Category: Food Delivery

  • Breaking Down Grocery Discounts This Black Friday

    Breaking Down Grocery Discounts This Black Friday

    As shoppers flocked online and to stores during Black Friday and Cyber Monday, the grocery category stood out as a key battleground for retailers. With inflation affecting consumer spending, discounted groceries have become a critical driver for both shopper savings and retailer competitiveness.

    In fact, according to the NRF, one of the top shopping destinations during Thanksgiving weekend were department stores (42%), online (42%),and grocery stores and supermarkets (40%). Clearly, consumers are looking to stock up in bulk on their groceries to maximize their savings.

    To understand the pricing dynamics in the grocery category, DataWeave analyzed grocery discounts across leading grocers, uncovering significant trends that shaped consumer choices during this holiday shopping period.

    Our research encompassed retailers like Amazon, Target, and Walmart, examining their discounting strategies across subcategories, alongside trends in share of search for leading CPG companies.

    Also check out our detailed analysis of discounts and pricing for health & beauty and home & furniture this Black Friday.

    Key Grocery Market Stats for Black Friday-Cyber Monday 2024

    • Retailer Discounts: Walmart offered the highest average absolute discount at 27.6%, followed by Amazon at 20.4% and Target at 14.0%
    • Subcategory Insights: Beverages Category at Walmart saw the deepest discounts, with an average of 33.4%
    • Top Gaining Brands: Cesar experienced the largest increase in share of search during the sales period (+3.89%)

    This blog will dive deeper into grocery discount trends and brand-level strategies, offering insights for retailers looking to stay competitive in the grocery sector.

    Our Methodology

    For this analysis, we tracked the average discounts offered by major U.S. grocery retailers during the Thanksgiving weekend, including Black Friday and Cyber Monday. We focused on key subcategories within the grocery segment, capturing trends in discounting strategies.

    • Sample Size: 18,324 SKUs
    • Retailers Tracked: Amazon, Walmart, Target
    • Subcategories Reported On: Fresh Produce, Dairy & Eggs, Pantry Essentials, Snacks, Frozen Foods, Meat & Seafood, Household Essentials, Beverages, Pet Products, Baby Products
    • Timeline of Analysis: November 10 to 29, 2024

    In the following insights, the Absolute Discount represents the reduction of the selling price compared to the Manufacturer’s Suggested Retail Price (MSRP). The Additional Discount reflects how much lower the selling price is during Black Friday compared to its price a week before the sale. This metric reveals the actual or effective value of the sale event, beyond the standard discounts typically offered.

    Key Findings

    Retailer-Level Insights

    Average Discounts Across Leading Grocery Retailers - Black Friday Cyber Monday 2024
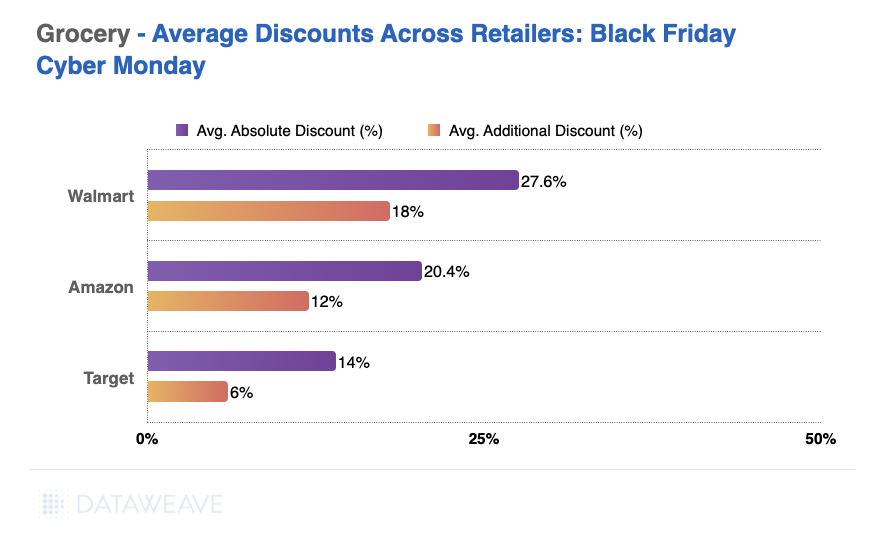
    • Walmart emerged as the leader in grocery discounting, offering the highest average absolute (27.6%) and additional (18%) discounts.
    • Amazon adopted a mid-tier discounting strategy, with average absolute discounts of 20.4%.
    • Target, while more conservative, maintained competitiveness in select subcategories like baby products.

    Subcategory Insights

    Average Discounts Across Leading Grocery Retailer Subcategories - Black Friday Cyber Monday 2024
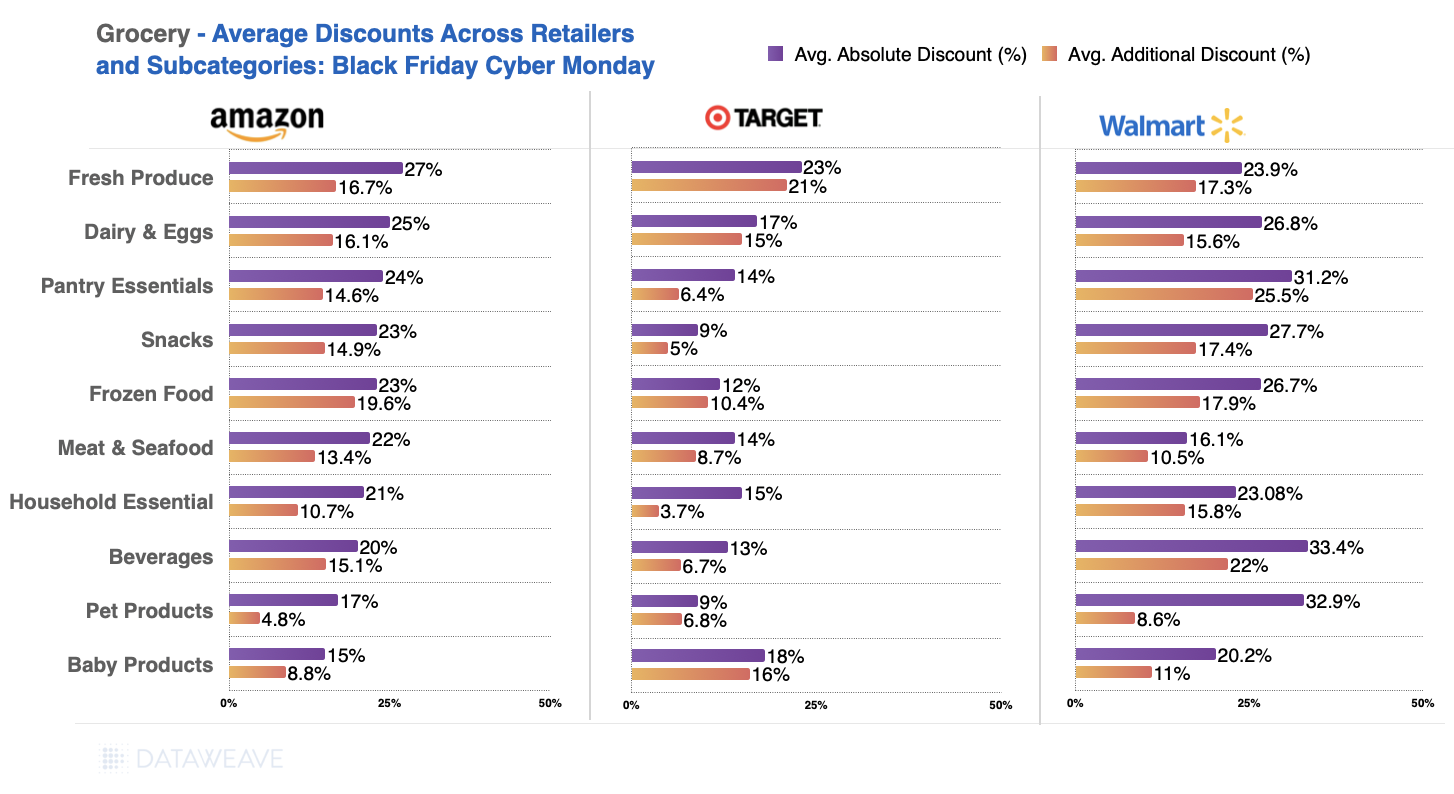
    • Pantry Essentials saw Walmart leading with an average discount of 31.2%, appealing to budget-conscious consumers stocking up for the holidays.
    • Fresh Produce showed consistent discounting across retailers, with Amazon slightly ahead at 27%.
    • Beverages stood out for significant discounting at Walmart, with an impressive 33.4% average discount.

    Brand-Level Insights

    Average Discounts Across Leading Grocery Brands - Black Friday Cyber Monday 2024
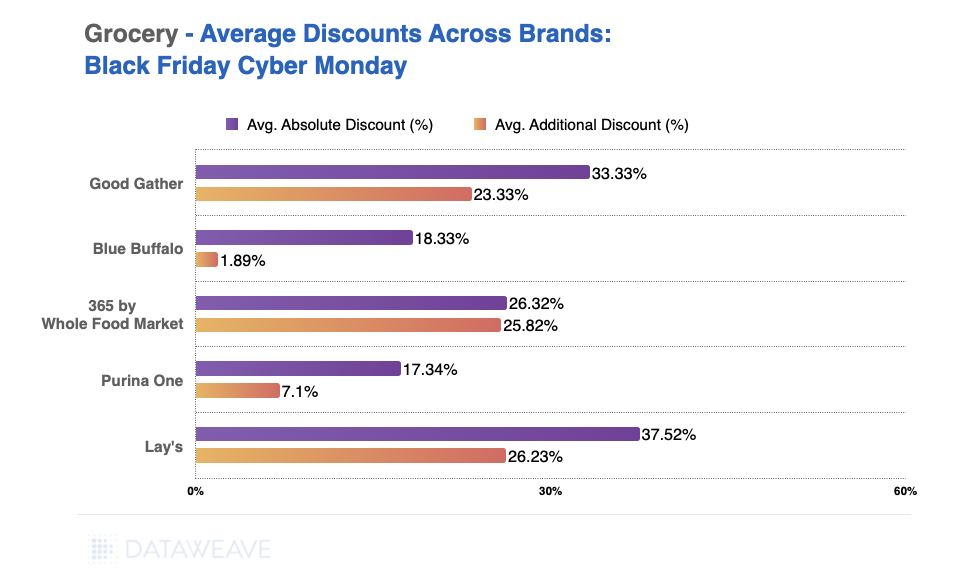
    • Lay’s led in absolute discounts (37.52%) and additional discounts (26.23%) showcasing aggressive pricing in the snacks subcategory.
    • Good & Gather maintained its competitive edge with strong discounts, appealing to price-conscious consumers seeking value.
    • Brands like Blue Buffalo (pet food brand) offered significant absolute discounts, but with a low additional discount of just 2%, the overall impact of the sale event on effective value was limited.

    Share of Search Insights

    Gains and Losses in Share of Search Across Leading Grocery Brands - Black Friday Cyber Monday 2024
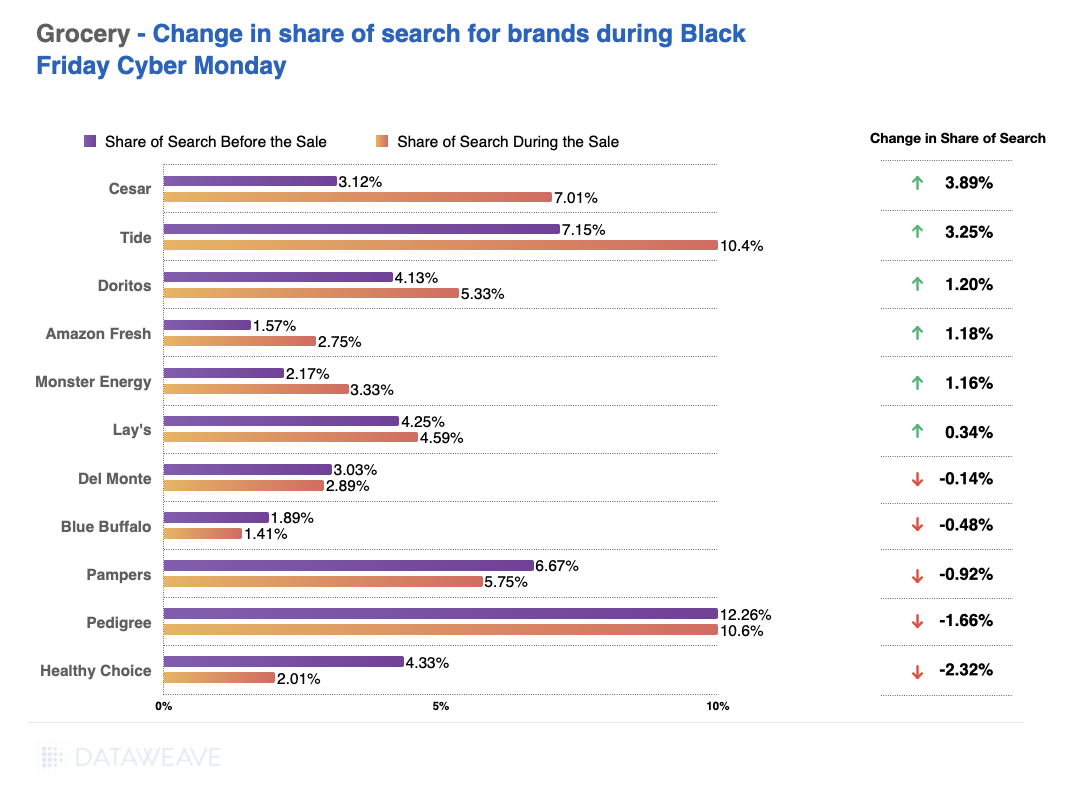
    • Cesar (dog food brand), Tide (laundry staple) and Doritos saw significant gains in share of search, reflecting successful promotional strategies.
    • Brands like Pampers (baby diapers brand), Healthy Choice, (frozen foods brand) and Pedigree (pet food brand) experienced a decline, indicating less effective engagement during the sale period.

    Who offered the lowest prices?

    In the previous analysis, we focused on the top 500 products within each subcategory for each retailer, showcasing the discount strategies for their highlighted or featured items. However, to identify which retailer offered the lowest or highest prices for the same set of products, it’s necessary to match items across retailers. For this, we analyzed a separate dataset of 1433 matched products across retailers to compare their pricing during Black Friday. This approach provides a clearer picture of price leadership and competitiveness across categories.

    Here are the key takeaways from this analysis.

    Category-Level Analysis

    Retailers Offering Most Value - Lowest Priced - Grocery - Black Friday 2024
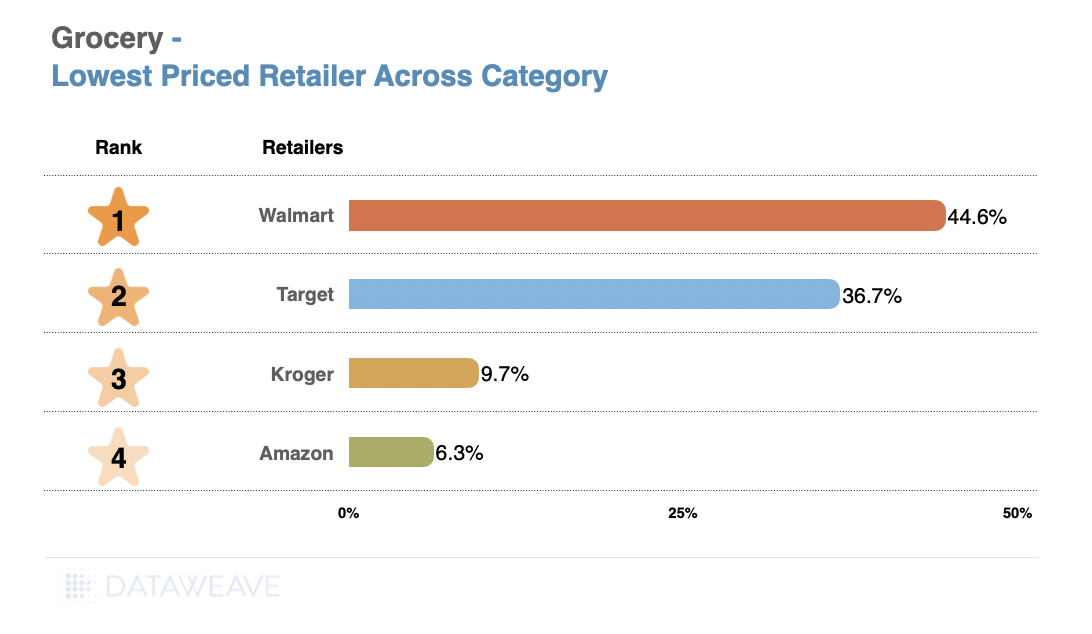
    • Walmart is the lowest priced retailer overall for the grocery category, with an impressive average discount of 44.60%. This significant discount advantage makes Walmart a leading option for value-seeking consumers.
    • Target follows with strong discounts of 36.73%, indicating solid pricing in comparison but less aggressive than Walmart.
    • Interestingly, Amazon was the most expensive in Grocery, with an average discount of only 6.3%.

    Subcategory-Level Analysis

    Lowest Priced Retailer Across Major Subcategories- Grocery - Black Friday 2024
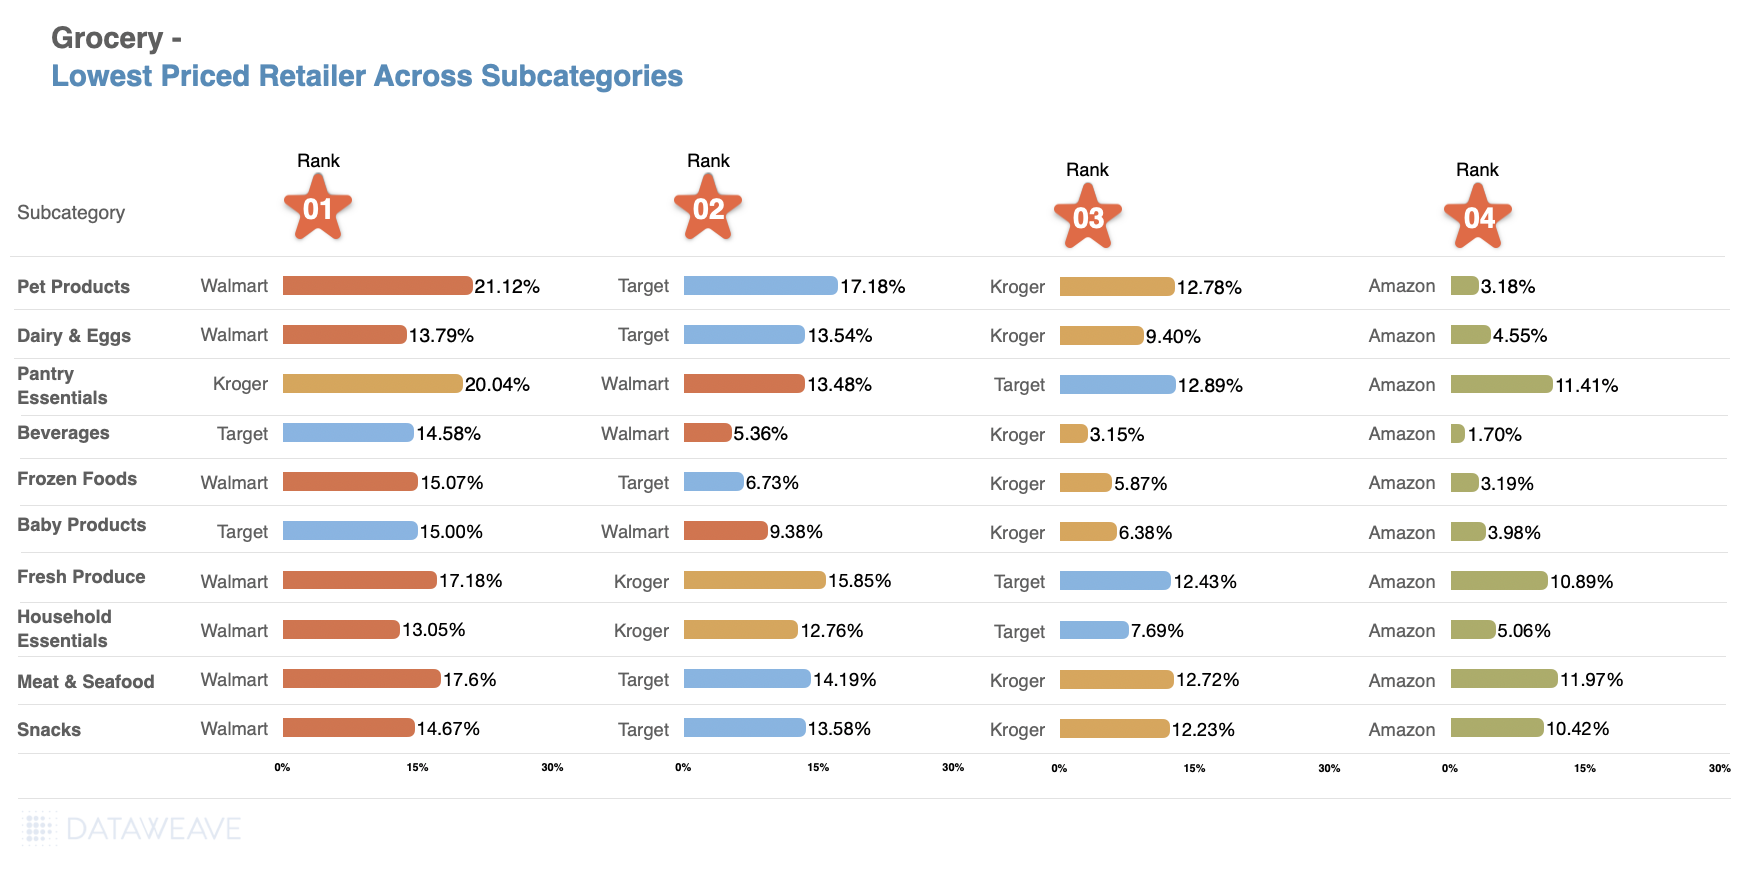
    • Walmart leads in various subcategories such as Pet Products (21.12%), Dairy & Eggs (13.79%), Household Essentials (13.05%), Frozen Foods (15.07%), and Meat & Seafood (17.60%), showcasing its extensive value across the board.
    • Target excels in Beverages (14.58%) and Baby Products (15.00%) with competitive discounts, standing out in these specific subcategories.
    • Kroger provides notable value in Pantry Essentials (20.04%) and Fresh Produce (15.85%), although its overall average discount is lower than Walmart’s.
    • Amazon consistently ranks lower in terms of average discounts across most subcategories, highlighting it as less competitive for consumers seeking the lowest prices.

    Brand-Level Analysis

    Lowest Priced Retailer Across Leading Brands- Grocery - Black Friday 2024
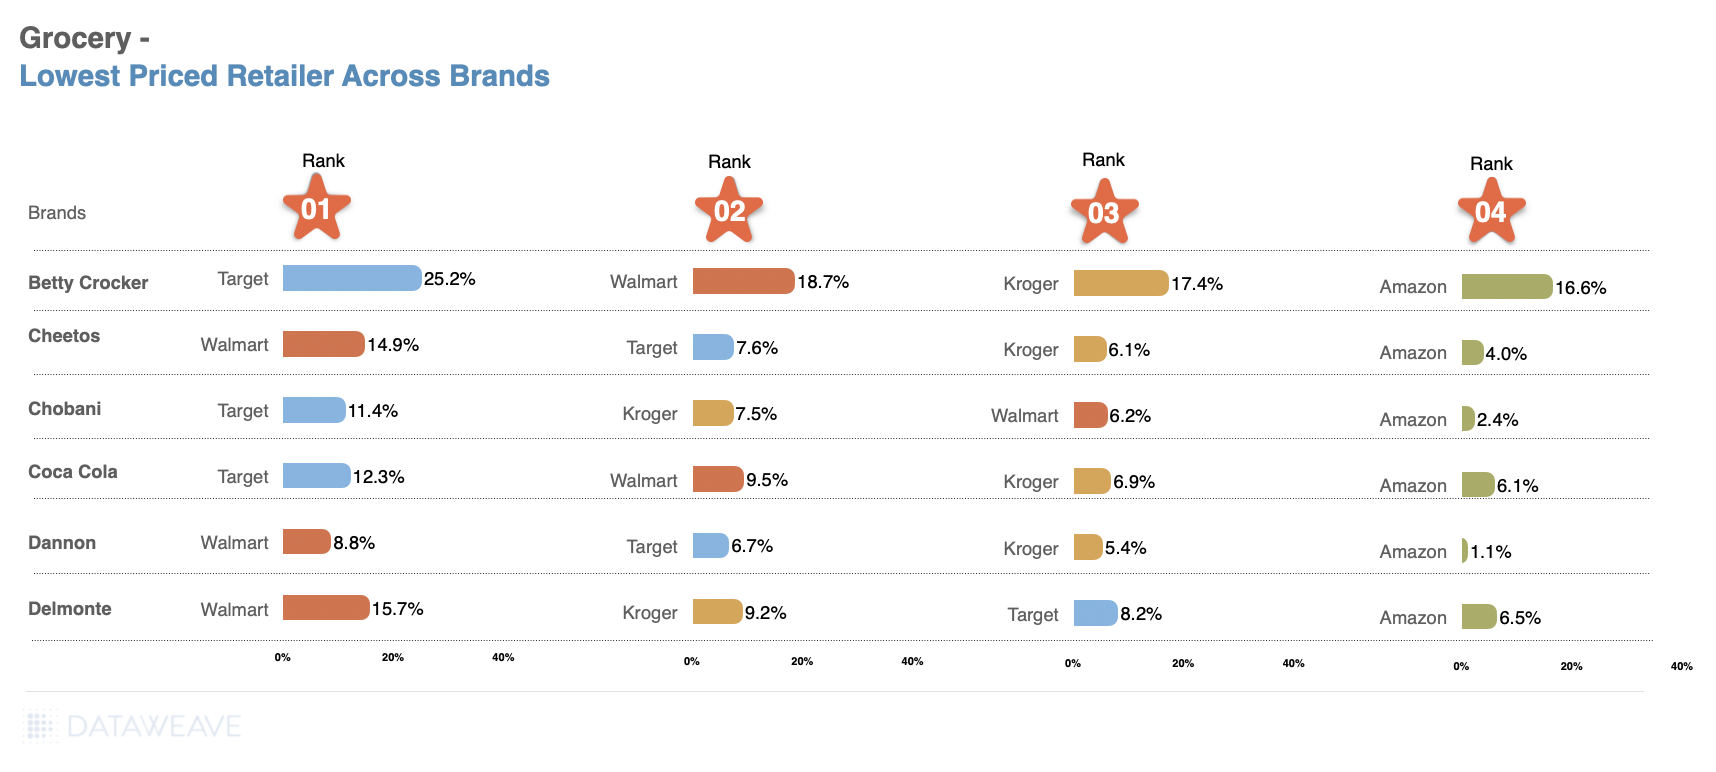
    • Walmart also holds the top position for several key brands like Cheetos (14.92%) and Dannon (8.81%), making it the best option for consumers looking for budget-friendly choices across popular brands.
    • Target takes the lead for brands like Betty Crocker (25.20%) and Chobani (11.37%), showing that it can offer value for specific products.
    • Kroger maintains strong discounts for brands such as Delmonte (9.19%), but it does not outpace Walmart in the overall grocery brand comparison.
    • Amazon generally lags behind in average discounts for most brands, with Dannon (1.12%) and Chobani (2.43%) showing significantly lower discounts.

    Walmart is the lowest priced retailer in the grocery category and provides substantial value across a wide range of subcategories and popular brands. This ties in with Walmart’s ELDP pricing strategy. The retailer leads in overall average discounts and maintains its position as the go-to for price-conscious consumers. Target offers strong value in certain subcategories and brands but falls short of Walmart’s broad value based pricing advantages.

    What’s Next

    For grocery retailers, competitive pricing and targeted promotions are critical to driving sales during key shopping events. As consumers continue to prioritize value, staying ahead in the discounting game can significantly impact market share.

    For detailed insights into grocery discounting strategies and to explore how DataWeave’s solutions can help retailers optimize their pricing, contact us today!

    Stay tuned to our blog for further analyses of other categories during Black Friday and Cyber Monday.

  • The Complete Guide to Competitive Pricing Strategies in Retail and E-commerce

    The Complete Guide to Competitive Pricing Strategies in Retail and E-commerce

    Your budget-conscious customers are hunting for value and won’t hesitate to switch brands or shop at other retailers.

    In saturated and fiercely competitive markets, how can you retain customers? And better yet, how can you attract more customers and grow your market share? One thing you can do as a brand or retailer is to set the right prices for your products.

    Competitive or competition-based pricing can help you get there.

    So what exactly is competitive pricing? Let’s dive into this strategy, its advantages and disadvantages, and how it can be used to stay ahead of the competition.

    What is Competitive Pricing?

    Competitive or competition-based pricing is a strategy where brands and retailers set product prices based on what their competitors charge. This method focuses entirely on the market landscape and sets aside the cost of production or consumer demand.

    It is a good pricing model for businesses operating in saturated markets, such as consumer packaged goods (CPGs) or retail.

    Competitive Pricing Models

    Competitive pricing isn’t a one-size-fits-all strategy. The approach includes various pricing models that can be customized to fit your business goals and market positioning.

    Here’s a closer look at five of the most common competition-based pricing models:

    Price Skimming

    If you have a new product entering the market, you can initially set a high price. Price skimming allows you to maximize margins when competition is minimal.

    This strategy taps into early adopters’ willingness to pay a premium for new project categories. As competitors enter the market, you can gradually reduce the price to maintain competitiveness.

    Premium Pricing

    Premium pricing lets you position your product as high-quality or luxurious goods.

    When you charge more than your competitors, you’re not just selling a product—you’re selling status and an experience. This strategy is effective when your offering is of superior quality or has unique features that justify a higher price point.

    Price Matching

    Price matching—also known as parity pricing—is a defensive pricing tactic.

    By consistently matching your competitors’ prices, you can retain customers who might otherwise, be tempted to switch to an alternative.

    This approach signals your customers that they don’t need to look elsewhere for what they need and can feel comfortable remaining loyal to your brand.

    Penetration Pricing

    Penetration pricing is when you set a low price for a new product to gain market share quickly. The opposite of price skimming, this strategy can be particularly effective in price-sensitive or highly competitive industries.

    By attracting customers early, you can also deter some competitors from entering the market. This bold move can establish your product as a market leader from the get-go.

    Loss Leader Pricing

    Loss leader pricing is a strategic sacrifice that can lead to greater gains in the long run.

    By offering a product at a low price—sometimes even below cost—you can attract new customers to your brand and strengthen your current customers’ loyalty.

    Eventually, you can cross-sell other higher-margin products to your loyal customer base to cover the loss from your loss leader pricing and increase sales of other more profitable products.

    Key Advantages of Competitive Pricing

    Although it’s not the only pricing strategy available, competitive pricing has some significant advantages.

    It is Responsive

    Agility is synonymous with profit in industries where consumer preferences and market conditions shift rapidly.

    Competitive pricing allows you to adapt quickly—if a competitor lowers their prices, you can respond promptly to maintain your positioning.

    It is Simple to Execute and Manage

    Competitive pricing is straightforward, unlike cost-based pricing, which requires complex calculations and spans various factors and facets.

    By closely monitoring competitors’ prices and adjusting your prices accordingly, you can implement this pricing strategy with relative ease and speed.

    It Can Be Combined with Other Pricing Strategies

    Competitive pricing is not a standalone strategy—it’s a versatile approach that can easily be combined with other pricing strategies. For example, say you want to use competitive pricing without losing money on a product. In this case, you could use cost-plus pricing to determine a base price that you won’t go below, then use competitive pricing as long as the price stays above your base price.

    Key Disadvantages of Competitive Pricing

    While competition-based pricing has its advantages, it’s not without its pitfalls. Here are some potential disadvantages of competitive pricing.

    It De-emphasizes Consumer Demand

    If you focus solely on what competitors are charging, you could overlook consumer demand.

    For example, you could underprice items that consumers could be willing to purchase for more. Or, you might overprice items that consumers perceive as low-value, which can reduce sales.

    You Risk Price Wars

    If you and your competition undercut each other for customer acquisition and loyalty, you will eventually erode profit margins and harm the industry’s overall profitability. It’s a slippery slope where everyone loses in the end.

    There’s Potential for Complacency

    When you base your prices on beating those of competitors, you might neglect to differentiate your offerings through innovation and product improvements. Over time, this can weaken your brand’s position and lead to a loss of market share. Staying competitive means more than just matching prices—it means continuously evolving and adding value for the consumer.

    4 Tips for a Successful Competitive Pricing Strategy in Retail

    Here are four competition-based pricing tips for retailers:

    Retailer Tip #1. Know Where to Position Your Products in the Market

    For competitive pricing to work, you must understand your optimal product positioning in the overall market. To gain this understanding, you must regularly compare your offerings and prices with those of your key competitors, especially for high-demand products.

    Then, you can decide which competition-based pricing model is suitable for you.

    Retailer Tip #2. Price Dynamically

    Dynamic pricing is a tactic with which you automatically adjust prices on your chosen variables, such as market conditions, competitor actions, or consumer demand.

    When it comes to competitive pricing, a dynamic pricing system can track your competitors’ price changes and update yours in lockstep.

    Price-monitoring tools like DataWeave allow you to stay ahead of the game with seasonal and historical pricing trend data.

    Retailer Tip #3. Combine Competitive Pricing with Other Pricing Strategies

    Competitive pricing can be powerful, but it doesn’t have to stand alone. You can enhance its benefits with complementary marketing tactics.

    To illustrate, you can bundle products to offer greater value than what your competitors are offering. You can also leverage loyalty programs to offer exclusive discounts or rewards so customers keep returning, even when your competitors offer them lower prices.

    Retailer Tip #4. Stay in Tune with Consumer Demand

    Competition-based pricing aligns you with your competitor, but don’t lose sight of what your customers want. Routinely test your pricing strategy against consumer behavior to ensure that your prices reflect the actual value of your offerings.

    5 Tips for a Successful Competitive Pricing Strategy for Consumer Brands

    If you’re thinking about how to create a competitive pricing strategy for your brand, consider these five tips:

    Brand Tip #1. Identify Competing Products for Accurate Comparisons

    The first step in competitive pricing is to know the value of what you’re selling and how it compares to that of your competitors’ products. This extends to private-label products, similar but not identical products, and use-case products.

    Product matching ensures your pricing decisions are based on accurate like-for-like comparisons, allowing you to compete effectively.

    Brand Tip #2. Understand Your Product’s Relative Value

    Knowing how your product competes on value is key to setting the right price. If your product offers higher value, price it higher; if it offers less, price it accordingly. This ensures your pricing strategy reflects your product’s market placement.

    Brand Tip #3. Consider Brand Perception

    Even if your product is virtually the same as a competitor’s, your brand’s perceived value may be different, which plays a crucial role in pricing.

    If your brand is perceived as premium, you can justify higher prices. Conversely, if customers perceive you as a value brand, your pricing should reflect affordability.

    Brand Tip #4. Leverage Value-Based Differentiation

    When your prices are similar to competitors’, you must differentiate your products by expressing your product value through branding, packaging, quality, or something else entirely.

    This differentiation will compel consumers to choose your product over other similarly priced options.

    Brand Tip #5. Stay Vigilant with Price Monitoring

    Your competitors will update their pricing repeatedly, and you will, too.

    It can be difficult and time-consuming to monitor your competitive pricing, so you’ll need a system like DataWeave to monitor competitors’ pricing and manage dynamic pricing changes.

    This vigilance ensures your brand remains competitive and relevant in real time.

    4 Essential Capabilities You Need to Implement Successful Competition-Based Pricing

    You’ll need four key capabilities to implement a competitive pricing strategy effectively.

    AI-Driven Product Matching

    Product matching means you’ll compare many products (sometimes tens or hundreds) with varying details across multiple platforms. Accurate product matching at that scale requires AI.

    For instance, AI can identify similar smartphones to yours by analyzing features like screen size and processor type. DataWeave’s AI product matches start with 80–90% matching accuracy, and then human oversight can fine-tune the data for near-perfect matches.

    You can make informed pricing decisions once you know which competing products to base your prices on.

    Accurate and Comprehensive Data

    A successful competition-based pricing strategy depends on high-quality, comprehensive product and pricing data from many retailers and eCommerce marketplaces.

    By tracking prices on large online platforms and niche eCommerce sites across certain regions, you’ll gain a more comprehensive market view, which enables you to make quick and confident price changes.

    Normalized Measurement Units

    Accurate price comparisons are dependent on normalized unit measurements.

    For example, comparing laundry detergent sold in liters to laundry detergent sold in ounces requires converting either or both products to a common base like price-per-liter or price-per-ounce.

    This normalization ensures accurate pricing analysis.

    Timely Actionable Insights

    Timely and actionable pricing insights empower you to make informed pricing decisions.

    With top-tier competitive pricing intelligence systems, you get customized alerts, intuitive dashboards, and detailed reports to help your team quickly act on insights.

    In Conclusion

    Competitive pricing or competition-based pricing is a powerful strategy for businesses navigating crowded markets, but you must balance competitive pricing with your brand’s unique value proposition.

    Competitive pricing should complement innovation and customer-centric strategies, not replace them. To learn more, talk to us today!

  • Capturing and Analyzing Retail Mobile App Data for Digital Shelf Analytics: Are Brands Missing Out?

    Capturing and Analyzing Retail Mobile App Data for Digital Shelf Analytics: Are Brands Missing Out?

    Consumer brands around the world increasingly recognize the vital role of tracking and optimizing their digital shelf KPIs, such as Content Quality, Share of Search, Availability, etc. These metrics play a crucial role in boosting eCommerce sales and securing a larger online market share. With the escalating requirements of brands, the sophistication of top Digital Shelf Analytics providers is also on the rise. Consequently, the adoption of digital shelf solutions has become an essential prerequisite for today’s leading brands.

    As brands and vendors continue to delve further and deeper into the world of Digital Shelf Analytics, a significant and often overlooked aspect is the analysis of digital shelf data on mobile apps. The ability of solution providers to effectively track and analyze this mobile-specific data is crucial.

    Why is this emphasis on mobile apps important?

    Today, the battle for consumer attention unfolds not only on desktop web platforms but also within the palm of our hands – on mobile devices. As highlighted in a recent Insider Intelligence report, customers will buy more on mobile, exceeding 4 in 10 retail eCommerce dollars for the first time.

    Moreover, thanks to the growth of delivery intermediaries like Instacart, DoorDash, Uber Eats, etc., shopping on mobile apps has received a tremendous organic boost. According to an eMarketer report, US grocery delivery intermediary sales are expected to reach $68.2 billion in 2025, from only $8.8 billion in 2019.

    In essence, mobile is increasingly gaining share as the form factor of choice for consumers, especially in CPG. In fact, one of our customers, a leading multinational CPG company, revealed to us that it sees up to 70% of its online sales come through mobile apps. That’s a staggering number!

    The surge in app usage reflects a fundamental change in consumer behavior, emphasizing the need for brands to adapt their digital shelf strategies accordingly.

    Why Brands Need To Look at Apps and Desktop Data Differently

    Conventionally, brands that leverage digital shelf analytics rely on data harnessed from desktop sites of online marketplaces. This is because capturing data reliably and accurately from mobile apps is inherently complex. Data aggregation systems designed to scrape data from web applications cannot easily be repurposed to capture data on mobile apps. It requires dedicated effort and exceptional tech prowess to pull off in a meaningful and consistent way.

    In reality, it is extremely important for brands to track and optimize their mobile digital shelf. Several digital shelf metrics vary significantly between desktop sites and mobile apps. These differences are natural outcomes of differences in user behavior between the two form factors.

    One of these metrics that has a huge impact on a brand’s performance on retail mobile apps is their search discoverability. Ecommerce teams are well aware of the adverse impact of the loss of even a few ranks on search results.

    Anyone can easily test this. Searching something as simple as “running shoes” on the Amazon website and doing the same on its mobile app shows at least a few differences in product listings among the top 20-25 ranks. There are other variances too, such as the number of sponsored listings at the top, as well as the products being sponsored. These variations often result in significant differences in a brand’s Share of Search between desktop and mobile.

    Share of Search is the share of a brand’s products among the top 20 ranked products in a category or subcategory, providing insight into a brand’s visibility on online marketplaces.

    Picture a scenario in which a brand heavily depends on desktop digital shelf data, confidently assuming it holds a robust Share of Search based on reports from its Digital Shelf Analytics partner. However, unbeknownst to the team, the Share of Search on mobile is notably lower, causing a detrimental effect on sales.

    To fully understand the scale of these differences, we decided to run a small experiment using our proprietary data analysis and aggregation platform. We restricted our analysis to just Amazon.com and Amazon’s mobile app. However, we did cover over 13,000 SKUs across several shopping categories to ensure the sample size is strong.

    Below, we provide details of our key findings.

    Share of Search on The Digital Shelf – App Versus Desktop

    Our analysis focused on three popular consumer categories – Electronics, CPG, and Health & Beauty.

    In the electronics category, brands like Apple, Motorola, and Samsung, known for their mobile phones, earbuds, headphones, and more, have a higher Share of Search on the Amazon mobile app compared to the desktop.

    Meanwhile, Laptop brands like Dell, Acer, and Lenovo, as well as other leading brands like Google have a higher Share of Search on the desktop site compared to the app. This is the scenario that brands need to be careful about. When their Share of Search on mobile apps is lower, they might miss the chance to take corrective measures since they lack the necessary data from their provider.

    In the CPG category, Ramen brand Samyang, with a lot of popularity on Tiktok and Instagram, shows a higher Share of Search on Amazon’s mobile app. Speciality brands like 365 By Whole Foods, pasta and Italian food brands La Moderna, Divinia, and Bauducco too have a significantly higher Share of Search on the app.

    Cheese and dessert brands like Happy Belly, Atlanta Cheesecake Company, among others, have a lower Share of Search on the mobile app. Ramen brand Sapporo is also more easily discovered on Amazon’s desktop site. Here, we see a difference of more than 5% in the Share of Search of some brands, which is likely to have a huge impact on the brand’s mobile eCommerce sales levels and overall performance.

    Lastly, in the Health & Beauty category, Shampoos and hair care brands like Olaplex, Dove, and Tresemme exhibited a higher Share of Search on the mobile app compared to the desktop.

    On the other hand, body care brands like Neutrogena and Hawaiian Tropic, as well as Beardcare brand Viking Revolution displayed a higher Share of Search on Amazon’s desktop site.

    Based on our data, it is clear that there are several examples of brands that do better in either one of Amazon’s desktop sites or mobile apps. In many cases, the difference is stark.

    So What Must Brands Do?

    Our findings emphasize the imperative for brands to move beyond a one-size-fits-all approach to digital shelf analytics. The striking variations in Share of Search between mobile apps and desktops conclusively demonstrate that relying solely on desktop data for digital shelf optimization is inadequate.

    If brands see that they’re falling behind on the mobile digital shelf, there are a few things they can do to help boost their performance:

    • If a brand’s Share of Search is lower on the mobile app, they can divert their retail spend to mobile in order to inorganically compensate for this difference. This way, any short-term impact due to lower discoverability is mitigated. This is also likely to result in optimized budget allocation and ROAS.
    • Brands also need to ensure their content is optimized for the mobile form factor, with images that are easy to view on smaller screens, and tailored product titles that are shorter than on desktops, highlighting the most important product attributes from the consumer’s perspective. Not only will this help brands gain more clicks from mobile shoppers, but this will also gradually lead to a boost in their organic Share of Search on mobile.
    • CPG brands, specifically, need to optimize their digital shelf for delivery intermediary apps (along with marketplaces). The grocery delivery ecosystem is booming with companies like DoorDash, Delivery Hero, Uber Eats, Swiggy, etc. leading the way. Using Digital Shelf Analytics to optimize performance on delivery apps is quite an involved process with a lot of bells and whistles to consider. Read our recently published whitepaper that specifically details how brands can successfully boost their visibility and conversions on delivery apps.

    But first, brands need to identify and work with a Digital Shelf Analytics partner that is able to capture and analyze mobile app data, enabling tailored optimization approaches for all eCommerce platforms.

    DataWeave leads the way here, providing the world’s most comprehensive and sophisticated digital shelf analytics solution, rising above all other providers to provide digital shelf insights for both web applications and mobile apps. Our data aggregation platform successfully navigates the intricacies of capturing public data accurately and reliably from mobile apps, thereby delivering a comprehensive cross-device view of digital shelf KPIs to our brand customers.

    So reach out to us today to find out more about our digital shelf solutions for mobile apps!

  • 7 Key Metrics that QSRs want (but may not get) from Food Delivery Apps

    7 Key Metrics that QSRs want (but may not get) from Food Delivery Apps

    The Quick Service Restaurant market is projected to be valued at $691 billion by 2022. As the QSR industry grows and the market becomes even more competitive, restaurant chains continuously seek ways to increase sales via food aggregators to market their business. To improve ROI and sales, having data and insights into key metrics could help QSRs to boost their success rate.

    QSRs would like to know how they stack up against their competition regarding discoverability on cluttered food aggregator apps. Restaurants want to know the gaps in their product assortment to understand what drives customers to their competitors. Getting insights into delivery time and competitors’ delivery fees will help QSR improve delivery ETAs and optimize fees. They can also set competitive pricing with insights into their competitors’ pricing. In addition, they can use data to optimize their ad spending on food apps and improve marketing ROI.

    In this blog, we will discuss the relationship between QSRs and food aggregators and how getting data about key metrics from these food delivery platforms can help QSRs scale their revenue. 

    Data: The Key Ingredient to increasing sales

    According to Statista, online food ordering revenue is expected to grow at a robust CAGR of 10.39% between 2021 and 2025. Food Aggregators apps like Uber Eats, DoorDash, and GrubHub offer convenient meal delivery options from various QSRs within a single app. Food aggregators provide a multitude of benefits for QSRs. They give access to a huge customer base, quick delivery, and an easy entry into quick commerce, helping QSRs increase visibility. Although QSRs rely on food aggregator platforms for hassle-free ordering, tracking, and delivery, they can’t always rely on them to share critical data that could help them optimize their operations & increase sales. 

    Online food ordering revenue
    Online food ordering revenue

    1. Data on Product Assortment

    QSRs need assortment insights to understand their competitor’s menu assortment. Assortment analytics plays a crucial role in ensuring that QSRs aren’t losing sales because their competitors are offering cuisines and dishes that they aren’t. Understanding gaps in menus helps QSRs to better plan their menu. However, food aggregator apps can’t share competitors’ assortment data with QSRs for a multitude of reasons, guidelines, and privacy laws. Thankfully, at DataWeave, our QSR intelligence solution can! We help restaurants improve their assortment by sharing insights into the dishes and cuisines their competitors’ have on display.

    Menu Assortment
    Menu Assortment

    2. Data on QSR Discoverability

    QSRs would love to know how to increase discoverability on food aggregators, as it will help them to appear ahead in search results and beat the competition. Improving visibility on these apps directly impacts sales and drives more orders for restaurants. Some aggregators offer discoverability information but give it on demand, usually after 20-30 days, making it irrelevant due to the enormous time gap. They also don’t provide information about the change in the discoverability of your competition. All these data points are so critical, and understandably so, Food Apps can’t share this level of information with restaurants. However, DataWeave’s QSR Intelligence solution can! It provides real-time discoverability insights into your restaurant and competitor’s visibility so that the data is actionable, and QSRs can use insights to improve visibility

    Read how DataWeave’s QSR Intelligence helped an American QSR Chain and how their ranking on search results page on Ube rEats, DoorDash & Grubhub impacted outlet discoverability & sales!

    3. Data on Pricing & Promotions

    Pricing a QSR’s menu is tricky. If you price too high, you’ll turn off new customers. If you price too low, you’ll cut margins & may even come off as low-qualify. Customer Price Perception is greatly influenced by the Price-Quality relationship. To add to this, restaurants are often up against stiff competition from restaurants with similar cuisine offerings so it’s critical that prices are competitive. Understanding competitor pricing doesn’t imply that you have to beat their prices. You can compensate for any price differences by offering higher quality cuisines, better customer service, and quicker delivery. Once again, food apps can’t share competitors’ pricing data with QSRs. But DataWeave’s QSR & Pricing Intelligence solution can! QSRs can use these insights to drive more revenue & margins by pricing their menu right.

    4. Data on Delivery Time

    QSRs must be able to deliver hot meals, in a timely manner to customers because customers want to quickly dig into the delicious food they ordered. Quicker deliveries within the ETA will also help earn the trust and loyalty of customers. However, food aggregators don’t share information on the delivery times with restaurants – not their own delivery time or their competitors. DataWeave can help QSRs to understand their peak hours and optimize their service to ensure quick ETAs. They can also get detailed insights into competitors’ delivery times to make sure they’re competitive. This is important because customers will often pick restaurants with quicker ETAs.


    Read how DataWeave’s QSR Intelligence helped an American QSR Chain understand the correlation between delivery time & sales volumes

    Delivery time trend by urbanity
    Delivery time trend by urbanity

    5. Data on Delivery Fee

    As a thumb rule, customers will always compare delivery fees across apps. They’re conscious of delivery dollars included in their bill and often choose a restaurant with lesser delivery fees. This makes it even more critical for restaurants to understand how they stack up against their competitors. Understanding competitors’ delivery fees could potentially help QSRs to optimize their rates. And once again, food aggregators can’t share information on competitors’ delivery fees with restaurants. However, DataWeave’s QSR Intelligence can provide all delivery-related insights – be it Delivery etas or fees. 

    Delivery fee trend by urbanity
    Delivery fee trend by urbanity

    6. Data on Ad Performance & ROI

    Getting ad analytics will help QSRs better manage their budgets & increase the ROI on their Ad spends. For example, wouldn’t it be great if QSRs were able to understand which ad formats or promotions led to the most sales? Or which carousal ads had the most visibility in key zip codes where your QSR is expected to do maximum business? Or even insights into a competitor’s ads and promotions on food apps. Knowing this information will help restaurants spend sensibly when buying media on Food Apps & get the most bang for their advertising buck. Food apps do provide standard ad analytics – a number of clicks, CTR, and so on, but for more complex, insightful & actionable insights, there’s DataWeave’s QSR Intelligence

    Read how DataWeave’s QSR Intelligence helped an American QSR Chain understand the ROI delivered on ad spends across Food Delivery apps.

    Insightful & actionable insights for QSR Chains
    Insightful & actionable insights for QSR Chains
    Insightful & actionable insights for QSR Chains
    Insightful & actionable insights for QSR Chains

    7. Data on Outlet Availability / Availability Audit

    To avoid lost sales, being available & “open for business” on Food Apps during peak lunch & dinner hours is critical. Also on weekends, when order volumes are usually high. Sometimes because of technical glitches, QSR outlets appear unavailable on Food Apps. A glitch like that can lead to lost business, and the longer the glitch stays undiscovered, the greater the impact on revenue. While Food Aggregators do their best to make sure all QSRs are up and running on their app, using DataWeave’s QSR Intelligence, restaurants can now do an outlet audit to make sure that’s the case. With just a mere 2.8% unavailability, we saw a 28% drop in the sales for one of our QSR customers! That’s how critical Availability insights are. 

    Conclusion

    Analyzing and optimizing sales, delivery, discoverability, availability & customer data is one of the fastest ways to help grow your QSRs revenue. However, the biggest challenge QSRs face is that it isn’t always easy to get this information. With DataWeave’s QSR Intelligence now some of that data is a little more accessible as we discussed in this blog. And additionally, here are the 7 Tricks we recommend QSRs to use to win on Food Apps

  • eCommerce in South Africa: Data-Driven approach to getting ahead

    eCommerce in South Africa: Data-Driven approach to getting ahead

    What an exciting month we’ve had at DataWeave! Our team flew down to gorgeous Cape Town, South Africa to attend the 8th edition of #EcomAfrica! After months of Zoom calls and virtual events, it was a refreshing change to see our customers in person and meet some of the movers and shakers in eCommerce and some of the top South African brands. 

    Top eCommerce Companies in South Africa
    Top eCommerce Companies in South Africa

    My last visit to South Africa was before the pandemic. Things have changed since then, & the difference was stark! The eCommerce landscape had a paradigm shift during Covid-19 and grew exponentially. My customers spoke to me about the new opportunities, growth potential as well as challenges that came in because of this boom. For one, eCommerce in South Africa has become more competitive than ever – from online retail to grocery and food delivery to even alcohol delivery! All retail businesses seem to have jumped onto the eCommerce bandwagon.

    A recent Deloitte report found that over 70% of South Africans shop online at least once a month & 2 out of 3 respondents said they plan to increase their frequency of online shopping. 65% said they know what they want, search online & check all stores that stock the product to compare prices. Price is one of the key factors that influence consumer purchase decisions. Other critical factors include delivery fee, delivery time, promotions & discounts & product assortment to name a few. In order to stay ahead in this highly competitive arena, both retailers and brands need to make data-driven decisions about critical KPIs like pricing to stay ahead of the competition.

    Increased Online Shopping & Online Shopping Frequency
    Increased Online Shopping & Online Shopping Frequency

    We’ve been working with customers in South Africa for over 4 years now, even before the pandemic. So on Day 2 of the event – S.Krishnan Thyagarajan “Krish”, President & COO, Dataweave had a chance to share our learnings and experience from all these years and how user data is critical to getting ahead & winning the eCommerce race in South Africa.

    For the purpose of Krish’s keynote address, we tracked pricing insights for a finite set of categories across key South African retailers like Checkers, Pick n Pay, EveryShop, Incredible, Makro, Waltons, Shoprite & Dis-Chem to name a few over a period of 16 months from Dec 2020 to April 2022. We highlighted price increase and decrease opportunities and how each retailer reacted in order to stay competitive, increase sales and protect margins. 

    BATTLE of the eCommerce GIANTS!

    Key Highlights from the Keynote

    • Increasing prices where an opportunity exists helps retailers increase their margins exponentially. Pick n Pay had the highest action rate (73%) when it came to capitalizing on price increase opportunities v/s Dis-Chem at 11%. 
    • When it came to price decrease opportunities (in order to stay competitive with rival brands) Takealot was the most responsive retailer – they capitalized on 30% of the opportunities, followed by Pick n Pay at a close second (28%) and Shoprite & Dis-Chem at just 4%.
    • Most retailers took between 1 – 5 days maximum to make price changes which means responsiveness to the market among all retailers is high making it more important for online retailers to always be on their toes.  
    • The 2 categories where most retailers capitalized on Price Increase Opportunities were Sauces & Condiments and Crackers & Biscuits.

    Want to watch the Keynote video on Demand? Click here to register & watch.

    Price Increase & Decrease Opportunities
    Price Increase & Decrease Opportunities

    Bonus video content! 

    • Watch the Impact of price increase & decrease opportunities on Private Label brands! 
    • See how product stock availability impacts price changes over a 16-month period. 
    • Find out which brands are in the lead in the Skin Care, Pet, Baby, Laundry & Cleaning Aid categories 

    If you’re an online retailer in South Africa & need insights on staying competitive with the right pricing, product assortment, delivery time, delivery rates, and the other key influencers that affect customers’ choice of online retailers, sign up for a demo with our team at DataWeave to know how we can help!  

  • The Rise of South African eCommerce : The Growth, & the Future

    The Rise of South African eCommerce : The Growth, & the Future

    2020 onwards, the South African economy was crippled due to the pandemic and lockdowns. However, according to StatsSA, South Africa’s online retail market share grew to 2.8% in 2020, double that in 2018. After the pandemic, South Africa’s eCommerce industry grew by 66% in 2020 compared to the year before. This increase was primarily because of restrictions on traditional stores that led to a 30% reduction in in-store purchases. 
    According to a Deloitte study, over 70% of South Africans shop online at least once a month because of convenience. Household appliances, footwear, clothing, electronics, and health products are the most popular categories among South African online customers.

    Top Categories
    South African Ecommerce
    South African Ecommerce


    These eCommerce stores account for 15% of online revenue in South Africa

    1. Takealot.com: Revenue US$602 million 
    2. Superbalist.com: Revenue US$85 million 
    3. Woolworths.co.za: Revenye US$57 million

    In this blog, we will discuss emerging eCommerce trends in South Africa and their impact on the various retail segments. 

    Trends to watch in 2022

    Trends to watch
    Trends to watch

    1. Quick commerce

    Quick delivery, especially when it comes to groceries, medicines, and food has become a customer expectation now. Q-commerce, a trend that capitalizes on optimizing delivery time, has become common in food tech companies and is now gaining traction in grocery delivery too, especially after the pandemic. UberEats, Checkers, Pick ‘n Pay, and Jumia is some of the country’s biggest Q-commerce players.

    2. Omnichannel eCommerce

    Omnichannel experience has taken center stage for retailers in South Africa after the pandemic. According to Nielseniq’s study, 30% of South African consumers indicated they had shifted their shopping habits to online shopping from in-person grocery store visits between March 2021 and 2022. 

    3. Digital Payment Trends

    The digital payment ecosystem in South Africa has seen a massive growth trajectory after the pandemic. Customers seamlessly use digital payments across shopping, entertainment, groceries, food, health, and wellness – a trend we suspect is here to stay.

    4. Buy Now Pay Later

    Buy now pay later is an interest-free mode of payment that is popular worldwide for helping customers who cannot make high-value purchases. Consumers don’t have to pay any price upfront and pay off the amount in interest-free installments over a predefined period. The BNPL is forecasted to account for 13.6% of global eCommerce payments by 2024.

    5. Chatbots

    Quick response to customer queries and problems is instrumental in increasing conversion rate and sales. However, it can be difficult to respond to emails and instant chat 24/7 for small businesses. This is where automated chatbots are helping South African retailers answer customer questions promptly and correctly.

    The 4 Fastest-Growing Retail Segments

    4 Fastest-Growing Retail Segments
    4 Fastest-Growing Retail Segments

    1. Online Retail

    eCommerce & online retail grew 20% YOY after the pandemic. Retailers saw a huge increase in the adoption of online shopping by consumers. Traditional brick-and-mortar stores looked for omnichannel opportunities to keep up with online retailers. Mr. Price, a clothing retailer in South Africa, saw a surge in online sales by a massive 90% between April and June 2020. There is a similar success story where OneDayOnly, another South African online retailer, saw 40% growth during the same period.

    … but this growth surge brought in some challenges for retailers too. With more and more customers shopping online, competition increased. Price-sensitive customers would constantly compare prices across online retailers before making a purchase. It became critical for retailers to price their products right to beat the competition & win the sale, without hurting their margins! 

    2. On-Demand Grocery Delivery

    Groceries saw an increase of 54% from 2019 driven by the pandemic & lockdown restrictions.

    South African eCommerce companies offer a wide range of on-demand services, from taxi rides and grocery orders to liquor delivery. Retailers fulfill orders from stores to offer affordable rates and quick delivery across South Africa. It replicates the instant gratification of purchasing products from brick and mortar stores and the added benefits of the hyper convenience of shopping from a mobile or a computer. 

    Read quotes from our customers at Talabat, Glovo & Grab Food – we worked closely with them & helped them in their efforts to scale through this global Q-Commerce boom.

    3. Online Food Delivery

    According to Statista, revenue in the online food delivery segment in South Africa is projected to reach US$0.87bn in 2022. As competition heats up and more and more players enter the market, staying competitive is becoming increasingly challenging for food delivery businesses.

    Bolt Foods SA said they grew 50% month on month in mid-2021 and said they had to bet on making sure they were offering competitive prices in order to get ahead. Additionally, in their quest to have a stronger competitive advantage, Bolt Food says it is also offering customers a very low delivery fee, lower than Uber Eats & Mr. D since delivery costs are a major consideration for customers when using food delivery apps.

    The right price, product assortment, delivery fee, and delivery eta are critical to scaling a Food Delivery business. If you’re in the food-tech business, reach out and we can tell you how DataWeave’s Food Delivery Intelligence can help you scale quickly and profitably! 

    4. Social Commerce

    With approximately 41.19 million South African customers engaging in online activity, there is a huge shift in user behavior as customers get comfortable purchasing directly via social platforms instead of online retailers or physical stores. Social commerce uses networking websites such as Facebook, Instagram, and Twitter as vehicles to promote and sell products and services.

    What matters to South African online shoppers?

    Between June and November 2020, South African consumers mostly used online retailers monthly (42%), food delivery services weekly (36%), and online classifieds less than once a month (34%). 

    Here is a summary of things that matter to South African shoppers when they shop online:

    1. Easy product discovery and competitive pricing

    Most customers start their online shopping with a product in mind and look for discounts and sales across retailers. More than 67% of respondents of a survey have said that they go to a specific online store and search for the product they want. Almost the same share of consumers said they compare online stores to find offers for products they want. Price plays an important part in product selection. 

    In order to offer the most competitive pricing, retailers in South Africa need to keep a keen eye on competitor pricing. They need to identify gaps and opportunities to make price changes to not only offer the most attractive price to customers but also drive more revenue and margins by pricing products right.

    2. Reliable Delivery time

    81% of South African consumers say that unreliable delivery time is one of the reasons that affect their choice of an online store. Quick delivery time has become a differentiator in the eCommerce space, where ‘next day delivery or even ‘same-day delivery’ have become the norm. South African online shoppers want reliable delivery times that suit their busy schedules. 

    Read more here, about how DataWeave helped an America QSR understand the correlation between their delivery time & sales volumes! 

    3. Low delivery fee

    86% of South African customers believe that high delivery fees impact their online stores’ choices. The high delivery cost is a problem for low-income customers and customers who shop daily.
    If you want to track how your delivery fee compares to your competition and how it’s impacting your sales, our Food Delivery Intelligence solutions are for you!

    4. Customer Service

    Your company’s customer service should be responsive, smooth, omnichannel, and hassle-free. 78% of South African customers are frustrated with delays in customer support from online retailers. Slow response times and lack of communication in case of delays, delivery, and refunds hamper the customer experience drastically.

    Customer Service
    Customer Service

    Conclusion

    eCommerce in South Africa is growing at unprecedented rates. There has been a surge in the appetite of South Africans for online shopping and online retailers across the board are gearing up to meet this demand. 

    If you’re an online retailer in South Africa & need insights on staying competitive with the right pricing, product assortment, delivery time, delivery rates, and the other key influencers that affect customers’ choice of online retailers, sign up for a demo with our team at DataWeave to know how can help!  

  • Share of Keyword Search Cinco de Mayo 2022

    Share of Keyword Search Cinco de Mayo 2022

    As inflation continues to hike costs for consumers and supply chains challenge them to maintain loyalty, there is still an active audience willing to pay the ultimate price for the convenience of food and alcohol delivery. That being said, we analyzed 8 popular Retail and Delivery Intermediary websites and 11 popular ‘Cinco de Mayo’ keywords to see which Brands are predicted to win the battle of Digital Shelf Share of Search this holiday.

    2022 Cinco de Mayo Share of Search Insights - Top Brands for 'Cinco de Mayo'
    2022 Cinco de Mayo Share of Search Insights – Top Brands for ‘Cinco de Mayo’

    Opportunities for Food & Bev on Cinco de Mayo

    While most of our analysis focused on popular Cinco de Mayo food and beverage products, none of these brands populated on either Target (pictured on left below) or Walmart (pictured on right below) page 1 search results for the term ‘Cinco de Mayo’. Keyword search results for this term are dominated primarily by décor brands as indicated below.

    Brands Achieving Top Share of Search for Food and Beverage Categories on Cinco de Mayo 2022
    Brands Achieving Top Share of Search for Food and Beverage Categories on Cinco de Mayo 2022

    Share of Keyword Search Results – Alcohol Category

    Three of the most popular alcohol types sought out during Cinco de Mayo are ‘Mexican Beer’, ‘Mezcal’, and ‘Tequila’. Below are the brands dominating Share of Keyword Search results on each of the major retail websites we researched.

    AmazonFresh, Meijer, Kroger, and Sam's Club Share of Search - Beer, Mezcal, and Tequila Keywords on Cinco de Mayo 2022
    AmazonFresh, Meijer, Kroger, and Sam’s Club Share of Search – Beer, Mezcal, and Tequila Keywords on Cinco de Mayo 2022

    We also reviewed the same keyword performance across popular delivery intermediaries to see how Share of Keyword Search altered for ‘Mexican Beer’, ‘Mezcal’, and ‘Tequila’. The results are below for TotalWine, Instacart, Drizly and GoPuff:

    TotalWine, Instacart, Drizly, and GoPuff of Search - Beer, Mezcal, and Tequila Keywords on Cinco de Mayo 2022
    TotalWine, Instacart, Drizly, and GoPuff of Search – Beer, Mezcal, and Tequila Keywords on Cinco de Mayo 2022

    The keyword ‘Agave’ is also a popular search term within the alcohol category during the time leading up to Cinco de Mayo. We reviewed keyword search performance at various zip codes to see how price points that populated on page 1 search results varied given the change in median income. Below are the results:

    Share of Search for Alcohol by Price Point and Zip Code on AmazonFresh
    Share of Search for Alcohol by Price Point and Zip Code on AmazonFresh

    Share of Keyword Search Results – Grocery Categories

    We also reviewed some of the most popular grocery items purchased during Cinco de Mayo by Keyword Share of Search results to see which brands are primed to win the Digital Shelf this year. Below are the results for Target.com and Walmart.com.

    Walmart and Target Share of Search - Food and Beverage Keywords on Cinco de Mayo 2022
    Walmart and Target Share of Search – Food and Beverage Keywords on Cinco de Mayo 2022

    Below are the results for the same popular grocery items and alcohol keywords related to Cinco de Mayo and the page 1 results seen for Brand Share of Search on Safeway.com.

    Safeway Share of Search - Food and Beverage Keywords on Cinco de Mayo 2022
    Safeway Share of Search – Food and Beverage Keywords on Cinco de Mayo 2022

    Access to these types of real-time digital marketplace insights can enable retailers and brands to make strategic decisions and help drive profitable growth in an intensifying competitive environment. Be sure to reach out to our Retail Analytics experts for access to more details regarding the above analysis, and let us know what other holiday insights you’d be interested in seeing this year. Happy Cinco de Mayo!

  • How Restaurants can use QSR Intelligence to Drive Sales

    How Restaurants can use QSR Intelligence to Drive Sales

    Quick service restaurants (QSR) are not only about delivering great food. They also have to overcome challenges like delivery, logistics, and affordable pricing, especially since covid-19 has staggered the entire industry. QSR intelligence helps restaurants get real-time insight into their performance across food delivery apps. With QSR intelligence, restaurants can identify the highest paying buyers across customer segments, demographics, and locations. Data-driven insights will help QSRs improve performance, decrease delivery time, optimize ad budget, and increase food quality – all with the goal to scale revenue and increase orders through food apps.

    The global fast food and quick service restaurant market are expected to grow at a CAGR of 5.1% from 2020 to 2027. The QSR industry is rapidly growing to encompass the changing needs of customers. 60% of U.S. consumers order delivery or takeout once a week and online ordering is growing 300% faster than in-house dining. With QSR intelligence, restaurants can get insights into metrics that will drive their profitability by helping them to fine-tune menus, enhance customer interaction, improve advertisements, and adjust inventory.

    Benefits of QSR Intelligence

    Continuous in-depth analysis of restaurant statistical data will help companies spot trends and devise strategies to improve sales via food apps. Here are a few benefits of QSR intelligence:

    a.    Improve estimates & minimize wait times

    QSR intelligence can help with accurate sales forecasting. With big data, restaurants can track their popular dishes or combos for various meal times to minimize wait times and increase delivery speed. It can also inform restaurants about upcoming trends, especially during holidays and festivals. Keeping an eye for trends will play a significant role in maximizing efficiency during food preparation and ensuring accurate food delivery ETAs.

    b.    Location-based promotions

    QSR intelligence allows restaurants to target customers based on their proximity to the restaurant. The food must be delivered at a particular time to the customers to enjoy the dish at the right temperature. QSRs can apply demographic intelligence to determine cancellation rates, delivery charges, and the proportion of demand and supply. These metrics will help QSRs to improve location-based promotions.

    c.    Increase ROI on deliveries

    To increase return on investment through food deliveries, QSRs can track metrics like location-based promotions, various payment options, ratings, etc. Tracking these metrics will help QSRs offer accurate ETAs, improve operational efficiency, and personalize services, which will increase revenue. Restaurants will also be able to understand where they can adjust their profit margins to increase revenue while maintaining a cumulative level of success.

    How to use QSR Intelligence

    a.    Assortment and availability

    The more restaurants can understand what and how their customers eat, the better they will be prepared to service those demands throughout the day. For example, QSRs can calibrate the menu, ingredients availability, and kitchen preparation time depending on their customers’ orders for lunch and dinner. This also helps optimize daily workflow, such as reorganizing staff to lower labor costs, optimizing the supply chain for ingredient delivery, and revamping the menu to offer better dishes. Another way to ensure your availability is to analyze your busiest hours and adjust the staff and delivery workforce accordingly. For example, if your customers tend to order more during breakfast, it’s worth considering opening your restaurant a bit earlier.

    QSR availability across 4 Food Delivery apps
    Availability across 4 QSR Food Delivery apps
    Availability trend during peak hours - Lunch & Dinner
    Availability trend during peak hours – Lunch & Dinner

    b.    Delivery time

    One of the most driving factors for the success of QSR is delivery time. Restaurants have to ensure the food is delivered as quickly as possible so customers can consume it at the right temperature. Data-driven insights can help restaurants track repeat addresses, find shortcuts or time-saving routes, and avoid unfamiliar or low delivery locations.

    QSRs have to analyze the entire delivery process from time taken to order on the app, how quickly kitchens can prepare orders, hand over to delivery partners, and get them to the customers. An essential part of QSRs is throughput, the speed at which they can process and deliver orders. During peak hours like lunch and dinner, faster service and quick ETAs ensure that customers do not choose other restaurants. If you have different menus for breakfast and other meals, ensure that your foodservice app can remove such menus when they are not available.

    Delivery Time Analysis
    Delivery Time Analysis
    Delivery Fee Analysis
    Delivery Fee Analysis

    c.    Pricing and Promotions

    QSRs have to understand customers’ price sensitivity while determining delivery costs and ensuring profitability for the business and delivery partners. Customers might look for free deliveries but not adding delivery charges might lead to loss. A deep dive into common transaction data across the locations will allow restaurants to understand the price sensitivity of all customer segments, helping them make intelligent pricing decisions.

    QSR intelligence can also help restaurants determine which delivery locations are most profitable. This helps to adjust the delivery radius, fee, and promotions. Restaurants can offer promo codes, coupons, referral codes, etc., to attract customers and encourage repeat purchases.

    d.    Discoverability

    Restaurants have to ensure that their dishes are on the first-page listing. With QSR intelligence on category analysis, keyword optimization, and competition analysis, restaurants can help their customers discover dishes. This also includes optimizing listings for pricing and rating and delivery fees and availability during peak times such as breakfast, lunch, and dinner.

    e.    Advertisement Optimizer

    QSRs can use data to optimize the advertisement budget and adequately improve return on investment. They can track the visibility of advertisement banners across locations and optimize them for different times of the day. Data analysis can also help restaurants understand which customer segments are more likely to convert to long-term loyalists. This data will help QSRs design personalized campaigns and align advertisement budgets while converting them to long-term customers, further improving the bottom line.

    Ad spends by identifying carousels with the highest visibility
    Ad spends by identifying carousels with the highest visibility
    Track QSRs performance across Carousels across multiple zip codes
    Track QSRs performance across Carousels across multiple zip codes

    f.     Growth & Expansion

    Upselling and cross-selling are two popular tactics that improve growth for quick-service restaurants. However, that requires a rich understanding of customers’ price sensitivity, preferences, and behavior. QSR intelligence can provide information about which upsell and cross-selling offers a customer segment is likely to value and which optimal channels for distributing the offer.

    Conclusion

    Quick service restaurants can track critical data points and use them to increase revenue and improve customer experience. Learning how to price, promote, and deliver food to customers during a pandemic can be challenging. QSR intelligence will help brands attract the right clientele, adjust inventory, reduce overall marketing costs, and increase order rates. This will also help increase customer loyalty across segments which can, in turn, increase the number of returning customers and profitability.

  • Quick Commerce in 2022: An Era of Hyperlocal Delivery

    Quick Commerce in 2022: An Era of Hyperlocal Delivery

    Busy lifestyles, urbanization, aging populations, and smaller households led to the preference for convenience and efficiency in eCommerce deliveries. However, the Covid-19 pandemic caused a massive shift in customer demand and buying decisions. The modern consumer journey moved from takeaway food to online shopping to quick or same-day deliveries. With evolving digital touchpoints, customers now favor fast deliveries and convenience. 

    According to a 2020 survey by KPMG in the UK, 43% of consumers chose next-day delivery, a 4% increase from last year. Interestingly, 17% of consumers abandoned a brand if they faced a longer delivery. Standard delivery time has shortened from 3 to 4 days and two-day shipping to next-day or same-day delivery. This increasing trend of quick delivery has led to the boom of quick commerce or Q-Commerce. Quick commerce or on-demand delivery refers to retailers that deliver goods in under an hour or as quickly as 10 minutes. The rise of Q-commerce is caused by changing consumer behavior and rising expectations since the pandemic. 

    In this blog, you’ll learn about quick commerce or Q-Commerce and its benefits. You’ll also read about factors to consider for quick commerce and tips to implement this business model. 

    1. What is Quick Commerce?

    on-demand delivery
    On-Demand Delivery

    Quick commerce or on-demand delivery is a set of sales and logistics processes that empowers eCommerce businesses, restaurants, grocery chains, and manufacturers to deliver products in less than 24-hours. A study shows that 41% of consumers are willing to pay for same-day delivery while 24% of customers will pay more to deliver their items within a one- or two-hour window.  

    Changing lifestyles and customer behavior directly impacted the rise of Q-Commerce. The takeaway food industry had used quick commerce for many years. But with Q-Commerce businesses consistently cutting delivery time, quick commerce for instant grocery delivery has become a new trend. For instance, India-based online grocery delivery firm Grofers rebranded to BlinkIt amid rising competition, promising 10-minute instant delivery. 

    2. How quick is Quick Commerce?

    The post-pandemic lifestyle & the rise in the number of small and single-person households has led to an increase in demand for products in small quantities that need to be delivered sooner than later. Sometimes in as little as 10 minutes! This trend is oriented towards specific products such as packed or fresh foods, Groceries, Food delivery, Gifts, Flowers, Medicines to name a few.

    quick delivery service
    Quick Commerce Categories

    Local shops that can reach more customers with less friction have swapped traditional brick-and-mortar warehouses to cater to an urban population. These online Q-Commerce stores can deliver goods from favorite stores and offer a vast choice of products that are available 24/7. However, it requires real-time inventory management, data-driven pricing management, innovative logistics technology, a fantastic rider community, and a proper assortment. 

    3. Factors to consider for Quick Commerce

    q commerce
    Competitive Assortment & Pricing

    a. Assortment

    With growing competition, getting product assortment right isn’t easy for quick commerce businesses, yet it’s critical to their success. To optimize assortment for quick commerce stores, they need to understand how demand differs between demographics and various stores. Since quick delivery involves packed and fresh products, it is even more essential to carry a unique assortment for each store. 

    Data analytics will help Q-Commerce businesses understand which products are repeatedly purchased in every store. It also helps identify high-demand gaps in your competitors’ platforms. Assortment analytics can help distinguish shifts in customer behavior across short- and long-term demands. The key to increasing sales is shaping inventory to match the overlap between market opportunity and consumer interest. With assortment analytics, they can determine the optimal mix of products for their daily inventory. 

    b. Pricing

    Pricing information is readily available on quick commerce businesses, allowing customers to compare prices before making purchase decisions. Before deciding on a product, shoppers actively track the best deals on platforms across various Q-Commerce delivery platforms. According to a survey, 31% of consumers rated price comparisons as the essential aspect of their shopping experience. Understanding price perception can help quick commerce companies to optimize their pricing strategy while remaining competitive. 

    A competitive pricing strategy does not imply that Q-Commerce businesses have to cut prices. Instead, it’s about adjusting prices relative to your competitors but not significantly impacting the bottom line. Competitive pricing provides real-time pricing updates, allowing quick commerce platforms to drive sales by nailing their pricing strategy. 

    c. Delivery Time

    delivery time
    Grocery Delivery Race In India

    Delivery time has become the game-changer in quick commerce, with platforms fighting over shorter delivery times. Unpredictable factors such as specific delivery windows, last-minute customer requests, and traffic congestion can wreak havoc in your planning. Optimizing your delivery time can improve operational efficiency through faster delivery, quick route planning, and driver monitoring. 

    Big eCommerce platforms like Amazon offer same-day or next-day delivery to prime members with no extra fee on minimum order criteria. The only demand of customers who do not worry about discounts or lower wholesale prices is quick delivery. The demand for quick delivery services has led to many global retailers offering same-day delivery to meet those expectations.

    d. Demand Forecasting

    Since quick commerce is a viable solution for certain products, businesses must determine what customers want and when they want it. Q-Commerce businesses can use historical data to predict future sales patterns with demand forecasting. It ensures that Q-Commerce businesses can limit wastages and their inventory can cater to a targeted market. Demand forecasting also helps to replenish stock based on real-time data. Furthermore, companies can identify bottlenecks and points of wastage in the supply chain with a demand-driven system in place.

    4. Benefits of Quick Commerce

    same day delivery
    Q-Commerce Benefits

    a. Competitive USP

    Q-Commerce businesses get new value propositions because customers that need immediate delivery are willing to try new brands and order from new stores. It also allows online Q-Commerce businesses to compete with global marketplaces and brick-and-mortar stores. 

    We at DataWeave have helped quick-service restaurants (QSRs) that are going the Q-Commerce route & selling via food aggregator apps to increase their revenue significantly. Our AI-Powered Food Analytic solutions have helped QSRs diagnose improvement areas, monitor key metrics, and drive 10-15% growth. Our data has helped them understand availability during peak times, monitor product visibility by region, track competitors, and choose suitable banners for promotion. Read more about that here.

    b. Increase margins

    A study from Deloitte suggests that 50% of online shoppers spend extra money to get convenient delivery of the products they need during the pandemic. These customers also paid extra for on-demand fulfillment and bought online pick-up in-store options. 

    Since the assortment of products in quick commerce is relatively small, Q-Commerce businesses can drive sales for their most profitable product lines. There is a potential for greater margins because wealthier demographics often require convenience. For instance, time-stranded professionals value convenience over discounts. 

    c. Customer experience is paramount

    With quick commerce, retailers can meet customer expectations and exceed them, fostering brand loyalty. Quick commerce addresses customer pain points such as running out of food before a small party or getting a birthday present for your friends. It can simply help people who cannot make it to the shop or stock up essentials.

    5. How to implement Quick Commerce

     quick delivery
    Implementation of Quick Commerce

    a. The need for local hubs

    To pack and deliver products in under an hour, businesses must be located close to the customers. Therefore, quick commerce relies on local warehouses that can serve customers in immediate proximity. Since the duration of two-wheelers is less likely to be impacted by heavy traffic or parking spaces, delivery services employ riders to deliver products.

    b. Ensure you have the right analytics in place

    Another essential part of running a quick commerce business is to have a web or phone application that can facilitate online ordering and offer accurate stock information to customers. Q-Commerce businesses also need a real-time inventory management tool that will provide insights into stock levels and allow for quick reordering and redistribution of products. This will also prevent deadstock and stockouts. 

    DataWeave’s Food Delivery Analytics product suite helps companies to increase order volumes, understand inventory, and optimize prices. It also provides access to discounts, offers, delivery charges, inventory, and final cart value across all your competitors. 

    c. It’s all about stock availability & assortment

    Q-Commerce in the Grocery Delivery space is excellent for specific product niches like packed or fresh foods and vegetables, drinks, gifts, cosmetics, and other CPG products that customers use every day.

    The stock assortment is as important in the Food Delivery space with restaurant chains like McDonald’s or Burger King that generate as much as 75% of their sales from online orders. These businesses have to make sure they’re carrying the most in-demand product assortment there is. 

    Conclusion

    same day delivery
    Same Day Delivery

    The rise of quick commerce represents the next big change in eCommerce, accompanied by a shift in consumer behavior towards online grocery shopping and food ordering. When positioned with proper assortment and pricing, instant delivery services can allow Q-Commerce businesses to capture the influx of consumers looking for speedy delivery. By tapping into big data from quick commerce markets, Q-Commerce businesses can gain insights into consumer demands. 

    If you’re a Q-Commerce business in the Food Delivery or Grocery Delivery space, reach out to our experts at DataWeave to learn how our solutions can help you understand the best Pricing Strategy, Delivery Time SLAs, Assortment Mix you need in order to successfully sell on Q-Commerce platforms.