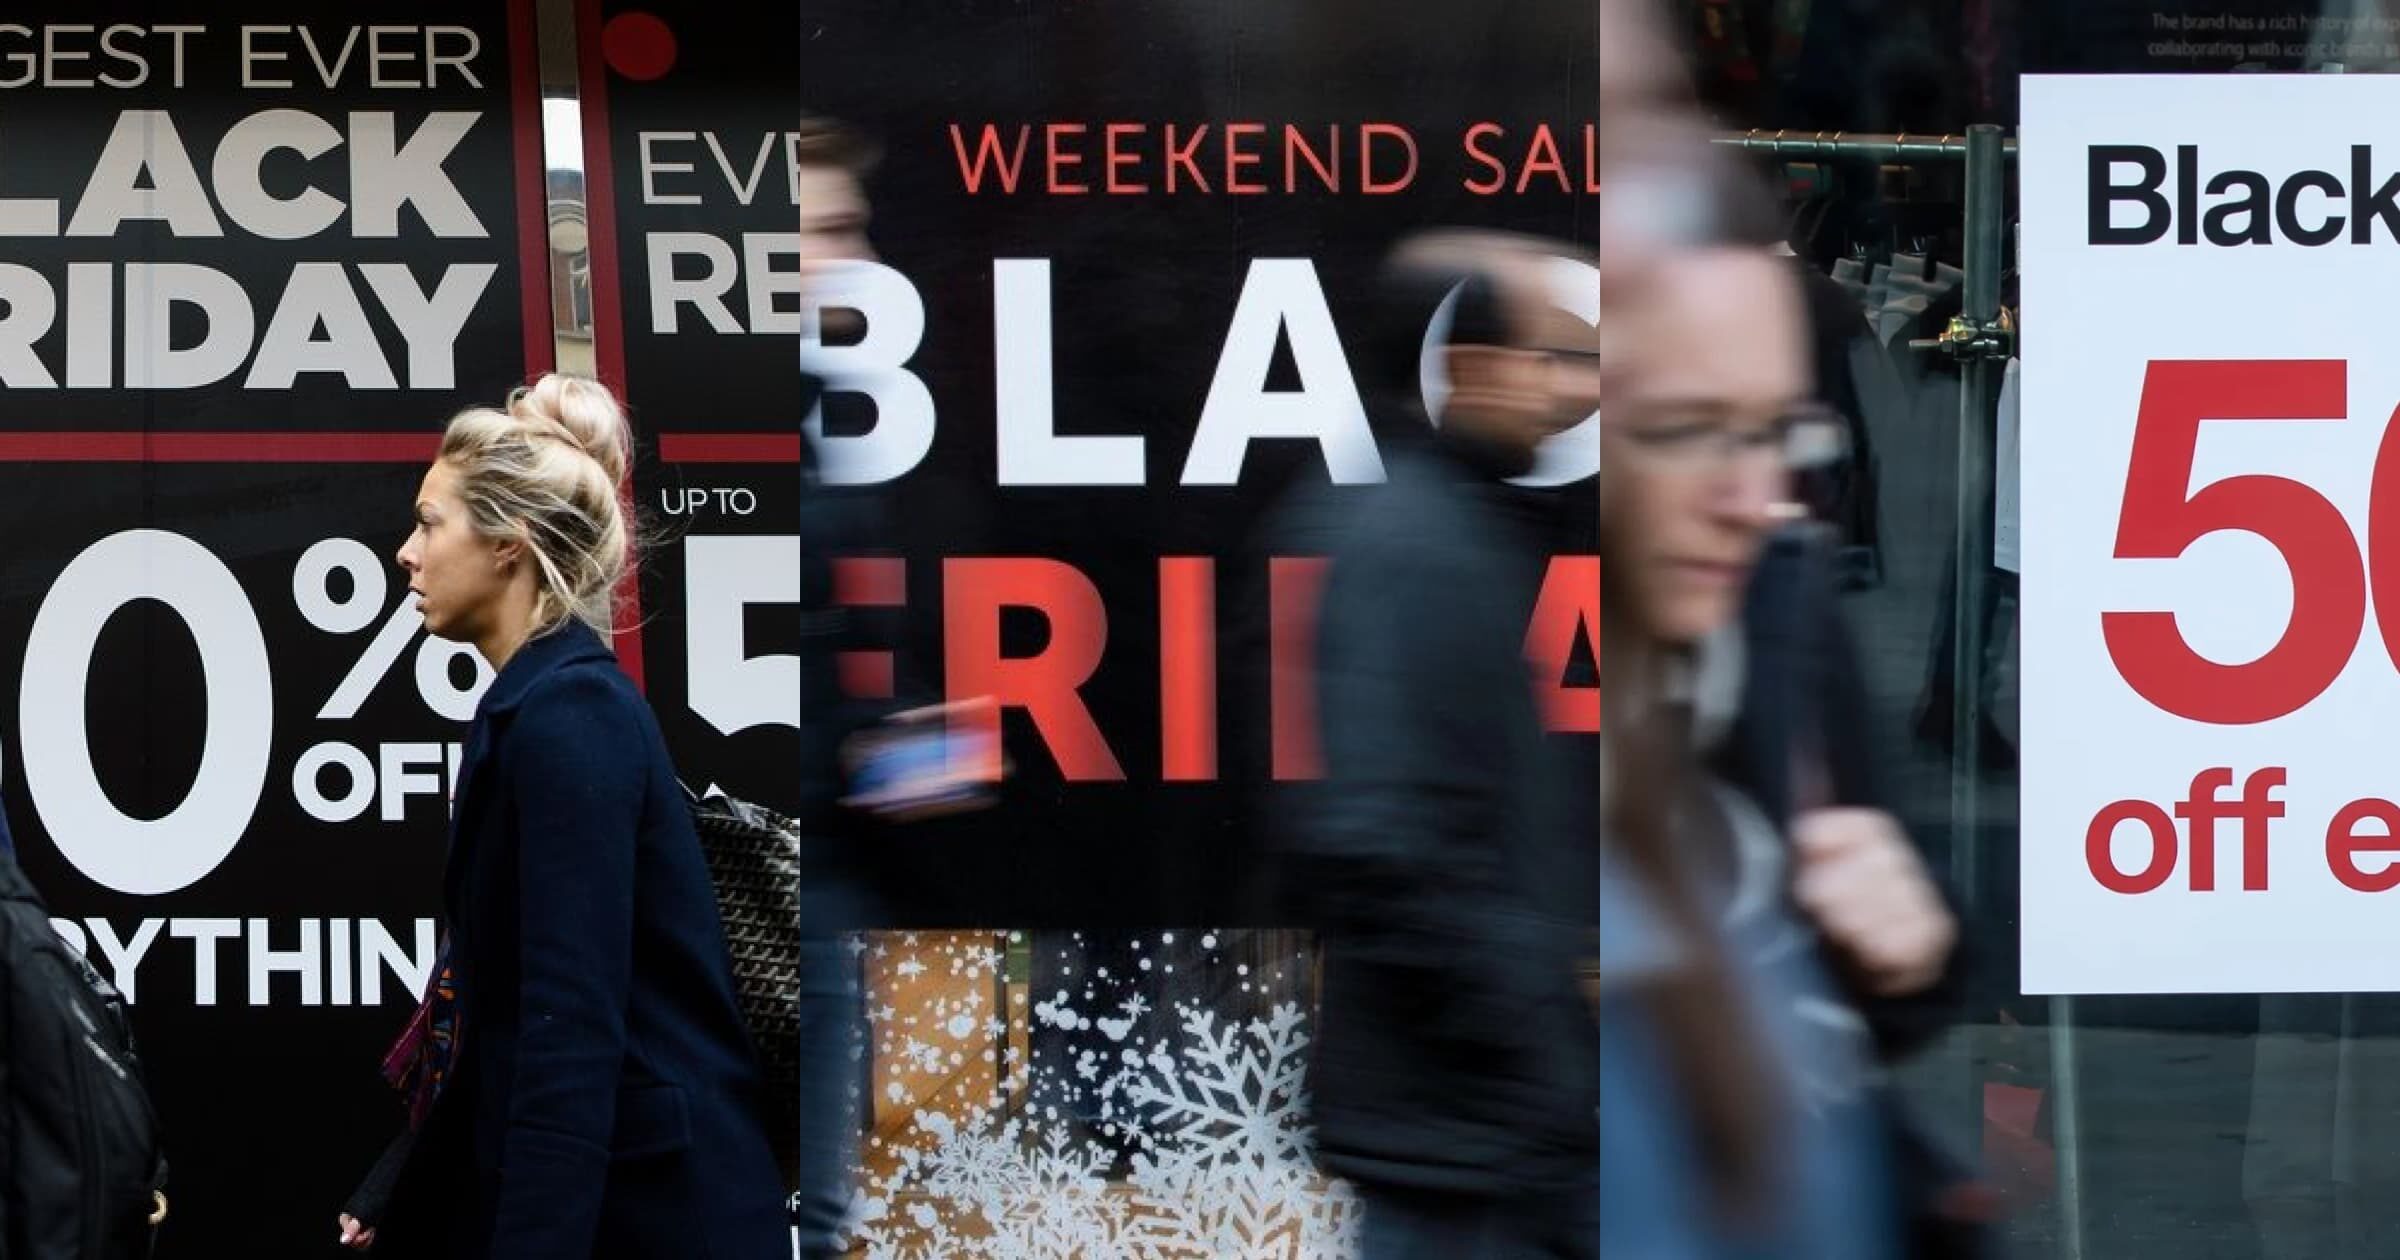
Contrary to popular speculation of lukewarm online sales owing to the weak economy, high inflation, and stretched wallets, Black Friday this year recorded a whopping $9 billion in e-commerce sales. Despite the lull in online shopping across many retailers in the months preceding Thanksgiving and weakened consumer sentiment, US online merchants saw a sizable boost in sales during and after Thanksgiving, albeit at a slower growth of 2.3%, as reported by Adobe Analytics.
This article looks closely at the Black Friday data to understand which brands, retailers, and product categories were key players. Through DataWeave’s innovative Digital Shelf Analytics product, we deep dive into the availability, discount, and share-of-search data to deduce why some product categories and retailers fared better than others.
Who: Retailers and Brands that had the Highest Presence
Black Friday sales this year were driven by consumers grabbing the biggest and best deals to make the most of their already stretched wallets. Many shoppers opted for flexible payment schemes, and Buy Now Pay Later (BPNL) payments rose by 78% compared to the week before Thanksgiving. Surprisingly, Amazon, which was the most searched retailer during Black Friday last year, came only fourth this year, as reported by the Search Intelligence company, Captify.
According to Captify, Walmart was the most searched retailer for Black Friday deals, followed by Target, Kohls, and Amazon in that order. Amazon, however, has reported its biggest Thanksgiving sale this year, with independent retailers selling through Amazon seeing a total sales of $1 billion. With the economic slowdown and thin wallets looming large, discount rates greatly influenced consumer spending. Mobile shopping accounted for 55% of digital sales, 8.5% more than the previous year.
As told by Adobe, Electronics were the significant sales driver, reporting 221% higher sales than in October this year, with smart home items and audio equipment playing an important role with 271% and 230% higher sales. Toys ( popular purchases were Fortnite, Roblox, Bluey, Funko Pop!, and Disney Encanto) and exercise equipment also registered a substantial growth of 285% and 218%, respectively.
Other top-selling items included gaming consoles (Xbox Series X and PlayStation 5 devices, games including FIFA 23, NBA 2k23, and Pokemon Scarlet & Violet), drones, Apple MacBooks, and Dyson products (airwrap and vacuum). Amazon’s most popular items were reported to be Apple Airpods, Nintendo Switches, Echo Dot smart speakers, and Fire TV sticks.
What: Top Selling Product Categories
Electronics, closely followed by home appliances (robotic vacuum cleaners), toys, and exercise equipment, were popular product categories in demand during Black Friday this year. Several retailers, including Amazon, Walmart, Target, Kohls, BestBuy, and Home Depot, offered lucrative pre-Black Friday discounts to trigger early sales kick-off.
Amazon carried an early discount of 50% on its Echo smart speaker, Target offered 30% off on Dyson vacuum cleaners, Walmart offered 25-35% off on Apple ipads and watches, and Kohls offered 51% off on the iRobot Roomba.
Amazon’s top ten best-selling products ranged from Amazon devices like Echo Dot speakers, Fire TV sticks, and Echo Show to Apple AirPods, Nintendo Switches, New Balance sneakers, Champion Apparel, and Burt’s Bees Lotions. The popular product categories were home, fashion, toys, beauty & health, and Amazon devices. Consumers heavily supported small businesses, contributing to $1 billion in sales. Top sellers from small businesses included card and board games.
Briefly correlating the discounts offered with the best-selling product categories, one can notice that the deals have largely influenced Black Friday sales this year. Popular categories are those that have had deep discounts, reflecting the consumer’s tendency to wait and grab the best deals.
How: Role of Digital Shelf Analytics – Key Performance Indicators
We have seen a summary of the Black Friday 2022 statistics – sales recorded, top-selling products, product categories, and retailers. Using DataWeave’s e-commerce analytics product, we track and study the variations in digital shelf KPIs across retailers before Thanksgiving and during Thanksgiving to understand how these influence sales.
Availability scores, discount rates, and share of search data are analyzed for top retailers in the US for key product categories. Data is tracked and analyzed across two time periods – before Thanksgiving (Nov 10 – Nov 21) and during Thanksgiving (Nov 21 – Nov 25).
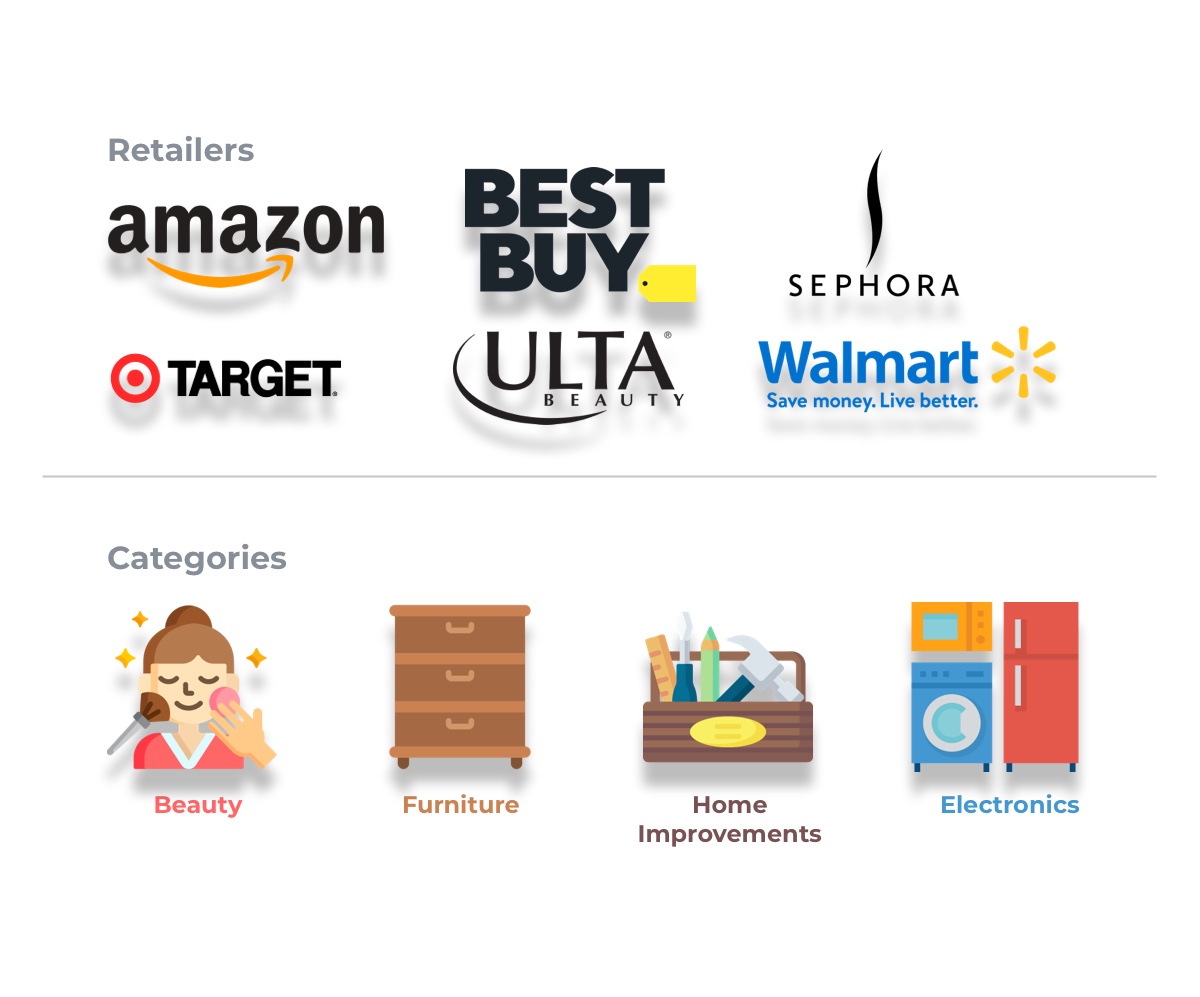
Methodology
- Retailers tracked: Amazon, Best Buy, Sephora, Target, Ulta, Walmart
- Product Categories tracked: Electronics, Home Improvement, Beauty, Furniture
- Digital Shelf KPIs tracked: Availability, Discount rates, Share of Search
- Location: USA
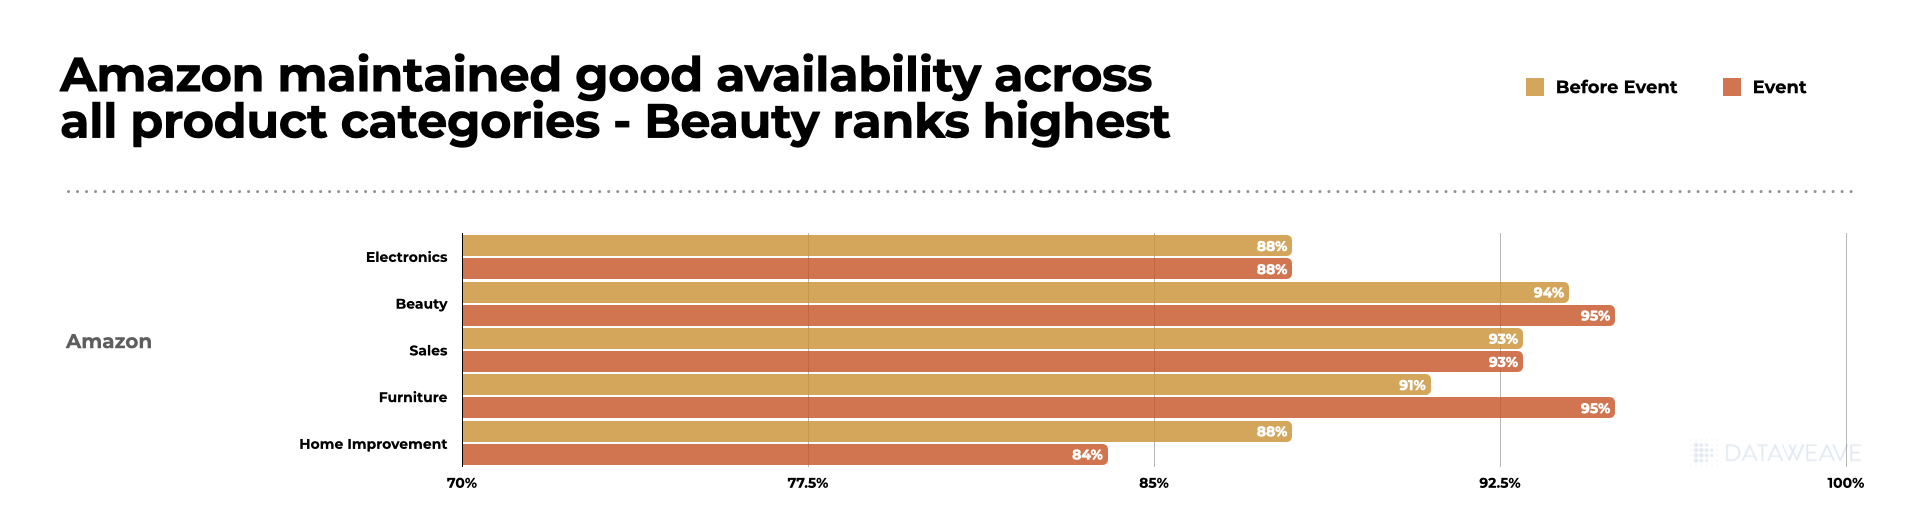
Amazon maintained good availability across all product categories – Beauty ranks the highest.
Salient Insights
- Amazon maintained good overall availability – an improvement of 3% over Prime day.
- Beauty had the highest availability of 95%, with none and Lotion & Brushes reporting 97% and 95% availability, respectively. Shampoo reported the lowest availability at 92%
- Home Improvement had the least availability at 87%, with dishwashers (68%) and washers and dryers (78%) having the lowest availability.
- Unlike Furniture and Home Improvement, most categories maintained similar availability scores before and during Black Friday.
- Furniture improved its availability during Black Friday by 4%, while Home Improvement reported a decrease in availability during Black Friday by 4%.
- Electronics, which was a major sales driver, had an availability of > 90% across all sub-categories except for Television, which had a low availability of 70%
- Tables and chairs registered 99% availability under Furniture
The above data indicates that Amazon ensured the high availability of utility products that consumers would buy even during a slow economy. Other retailers showed similar availability trends, with scores being similar prior to and during the event.
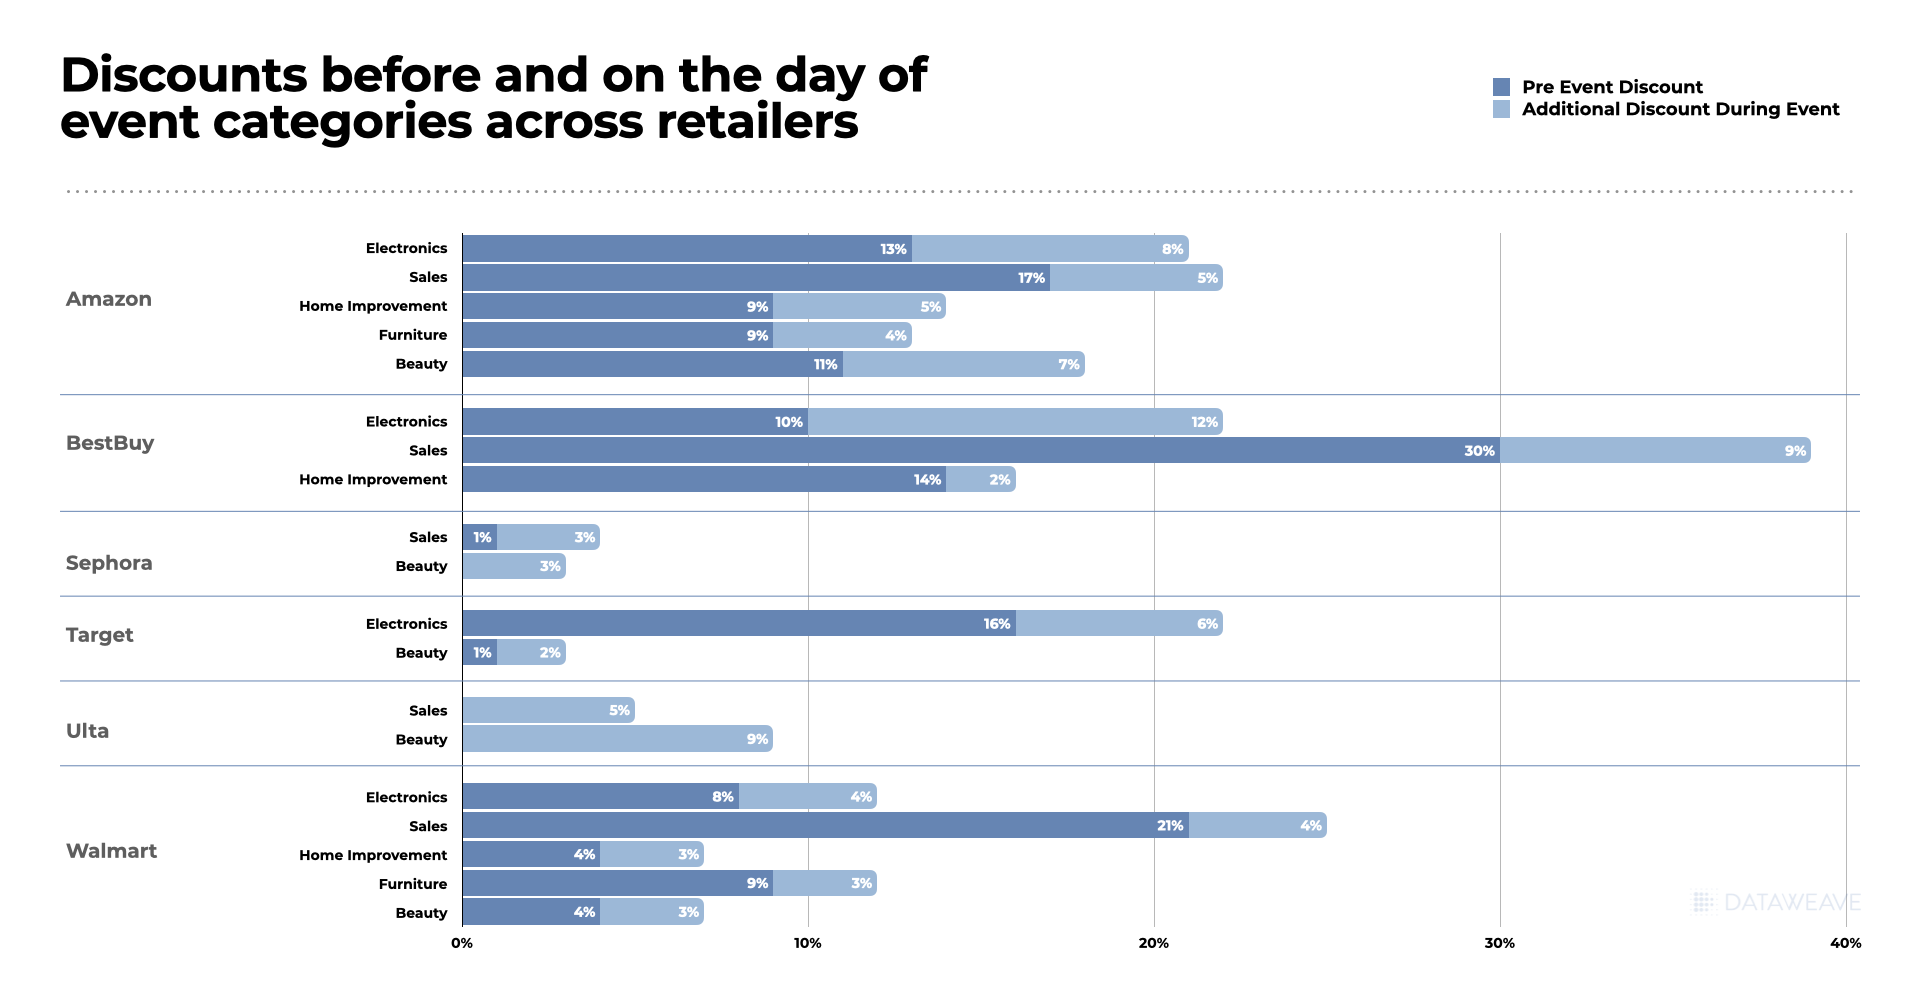
Discounts Drove Sales – Best Buy offered the Highest Discounts
Highlights
- Best Buy offered the highest early Black Friday discount of 30%, followed by an additional 9% discount around Black Friday. Walmart followed next with 21% early discounts and an extra 4.5% discount during the event. Amazon came next with 17% early discounts and a 5% discount during Black Friday. Discount rates seem to strongly correlate with online searches, with Walmart beating Amazon this year as the most searched retailer for Black Friday deals.
- Electronics was the most discounted category across Amazon, Best Buy, and Target, with an average discount of 21%. Walmart gave lower deals on electronics (12%). Electronics also had heavy early discounts of 12%, with most retailers giving an additional discount of 7-8% closer to Thanksgiving.
- Best Buy offered early discounts of 10% and further upped their discounts by another 12% closer to Thanksgiving. Being the most discounted category, electronics was also a significant sales driver this Black Friday.
- Amazon offered the highest discounts for Beauty products (18%), followed by Ulta at 10% and Walmart at 8%. Sephora and Target gave minimal discounts on beauty products (3%)
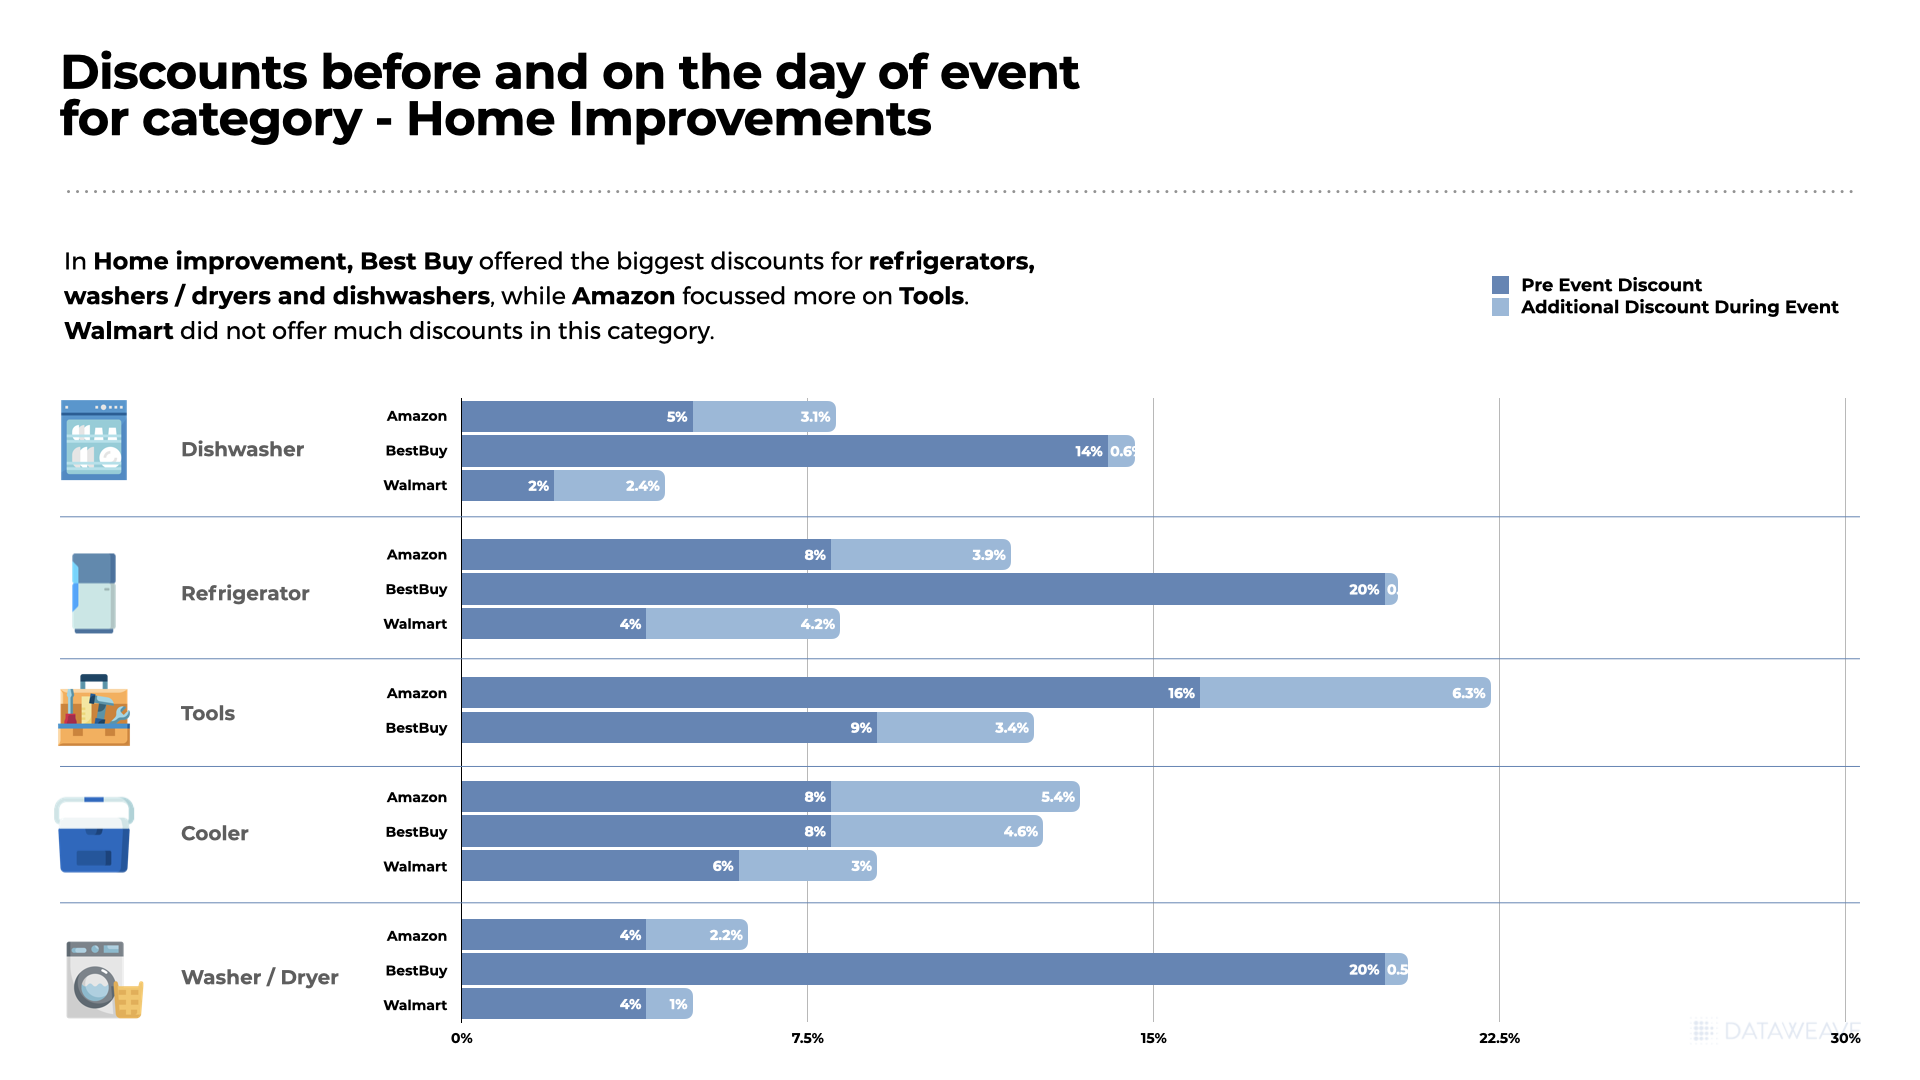
- Best Buy gave the maximum discounts on Home Improvement products (16%), followed by Amazon at 14%. Walmart gave much lower discounts of 7% on Home Improvement products.
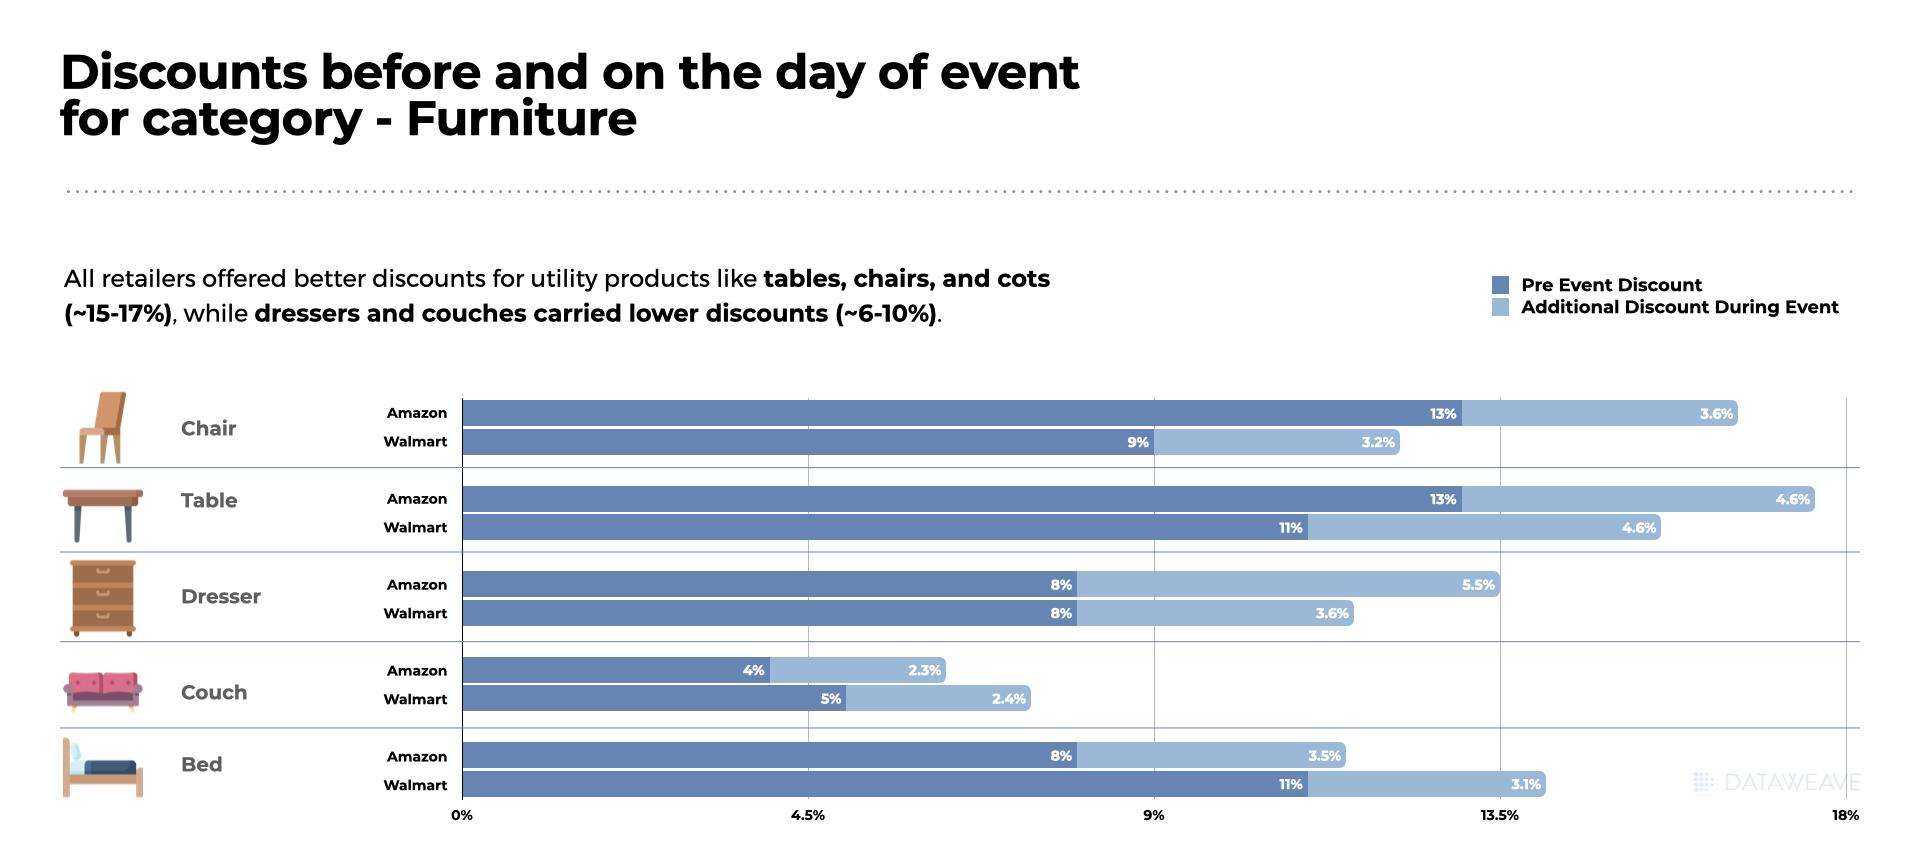
- Furniture is another category with 12-13% discounts at both Amazon and Walmart.
- Best Buy’s strategy this year has been to offer heavily discounted early deals to boost their sales.
Highlights
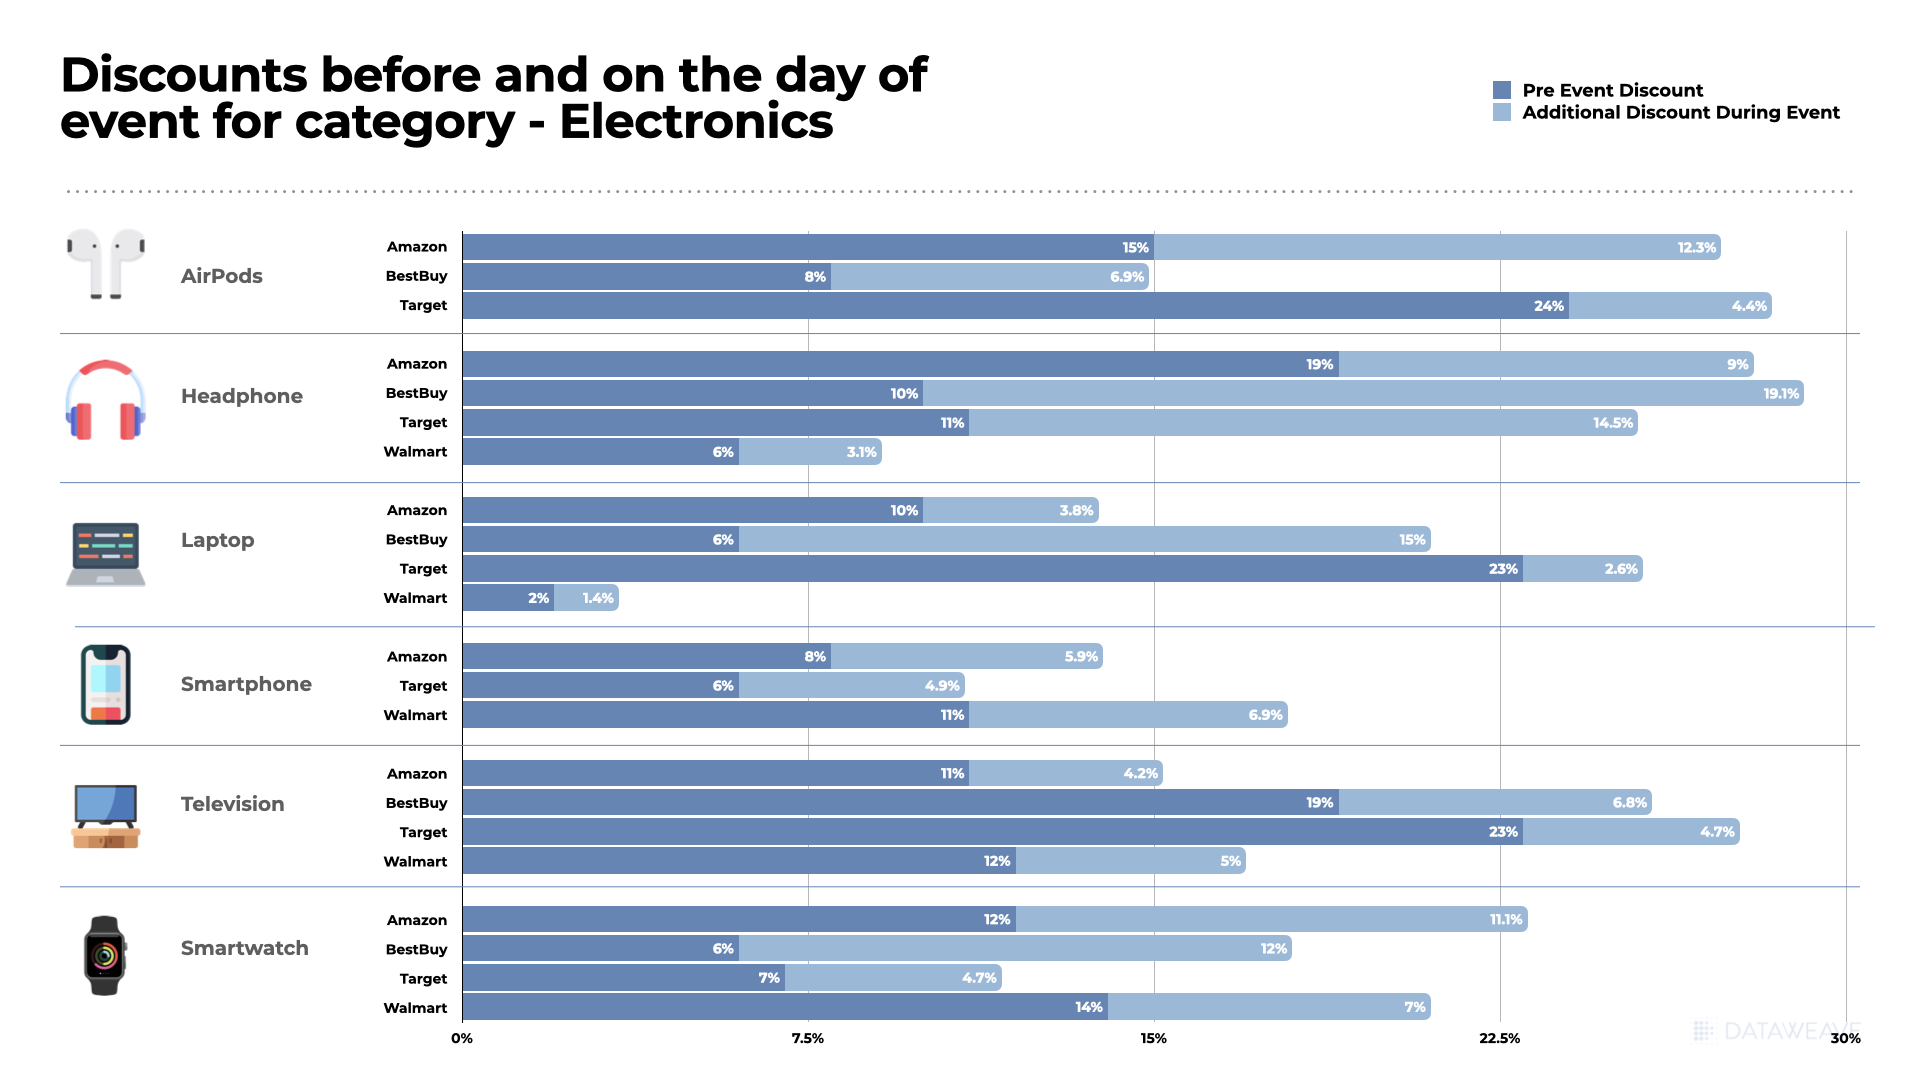
- Airpods and headphones were the most discounted item under Electronics, with Amazon and Target offering a whopping 27-29% discount. This clearly resulted in heavy sales of AirPods this Thanksgiving.
- Best Buy and Target had good discounts on all electronic items, while Amazon gave heavier discounts on AirPods, headphones, and smartwatches.
- Walmart did not offer hefty discounts on laptops and headphones, instead focused on Smartwatches, smartphones, and television.
- In Home improvement, Best Buy offered the biggest discounts for refrigerators, washers and dryers, and dishwashers, while Amazon focussed more on Tools.
- Walmart did not offer many discounts in this category.
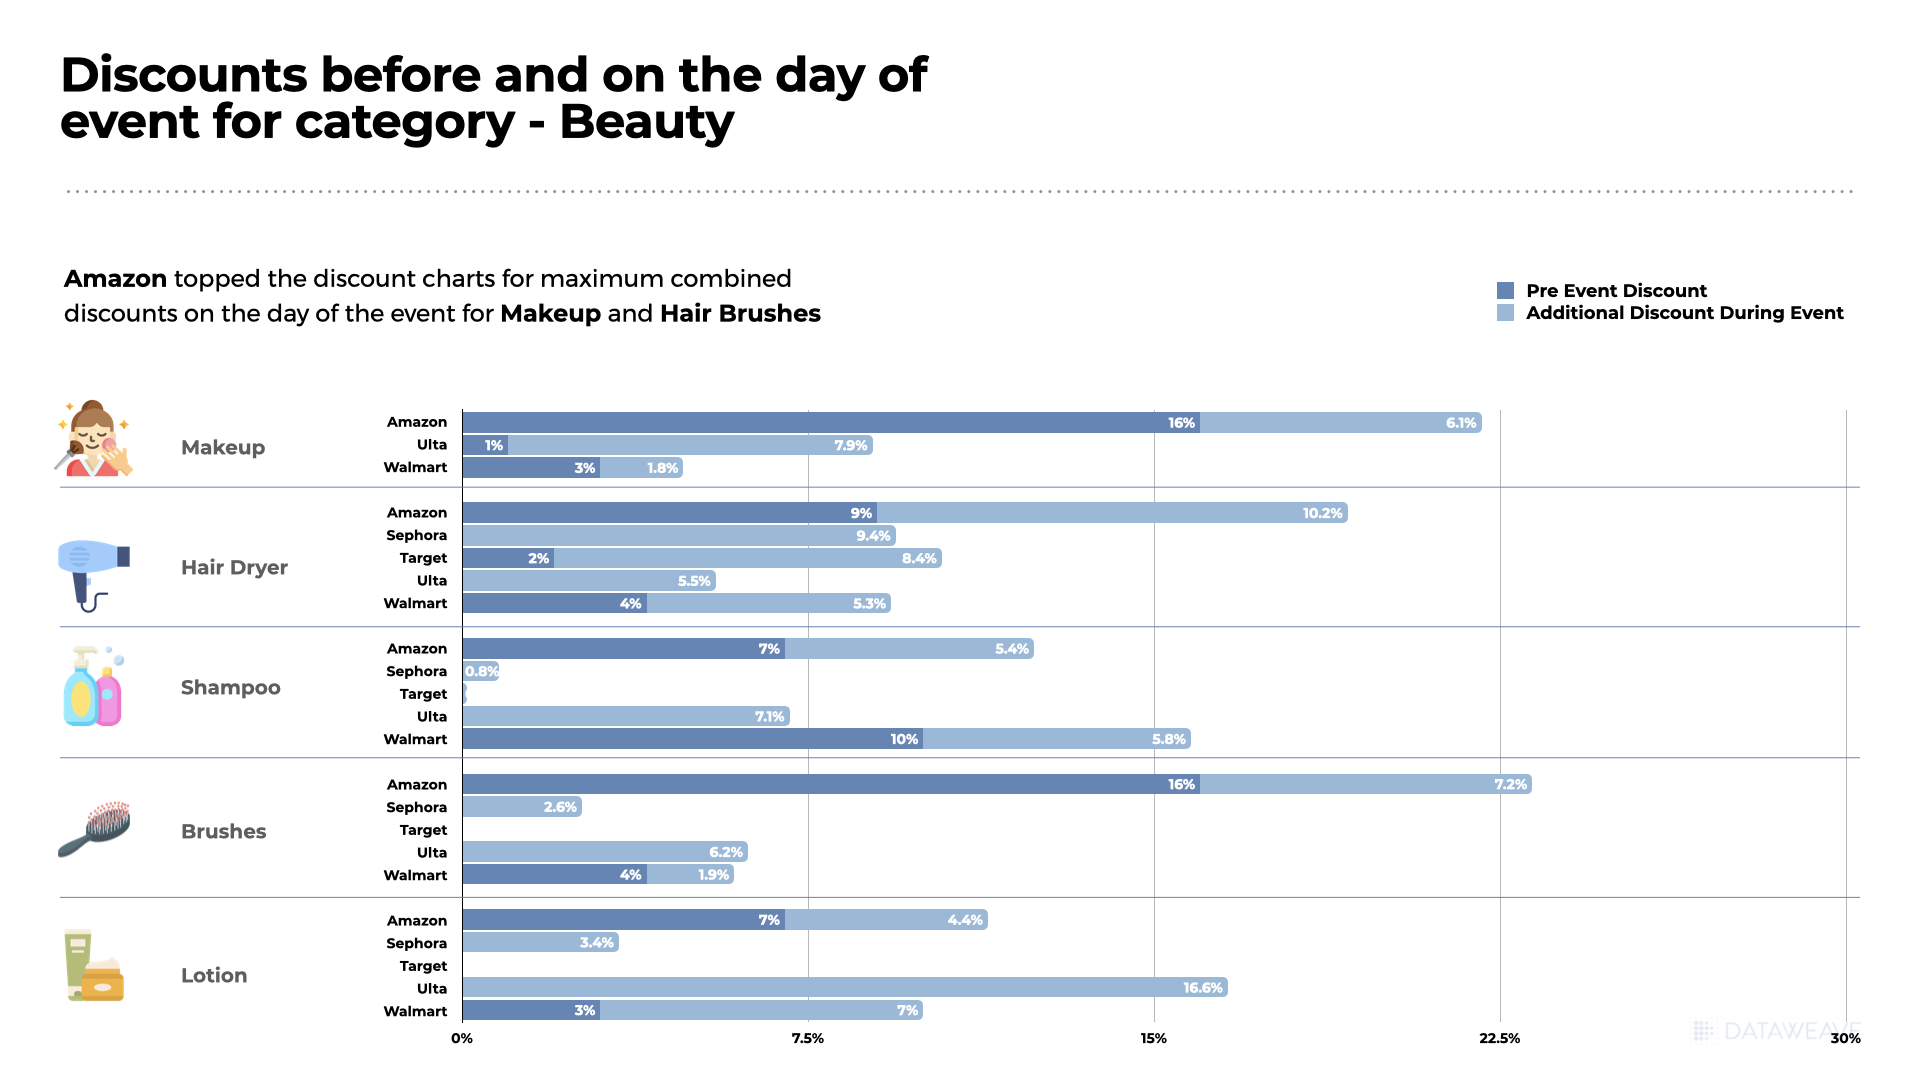
- Amazon topped the discount charts for maximum combined discounts for makeup and hair brushes on the day of the event.
- All retailers offered better discounts for utility products like tables, chairs, and cots (~15-17%), while dressers and couches carried lower discounts (~6-10%).
Highlights
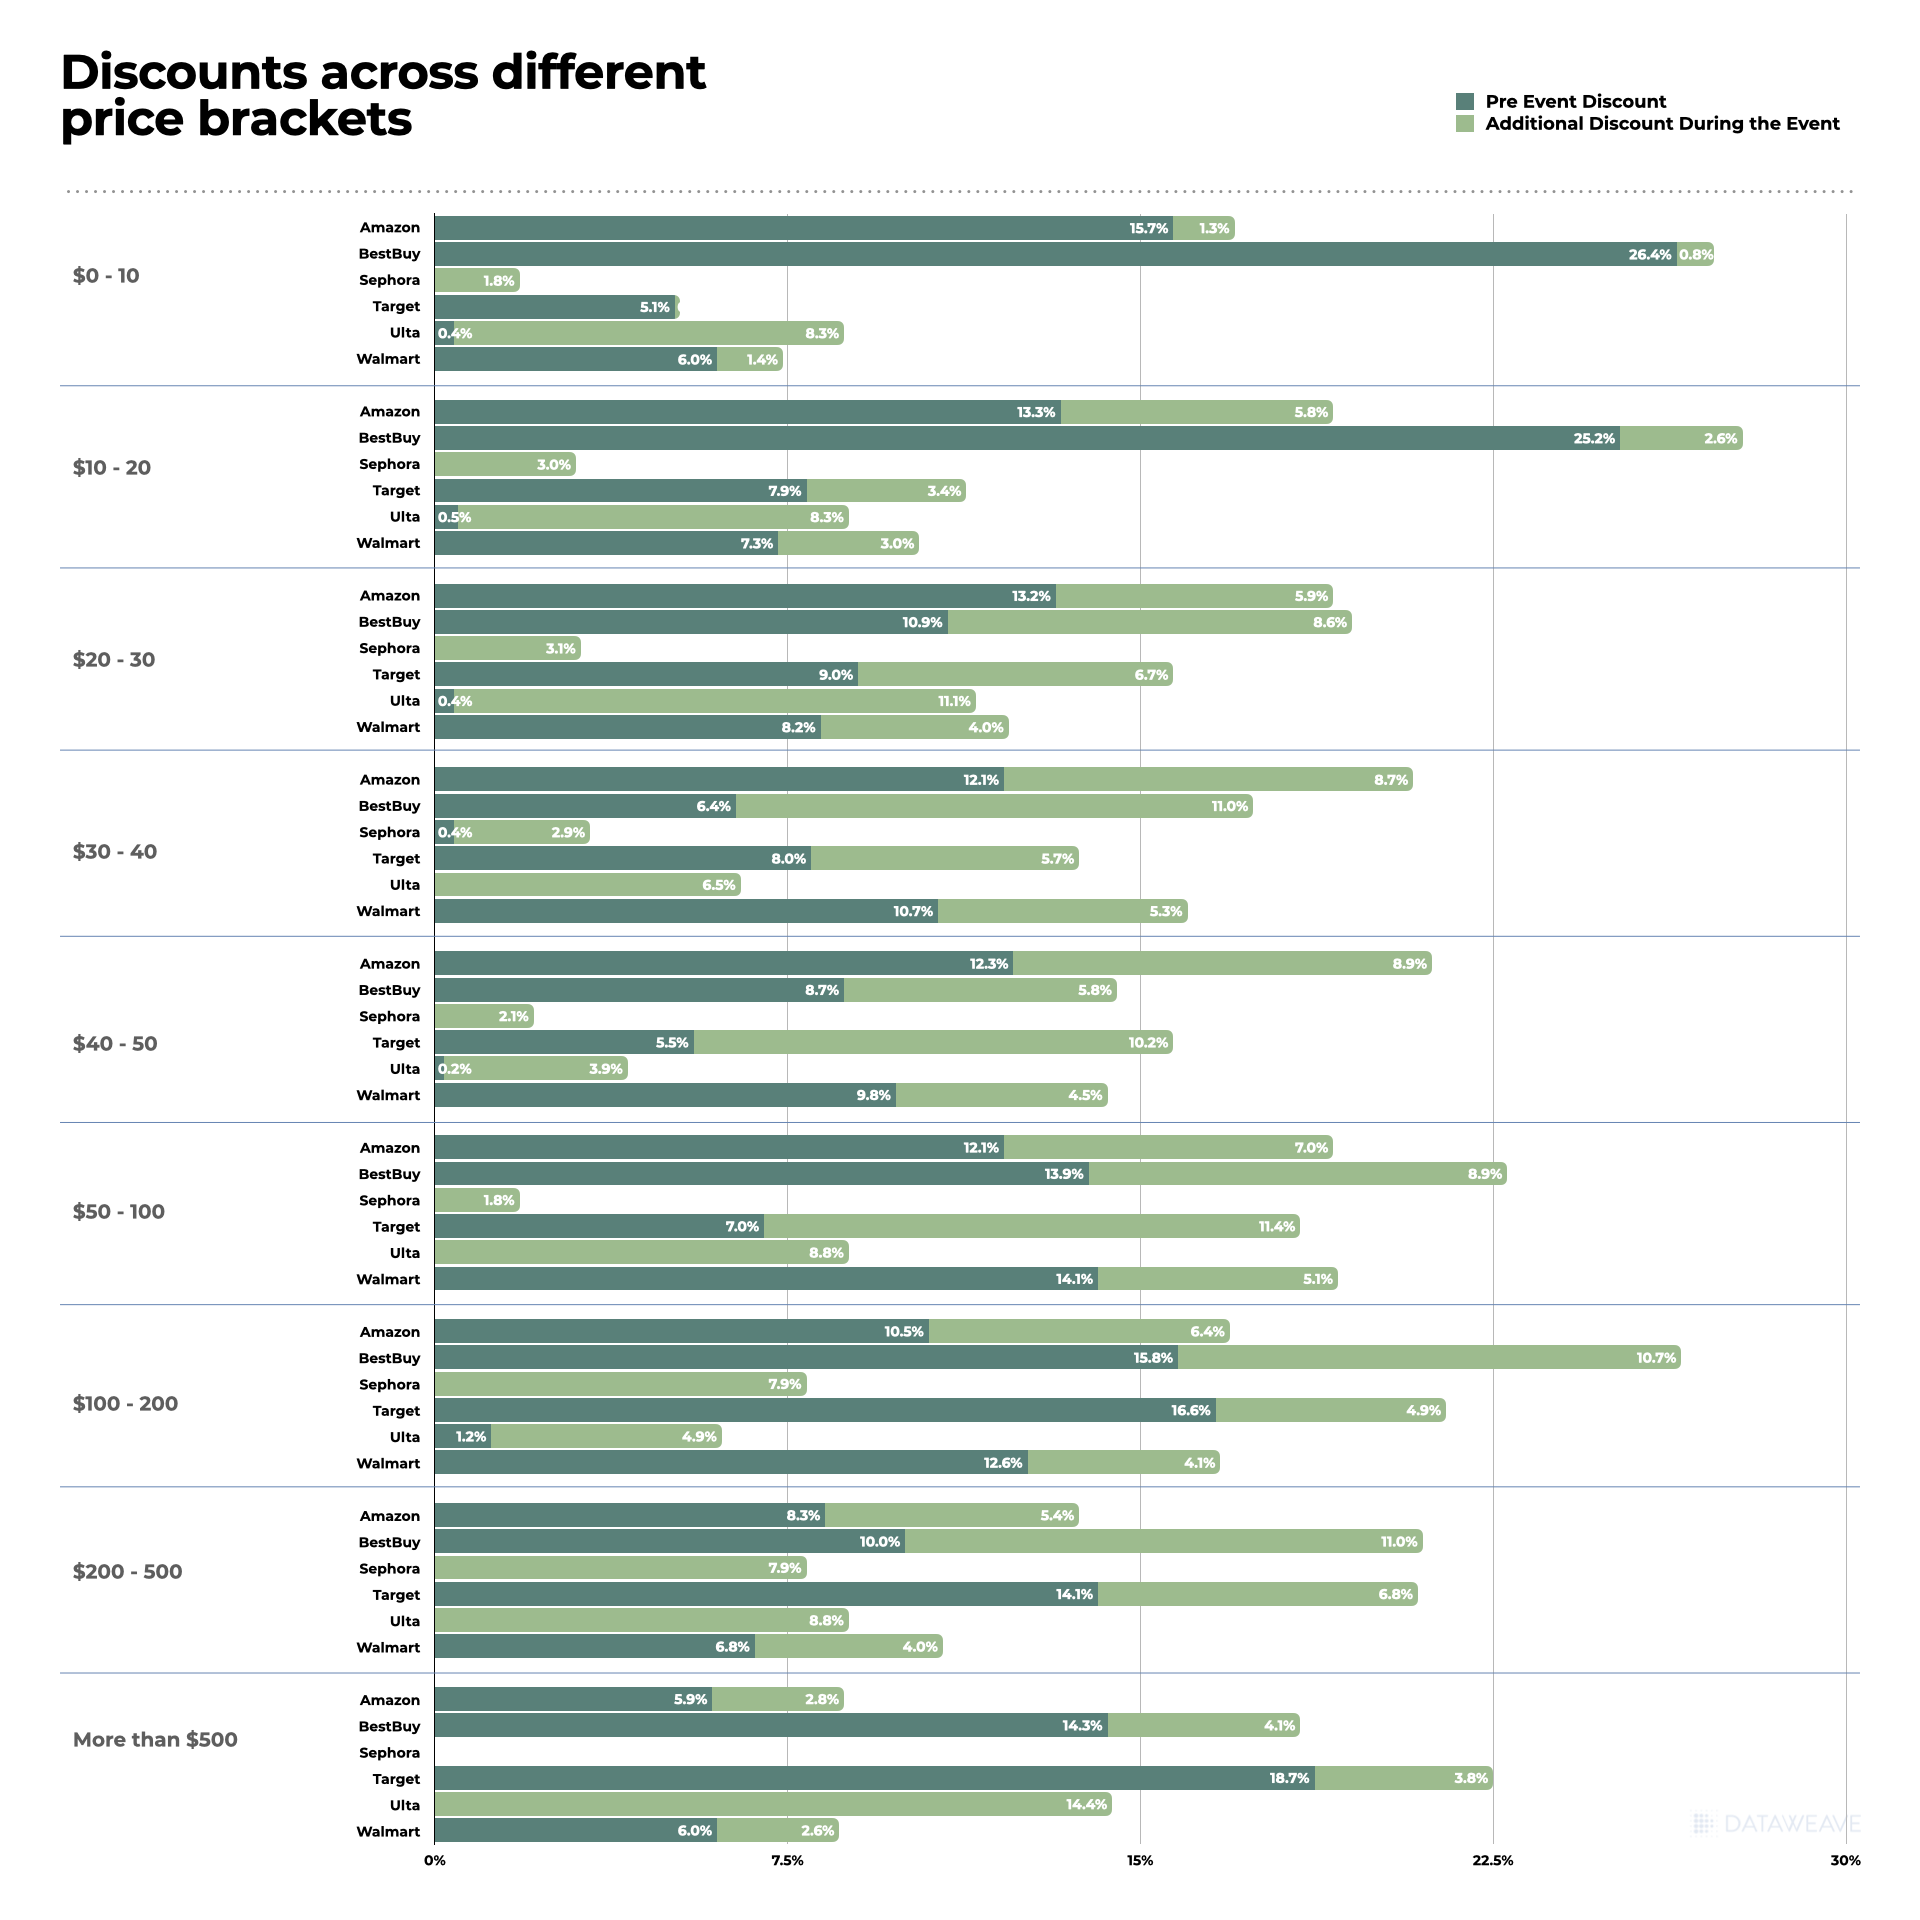
- Different companies had different discount strategies based on price buckets.
- Amazon gave heavier discounts in the lower price buckets (< 200$) and lower discounts for products priced higher than 200$.
- Best Buy offered the heaviest early discounts of >25% on products priced under 20$ but provided a few additional discounts during the event. For products priced higher than 20$, Best Buy uniformly offered substantial early discounts as well as further discounts during the event.
- On the other hand, Target focussed on mid and high-priced items, offering heavy early discounts of 16-18% on products priced higher than 100$ and early discounts of ~7% for middle and lower-priced items. For middle-priced products (40-100$), it offered heavier discounts of 10-12% during the event.
- Walmart focussed on mid-priced products, offering the highest discounts (both early (~12%) and additional discounts (5%)). It offered the least discounts (~8-9%) on products priced higher than 200$.
Share of Search – Amazon is the only retailer with sponsored searches; Apple AirPods rule the roost.
Salient Insights
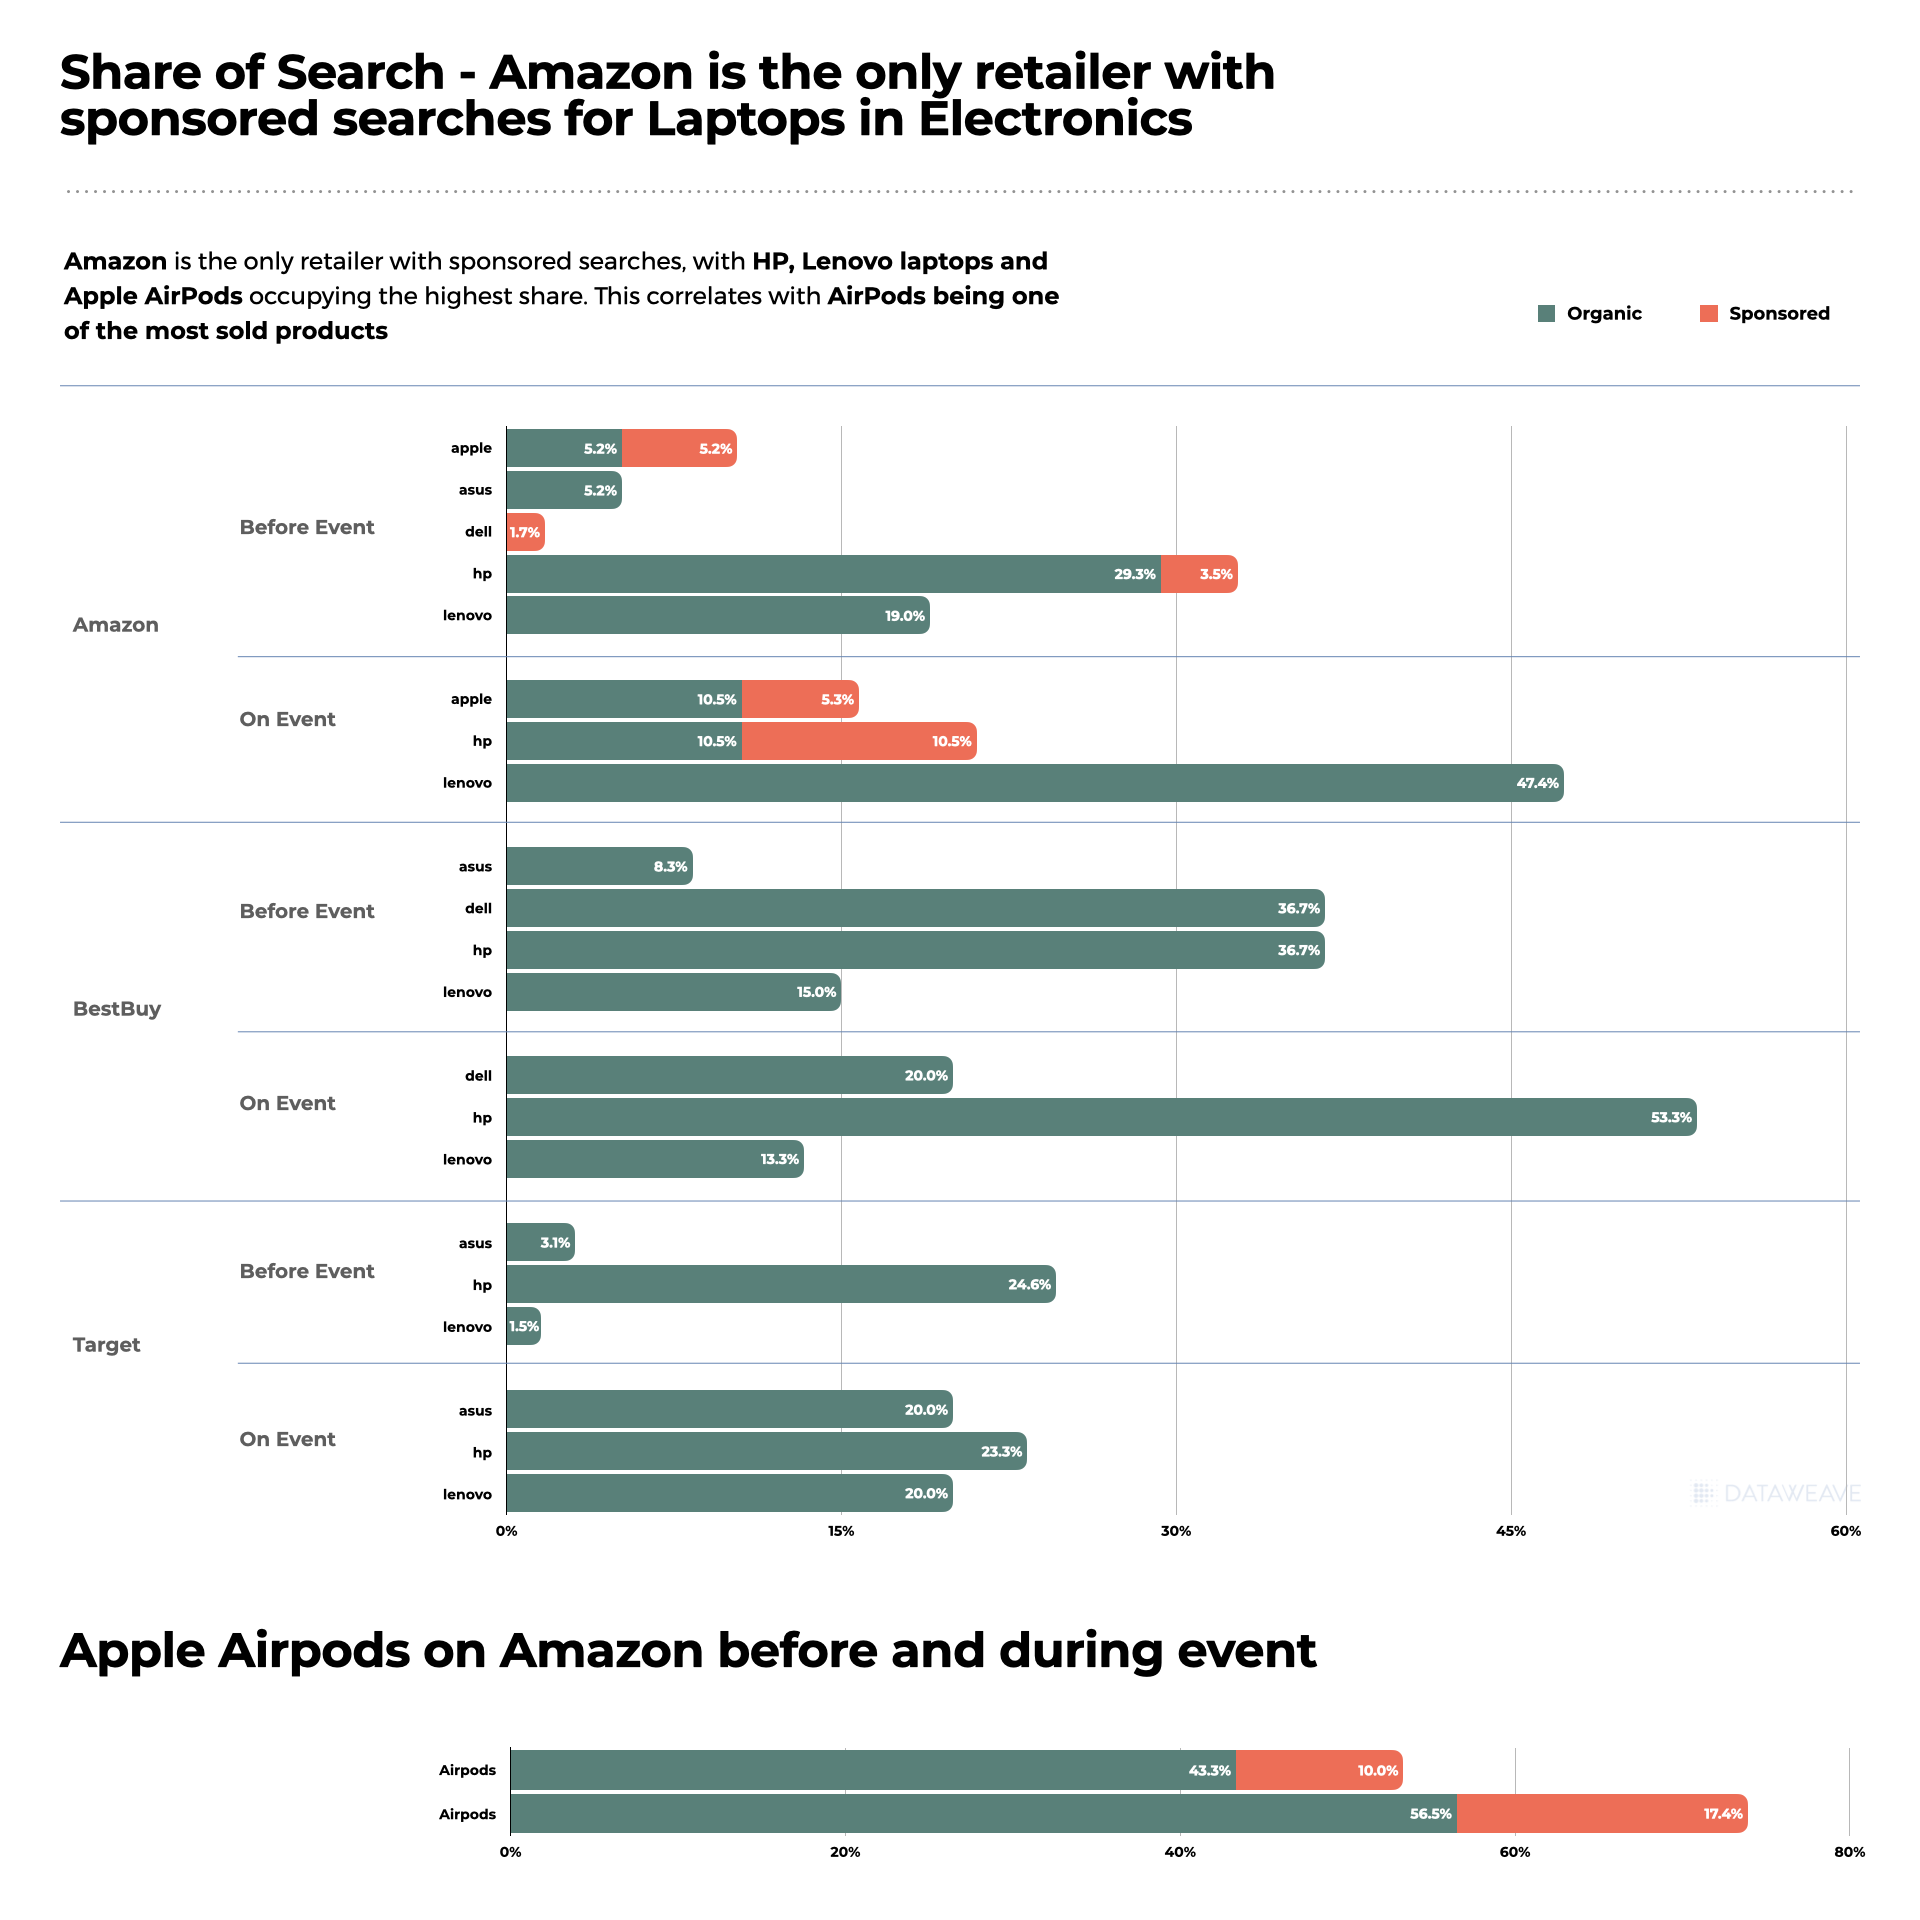
- Amazon is the only retailer with sponsored searches, with HP, Lenovo laptops, and Apple AirPods occupying the highest share. This correlates with AirPods being one of the most sold products.
- HP laptops had the highest share on Amazon pre-Event but gave the spot to Lenovo during Thanksgiving.
- Tracphone and Motorola smartphones, Insignia Televisions, and JBL headphones had a good SoS on Amazon.
- On Best Buy, HP and Dell laptops featured most in searches, with HP ruling the roost during the event. Lenovo had a small presence.
- Samsung smartwatches, televisions, and Apple AirPods have a big chunk of the search at Best Buy.
- On Target, pop sockets, smartphones, Apple smartwatches, headphones, and AirPods have the most prominent presence. Apple was the most featured brand in this segment.
Salient Insights
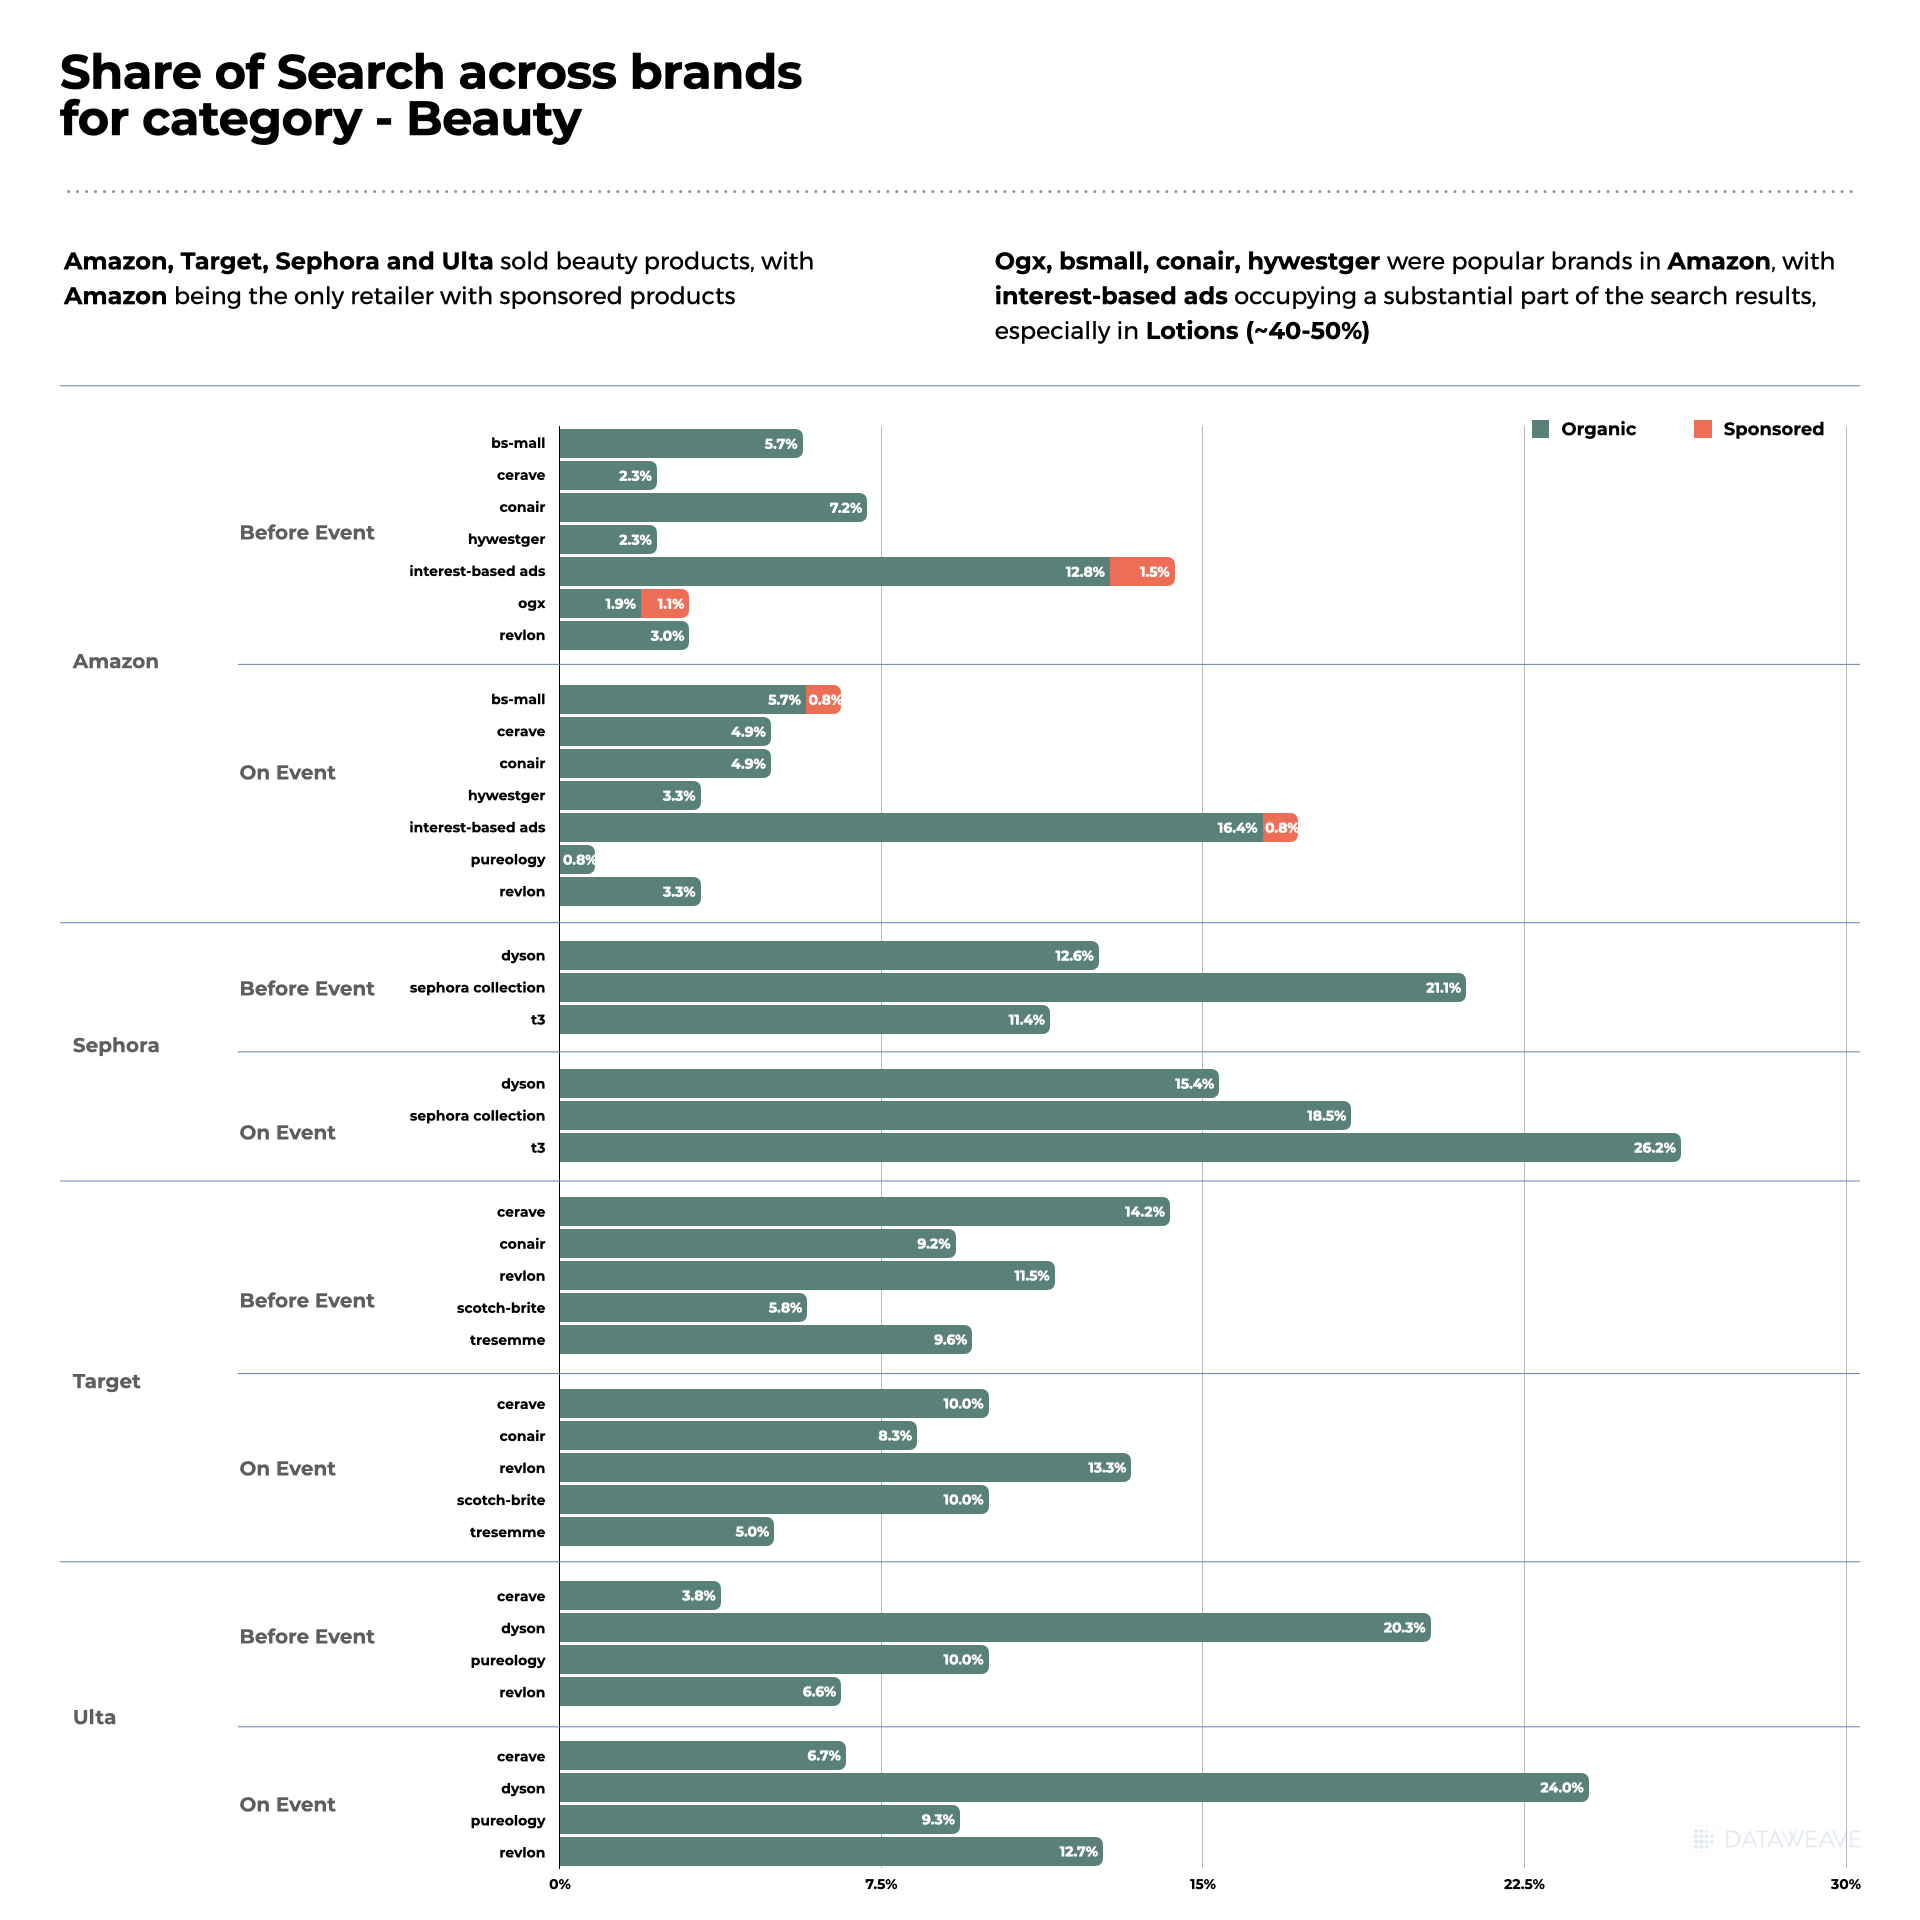
- Amazon, Target, Sephora, and Ulta sold beauty products, with Amazon being the only retailer with sponsored products.
- Ogx, bs-mall, conair, hywestger were popular brands on Amazon, with interest-based ads occupying a substantial part of the search results, especially in Lotions (~40-50%)
- Tresemme, Scotch Brite, Revlon and Cerave were popular brands in Target
- Dyson products (brushes and hair dryers) are featured at Ulta’s top of the search, followed by Pureology shampoos.
- Sephora’s own collection of brushes featured prominently on their website both before and during the event, followed by Dyson and T3 brushes and hair dryers.
Salient Insights
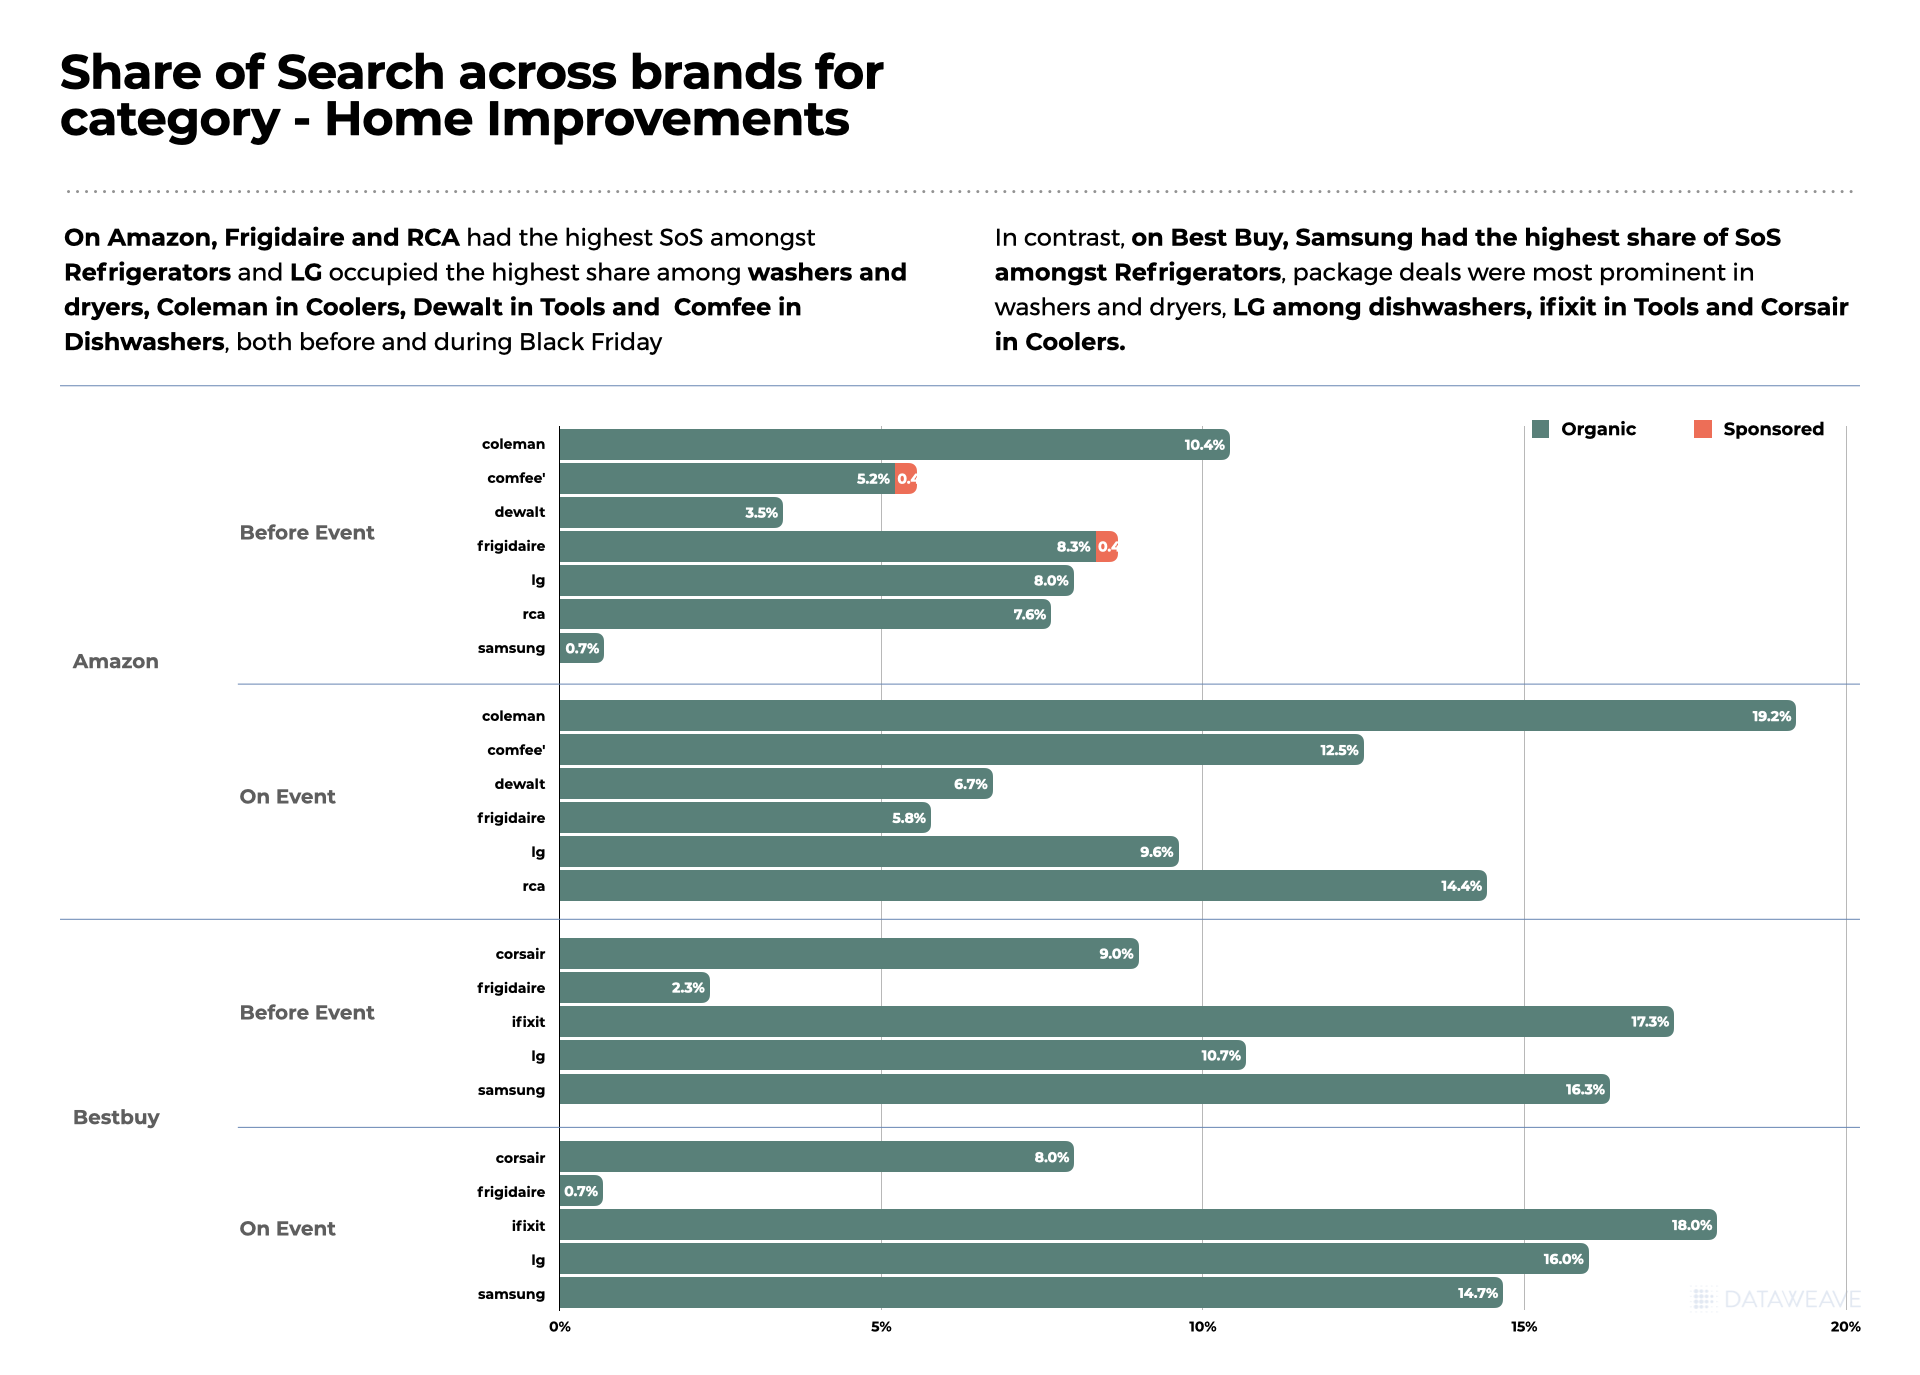
- In Amazon, Frigidaire and RCA had the highest SoS amongst Refrigerators, and LG occupied the highest share among washers and dryers, Coleman in Coolers, Dewalt in Tools, and Comfee in Dishwashers, both before and during Black Friday.
- In contrast, on Best Buy, Samsung had the highest share of SoS amongst Refrigerators, package deals were most prominent in washers and dryers, LG among dishwashers, ifixit in Tools, and Corsair in Coolers.
Salient Insights
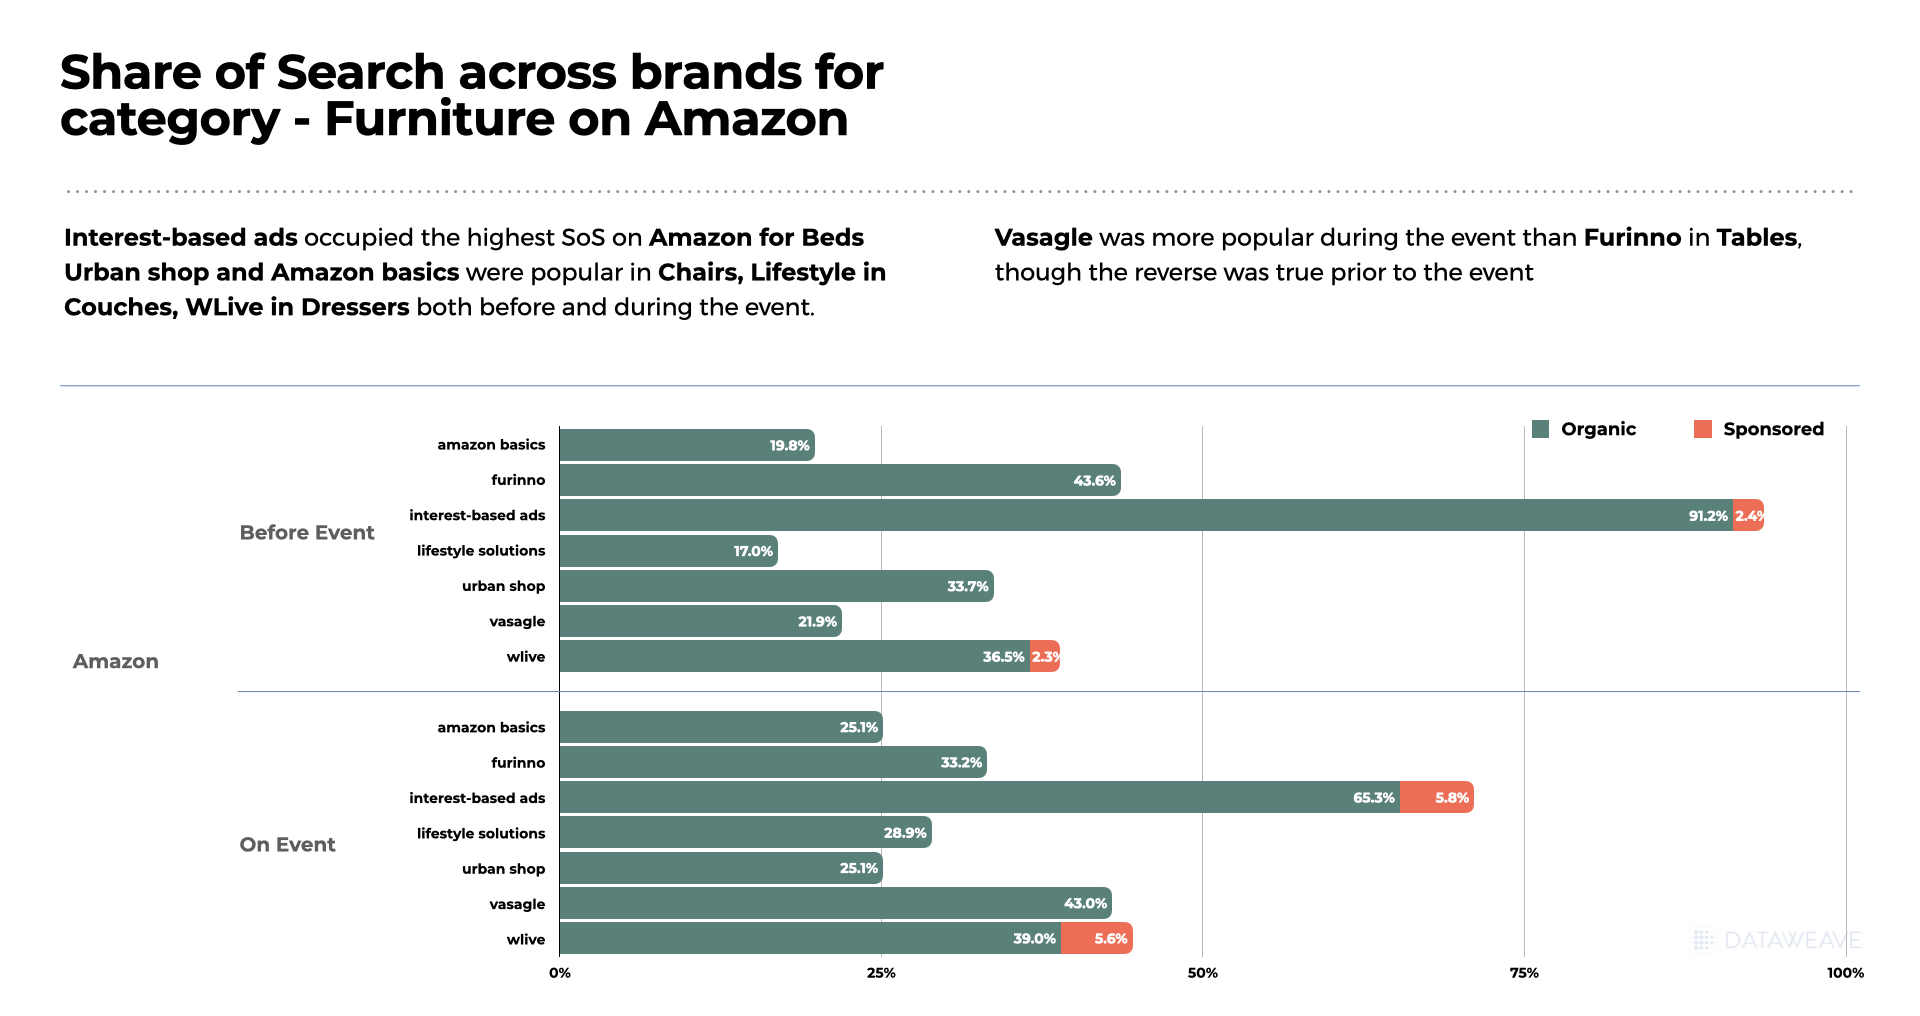
- Interest-based ads occupied the highest SoS on Amazon for Beds.
- Urban shop and Amazon basics were popular in Chairs, Lifestyle in Couches, WLive in Dressers both before and during the event.
- Vasagle was more popular during the event than Furrion in Tables, though the reverse was true prior to the event.
Summary & Key Takeaways
Black Friday this year was a pleasant surprise to Brands and Retailers, reporting much larger sales than predicted. After experiencing a slump in sales in the months leading up to Thanksgiving, e-commerce vendors have a reason to be optimistic about their holiday season sales forecasts.
- A record-breaking $9.2 Billion in online sales was reported by Adobe Analytics, a growth of 2.3 % compared to the previous year.
- Mobile shopping accounted for 55% of digital sales, a rise of 8.5% compared to last year.
- Retailers wooed customers through deep discounts (~30%) prior to Thanksgiving and around Black Friday. Heavily discounted items like Apple AirPods were the most popular.
- Thanks to inflation and stretched wallets, consumers were willing to spend but waited to grab the best and biggest deals. Utility products had better sales.
- With tough competition between retailers on who offers the best discounts, Amazon slid down to the fourth position, and Walmart was the most searched retailer.
DataWeave, through its Digital Shelf Analytics and Commerce Intelligence solutions, gleans useful insights from e-commerce data and breaks down trends during global shopping events like Prime Day, Black Friday, and Cyber Monday. If you are a brand or a retailer who would like to know more about our products and solutions, contact us at contact@dataweave.com.