Category: E Commerce

  • How E-commerce Brands Build Customer Trust | DataWeave

    How E-commerce Brands Build Customer Trust | DataWeave

    Brands that build consumer trust will win big as online shopping explodes this year. As the COVID-19 pandemic propels more shoppers online, an astounding $5 trillion (30%) of annual global retail sales is up for grabs as the market shifts to e-commerce, according to Boston Consulting Group.[1]

    Notably, e-commerce has changed brands’ retail processes. Unlike brick-and-mortar stores, the digital shelf is where brands manage their company and products among online shoppers, influencing what they browse and buy.

    Rather than stocking merchandise through retailers’ physical stores, brands can now manage their online products by working with logistics experts like Fulfillment by Amazon. Instead of merchandising in stores with planograms and endcap displays, brands promote their digital assortment with targeted product content that resonates and keeps them coming back.[2] The evolution of retail can help brands save time and effort, and increase their agility and effectiveness.


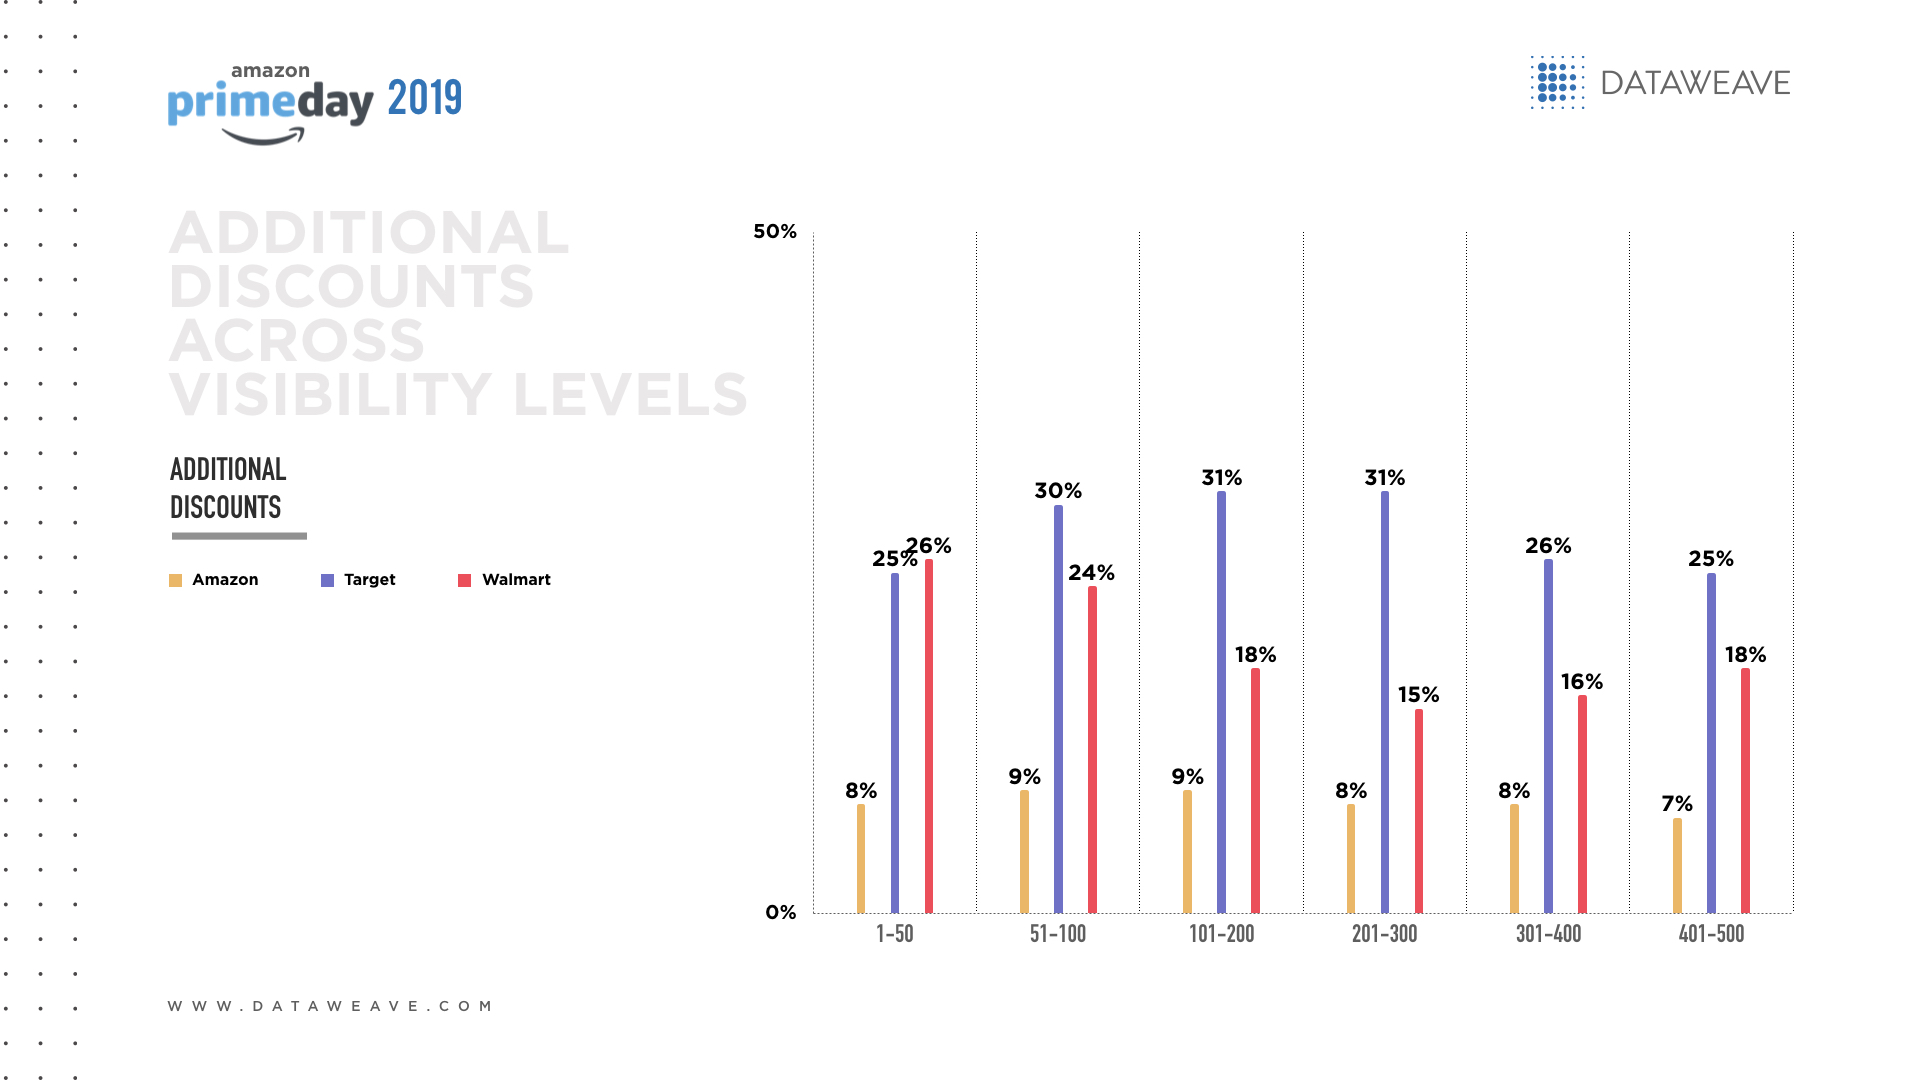
    Gaining high visibility on the digital shelf can help brands boost their reach, brand awareness and sales. That’s why more brands are now investing in proven e-commerce best practices to increase consumer confidence by offering reliable products, relevant marketing and a smooth online experience. Now that the 2020 holiday sales season is underway, it’s the perfect time to see how leading brands compete in the increasingly crowded online market by demonstrating credibility and consistency.


    Market fragmentation increases brand complexity

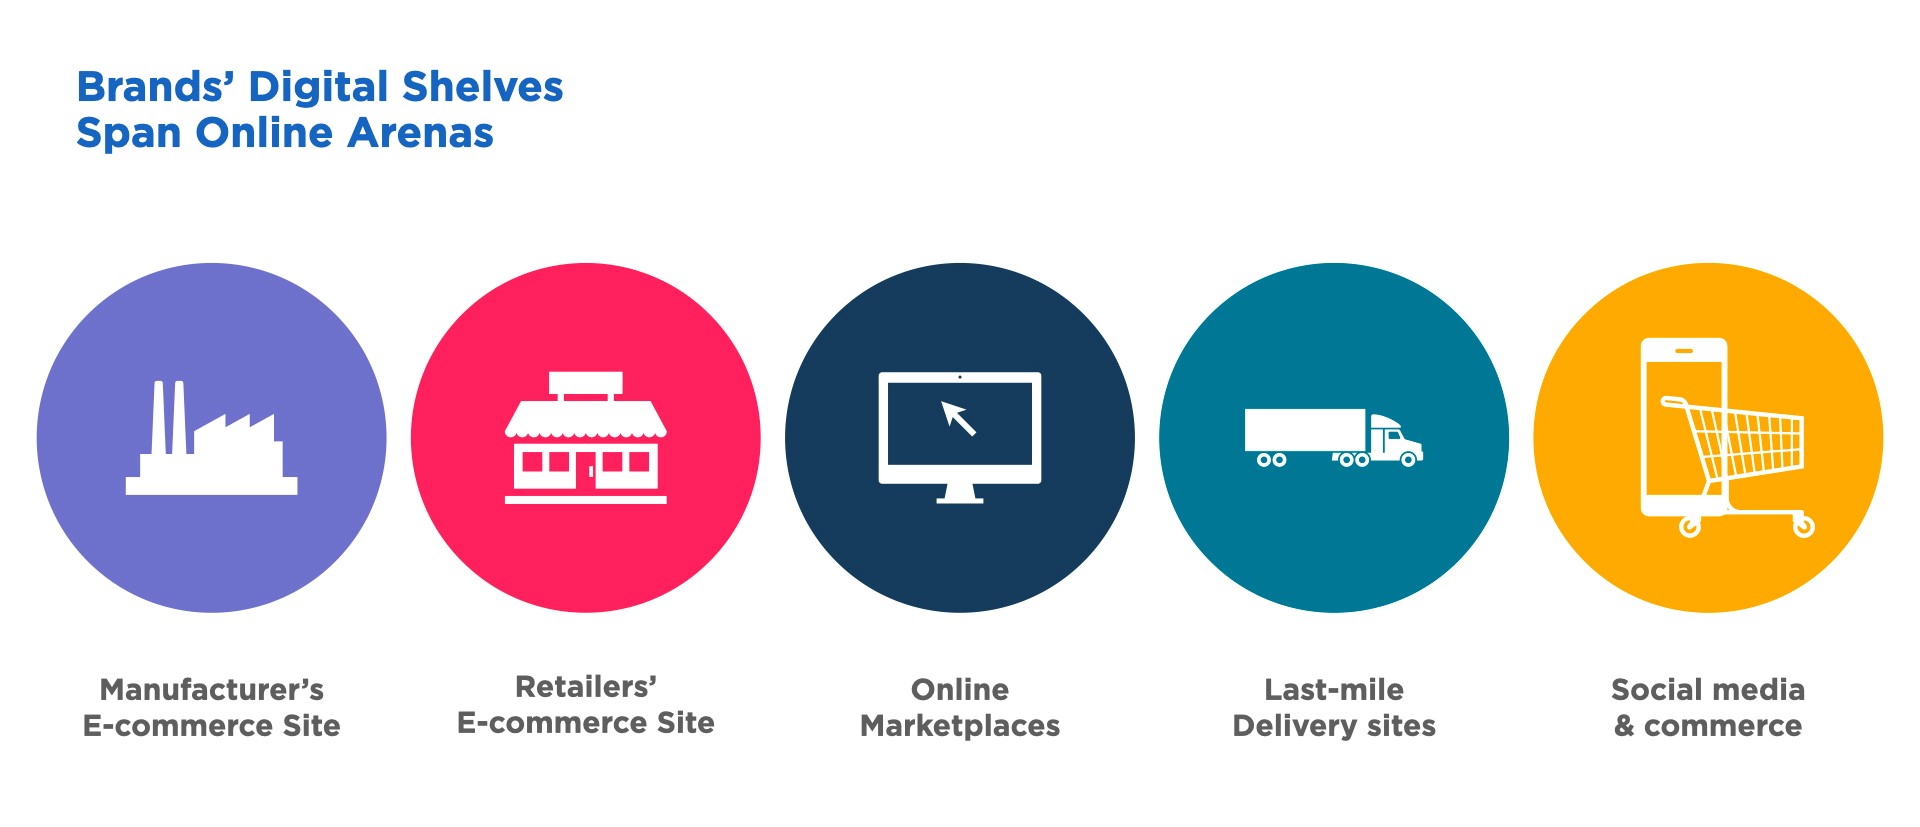
    Selling across multiple online touchpoints means brands have more e-commerce websites and digital shelves to monitor to ensure compliance with brand guidelines to ensuring a consistent customer experience. To engage online shoppers, brands’ marketing strategies must now diligently manage their digital shelf across diverse online shopping arenas, including:

    • Direct-to-consumer (DTC) sites: More brand manufacturers are shortening the supply chain by bypassing retailers and selling directly to consumers, including sales through their own e-commerce websites.eMarketer predicts that U.S. DTC e-commerce sales will grow by 24% to reach nearly $18 billion in 2020.[3]

    • Retailers’ e-commerce sites: Brands are also migrating online because the retailers who sell their merchandise moved online this yearto adapt to the pandemic and survive shuttered storefronts. As of April 21, e-commerce grew 129% year-over-yearin U.S. and Canadian orders and U.S. e-commerce sales are on track to hit nearly $710 billion this year.[4] More than ever, sharing timely, accurate product information with retail partners is essential for success.

    • Online marketplaces: A growing number of brands are investing in digital advertising and content to stand out on popular, high-traffic online marketplaces. Global e-commerce leaders Amazon, eBay and China’s Alibaba and JD, are mostly search-based sites, as users know what they want and search for it, which makes product description pages and ads important marketing tools. Conversely, China’s Pinduoduo platform involves group-buying and interactive games to boost brand awareness and sales by entertaining online consumers and inspiring flattering word-of-mouth.[5] Among online marketplaces, digital content fuels brand discovery and sales.

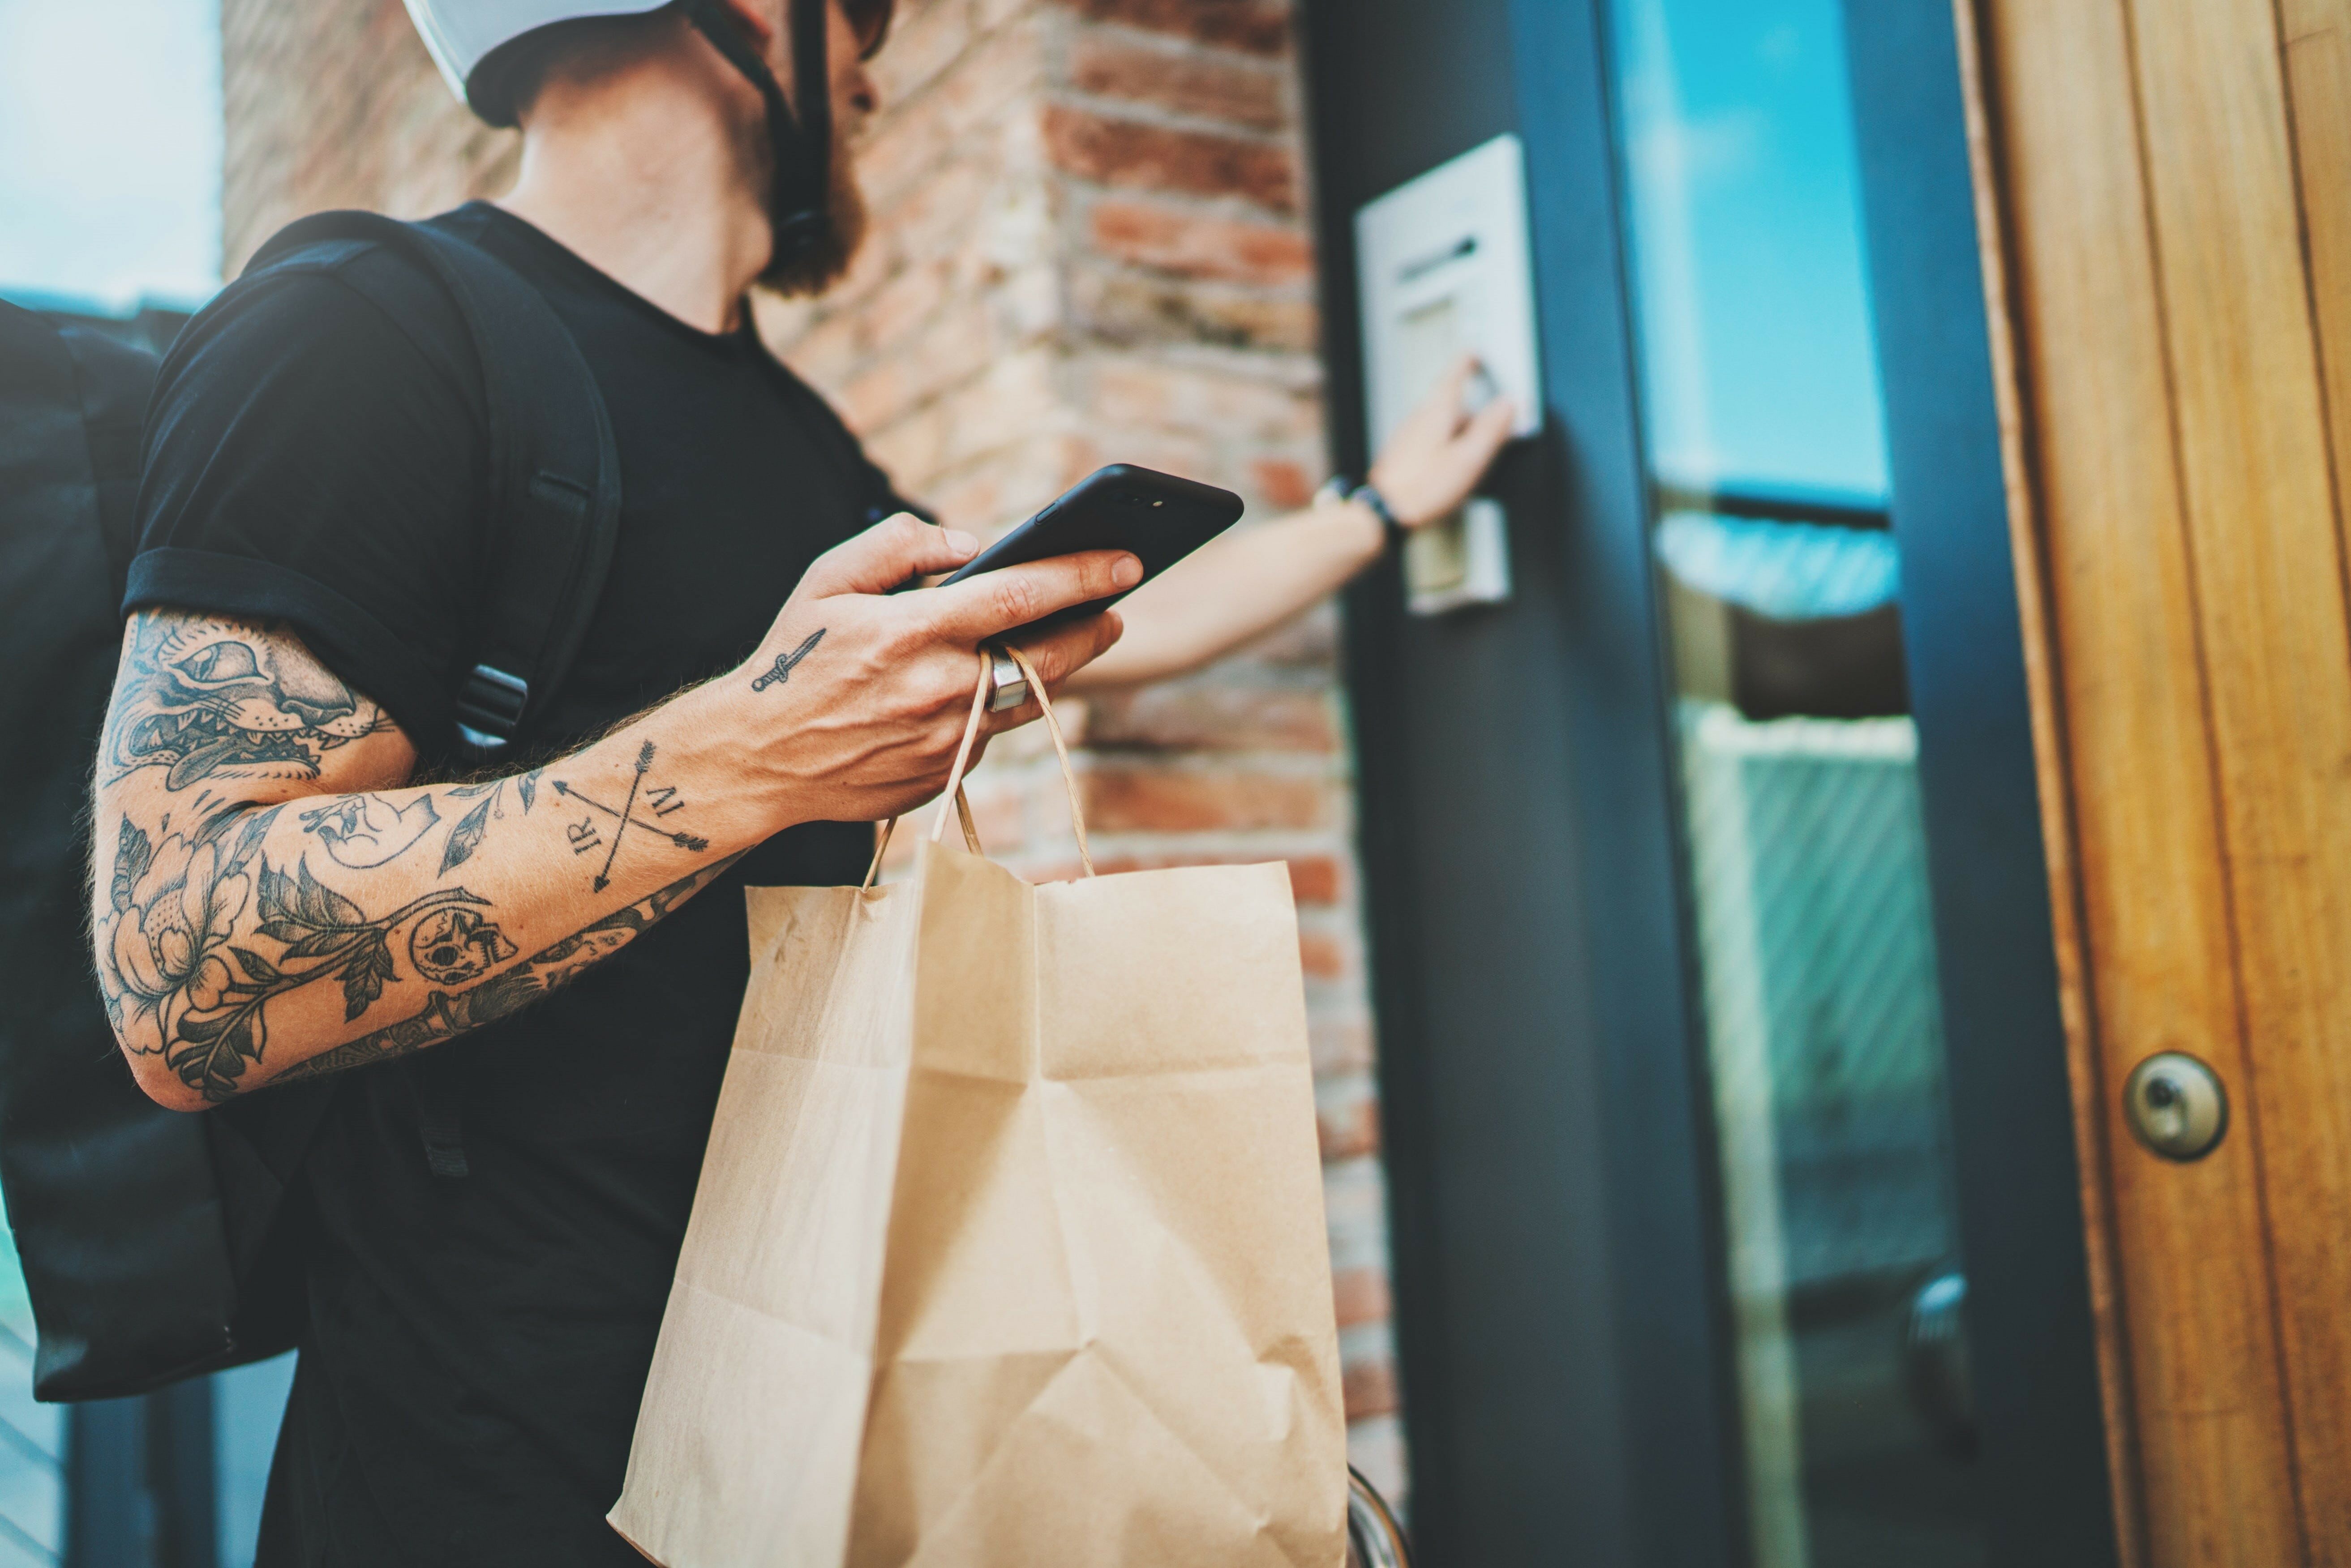
    • Last-mile delivery channels: Brands can also sell in collaboration with their last-mile partners. Last-mile experts like Peapod, Instacart, Uber and Shipt offer online advertising opportunities for brands to reach new audiences. For instance, Instacart launched a self-serve advertising platform that lets brands promote their products in search results. Brands can choose the products to promote, set a budget and pay when users engage with those products.[6]

    • Social media: To reach and influence consumers where they already spend their time, more brands are investing in social media promotions and even embracing social commerce innovation. Social media matters to brands’ marketing effectiveness, as 52% of online brand discovery happens on social feeds.[7] Also, 92% of Instagram users say they’ve followed a brand, visited their website or made a purchase after seeing a product on Instagram.[8]

    Brand promotions have evolved beyond Google AdWords and Facebook campaigns. Now promotions include digital content and ads across all of these digital touchpoints, which increases the scope of brand marketing efforts to reach online consumers.

    How brands transform digital shelf complexity into clarity

    To earn online shoppers’ trust across e-commerce arenas, more leading companies are turning to a common solution: data.


    Too often, online shoppers abandon their cart due to concerns that they will unwittingly buy inauthentic products from fraudulent sellers. To protect their brands, manufacturers use data insights to pinpoint and prevent unauthorized sellers, counterfeit products and minimum advertised price (MAP) violations to demonstrate authenticity, accountability and price parity.

    Digital is the new normal”
    ~ Nike CEO John Donahoe
    [9]

    To invigorate underperforming online promotions, brands rely on analytics to connect the dots among their online promotions, marketing performance and share of voice. Insights on advertising, keywords and consumer reviews help brands make better marketing decisions faster. These insights help brands stand out from competitors and build relationships with shoppers by ensuring their promotions resonate and drive more sales online.

    To overcome low online traffic and sales, more brands apply data insights to improve their digital presence, visibility and sell-through rates. Brand analytics measure their popularity on e-commerce websites and track their stock status to improve accessibility, optimize digital shelf velocity and deliver a reliable customer experience that builds trust.


    Watch over your brand: To stay competitive and earn consumer trust, more brands now rely on data insights to make fast, effective decisions that enhance their reputation and boost online sales.

    As e-commerce explodes, more leading brands are collaborating with DataWeave for actionable brand analytics to protect their digital shelves, decrease complexity and boost consumer trust. These accurate, trusted insights help brands gain clarity to make smarter e-commerce decisions faster. Making data-driven brand management, promotional and digital marketing decisions helps brands prove their authenticity, improve marketing effectiveness and boost online sales. To see how DataWeave helps brands stand out, sell more and stay competitive, visit www.dataweave.com.


    [1] Taylor, Lauren, Chris Biggs, Ben Eppler, Henry Fovargue and Gaby Barrios.  How Retailers Can Capture $5 Trillion of Shifting Demand. Boston Consulting Group. August 31, 2020.

    [2] Gibbons, David. Ecommerce and content: How retailers have shifted strategies during the COVID-19 pandemic. Digital Commerce 360. August 18, 2020.

    [3] US Direct-to-Consumer Ecommerce Sales Will Rise to Nearly $18 Billion in 2020. eMarketer. April 1, 2020.

    [4] Wertz, Jia. 3 Emerging E-Commerce Growth Trends To Leverage In 2020. Forbes. August 1, 2020.

    [5] Lee, Emma. The incredible rise of Pinduoduo, China’s newest force in e-commerce. TechCrunch. July 26, 2018.

    [6] Goyal, Vivek. Browsing e-commerce: An untapped $250B+ opportunity. Medium. September 27, 2020.

    [7] Cooper, Paige. 43 Social Media Advertising Statistics that Matter to Marketers in 2020. Hootsuite. April 23, 2020.

    [8] Cooper, Paige. 43 Social Media Advertising Statistics that Matter to Marketers in 2020. Hootsuite. April 23, 2020.

    [9] Grill-Goodman, Jamie. ‘Digital is the New Normal,’ Nike CEO Says. RIS News. September 23, 2020.

  • Amazon Great Indian Festival Vs Big Billion Day- Who offered better discounts?

    Amazon Great Indian Festival Vs Big Billion Day- Who offered better discounts?

    The Great Indian Festival finally arrived and it coincided with Flipkart’s Big Billion Day Sale. The pandemic has pushed consumers to shop online and both, the Great Indian Festival and the Big Billion Day sales had been eagerly anticipated. Flipkart’s sale lasted between 16-21 October, while Amazon’s (in India) took started on 17th October.

    It is claimed that Amazon and Flipkart have hit $3.5 billion in sales in just four days. On the last day of its Sale, Flipkart claimed to have achieved 10 times growth as compared to last year’s Big Billion Day sale. Clearly, the sales have surpassed all the forecasts made for this year’s sale. We at DataWeave took a closer look to analyze the discounts that were offered across popular categories, to see if customers really had access to better deals and discounts. 

    Our Methodology:

    We looked at the top 500 products across categories like Fashion – men and women, electronics, Amazon devices, baby products, grocery and personal care. The pricing offered on these products across the sale period was compared with the pre-sale price, to understand the trend in discounts across the popular categories and brands.

    The Verdict:

    We segmented the products we were tracking into the following:

    Type 1: Products were either priced the same or were discounted over the sale compared to pre-sale 

    Type 2: Products were either priced the same or witnessed price increase during the sale compared to pre-sale 

    Type 3: Products which saw both price increase and decrease during sale compared to pre-sale

    Type 4: Products whose price continued to be the same even during the sale 

    flipkart_big_billion_day_2020_chart_1

    Flipkart clearly provided the better deals to customers for the categories we looked at during their Big Billion Day sale compared to Amazon. Flipkart discounted 54% of its products during the sale period compared to Amazon, and 26% of the products were discounted. 

    It is also interesting to note that in addition to offering more discounted products, Flipkart also offered additional discounts than Amazon.

    Amazon offered 13.2% additional discount and most of this average discounting can be attributed to a 33.8% discount on Amazon devices. It also ended up increasing the pricing for 16% of the products during the sale period, while Flipkart hiked the pricing for 6% products. 56% of products on Amazon continued being sold at the same price even during the sale. 

    Additional discounts across product premiumness levels

    Premiumness was based on the actual price of a product before the sale event. This was divided into low, medium and high premiumness levels, with high indicating higher selling prices.

    flipkart_big_billion_day_2020_chart_2
    big_billion_day_great_indian_sale_2020

    In Amazon devices, baby products, electronics and grocery-cooking essentials, Amazon showed a direct relationship between its additional discounts and the level of premiumness. While Flipkart did not seem to follow a particular pattern with respect to product premiumness. 

    Flipkart offered the highest discounts for premium products in the Fashion category (for both men and women) compared to the rest. 

    Top brands by additional discounts:

    We looked at popular brands across categories to arrive at brands that were being sold at the maximum discount. These brands appeared at least twenty times in the top 500 ranks we considered.

    amazon_great_indian_sale_2020_electronics

    Acer, Philips, Samsung, Lenovo, Bajaj, Asus which were common brands across both Flipkart and Amazon in the electronics category, were being sold at much deeper discounts on Flipkart (almost double), compared to that on Amazon.

    Avita was extremely popular under the laptop sub-category on Flipkart and was observed to be discounted the highest during the sale.

    In Fashion, Titan was the most discounted brand with 53.9% additional discount but only 4% and 2% of the products offered discounting in mens’ and womens’ fashion respectively. Reebok in mens’ fashion and Fastrack, Sonata and Puma in womens’ wear on Flipkart, had discounts across almost all the products. 

    amazon_great_indian_sale_2020_baby_care
    flipkart_big_billion_day_2020_baby_care

    In the baby care category, Hasbro gaming on Flipkart had the highest additional discount followed by Funskool. Both the brands had more than 85% of their products discounted. 

    Johnson’s, which was common on both Amazon and Flipkart, was offered at higher discounts on Amazon compared to Flipkart. However, only 31% products were discounted vs 72% on Flipkart.

    Most Visible Brands

    We looked at the top 200 ranks across each sub-category to narrow down on the most visible brands across the sale period.

    amazon_great_indian_sale_top_brands
    flipkart_big_billion_day_2020_top_brands

    Across all categories and their sub-categories, the sub-category laptop had distinct brands that hold the majority of the products. This is observed both in Amazon and Flipkart where brands like Lenovo, HP, Asus hold more than 33% share of the first 200 products. 

    “Mobile” category was dominated by brands like Redmi and Boat on Amazon, and Realme and OPPO on Flipkart. These brands occur at least 24% of the time in the top 200 ranks.

    Who Won?

    There are many ways to look at this. To begin with, the combined sales of Flipkart and Amazon during the festive season in India accounted for more than 90% of the e-commerce industry’s gross sales. That amounts to a 55% year-on-year growth. Delving further, we see that Flipkart was far more aggressive with their offerings.

    They discounted 56.8% additional products at an overall discount of 15%. On the other hand, Amazon retained their typical cautious approach to discounting, with only 28.4% of the products, at an overall discount of 12.8%.

    If we adopt a more macro view of the sales, we have to take into account that this year is somewhat of an anomaly. Given the social distancing norms and other SOPs governing the common man, more people have been ushered into the world of online shopping. The penetration extended far into the Tier 2 and Tier 3 cities as well, thus potentially benefiting Flipkart, owing to their interior reach.

    Going by the numbers, Flipkart seems to have taken this round without a doubt. As we observed though, there are many ways to look at this and what seems to stand out from these two giants, is the consumer. At the end of the day, it’s the consumer that in spite of these strange times, has shopped more than before, indicating that the situation is getting back to a semblance of normalcy.

    So Flipkart’s got the sales numbers but the consumer got deeper discounts on more products. As the old adage goes, ‘consumer is king’.

  • Prime Day 2020: Home categories fuel retail rivalry & desirable discounts

    Prime Day 2020: Home categories fuel retail rivalry & desirable discounts

    According to our preliminary analysis of Prime Day 2020, Amazon’s rivals offered more generous discounts within Home categories to stay competitive as more consumers invest in their homes this year.

    This year the COVID-19 pandemic has transformed consumers into homebodies who increasingly work, learn and shop from home. This year also marks the first time Prime Day took place in the Fall, jumpstarting the holiday sales season.

    At DataWeave, we wanted to know whether Prime Day 2020 lived up to the hype and how Amazon’s deals compared to other retailers’ discounts. Our analysis examines products across four popular Home categories: Bed & Bath, Furniture, Kitchen and Pet Care.

    Our Methodology

    We tracked the pricing of several leading retailers (Home Depot, Target, Walmart and Amazon) selling the Home categories of Bed & Bath, Furniture, Kitchen and Pet Care to assess their pricing and assortment strategies during this annual sales event. Our analysis focused on additional discounts offered during the sale to estimate the true value that the sale represented to consumers. Our calculations compared product prices on Prime Day versus the prices prior to the sale. The sample consisted of up to the top 750 ranked products across 16 popular product types for the home.

    The Verdict 

    Overall, Amazon reported the lowest price reduction in all Home categories (12.4%), compared to Target (22.1%), Home Depot (16.5%), and Walmart (15.1%). Yet Amazon reported the second-highest percentage of additionally discounted products (9.6% vs. 11.0% for Target).

    After Prime Day ended, certain retailers’ Home assortments saw more significant price increases than others. For instance, 88% of Target’s 760 products in Bed & Bath, Furniture, Kitchen and Pet Care received a price increase during the post-sale period, compared to 47% of Walmart’s 1005 products. Walmart’s everyday low price strategy helps to explain the difference between the two big box retailers.

    These results suggest that Prime Day 2020 may boost Amazon’s marketing and PR engagement yet its rivals offered the most generous deals in Home categories. As home-related categories’ sales soared during the pandemic, Amazon’s competitors offered deep discounts to stand out online and grow their market share. As such, consumers may want to embrace the habit of comparing multiple retailers’ websites to discover the best Prime Day deals in Home categories.

    Top product types by additional discount

    In Bed & Bath, Target offered the biggest average additional discount (27.4%) and Amazon offered the lowest (13.3%). Bed sheets and pillowcases were a popular product category for additional discounts across all four retailers, with Target offering the best average additional discount at 31.3%. Other popular product types among rival retailers included blankets, comforters and bathroom furniture.


    In Furniture, Home Depot (20.5%) offered the biggest overall additional discount, closely followed by and Target (19.2%). Living room furniture was a popular subcategory for all four retailers, with Home Depot offering the highest additional discount (29.1%). Other popular product types included furniture for the bedroom, home office, kitchen and dining room.

    In the Kitchen category, Target offered the biggest average additional discount for small appliances (21.8%), a subcategory in which all four retailers offered discounts. Within the large appliance subcategory, Walmart’s additional discounts were nearly triple Amazon’s (15.7% vs. 5.6%).

    Within the Pet Care category, Target offered the biggest average additional discount (18.5%). Cat food was a popular product category, with Target offering the best average additional discount (50.0%). Other popular product types across all four retailers included dog collars, leashes and dry dog food.

    Additional discounts across product “premiumness” levels

    Premiumness was calculated as the average selling price before the sale event. This was divided into low, medium and high premiumness levels, with high indicating higher selling prices.

    In Bed & Bath, most retailers showed an inverse relationship between their additional discounts and the products’ level of premiumness. Target offered the biggest additional discounts across all levels of premiumness, more than double Amazon’s discounts (27.2% vs. 12.3%). Target’s bold discounting strategy shows a commitment to protecting its competitive position across the entire Bed & Bath category.

    By far, Amazon offered the greatest percentage of additional discounts in Bed & Bath compared to its rivals across all levels of premiumness. Comparatively pervasive discounts help the e-commerce giant offer a greater variety of appealing deals within this category.

    In Furniture, most retailers showed a direct relationship between their additional discounts and the level of premiumness. Notably, Home Depot offered massive additional discounts at the high premium level, nearly triple Amazon and Walmart (34.5% vs. 12.7%). This move suggests Home Depot is serious about winning the business of upscale consumers in the Furniture category.

    Target differentiated its assortment by discounting by far the greatest portion of its Furniture at all premiumness levels (22.4%) and Home Depot discounted the least (4.4%). Amazon and Walmart distributed the greatest portion of their additional discounts to the moderate level of premiumness. Target’s strategy tries to attract all Furniture shoppers while Amazon and Walmart try to make their mid-market offerings affordable to more consumers.

    Across all levels of premiumness for Kitchen products, Target offered the biggest additional discounts, including almost double Amazon’s discounts at the medium level (22.5% vs. 13.4%). Target’s aggressive discounting shows a desire to be more competitive by attracting consumers at all levels of the Kitchen category.

    In the Kitchen category, most retailers offered a direct relationship between the proportion of additional discounts and the level of premiumness, yet Home Depot showed an inverse relationship. Amazon’s proportion of additional discounts across all levels of premiumness nearly tripled Home Depot’s (10.1% vs. 3.7%). This discount strategy shows Amazon’s willingness to offer shoppers deals across a broader variety of Kitchen items.

    In Pet Care, Walmart offered the highest overall additional discounts (16.2%), which could fortify its low-cost leadership position for pet lovers at all price points.


    While Target offered the greatest overall percentage of additional discounts in Pet Care, Amazon applied more discounts to the higher end of the premium spectrum and Target focused on the lower end.

    Additional discounts across visibility levels

    In Bed & Bath, Target offered the highest overall additional discounts across all levels of visibility (27.3%) and Amazon offered the lowest (12.4%). Amazon focused its additional discounts on the most visible Bed & Bath products to help online shoppers discover those items with ease and make them appealing enough to add to their cart.


    Amazon offered the lowest additional discounts in the Furniture category across all levels of product visibility. Yet, among the Furniture category’s most visible items, Amazon offered its highest additional discounts. Home Depot’s additional discounts approach was the most aggressive except among the lowest product visibility levels. Home Depot’s discount strategy shows a desire to compete for Furniture’s most visible items.

    In the Kitchen category, Home Depot consistently offered the lowest additional discounts among products at the higher visibility levels. Conversely, Target was the most aggressive in this category, offering additional discounts of up to 43.2% at moderate levels of visibility and double Home Depot’s discounts (26.3% vs. 13.4%) among the most visible items. Amazon may feel confident that men already choose Amazon for their apparel needs.

    In Pet Care, the retailers generally offered the most additional discounts for items in the middle of the visibility spectrum. Walmart offered the most aggressive additional discounts among the most visible Pet Care items, more than double Target’s discounts (13.5% vs. 6.5%).

    Overall, Prime Day 2020 offered an ideal time for Amazon to attract homebound consumers to invest in domestic products, yet its rivals offer much higher additional discounts in Bed & Bath, Furniture, Kitchen and Pet Care. How about other categories? Watch this space for more insights!

  • How Prime Day 2020 Deals Influenced Retail Pricing Strategies

    How Prime Day 2020 Deals Influenced Retail Pricing Strategies

    Our preliminary analysis reveals that Prime Day 2020 motivated Amazon’s rivals to offer deeper discounts in key categories to try to make their merchandise more magnetic and lure consumers away from the e-commerce giant.

    This year’s Prime Day is momentous, as the COVID-19 pandemic has encouraged more consumers to make online shopping a more regular habit. It also marks the first time Prime Day took place in the strategically significant final quarter of the year, kicking off the holiday sales season.

    At DataWeave, we wanted to know whether Prime Day 2020 lived up to the hype and how Amazon’s deals compared to other retailers’ discounts. Our analysis examines products across three popular categories: electronics, beauty and fashion.

    Our Methodology

    We tracked the pricing of several leading retailers (Best Buy, Target, Walmart and Amazon) selling consumer electronics, beauty and fashion to assess their pricing and assortment strategies during this annual sales event.

    Our analysis focused on additional discounts offered during the sale to estimate the true value that the sale represented to consumers. Our calculations compared product prices on Prime Day versus the prices prior to the sale. The sample consisted of up to the top 750 ranked products across 21 popular product types in consumer electronics, beauty and fashion.

    The Verdict

    Overall, Amazon reported the lowest price reduction in the Electronics, Beauty and Fashion categories (13.4%), compared to Best Buy (22.5%), Target (21.7%) and Walmart (16.3%). Yet Amazon reported the second-highest percentage of additionally discounted products (12.0% vs. 15.7% for Target).

    After Prime Day ended, certain assortments reflected more significant price increases than others. For instance, 97% of Target’s 158 products in Electronics, Beauty and Fashion had a price increase during the post-sale period, compared to 49% of Walmart’s 986 products. This discrepancy makes sense given Walmart’s everyday low price strategy.


    These results suggest that although Prime Day generates tremendous media buzz for Amazon, the most generous deals come from its rivals. To stand out and lure shoppers away from Amazon, competitors offered comparatively deeper discounts, especially in categories in which they want to grow their market share. This means online shoppers would be wise to compare prices across retailers’ websites to find the best cross-category deals on Prime Day.

    Top product types by additional discount

    In Electronics, Best Buy offered the biggest average additional discount (22.4%) and Amazon offered the lowest (9.4%). Tablets were a popular product category among Amazon, Best Buy and Walmart, with Best Buy offering the best average additional discount at 19.1%. Other popular product types among rival retailers included TVs, desktops and laptops.


    In Beauty, Target (13.2%) and Walmart (13.1%) almost tied for the biggest overall additional discount. Makeup was a popular beauty subcategory, with Walmart offering the highest additional discount at 19.7%. Other popular product types included hair care, skin care and fragrance.

    In Men’s Fashion, Target offered the biggest average additional discount of 28.1%. Suits and blazers were a popular fashion subcategory, in which Target offered the highest average additional discount at 50.0%. Other popular product types included T-shirts and tank tops, shirts and jeans.


    Within the Women’s Fashion category, Walmart offered the biggest average additional discount of 20.5%. Tops and tees were a popular product category across all three fashion rivals, with Walmart offering the best average additional discount at 23.6%. Other popular product types included dresses, jumpsuits and jeans.

    Additional discounts across product “premiumness” levels

    Premiumness was calculated as the average selling price before the sale event. This was divided into low, medium and high premiumness levels, with high indicating higher selling prices.


    In Electronics, Amazon showed a direct relationship between its additional discounts and the level of premiumness; Best Buy and Walmart showed an inverse relationship. Best Buy offered the biggest additional discounts across all levels of premiumness, nearly triple Amazon’s discounts (20.7% vs. 7.0% ) at the low end of the premium spectrum, and more than double Amazon’s discounts (18.5% vs. 7.3%) at the moderate level. Best Buy’s discounting strategy show it’s serious about protecting its competitive position in electronics.

    Best Buy and Walmart offered the most additional discounts at the high end of the premiumness spectrum, making both retailers more competitive in the high-ticket electronics category. By contrast, Amazon offered nearly double the additional discounts of its rivals within the low segment, which helps to protect its margins while making products even more affordable and appealing.


    In Beauty, Amazon and Walmart offered their biggest additional discounts at the low premium level, possibly to position those products as loss leaders. Meanwhile Target nearly doubled and tripled its rivals’ additional discounts at the high premium level (30.0% vs. 16.0% for Walmart and 11.0% for Amazon) to stand out in this intensely competitive category.

    Amazon stood out by discounting the greatest portion of its Beauty offerings at all premiumness levels and Target discounted the least. Amazon and Walmart showed a direct relationship between their distribution of additional discounts and the beauty products’ premiumness level.


    Across all levels of premiumness for Men’s Fashion, Target offered the biggest additional discounts, including more than triple Amazon’s discounts at the high end (38.4% vs. 12.4%). Target’s aggressive discounting shows a desire to be more competitive within the most premium segment of Men’s Fashion.

    Amazon’s additional discounts accounted for the greatest percentage of its Men’s Fashions across all levels of premiumness, nearly triple Target’s overall average (15.4% vs. 5.3%). This approach shows Amazon’s willingness to give shoppers deals across a broader variety of Men’s Fashion items.

    In Women’s Fashion, Target’s and Walmart’s overall additional discounts were comparable, and Amazon’s discounts were consistently the lowest among all levels of premiumness. Walmart offered its most generous discounts at the low and medium level of premiumness, which could reinforce its low-cost leadership image.

    While Amazon and Target offered a comparable overall percentage of additional discounts in Women’s Fashions, Amazon applied more discounts to the higher end of the premium spectrum and Target focused on the lower end.

    Additional discounts across visibility levels

    In Electronics, Amazon offered the lowest average additional discounts across all levels of visibility. Among the most visible electronics, Amazon and Best Buy gave the most visible electronics higher additional discounts to make those items more alluring to help consumers find the items fast and add them to their online baskets.

    Among the Beauty category’s most visible items, Amazon and Target offered their highest additional discounts. Yet Target was most aggressive in beauty, offering a 30% additional discount at the most visible end of the spectrum as well as at the least visible. This discount strategy shows Target wants to compete in Beauty, spreading its generosity beyond an exclusive focus on highly visible items.

    In Men’s Fashion, Amazon consistently offered the lowest additional discounts at all visibility levels. Target was the most aggressive in this category, offering additional discounts of 50% at moderate levels of visibility and 34.5% among the most visible items. Amazon may feel confident that men already choose Amazon for their apparel needs.

    In Women’s Fashion, the retailers generally offered the most additional discounts for items at the higher end of the visibility spectrum. Walmart offered the most aggressive additional discounts among the most visible items in Women’s Fashion to try to boost its market share in this category.

    Overall, while Prime Day is an effective way for Amazon to boost brand engagement, its rivals overwhelmingly offer higher additional discounts in Electronics, Beauty and Fashion. How about other categories like the booming Home space? Watch this space for more insights!

  • Food Delivery Boom Fuels Competition Among Restaurants

    Food Delivery Boom Fuels Competition Among Restaurants

    This year, homebound consumers crave the convenience of food delivery.
    Growing 20% since 2015, restaurant delivery has sparked intense rivalry to reach consumers’ homes. Although the pandemic led to $165 billion in lost sales industry-wide between March and July, experts predict online food delivery sales will reach $220 billion by 2023, accounting for 40% of total restaurant sales.[1,2]

    This massive market opportunity makes food delivery an urgent priority for restaurants to stay competitive and solvent during the pandemic. This year nearly one in six U.S. restaurants have closed either permanently or long-term.[3]

    Also, 40% of U.S. operators say they will likely be out of business within six months if economic conditions persist and 60% of Canadian restaurants could close permanently by November.[4,5]


    COVID-19 compounds market complexity

    Powerful market trends are rattling restaurants. During the pandemic, nearly 70% of operators have added third-party delivery to lift sales.[6]

    This year, third-party delivery from food delivery apps like Uber Eats, Grubhub and DoorDash will grow 21% over 2018.[7] The global market for cloud kitchens (also called ghost kitchens or virtual kitchens), commercial kitchens intended for delivery-only orders, will grow from $650 million in 2018 to $2.6 billion by 2026.[8]


    To avoid the need to rely on delivery partners, many chains invest in their own last-mile delivery capability to serve their fleet of restaurants.
    E-grocery sales are poised to surge 40% in 2020 and meal kits have boomeranged back into popularity, nearly doubling 2019 sales.[9, 10]

    Consumers demand speed to keep their food fast, fresh and hot. Prompt service matters, as one survey found when consumers face a food delivery issue, 93% want it resolved within 10 minutes.[11]

    The recession and job losses mean more consumers now need affordable food options. Meanwhile, restaurants are investing more in technology to modernize operations for efficient omnichannel service.

    How restaurants are adapting to 2020’s disruption


    Restaurant prices have risen during the pandemic to cover operating costs. Third-party delivery fees have led 41% of consumers to prefer to order food by contacting the restaurant directly (vs. 16% for third-party delivery).[12] To optimize pricing competitiveness, more restaurants now compare their delivery fees and offerings with rivals’ to spot and correct gaps, and keep their prices affordable.

    To streamline operational processes and costs during the pandemic, 28% of restaurants shrank their menus.[13]

    For clarity on which items to keep, operators now use data insights on restaurant listings and menu items down to the ZIP code level. This information also helps them decide whether to adapt to consumers’ diverse tastes, including vegan, gluten-free and organic, for competitive local assortments.


    Outperform rivals: Restaurant operators seek proof of their brand visibility on food delivery apps’ homepages.


    Restaurants have discovered consumers welcome reasons to celebrate at home this year. One chain’s weekly virtual happy hours on Facebook Live drew 80,000 participants and a $40,000 sales increase from delivery and takeout orders.[14]

    More restaurants now compare their promotional strategies with rivals’ to evaluate marketing performance, including homepage discoverability and visibility ranking, to ensure consumers find their brand online with ease.

    Delivery speed and precision also matter. A survey found 70% of consumers had food delivery order complaints, including late delivery (50%), incorrect order (37%) and cold or stale food (36%).[15] Using accurate geographic data can help restaurants improve speed and the customer experience.

    To gain a competitive advantage in today’s booming food delivery market, a growing number of leading chains and food delivery providers are collaborating with DataWeave to access actionable insights to make better strategic and operational decisions faster. Using trusted insights to make data-driven pricing, menu and promotional decisions help restaurants save time, reduce risk and gain clarity in today’s evolving market.

    Applying DataWeave’s accurate, up-to-date information also helps restaurants deliver affordability, convenience and variety to remain responsive to consumers and agile among competitors. To see how DataWeave helps restaurants stay relevant and competitive, contact us today.


    [1] Rogers, Kate. Winter is coming, bringing a new challenge to already-struggling restaurants. CNBC. September 14, 2020.
    [2] Zahava Dalin-Kaptzan. Food Delivery: Industry Trends for 2020 and beyond. Bringg. April 30, 2020.
    [3] Klein, Danny. 100,000 Restaurant Closures Expected in 2020. QSR. September 14, 2020.
    [4] Rogers, Kate. Winter is coming, bringing a new challenge to already-struggling restaurants. CNBC. September 14, 2020.
    [5] Charlebois, Sylvain. Don’t Want to Save the Restaurant Industry? Fine, but Use it to Save the Canadian Economy. Retail Insider. September 11, 2020.

    [6] Rogers, Kate. Winter is coming, bringing a new challenge to already-struggling restaurants. CNBC. September 14, 2020.
    [7] US Food Delivery App Usage Will Approach 40 Million Users in 2019. eMarketer. July 2, 2020.
    [8] Levy, Ari. Virtual Kitchen, founded by ex-Uber execs to help restaurants with delivery, raises $20 million. CNBC. Sept. 8 2020
    [9] Redman, Russell. Online grocery sales to grow 40% in 2020. Supermarket News. May 11, 2020.
    [10] De Leon, Riley. How the coronavirus pandemic delivery surge created a lifeline for Blue Apron meal kits. CNBC. May 22, 2020.
    [11] Guszkowski, Joe. Delivery services have room to improve, consumers say. Restaurant Business Online. Sept. 1, 2020.
    [12] Guszkowski, Joe. Consumers’ desire to order directly from restaurants is a big opportunity. Restaurant Business Online. Aug. 27, 2020.
    [13] Romeo, Peter. Best practices for weathering a second COVID wave. Restaurant Business Online. Aug. 28, 2020.
    [14] Ibid. 
    [15] Guszkowski, Joe. Delivery services have room to improve, consumers say. Restaurant Business Online. Sept. 1, 2020.

  • Introducing the CPG Brand Monitor by DataWeave

    Introducing the CPG Brand Monitor by DataWeave

    As DataWeave continues to engage with brands and manufacturers of all sizes, a consistent theme keeps emerging, “click and collect tracking”. Right now, brands rely on manual-store checks or waiting upwards of two weeks for a retailer to report sales data, which reveals low sales because a product is out of stock. In addition, there are always questions about the local price of your products compared to top competitors in the category. This is where DataWeave’s CPG Brand Monitor solution can help. 

    Click here for a quick tour of our dashboard.

    What we cover?

    On a daily basis, we track over 13,000 variant level SKUs across 100 stores, via seven of the top grocery retailers. We have selected the largest grocers in each region of the US, to allow for the widest coverage. These grocers include Albertsons/ Safeway in the west, HEB in Texas, Kroger in the upper mid-west, Wegmans in the Mid-Atlantic and Publix in the Southeast. 

    How does it work?

    In the application, you will see the list of all the SKUs we’re covering, with filters on the left side of the page to help with navigation. You can sort by Brand, Category, Store/ City, State, etc. After the filters are applied, the SKU list will be displayed based on these filters.  On the right side of the screen, you will see all the product level details including a 7-day price history, individual store level pricing/ stock availability and exportable charts and graphs. 

    How do I get access?

    Simply access the CPG Brand Monitor page, fill in your credentials via “Start Free Trial” and your login will be sent directly to your inbox. No commitments or phone calls are needed to test out the data. After a few days, our team will be in touch to make sure you understand how to navigate the tool and take you through our subscription options.   

    What else do we offer?

    DataWeave also offers a full Digital Shelf Analytics suite that covers Share of Voice (keyword, navigation and banner audits), Content Audit/ Optimization, Ratings/ Review Sentiment Analysis, Promotional Analysis, and much more. 

  • JioMart Launches Online Grocery Store

    JioMart Launches Online Grocery Store

    JioMart, the online channel for Reliance Retail Limited, launched in December 2019 as a contender in the e-grocery segment. Currently in India, this segment is being dominated by bigbasket, Amazon, Flipkart Supermart, Grofers, etc. After less than a year and from their initial launch in Mumbai, they now have their presence in 205 cities across India.

    According to their recent press release, they claim to be clocking over 250,000 daily orders, compared to bigbasket’s 220,000 and Amazon’s 150,000. To get an understanding of this rapid penetration, we had a look at the PIN codes that JioMart serves, spanning the country.

    The map below represents the percentage of PIN codes that are being served by JioMart’s online grocery in each state:

    **Disclaimer -Map for representation purposes only

    While states like Chandigarh, Delhi and Punjab in the North are covered extensively, JioMart has a stronger distribution in the Southern states.

    The image below shows the top ten states in India where JioMart’s online grocery has the highest presence:

    They’re yet to launch in 14 more states but it’s interesting to note that in this limited time, they’ve managed to cover 14% of the PIN codes in the country and all this, in the midst of lockdowns.

    Assortment

    To get an idea of the assortment in their range, we analyzed select PIN codes across three tiers of cities in India. The parameters we looked at were categories, brands and discounts to get an understanding of how JioMart is stacking up against its competitors. The cities we examined were:

    • Tier 1 – Bangalore, Delhi, Kolkata, Mumbai
    • Tier 2 – Ahmedabad, Jaipur, Kochi, Visakhapatnam
    • Tier 3 – Mohali, Mysore, Nagpur, Siliguri

    In its range, they offer eight broad categories, of which, we focussed on the four that offer the highest selection of products: home care, personal care, snacks & branded food and staples.

    The table below represents the average selection of products offered across each tier.

    Overview of discounts offered and the private label split

    Out of the assortment we looked at in the three tiers, we noticed that an average of 18% of the products are JioMart’s private labels. What stood out further is that private labels accounted for 48% in the Staples category and 24% in Personal Care. We noticed this trend (increase in the private label) when we did an analysis of Amazon.

    When it comes to discounts, we noticed that a near-total 91% of the products listed are being sold at a discount. Out of this, the highest discounts were witnessed in the Home Care and Staples categories.

    The brands with the highest number of products listed were Good Life, Reliance, Amul, Gillette and items sold loosely. All these accounted for 14% of the assortment. Out of these, Good Life, Reliance and the loose items are JioMart’s private labels.

    Competitor analysis

    To get an idea of where JioMart stands with relation to its competitors, we focussed on food and essentials in the Tier 1 cities. The table below highlights the number of product offerings in each category:

    It’s clear that in these categories (food and essentials), JioMart has the least number of products on discount. There’s no doubt that bigbasket is miles ahead in its product range/ assortment.

    To get a better idea of the discounting patterns, we analyzed the same categories to get a count of the number of products being discounted, as well as the average discount being offered. 

    We noticed that JioMart bookended our analysis – the least average discount, across the most number of products. Grofers offered the highest average discount of 23% with Flipkart Supermart and bigbasket closely behind. Lastly, bigbasket had the least number of products on discount with a little over 53%.

    Conclusion

    JioMart launched during a tumultuous and unprecedented time; the COVID-19 pandemic and the subsequent nation-wide lockdowns. Given this trial by fire, they managed to make an impact in this highly competitive space. Their expansion plans of tying up with mom and pop stores to fortify their penetration, had to take a back seat due to the ongoing situation but is sure to resume once conditions improve. This set-back did not however deter JioMart from attracting strategic investments from Facebook, Google and 12 other investors  in a span of 3 months. 

    In a study by Goldman Sachs, it found that India’s e-commerce business is expected to grow at a compound annual growth rate of 27% by 2024, resulting in a $99 billion market share. What’s even more shocking is that 50% of this market will be captured by Reliance Industries. It, therefore, stands to reason that all we’ve seen and heard of so far, is merely the tip of the iceberg and there’s surely more to come in the near future.

  • Market Intelligence Platform with Kenshoo

    Market Intelligence Platform with Kenshoo

    We’re thrilled to announce that we have teamed up with Kenshoo to offer an integrated marketing solution that combines DataWeave’s digital shelf analytics and commerce intelligence platform with Kenshoo’s ad automation platform. This in turn, provides better recommendations on promotions to retailers and consumer brands.

    As e-commerce surges, consumer brands can now promote their products through retail-intelligent advertising. Product discoverability, content audit, and availability across large marketplaces can be critical to a brand’s success. Using DataWeave’s digital shelf solutions, Kenshoo now can offer marketers greater visibility into a brand’s performance.

    Even large retailers and agencies can use our commerce intelligence platform to improve their price positioning, address category assortment gaps, and more.  

    Through this partnership, Kenshoo – a global leader in marketing technology, can help its significant base of consumer brands and retailers invest their marketing dollars intelligently and in a timely manner.

    At DataWeave, we have constantly strived to bring in a holistic approach to help our customers optimize their online sales channels. This partnership furthers our resolve in this direction. As we collectively strive to adjust to a post-COVID-19 world, we are observing an acceleration towards digital commerce. This acceleration and change in consumer behavior is going to be a lasting change, creating significant growth opportunities for both DataWeave and Kenshoo.

    With this partnership, we look forward to helping our customers make timely, intelligent, and data-driven decisions to grow their business.

  • Amazon Triples Down on its Private-label Product Portfolio

    Amazon Triples Down on its Private-label Product Portfolio

    Among Amazon’s most prominent and decisive steps in achieving retail dominance over the last few years has been its focus on expanding its private label portfolio.

    The most recent collaborative report between DataWeave and Coresight Research determines that Amazon’s private label assortment in early 2020 has grown three-fold over the previous two years, most of which is in categories outside of apparel and accessories.

    In addition, the report covers various facets of Amazon’s private label penetration and strategy. These include the size of Amazon’s private label portfolio, the distribution of private label products by category, the product ratings and number of reviews, the average price points across products and brands, and more.

    Our detailed and proprietary Amazon private label dataset includes information on over 20,000 products and 111 brands.

    Some of our key findings are:

    • Amazon’s private-label offering spans 22,617 products across 111 identified private labels.
    • Around half of the private-label products are in clothing, footwear and accessories, which is lower than the three-quarters found in our similar research from June 2018, indicating Amazon’s push into a broader range of categories.
    • The average Amazon private-label product generates a customer rating of 4.3 out of 5, representing positive customer feedback overall.

    Amazon’s Private-Label Offering Spans 22,617 Products across 111 Identified Private Labels

    The number of private-label products—22,617—is more than triple the total of 6,825 from June 2018 (see our previous report). The number of private-label brands also increased substantially (up 50% versus June 2018), indicating that the e-commerce giant has stepped up its private-label strategy.

    Around Half of Private-Label Products Are in Clothing, Footwear and Accessories

    Just over half of Amazon’s private-label products are in “clothing, footwear and accessories,” versus almost three-quarters when we undertook similar research in June 2018, indicating Amazon’s push into a broader range of categories. Other categories that feature more than 1,000 private-label products include “home and kitchen,” “grocery and gourmet food” and “tools and home improvement.”

    Source: DataWeave/Coresight

    The Average Amazon Private-Label Product Generates a Customer Rating of 4.3 out of 5

    We examined feedback provided by Amazon’s private-label customers: Customer satisfaction can be measured by the average star rating that customers have left in reviews. We chart both average star rating and average number of customer reviews per product in the graph below.

    The average Amazon private-label product generates a customer rating of 4.3 stars out of 5, suggesting overall solid customer satisfaction levels.

    Source: DataWeave/Coresight

    The full report is available for Coresight’s premium subscribers. It includes further details of categories and subcategories that suggest longer-term implications—including how Amazon targets a niche customer base through specific category labels but appeals to broader consumer needs by offering multicategory labels.

    To access DataWeave’s proprietary database on Amazon’s private label brands and products, reach out to us today!

  • How Apache Airflow Optimizes Complex Workflows in DataWeave’s Technology Platform

    How Apache Airflow Optimizes Complex Workflows in DataWeave’s Technology Platform

    As successful businesses grow, they add a large number of people, customers, tools, technologies, etc. and roll out processes to manage the ever-increasingly complex landscape. Automation ensures that these processes are run in a smooth, efficient, swift, accurate, and cost-effective manner. To this end, Workflow Management Systems (WMS) aid businesses in rolling out an automated platform that manages and optimizes business processes at large scale.

    While workflow management, in itself, is a fairly intricate undertaking, the eventual improvements in productivity and effectiveness far outweigh the effort and costs.

    At DataWeave, on a normal day, we collect, process and generate business insights on terabytes of data for our retail and brand customers. Our core data pipeline ensures consistent data availability for all downstream processes including our proprietary AI/ ML layer. While the data pipeline itself is generic and serves standard workflows, there has been a steady surge in customer-specific use case complexities and the variety of product offerings over the last few years.

    A few months ago, we recognized the need for an orchestration engine. This engine would serve to manage the vast volumes of data received from customers, capture data from competitor websites (which can range in complexity and from 2 to 130+ in number), run the required data transformations, execute the product matching algorithm through our AI systems, process the output through a layer of human verification, generate actionable business insights, feed the insights to reports and dashboards, and more. In addition, this engine would be required to help us manage the diverse customer use cases in a consistent way.

    As a result, we launched a hunt for a suitable WMS. We needed the system to satisfy several criteria:

    • Ability to manage our complex pipeline, which has several integrations and tech dependencies
    • Extendable system that enables us to operate with multiple types of databases, internal apps, utilities, and APIs
    • Plug and play interfaces to execute custom scripts, and QA options at each step
    • Operates with all cloud services
    • Addresses the needs of both ‘Batch’ and ‘Near Real Time’ processes
    • Generates meaningful feedback and stats at every step of the workflow
    • Helps us get away with numerous crontabs, which are hard to manage
    • Execute workflows repeatedly in a consistent and precise manner
    • Ability to combine multiple complex workflows and conditional branching of workflows
    • Provides integrations with our internal project tracking and messaging tools such as, Slack and Jira, for immediate visibility and escalations
    • A fallback mechanism at each step, in case of any subsystem failures.
    • Fits within our existing landscape and doesn’t mandate significant alterations
    • Should support autoscaling since we have varying workloads (the system should scale the worker nodes on-demand)

    On evaluating several WMS providers, we zeroed in on Apache Airflow. Airflow satisfies most of our needs mentioned above, and we’ve already onboarded tens of enterprise customer workflows onto the platform.

    In the following sections, we will cover our Apache Airflow implementation and some of the best practices associated with it.

    DataWeave’s Implementation

    Components

    Broker: A 3 node Rabbit-MQ cluster for high availability. There are 2 separate queues maintained, one for SubDags and one for tasks, as SubDags are very lightweight processes. While they occupy a worker slot, they don’t do any meaningful work apart from waiting for their tasks to complete.

    Meta-DB: MetaDB is one of the most crucial components of Airflow. We use RDS-MySQL for the managed database.

    Controller: The controller consists of the scheduler, web server, file server, and the canary dag. This is hosted in a public subnet.

    Scheduler and Webserver: The scheduler and webserver are part of the standard airflow services.

    File Server: Nginx is used as a file server to serve airflow logs and application logs.

    Canary DAG: The canary DAG mimics the actual load on our workers. It runs every 30 minutes and checks the health of the scheduler and the workers. If the task is not queued at all or has spent more time in the queued state than expected, then either the scheduler or the worker is not functioning as expected. This will trigger an alert.

    Workers: The workers are placed in a private subnet. A general-purpose AWS machine with two types of workers is configured, one for sub-DAGs and one for tasks. The workers are placed in an EC2-Autoscaling group and the size of the group will either grow or shrink depending on the current tasks that are executed.

    Autoscaling of workers

    Increasing the group size: A lambda is triggered in a periodic interval and it checks the length of the RMQ queue. The lambda also knows the current number of workers in the current fleet of workers. Along with that, we also log the average run time of tasks in the DAG. Based on these parameters, we either increase or decrease the group size of the cluster.

    Reducing the group size: When we decrease the number of workers, it also means any of the workers can be taken down and the worker needs to be able to handle it. This is done through termination hooks. We follow an aggressive scale-up policy and a conservative scale-down policy.

    File System: We use EFS (Elastic File System) of AWS as the file system that is shared between the workers and the controller. EFS is a managed NAS that can be mounted on multiple services. By using EFS, we have ensured that all the logs are present in one file system and these logs are accessible from the file server present in the controller. We have put in place a lifecycle policy on EFS to archive data older than 7 days.

    Interfaces: To scale up the computing platform when required, we have a bunch of hooks, libraries, and operators to interact with external systems like Slack, EMR, Jira, S3, Qubole, Athena, and DynamoDB. Standard interfaces like Jira and Slack also help in onboarding the L2 support team. The L2 support relies on Jira and Slack notifications to monitor the DAG progress.

    Deployment

    Deployment in an airflow system is fairly challenging and involves multi-stage deployments.

    Challenges:

    • If we first deploy the controller and if there are any changes in the DAG, the corresponding tasks may not be present in workers. This may lead to a failure.
    • We have to make blue-green deployments as we cannot deploy on the workers where tasks may still be running. Once the worker deployments are done, the controller deployment takes place. If it fails for any reason, both the deployments will be rolled back.

    We use an AWS code-deploy to perform these activities.

    Staging and Development

    For development, we use a docker container from Puckel-Airflow. We have made certain modifications to change the user_id and also to run multiple docker containers on the same system. This will help us to test all the new functionality at a DAG level.

    The staging environment is exactly like the development environment, wherein we have isolated our entire setup in separate VPCs, IAM policies, S3-Buckets, Athena DBs, Meta-DBs, etc. This is done to ensure the staging environment doesn’t interfere with our production systems. The staging setup is also used to test the infra-level changes like autoscaling policy, SLAs, etc.

    In Summary

    Following the deployment of Apache Airflow, we have onboarded several enterprise customers across our product suite and seen up to a 4X improvement in productivity, consistency and efficiency. We have also built a sufficient set of common libraries, connectors, and validation rules over time, which takes care of most of our custom, customer-specific needs. This has enabled us to roll out our solutions much faster and with better ROI.
    As Airflow has been integrated to our communications and project tracking systems, we now have much faster and better visibility on current statuses, issues with sub processes, and duration-based automation processes for escalations.
    At the heart of all the benefits we’ve derived is the fact that we have now achieved much higher consistency in processing large volumes of diverse data, which is one of DataWeave’s key differentiators.
    In subsequent blog posts, we will dive deeper into specific areas of this architecture to provide more details. Stay tuned!

  • Coronavirus Outbreak: Impact on E-Commerce Retailers and Consumer Brands

    Coronavirus Outbreak: Impact on E-Commerce Retailers and Consumer Brands

    The Coronavirus, otherwise known as COVID-19, has made landfall on U.S. shores. At the time of writing this article, there are over 230 confirmed cases in the country and 12 deaths. The growing unease about the virus, which has quickly accumulated 95,000+ confirmed cases globally, has, among other things, adversely affected businesses and stock markets the world over.

    In the wake of this outbreak, U.S. based retailers and brands would be prudent to brace themselves and plan ahead to minimize disruptions as much as possible.

    Businesses and consumers in China, the global epicenter of the epidemic, have been dealing with these challenges over the last couple of months. It’s likely that some of the trends observed in China would be mimicked in the U.S. as well, something that domestic retailers and brands would do well to study and prepare for.

    The Inadvertent E-commerce Wave

    When the outbreak happened in China, it caused an uptick in e-commerce adoption as shoppers were reluctant to step out of their homes and instead, opted to shop for their goods online.

    Reports indicate that Chinese online retailer JD.com’s online grocery sales grew 215% YoY over a 10-day period between late January and early February. Similarly, Carrefour’s vegetable deliveries grew by 600% YoY during the Lunar New Year period. Online sales of Dettol, a disinfectant produced by Reckitt Benckiser, rose 643% YoY between 10 February and 13 February on China’s Suning.com.

    In Singapore, another region affected by the virus more recently than in China, Lazada’s grocery arm, RedMart, and Supermarket chain, NTUC FairPrice, both reported an unprecedented surge in demand, which tested their delivery capabilities to the limit.

    This bump in online sales isn’t just restricted to grocery, but other categories as well. Jean-Paul Agon, CEO of L’Oréal, recently said that online sales of the brand’s beauty products increased in China in February.

    Given such a consistent shift in shopping behavior across coronavirus-affected regions, it’s logical to expect that a similar trend would be followed in the U.S. – in fact, it might already be underway.

    A recent survey by Coresight Research indicated that 27.5% of U.S. respondents are avoiding public areas at least to some extent, and 58% plan to if the outbreak worsens. Of those who have altered their routines, more than 40% say they are “avoiding or limiting visits to shopping centers/ malls” and more than 30% are avoiding stores in general. The survey also found consumers will likely begin to avoid restaurants, movie theaters, sporting events and other entertainment venues.

    Therefore, it’s essential for U.S. retailers and brands to swiftly energize their e-commerce readiness and be fully prepared to cater to the circumstances-induced shift in shopping behavior, inclined toward online.

    A Logistical Nightmare

    The most obvious area of impact for retailers and brands is in their supply chain and order fulfilment operations.

    A large portion of consumer product manufacturers rely to some extent on China, and the potential impact of the virus on supply chain processes is inescapable. Chinese factories have been operating at partial capacity, impacting supply chains globally. This has largely affected highly popular e-commerce categories like consumer electronics, fashion and furniture.

    Shares in the U.S. of furniture e-commerce retailer, Wayfair, fell as much as 26% toward the end of February, according to a Bloomberg report. The is particularly revealing, as the online retailer reportedly relies on China for half of its merchandise.

    Retailers struggling to cope with this stress in their supply chain systems would do well to warn their customers beforehand about delays in deliveries, like AliExpress has just done.

    For categories like CPG, as consumers increasingly shop online, retailers that offer Buy Online Pick Up In Store (BOPIS), should expect a surge in its adoption, and reinforce their online infrastructure and in-store operations to cater to the rising demand.

    In addition to disruptions in the supply chain, several other mission-critical areas are likely to get affected too.

    Keeping Up With The Online Surge

    As with any event of this magnitude, the business implications reach far and wide. The following are a few areas that we’ve identified as critical, based on our experience working with retailers and brands. Being aware of and focusing on these issues are likely to alleviate some of the issues faced by consumers today.

    Fair pricing: There have been several reports of price gouging on e-commerce platforms. Examples include 2-ounce Purell bottles being sold for $400 and face masks for up to $20. While these prices have mostly been set by third party merchants, brands are likely to face the flak from consumers. A recent Bloomberg article reported that online retailers still rely partly on employees to manually monitor these items. This approach has obvious limitations, such as products quickly reappearing on the website after being de-listed. Brands and e-commerce platforms will need to explore automated ways of controlling their online pricing practices at large scale.

    3P merchant and counterfeit management: Often, unauthorized third-party merchants selling an original manufacturer’s goods are the ones who unreasonably inflate prices. These merchants tend to test the markets on online marketplaces with their pricing, which adversely affects the brand image of the manufacturer. Further still, they sometimes list counterfeit or fake goods that make incorrect or extravagant claims. Brands will need to swiftly identify and de-list these merchants from online marketplaces.

    Ensuring stock availability: During times like these, it’s a common sight to see empty aisles at supermarkets selling items like canned food, water, paper products and personal care products. Consumers will benefit from brands monitoring their stock availability at stores, which will help them better align their supply chain operations to the rapidly changing demand patterns across the U.S. map. This way, efforts can be more targeted at regions with severe shortages.

    Content compliance: Helium 10, a technology provider for Amazon sellers, reported that since 26 February, 90% of searches on Amazon are coronavirus related, and searches for hand sanitizers spiked to 1.5 million searches in February compared to 90,000 in November. As a result, to arrest exploitative practices, some online marketplaces have announced policy guidelines on product content claiming health benefits. Words like ‘Coronavirus‘, ‘COVID-19‘, ‘Virus‘ and ‘epidemic’ are, in fact, prohibited.  Amazon has already de-listed several merchants claiming fraudulent cures. Ebay has gone as far as to ban all new listings for face masks, hand sanitizers, and disinfecting wipes, due to regulatory restrictions. In this context, retailers and brands will benefit from deploying tracking mechanisms that quickly identify offenders.

    The areas of business presented above are by no means a comprehensive list for retailers and brands to rely on during this time. Still, these are critical impact areas for them to address, even as huge efforts are made toward managing highly stressed supply chains.

    DataWeave Offers Support

    The coronavirus outbreak is likely to get worse before it gets better. As we enter unchartered territories, DataWeave is offering to contribute in small ways, pro bono, by leveraging our expert talent and competitive intelligence technology platform, to address some of the challenges faced by retailers and brands.

    We’re announcing a limited-time, no-cost offer to detect and report on price gouging, the presence of unauthorized third-party merchants, as well as stock availability across U.S. ZIP-codes. This offer will be valid for 4-6 weeks (timeline will be flexible based on how the outbreak develops) and limited to monitoring the top 10 U.S. online marketplaces, as well as critical product categories such as medicinal and hygiene-related products, emergency food items, survival-related products, fuel, etc.

    Reach out to us for further details.

  • [INFOGRAPHIC] 2019 at DataWeave: Blazing New Trails

    [INFOGRAPHIC] 2019 at DataWeave: Blazing New Trails

    As another year comes to a close, we look back at 2019 with fond memories and look forward to the exciting new prospects of 2020. Take a trip with us as we highlight some of DataWeave’s milestones of the last twelve months.

    Over the course of the year, DataWeave’s success has gone hand in hand with the evolution of retail and e-commerce, reinforcing the relevance of our technology platform.

    Our rapid growth in the North American market is a reflection of how intense competition in the region is triggering the need for accurate, timely, and actionable competitive and market insights, as well as other avenues for retailers and brands to gain a competitive edge.

    Last year, we saw a resurgence of big-box (omnichannel) retailers as they adopted innovative approaches to play to their strengths (their offline stores). Offering buy online, pick up in store (BOPIS) or click-and-collect options, rolling out price match guarantee programs, and expanding their partnerships with delivery services like Instacart, enabled these retailers to leverage the best of both the online and offline worlds to compete with e-commerce firms.

    Amazon continues to dominate e-commerce with a daunting 38% share in the US. Still, the partnerships between brands and Amazon are increasingly being tested. Nike and Ikea recently joined the likes of Swatch and Birkenstock to sever ties with the retail behemoth. This seemingly growing trend is largely due to counterfeits continuing to leak through the system.

    Brands that used to de-prioritize their focus on their eCommerce channel (as it often was only a small portion of their revenues) have come to realize that consumers use large marketplaces like Amazon not just to shop for products but also to perform product research. As a result, how these brands are represented and sold online impact their offline sales. And with the onset of BOPIS and click-and-collect initiatives, brands can now analyze this correlation even at a hyperlocal (ZIP-code) level.

    Large marketplaces, for their part, have started taking advantage of the increasingly brand-agnostic shopping behavior of consumers by launching ad-platforms for brands and manufacturers, enabling them to boost their visibility online.

    Due to such sweeping transformations to the market landscape, brands and retailers are increasingly looking more toward intelligent tech-based solutions to help them gain a competitive edge.

    In order to effectively serve the growing need for competitive and market insights, we’ve pushed our platform to its limits and beyond. It’s our constant endeavor to innovate and improve. This is evident with the launch of a host of new features on our product suite, especially Brand Analytics – designed to enable consumer brands to protect their brand equity and optimize e-commerce performance.

    One of the key factors that enabled us to achieve all the milestones we did is the aggressive hiring of some of the most skilled talent in the tech industry. Our team grew by 44% in 2019, giving us additional confidence to raise the bar on our capabilities and offer 95% accuracy in our data and insights to our customers consistently.

    We’re encouraged by the fact that we’ve more than doubled as a business, year-over-year, for the past several years, without depending solely on growing the team, but also by consolidating our technology stack, optimizing our processes, and scaling our products.

    Here’s a sneak peek into our performance in 2019:

    2020 Vision

    The upcoming year promises to be an exciting one for the retail industry and the consumer brand space at large. We plan to be at the helm and increase our footprint all around. There’s a strong focus to expand our US team and consequently, the business. While we continue to strengthen our roots in India, we will look toward other mature markets like the UK, Germany and the Middle East as well.

    On other fronts, we’re gathering steam on new partnership engagements – consulting firms, ad tech firms, marketing agencies and complementary technologies. We will also expand our foray into the travel and delivery services verticals.

    With our diversifying portfolio, we haven’t lost sight of one of the most important aspects of any successful company – its employees. We will continue to keep our employees engaged, motivated, and satisfied by providing vertical and horizontal career growth opportunities, conducting personalized training programs, organizing hackathons, fostering cross-team collaboration and learning, and encouraging everyone to periodically blow off some steam at company retreats and the ferociously fought in-house sports tournaments.

    Here’s to a stellar 2020 of empowered retailers and brands. We wish them well as they navigate the dense competitive landscape, knowing that they have an ally in their corner with DataWeave.

  • Black Friday 2019 Pricing for Online Furniture

    Black Friday 2019 Pricing for Online Furniture

    For today’s shoppers, instant gratification is the need of the hour. It’s, therefore, no surprise that furniture e-retail has been picking up steam over the last decade. What was once a norm to physically touch and feel before making a purchase, is now just a few clicks away. Retailers have bridged the gap by making the purchase process as seamless as possible – easy finance options, hassle-free returns and variety.

    While several factors play a role in driving consumers to shop furniture goods online, price is the primary motivator, as is the case with most popular product categories sold online.

    During Black Friday 2019, DataWeave performed an analysis on a sample of 23,000+ products across six of the top furniture retailers – Amazon, Home Depot, JCPenney, Target, Walmart and Wayfair. Ten product types were covered in the furniture category (such as Beds, Bookcases, Mattresses, Sofas, etc.) and the analysis focused on the top 500 ranked products of each product type.

    To get an accurate depiction of the additional markdowns during the sale, we took the mode of the prices for the preceding week and compared them with that during the sale.

    Additional markdowns

    Target (25%) and Home Depot (21%) marked down their prices most aggressively during the sale.  JCPenney and Wayfair stood out for offering additional markdowns on the highest portions of their ranges (67% and 46% respectively), even though the average markdown percentage was fairly conservative. Amazon and Walmart were steady as usual, with additional markdowns of 8% and 10% on 15% and 17% of their assortment, respectively.

    Premiumness

    To further understand the furniture pricing strategies of these retailers, we categorized their products into buckets of how expensive or cheap the product is (High, Medium, and Low in terms of price), relative to the rest of the products hosted by the retailer, and studied how the additional markdowns varied across these buckets. Where the MRP was not displayed, the most expensive price of the product during the holiday period prior to Black Friday was considered to define the “premiumness” of the product.

    Two patterns clearly stand out from this analysis. Most of the retailers remained relatively equitable between their premium categories with nothing significant to report in terms of varying markdowns. Home Depot and and JCPenney are the only exceptions here, but not by much.  The other interesting insight is that the percentage of marked-down products had a near unanimous pattern of the high level being the most covered, followed by the medium and then low.

    Therefore, while there wasn’t a significant variation in the average markdown across premiumness levels, a larger portion of the high-premium goods were consistently offered at a discount across all retailers.

    Popularity

    Much like our premiumness categorization, we investigated products based on their popularity levels as well. We’ve defined popularity using a combination of the average review rating and the number of reviews for each product, condensed to a scale of low, medium and high.

    We observe slightly different furniture pricing strategies adopted by retailers across popularity levels. While Home Depot, Amazon, and Wayfair chose to provide higher markdowns on their more popular products, Target, JCPenney, Walmart chose to provide higher markdowns on their least popular products. In addition, a larger portion of the least popular products were consistently offered on discount by almost all retailers.

    In combination with our findings across premiumness levels, we can surmise that part of the strategy of most retailers was to liquidate their stock of expensive and unpopular products during the sale.

    Price Change Activity

    As part of our analysis, we also tracked the level of pricing activity across retailers over the last week of November, in terms of the number of price changes made as well as the average price variation for each retailer.

    In general, we can see that Amazon and Walmart  consistently made several price changes through the week, though the average magnitudes of these price changes were relatively low. This echoes the pattern we’ve observed through our analysis of other product categories during the sale event, as well.

    Also, we see an almost coordinated increase in the number of price changes and the average magnitude across the 27th and 28th of November. This is likely an attempt by the retailers to get a head start on Black Friday deals.

    An unusual and interesting pattern was observed with Wayfair, which started out the week with the most changes at 2500. It then tanked the next day and hovered around 500 till the 28th, only to spike to 2500 again. All these changes though, had their variation in and around 5%.

    In summary, its interesting to observe how different retailers approached the much-anticipated holiday season sale events differently. As one might expect, there are significant variations among retailers in the aggressiveness of discounting activity as they approached Black Friday, and on Black Friday itself. Contrasting pricing strategies for popular and premium goods were also observed.

    If you would like to learn more about the pricing of top U.S. retailers across other product categories like consumer electronics, fashion, and beauty & health, check out our series of articles on Black Friday 2019.

  • Health & Beauty on Black Friday: Analyzing Pricing Strategies of Top U.S. Retailers

    Health & Beauty on Black Friday: Analyzing Pricing Strategies of Top U.S. Retailers

    We’ve come a long way from face paint and medicinal herbs to multi-billion dollar industries revolving around health and beauty. Customers are getting increasingly bombarded with variety that promises something for everyone. In fact, a recent DataWeave study identified Health & Beauty as one of the most popular CPG categories in the U.S., both in terms of assortment strength and brand concentration. As with most other categories, pricing activity around Health & Beauty is especially abuzz when Thanksgiving weekend comes around.

    As part of our series of articles analyzing the pricing of leading retailers across categories on Black Friday, the DataWeave team performed an analysis on a sample of 14,000+ products across six top retailers – Amazon, JC Penney, Macy’s, Nordstrom, Target and Walmart. Seven product types were covered across the category, such as Fragrance, Hair Care, Makeup, etc. and the analysis focused on the top 500 ranked products of each product type.

    Additional markdowns

    For this analysis, we considered the mode of the prices for the week before and compared it with that during the sale. This painted a picture of the additional markdowns for the duration of the sale.

    Similar to our prior coverage of the Fashion category during Black Friday, Macy’s had the broadest reach in terms of the marked down products at 25.6%. The average percentage of the markdowns was 22% and was only eclipsed by JC Penney with an average of 34.7%, though this was only offered on 3% of its range. At the other end of the spectrum, Amazon and Walmart had the lowest markdowns at 8.9% and 8.4% respectively but were among the top three in products covered (18% & 12%). Target and Nordstrom offered mid-range markdowns across the board but on a rather conservative selection of products of 5% and 3%, respectively.

    Additional markdowns by product types

    When we delved further into the product types, we noticed that a majority of the retailers heavily marked down makeup, shampoo & conditioner and men’s hair care products. The table illustrates the top three discounted categories for each retailer we analyzed.

    Premiumness

    We categorized the products across retailers into buckets of how expensive or cheap a product is, relative to the rest of the products hosted by the retailer in the respective product type. Where the MRP was not displayed, the most expensive price of the product during the holiday period prior to Black Friday was considered for this categorization. We then tagged products as High, Medium and Low in terms of product premiumness, with High referring to the more expensive products.

    In line with previous trends, Macy’s had the highest markdown on its high level products at 32.8%. It also had the widest coverage for the category at 20%. Amazon, Macy’s, Target, Walmart followed the expected approach of providing higher markdowns on the more premium products, and also on a higher portion of these products. This would be consistent with their goal of providing attractive offers on premium goods while also protecting their margins.

    JC Penney and Nordstrom were exceptions here, with JC Penney providing higher markdowns on its cheaper goods, while Nordstrom focused its markdowns on the medium bucket.  That being said, it should be reiterated that the portion of products with markdowns for both thee retailers was relatively small.

    Popularity

    Similar to categorizing the products at levels of product premiumness, we categorized them into levels of popularity as well. Here, popularity is defined using a combination of the average review rating and number of reviews obtained for each product.

    Interestingly, no consistent pattern has emerged that indicates a strategic focus on factoring product popularity into their pricing strategies for Black Friday.

    Macy’s, JC Penney, and Nordstrom chose to provide higher markdowns on their highly popular products, of which only JC Penney and Macy’s chose to also markdown a higher portion of their highly popular products. It was just as common though to see retailers (including Amazon) marking down the prices of their least popular products. This is likely an attempt by the retailers to liquidate their excessive stock of less popular products during the sale.

    Price Change Activity

    As documented quite often in recent years, the Black Friday sale is no longer limited only to a single day, but attractive offers are often seen right through November, especially over the last week of the month. We tracked the level of pricing activity across retailers over the last week of November, in terms of number of price changes as well as the average price variation for each retailer.


    In typical fashion, we observed that Amazon had the most number of pricing changes by a large margin, peaking at 2500 for the set of products tracked. The next in line was Walmart a long way down at 618 changes on the 27th. Even after the multiple changes, their average price change variation remained at the lower end of the scale – in and around 10%.

    The rest of the retailers exercised fewer price changes, with the slight exception of Macy’s in the days leading up to Black Friday. However, the changes almost ceased from the day before only to marginally rise on the 29th.

    While all the retailers tended to follow a predictable pattern of decreasing variation on the 28th and sharply increasing it the next day, Nordstrom and Walmart did the exact opposite, having likely chosen to jump the gun in offering discounts during Black Friday.

    Conclusion

    To conclude, we deduced that Macy’s had relatively higher markdowns on more of its products than the rest. JC Penney, Nordstrom and Target offered high markdowns on the face of it but on a very small section of products. Unsurprisingly, Amazon and Walmart stayed true to their past patterns and remained conservative in their additional markdowns during the sale but generous in their reach.

    Have a look here at our other observations regarding the Black Friday sale and stay tuned for more insights from our analysis of other product categories!

  • Fashion on Black Friday: Decoding Pricing Strategies of Top U.S. Retailers

    Fashion on Black Friday: Decoding Pricing Strategies of Top U.S. Retailers

    Over the last few Thanksgiving Weekend sales, fashion, what was a category once typically reserved for offline purchases, has evolved into a regularly marked down and popular category as shoppers get more comfortable making these purchases online. This can be credited to the ease of purchase that retailers offer – trials, returns, etc. combined with the desire for shoppers to refresh their wardrobe for the new year ahead.

    At DataWeave, we performed an analysis on a sample of 40,000+ products across six of the top fashion retailers – Amazon, Bloomingdale’s, Macy’s, Nordstrom, Target and Walmart. . Twenty product types were covered across both men’s and women’s fashion and the analysis focused on the top 500 ranked products of each product type.

    Additional Markdowns

    For the sake of this analysis, we compared the prices during the sale with the mode of the prices the week before. This gave us a clear picture of the additional markdowns during the sale period and therefore, the additional value to shoppers.

    Dominating the fashion space, Nordstrom and Macy’s came in hot with the most aggressive discounts on the largest share of their product range, 36% and 27% respectively, on more than a quarter of their range. In the women’s lineup, Target offered a 36% markdown, compared to ~22% for its men’s lineup. Across both categories though, this was only on 1% of Target’s range. In what seems to be an expected trend, Amazon and Walmart remained relatively conservative with their additional markdowns, as they tend to be competitively priced even during non-sale periods.

    Drilling down into the product types, we noticed that very aggressive markdowns were being offered on t-shirts and skirts (over 40%). Swimwear, hosiery, handbags, and sunglasses were other product types that were featured with attractive prices across websites.

    Product Premiumness

    We categorized the products across retailers into buckets of how expensive or cheap the product is, relative to the rest of the products hosted by the retailer. Where the MRP was not displayed, the most expensive price of the product during the holiday period prior to Black Friday was considered. We then bucketed products in categories of High, Medium and Low of product premiumness, with High containing the more expensive products by price.

    Amazon, Bloomingdale’s, Macy’s and Nordstrom chose to markdown the more expensive products in their range higher than the rest of their assortment. This aligns well with what one would expect retailers to do as shoppers tend to expect attractive offers on the more expensive range of products. Also, with the more expensive products, retailers and brands likely have more room to be flexible with margins. Amazon shows a consistent strategy here, having provided higher markdowns on a relatively higher portion of its most premium products and vice versa. This trend can only otherwise partially be seen with Macy’s.

    Walmart though, chose to go the other route and provided higher markdowns on its least premium products. This might have been a targeted effort to maintain their perception among shoppers as a destination for affordable goods. Though it’s important to note here that these markdowns were seen only on a small set of cheap goods – just over 5%.

    Price Change Activity

    Walmart, Nordstrom and to an extent, Bloomingdale’s, had an almost consistent number of price changes throughout the week. Nordstrom recorded the most significant dip in the magnitude of the markdowns over time.

    Amazon and to a smaller degree, Macy’s, had more price changes during the week. However, Amazon’s average price variation remained among the lowest whereas Macy’s clocked in the highest by Black Friday at just under 40%.

    Across the board, the price changes dipped on the 28th and then rose again on the 29th. This can be seen as a conscious effort to have more aggressive activity on Black Friday.

    In summary, fashion-first retailers like Macy’s and Bloomingdale’s went all-in during the sale, while Nordstrom, a multi-category retailer, stood out for its aggressive focus on fashion.

    Amazon and Walmart continued to operate within the competitive space that they’ve carved out for themselves as the leading retailers in the US. We observed a similar trend even in the other product categories we’ve analyzed for the sale. Check out our analysis of the Electronics category during Black Friday here.

  • Black Friday Sale: Breaking Down Pricing Strategies in Consumer Electronics

    Black Friday Sale: Breaking Down Pricing Strategies in Consumer Electronics

    Online holiday shopping (Nov-Dec) in the US for 2019 is projected to be $143.7B, a 14.1% increase from 2018. This sets a rather exciting stage for retail giants in the battle to claim market share. Interesting patterns emerge as each one tries to out-smart the other. Black Friday, in particular, is when most of the activity was expected to be concentrated.

    Inevitably, consumer electronics had strong representation, according to research by Coresight. As traffic steers more towards online shopping, there’s an increased sense of comfort in purchasing big ticket items on an ecommerce platform. There are multiple reasons why electronics lead the race during the holiday season – easy to gift, personal indulgence, comparatively shorter shelf life and well, because who among us can really resist a gadget on sale.

    In line with expectations during the season, there’s been a slew of generous discounts across the board. According to prior trends, Amazon was on course to be the lowest priced. In order to assess this, we decided to study a sample of 1000 products on Amazon and match them against its competitors like Walmart, Target, Best Buy and New Egg. Doing this gave us an accurate picture of the comparative pricing across retailers during this season, right up to Black Friday.

    Competitive Pricing Analysis

    There is a commonly held assumption that Amazon is the lowest priced retailer in most cases. How true is that? Here are our findings:

    We tracked the split across three scenarios during the holiday period – Amazon being exclusively the lowest priced, Amazon sharing the lowest priced spot and Amazon not being the lowest priced.

    Clearly, Amazon monopolized the share of lowest priced products during the entire period – with its share of lowest priced products ranging between 86% and 60%. The dip from 86% to 60% was immediate on the 27th, as Amazon’s competitors caught up. In general, Amazon’s share of lowest priced products fell from 76% to 62% on Black Friday, as its competitors launched their most aggressive promotional campaigns for the holiday season. As shown in the next chart below, a large portion of this can be attributed to Target’s pricing activity.

    Relative Price Index

    From 21 November until Black Friday, we calculated the price index across retailers, which indicates the relative pricing levels each day for the set of matched products – the lower the price index, the lower the average relative price.

    Unsurprisingly, Amazon has been consistently the lowest priced by a fair margin. A few rungs down, New Egg and Fry’s have been going head-to-head with their price positions. Target on the other hand, underwent a spike in relative pricing from 26-28 November. To sum up, in order of lowest pricing, it’s Amazon, Best Buy, Walmart, New Egg, Fry’s and Target.

    Additional Markdowns

    While the insights above were unearthed by comparing the products of retailers against a sample of 1000 Amazon products, we went further and performed a separate analysis on a different sample of 15,000+ products across retailers, which focussed on the top 500 ranked products of each product type for Amazon, Best Buy, Target and Walmart. The product types considered include Digital Cameras, DSLRs, Headphones, Laptops, Mobile Phones, Refrigerators, Tablets, Televisions, USB Flash Drives and Wearables.

    Here, we compared the prices during the sale with the mode of the prices of the same retailer the week before. This put into perspective the level of additional markdowns during the sale period, enabling us to better understand the additional value to shoppers during the sale period (since discounts are often offered during non-sale periods too).

    Looking at opposite ends of the spectrum, we find Amazon with the least drastic markdowns during the sale as it tends to consistently have lower prices across the board. At the other end, there’s Best Buy and Target with the most aggressive markdowns; Target taking the lead, 25.5% on 35% of its products, which is also consistent with the activity we observed in the previous sample of matched products.

    Going further, we’ve broken down the markdown activity by the top product types for each retailer. Across the board, we observe attractive discounts on Headphones, USB Flash Drives and Mobile Phones.

    Price Change Activity

    With the proliferation of pricing intelligence tools (often driven by algorithms), dynamic pricing is a commonly observed behavior among retailers. We analyzed this trend during the holiday period to identify the retailers that are most aggressive in their price change activity. The following charts reveal the number of price changes performed by retailers in our sample as well as the average price variation during this holiday period.

    Amazon made several price changes during the week but with a relatively low magnitude, since it was the lowest priced anyway through the week. The only other player with similar activity was Walmart. Target and Best Buy had significantly fewer price changes but when they did make the changes, the magnitude was much larger. Their focus was solely on a smaller, select set of products where they went all in.

    In conclusion

    As the years advance, the duration of holiday sales is no longer restricted to the actual holiday, but the days preceding and following them as well. With more and more people getting increasingly comfortable with online shopping (14.1% increase from 2018), buying habits are evolving too. Big retailers are cashing in on this and driving their pricing strategies to keep up with the evolution.

    One of the clear cut findings from our research is that there are two primary paths they take: smaller additional markdowns over a longer period and larger additional markdowns over a shorter period. Whichever path they choose, retailers need to be on top of the game with valuable insights, that give them a competitive edge. For accurate and large scale competitive intelligence, reach out to us.

  • Amazon on course for an aggressive Black Friday

    Amazon on course for an aggressive Black Friday

    The holidays are around the corner and that much awaited holiday cheer, has now become directly proportional to the arrival of an Amazon package. According to a new report, in partnership with Bain & Company, DataWeave has observed that early in November, Amazon had the lowest price 30%-50% of the time and matched the lowest price 35%-60% of the remaining cases, based on an analysis performed on a sample of over 16,000 products across 10 websites and 5 product categories.

    Aggressive pricing strategies have been Amazon’s modus operandi for a while now and it’s not about to change this season. In the build up to the Black Friday promotions this year, they even slashed their prices of the rarely discounted Apple products, such as the iPad Pro. This sets the tone for what shoppers can expect as the holiday season comes upon us.

    Results of a recent survey, published as part of the Bain report, revealed that ‘value for money’ was the primary concern that influence purchasing decisions, across categories. In the same breath, the respondents went on to say that they perceive Amazon as a ‘value leader’, sans womens’ clothing and pet supplies.

    Although this season might continue to see Amazon rake in the most market share, competitors are not far behind. There’s heavy investment from the likes of Walmart and others in order to negate the effects of the undercut. If these competitive responses become louder, the dent on customer perception could begin to tilt to more neutral ground.

    Stay tuned as we follow this pattern during the season and release our findings over the next few weeks.

    For access to the full article that was published in the Retail Holiday Newsletter by Bain & Company and powered by DataWeave, click here.

  • 3 Common Problems Brands Face in eCommerce | DataWeave

    3 Common Problems Brands Face in eCommerce | DataWeave

    Over the last three years, I have helped deploy eCommerce analytics solutions for several brands and manufacturers globally. During this time, I have conversed with day-to-day users up through C-Suite executives of some of the world’s most successful brands, while also working with the founders of startup brands who were simply trying to find their place in the world of commerce.

    As I look back on my time to date, I have noticed a few themes emerge from my diverse client conversations with brands, which are indicative of an ecosystem that’s only now coming to terms with retailers and consumers moving online. Here are three fundamental problems I’ve seen brands often run into as they adapt to the world of eCommerce:

    1. “We have no idea what we are doing”

    My favorite part about being an analytics solution provider is the introduction session with a new client. I always entered these conversations with a few key questions:

    – What are your top three eCommerce initiatives for the next 12 months?

    – How does your team and other internal resources align with these initiatives

    – How do you envision using this type of tool to help you succeed with your goals? What made you choose ours?

    Early in my career, what always amazed me was that these enormous brands – wildly successful brands – entered into a partnership without a clear plan to execute. Many would fumble through what I thought were very basic questions. After a few of these conversations, I came to the realization that most brands have a limited understanding of what they are doing in eCommerce.

    How could this be possible?

    I remember a conversation with a large CPG brand executive. He said, “Keep in mind, most of the people doing these jobs are from a bricks-and-mortar world. They don’t have eCommerce experience because no one does. It is too new. We don’t have the resources to hire more people because eCommerce makes up less than 1% of our total revenue.”

    As an industry, brands are collectively making it up as they go. Few admit it, but the industry is growing and evolving so fast, the best that some do is hold on for the ride (while taking a few calculated chances along the way).

    2. “We measure success poorly”

    I have noticed that, with time, many brands are starting to get a better grasp on how to operate online, though there is still a long way to go for many. The best evidence for this improvement is the growth in the number of job posts for eCommerce-focused roles, new vendors popping up in this space, and industry centers of excellence being developed. As more people choose eCommerce roles, the biggest challenge that I see is the lack of effective measurement and training processes.

    Often, the issue is that many brands take a long-standing, loyal executive and assign them as the eCommerce leader. When this person is not forward thinking, analytical or open to trying things a new way, brands fail. The reason startup brands are winning online is because they are entering the eCommerce game with an open and fresh perspective. Forcing old ways into eCommerce will surely lead to failure.

    I have worked with many brands that have developed eCommerce centers of excellence and have shared best practices on how to measure teams and success. The most painful to deal with were the organizations that brought their bricks-and-mortar measurements into the eCommerce world. The data used to measure success was the wrong data. The KPIs were set in a way that people would surely fail.

    In my opinion, the best measurements for success are sales growth (not share growth), digital shelf KPIs (search and content first), and a subjective measure on maturity in the industry. The best first step is to have someone lead the team who understands how to measure success and execute in a cutting-edge and evolving environment.

    3. “We sign up with either too many or the wrong service providers”

    The final observation is one that is costing many teams a lot of money. Many brands start to move into eCommerce based on their old team structures. Each team has a separate eCommerce objective, budget, and set of tools to execute with.

    Then, when the centralized eCommerce team (Center of Excellence) gets established, they will likely find many teams working with many tools. Sometimes, they see many teams signed up, via separate contracts, with the same tool. Worse still – it’s often the wrong type of tool.

    As brands evaluate tools, they need to ask questions such as:

    • Does this vendor provide global coverage, so that we can establish a global way of thinking and executing (with the ability to customize for local consumption when required)?
    • Does this vendor have the backbone (people and technology) to scale with my business?
    • (The best question, in my opinion) Does this vendor have people who are willing to listen and understand my business, or are they simply people who want to sell me a cookie-cutter solution?

    In my experience, I have seen brands spending way too much time, effort, and money on vendors who do not check the boxes listed above.

    Summing up…

    As I look back over my time serving brands in the eCommerce analytics space, I have seen an industry morph and transform time and time again. I have seen companies shift, re-shift, panic and pivot.

    If you’re a brand, my encouragement to your team is to hit the pause button. Ask the right questions. Evaluate your goals, your team structure, and your vendor partners. If the strategy, execution, people, and measurement, are not aligned, come up with a plan to get them back on track. Be willing to learn a new way to do business.

    Pause. Reset. Measure.

  • Flaunt Your Deep-Tech Prowess at Bootstrap Paradox Hackathon Hosted by Blume Ventures

    Flaunt Your Deep-Tech Prowess at Bootstrap Paradox Hackathon Hosted by Blume Ventures

    When DataWeave was founded in 2011, we set out to democratize data by enabling businesses to leverage public Web data to solve mission-critical business problems. Eight years on, we have done just that, and grown to deliver AI-powered competitive intelligence and digital shelf analytics to several global retailers and brands, which include the likes of Adidas, QVC, Overstock, Sauder, Dorel, and more.

    As the company has grown, so has our team, which is now 140+ members strong. We’re still constantly on the lookout for smart, open, and driven folks to join us and contribute to our success.

    And so, we’re excited to partner with Skillenza and Blume Ventures to co-host the Bootstrap Paradox Hackathon, where we are eager to engage with the developer community and contribute in our own way back to the startup ecosystem.

    The event will be conducted as an offline product building competition, with a duration of 24 hours on August 3-4, 2019 at the Microsoft India office in Bengaluru. It will provide a platform for developers and coders to interact with and solve challenges thrown up by DataWeave and other Blume portfolio companies, such as Dunzo, Unacademy, Milkbasket, Mechmocha, and Locus.


    Taking up DataWeave’s challenge during this Hackathon will give you a sneak peek into what our team works on daily. It’s no surprise that we have “At DataWeave, it’s a Hackathon every day!” plastered on our walls. After all, it’s not just all about intense work, but also a lot of fun and frolic.

    The problems that we deal with are as exciting as they are hard. Some of our key accomplishments in technology include:

    • Matching products across e-commerce websites at massive scale and at high levels of accuracy and coverage
    • Using Computer Vision to detect product attributes in fashion such as a color, sleeve length, collar type, etc. by analyzing catalog images
    • Aggregating data from complex web environments, including mobile apps, and across 25+ international languages

    One of our more recent innovations has been in optimizing e-commerce product discovery engines, which dramatically improves shopper experience and purchase conversion rates. During the Bootstrap Paradox Hackathon, coders will get a chance to build a similar engine, with guidance and assistance from DataWeave’s technology leaders.

    Data sets containing product information like title, description, image URL, price, category etc. will be provided, and coders will need to clean up the data, extract information on relevant product attributes and features, and index them, in the process of building the product discovery engine.

    For more details on the challenge, register here on the Skillenza platform.

    As a sweetener, the event also promises everyone a chance to win over 10 lakhs in prize money.

    Simply put, if you love code, this is the place to be this weekend. See you there!

  • Prime Day 2019 Fashion: Were the Deals as Attractive as the Merchandise?

    Prime Day 2019 Fashion: Were the Deals as Attractive as the Merchandise?

    Target and Walmart offered more appealing discounts than Amazon during Prime Day 2019.

    Statista estimates that e-commerce fashion accounted for approximately 20.4% of overall fashion retail sales in the United States in 2018, which amounted to about $103 billion in absolute terms. According to Internet Retailer, apparel is the largest and among the most competitive retail categories in e-commerce. Moreover, as a share of total apparel and accessories sales, online apparel sales is growing at a faster rate than US e-commerce as a whole.

    Given the high-growth and competitive nature of the category, we at DataWeave were interested to find out how high the stakes got during the fifth annual Prime Day earlier this month.

    Our Methodology

    Since Prime Day is no longer necessarily an Amazon event (since competing websites often offer attractive discounts as well), we tracked the pricing of several leading retailers selling fashion apparel, footwear, and accessories to assess their pricing and product strategies during the sale event. Our analysis was focused on additional discounts offered during the sale to estimate the true value that the sale represented to its customers. We calculated this by comparing product prices on Prime Day versus the same prices prior to the sale.

    Our sample consisted of 20 product types across women’s as well as men’s fashion categories. While we did monitor exclusive fashion retailers Macy’s, Bloomingdales, Nordstrom, and Neiman Marcus, we did not find them offering any additional discounts – an interesting insight all on its own since they’ve clearly chosen not to compete with Amazon during the two days of the Prime Day sale. We therefore restricted the rest of our study to Amazon, Target, and Walmart – the latter two of which interestingly offered immensely aggressive discounts in their apparel categories.

    The Verdict

    Despite owning the day at least in name, Amazon was found to offer the lowest additional discounts among the retailers studied. Target and Walmart, on the other hand, ensured that they didn’t lose out on market share this Prime Day by offering substantially high discounts of their own. While Target was the most aggressive with a steep average markdown of 26.5%, Amazon closed out the bottom at 8.4%.

    Walmart and Target didn’t seem particularly focused on compensating their sharp discounts with price increases in other products – their focus seems to have been solely only on offering timely discounts during the sale. Amazon, on the other hand, marked up just about as many products as it marked down, with the markup margin being close to double that of the markdown in an effort to protect margins during the sale.

    Top product types by additional discount

    Target and Walmart both offered aggressive discounts across their top product categories. Walmart ended up with a marginally higher overall average additional discounts on product types like Shirts, T-shirts, and Tops.

    Interestingly, though Amazon offered moderate discounts across its top categories (Lingerie, Swimwear, and Underwear), the volume of marked down products was very limited.

    Additional discounts across popularity levels

    We determined popularity using a combination of average review rating and number of reviews, and the resulting scores were categorized as low, moderate, and high.

    When it came to discounting popular products, there were clear differences in strategy among all the three retailers. Amazon, which interestingly had close to 60% of its products in the low popularity bucket, chose to offer the highest discounts in the same category – indicating an effort to clear its stock of unpopular products. Target and Walmart, on the other hand, focused their discounts on moderate rated products.

    Additional discounts across product “premiumness” levels

    Premiumness was calculated as the average selling price before the sale event. This was divided into four percentile blocks, with higher percentile blocks indicating higher selling prices.

    As found in the electronics and furniture categories that were analyzed previously, most of the discounting activity was focused on the lower end of the premium spectrum with a view to protect margin – despite a largely equitable distribution of discounted products across percentile ranges (with the exception of Target, which had a discounted assortment heavily dominated by its least premium products).

    This indicates a clear strategy to protect margins, while still maintaining the perception of promoting attractive offers to draw traffic. Target and Walmart both offered substantial additional discounts of close to 30% on their least premium products, while at 12%, Amazon offered less than half that discount.

    Additional discounts across visibility levels

    Given the fairly large number of SKUs across the fashion category in general, the discounts across visibility levels understandably didn’t vary much when compared to the more pronounced fluctuations observed in the electronics and furniture categories. This is also largely because consumers tend to explore lower ranked products more so in the fashion category than in other categories.

    Across product categories, we’re seeing lower-than-expected additional discounts on Amazon this Prime Day, coupled with more aggressive pricing activity by Amazon’s competitors. While this puts more pressure on Amazon, this also is a strong validation of Prime Day as a key annual sale event on the US shopper’s calendar.

    Curious to know how Amazon and its competitors performed in other product categories this Prime Day? Watch this space for more!