After demonetization, Covid-19 has probably been one of the worst scenarios for the retail sector in India. The entire nation went into lockdown and the industry noticed some big changes around the entire globe. From remote working to shopping, everything turned to digital and Bharat witnessed new trends across payments, e-commerce, and more.
Not surprisingly, D2C has been a favorite amongst businesses thanks to its agility. More than 800 brands have joined the direct-to-consumer bandwagon in order to reach their audience quickly and in an efficient way. Where brands such as MamaEarth, Clovia, Bewakoof, Lenskart have been some of the popular brands in the sector, last year even traditional giants such as LG, Ajanta-Orpat, Piaggio, Havells also adopted the D2C model.
Brands are more focused on making the user experience better and it will be safe to say that this year, D2C will be the highlight of the e-tail ecosystem. Naturally, e-commerce giants such as Amazon, Flipkart have played an important role in this revolution. Amazon, which has over 100 Million registered users in India, announced that it will host its flagship event, Prime Day this year on 26-27 July.
Let’s look at some of the things brands can do to leave their mark this Prime Day in India.
Given that the pandemic has accelerated online shopping nationwide, Digital Shelf Optimisation (DSO) should be the key lever for any brand to accelerate its digital commerce growth. Events such as Prime day are significant for a brand’s reputation, customer experience, overall sales and can help you build a loyal customer base.
With that in mind, we have prepared a list of things to consider, in order to help brands stand out from the crowd.
Pricing and Discounting: Offer discounts and deals to attract customers.
It is obvious that Prime Day will see a tremendous influx of shoppers. Noticeably, impulsive shopping is a trend during these sales, as everybody loves a good product for a discounted price. Make sure to offer discounts and deals to attract customers.
Another suggestion is to keep a track of competition, their pricing and promotional strategies and keep an eye on price changes happening across relevant categories or SKU’s (Stock Keeping Unit). Competition analysis is a powerful tool and having accurate data on their sales, market share is a critical part of this.
Product Visibility: Lakhs of sellers & brands are vying for the same spot
Marketplaces are crowded, and getting discovered is already hard. Lakhs of sellers & brands are vying for the same spot. And with more people moving online, it’s going to get increasingly harder for brands to stand out. Optimize your search visibility using the right keywords relevant to your brand, strategically spend on Sponsored Ads to secure high visibility placements on Amazon and lastly make sure your online product packaging via product pages contain attractive images to position your product in the best light.
Product Availability: Have plenty of stock available
Make sure to have plenty of stock available as shoppers are likely to turn to other brands/products in case your product is unavailable. Also, keep in mind that people are generally more open to trying new products during a sale as it offers discounts. Track your products’ stock status to make sure they’re available 24 x 7.
As the foremost goal during sales is to move inventory as much as possible, offering a large assortment is a good idea. Create product bundles that complement each other.
A+ Content is King: The new age packaging for your product
Content is the new age packaging for your product. Content is crucial to change consumer shortlists & considerations into conversions.
Your content tells your product story & gives customers the information they need to make a purchase. Use high resolution and accurate images, add features, benefits, USPs of your products clearly. It is advisable to use more than one image to show your product more clearly. Make sure all your brand & product pages on Amazon are optimized.
Reviews and Ratings: Feedback is a very important e-commerce tool.
Why would shoppers rely on word-of-mouth when they can take help from millions of people from the community? Not said enough, feedback is a very important e-commerce tool. Amazon’s A9 algorithm presents the choices to the consumers but reviews and star ratings still play an influential role in the journey from consideration to conversion.
Brands could consider partnering with Dataweave, to keep track of reviews and manage negative ratings on Amazon.
Summary
According to a report by EY-IVCA Trend Book 2021, “ The e-commerce industry in India is expected to reach $99 Bn by 2024 and penetration of retail is expected to be 10.7% by 2024, compared to 4.7% in 2019.”
Source: Statista
The same report also revealed that India will have 220 Million online shoppers by 2025. With e-commerce growing at an exponential rate, brands are advised to be more statistical & data-driven to win a larger % of online sales. If you think this is the right time to optimize your digital shelf, take a look at our products and services.
We at DataWeave would be happy to be a part of your e-commerce and digitization journey. You can sign up for a demo with our team to know more
As consumers socialize more this year, retailers around the world are competing for sales in the torrid health & beauty category.
That’s why we at DataWeave wanted to know how Prime Day 2021 discounts played a role in the pricing strategies for health & beauty products. We focused our analysis on how global retailers adapted their Prime Day pricing strategies to distinguish their offerings across seven health & beauty subcategories, including makeup, health care and baby care.
Our Methodology We tracked the pricing of products among 16 leading retailers in nine countries across five regions, including:
● The US (Amazon US, Sephora, Target, Ulta and Walmart) ● The UK (Amazon UK, Ebay, Etsy and OnBuy) ● Europe (Amazon France, Amazon Germany and Amazon Italy) ● The Middle East (Amazon Saudi Arabia and Amazon UAE) ● Asia (Amazon Japan and Amazon Singapore)
The results showed some surprising differences among retailers and regions. See how retailers used pricing as a competitive strategy to win Prime Day sales in the health & beauty category, as well as international health & beauty brands that stood out for the discounts on their products.
Percentage of items with a price decrease
The US retailer with the overall highest percentage of health & beauty products with a price decrease for Prime Day was Amazon US (23.9%).
Health & beauty subcategories with the highest percentage of items with a price decrease per US retailer were:
● Amazon US: Fragrance (32.4%), oral care (27.1%) and skin care (22.7%) ● Sephora: Makeup (0.2%) ● Target: Oral care (2.7%), baby care (1.6%) and hair care (0.8%) ● Ulta: Makeup (3.7%), skin care (0.8%) and hair care (0.1%) ● Walmart: Fragrance (35.3%), hair care (27.0%) and skin care (23.1%)
By far, the UK retailer with the overall highest percentage of items with a price decrease for Prime Day was Amazon UK (41.9%).
Health & beauty subcategories with the highest percentage of items with a price decrease per UK retailer were:
● Amazon UK: Oral care (62.5%), fragrance (46.2%) and hair care and skin care (both 45.4%) ● Ebay: Makeup (8.1%), fragrance (7.1%) and skin care (4.7%) ● Etsy: Oral care (3.4%), skin care (2.3%) and makeup (0.9%)
In Europe, Amazon Germany had the overall highest percentage of items with a price decrease for Prime Day (33.1%).
Health & beauty subcategories with the highest percentage of items with a price decrease per European retailer were:
● Amazon France: Skin care (27.2%), fragrance (25.0%) and hair care (24.4%) ● Amazon Germany: Skin care (49.7%), fragrance (41.3%) and hair care (37.2%) ● Amazon Italy: Skin care (5.9%)
Across the Middle East & Asia, Amazon UAE had the overall highest percentage of health & beauty items with a price decrease for Prime Day (54.1%).
Health & beauty subcategories with the highest percentage of items with a price decrease per retailer were:
● Amazon Saudi Arabia: Health care (56.4%), hair care (48.8%) and fragrance (46.2%) ● Amazon UAE: Skin care (64.3%), fragrance (64.0%), and hair care (58.4%) ● Amazon Japan: Oral care (5.3%), skin care (4.5%) and makeup (3.3%) ● Amazon Singapore: Baby care and health care (both 35.6%), makeup (32.6%) and fragrance (31.3%)
Magnitude of price decrease
The US retailer with the greatest overall magnitude of price decrease for Prime Day was Ulta (33.3%).
The health & beauty subcategories with the greatest magnitude of price decrease per US retailer were:
● Amazon US: Hair care (18.0%), baby care (15.5%) and health care (15.4%) ● Sephora: Makeup (24.5%) ● Target: Hair care (46.6%), oral care (28.4%) and skin care and baby care (both 15.0%) ● Ulta: Hair care (40.8%), skin care (34.0%) and makeup (32.5%) ● Walmart: Baby care (11.5%), skin care (11.3%) and hair care (11.0%)
Brands with the greatest magnitude of price decreases per US retailer included:
● Amazon US: Cerave (54.5%), Aquaphor (54.4%) and Yankee Candle (50.7%) ● Sephora: Nars (25.9%) and Marc Jacobs Beauty (23.1%) ● Target: Kristin Ess (50.0%), Hot Tools (48.6%) and Arc Oral Care (both 40.1%) ● Ulta: KKW Beauty, Lime Crime, Ulta and NYX Professional Makeup (all 50.0%), CoverGirl (47.8%) and Biolage (40.8%) ● Walmart: Whitening Toothpaste (57.6%), Absolute New York (56.7%) and Zdmathe (48.5%)
The UK retailer with the greatest overall magnitude of price decrease on health & beauty products for Prime Day was Amazon UK (18.6%).
The health & beauty subcategories with the greatest magnitude of price decrease per UK retailer were:
● Amazon UK: Oral care (23.5%), makeup (22.0%) and skin care (20.2%) ● Ebay: Hair care (16.0%), fragrance (14.4%) and makeup (11.5%) ● Etsy: Makeup (20.0%), oral care (16.1%) and skin care (13.3%)
Brands with the greatest magnitude of price decreases across health & beauty sub-categories per UK retailer included:
● Amazon UK: Philips Sonicair (56.8%), BaByliss For Men (53.0%) and Dr. PawPaw (52.9%) ● Ebay: Oral-B Braun (50.3%), Clean (50.1%) and Versace (46.0%) ● Etsy: Valdenize (both 48.4%), Allure Wedding Jewelry (32.8%) and Moroccan White (30.0%)
Among European retailers, Amazon Germany offered the greatest overall magnitude of price decrease on health & beauty products for Prime Day (20.2%).
The health & beauty subcategories with the greatest magnitude of price decrease per European retailer were:
● Amazon France: Skin care (20.4%), baby care (17.8%) and makeup (16.2%) ● Amazon Germany: Skin care (28.2%), makeup (22.6%) and health care (21.3%) ● Amazon Italy: Skin care (9.9%)
Brands with the greatest magnitude of price decreases per European retailer included:
● Amazon France: Look Concept (59.8%), Douyao (57.5%) and Eco Styler (57.4% for both hair care and health care) ● Amazon Germany: Le Cuisinier (58.4%), Beurer (47.5%) and Solida (45.9%) ● Amazon Italy: Bezox (9.9%)
Across the Middle East and Asia, Amazon Japan offered the greatest overall magnitude of price decrease on health & beauty products for Prime Day (18.0%).
The health & beauty subcategories with the greatest magnitude of price decrease per retailer were:
● Amazon Saudi Arabia: Health care (25.1%), skin care (19.3%) and baby care (16.5%) ● Amazon UAE: Makeup (23.1%), hair care (18.3%) and baby care (18.1%) ● Amazon Japan: Skin care (27.6%), hair care (17.2%) and makeup (14.7%) ● Amazon Singapore: Skin care (10.1%), hair care (8.9%) and health care (8.2%)
Brands with the greatest magnitude of price decreases per retailer in the Middle East and Asia included:
● Amazon Saudi Arabia: Tide (59.8%), bblüv (58.3%) and Mas (55.0%) ● Amazon UAE: Syoss (59.7%), Vertex (59.1%) and Onesea (58.7%) ● Amazon Japan: ドクターブロナー (Dr. Bronner’s) (54.8%), ゼルマ (Zelma) (50.0%) and いち髪 (47.8%) ● Amazon Singapore: Changing Lifestyles (56.6%), Dynarex (53.0%) and Grohe (52.5%)
Discounts before, during and after the event
In the US, specialty beauty retailers’ discounts stood out during Prime Day sales. The US retailer with the biggest overall health & beauty discount before (43.4%), during (39.3%) and after (39.4%) Prime Day was Ulta. During and after Prime Day, Sephora was a close second at 38.2% for both periods.
Ulta’s biggest pre-event discounts were on makeup (44.2%) and skin care (33.0%). Hair care (40.8%). makeup (39.5%) and skin care (36.0%) were the leading subcategories for Ulta’s discounts during Prime Day. After the event, Ulta’s biggest discounts were for hair care (40.8%), makeup (39.6%) and skin care (37.3%)
In the UK, OnBuy offered the highest discounts before, during and after Prime Day at 70.0% off baby care products. Yet the total product count was only 2.
Among the remaining rivals, all of whom had a product count above 1000, Ebay had the highest discounts before (30.8%), during (33.8%) and after (35.0%) Prime Day.
Before Prime Day, Ebay biggest discounts were on hair care (48.9%), fragrance (23.9%) and makeup (23.4%). Ebay’s top discounts during Prime Day were on hair care (50.3%), makeup (24.9%) and fragrance (24.8%). Similarly, after the event, Ebay had the biggest discounts on hair care (49.9%), makeup (26.7%) and fragrance (26.2%).
Across retailers in the Middle East & Asia, Amazon UAE offered the biggest overall health & beauty discounts before (26.0%), during (30.7%) and after (26.0%) Prime Day.
In the pre-sales event, Amazon UAE offered the most generous discounts on makeup (30.7%), fragrance (29.9%) and health care (29.2%).
During Prime Day, Amazon UAE’s biggest discounts were on makeup (37.2%), fragrance (31.6%) and health care (31.3%).
During Prime Day, Amazon UAE offered the biggest discounts on fragrance (30.5%), makeup (30.0%) and health care and baby care (both 26.8%).
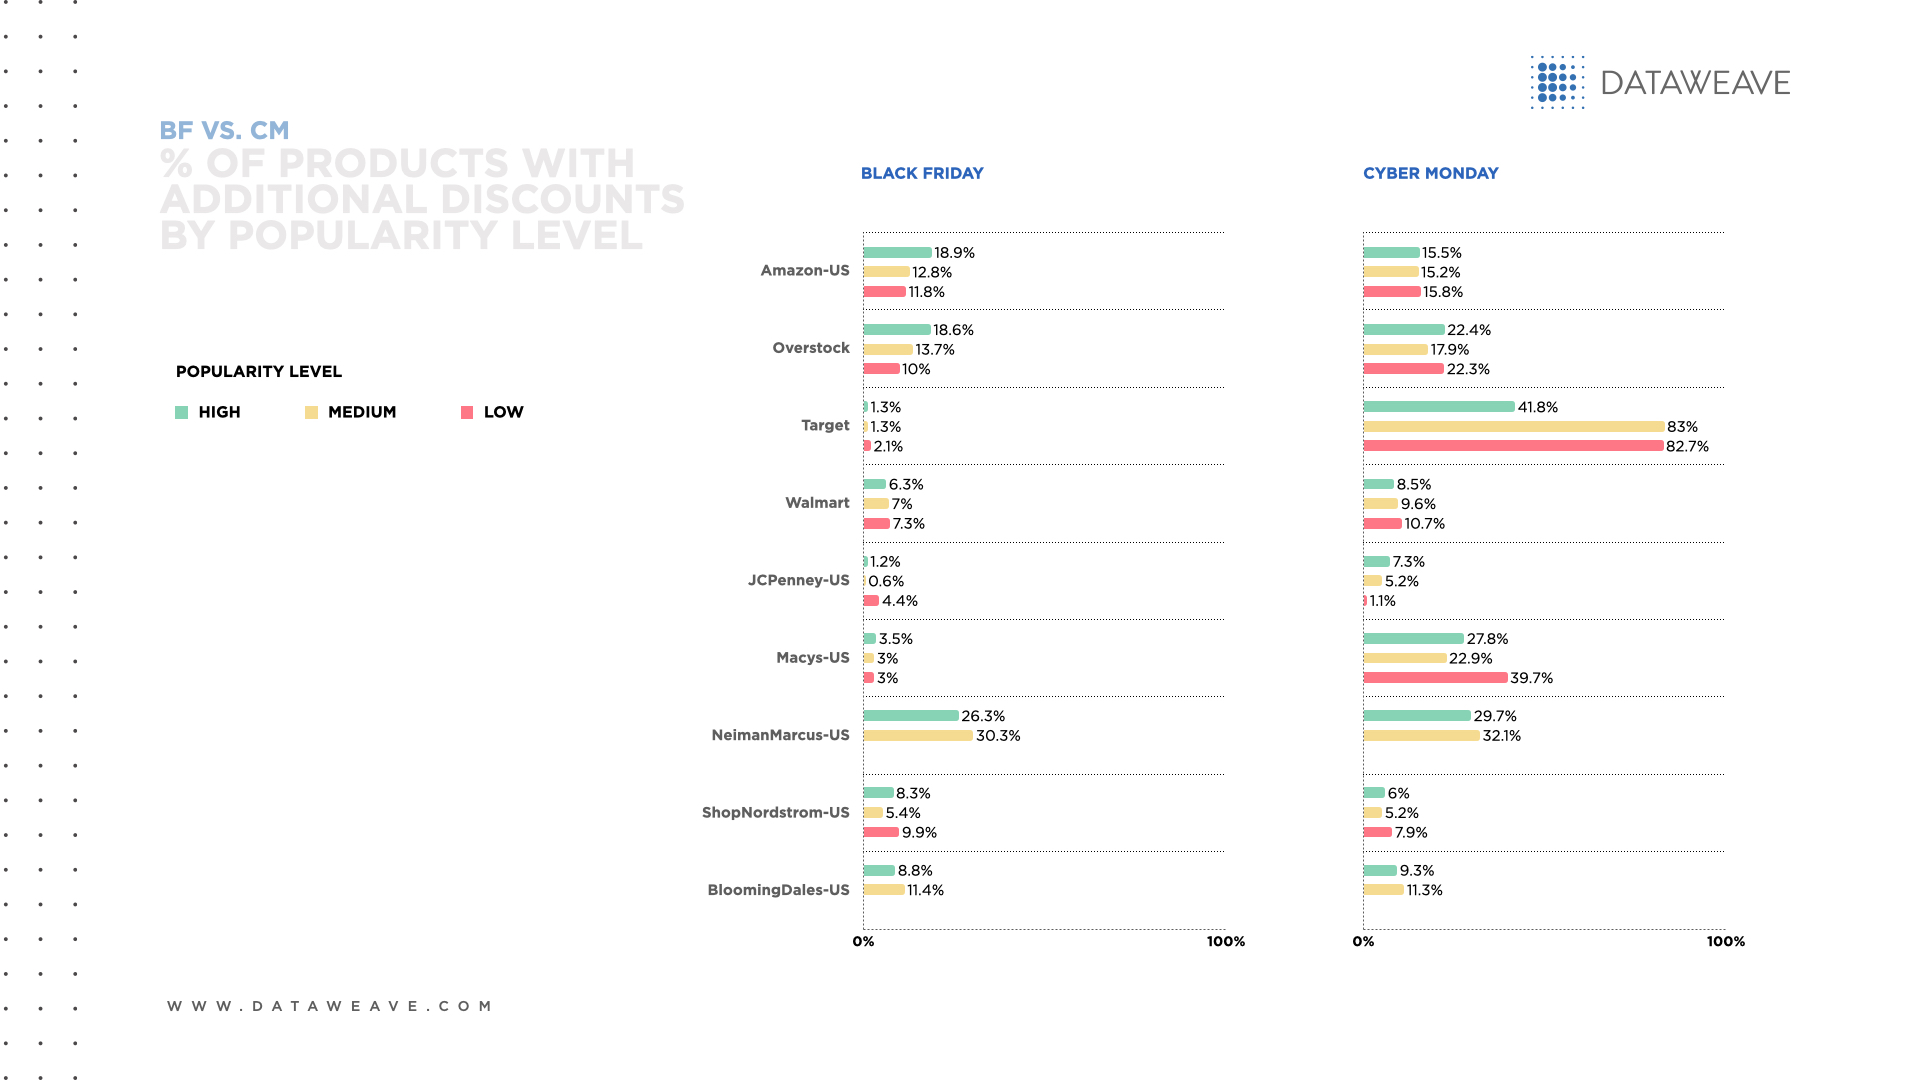
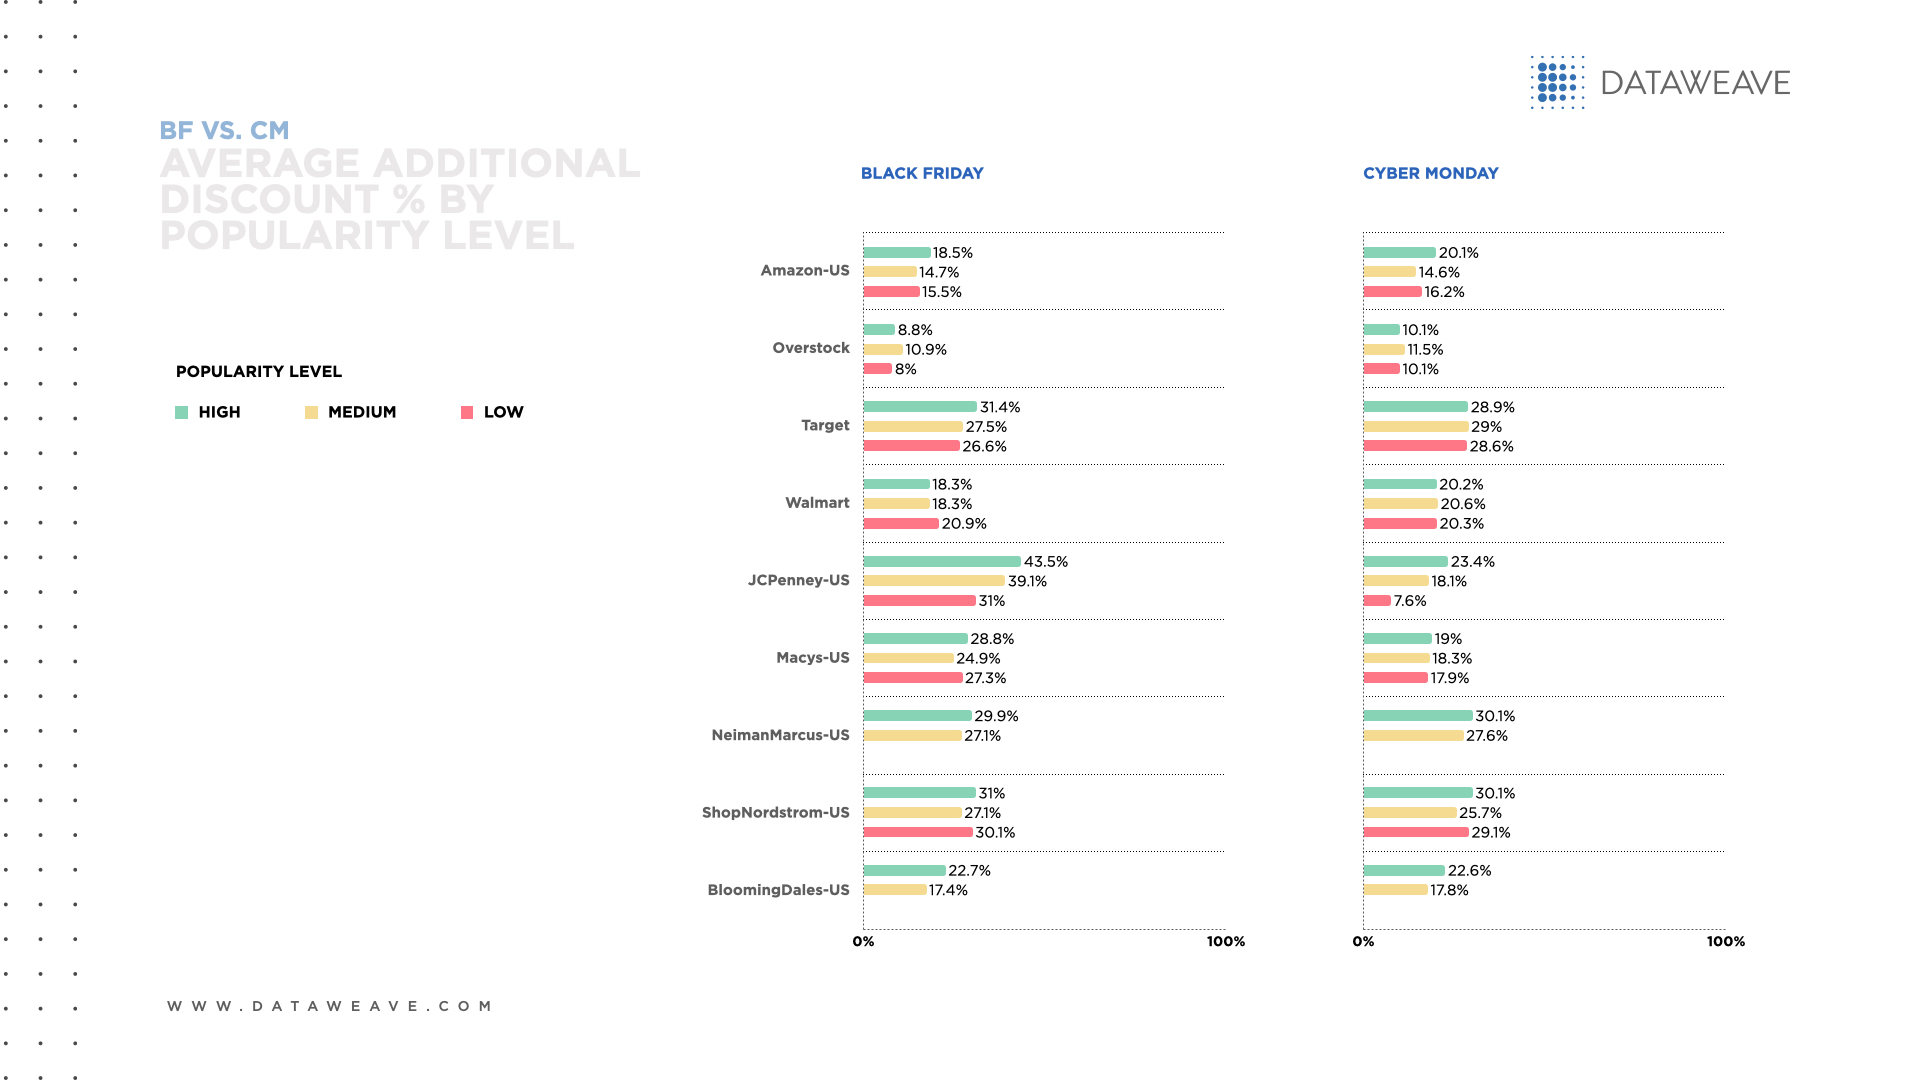
Popularity
In the US, among health & beauty products with high popularity, Amazon US offered the highest percentage of items with a price decrease (24.3%) and Target offered the greatest magnitude of price decrease (29.3%).
For health & beauty items with medium popularity, Amazon US offered the highest percentage of items with a price decrease (26.0%), and strategic partners Target and Ulta both offered the greatest magnitude of price decrease (33.4%).
Among health & beauty merchandise with low popularity, Walmart offered the highest percentage of items with a price decrease (18.5%) and Ulta offered the greatest magnitude of price decrease (37.4%).
Amazon UK stood out among all levels of health & beauty product popularity.
In the UK, among health & beauty products with high popularity, Amazon UK offered both the highest percentage of items with a price decrease (42.8%) and the greatest magnitude of price decrease (18.6%).
For health & beauty items with medium popularity, Amazon UK offered the highest percentage of items with a price decrease (42.8%) and Etsy offered the greatest magnitude of price decrease (20.1%).
Among health & beauty merchandise with low popularity, Amazon UK offered both the highest percentage of items with a price decrease (35.4%) and the greatest magnitude of price decrease (17.6%).
In Europe, Amazon Germany dominated discounts for health & beauty products across all levels of popularity.
Among health & beauty goods with high popularity, Amazon Germany offered both the highest overall percentage of items with a price decrease (34.6%) and the greatest overall magnitude of price decrease (20.6%).
For health & beauty items with medium popularity, Amazon Germany offered both the highest percentage of items with a price decrease (32.7%) and the greatest magnitude of price decrease (20.0%).
Among health & beauty merchandise with low popularity, Amazon Germany offered the highest percentage of items with a price decrease (33.5%) and the greatest magnitude of price decrease (20.6%).
In Middle East & Asia, among health & beauty items with high popularity, Amazon UAE offered the highest overall percentage of items with a price decrease (53.0%) and Amazon Saudi Arabia had the greatest overall magnitude of price decrease (18.7%).
For health & beauty products with medium popularity, Amazon UAE offered the highest overall percentage of items with a price decrease (55.3%) and Amazon Saudi Arabia had the greatest overall magnitude of price decrease (19.7%).
Among health & beauty goods with low popularity, Amazon UAE offered the highest percentage of items with a price decrease (54.5%) and Amazon Japan had the greatest magnitude of price decrease (18.7%).
Health & beauty’s stunning Prime Day deals
Overall, Prime Day 2021 gave shoppers around the world the opportunity to score generous discounts on health & beauty products.
According to our analysis, the retailers whose Prime Day pricing stood out the most were Amazon US and Ulta in the US, Amazon UK and Ebay in the UK, Amazon Germany in Europe, Amazon UAE in the Middle East and Amazon Japan in Asia.
Stay tuned for Prime Day 2021 international fashion and home goods pricing insights.
Amazon’s Prime Day 2021 global shopping event took place June 21 and 22, 2021 and smashed previous sales records. At DataWeave, we wanted to know how Prime Day 2021 deals and discounts on electronics compared across retailers and regions. We focused on how retailers adapted their Prime Day pricing strategies to stand out in the competitive consumer electronics category.
Our Methodology We tracked the pricing of several leading retailers in nine countries across five regions, including:
• The US (Amazon US, Best Buy, Target and Walmart) • The UK (Amazon UK, Ebay, Etsy and OnBuy) • Europe (Amazon France, Amazon Germany and Amazon Italy) • The Middle East (Amazon Saudi Arabia and Amazon UAE) • Asia (Amazon Japan and Amazon Singapore)
Let’s see how retailers used pricing tactics to gain a competitive advantage during Prime Day, as well as which electronics brands had the highest discounts around the world.
Percentage of items with a price decrease
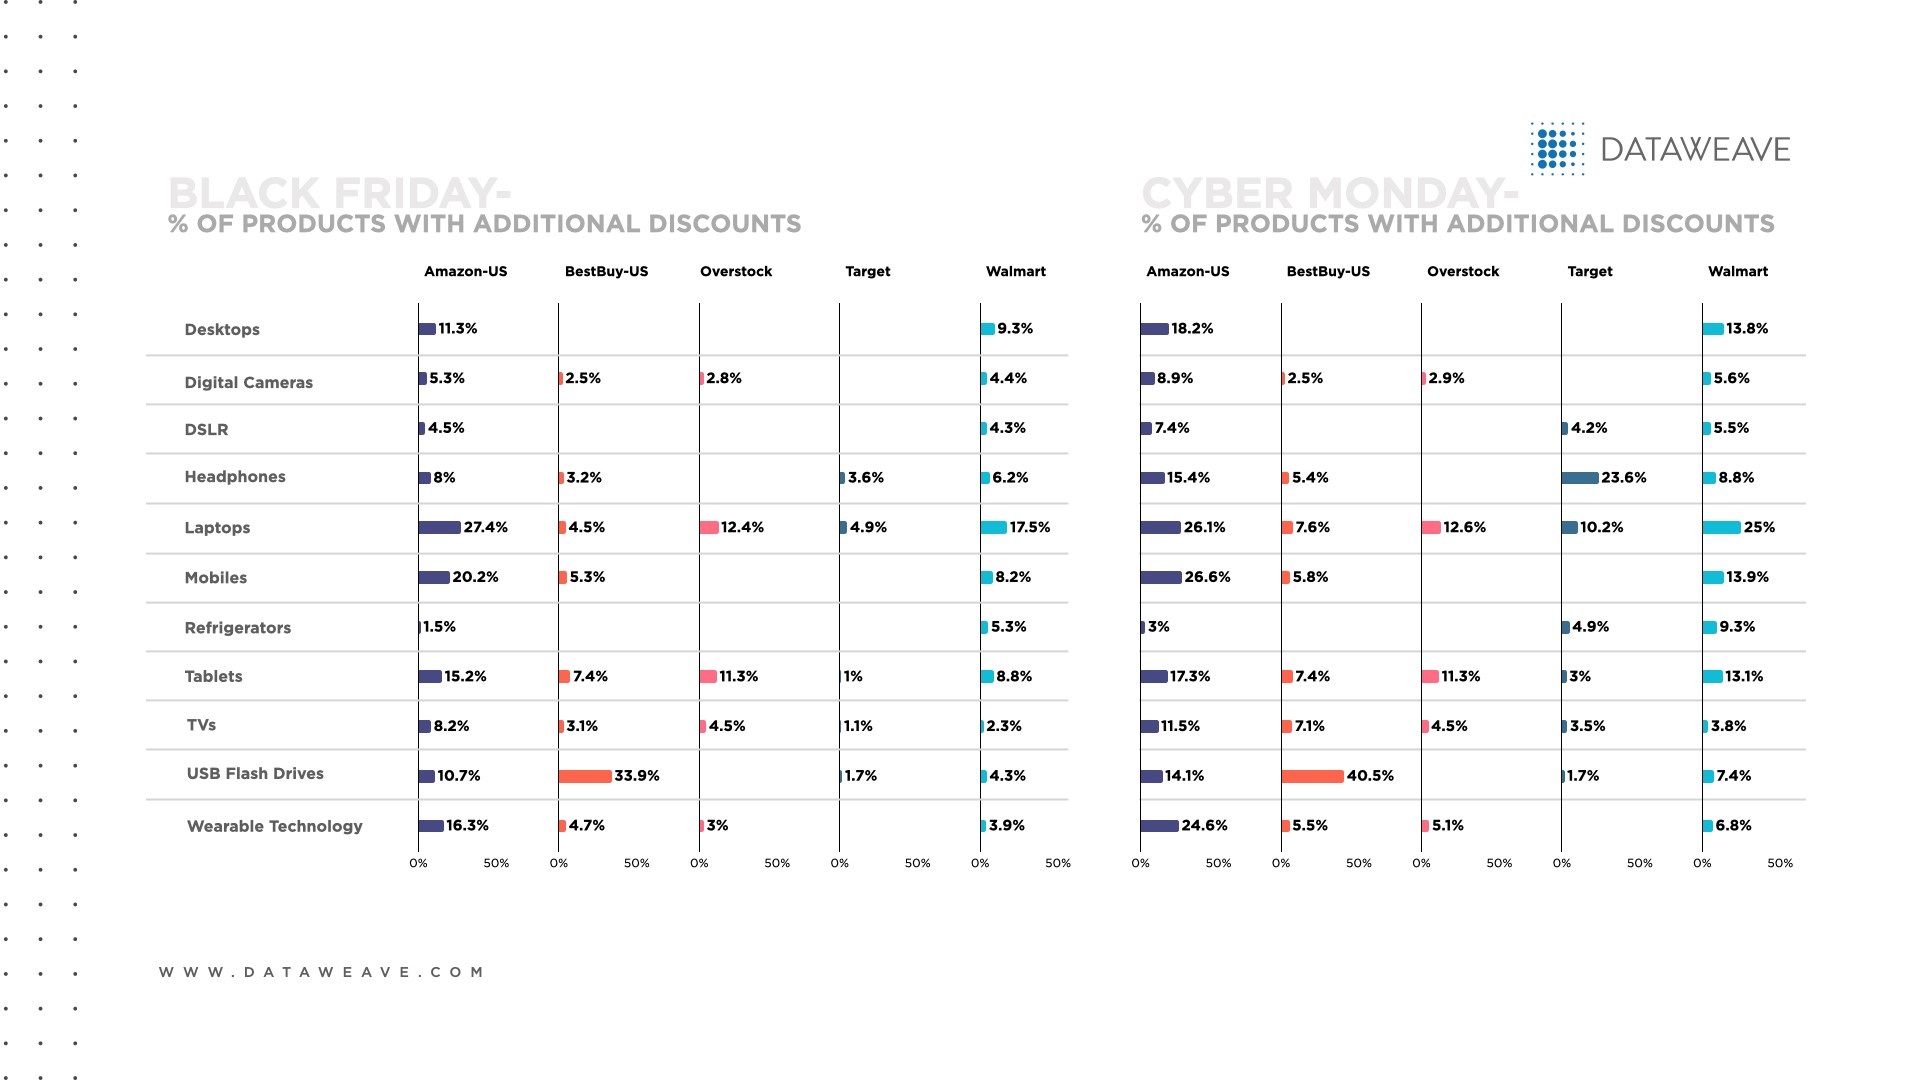
The US retailer with the overall highest percentage of items with a price decrease for Prime Day was Amazon US (26.3%).
Electronics subcategories with the highest percentage of items with a price decrease per US retailer were:
• Amazon US: Headphones (36.3%), video games and electronics (both 35.8%) and cameras (35.7%) • Best Buy: Wearables (10.1%) and electronics (6.8%) • Target: Electronics (21.4%), Bluetooth & wireless speakers (19.4%) and tech accessories (14.8%) • Walmart: Cell phones & accessories (25.8%), TV & video (14.9%) and cameras (9.4%)
The UK retailer with the overall highest percentage of items with a price decrease for Prime Day was Amazon UK (30.4%), closely followed by OnBuy (30.0%). Of note, Amazon UK offered price increases on 10 times as many products as OnBuy (2379 vs. 237).
Electronics subcategories with the highest percentage of items with a price decrease per UK retailer were:
• Amazon UK: Electronics (53.2%), cameras (41.8%) and headphones (41.5%) • Ebay: TV & video (19.2%), computers & office (12.2%) and cell phones & accessories (7.5%) • Etsy: Electronics (1.4%) • OnBuy: Cell phones & accessories (35.5%) and wearables (4.8%)
In Europe, Amazon Germany had the overall highest percentage of items with a price decrease for Prime Day (28.9%).
Electronics subcategories with the highest percentage of items with a price decrease per European retailer were:
Across the Middle East & Asia, Amazon UAE had the overall highest percentage of items with a price decrease for Prime Day (36.1%).
Electronics subcategories with the highest percentage of items with a price decrease per retailer were:
• Amazon Saudi Arabia: Video games (47.8%), electronics (46.8%) and cell phones & accessories (41.2%) • Amazon UAE: Electronics (63.4%), tech accessories (60.3%) and cell phones & accessories (60.1%) • Amazon Japan: TV & video (14.9%), musical instruments (11.8%) and electronics (10.3%) • Amazon Singapore: Wearables (32.2%), car electronics (30.4%) and musical instruments (30.2%)
Magnitude of price decrease
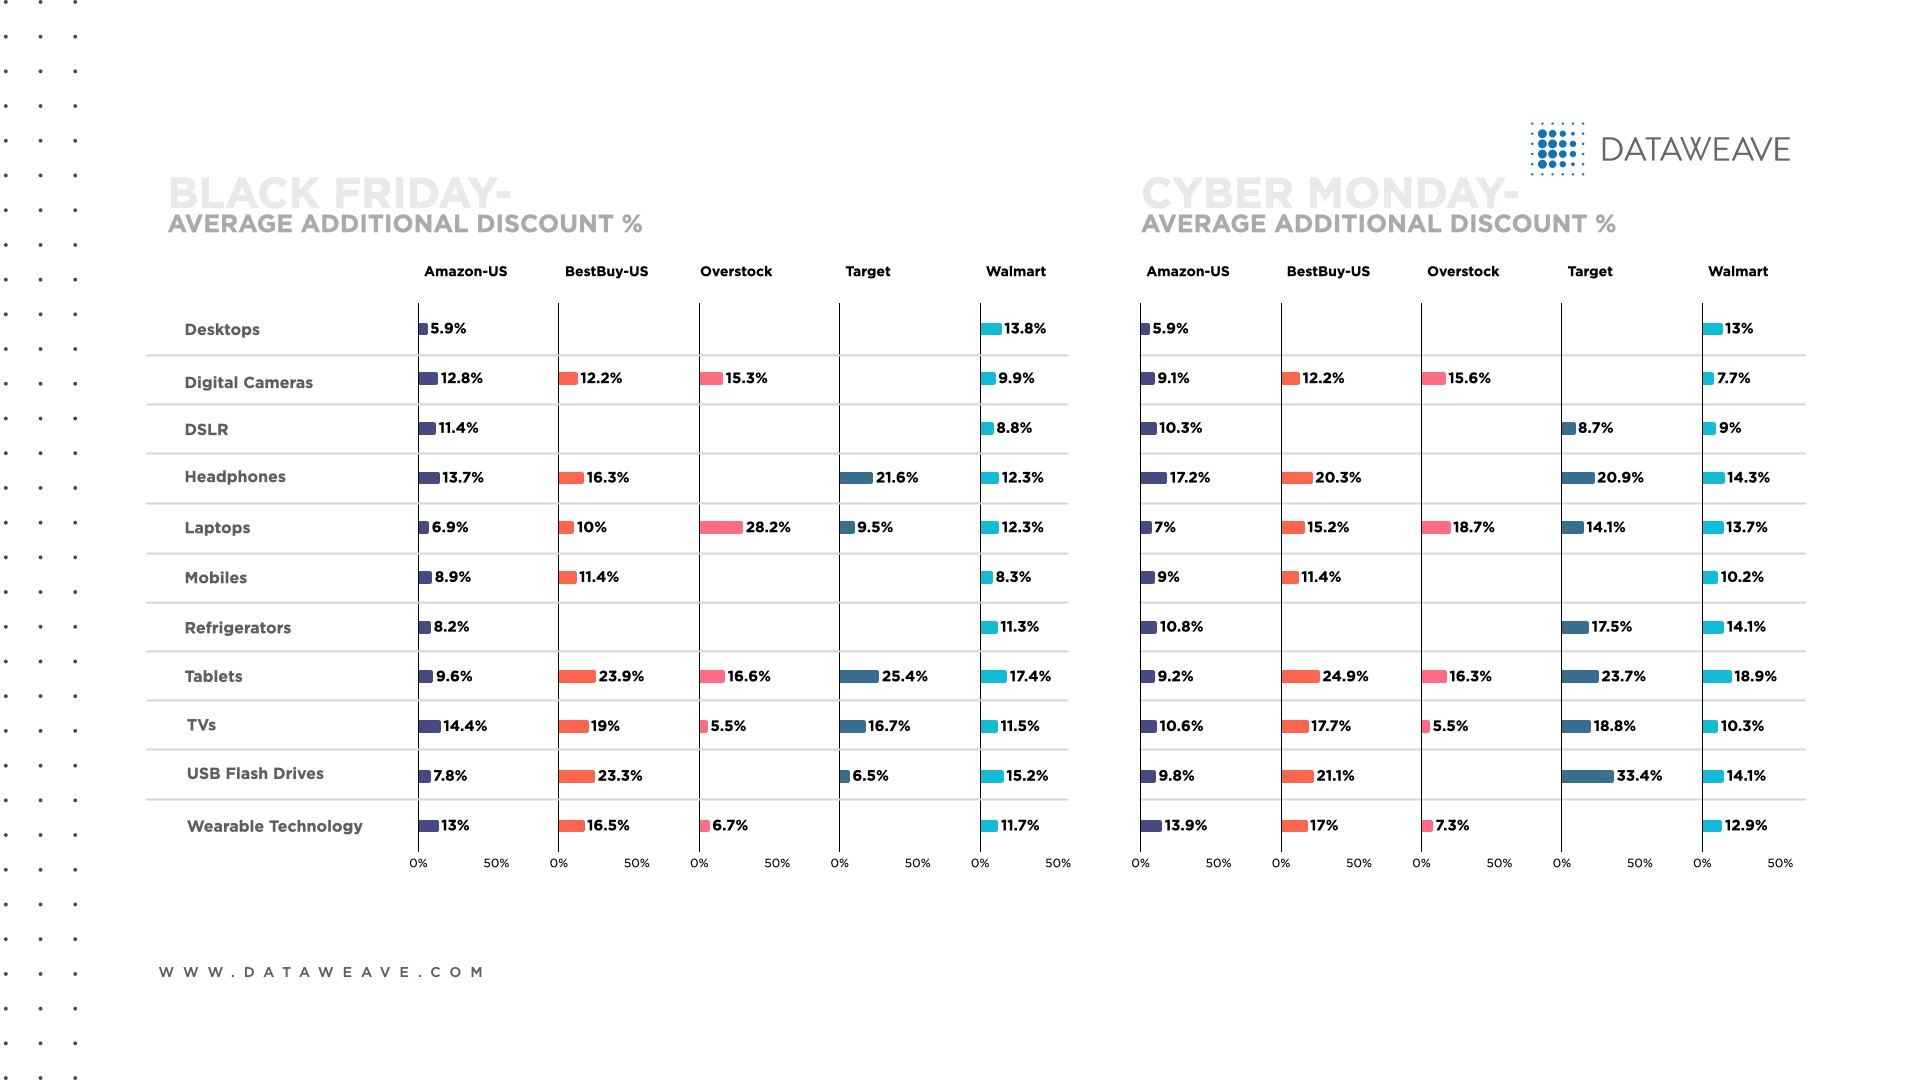
The US retailer with the greatest overall magnitude of price decrease for Prime Day was Target (18.6%).
The electronics subcategories with the greatest magnitude of price decrease per US retailer were:
• Amazon US: Cell phones & accessories (20.4%), electronics (20.1%) and headphones (18.7%) • Best Buy: Wearables (16.9%) and electronics (13.3%) • Target: Video games (27.9%), tech accessories (25.6%) and headphones (24.4%) • Walmart: TV & video (10.6%), computers & office (10.3%) and home audio & theater (10.1%)
Brands with the greatest magnitude of price decreases per US retailer included:
• Amazon US: JBL (57.2%), Hape (55.0%) and Falcon (52.8%) • Best Buy: Bower (40.0%), Vtech (36.7%) and Wingthings (30.0%) • Target: 2k Sports and 2K Games (both 56.7%), Little Tikes (50.0%) • Walmart: Moonlite (54.3%), Sceptre (45.9%) and Polaroid (38.5%)
The UK retailer with the greatest overall magnitude of price decrease for Prime Day was OnBuy (22.1%).
The electronics subcategories with the greatest magnitude of price decrease per UK retailer were:
• Amazon UK: Home audio & theater (28.4%), electronics (21.7%) and cell phones & accessories (20.1%) • Ebay: TV & video (19.5%), wearables (18.7%) and computer & office (16.6%) • Etsy: Electronics (14.8%) • OnBuy: Cell phones & accessories (22.3%) and wearables (5.9%)
Brands with the greatest magnitude of price decreases across electronics categories per UK retailer included:
• Amazon UK: Amazon (58.3% for both cell phones & accessories and headphones), Flexson (55.4%) and Ibra (47.9% for both cameras and TV & video) • Ebay: Falcon (52.0%), Ticwatch (48.4%) and Grougs by Live Lead (47.9%) • OnBuy: Sony (33.1%), Apple (23.1%) and Samsung (21.3%)
Among European retailers, Amazon Italy offered the greatest overall magnitude of price decrease for Prime Day (18.9%) among a total of 66 products.
The electronics subcategories with the greatest magnitude of price decrease per European retailer were:
• Amazon France: Home audio & theater (13.1%), video games (10.5%) and TV & video (10.3%) • Amazon Germany: Video games (22.0%), electronics and musical instruments (both 20.3%) and cell phones & accessories (20.2%) • Amazon Italy: Cell phones & accessories (41.2%) and headphones (28.1%)
Brands with the greatest magnitude of price decreases per European retailer included:
• Amazon France: DCSk (59.0%), Amazon Basics (58.7%) and Qoosea (46.3%) • Amazon Germany: Meister (53.5%), Rampow (51.4%) and Gewa (51.1%) • Amazon Italy: Homscam (41.2%) and Gamurry (15.1)
Across the Middle East and Asia, Amazon Japan offered the greatest overall magnitude of price decrease for Prime Day (11.9%) among a total of 66 products.
The electronics subcategories with the greatest magnitude of price decrease per retailer were:
• Amazon Saudi Arabia: Video games (16.8%), electronics (12.8%) and cell phones & accessories (12.4%) • Amazon UAE: Car electronics, headphones and tech accessories (all 13.1%) • Amazon Japan: Headphones (25.4%), home audio & theater (23.6%) and cameras (14.9%) • Amazon Singapore: Car electronics (9.4%), cell phones & accessories (8.6%) and electronics (8.3%)
Brands with the greatest magnitude of price decreases per retailer in the Middle East and Asia included:
• Amazon Saudi Arabia: Belkin (52.9%), Topoint (49.3%) and Promate (45.7%) • Amazon UAE: Amazon Basics (56.3%), Bettyliss (52.1%) and Acreate (50.3%) • Amazon Japan: タニタ(Tanita) (49.7%), Laza-Vally (47.8%) and Nebula (33.3%) • Amazon Singapore: Pintech Percussion (55.0%), Pac (53.4%) and Goldwood Sound Inc. (52.9%)
Discounts before, during and after the event
The US retailer with the biggest overall electronics discount before Prime Day was Amazon US (26.6%). Amazon’s biggest discounts were on home audio & theater (30.5%), TV & video (29.1%) and cell phones & accessories (28.6%).
Walmart offered the biggest discounts during (32.1%) and after (31.5%) the event. During the event, Walmart’s biggest discounts were on cell phones & accessories (46.3%), home audio & theater (35.5%) and computers & office (31.0%). Similarly, after the event, Walmart’s biggest discounts were on cell phones & accessories (45.8%), home audio & theater (35.3%) and computers & office (30.8%).
OnBuy was the UK retailer with the biggest overall electronics discount before (65.3%), during (68.6%) and after (69.1%) Prime Day with a product count of 237. OnBuy’s biggest discounts were on cameras (69.5% before, during and after the sales event), cell phones & accessories (rising from 67.6% before the sales event to 71.6% during and 71.8% after the event) and wearables (65.2% before and after the event yet 35.5% during Prime Day).
In Europe, Amazon Germany offered the biggest overall electronics discount before (21.4%), during (25.6%) and after (20.2%) Prime Day. Amazon France and Amazon Italy also offered comparable overall discounts (21.1%) before Prime Day.
In the pre-sales event, Amazon Germany gave the most generous discounts on cameras (34.1%), wearables (24.7%) and headphones (24.3%). During Prime Day, Amazon Germany offered the biggest discounts on video games (30.7%), headphones (30.1%) and electronics (28.3%). After Prime Day, Amazon Germany offered the biggest discounts on headphones (24.2%) electronics (22.6%) and cell phones & accessories (22.1%).
Across retailers in the Middle East & Asia, Amazon UAE offered the biggest overall electronics discount before Prime Day (24.3%), whereas Amazon Japan offered the biggest discount during (32.0%) and after (32.3%) Prime Day.
In the pre-sales event, Amazon UAE offered the most generous discounts on TV & video (31.3%), musical instruments (31.0%) and headphones (25.4%). During and after Prime Day, Amazon Japan offered the biggest discounts on Bluetooth & wireless speakers and electronics (both 99.0%).
Popularity
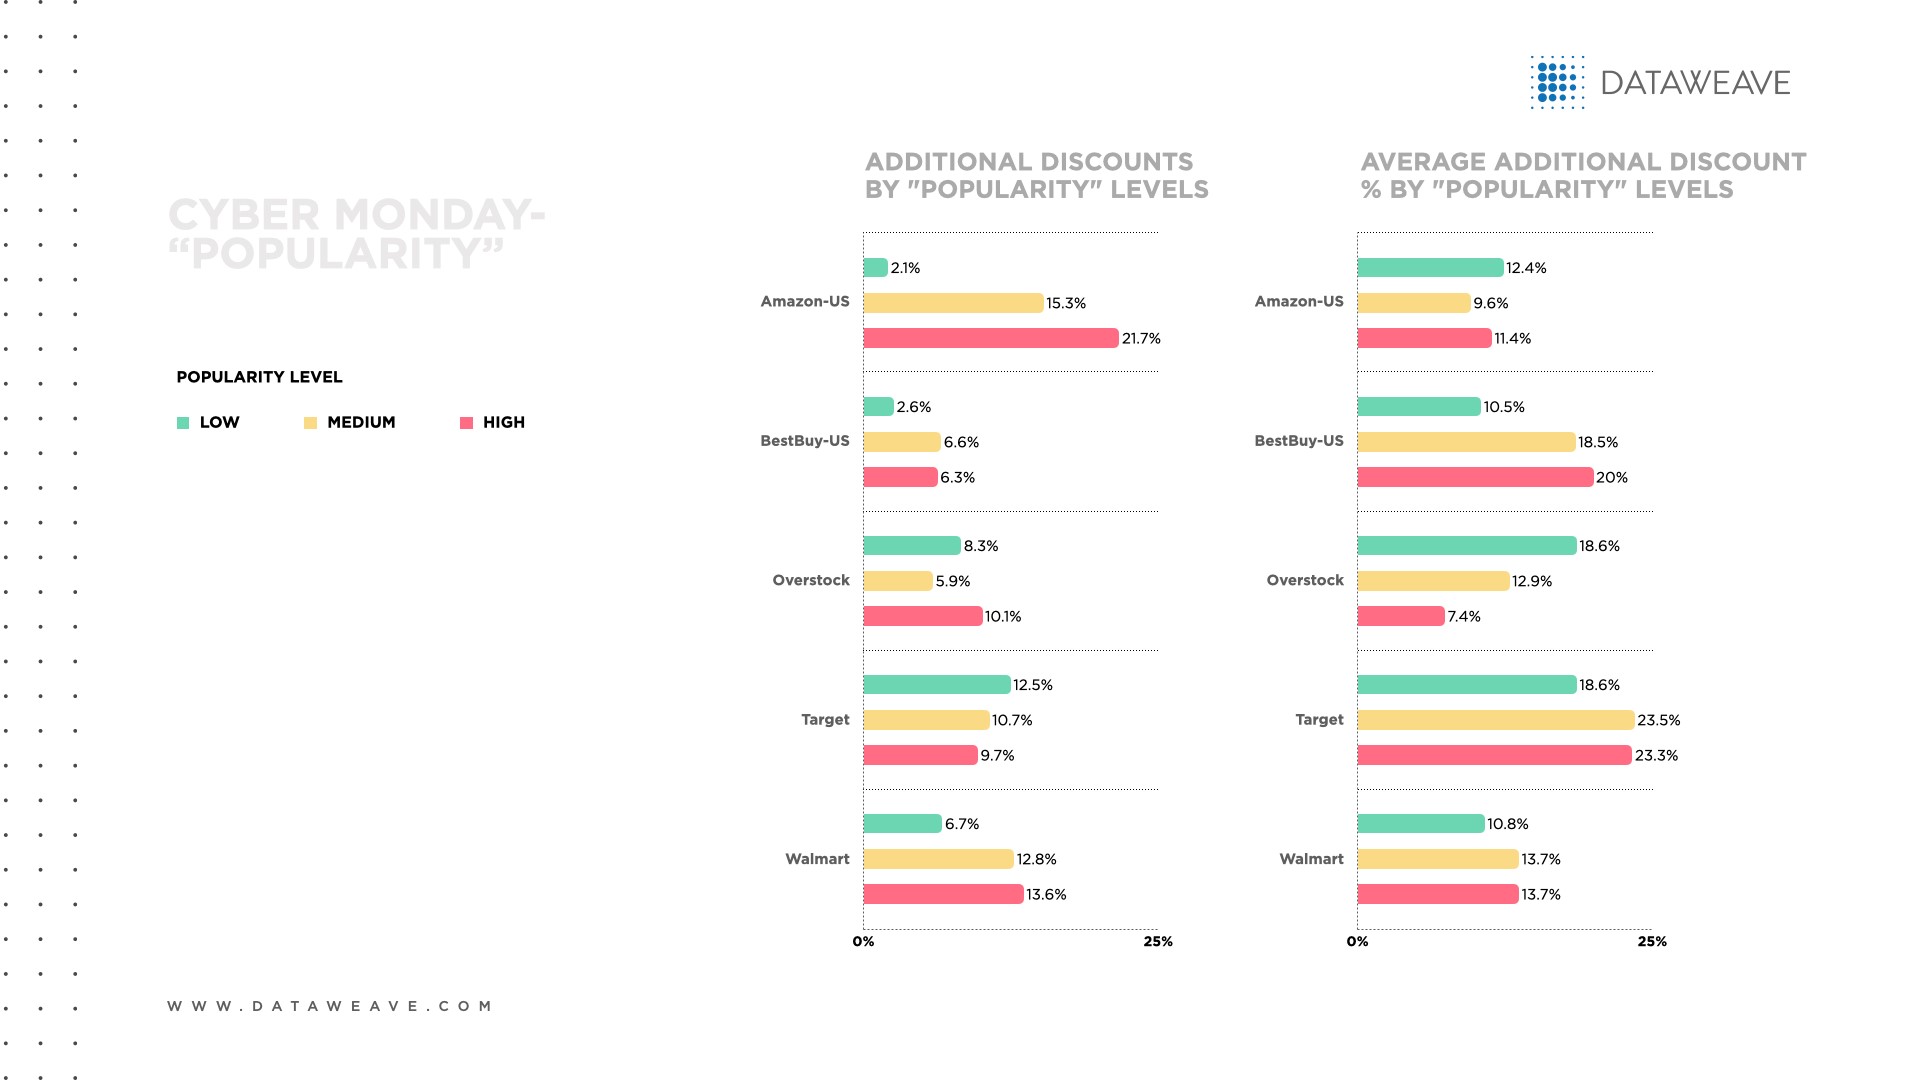
In the US, among electronics with high popularity, Amazon US offered the highest percentage of items with a price decrease (27.8%) and Target offered the greatest magnitude of price decrease (21.3%).
For electronics with moderate popularity, Amazon US offered the highest percentage of items with a price decrease (24.7%) and Best Buy offered the greatest magnitude of price decrease (15.4%).
Among electronics with low popularity, Amazon US offered the highest percentage of items with a price decrease (25.2%) and Best Buy offered the greatest magnitude of price decrease (13.4%), closely followed by Amazon US (13.3%).
In the UK, among electronics with high popularity, OnBuy offered the highest percentage of items with a price decrease (44.0%) among 84 products and Etsy offered the greatest magnitude of price decrease (28.5%) among 150 products.
For electronics with moderate popularity, Amazon UK offered the highest percentage of items with a price decrease (29.3%) and OnBuy offered the greatest magnitude of price decrease (26.7%).
Electronics with low popularity, Amazon UK offered the highest percentage of items with a price decrease (23.9%) and OnBuy offered the greatest magnitude of price decrease (26.3%).
In Europe, among electronics with high popularity, Amazon Germany offered the highest overall percentage of items with a price decrease (30.1%) and the greatest overall magnitude of price decrease (20.2%).
For electronics with moderate popularity, Amazon Germany offered the highest percentage of items with a price decrease (29.7%) and Amazon Italy offered the greatest magnitude of price decrease (41.2%) among 12 products.
Among electronics with low popularity, Amazon Germany offered the highest percentage of items with a price decrease (26.7%) and the greatest magnitude of price decrease (17.2%).
In Middle East & Asia, among electronics with high popularity, Amazon Singapore offered the highest overall percentage of items with a price decrease (32.2%) and Amazon Saudi Arabia had the greatest overall magnitude of price decrease (10.4%).
For electronics with moderate popularity, Amazon UAE offered the highest percentage of items with a price decrease (48.8%) and Amazon Japan offered the greatest magnitude of price decrease (11.5%).
Similarly, among electronics with low popularity, Amazon UAE offered the highest percentage of items with a price decrease (36.9%) and Amazon Japan the greatest magnitude of price decrease (13.3%).
Consumers won big on Prime Day 2021
Overall, Prime Day 2021 offered a wide range of deals across the competitive electronics category in each region. Almost all of the retailers we studied (except for Ebay) showed up in the analysis for offering notable discounts and pricing strategies this year. Amazon US, OnBuy, Amazon Germany, Amazon Japan and Amazon UAE appeared in the results most often among their respective regions. Stay tuned for Prime Day 2021 pricing insights across other categories, including home, health & beauty and fashion.
This year, shoppers will skip neckties and celebrate Dad with gifts for his home office or man cave. As our personal and professional lives grow increasingly digital and tied to our homes, retailers face new seasonal sales opportunities.Retailers whose assortments contain in-demand electronics and home products can drive more e-commerce sales revenue and gain a competitive edge in time for Father’s Day 2021.
According to the NRF, Father’s Day spending is expected to hit $20.1 billion, up 18% from 2020’s total of $17 billion. The vast majority (75%) of Americans plan to celebrate the fathers, husbands and other paternal figures in their life this Father’s Day. Popular products dads will love
Retailers can inspire Father’s Day shoppers by filling their assortments with in-demand electronics and home products, as these two categories continue to boom.
Consider these recent results related to electronics and home goods:
Online sales of consumer electronics grew 18% year-over-year in 2020 as more consumers work, shop and enjoy entertainment in the comfort of their homes.
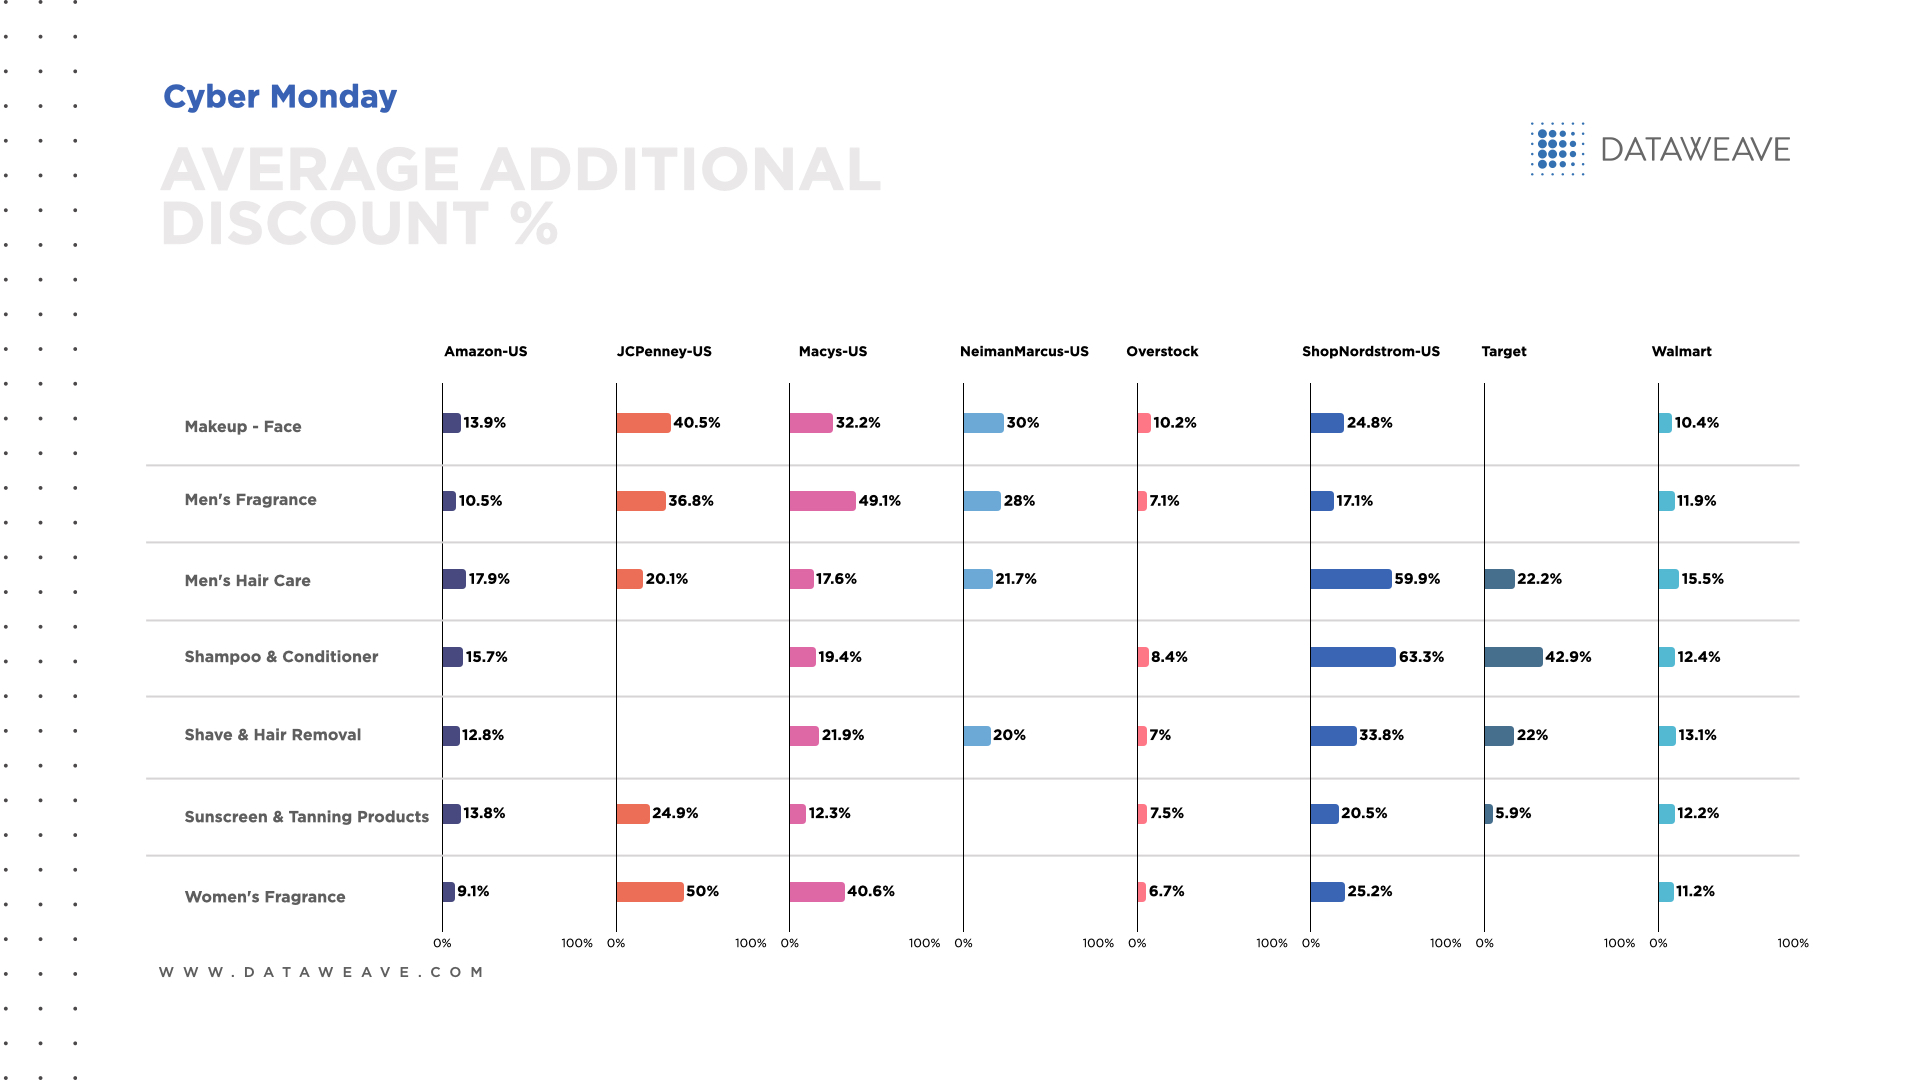
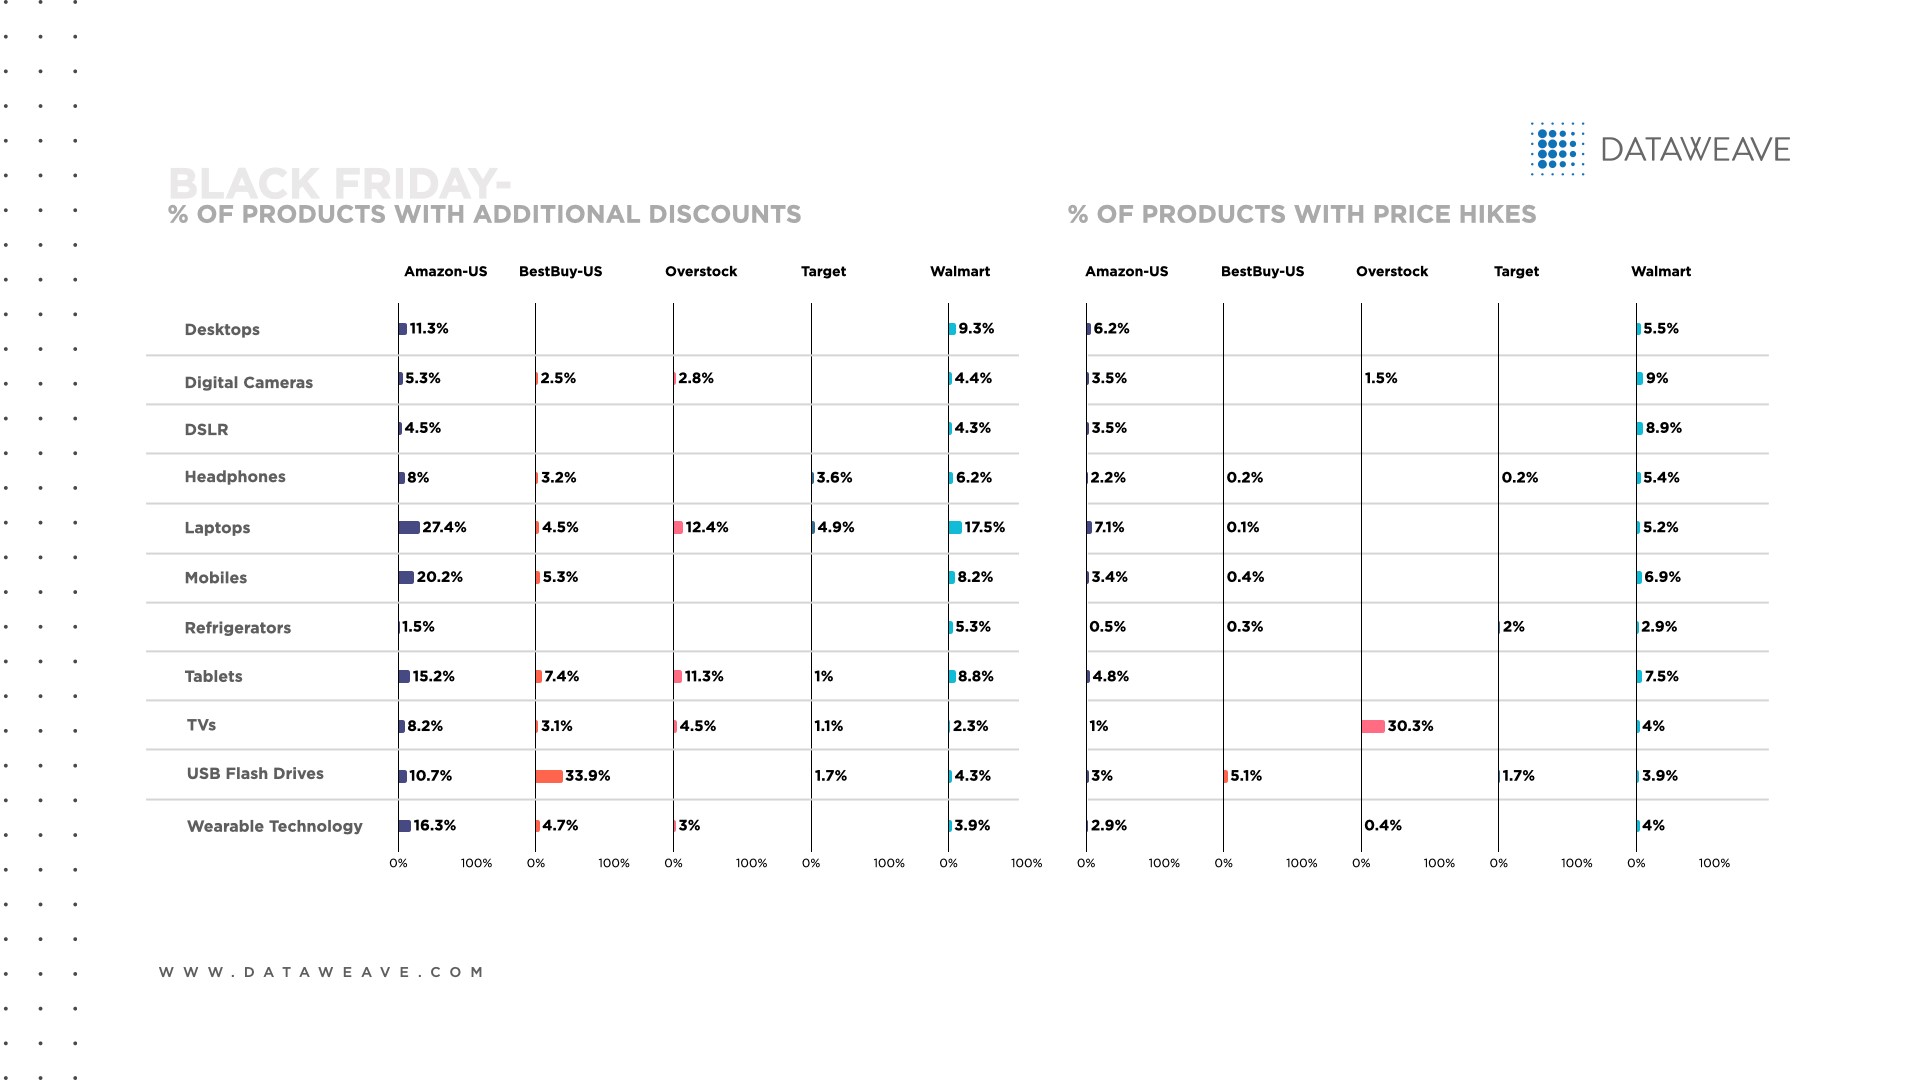
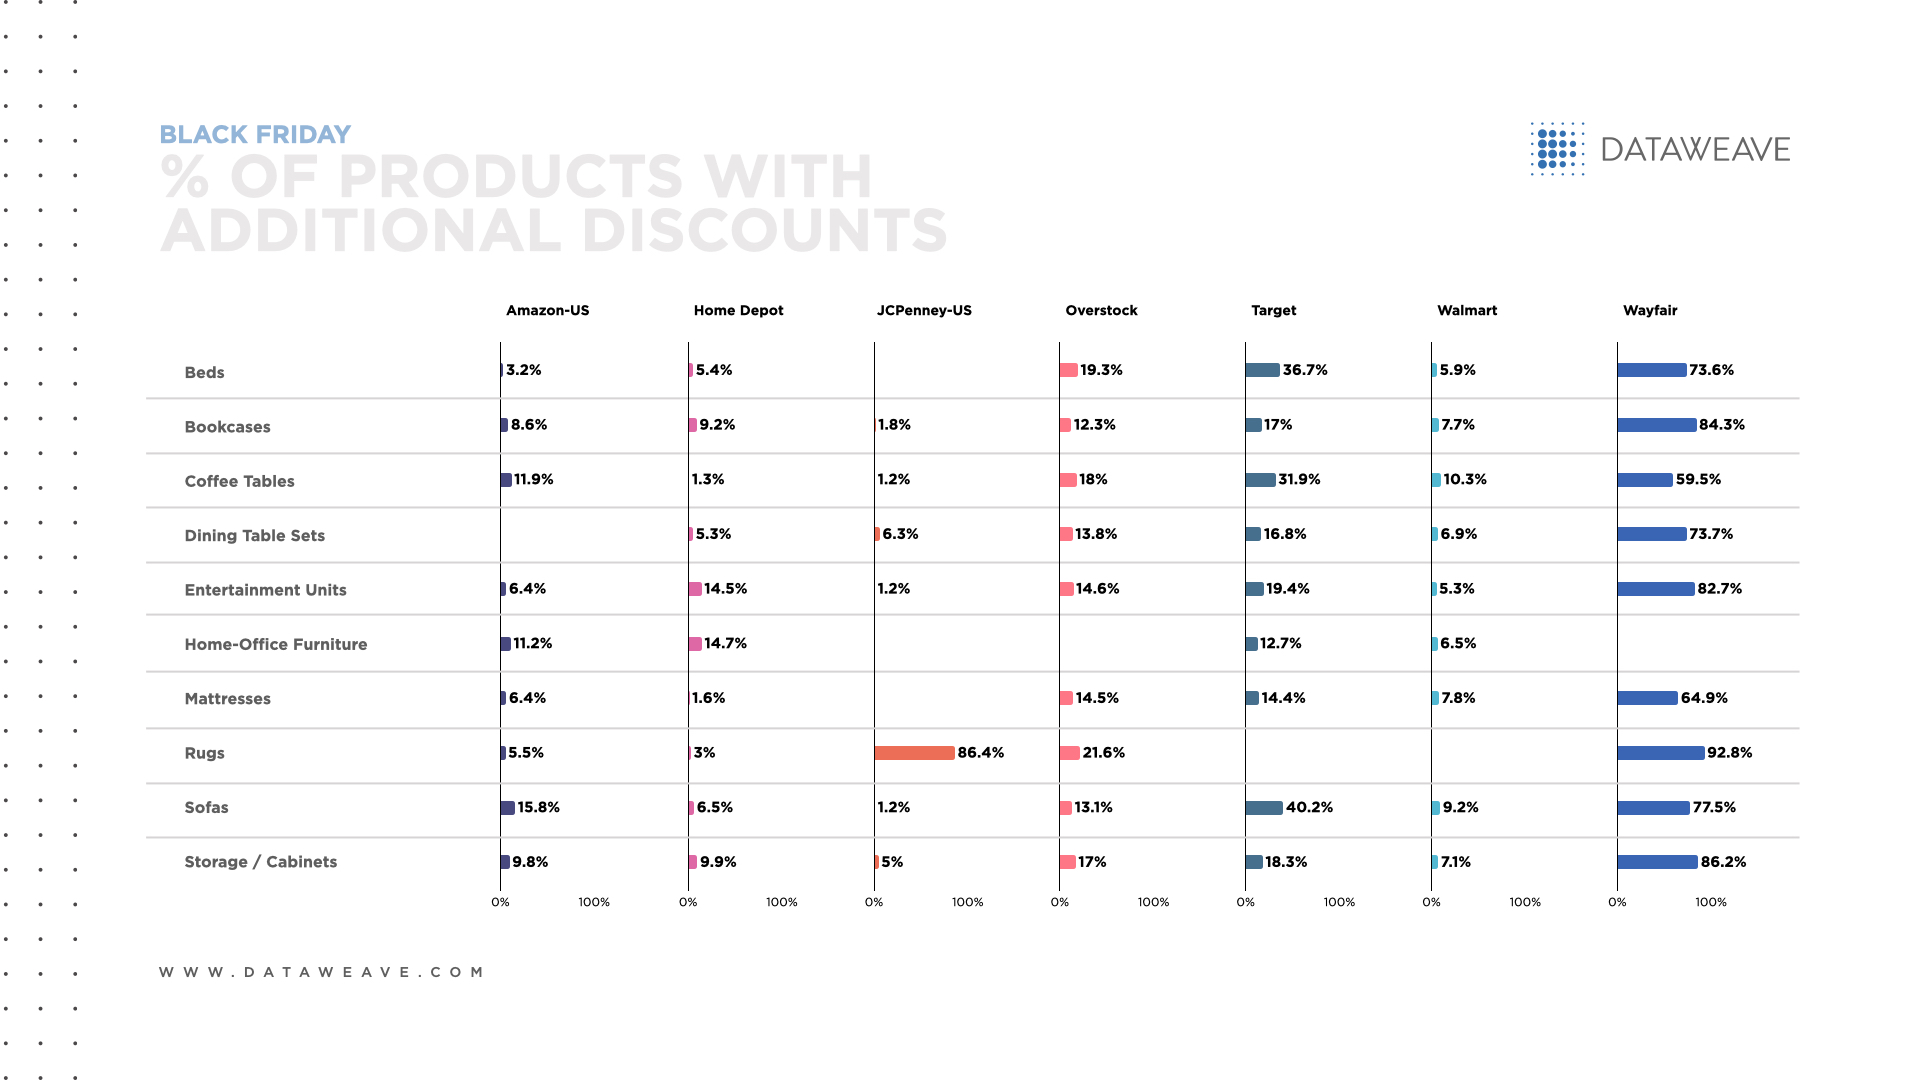
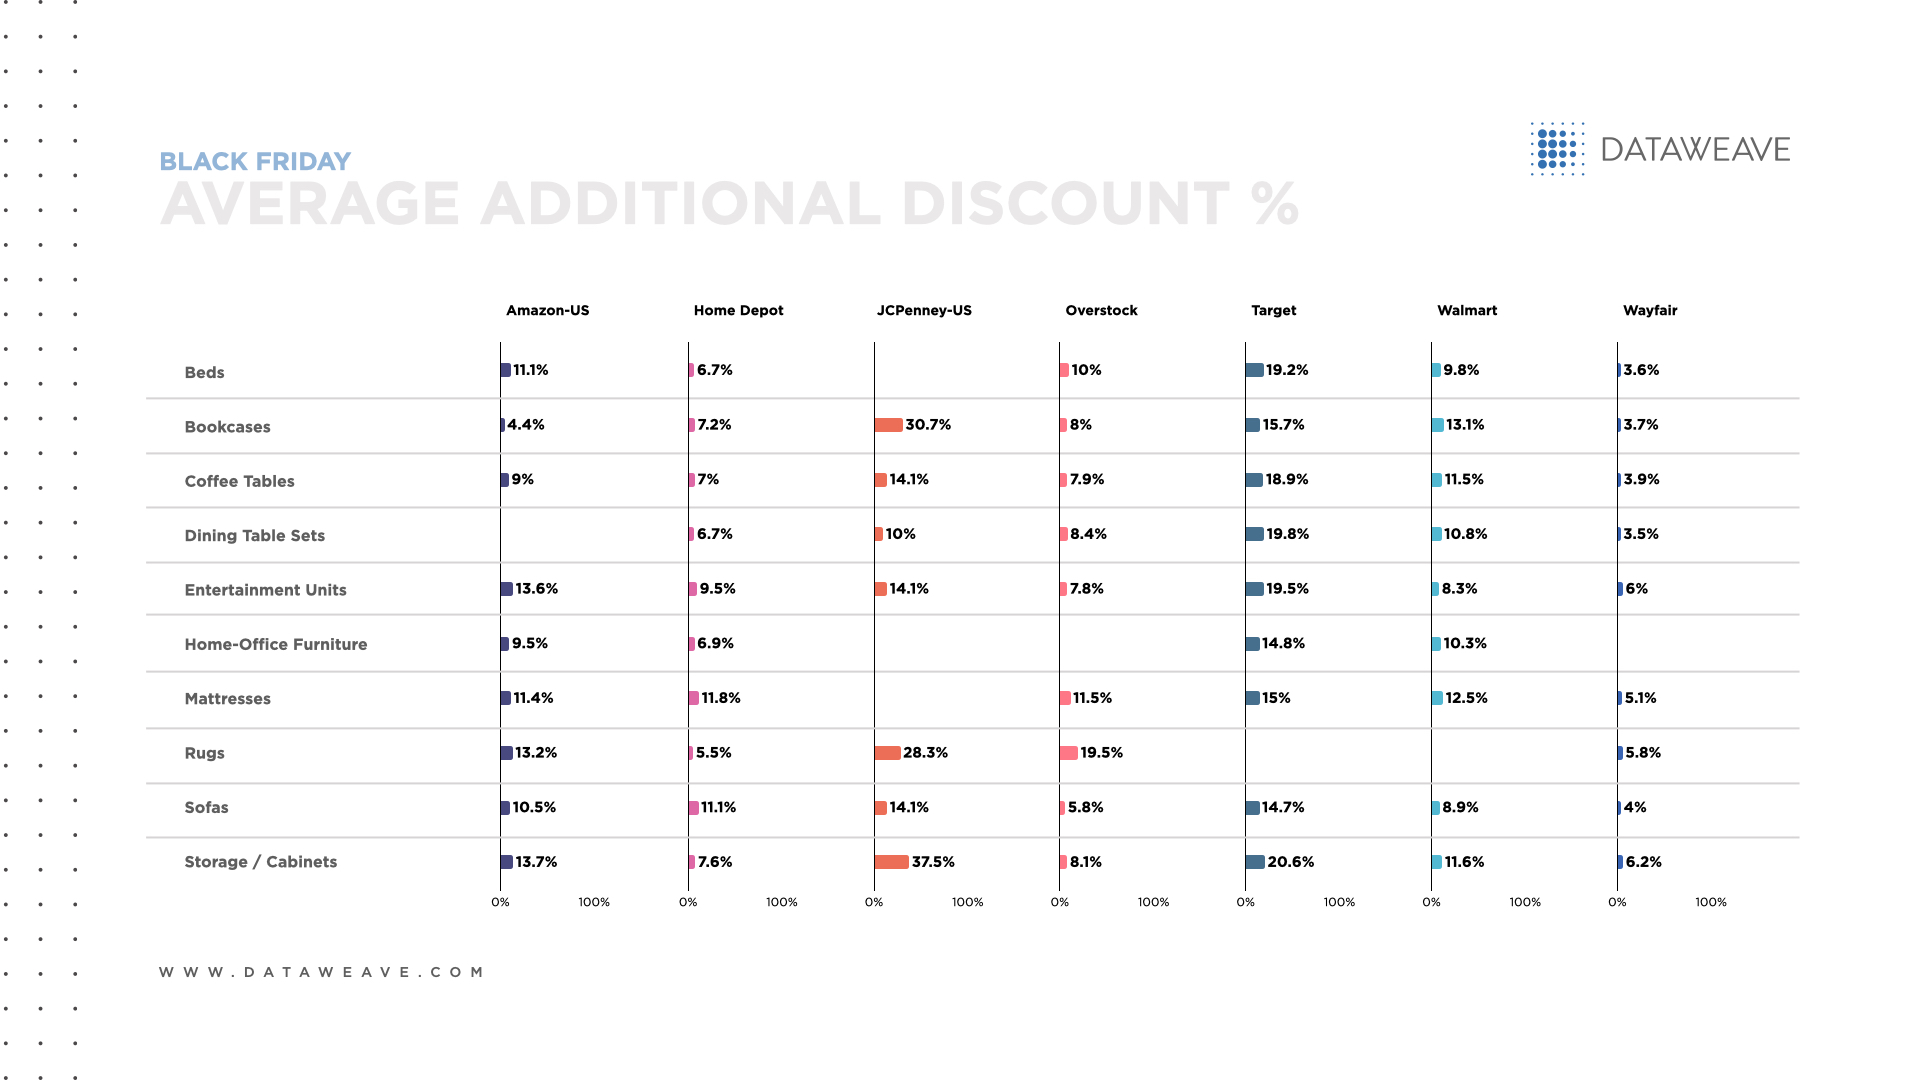
To win more sales on Black Friday 2020, certain retailers offered attractive deals and deep discounts on electronics like laptops, mobiles, wearables, USB flash drives, tablets and headphones.
Home furnishings sales rose 12% year-over-year in 2020 as homebound consumers invested in products for domestic comfort, organization and functional purposes.
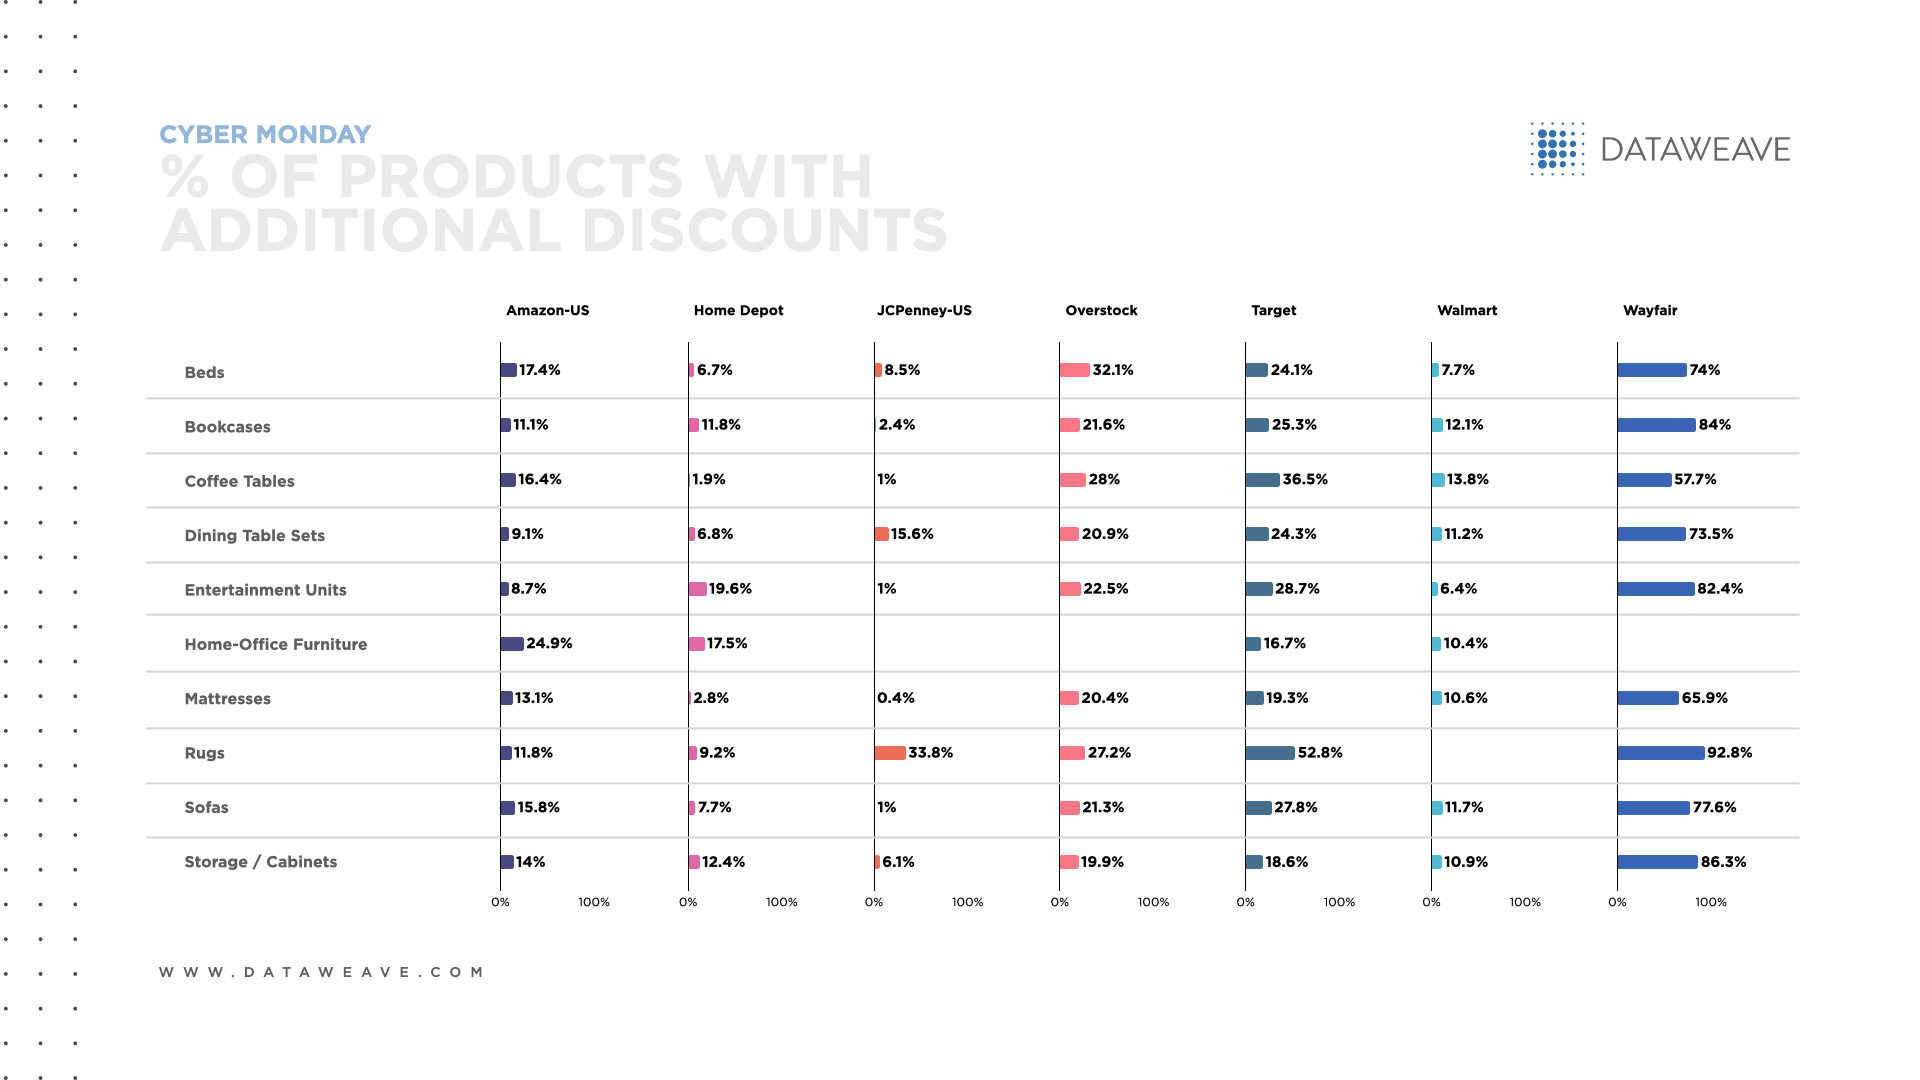
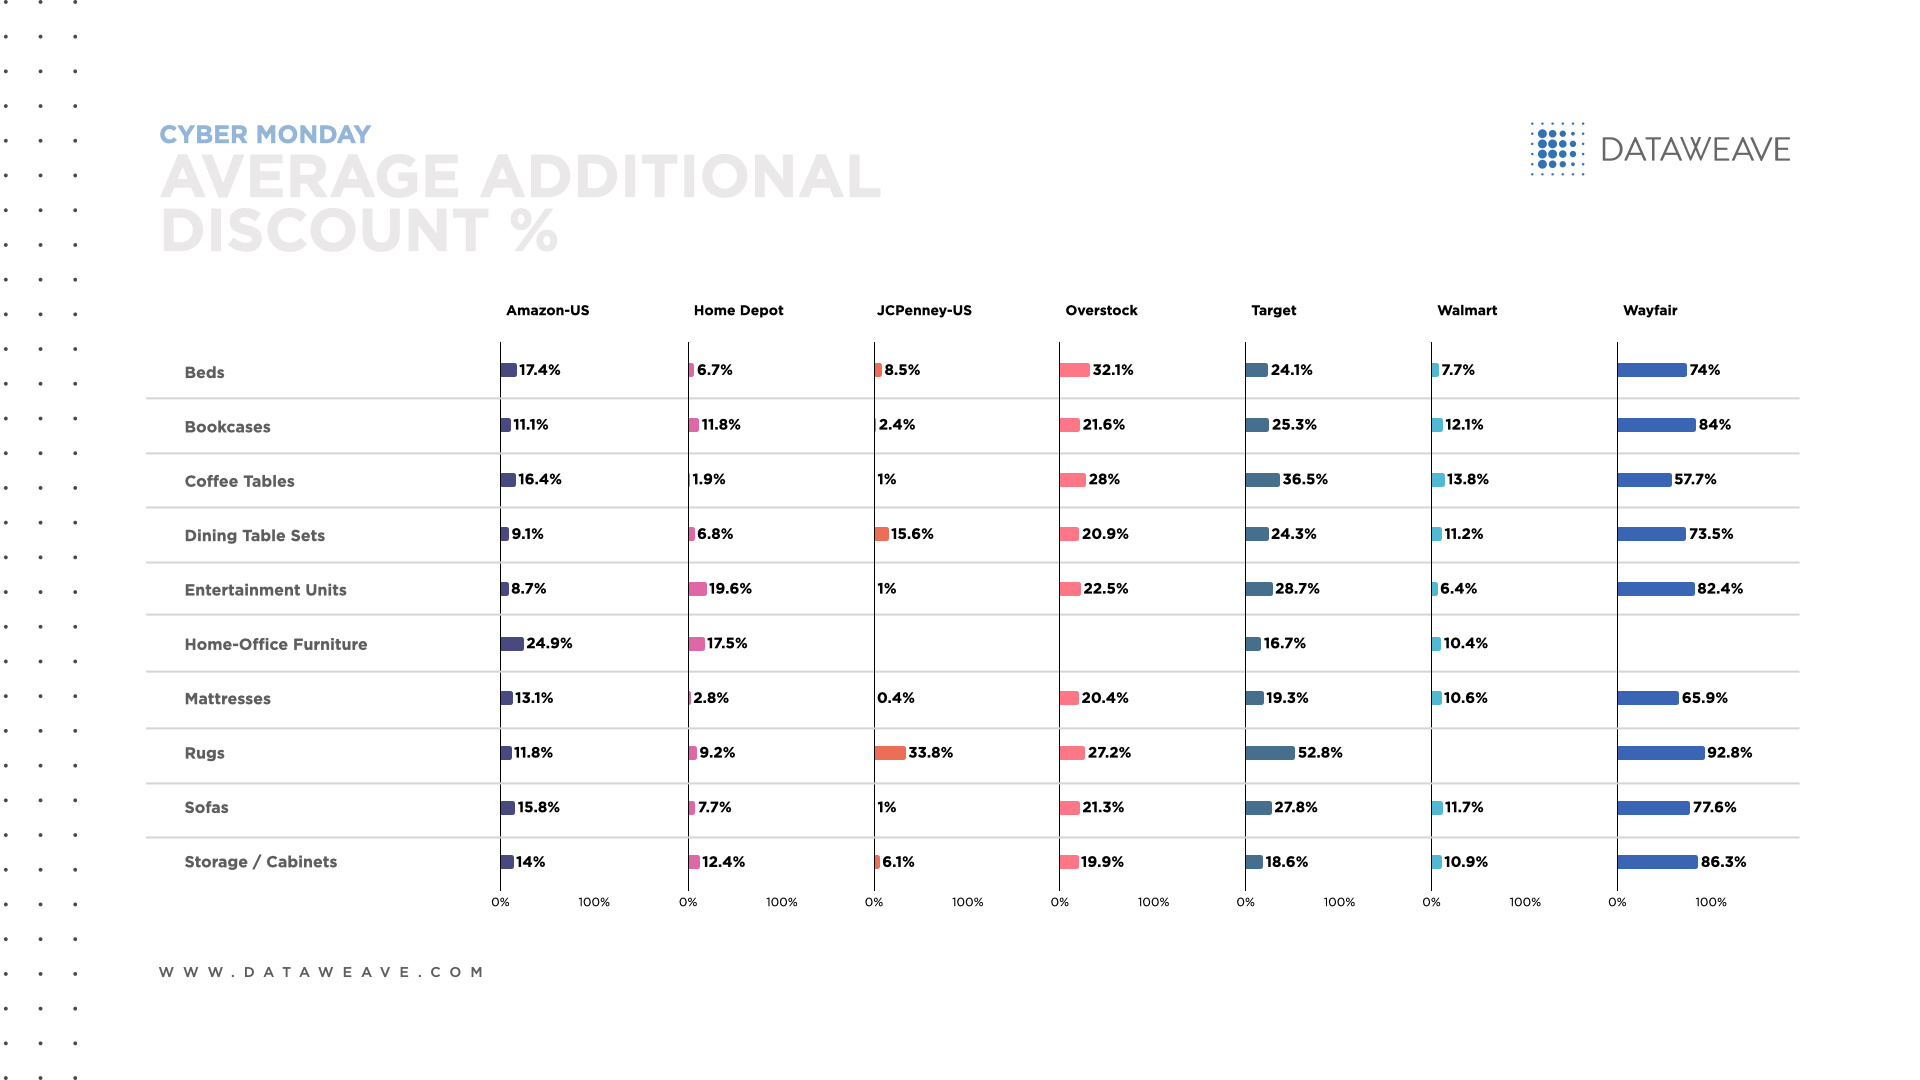
On Cyber Monday 2020, home merchandise saw bustling sales, as storage items, cabinets and bookcases were among the most competitively priced products in the category.
Since home is the new hub, retailers can plan their assortments to align with this enduring consumer trend to outplay rivals. Optimizing their product mix involves making decisions on the right balance among bestsellers, hot trends, unique products and essential items to gain a competitive advantage.
Grab shoppers’ attention with desirable promotions
Although shoppers appreciate variety, the abundance of product choices available online can overwhelm consumers. In response, retailers can craft persuasive and timely digital campaigns to help simplify the customer experience.
Digital promotions, including banner ads and search campaigns, can help retailers spark a sense of urgency that motivates shoppers to buy. The key is for retailers to connect to consumers with the right messaging, timing and targeting to earn their attention, trust and sales. Retailers need effective promotions to optimize their ad spend. Pricing secures the sale
To maximize top line performance, retailers also need to nail their Father’s Day pricing strategies.
Notably, consumption habits and loyalty have dramatically shifted during the pandemic, which has affected retailers’ pricing strategies. Value pricing continues to soar due to economic uncertainty, job losses and a growing desire for value for money. Last year, 30% of consumers switched to a new brand due to better prices, while 25% cited better value as the reason they switched, according to McKinsey & Company.
On the other side of the socioeconomic spectrum, premium pricing is also on the rise. Upscale shoppers are now more willing to splurge on high quality goods, including home furnishings and electronics. These consumers will pay more for merchandise that adds value or purpose to their lives. In addition, digitally-savvy Gen Z and Millennial consumers are spending 125% as much as they did in 2019. As a result, retailers that capitalize on consumers’ enthusiasm and price elasticity will drive incremental e-commerce revenue gains.
As e-commerce competition intensifies and informed, empowered shoppers know where to find the best prices, more retailers now seek a new pricing approach to stand out, drive sales growth and protect against price wars. Drive revenue with the right products, promotions and prices
To win the attention and sales of Father’s Day shoppers, more leading retailers now use data insights to make faster, more effective assortment and pricing decisions that maximize their e-commerce sales.
Data analytics help retailers know which products consumers will actually buy. Leading global retailers rely on Assortment Analytics from DataWeave to ensure their online assortments keep up with evolving consumer needs. Building acompetitive product mix can set retailers apart and boost e-commerce sales by offering in-demand merchandise. Assortment analytics give retailers insights on the most popular brands and products on any e-commerce website, and help them spot and fill any assortment gaps to capture more sales.
To captivate online shoppers’ attention, retailers use DataWeave’s Promotional Insights to lower acquisition costs with marketing promotions that resonate. As online shoppers increasingly seek timely offers, these insights help retailers quickly evaluate the effectiveness of their promotions and optimize their digital ad spend. Retailers gain near-real-time insights on the brands, categories and products their rivals promote, including campaign frequency, duration and messaging for promotions that convert.
Major retailers also turn to Pricing Intelligence from DataWeave to promptly adapt to rivals’ online price changes and shifts in consumer demand. Retailers drive more revenue and margin by easily identifying fluctuations in consumer demand and rivals’ pricing, as well as any gaps. Retailers gain an edge by seeing pricing patterns that their rivals miss. They gain accurate exact and similar product matching, and near real-time pricing updates to stay competitive and fuel e-commerce conversions. Data insights help retailers delight dads
This Father’s Day, retailers can apply data insights to offer consumers eye-catching promotions of in-demand electronics and home products at the right price to wow dads. Insights from DataWeave can help retailers make smart, competitive assortment, promotion and pricing decisions that boost agility, improve the customer experience and drive e-commerce sales for this special occasion – and all year long.
The pandemic’s profound economic impact sparked a surge in value shopping.
Between February and December 2020, 10 million Americans lost their jobs.1 Due to the pandemic, 36% of lower-income adults and 28% of middle-income adults lost a job or took a pay cut (vs. 22% of upper-income adults). In addition, less than a quarter of lower-income adults have three months’ worth of emergency funds (vs. 48% of middle-income adults and 75% of upper-income adults).2
These financial shifts matter to retailers, as lower- and middle-income households account for 81% (29% and 52%, respectively) of the total U.S. population.3 Reduced disposable income among households like these has led more consumers to embrace bargain-hunting as a shopping habit.
We’ll see why price sensitive consumers are influencing retailers to adjust their e-commerce pricing strategies to stay competitive and responsive.
Consumers seek value across retail categories
Recent research shows 50% of U.S. adults are more sensitive to product prices now than before the pandemic. Also, 80% of U.S. shoppers are taking at least one action to seek more value when they shop for groceries, prioritizing value for money over speed.4
According to McKinsey, 65% of consumers cited value as one of their top three reasons they switched brands during the pandemic. Also, 40% of shoppers cited a desire for better value and 38% cited better prices or promotions as reasons for choosing new products.5
Value-oriented pricing influences purchases, as 70% of consumers said product discounts are more important today compared to a year ago. In addition, 54% ofconsumers said better online deals and discounts are a leading factor that persuades them to choose a specific retailer.6
As e-commerce explodes, consumers have greater access to information. They can find the best price across online sites and receive notifications when a product’s price drops before they buy. Retailers face intense pricing pressure
Similar to the aftermath of the 2008 recession, discounters and dollar chain retailers are now thriving as consumers seek superior value for money. Consumers need new products yet they no longer want to spend as much as before.
That’s why bargain retail is poised to be among the biggest winners in 2021 as consumers get out and socialize more. 7
Dollar General continues to aggressively expand its omnichannel reach as value shopping soars.8 To stay competitive, Family Dollar has partnered with Instacart on same-day delivery.9 In the fierce grocery sector, hard discounter Aldi’s omnichannel expansion includes a focus on private labels and efficient operational processes that improve cost effectiveness and competitive pricing.10
Across retail categories,a remarkable 50 million price changes take place online every day.Given consumers’ shift to value shopping, more retailers are changing their pricing to offer discounts both online and in-store.11 However, to avoid costly price wars, more retailers are now taking a renewed approach to their pricing strategies to protect their margins as they compete.
Specifically, to optimize their e-commerce business for profitable growth, more retailers are modernizing their pricing strategies with data insights.
Pricing intelligence is retailers’ secret weapon
As e-commerce rivalry heats up, retailers must evaluate pricing across more online websites to keep their own prices competitive. This process is becoming increasingly complex and time consuming. Meanwhile, retailers may consider adopting aggressive pricing tactics to win online sales. Yet this pricing strategy is unsustainable over the longer term, as it erodes profit margins.
Today’s heated e-commerce rivalry means retailers can no longer afford to guess at price points or use the same pricing tactics that relied on before the pandemic.
That’s why leading retailers turn to data insights for their pricing strategies to stay agile and flexible while rapidly adapting to fluctuations in consumer demand and competitors’ pricing.
Now more retailers turn to DataWeave’s Pricing Intelligence to drive more revenue and margin.
To optimize profit margins, retailers use our actionable insights to make pricing decisions according to data-driven recommendations. They also make decisions to protect their desired price perception.
Monitoring competitors’ pricing moves helps retailers benchmark their own performance, identify gaps and respond to market trends faster. They can also refer to historic pricing data analytics to accurately anticipate and counter rivals’ next moves to gain an edge.
Retailers that apply data insights to optimize their pricing can drive more online revenue by finding the ideal price consumers are willing to pay while still maintaining profitability. Pricing intelligence can make customer acquisition more efficient, and help retailers grow online sales and market share.
Amid greater price sensitivity, retailers’ pricing strategies are evolving to use data to adapt to consumers’ needs and drive e-commerce sales and profitability. DataWeave’s Pricing Intelligence gives retailers an edge so they stay agile and competitive, and maximize e-commerce sales across consumers of all economic levels.
1. Howland, Daphne. The middle class is stressed and the pandemic isn’t helping. Retail Dive. January 20, 2021. 2. Howland, Daphne. The middle class is stressed and the pandemic isn’t helping. Retail Dive. January 20, 2021. 3. Bennett, Jesse, Richard Fry and Rakesh Kochhar. Are you in the American middle class? Find out with our income calculator. Pew Research Center. July 23, 2020. 4. Maake, Katishi. DoorDash, Instacart Eye Launching Credit Cards. The Harris Poll. April 9, 2021. 5. Charm, Tamara, Harrison Gillis, Anne Grimmelt, Grace Hua, Kelsey Robinson and Ramiro Sanchez Caballero.Survey: US consumer sentiment during the coronavirus crisis. McKinsey & Company. May 13, 2021. 6. Berthiaume, Dan. Survey: Deals drive purchases during pandemic. Chain Store Age. March 18, 2021. 7. Thomas, Lauren. Beauty and bargain retail could be the biggest winners in 2021, Wells Fargo predicts. CNBC. March 25, 2021. 8. Unglesbee, Ben. Dollar General ramps up expansion of Popshelf concept. Retail Dive. March 19, 2021. 9. Ryan, Tom. Will same-day delivery pay off for dollar stores? RetailWire. February 8, 2021. 10. Anderson, George. Should Aldi’s growing store count and digital progress keep rivals up at night? RetailWire. February 11, 2021. 11. Berthiaume, Dan. Survey: Deals drive purchases during pandemic. Chain Store Age. March 18, 2021
Moms deserve a scrumptious celebration. In time for Mother’s Day, restaurants and their food delivery partners can unburden mothers from the chore of cooking by delivering the gifts of ease, convenience and nourishment.
Over the past year, moms have been starved for time amid the disruption of working from home and supporting their children’s virtual schooling. Meanwhile, grandmothers have been starved for social connection, as many of them have only seen their loved ones on Zoom.
Restaurants can satisfy consumers’ unmet needs. Using timely, empathetic digital marketing can help restaurant operators stand out on food delivery apps (like DoorDash, Uber Eats, Grubhub and Postmates) and sell more online this Mother’s Day – and all year round.
Delight moms with what they really want
According to the NRF,83% of consumers plan to celebrate Mother’s Day in 2021. On average, shoppers plan to spend $220.48 (up $16 since last year), the highest amount in the history of NRF’s Mother’s Day surveys. 1
Most (62%) moms say they would love to eliminate the chore of cooking on Mother’s Day. Dinner is the most important meal on Mother’s Day, and most moms prefer restaurant meals (53%) to home cooked meals (39%). 2
Given consumers’ willingness to spend and Mom’s appetite for restaurants, Mother’s Day 2021 is poised to be a powerful sales event for restaurants.
Restaurants need new ways to navigate market trends
The restaurant industry faces consolidation, as 17% (110,000) of U.S. restaurants permanently closed in 2020, and 87% of full-service restaurants reported an average 36% drop in revenue. 3 These figures prove restaurant operators need help to boost their top line and cut costs as they adapt to intense rivalry and shifting market conditions.
During the pandemic, many consumers have embraced home for health or financial reasons or a creative outlet. Although 55% of consumers have been eating at home more often since the pandemic began, 65% say they are tired of cooking at home. 4
Fortunately, consumers are in a celebratory mood. Last year, Mother’s Day was a top sales day, as consumer spending at restaurants soared 103% on Mother’s Day Sunday and 63% on Saturday. 5 Restaurants can relieve consumers of the chore of cooking and add variety to dining occasions like Mother’s Day.
Successful restaurants gain a digital data advantage
To satisfy consumers’ needs and outplay rivals, restaurants now turn to data analytics from DataWeave to protect their profitability with effective pricing, menu and promotion decisions.
Pricing analytics
Restaurant operators can optimize their pricing to stay competitive. For instance, restaurants can compare their offerings and delivery fees with those of rivals to pinpoint and fill any gaps. Monitoring rivals’ pricing moves also helps restaurant operators stay flexible by keeping their prices affordable, so they can attract online sales growth.
Menu analytics
To minimize costs, more restaurants are streamlining their menus. Menu analytics can help operators spot the optimal mix of bestselling items and emerging food trends, like plant-based, vegan, gluten-free and local sourcing. To know which items to keep, operators can even use data insights on menu items down to the ZIP code level to localize their offerings and adapt to diverse tastes to drive online sales.
Promotion analytics
As consumers embrace home entertaining this Mother’s Day, restaurant operators can use data insights to boost sales.They can monitor rivals’ moves and compare their promotional strategies with those of competitors. Evaluating their digital marketing performance (like their brand’s discoverability and visibility ranking on food apps’ homepages) helps restaurants show up more prominently online and sell more.
Savvy restaurants welcome celebrations as lucrative sales occasions
Restaurants can spice up Mom’s life by letting her relax and receive the gifts of tasty meals, time savings and family festivities. Operators can simplify Mother’s Day celebrations by giving consumers a hassle-free dining experience so families can focus on connecting rather than cooking.
For a business advantage, restaurant operators can apply digital marketing insights to boost their agility in responding to consumers’ needs and rivals’ moves.
To stay agile and competitive as the food delivery market booms, leading restaurant chains and food delivery providers are collaborating with DataWeave to make data-driven pricing, menu and promotional decisions that fuel online sales.
1 Retail Holiday and Seasonal Trends: Mother’s Day. NRF. 2021 2 New Study Shows What Moms Really Want On Mother’s Day. US Foods. May 2020. 3 Valinsky, Jordan. 10,000 of America’s restaurants have closed in the past three months. CNN. December 9, 2020. 4 Contreras, Tricia. How the pandemic is shaping home cooking trends. SmartBrief. September 30, 2020. 5 Lalley, Heather. Despite pandemic, Mother’s Day was huge for restaurants. Restaurant Business. May 18, 2020.
Show moms extra love this year. With Mother’s Day coming up fast, savvy beauty and fashion brands will use this special occasion to inspire pampering and gift giving to fuel their e-commerce sales growth.
This year, beauty and fashion are poised to boom, as 40% of consumers plan to buy beauty products and 37% will buy new outfits for going out. 1 According to eMarketer,apparel and accessories e-commerce sales will grow nearly 19% this year due to pent-up demand for clothing, while health and beauty sales will rise 16%. 2
“People will be happy to go out again … there will be a fiesta in makeup and in fragrances.”
~L’Oréal CEO and Chairman Jean-Paul Agon
After beauty and apparel sales declined last year, brands now seize every opportunity to capitalize on the categories’ resurgence in 2021. To differentiate their goods, brands can use e-commerce marketing best practices to position their fashion and beauty items as spectacular gifts that moms will love.
Aligning with the latest trends can help brands boost online growth.
Hot trends dominating beauty and fashion
This Mother’s Day, shoppers can delight moms with beauty bestsellers like:
Mask-friendly makeup: As we continue to wear masks over the short-term, cosmetics like false lashes, smudge-proof mascara and ultra-hypoallergenic eyeshadow will remain popular. 3
Fragrances: Online fragrance sales rose 45% year-over-year in 2020. Clean and organic beauty categories grew 56% with fragrance brands growing the most. 4
Purpose-led brands: Consumers crave companies that care. More online searches contain keywords like “ethical beauty” and “sustainable makeup” for products that help consumers look good and feel good. 5
Online fashion is in vogue
Before the pandemic, consumers bought less than one-third of their apparel or footwear online; last year, the proportion surged to an astounding 51%. In 2021, consumers will invest even more in their wardrobes, including trends like:
Comfort: Athleisure will remain in demand as many consumers still prefer comfortable clothing when they work from home. 7
Beloved staples: Classic pieces like jeans, dresses and simple yet elegant tops are making a comeback as consumers start to go out more. 8
Retro ‘80s: Ladies are ready to party like it’s 1984. Bright and metallic colors and sequins for occasionwear (and even NFL linebacker-inspired shoulderpads) are recreating a fun, indulgent ’80s vibe. 9
Brands’ secret weapon for a competitive advantage
For successful Mother’s Day campaigns, more fashion and beauty brands will use digital shelf analytics for marketing decisions that maximize their ROI and e-commerce sales.
To ensure online shoppers discover Mother’s Day products with ease, brands are usingShare of Searchinsights to measure their share of digital shelf. These DataWeave analytics tell brands which keywords perform best. Brands can also benchmark their search and navigation visibility against rivals’ rankings across e-commerce categories, websites and geographic regions.
Using Content Auditinsights tells brands how their content is performing. They can discover and fill content gaps so their products show up more prominently. Optimizing content (like keywords, product page titles, descriptions, ads and sponsored space) and images to align with the retailers’ search algorithms ensures a consistent brand experience across all online channels. Improving content helps brands connect to consumers with marketing that resonates and inspires them to buy. Brands also use
Pricing and Promotionsinsights to measure the effectiveness of their online promotions and secure sales. Brands can stay competitive by ensuring their pricing and promotions are in line with rivals’ offers, such as identifying first movers and rivals with the deepest discounts across retailers and SKUs. Brands can even determine how imitating rivals’ pricing and promotional moves could impact revenue and sales volume.
Help shoppers make Mom’s day
Since Mother’s Day is almost here, beauty and fashion brands can apply these data insights to connect consumers with a variety of products moms will love. Digital shelf analytics from DataWeave can help brands deliver timely campaigns, improve their return on digital marketing spend and make effective marketing decisions to drive e-commerce sales.
1 Howland, Daphne. Wells Fargo sees permanent behavior shifts from the pandemic. Retail Dive. March 29, 2021. 2 Droesch, Blake. US Ecommerce by Category 2021. eMarketer. April 27, 2021. 3 Wood, Dana. Is Makeup Dead? The Robin Report. April 18, 2021. 4 Larson, Kristin. Fragrance Sales Pick Up As Consumers Reengage With The Outside World. Forbes. April 27, 2021. 5 What Can Brands Learn About Sustainability From Green Beauty Consumers? Beauty Business Journal. June 15, 2020. 6 Howland, Daphne. Wells Fargo sees permanent behavior shifts from the pandemic. Retail Dive. March 29, 2021. 7 Ibid. 8 Bhattarai, Abha. Americans are starting to buy real clothes again. The Washington Post. March 18, 2021. 9 Warren, Liz. Loose Denim and Bold Occasionwear on Full Display for Fall 2021. Sourcing Journal. April 2, 2021.
Soaring e-commerce growth has made retail more crowded, complex and competitive. Now retailers face an urgent need to keep an eye on more rivals with potential substitute products to maximize their own e-commerce growth.
Consider these recent figures, which illustrate online shoppers’ abundance of product choices:
24% year-over-year increase in direct-to-consumer (DTC) brands in the U.S. alone was estimated for 2020 as more brands bypass retailers1
55% of shoppers have purchased private label in the past year and many retailers are investing more in their own brands2
110% average increase in small retailers’ 2020 online holiday sales, as more players launched new e-commerce shops during the pandemic3
39% of U.S. consumers have changed brands, with the level of brand switching doubling in 2020 compared to 2019, especially among Gen Z and Millennial consumers, as loyalty declines4
These statistics prove that in 2021 retailers need to navigate more online players and products. Now retailers need a new approach to stay on top of market trends to keep their e-commerce strategies competitive, profitable and attractive to discerning online shoppers.
Retailers reduce the risk of substitutes with similarity matching
In response to online crowding, more leading retailers are turning to similarity matching. Similarity matching is a type of retail analytics that scour global e-commerce sites to find products that exactly match a specific item as well as products that closely match it. Similarity matching insights have grown in strategic significance because they increase retailers’ visibility into potential substitute products, so they can respond to all rivals’ moves with greater agility and efficiency to stay competitive.
In terms of e-commerce applications, similarity matching helps retailers gather insights on potential substitute products so they can adjust their pricing and assortment strategies accordingly. Retailers can align their pricing with rivals’ pricing moves for similar items to protect their margins and maximize profitability. They can also make informed assortment decisions, including which product mix of bestsellers, unique items and private labels could optimize their online sales performance.
Online shoppers search for productsdifferently across different categories
Consumer behavior plays a role, as online search habits differ across product categories, which influences the type of similarity matching retailers need. For example, categories like fashion, toys, home and kitchen work best with similarity matching based on text and images. In these highly-visual categories, consumers can quickly determine whether a product fits the design and aesthetic they are looking for. As a result, e-commerce product titles, descriptions and product images play a big role in consumers’ purchase decisions.
By contrast, consumer electronics and furniture are categories in which consumers tend to seek specific product attributes, such as a certain level of resolution for their high-definition TV or a couch with particular dimensions so it fits their living room. For these types of products, consumer purchases are driven by product specifications, so similarity matching takes into account their specific needs as well as a degree of tolerance for exact or near-similar attributes across online competitors.
Expect intense e-commerce rivalry in 2021
As more consumers shop online, they are increasingly informed by online product comparison information. A wide variety of product choices means consumers can substitute similar goods with ease, especially if a particular item is out-of-stock. Perceived product differentiation, price sensitivity and private labels can also influence consumers’ purchase decisions.
Across categories, e-commerce growth is outpacing total retail growth. When competition is this fierce, there is an increased risk that numerous and aggressive players will drive down profit margins. Leading retailers are now seizing opportunities to earn consumer loyalty. Using similarity matching helps retailers by offering in-demand products that consumers will actually buy and deliver exceptional online experiences to prevent shoppers from switching to rivals and their comparable products.
Similarity matching lets you stay competitive
As e-commerce traffic and rivalry increase, similarity matching helps retailers stand out and serve online shoppers more effectively.
Retailers gain visibility into their entire competitive landscape to keep their e-commerce strategy responsive to shifts among consumers and rivals. By knowing the full scope of potential substitute products available online, retailers can keep their pricing and assortment strategies in line with rivals’ to reduce their risk of losing sales to rivals, and boost their top line, profitability and cost savings.
The data insights give retailers the flexibility they need to align with online shoppers’ different needs across categories. As a result, retailers can use similarity matching to boost agility and gain a competitive advantage by adapting to online shoppers’ needs, winning their sales and fueling e-commerce growth.DataWeave’s similarity matching capability lets clients
1 US Direct-to-Consumer Ecommerce Sales Will Rise to Nearly $18 Billion in 2020. eMarketer. April 2, 2020.
2 Ochwat, Dan. Shopper study: Private brands purchased because they’re preferred. Store Brands. February 24, 2021 3 Miranda, Leticia. Small businesses who pivoted to e-commerce saw record sales during Black Friday weekend. December 1, 2020. 4 Charm, Tamara, Harrison Gillis, Anne Grimmelt, Grace Hua, Kelsey Robinson and Ramiro Sanchez Caballero. Survey: US consumer sentiment during the coronavirus crisis. McKinsey & Company. March 24, 2021.
The proliferation of informed shoppers, e-commerce sites, and competitors of all sizes has increased the complexity of – and lucrative opportunities in – brand management.
Now more brands rely on data insights to uncover specific ways to make their digital marketing more arresting, effective and profitable. Many brands struggle with e-commerce profitability due, in part, to advertising expenses that often yield lackluster results.1
Analytics are growing in retail significance, as 88% of retail and consumer goods marketers say data improves their marketing by allowing them to personalize touchpoints. Relevant marketing and great marketers helps brands connect with consumers. Let’s see why leading brands are adding data insights to their 2021 marketing strategies to fuel online sales growth.
Brands discover how to get discovered
Consumer goods brands no longer leave it up to chance that consumers will find them online. The digital migration of companies and consumers over the past year means more noise for brands to breakthrough.
Now search is growing in importance to improve brands’ online product discovery. Here’s why:
87% of shoppers begin their hunt in digital channels3
17% rise in paid search in late 20204
24% rise in paid social advertising during the same period5
To grab consumers’ attention by being easier to see, more brands are turning to data insights to track their online visibility.
Brands need to look for ways to mitigate the high costs of acquiring customers online6
Brands use marketing analytics related to keywords and navigation searches help brands know exactly how much space on the digital shelf they occupy across different online platforms.
These DataWeave’s Share of Search solutions help brands understand what percentage of the digital shelf they command through either keywords or navigation. These insights can help brands decide whether to boost their brand visibility using sponsored ads to ensure their products show up more prominently in online search results to boost brand reach and awareness on each channel. For instance, brands can tell whether consumers search for products using branded, generic or category-specific keywords to align their marketing accordingly.
In addition, brands can see how their organic and sponsored results rank compared to their competitors to spot ways to improve their visibility rank and decrease customer acquisition costs.
Content differentiates a brand’s digital shelf
For a striking digital presence and enhanced discoverability, leading brands measure how effectively their content inspires online shoppers to choose them.
Brands can improve their digital marketing results by using Content Audit insights to spot patterns among their top-performing campaigns. They can also benchmark their content with category bestsellers to discover how to optimize their online performance to grow sales volume and market share.
Strategic advertising requires high-quality photography and data-driven content7
Using these data insights from DataWeave helps brands determine how well their content (including product description pages and images) align with e-commerce algorithms and lead to online traffic, engagement and sales. Brands also adapt faster by adjusting underperforming campaigns to reduce costs and optimize their digital marketing spends.
Brands can fill content gaps across online channels with enhanced product information that aligns content and images with brands’ product information management (PIM). Using analytics to deliver a consistent brand experience across all online channels can help brands build relationships with consumers and earn their trust.
Alluring promotions help brands secure the sale
As e-commerce evolves, brands have matured beyond Google AdWords and Facebook campaigns to offer targeted promotions across digital touchpoints, which increases marketing reach and complexity.
To boost clarity, be in demand and drive sales across online platforms, more leading brands use data insights to measure the effectiveness of their digital Promotions. Promotional insights from DataWeave keep brands informed of trending categories and products to keep their online offerings relevant and timely. Brands can pinpoint exactly which products to promote and which e-commerce sites help them drive the most profitable results with compelling digital offers.
Brands that respond quickly to their customers’ needs have the upper hand8
Analytics also keep brands competitive and relevant by benchmarking their promotional strategies with their rivals’ and continuously monitoring rivals’ online moves. For instance, brands can track the promotions their competitors offer for similar products across different e-commerce sites. These competitive insights help brands quickly spot opportunities to optimize their online conversions with appealing promotions that reflect market trends.
Better marketing decisions can help brands grow sales and share
Data insights make brands more enticing by connecting the dots among their online visibility, content and promotions. Brands uncover ways to make smarter marketing decisions faster to improve their top line and decrease customer acquisition costs. DataWeave analytics also help brands stand out and improve product discovery, engagement and sales. As a result, brands save time and boost their agility with relevant marketing that resonates and inspires shoppers to keep coming back.
1 Jansen, Caroline, Cara Salpini and Maria Monteros. 8 DTC trends to watch in 2021. Retail Dive. February 3, 2021 2 Casna, Kathryn. Ecommerce Trends That Are Shaping the Way Businesses Sell Online. Salesforce. 2021. 3 Casna, Kathryn. Ecommerce Trends That Are Shaping the Way Businesses Sell Online. Salesforce. 2021. 4 The Future of eCommerce in 2021. Shopify Plus. 2021. 5 The Future of eCommerce in 2021. Shopify Plus. 2021. 6 Jansen, Caroline, Cara Salpini and Maria Monteros. 8 DTC trends to watch in 2021. Retail Dive. February 3, 2021. 7 Glasheen, Jasmine. 2021 Forecast: Next Gens in a Brand-New World. The Robin Report. January 3, 2021. 8 Monteros, Maria. Forrester: Few brands can anticipate and act on consumer needs. Retail Dive. February 10, 2021.
Brands that protect their bottom line will win online.
As global e-commerce smashes sales records, more brands are now taking control over their online presence (“digital shelf”) to enhance their performance and profit margins.
In the U.S., the increase in e-commerce penetration during the first half of 2020 was equivalent to that of the last decade.1 Last year also marked the first time in history that all retail sales gains came from e-commerce.2 E-commerce has lasting appeal, as two-thirds of consumers plan to continue to shop online after the pandemic.3
“Brands need to continue to look for ways to mitigate the high costs of acquiring customers online.” 4
To keep up as shopping migrates online, brands face bigger expenditures. In the second quarter of 2020, e-commerce costs grew much faster (up 60% year-over-year) than revenues (up 40%).5 Namely, brands face steep costs for customer acquisition and logistics, which erode their online profit margins.
The bottom line for brands is they must sell online – profitably – to stay competitive. They urgently need new ways to drive online sales and incur fewer costs. Let’s see why brand leaders are using data insights to optimize their e-commerce decisions and profitability.
Brands find new growth opportunities
Over the past year, e-commerce has gotten more crowded. Now brands seek proven ways to differentiate their offerings and consistently deliver an alluring online experience. That’s because a recent study found 42% of consumers cite less trust in online shopping due to poor experiences, such as inconsistent pricing and out-of-stock merchandise.6 In response, these e-commerce best practices can help brands improve the customer journey and top line sales.
To help consumers find their products online with ease, brands can use data insights for superior product discovery. Insights help brands know exactly which keywords shoppers search for to earn high visibility rankings among consumers’ online search results. Data analytics direct brands to the most relevant keywords, which they can use in marketing, including product descriptions, for effective online discovery.7
Brands also face increased pressure to keep up with rivals’ real-time pricing changes across retailers’ e-commerce sites, online marketplaces and social media. Insights help brands price competitively across channels by monitoring and promptly adapting to competitors’ online pricing moves. Brands can even use data to ensure merchants consistently respect pricing policies.
Data analytics also help brands measure their marketing effectiveness and popularity across e-commerce
websites, and how they compare to their rivals. Brands can improve how they promote their products by using targeted digital content that resonates. For instance, they can publish unique content on each channel tailored to the platform’s unique algorithm and use data to discover patterns among their top performing campaigns. Also, brands can determine when to use their own social media channels or pay for sponsored ads to drive more sales.
As we saw last March, in-stock merchandise is essential to maximize online sales. Data analytics help brands track their stock status to ensure products are available across all their digital channels for reliable service that sparks more sales.
Brands find new efficiencies
Cost effectiveness is also vital and these e-commerce best practices help brands boost their online efficiencies.
Brands use insights to pinpoint and keep sharing content that effectively resonates with and enages their target audience. They can use data insights to see where to allocate their marketing spend for online promotions and either revitalize or drop underperforming online promotions. Brands can also track whether their online promotions align with rivals’ promotions to stay competitive and agile.
Likewise, measuring a brand’s popularity through consumer reviews reveals which underperforming products to downplay to conserve marketing resources for the specific products and bundles that perform best in their categories. For instance, PepsiCo’s and Kraft Heinz’s new online shops offer only large items or bundles for basket sizes large enough to offset shipment costs.8
To reduce the high cost of product returns, brands can use data insights to prioritize bestselling products rather than items consumers are more likely to send back. Using clear, up-to-date content, including product descriptions with accurate dimensions, can also help online consumers know exactly what they’re buying to minimize returns.
How brands and consumers profit
When brands use insights to make better e-commerce decisions, they can compensate for ballooning expenses. Analytics help brands connect the dots among their online visibility, promotions, performance and reviews. These best practices can give brands an edge by uncovering how to be more aggressive with revenue-earning and cost-cutting opportunities. Brands find effective ways to acquire more online customers to improve their top line and offset e-commerce expenses with new efficiencies. Data-driven digital marketing decisions help brands improve their e-commerce effectiveness to stay profitable and competitive.
Meanwhile, consumers also win by having an inviting, smooth and reliable online shopping experience. They find the products they want with greater ease, and feel confident enough to buy based on information like a brand’s pricing, promotions and product availability.
1 Arora, Arun, Hamza Khan. Sajal Kohli and Caroline Tufft. DTC e-commerce: How consumer brands can get it right. McKinsey & Company. November 30, 2020. 2 Ali, Fareeha. US ecommerce grows 44.0% in 2020. Digital Commerce 360. January 29, 2021. 3 Arora, Arun, Hamza Khan. Sajal Kohli and Caroline Tufft. DTC e-commerce: How consumer brands can get it right. McKinsey & Company. November 30, 2020. 4 Jansen, Caroline, Cara Salpini and Maria Monteros. 8 DTC trends to watch in 2021. Retail Dive. February 3, 2021. 5 Haber, John. Logistics Costs Challenge E-Commerce Profit Margins. Parcel Industry. October 9, 2020. 6 O’Carroll, Derek. 5 Hidden Trends That Will Shape E-Commerce in 2021. Total Retail. February 4, 2020. 7 Leong, Brandon. COVID-19 strategy: Use the power of your digital sell sheet. Digital Commerce 360. August 23, 2020. 8 Arora, Arun, Hamza Khan. Sajal Kohli and Caroline Tufft. DTC e-commerce: How consumer brands can get it right. McKinsey & Company. November 30, 2020.
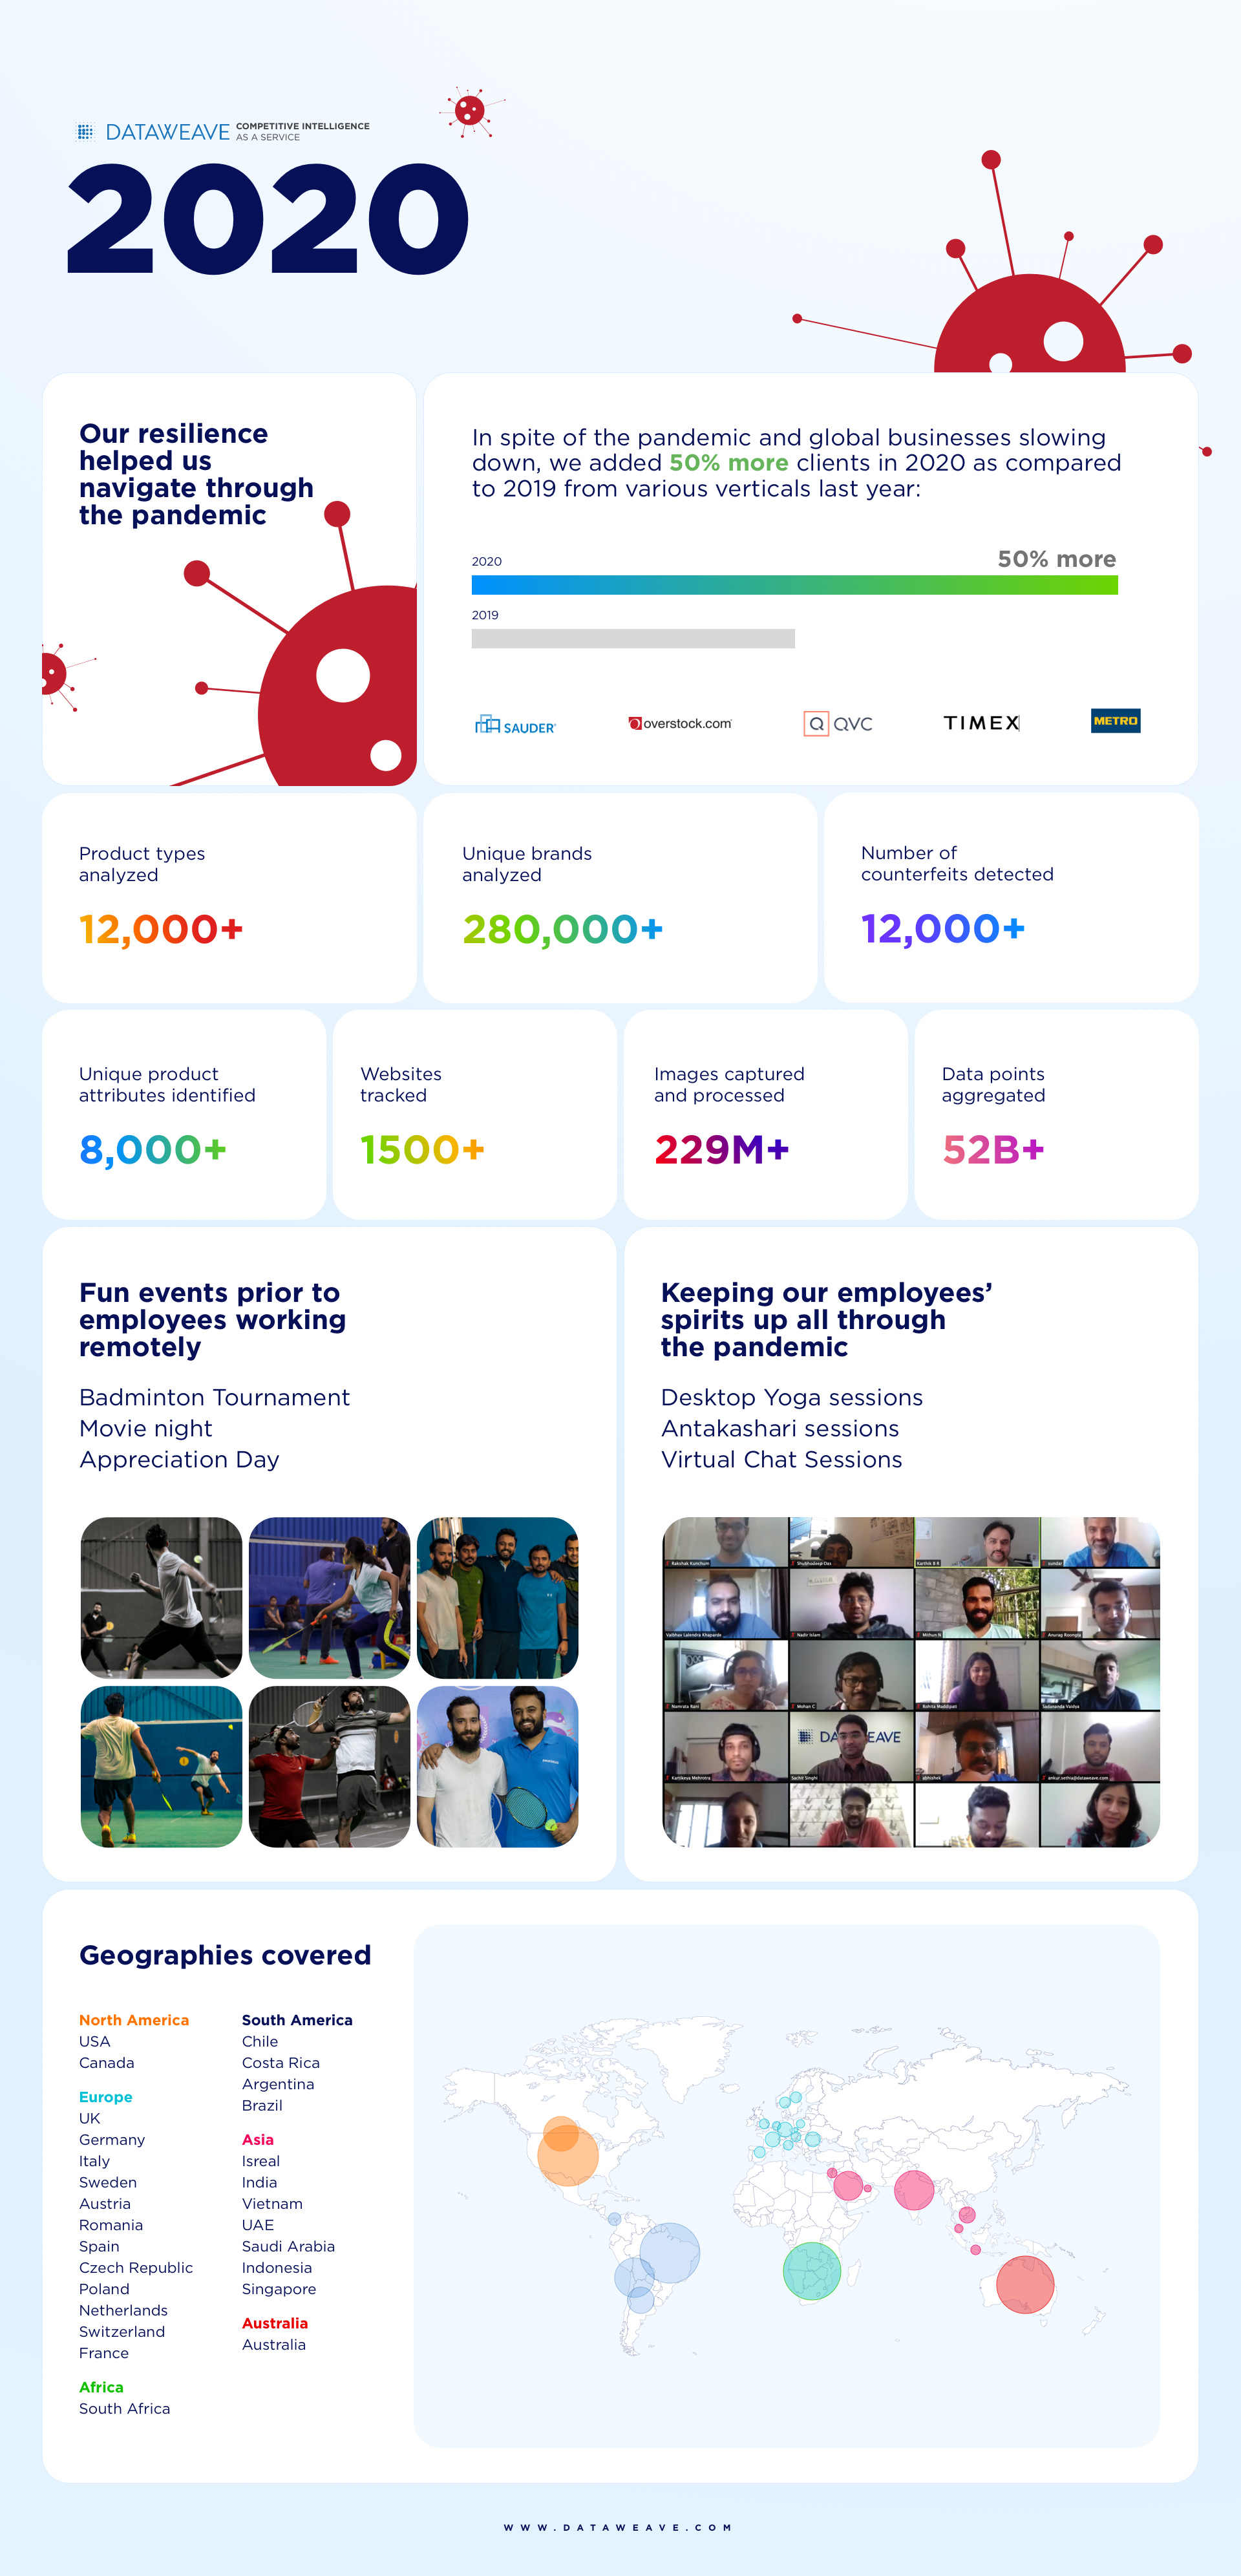
The start of 2020 brought with it the promise of global economic growth. Markets in the US were on a steady rise we also witnessed demand from brands and retailers in Europe and the Middle East. All seemed to be on track to make it a year of plenty.
Out of nowhere, the end of the first quarter saw the world coming to a grinding halt. The world was held hostage by a global pandemic and the force with which we were hit, was unprecedented.
From February to mid-May we saw things come to a sharp halt. We at DataWeave seized this intermittent downtime to bolster our product offerings.
On the flip side, when the world did start opening May onwards, we saw completely new categories take center stage digitally. With new habits and trends taking shape, the pandemic single-handedly caused exceptional growth in the Food and Grocery Delivery intermediaries. Predictably, the rest of the world followed. Our existing customers saw the competition rise steeply with everyone coming online. We invested substantially in our Digital Shelf Analytics solutions after noticing that e-commerce was seeing a boom. 2020 saw brands making their online presence the new norm. This meant that small, medium and large enterprises had to now divert their spending to analytics and e-commerce.
It is interesting to note that the rise in the food and grocery delivery segment gave brands another channel to focus on vis a vis their presence. Brands that were available on these sites focused on how they could optimize their sales on these channels, which proved to be the front runners during the height of the pandemic. While the challenges and opportunities for both these segments overlapped and seemed similar, our solutions helped measure and optimize brand performance across all online channels. Some of the in-demand solutions and analytics we saw our customers use were; share of search, content audit, assortment and availability, pricing and promotions, and ratings and reviews.
There were mixed emotions in the market, with regard to the best use of marketing spends. Human resource and client cutbacks happened across the board. At DataWeave however, we had the pleasure of onboarding 25 new clients including retailers and brands ranging from food and grocery delivery, home improvement from across multiple geographies.
Infographics
Throughout the year, the work never ceased at DataWeave. The team showed incredible resilience while working remotely, making sure our deliverables were being taken care of, at all times. Due to the e-commerce boom and immense pressure from existing and new entrants in the digital space, our clients saw a need to gather more insights. With the given uptick, we are happy to report that our stellar 95%+ accuracy record for in-depth insights at scale, was maintained through the course of all the work done.
Looking forward to the year 2021:
In the US, the adoption of e-commerce accelerated as traditional brick and mortar stores shut down and pivoted. To put things into perspective, e-commerce adoption grew only by 4.3% from 2014 to 2019. In just three months in 2020, e-commerce adoption grew at 4.3%! Add to that, with approved vaccines making their way slowly to the public, we do anticipate the travel sector to open up and we look forward to working with new clients.
Nike’s Chief Executive, John Donahoe recently said, ” We know that digital is the new normal. The consumer today is digitally grounded and simply will not revert back…the shift to online sales could be a permanent trend.” We could not agree more! With online sales here to stay, brand and retailers’ requirements to keep their competitive edge will only continue to grow. We at DataWeave, look forward to delivering the results they want in this new year, and for the years to come.
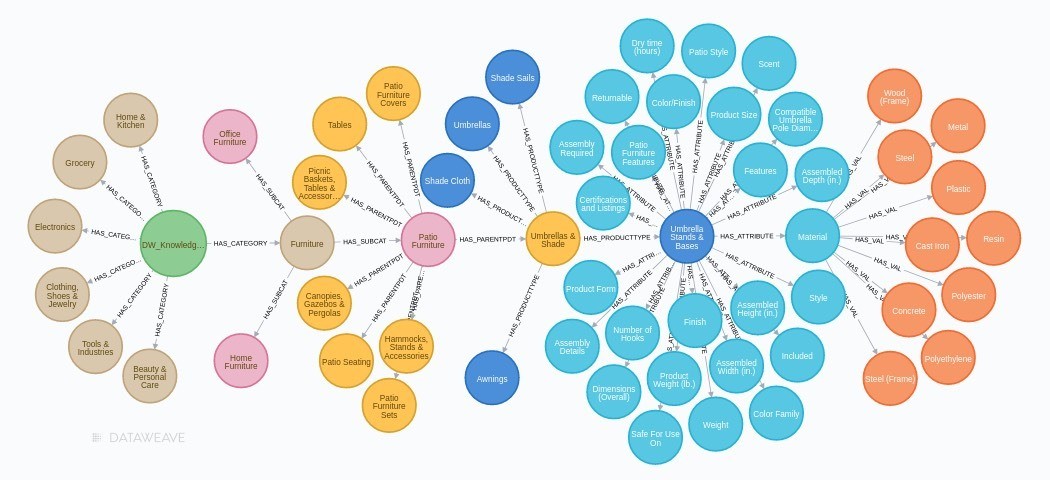
In Part 1 we discussed the importance of Retail taxonomy and the applications of mapping retail taxonomies in Assortment Analytics, building Knowledge Graph, etc. Here, we will discuss how we approached the problem of mapping retail taxonomies across sources.
We solved this problem by classifying every retail product to a standard DataWeave defined taxonomy so that products from different websites could be brought at the same level. Once these products are at the same level, mapping taxonomies becomes straightforward.
We’ve built an AI-based solution that uses state-of-the-art algorithms to predict the correct DataWeave Taxonomy for a product from its textual information like Title, Taxonomy and Description. Our model predicts a standard 4 level (L1-L2-L3-L4) taxonomy for any given product. These Levels denote Category, Sub Category, Parent Product Type and Product Type respectively.
Approach
Conventional methods for taxonomy prediction are typically based on machine learning classification algorithms. Here, we need to provide textual data and the classifier will predict the entire taxonomy as a class.
We used the classification approach as a baseline, but found a few inherent flaws in this:
A Classification model cannot understand the semantic relation between input text and output hierarchy. Which means, it cannot understand if there’s any relation between the textual input and the text present in the taxonomy. For a classifier, the output class is just a label encoded value
Since the taxonomy is a tree and each leaf node uniquely defines a path from the root to leaf, the classification algorithms effectively output an existing root-to-leaf path. However, it cannot predict new relationships in the tree structure
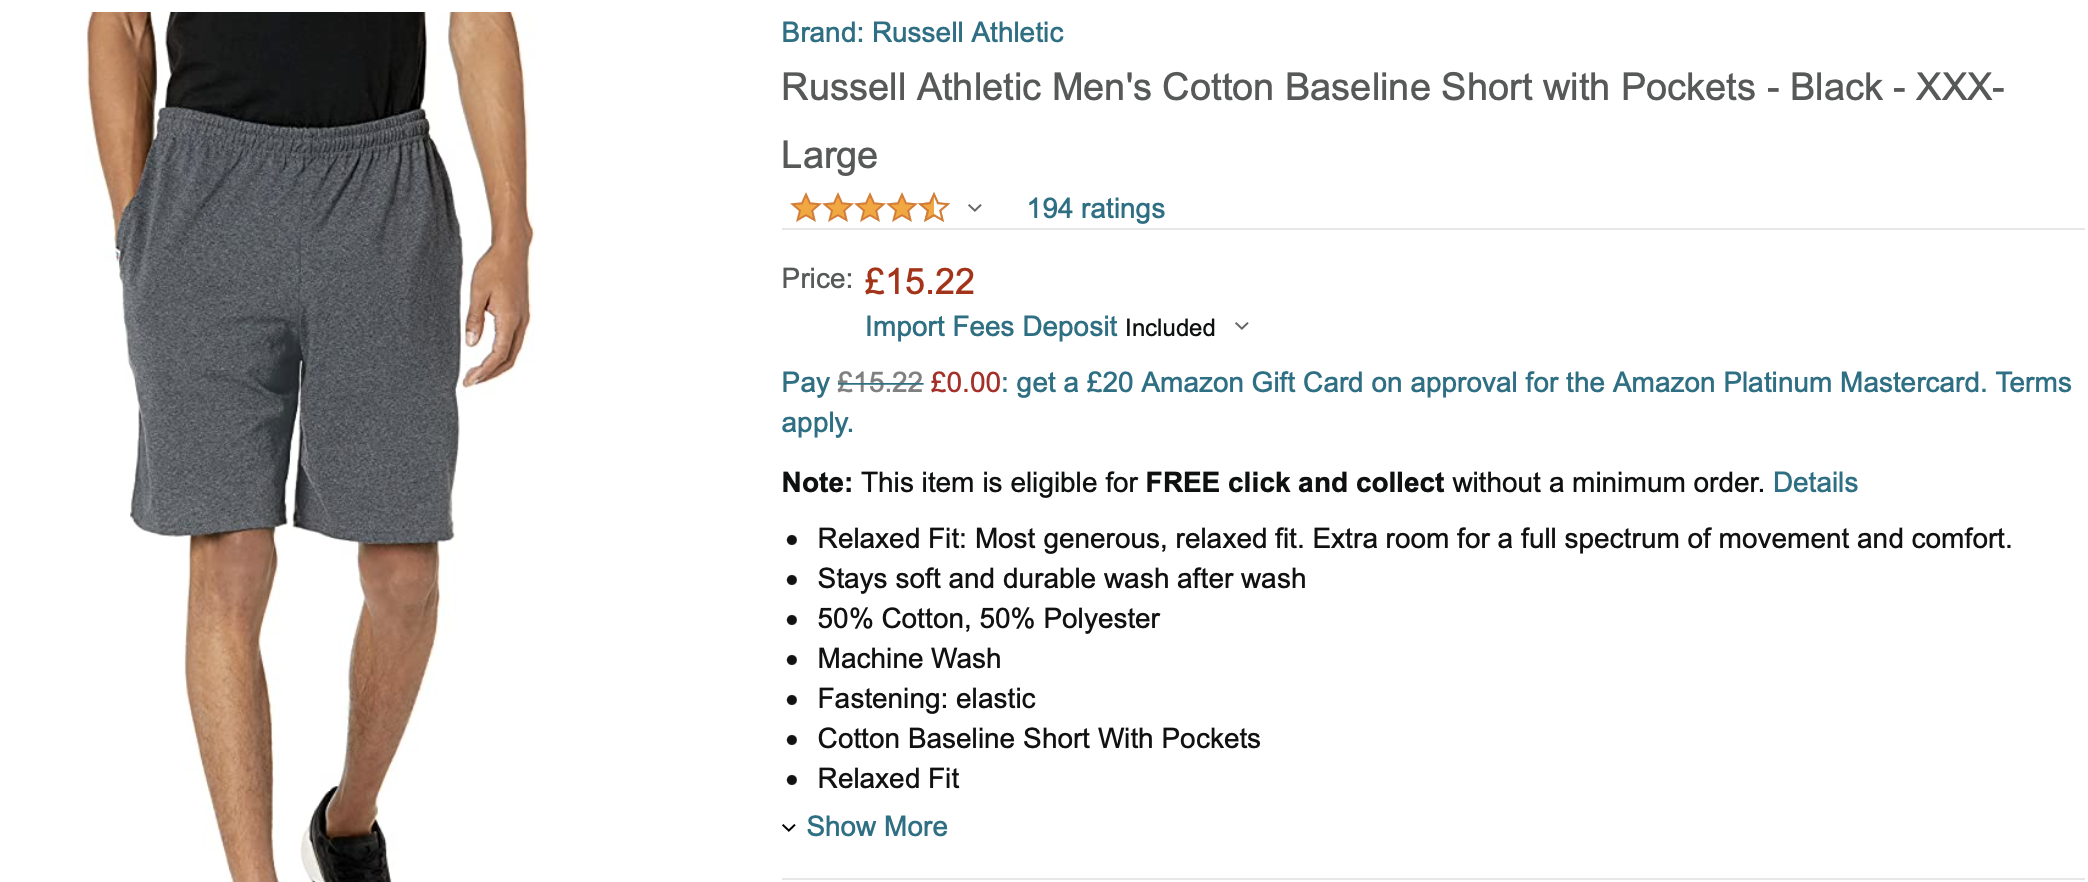
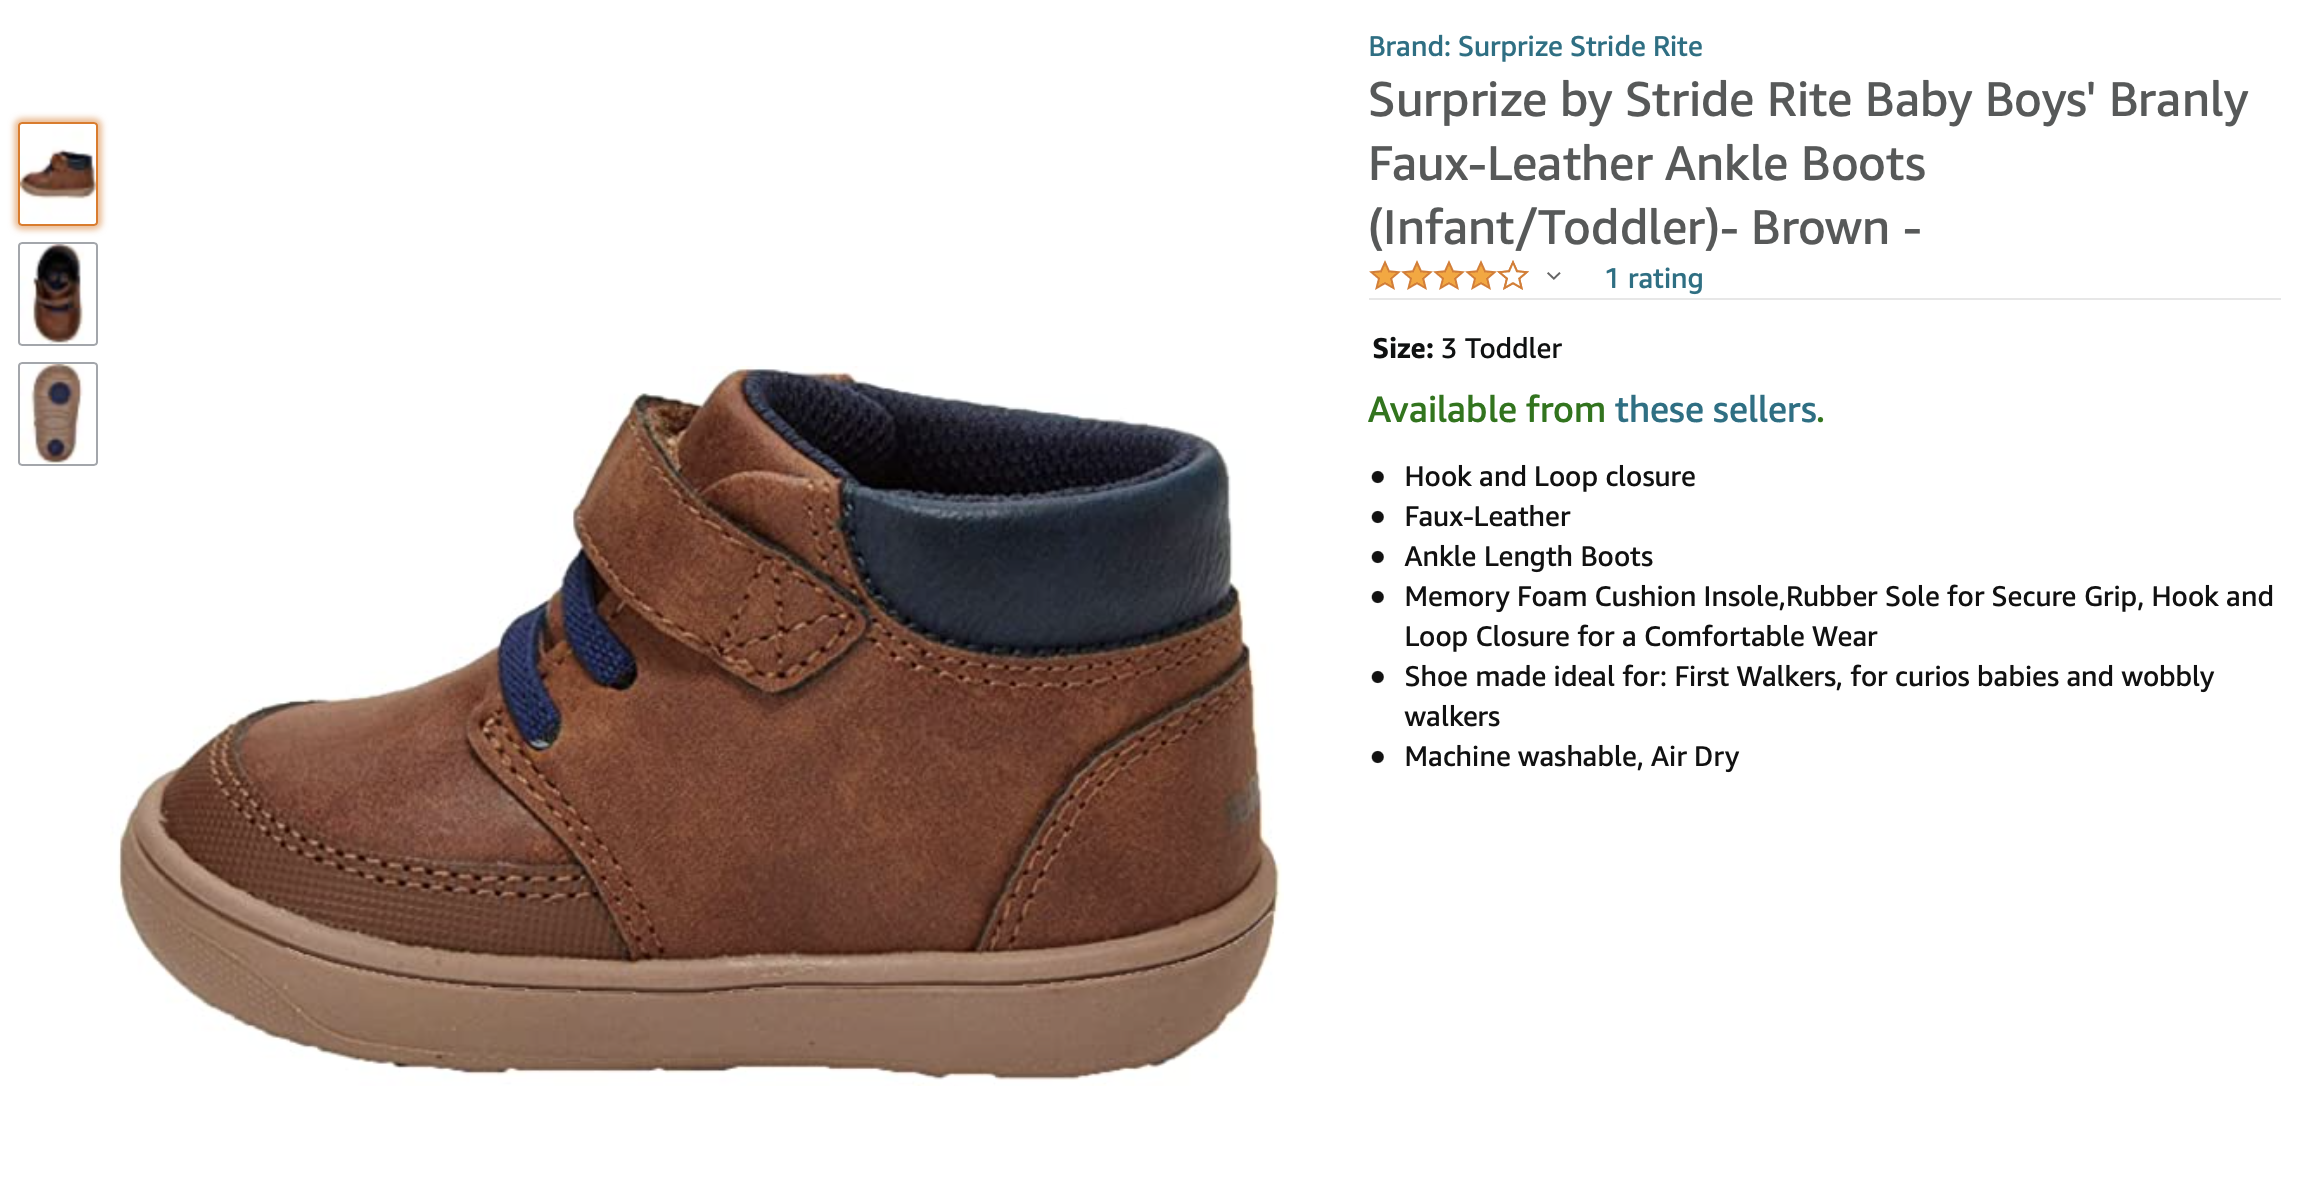
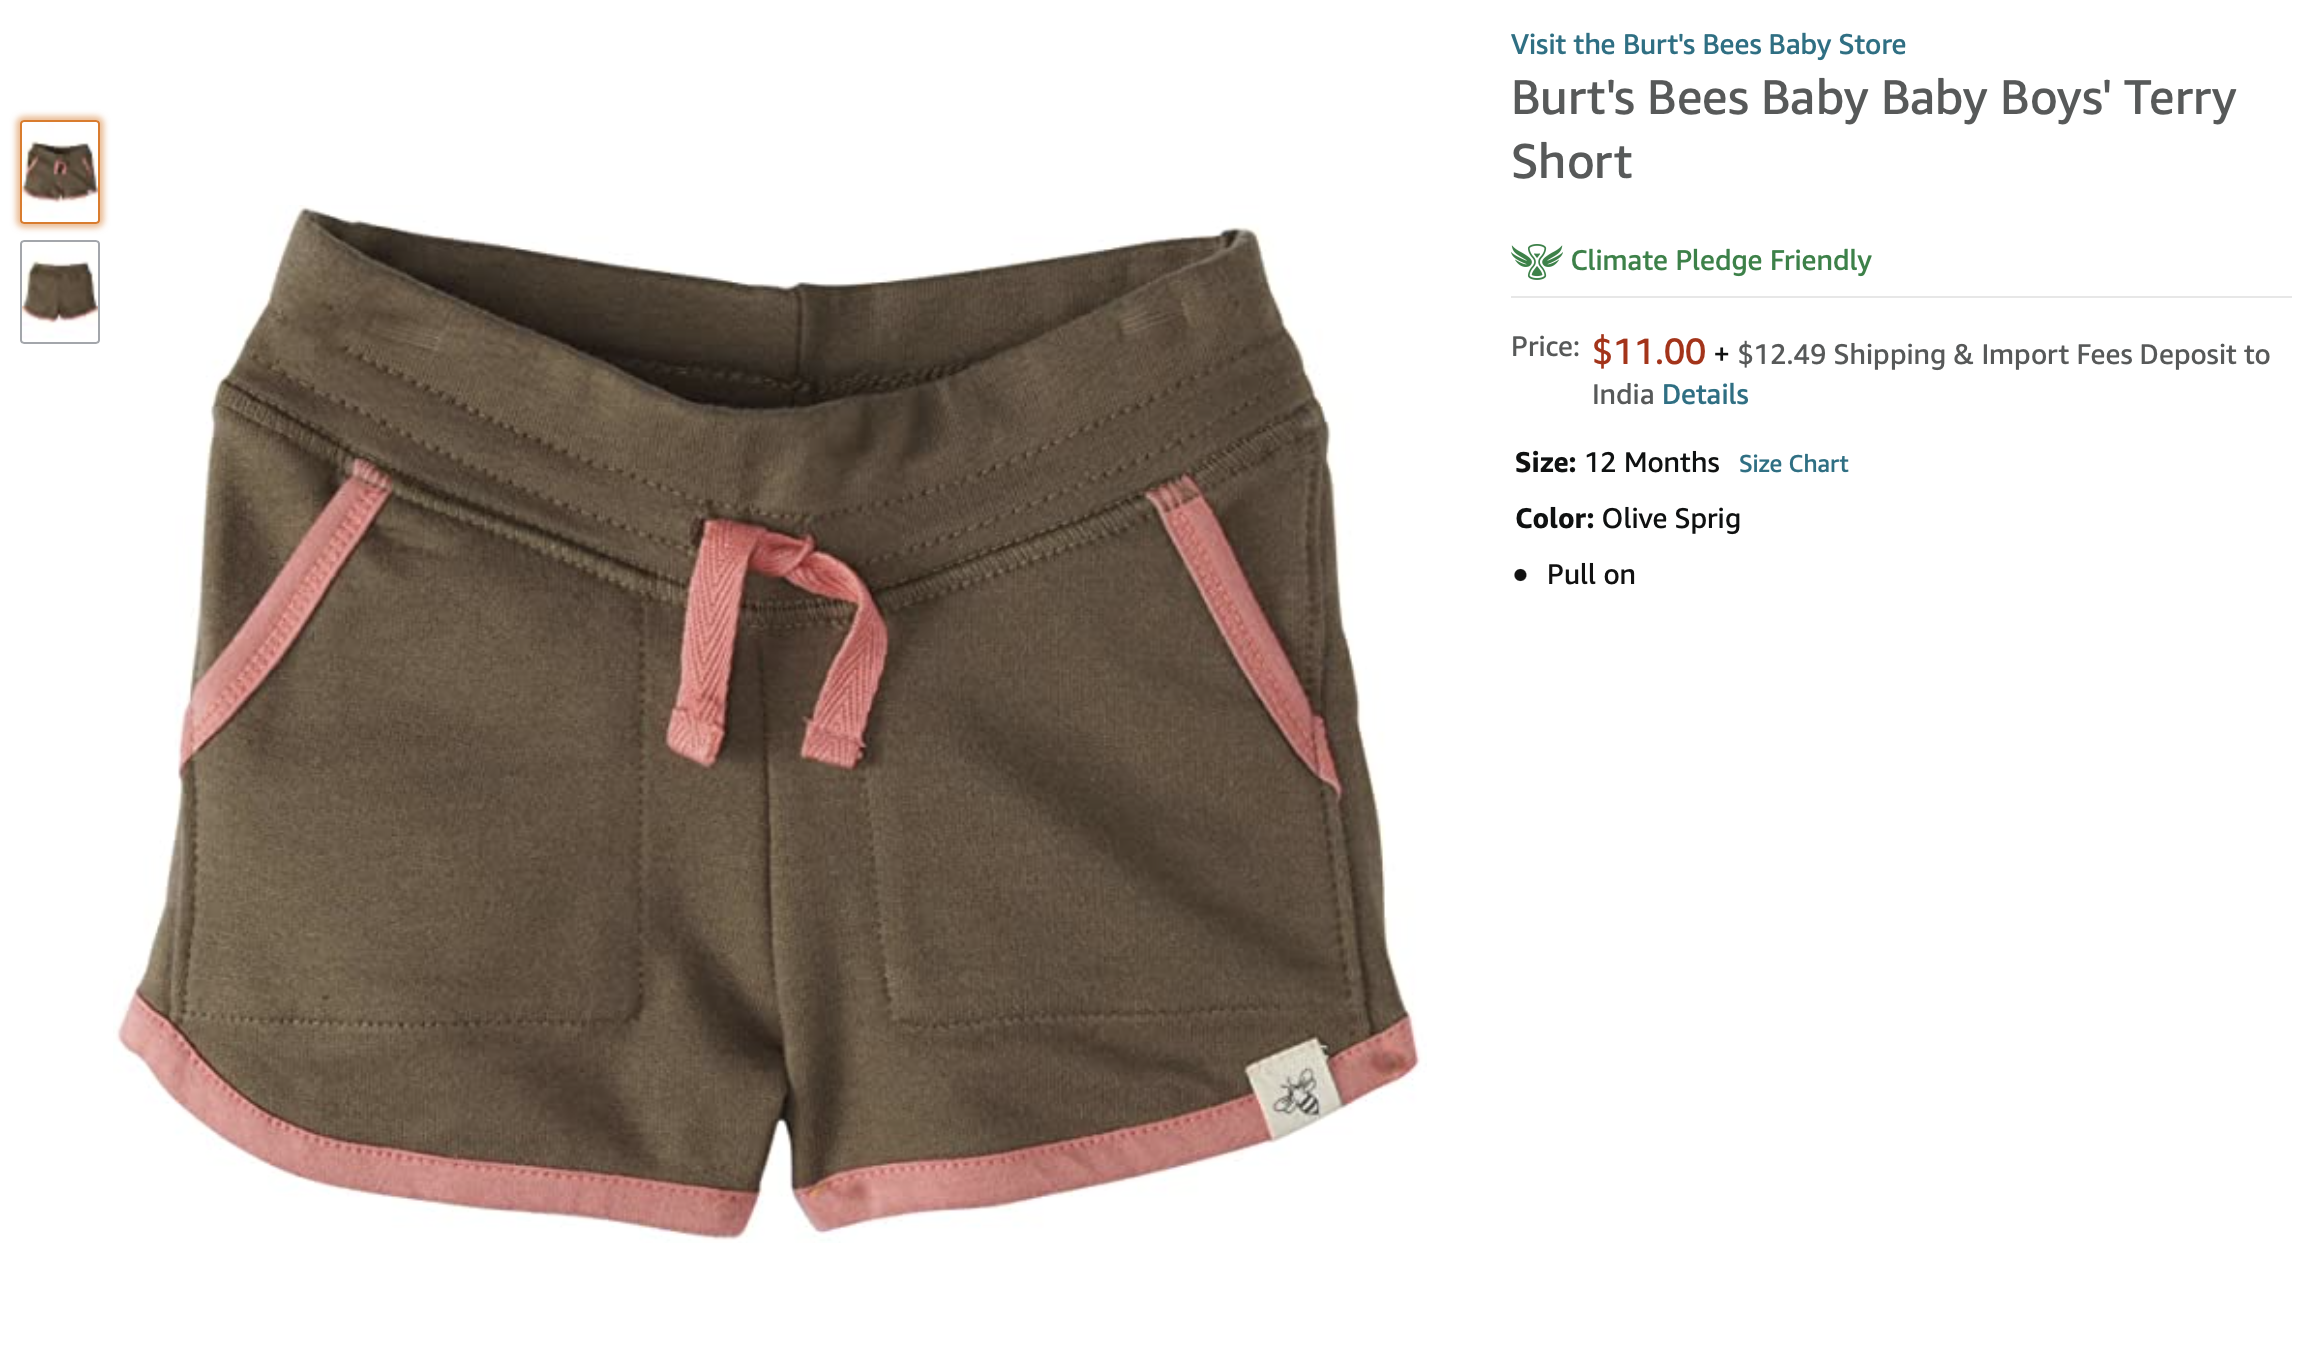
Let’s say, our training set has only the records for “Clothing, Shoes & Jewelry > Men > Clothing > Shorts” and “Clothing, Shoes & Jewelry > Baby > Shoes > Boots”, Example:
{‘title’: “Russell Athletic Men’s Cotton Baseline Short with Pockets – Black – XXX-Large”,
Now, if a product with Title “Burt’s Bees Baby Baby Boys’ Terry Short” comes for prediction, then the classifier will never be able to predict the correct taxonomy. Although, it would have seen the data points of Shorts and Baby.
E-commerce product taxonomy has a very long tail, i.e. there’s a huge imbalance in counts of data per taxonomy. Classification algorithms do not perform well for very long tail problems.
Encoder-Decoder with Attention for Taxonomy Classification
What is Encoder-Decoder?
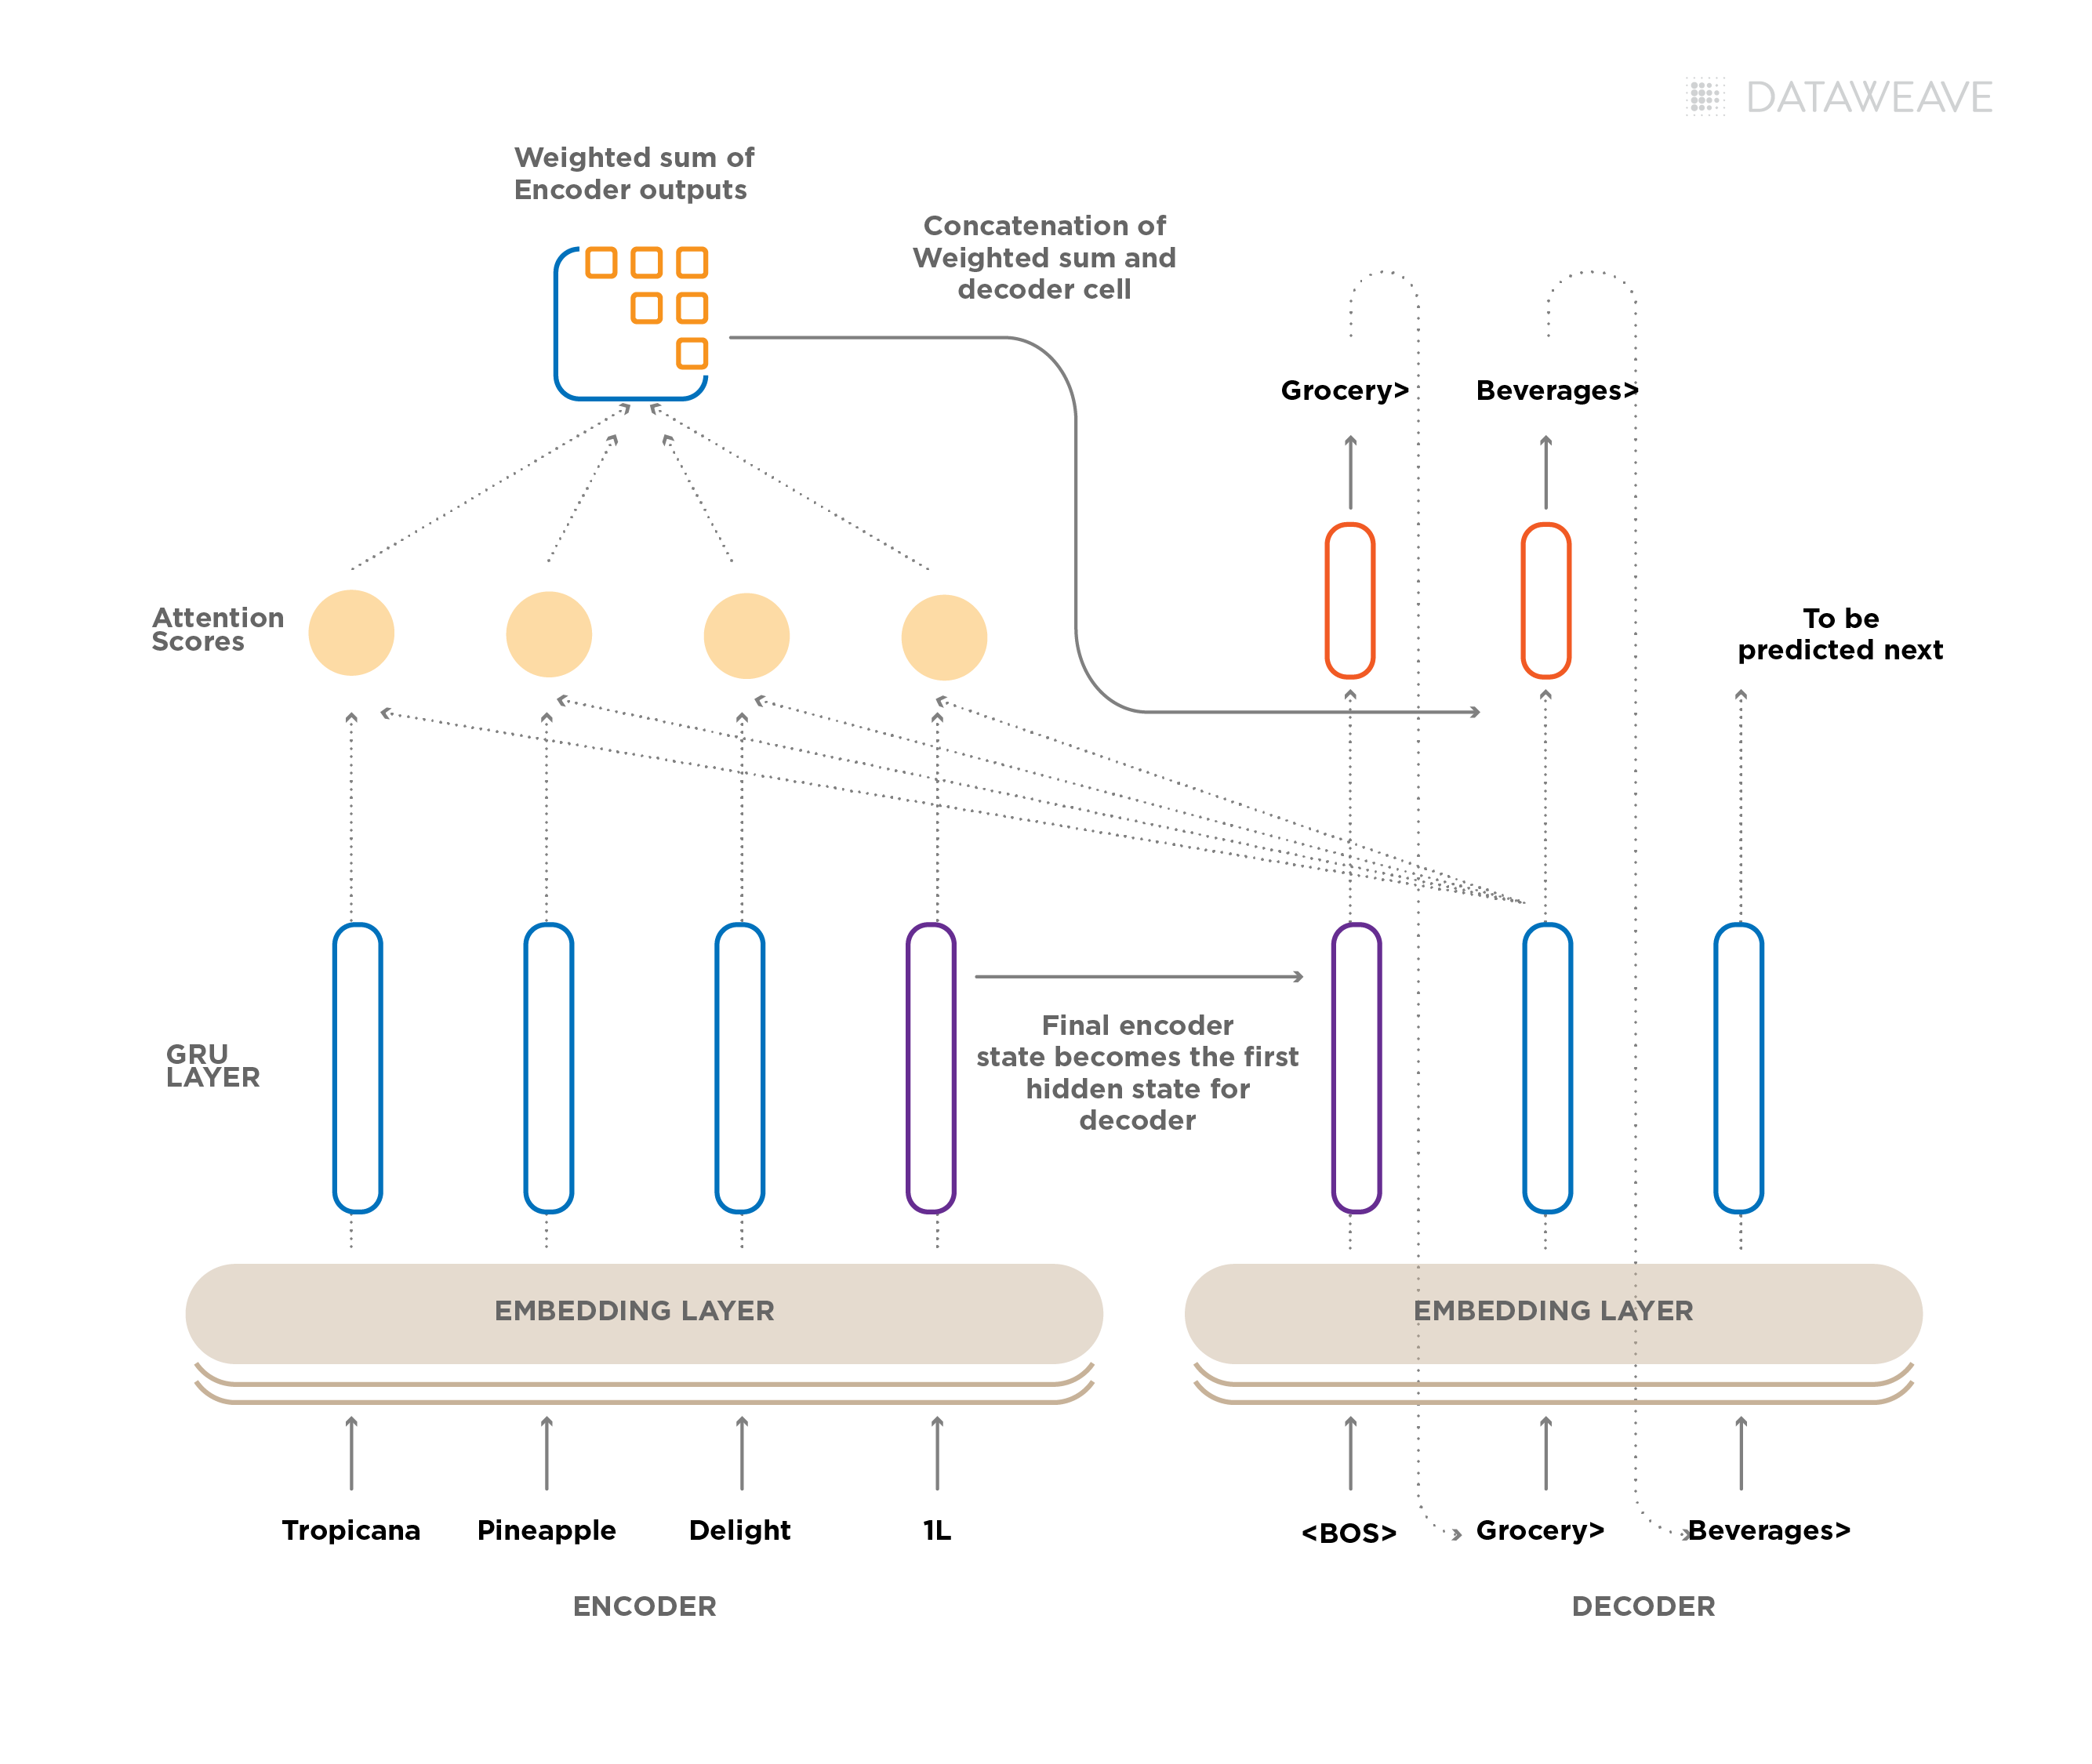
Encoder-Decoder is a classical Deep Learning architecture where there are two Deep Neural Nets, an Encoder and a Decoder linked with each other to generate desired outputs.
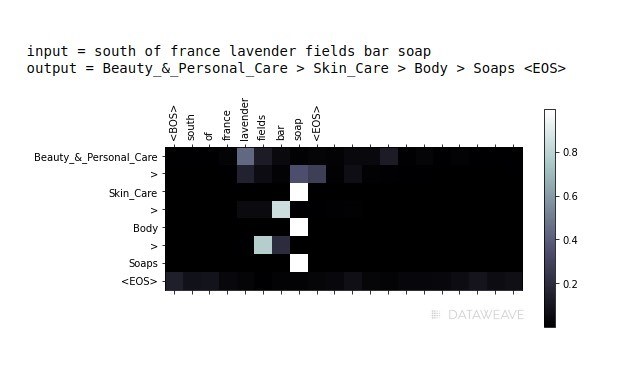
The objective of an Encoder is to encode the required information from the input data and store it in a feature vector. In case of text input, the encoder is mostly an RNN or Transformer based architecture and for image input, it is mostly a CNN-based architecture. Once the encoded feature vector is created, the Decoder uses it to produce the required output. The Encoder and Decoder can be interfaced by another layer which is called Attention. The Role of Attention mechanism is to train the model to selectively focus on useful parts of the input data and hence, learn the alignment between them. This helps the model to cope effectively with long input sentences (when dealing with text) or complex portions of images (when input is an image).
Instead of classification-based approaches, we use an Encoder-Decoder architecture and map the problem of taxonomy classification to the task of machine translation (MT) AKA, Seq2Seq. An MT system takes the text in one language as input and outputs its translation as a sequence of words in another language. In our case, the input maps to the textual description of a product, and the output maps to the sequence of categories and sub-categories in our taxonomy (e.g., Clothing, Shoes & Jewelry > Baby > Shoes > Boots). By framing taxonomy classification as an MT problem, we overcome a lot of limitations present in classical classification approaches.
This architecture has the capability to predict a taxonomy that is not even present in the training data.
Talking about the example we discussed earlier where a traditional classification model was not able to predict the taxonomy for “Baby Boys knit terry shorts – cat & jack gray 12 m”, this Encoder-decoder model easily predicts the correct taxonomy as “ Clothing, Shoes & Jewelry > Baby > Clothing > Shorts”
We achieved a much higher accuracy because the model understands the semantic relationship between the input and output text, as well as giving attention to the most relevant parts in the input, when generating the output
Fig. Attention visualization for product title “South of France lavender fields Bar Soap”. It can be seen from the image that the attention weights of “soap” word is very high when predicting the output at different time-steps.
We used pre-trained fasttext word embeddings to vectorize textual input, pass on to the GRU-RNN based encoder which processes the input sequentially, and generates the final encoded vector. The Decoder which is also a GRU-RNN takes this encoded input and generates the output sequentially. Along with the encoded vector, there is also an attention vector which is passed to the Decoder for the output at every time-step.
We trained both the Classification model (Baseline) and the Encoder-Decoder model for the Fashion category and the Beauty & Personal Care category.
For Fashion, we trained the model with 170,000 data points and validated it on a 30k set. For Beauty Category, we trained the model on 88k data points and validated it on a 20k set. We were able to achieve 92% Seq2Seq accuracy in 1,240 classes for the Fashion category and 96% Seq2Seq accuracy in 343 classes for the Beauty Category, using the Encoder-Decoder approach.
Summary and the Way Forward
Since we moved to this approach, we have seen drastic improvements in the accuracy of our Assortment Intelligence accounts. But the road doesn’t end here. There are several challenges to be tackled and worked upon. We’re planning on making this process language agnostic by using cross-lingual embeddings, merging models from different categories and also using product Image to complement the text-based model with visual input via a Multi-Modal approach.
Every product on a retail website is categorized in such a way that it denotes where the product belongs in the entire catalog. Generally, these categorizations follow a hierarchy that puts the product under some Category, Subcategory and Product Type (Ex. Clothing, Shoes & Jewelry > Men > Clothing > Shirts). We call this hierarchical eCommerce product categorization as Product Taxonomy. Categorizing products in a logical manner – in a way a shopper would find intuitive, helps in navigation when he or she is browsing an e-commerce website.
In addition, with a good category organization, a product lends itself for better searchability (for search engines) on e-commerce websites. Search engines work by looking up query terms in an index which points to products which contain those terms. Matches in various fields are ranked differently in relevance.
For instance, a term that matches a word in the title, indicates greater relevance compared to one which matches the description. Additionally, terms that are exclusive to certain products, signal greater selectivity and hence contribute more to ranking. In light of this, the choice of words in fields indicating a product’s category affects the relevance of search results for a user query. This improves discoverability and as relevant results show up, it in turn improves the user experience. A good product taxonomy contributes to increased sales by helping shoppers find relevant products while browsing or searching.
Retail websites organize products into a taxonomy which they deem intuitive for their users, and fits the organization of their business units. Different retail websites could thus have taxonomies varying significantly from each other. Since we deal with millions of products across hundreds of websites on a daily basis, we often have to work with various taxonomies for the same product coming from different websites.
We are required to align these to a common standard taxonomy for our analyses. Standard taxonomies like Global Product Classification (GPC) taxonomies and Google Product taxonomies offer a standard way of representing a product. However, none of these taxonomies are complete and generic. Hence, we at DataWeave have come up with our own Standard Taxonomies for each category in e-commerce, which are generic enough to represent products on websites across different geographies.
Having a standard taxonomy for each retail product is important for our Data Orchestration pipeline. A Standard Taxonomy helps in enriching the DataWeave Retail Knowledge Graph at scale.
DataWeave’s Retail Knowledge Graph
The information about products on most of the retail websites is unstructured and broken. We process this unstructured data, derive structured information from it and store it in a connected format in our Knowledge Graph. The Knowledge Graph is used in downstream applications like Attribute Tagging, Content Analysis, etc. The Knowledge Graph follows a standard hierarchy of 4 levels (L1 > L2 > L3 > L4) for all the retail products.
Mapping eCommerce retail taxonomies is not only a requirement for the Knowledge Graph, but has some direct business applications as well:
Assortment Analytics
Mapping competitors’ products to their own taxonomies help retailers understand the exact gap in their assortment, regardless of how competitors are categorizing their products
Let’s say a retailer is interested in knowing the assortment of a product type, Scented Candles in their competitor’s catalog. Now, the retailer might have categorized it as Home & Kitchen > Home Decor > Scented Candle but the same product type could have been categorized as Fragrance > Home > Candles on a competitor’s website. Here, having an efficient and scalable mechanism to map product taxonomies provides accurate assortment analytics which retailers look for. Example:
Health & Household > Health Care > Alternative Medicine > Aromatherapy > Candles
Fragrance > Candles & Home Scents > Candles
Automated Catalog Suggestion
It is also used in Catalog Suggestion as a Service, where for any product we suggest the appropriate taxonomy it should follow on the website for a better browsing experience.
Stay tuned to Part-2 to know how we are solving the problem of mapping various retail taxonomies.
Black Friday looked downright sultry with desirable discounts on health and beauty products.
This year, health and beauty sales faced the threat of declining demand, as the pandemic keeps many consumers cooped up at home and in-store product testers no longer allowed. Yet consumers’ enduring desire to look and feel their best means this category will remain resilient. (Plus, we want to look smokin’ hot on Zoom.)
That’s why we were curious to know how retail rivals, ranging from discounters to department stores, are battling it out to become bodacious beauty destinations to win the hearts, wallets and fake lashes of online shoppers.
To calculate which retailers’ prices offered the broadest and most generous discounts, we examined health and beauty products’ pricing at Amazon, JC Penney, Macy’s, Neiman Marcus, Overstock, Nordstrom, Target and Walmart. We compared the pre-sale period (November 24-26) to the holiday sales period (Black Friday on November 27 through Cyber Monday on November 30) for a glimpse of retailers’ pricing strategies in this fiercely competitive category.
To gain insights into retailers’ competitive pricing strategies, we tracked three scenarios: whether prices decreased, increased or remained the same during the last week of November 2020. The vast majority of health and beauty products (91.0%) maintained the same prices during the pre-sale and sales periods. An astounding 99.7% of Target’s health and beauty prices stayed the same during the period.
Amazon had the highest proportion of health and beauty products that offered a price decrease (18.1%), particularly on men’s fragrance, women’s fragrance and men’s hair care. Offering discounts on more items hints that Amazon wants to attract more health and beauty consumers, including men, by making more items affordable. Target offered the lowest proportion of health and beauty products with price decreases (0.8%).
Amazon also had the greatest proportion of health and beauty products with a price increase (7.0%) with 15.3% of men’s fragrance earning a price hike.
On Black Friday, among health and beauty products with price decreases, Target gave the most generous average discount (37.6% vs. 7.2% for Overstock). However, Target’s discounts applied to only 12 products compared to 798 for Overstock.
Common types of health and beauty products with the highest average discount on Black Friday have included face makeup, men’s fragrance, men’s hair care, and shampoo and conditioner.
Among health and beauty products with price increases on Black Friday, Nordstrom had the highest average price hike (43.8% on one women’s fragrance) and Walmart offered the lowest (10.3% on 250 products).
These findings suggest that Target was willing to create aggressive loss leaders in this category and Amazon wanted to boost health and beauty sales among male shoppers.
Black Friday vs. Cyber Monday
This year, most retailers offered more additional discounts on health and beauty products on Cyber Monday than on Black Friday, possibly to prioritize clearing out their inventory before year-end. JC Penney and Macy’s were the exception. Overall, the top product types that received additional discounts included shave and hair removal, women’s fragrance and face makeup.
On Cyber Monday, Amazon offered additional discounts on the greatest proportion of health and beauty products (21.1% vs. 2.1% for Target). Amazon focused on men’s hair care, shampoo and conditioner and face makeup.
Half the retailers (Amazon, JC Penney, Nordstrom and Overstock) offered deeper additional discounts on health & beauty on Cyber Monday than Black Friday, possibly to clear out their inventory before the end of the year. Cyber Monday discounts ranged from 35.0% for Nordstrom to 7.8% for Overstock.
Meanwhile, both Neiman Marcus and Walmart offered the same levels of discounts on both Black Friday and Cyber Monday.
Overall, the types of health and beauty products with the deepest discounts on both Black Friday and Cyber Monday were shampoo and conditioner, men’s hair care and face makeup.
Additional discounts across products by “premiumness” level
For almost all the retailers, the percentage of health and beauty products with additional discounts was higher on Cyber Monday than on Black Friday. Overstock had the highest proportion (20.2%), slightly more than Amazon (20.0%).
JC Penney had a higher percentage of products with additional discounts on Black Friday. Neiman Marcus had the same percentage of products on both sales days.
All the retailers except JC Penney and Neiman Marcus allocated the greatest percentage of their additional discounts to health and beauty products at the high level of premium. The retailers may have wanted to appeal to upscale shoppers and make high premium goods more accessible to a broader audience of consumers.
Half of the retailers (JC Penney, Nordstrom, Target and Walmart) offered deeper discounts on Black Friday than Cyber Monday.
Target offered the most generous discounts on Black Friday with an average additional discount of 39.7%, which ranged from 50.1% on moderately premium health and beauty products to 28.6% for products at a high premium level. Target appeared to make more beauty items, including high premium items, affordable to more consumers to stay competitive as a beauty destination.
Conversely, Amazon, Overstock and Macy’s were more generous with additional discounts on Cyber Monday. Among the high premium level of health and beauty products on Cyber Monday, Macy’s offered the deepest discounts (31.3%), edging out department store rival JC Penney (30.4%) in competing for upscale shoppers.
Health & Beauty’s Ravishing Holiday Prices
This year’s Black Friday and Cyber Monday pricing strategies showed retailers’ attempts to stand out, expand their market reach to stay competitive. Appealing to a broader audience included spanning upscale and value tiers, and wooing more male online shoppers to grow their top line and boost loyalty in an intense category amid a pandemic.
Stay tuned for more Black Friday and Cyber Monday 2020 analysis to discover how retailers strategically price their products to win in leading e-commerce categories.
This year’s COVID-19 pandemic created a seismic shift towards tech, directly affecting retailers’ Black Friday and Cyber Monday pricing strategies for electronics. Prime Day 2020’s new fall date also inevitably influenced pricing and purchasing patterns. If consumers pampered themselves with a 75-inch TV in October, what are the odds they’re in the market for another big-screen TV in late November?
Consumer electronics are perennial holiday bestsellers because they make gift-giving easy, whether we buy them for others or for personal indulgence. Continuous innovation also means a comparatively shorter product lifecycle, making electronics an exciting, progressive retail category.
To determine which retailers’ pricing strategies offered the most generous discounts on electronic products, we examined electronics pricing at Amazon, Best Buy, Overstock, Target and Walmart. We compared during the pre-sale period (November 24-26) to the holiday sales period (Black Friday on November 27 through Cyber Monday on November 30) for a glimpse of retailers’ pricing strategies to stay competitive in 2020.
For competitive pricing insights, we tracked three scenarios before and during 2020’s traditional holiday sales season: whether prices decreased, increased or remained the same. Most strikingly, the overwhelming majority of electronics products (89.8%) maintained the same prices during the pre-sale and sales periods. For instance, Target kept a whopping 98.0% of its electronics prices the same during the period.
Amazon had the greatest proportion of electronics products that offered a price decrease (11.7%), particularly on laptops, mobiles and wearable technology. These results also suggest Amazon wants to reach more consumers by making more electronics affordable with discounts. Target offered the lowest proportion of electronics with price decreases (2.5%).
Overstock had the greatest proportion of electronics products that offered a price increase (10.7%) with 30.3% of TVs increasing in price. Best Buy offered the lowest proportion of electronics with price increases (1.2%).
Among electronics products with price decreases on Black Friday, Best Buy offered the highest average discount (16.6%) and Amazon offered the lowest (10.2%). Among all the retailers, the types of electronics with the highest average discount included tablets, headphones, laptops and TVs.
Among electronics products with price increases on Black Friday, Best Buy had the highest average price hike (30.2%) and Amazon offered the lowest (9.8%). That said, Best Buy increased the price of one laptop by 73.1% whereas Amazon increased the price of 44 laptops by an average of 4.2%.
These findings show that Best Buy aggressively protected its market share in this competitive category by offering the most generous discounts.
Black Friday vs. Cyber Monday
Without exception, the retailers offered more additional discounts across the electronics category on Cyber Monday than on Black Friday. Retailers may have wanted to clear out their inventory to make room for new, innovative products in their assortments.
Amazon had the greatest proportion of electronics with additional discounts on Cyber Monday (15.7%, which is more than double the 7.3% each for Overstock and Target). Amazon’s additional discounts focused on mobiles, laptops and wearable technology.
Overall, the greatest proportion of additional discounts on electronics on Cyber Monday focused on laptops, desktops and USB flash drives.
While most retailers offered deeper discounts on electronics on Cyber Monday than Black Friday, Overstock was the sole exception.
On Cyber Monday, Target offered the most generous average additional discounts (19.6% vs. 10.2% for Amazon); however, Target’s discounts applied to 260 electronics products compared to 924 for Amazon.
Overall, the types of electronics with the deepest discounts on Cyber Monday on electronics were USB flash drives, tablets and headphones.
Additional discounts across products by “premiumness” level
When we examine electronics’ additional discounts according to the products’ premium level, several patterns stand out.
Most apparent is that every retailer offered a higher proportion of additional discounts on Cyber Monday compared to Black Friday, ranging from 15.9% for Amazon to 6.4% for Best Buy.
With only one exception, Amazon offered the greatest proportion of additional discounts across all premium levels. Only Target offered a slightly higher proportion among low premium electronics (11.9% vs. 11.3% for Amazon). This approach could help Amazon make more electronics products more affordable to more consumers and boost its reach in this competitive category.
Among electronic items at the high premium level, Amazon was most aggressive in allocating additional discounts (21.0% vs. 5.4% for Target), which could help the e-commerce giant earn top-of-mind status among affluent shoppers in the market for big-ticket electronics.
Most retailers (Amazon, Best Buy and Walmart) offered deeper discounts on Cyber Monday than Black Friday. By contrast, Overstock and Target were more generous on Black Friday.
Interestingly, Target’s average additional discount on Cyber Monday (18.8%) was still more generous than those of the other retailers.
Among moderately premium items, Target’s average additional discount was 22.3%, more than double Amazon’s 10.3%. Target may have tried to make mid-market electronics more affordable to its core audience of value-seeking shoppers.
Additional discounts across products by “popularity” level
A review of retailers’ additional discounts by electronics’ popularity level reveals that most retailers allocated a bigger proportion of discounts on Cyber Monday than on Black Friday. Overstock was the exception. Again, clearing out 2020 inventory before year-end likely influenced retailers’ pricing strategies.
Overall, on Cyber Monday retailers showed a direct relationship between additional discounts and electronics’ popularity levels. For instance, Amazon offered additional discounts on 21.7% of highly popular electronics and 15.3% on moderately popular electronics. Since Amazon strives to be “The Everything Store,” it makes sense to make more products more appealing and affordable to more consumers. Meanwhile, Target offered nearly double the proportion of additional discounts of less popular electronics than discount rival Walmart (12.5% vs. 6.7%) to tempt value-seekers with deals.
Most retailers (Amazon, Best Buy, Target and Walmart) offered deeper discounts on Cyber Monday than Black Friday. Overstock was more generous on Black Friday.
On Cyber Monday, Target’s average additional discount (21.8%) was the most generous of all the retailers, nearly double that of Amazon (11.1%). However, Target’s discounts applied to 259 electronics products. vs. 903 for Amazon.
Both Amazon and Overstock gave their most generous discounts to less-popular electronics, possibly to clear out their inventory to make room for more popular or higher-margin items.
Black Friday & Cyber Monday 2020 Electronics Pricing Strategies
This year, the pandemic jolted consumers to focus on digital technology to stay connected to work, school and retail, which heightened demand for electronics.
In response, retailers’ 2020 pricing strategies for Black Friday and Cyber Monday suggest a desire to extend their reach beyond their core audience to maximize their brand appeal and steal rivals’ market share.
The Cyber Monday findings, in particular, suggest retailers decluttered their assortments to make space for the latest and highest-margin tech gadgets in time for Christmas.
Click here for more Black Friday and Cyber Monday 2020 analysis for greater clarity on the evolving pricing positions of retail rivals across top e-commerce categories.
As most of us stay home for the holidays this year, retailers hope we’ll invest in our nest.
The global pandemic ignited sales in the red-hot home furniture category, as our domestic comfort, functionality and aesthetics suddenly became urgent priorities in 2020. Now we’re investing more in domestic leisure, organizing and redecorating as our consumption habits shift.
That’s why we wanted to know how retailers adapted their Black Friday and Cyber Monday furniture pricing strategies to meet consumers’ needs. For instance, did retailers give the best deals on low-commitment furniture like area rugs or on big-ticket items like dining room sets?
To pinpoint which retailers offered the greatest proportion of discounts and the deepest discounts, we reviewed furniture at Amazon, Home Depot, JC Penney, Overstock, Target, Walmart and Wayfair. We compared the pre-sale period (November 24-26) to the holiday sales period (Black Friday on November 27 through Cyber Monday on November 30) to monitor retailers’ furniture pricing moves.
Top product types by additional discount
To review retailers’ holiday pricing strategies in the furniture category, we tracked three scenarios: whether prices decreased, increased or remained the same during the last week of November 2020.
The proportion of furniture items that maintained the same prices during the pre-sale and sales periods ranged widely, from 91.6% for Home Depot to only 22.6% for Wayfair.
That’s because Wayfair had by far the highest proportion of furniture with a price decrease (77.2% on 4254 products vs. 7.1% on 342 products for Home Depot). Since Wayfair specializes in home décor, it makes sense for the retailer to aggressively distribute discounts across its furniture assortment.
Among all retailers, the top types of furniture with discounts included bookcases, entertainment units, sofas and storage and cabinets. These findings suggest we are investing in domestic leisure, relaxation and organization.
On Black Friday, JC Penney offered the most generous average discount (21.3% vs. 4.6% for Wayfair). This means that although Wayfair spread discounts across its furniture subcategories, the actual discounts were lower than rivals’.
Types of furniture with the highest average discount on Black Friday at JC Penney included storage and cabinets, bookcases and rugs. These products tend to be affordable additions to our homes compared to bigger investments like a dining room set.
Black Friday Vs. Cyber Monday
On Cyber Monday, Target offered additional discounts on the greatest proportion of furniture (27.4% vs. 7.8% for JC Penney). These findings suggest Target really wants to be a convenient option for shoppers, including their home furnishing needs.
Among all retailers, the top types of discounted furniture included rugs, beds and entertainment units.
Most retailers offered deeper additional discounts on furniture on Cyber Monday than Black Friday, possibly to maximize sales before the end of the year. Cyber Monday discounts for furniture ranged from 20.9% for JC Penney to 4.9% for Wayfair. Among all retailers, the top types of furniture that received discounts on Cyber Monday were rugs, storage and cabinets and dining table sets, which show that redecorating and organizing were in style this holiday season.
Additional discounts across product “premiumness” levels
Nearly all retailers had a higher proportion of furniture with additional discounts on Cyber Monday than on Black Friday. Wayfair had the highest proportion (79.2% for both Cyber Monday and Black Friday vs. 9.3 for Home Depot). Wayfair’s use of discounts across all premium levels on both major sales days shows the retailer wants to extend its brand reach, own this category and earn top-of-mind status across diverse furniture shoppers at all price points.
Only JC Penney had a higher percentage of furniture with additional discounts on Black Friday.
Every retailer offered deeper discounts on Cyber Monday than Black Friday, likely to clear out 2020 merchandise.
On Cyber Monday, JC Penney offered the most generous furniture discounts, with an average additional discount of 38.0%, which ranged from 35.1% at the low premium level to 40.9% at the moderately premium level. Aggressive discounts could set JC Penney apart among department stores and attract more low- to mid-market consumers with tempting furniture deals.
Also, most retailers gave the deepest discounts on furniture at the high premium level, which can help to make upscale items accessible and affordable to a greater number of consumers.
Additional discounts across product “popularity” levels
Almost all retailers offered a greater proportion of additional furniture discounts on Cyber Monday than on Black Friday, ranging from 67.6% for Wayfair to 7.8% for Home Depot.
Across all levels of popularity for furniture, Wayfair dominated with discounts on the most diverse array of products to give more furniture shoppers an opportunity to save money.
Meanwhile, Amazon and JC Penney offered the greatest proportion of discounts at the low level of popularity, possibly to declutter their furniture assortment to make room for in-demand products.
Nearly every retailer offered deeper discounts on furniture on Cyber Monday than on Black Friday, with JC Penney being the most generous (39.1% vs. 5.3% for Wayfair).
Home Depot and Wayfair prioritized discounts among less popular furniture, likely to clear them out and make more room in their assortments for items people really want.
Amazon and Walmart gave deeper discounts on highly popular furniture to battle it out over bestsellers.
Holiday Furniture Pricing Inspires Us to Reimagine Our Space
This year, more consumers decluttered their homes and more retailers decluttered their furniture assortment by clearing out 2020 merchandise with desirable deals on Black Friday and Cyber Monday.
The findings of this pricing analysis hint at retailers’ competitive positioning. To own the furniture category, Wayfair aggressively allocated discounts across its assortment even if rivals gave deeper discounts. Target’s deep discounts helped to position the chain as a convenient option for shoppers’ cross-category needs, including furniture. JC Penney’s astonishingly deep discounts on Black Friday and Cyber Monday could help to liquidate inventory, whereas Amazon and Walmart battled over bestsellers.
Click here for more Black Friday and Cyber Monday analysis to learn about retailers’ holiday pricing strategies during 2020’s e-commerce boom.
Retailers really wanted to dress us up this holiday season.
This year’s Black Friday and Cyber Monday fashion pricing trends reflect how retailers have responded to the pandemic’s influence on apparel shopping to boost their resilience and competitiveness.
For instance, since most consumers now cocoon at home, few of us are likely to splurge on fancy gowns or suits as holiday gifts for ourselves or others. That’s why we wanted to know which retailers doubled down on Black Friday fashion discounts and which ones used Cyber Monday discounts to make room for in-demand merchandise.
To calculate which retailers’ prices offered the greatest proportion of discounts and the deepest discounts, we analyzed men’s and women’s fashions at Amazon, Bloomingdale’s, JC Penney, Macy’s, Neiman Marcus, Overstock, Nordstrom, Target and Walmart. We compared the pre-sale period (November 24-26) to the holiday sales period (Black Friday on November 27 through Cyber Monday on November 30) to gain insights into retailers’ pricing strategies in fashion.
Top product types by additional discounts- Men’s fashion
To review retailers’ holiday pricing strategies, we tracked three scenarios: whether prices decreased, increased or remained the same during the last week of November 2020.
The overall proportion of men’s fashion items that maintained the same prices during the pre-sale and sales periods was 88.6%, ranging from 99.5% for JC Penney to 75.0% for Neiman Marcus.
Neiman Marcus had the highest proportion of men’s fashions with a price decrease (25.0% vs. 1.4% for JC Penney). Top types of men’s fashions that had discounts were formal shoes, jackets and coats, and sports shoes. These findings seem to reflect how we rarely go out during the pandemic yet we’re exercising more.
In addition, Amazon and Walmart were most active in offering discounts across all men’s fashion subcategories with Amazon offering more than double Walmart’s percentage of products discounted (15.9% vs. 7.1%).
On Black Friday, JC Penney offered the most generous average discounts (35.6% vs. 9.4% for Overstock). While that contrast seems dramatic, it’s important to note JC Penney’s discounts applied to only 8 products compared to 929 for Overstock.
Men’s fashions with the highest average discount on Black Friday included formal shoes, jackets and coats and jeans.
Top product types by additional discounts- Women’s fashion
For women’s fashions we also tracked whether prices decreased, increased or remained the same during the last week of November 2020. The vast majority of women’s fashions (89.3%) maintained the same prices during the pre-sale and sales periods. A whopping 99.3% of Target’s women’s fashion prices stayed the same.
Neiman Marcus had the highest proportion of women’s fashions with a price decrease (33.4%), particularly on casual shoes, t-shirts and lingerie. JC Penney and Target offered the lowest proportion of price decreases on women’s fashions (1.9%).
Similar to men’s fashions, Amazon and Walmart offered price discounts across all the women’s fashion subcategories with Amazon offering a higher proportion of products with discounts. (10.7% vs. 7.7% for Walmart)
On Black Friday, JC Penney offered the most generous average discounts (45.0% vs. 12.2% for Overstock) yet JC Penney’s discounts applied to only 28 products compared to 1952 for Overstock.
The types of women’s fashions with the highest average discount on Black Friday included tops, casual shoes and handbags. Perhaps women pampered themselves with a new purse and new tops to look chic on Zoom calls.
Black Friday Vs Cyber Monday
During this year’s holiday sales events, almost all retailers offered more additional discounts on men’s and women’s fashion on Cyber Monday than on Black Friday, possibly to sell off seasonal inventory before year-end. Nordstrom was the only exception, offering more discounts on Black Friday.
On Cyber Monday, Target offered additional discounts on the greatest proportion of men’s fashions (63.3% vs. 10.6% for Walmart). Top types of men’s fashions with discounts included underwear, jeans, jackets and coats.
Similarly, Target offered additional discounts on the greatest proportion of women’s fashions on Cyber Monday (79.4% vs. 3.2% for JC Penney). The most common types of discounted women’s fashions were dresses and jumpsuits, t-shirts and casual shoes.
These findings suggest Target is aggressively pursuing value shoppers and positioning the chain as a convenient source for all the whole family’s apparel needs.
Most retailers (Amazon, Nordstrom, Overstock, Target and Walmart) offered deeper additional discounts on men’s fashions on Cyber Monday than Black Friday, possibly to maximize year-end sales and clear out seasonal inventory. Cyber Monday discounts for men’s fashions ranged from 29.8% for Nordstrom to 11.0% for Overstock. Top types of men’s fashions that received Cyber Monday discounts included jackets and coats, formal shoes, sunglasses and t-shirts, which reflect how men are going out less.
Conversely, most retailers (JC Penney, Macy’s, Neiman Marcus, Nordstrom and Walmart) offered deeper additional discounts on women’s fashions on Black Friday than Cyber Monday, possibly to entice women to get a jumpstart on the holiday sales weekend to maximize top line performance in this competitive category. Black Friday discounts for women’s fashions ranged from 45.0% for JC Penney to 12.2% for Overstock. Top types of women’s fashions with Black Friday discounts included swimwear, lingerie and t-shirts, which reflect seasonal merchandise.
Additional discounts across products by “premiumness” level
For almost every retailer, the percentage of fashions with additional discounts was higher on Cyber Monday than on Black Friday. Target had the highest proportion (62.7% vs. 5.7% for JC Penney). It appears Target really wants to win value-seeking apparel shoppers, by offering additional discounts on 93.3% of fashions at the low premium level (vs. 4.6% for Walmart).
By contrast, Nordstrom had a higher percentage of fashions with additional discounts on Black Friday.
Most retailers (Amazon, Bloomingdale’s, Neiman Marcus, Overstock, Target and Walmart) offered deeper discounts on Cyber Monday than Black Friday, likely make room for new seasonal merchandise.
Neiman Marcus offered the most generous fashion discounts on Cyber Monday with an average additional discount of 30.1%, which ranged from 31.7% at the high premium level to 28.9% at the low premium level. This aggressive discounting could help Neiman Marcus stand out among department stores, and extend its reach and appeal by making fashions more affordable across price points.
Conversely, JC Penney, Macy’s and Nordstrom offered deeper discounts on Black Friday. All three department stores were most generous at the low premium level for fashions, with JC Penney offering the deepest discounts (47.8%) to turn low premium fashions into irresistible Black Friday bargains.
Additional discounts across products by “popularity” level
Almost all retailers offered a greater proportion of additional fashion discounts on Cyber Monday than on Black Friday, ranging from 69.2% for Target to 5.2% for JC Penney, with a direct relationship between product popularity and additional discount percentage. Across all levels of popularity for fashions, Target was by far the most aggressive with discounts to appeal to the broadest variety of fashion shoppers.
Only Nordstrom offered a higher proportion of additional discounts on fashions on Black Friday, focusing on both high and low levels of popularity.
Most retailers (Amazon, Neiman Marcus, Overstock, Target and Walmart) offered deeper fashion discounts on Cyber Monday than on Black Friday, with both Neiman Marcus and Target being the most generous (28.8%). Amazon and Neiman Marcus were most generous with discounts among less popular items, while Overstock, Target and Walmart were most generous among moderately popular fashions.
Conversely, JC Penney, Macy’s and Nordstrom offered more generous fashion discounts on Black Friday, with JC Penney being the most generous (39.2%). All three retailers offered the deepest discounts at the low level of popularity, possibly to make room for in-demand fashion items.
2020’s Fashionable Holiday Prices
As this year’s Black Friday and Cyber Monday fashion pricing results show, we prioritized comfort and basics over debonair formalwear. Since staying at home is in style, many retailers discounted dressier attire.
In terms of competitive pricing strategies, Target’s aggressive discounts could boost the chain’s appeal among diverse fashion shoppers. Also, Neiman Marcus stood out among department stores by extending its reach and affordability across pricing tiers.
Click here for more Black Friday and Cyber Monday analysis to learn about retailers’ holiday pricing strategies during 2020’s e-commerce boom.
‘Make in India’ is a headline you’re likely to have seen smeared across newspapers or as campaign rhetoric. E-retailers in India were mandated to display the country of origin against all the products starting 1st August, 2020. The rationale behind this move was to provide the customer the information which would aid the government to accelerate their plans on curbing imports.
To get an idea of the extent that this was followed, we looked at 29,000+ products on Amazon and 20,000+ products on Flipkart, across popular categories.
What our data revealed (illustrated in the chart above) is that Flipkart had updated the country of origin information for 91% of the products while Amazon had updated for only 56%. In categories like Grocery/ Cooking Essentials and Personal Care, Flipkart updated this information across 100% of products that we looked at.
The chart above reveals interesting insights into the respective product mixes of Flipkart and Amazon. We narrowed our study to three categories that stood out; Electronics, Baby products and Men’s’ fashion. These are the categories we noticed that have the most number of products that are manufactured out of India. Apart from India, the largest manufacturer is China, where a lot of these products come from. Looking at this chart, we see that most of Flipkart’s products are manufactured in India, compared to its counterpart.
To sum up, we noticed that Flipkart has updated 91% of its products while Amazon has updated only 56% of their products of the products we tracked.
With the heightened emphasis on Make in India and reducing imports, sellers importing from other countries might have to rethink how to replace the products they currently are sourcing with local products. This also provides an opportunity to the Indian manufacturers to produce popular products which are currently being imported.
We’ll now have to wait and watch over the coming months to see how things unfold for these retailers and the sellers.
Amazon’s pricing advantage has declined in key categories, compared to last year as we enter 2020’s holiday season.
The holidays are here and the retail industry is gearing up for the yearly stampede. In a report published by Bain & Company, in partnership with DataWeave, it was observed that, “When it comes to pricing, Amazon’s historical advantage is also deteriorating. The research shows that in October and November 2019, Amazon matched or beat competitors’ prices 81% of the time in the categories studied. By November of 2020, that rate dropped to 74%”. This was based on the four key categories where we had pricing data for Amazon and at least one other competitor.
Amazon’s pricing advantage has declined in key categories
Aggressive pricing, which was once Amazon’s forte, seems to be on a downward trend this year. All but one category saw an increase in the percentage of products where they beat the lowest price, ‘movies, music, video games’ – by a small margin of one percentage point.
What could this shift be attributed to? The obvious would be the repercussions of COVID but there perhaps is more at work here. As observed last year, the behemoth that Amazon is, does not deter its competitors from constantly biting at the heels, with a steely determination to rope in market share. Everything from increased and specific customer demands, to government legislation, there are a lot of moving parts.
One thing is for sure, this is surely just the beginning of the great e-commerce battle. For access to the full article that was published in the Retail Holiday Newsletter by Bain & Company and powered by DataWeave, click here.
The rapid evolution in essential goods is rattling retail. That’s because the COVID-19 pandemic has dramatically changed shopping habits and retail necessities, leading to unpredictable shifts in demand.
Most notably, U.S. e-commerce has surged by an astonishing 45% year-over-year, as the pandemic accelerated online shopping by five years.[1] Since more consumers now work and learn from home, many pandemic-inspired habits will likely shape retail for years to come.[2]
Now that the risk of the second wave lies ahead, it’s the ideal time for retailers to review pandemic bestsellers and patterns to adapt to shifts in shopping behavior.
Pandemic’s bestsellers shape retail strategies
2020’s unexpected consumption patterns give retailers a glimpse of how they can adapt and thrive. The best-selling essential goods during the pandemic have included:
Toilet paper: +734% year-over-year (YoY) growth in March[3]
Disposable gloves: +670% in March[4]
Fitness equipment: + 535% YoY in online sales for February to March[5]
Hand sanitizer: +470% YoY for the week ending March 7[6]
Yeast: +410% YoY for the four weeks ending April 11[7]
Puzzles: +370% YoY in the last two weeks of March
Pyjamas: + 143% in online sales between March and April[8]
As such, retailers can ensure their assortments contain these types of popular cross-category items, which reflect overall themes of consumers’ needs for self-sufficiency, wellness and comfort.
E-grocery is also soaring, as experts predict a 40% rise in U.S. online grocery sales in 2020 due to the pandemic.[9] Top categories bought by online grocery shoppers include:
Packaged non-fresh food (69%)
Toiletries, personal care and diapers (63%)
Household cleaning and paper products (61%)[10]
In response to these trends, retailers can prioritize shelf-stable center store products and non-food consumer goods throughout the pandemic.
How retailers boost agility, clarity and sales amid COVID-19 chaos
Consumer panic led to pricing volatility for hard-to-find items like hand sanitizer, disinfectant wipes and masks.[11] To keep up with competitors’ online price fluctuations, more retailers use competitive analytics to adapt their own prices accordingly. Notably, McKinsey & Company cites data insights and price sensitivity as the top two disruptive trends the pandemic has turbocharged.[12]
In March, shortages of toilet paper and flour led consumers to react with panic and hoarding that created urgent supply chain issues. To avoid out-of-stock items, more retailers now turn to data insights to identify potential disruptions. Up-to-date insights help retailers spot emerging market trends and adapt their assortment to stock in-demand items.
Now that more consumers shop online, retailers are investing in digital promotions to boost sales. Data analytics help retailers quickly evaluate the effectiveness of their promotions, which can inspire consumers to fill their baskets. Nimbly adapting to competitors’ promotions is essential, as McKinsey cites rising competition for deals among the pandemic’s most disruptive retail trends.[13]
Avoid empty shelves: The pandemic has motivated more retailers to rely on data insights to make fast, effective pricing and assortment decisions.
As consumption habits evolve, high-level dashboards help retailers quickly spot inventory shortages to prevent out-of-stocks.
To make their retail strategies pandemic-proof, leading retailers are collaborating with DataWeave to access accurate, actionable insights that boost online agility and sales. Applying DataWeave’s trusted data gives retailers clarity amid today’s chaotic market and shifting demand for essential goods, so they can make effective decisions fast. Insights also help retailers enhance the customer experience by supporting in-stock product assortments, competitive pricing and effective promotions that boost sales, trust and loyalty. To see how DataWeave helps retailers stay agile and competitive, visit dataweave.com.
[1] Perez, Sarah. COVID-19 pandemic accelerated shift to e-commerce by 5 years, new report says. TechCrunch. August 24, 2020.
[2] Gottlieb, David. 5 Strategic Imperatives for Retail’s New Normal. Total Retail. August 18, 2020.
[3] Weiczner, Jen. The case of the missing toilet paper: How the coronavirus exposed U.S. supply chain flaws. Fortune. May 18, 2020.
[4] Clement, J. COVID-19 impact on fastest growing e-commerce categories in the U.S. 2020. Statista. June 19, 2020.
[5] Gibson, Kate. Coronavirus inspires fitness buying binge that tops New Year’s. CBS News. April 1, 2020.
[6] Chasark, Krisann. Coronavirus impact: Hair dye becoming next high-demand item amid COVID-19 pandemic. ABC News. April 11, 2020.
[7] Guynn, Jessica and Kelly Tyko. Dry yeast flew off shelves during coronavirus pantry stocking. Here’s when you can buy it again. USA Today. April 23, 2020
[8] Thomas, Lauren. Comfort is en vogue during coronavirus: PJ sales surge 143%, pants sales fall 13%. CNBC. May 12, 2020.
[9] Redman, Russell. Online grocery sales to grow 40% in 2020. Supermarket News. May 11, 2020.
[10] Redman, Russell. Online grocery sales to grow 40% in 2020. Supermarket News. May 11, 2020.
[11] Levenson, Michael. Price Gouging Complaints Surge Amid Coronavirus Pandemic. The New York Times. March 27, 2020.
[12] Kopka, Udo, Eldon Little, Jessica Moulton, René Schmutzler, and Patrick Simon. What got us here won’t get us there: A new model for the consumer goods industry. McKinsey & Company. July 30, 2020.
[13] Kopka, Udo, Eldon Little, Jessica Moulton, René Schmutzler, and Patrick Simon. What got us here won’t get us there: A new model for the consumer goods industry. McKinsey & Company. July 30, 2020.

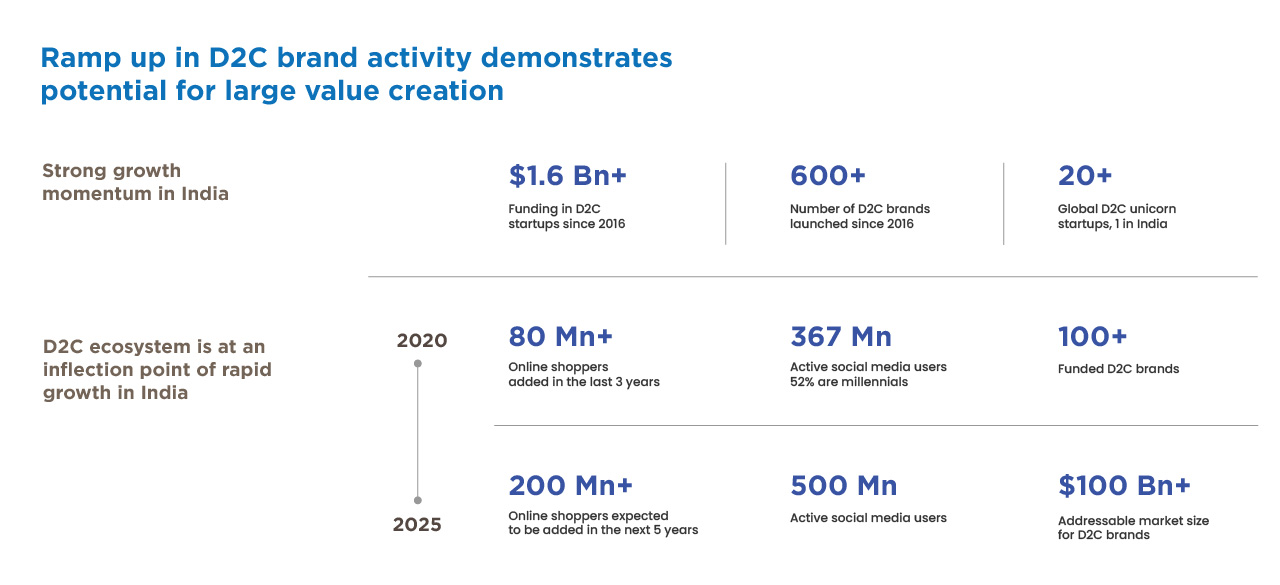


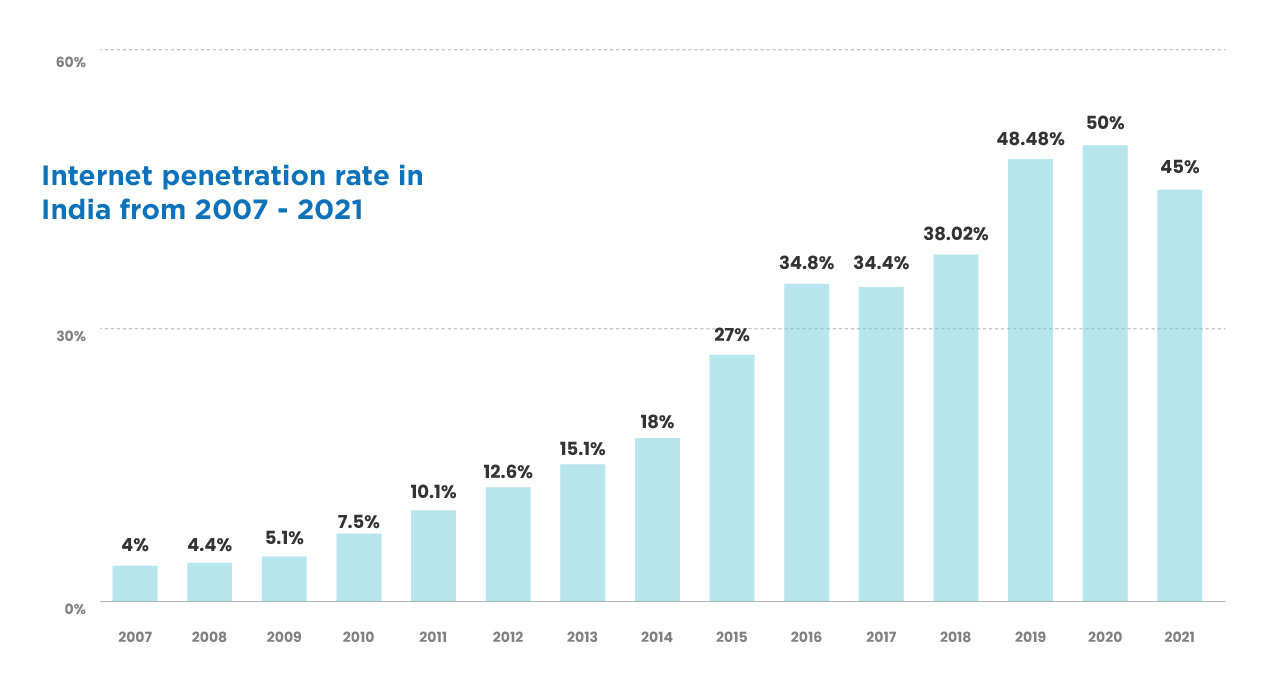

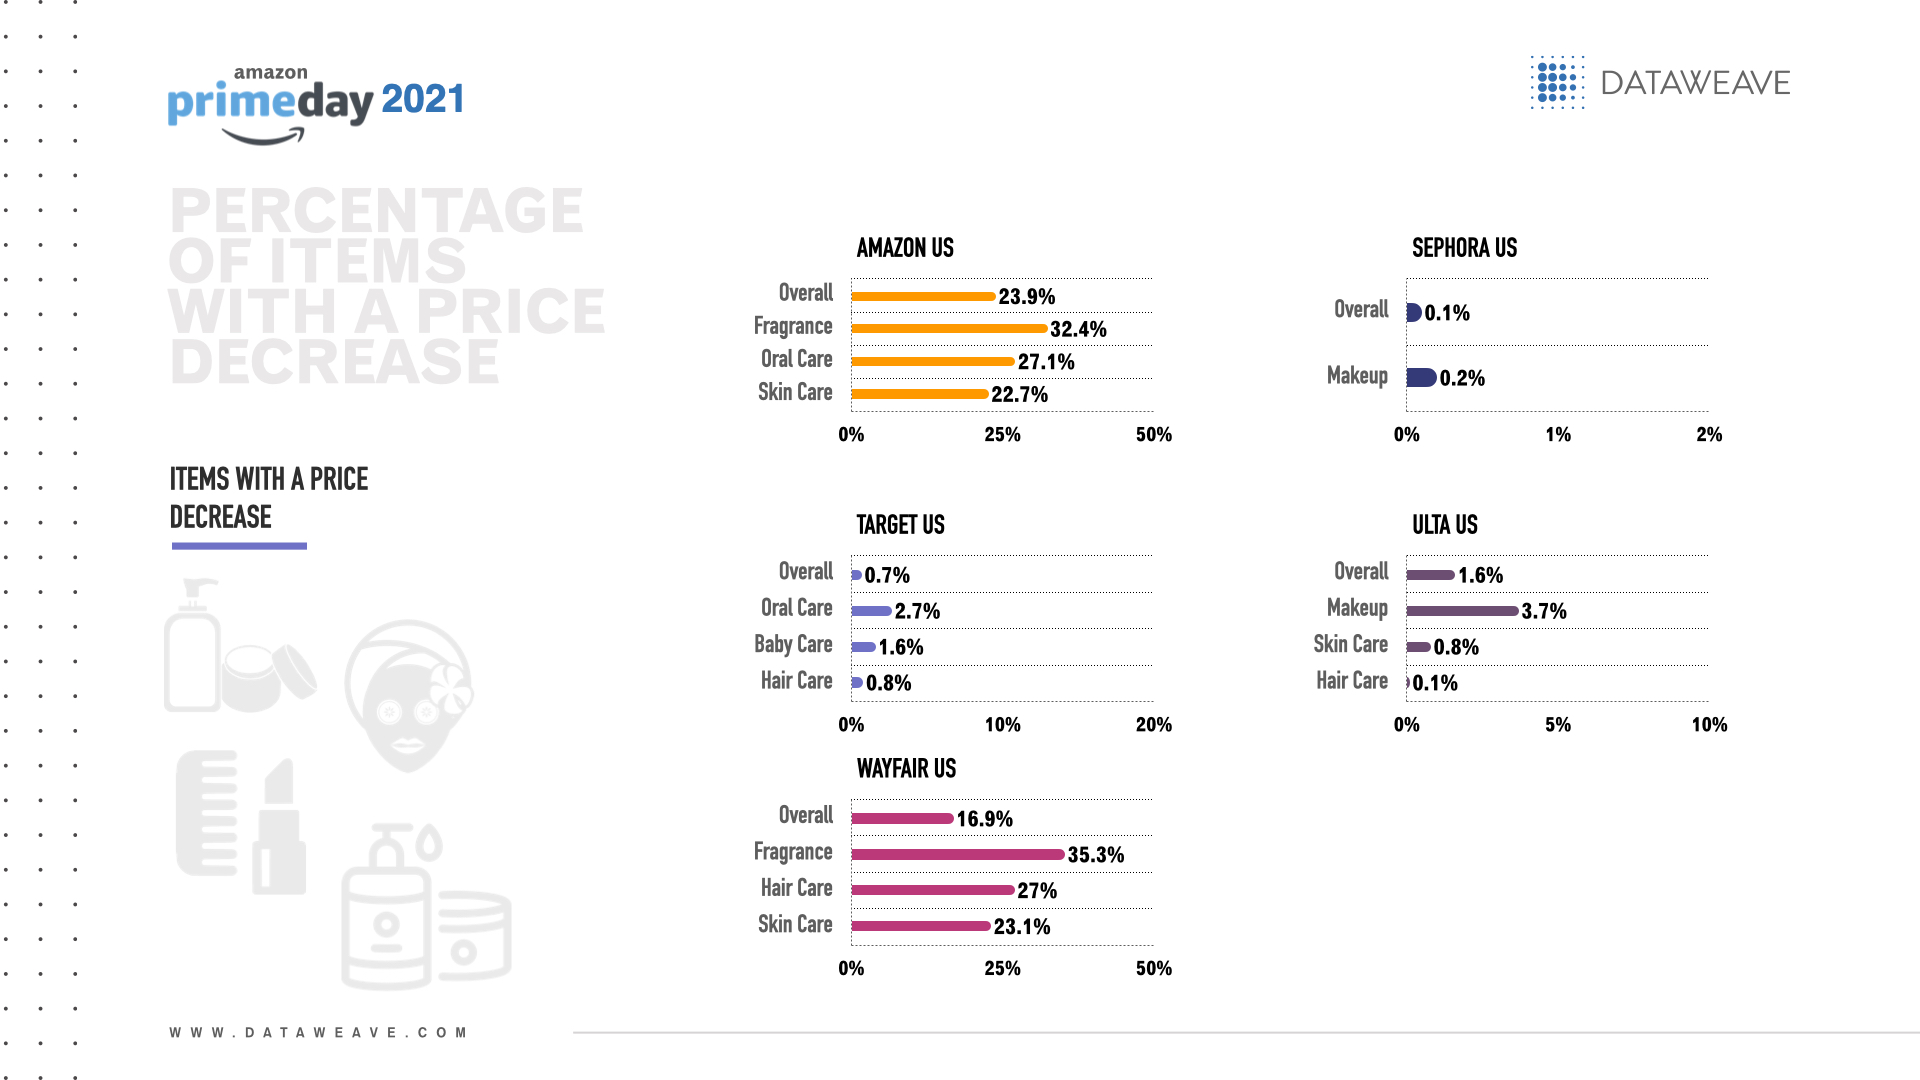
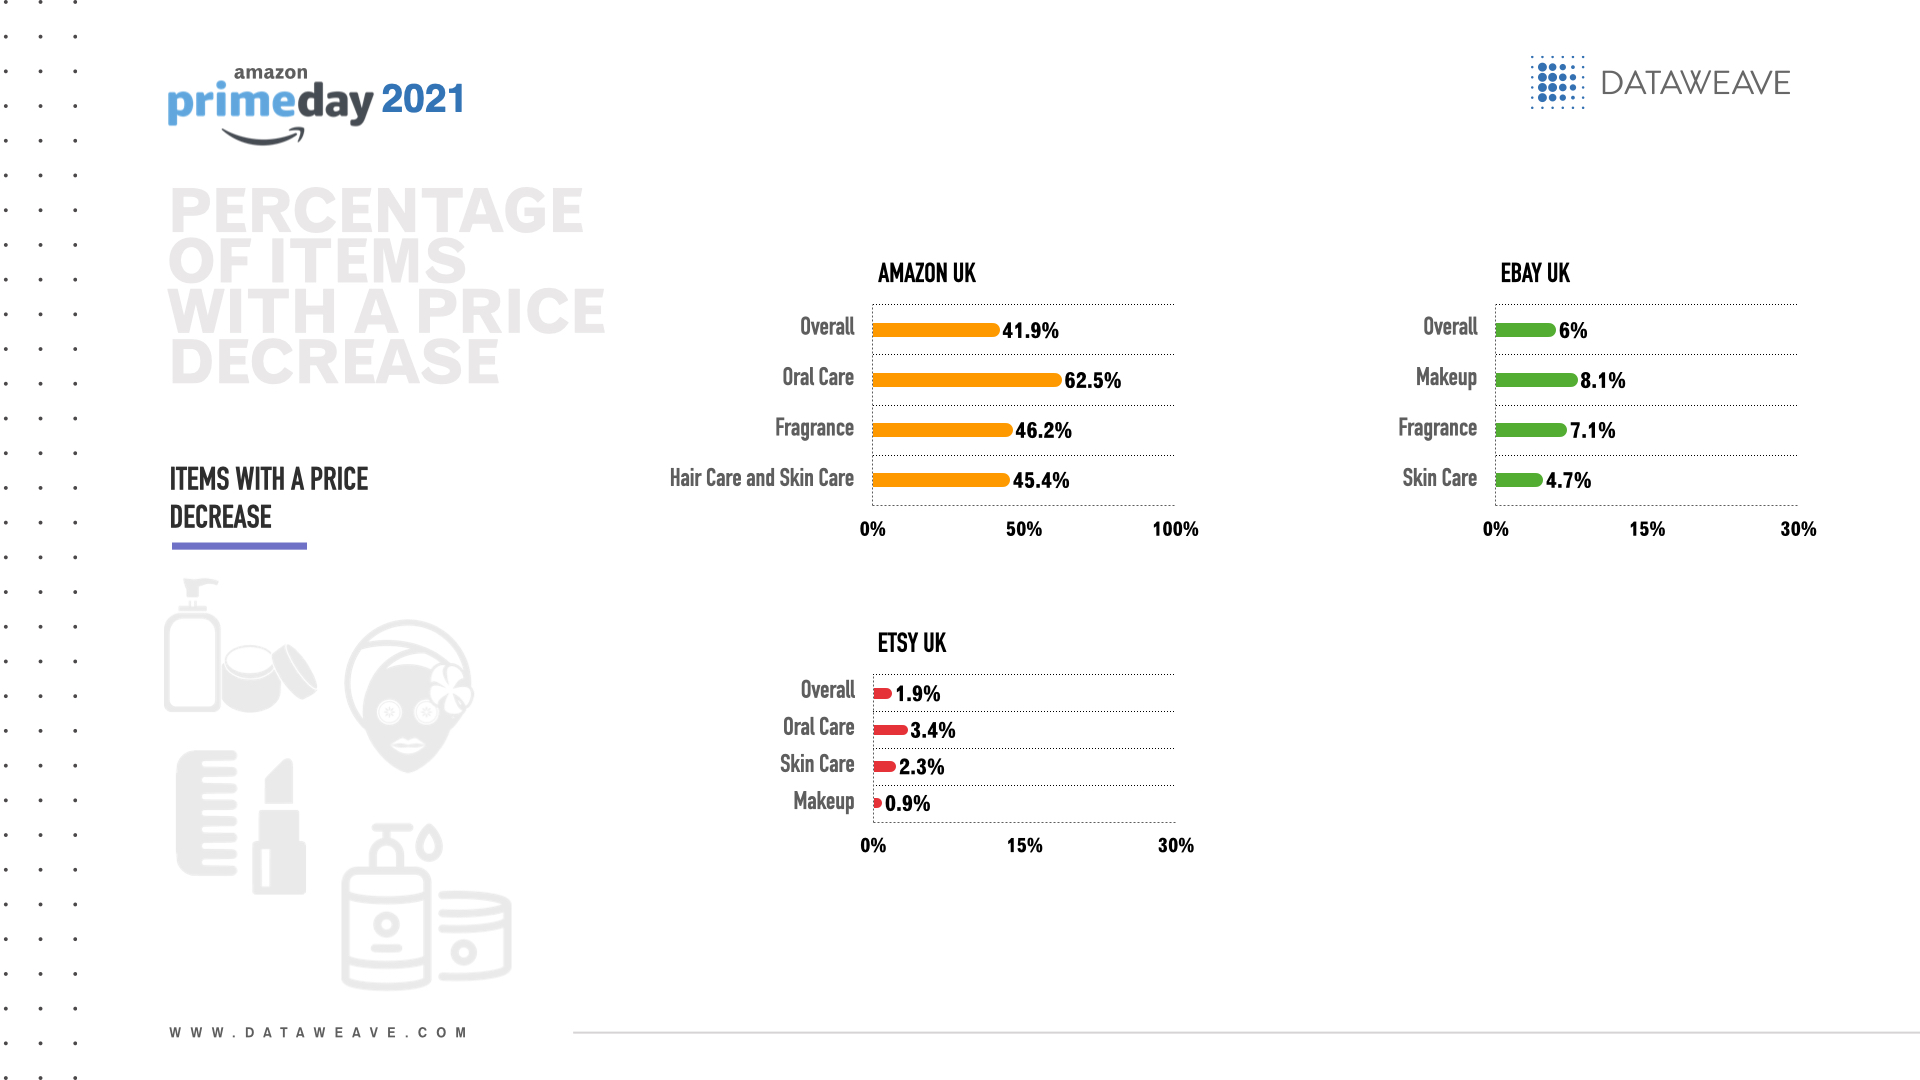
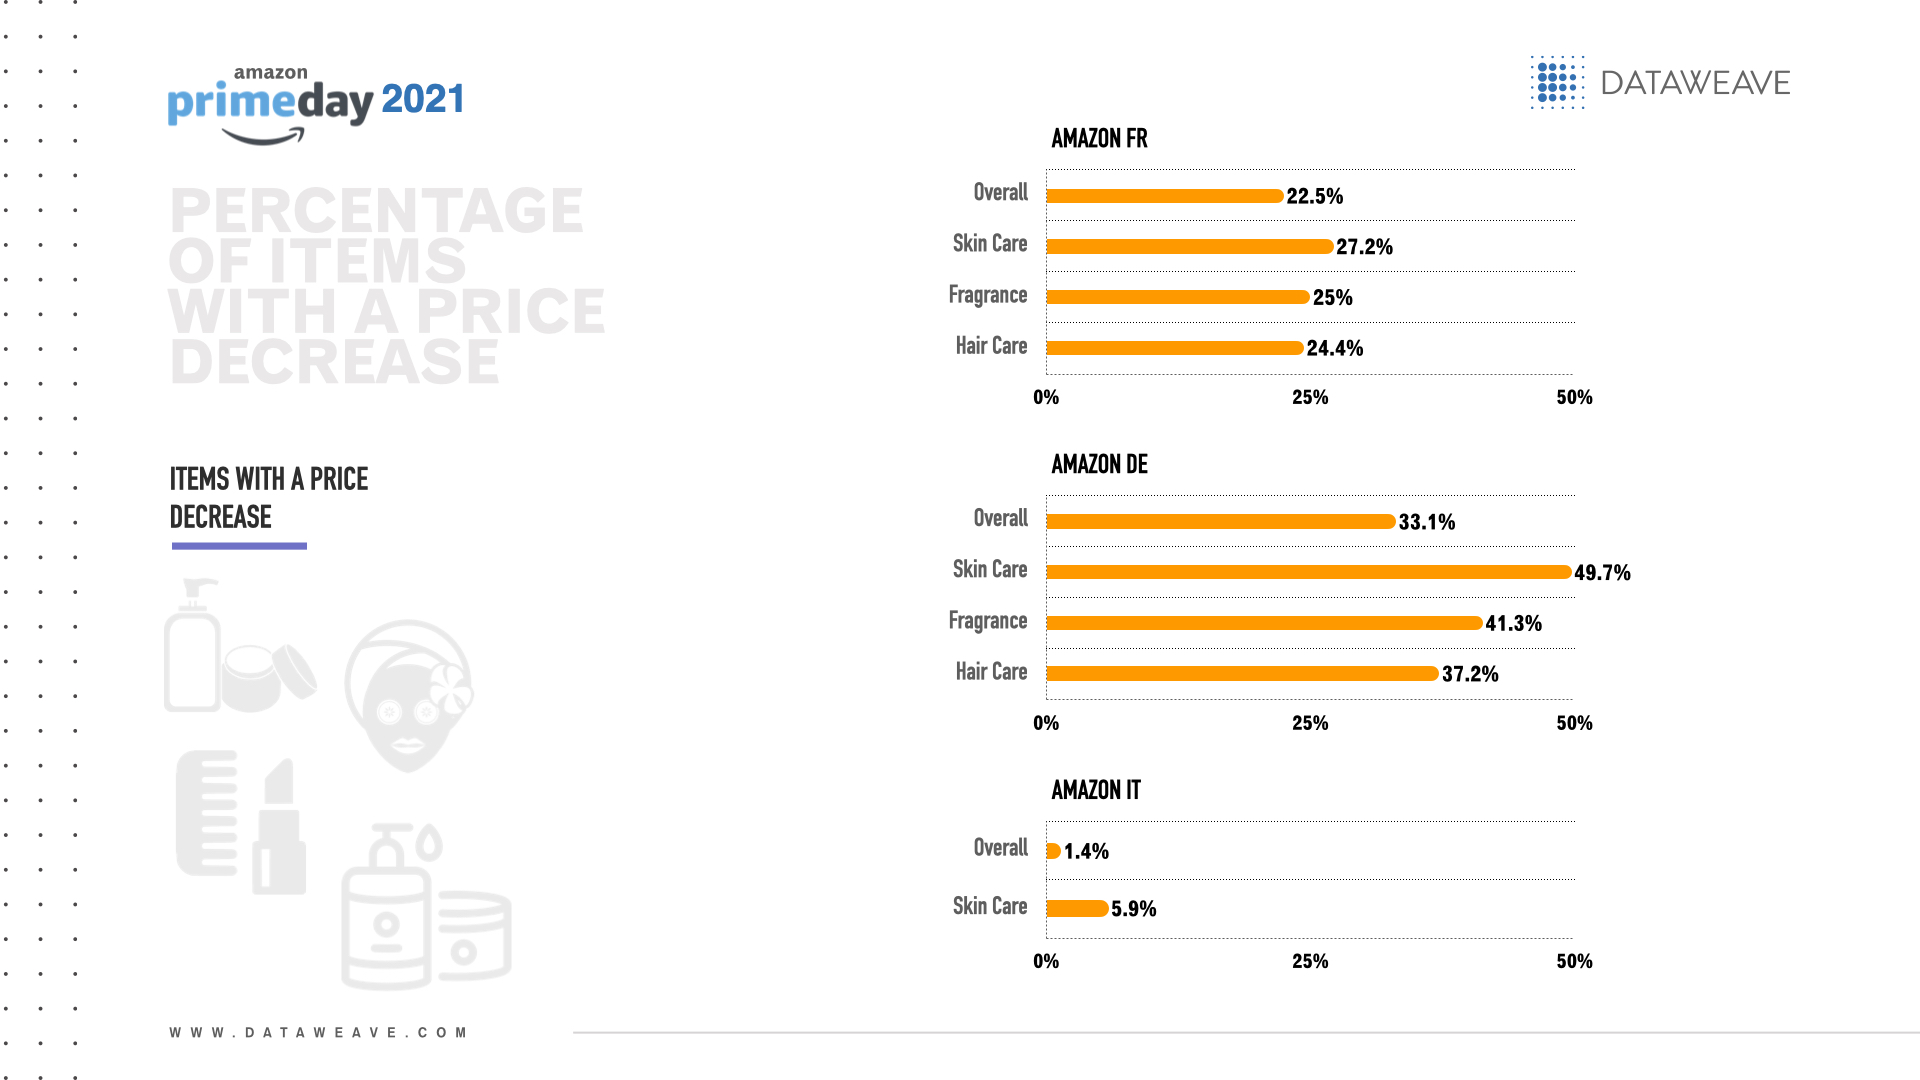
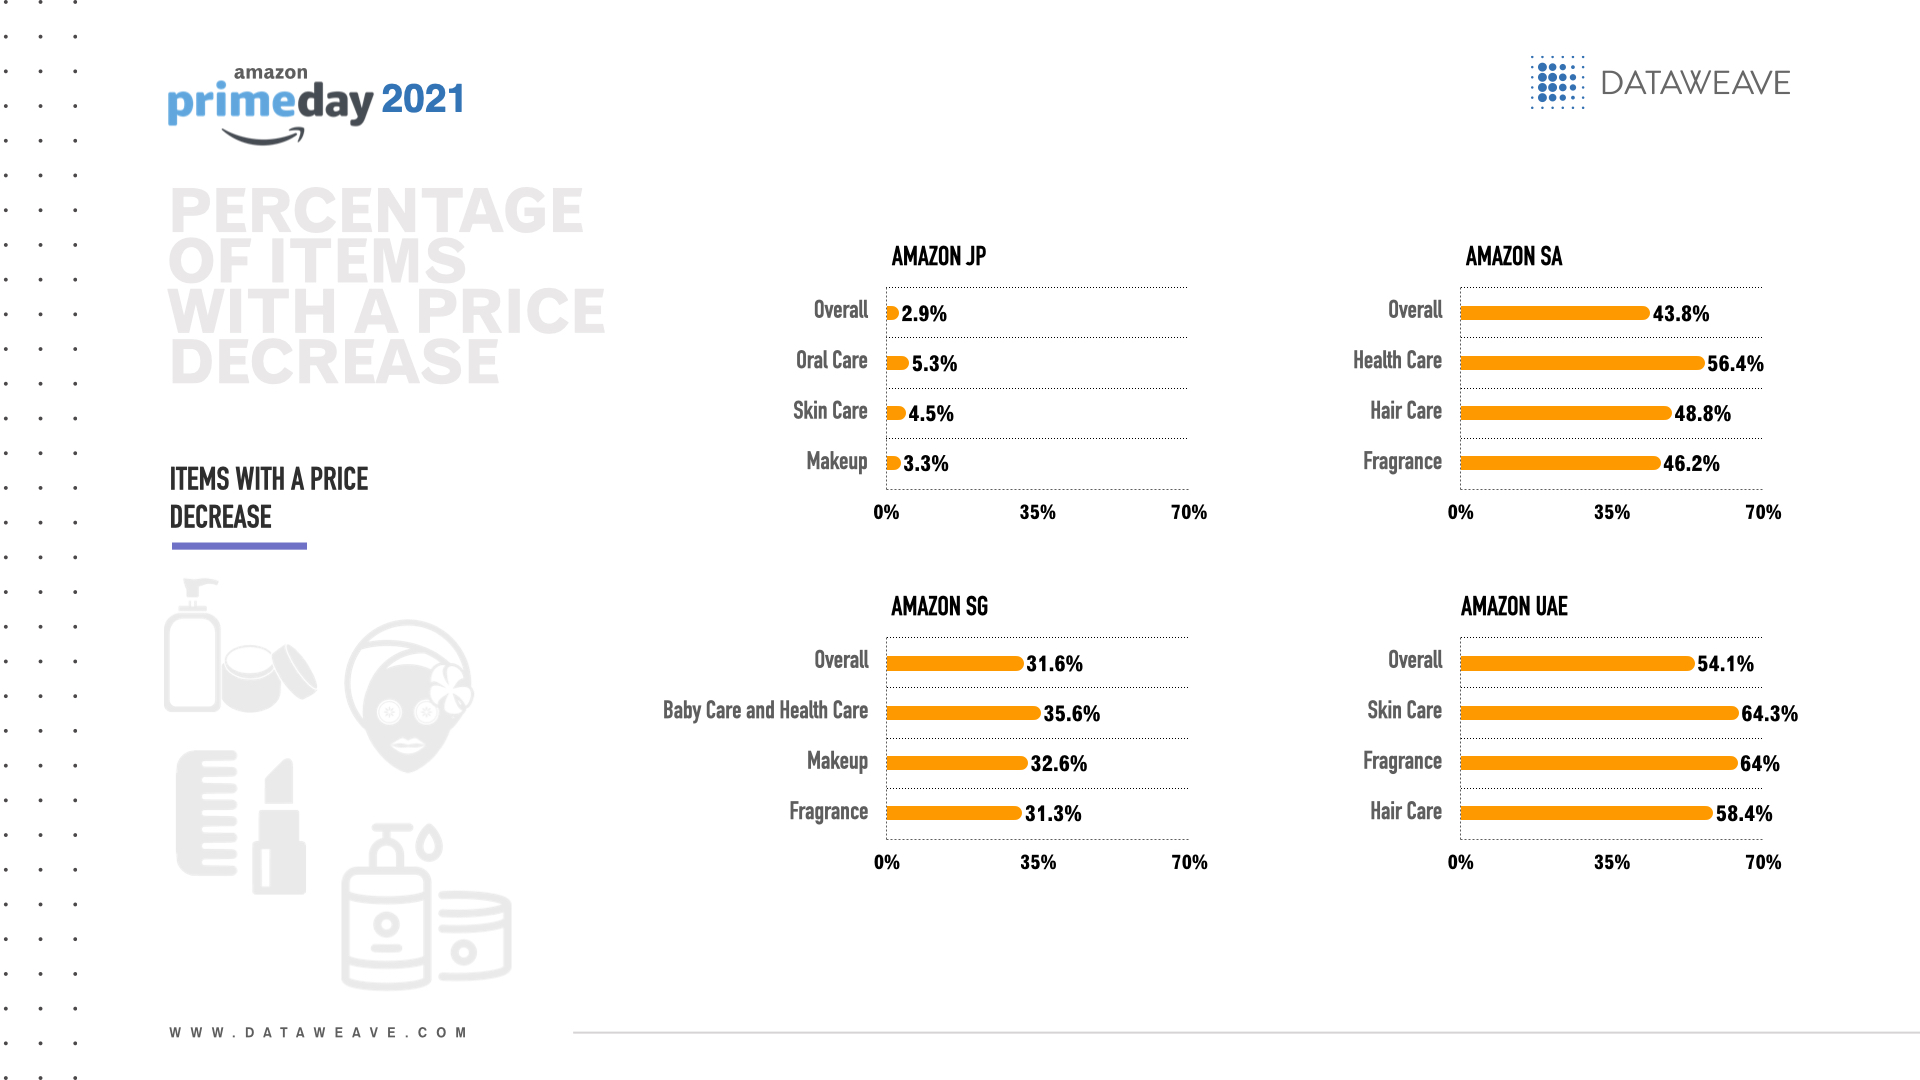
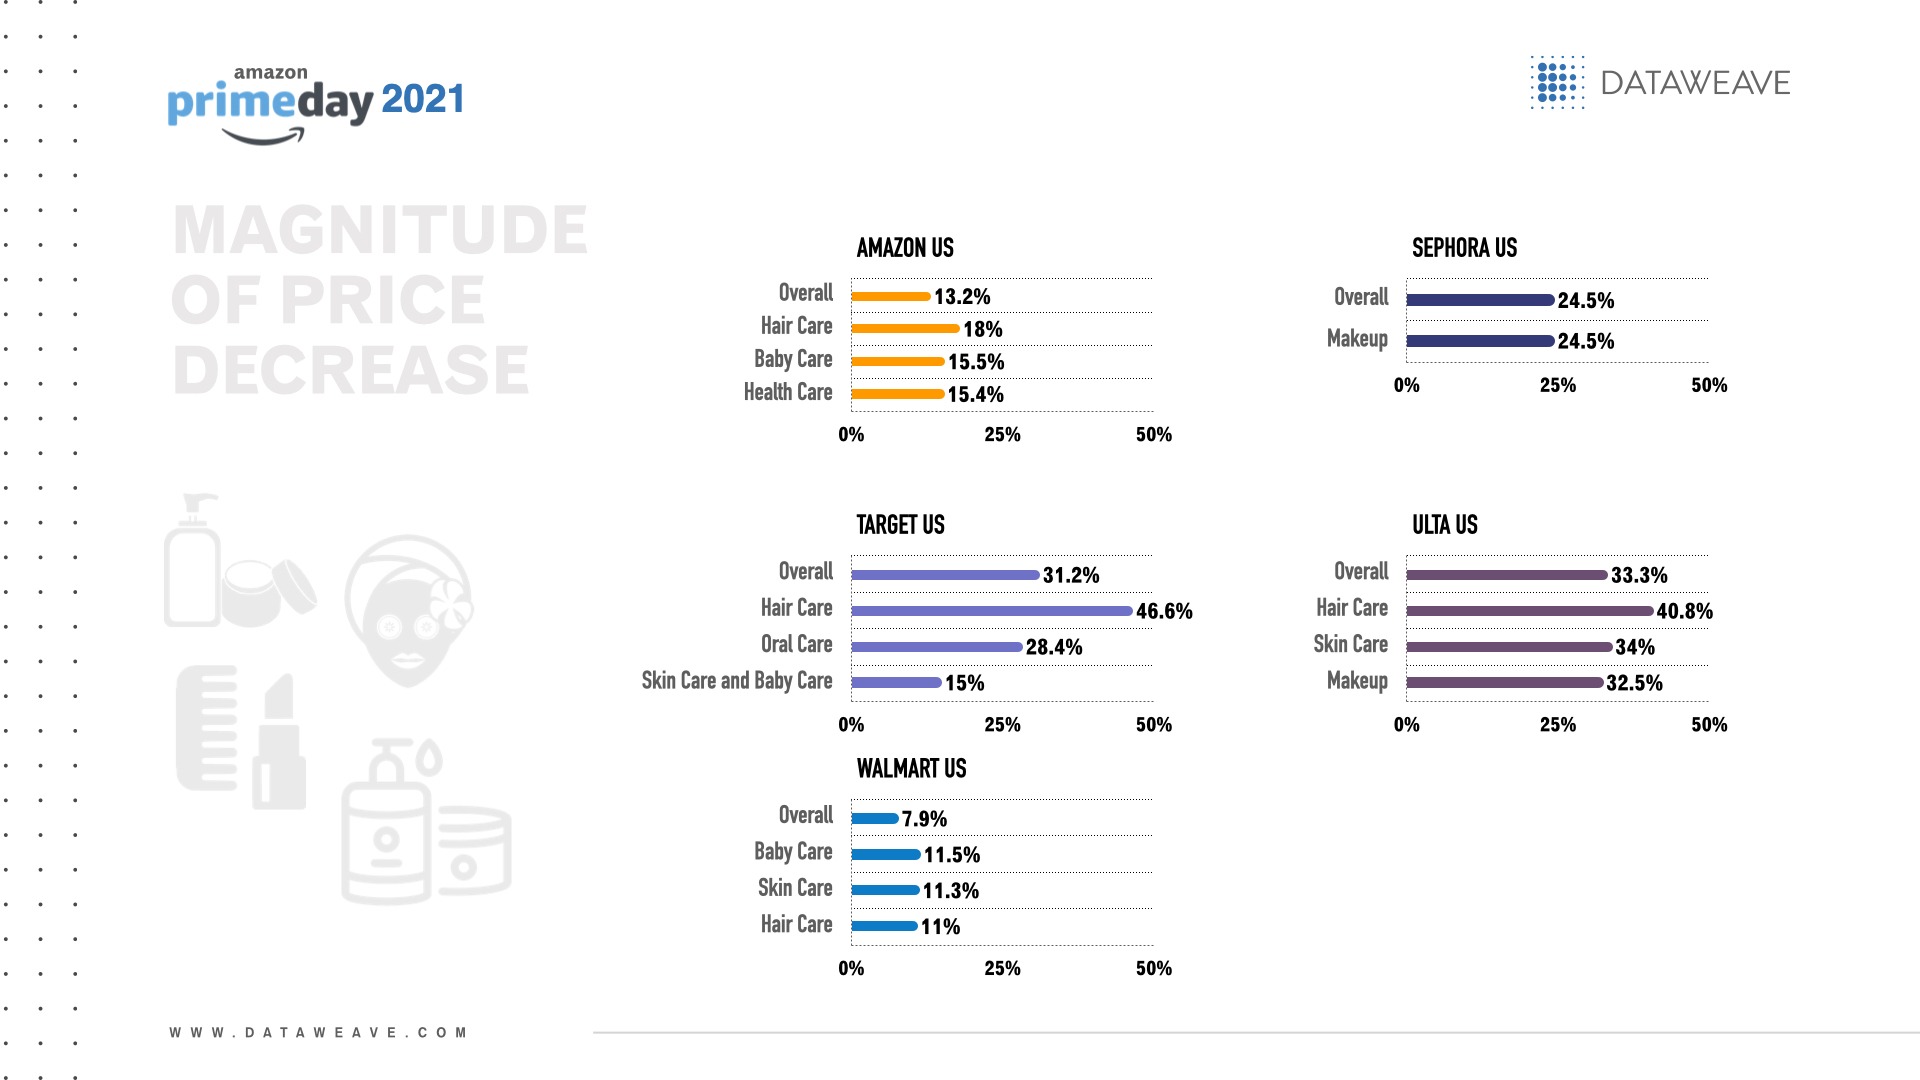
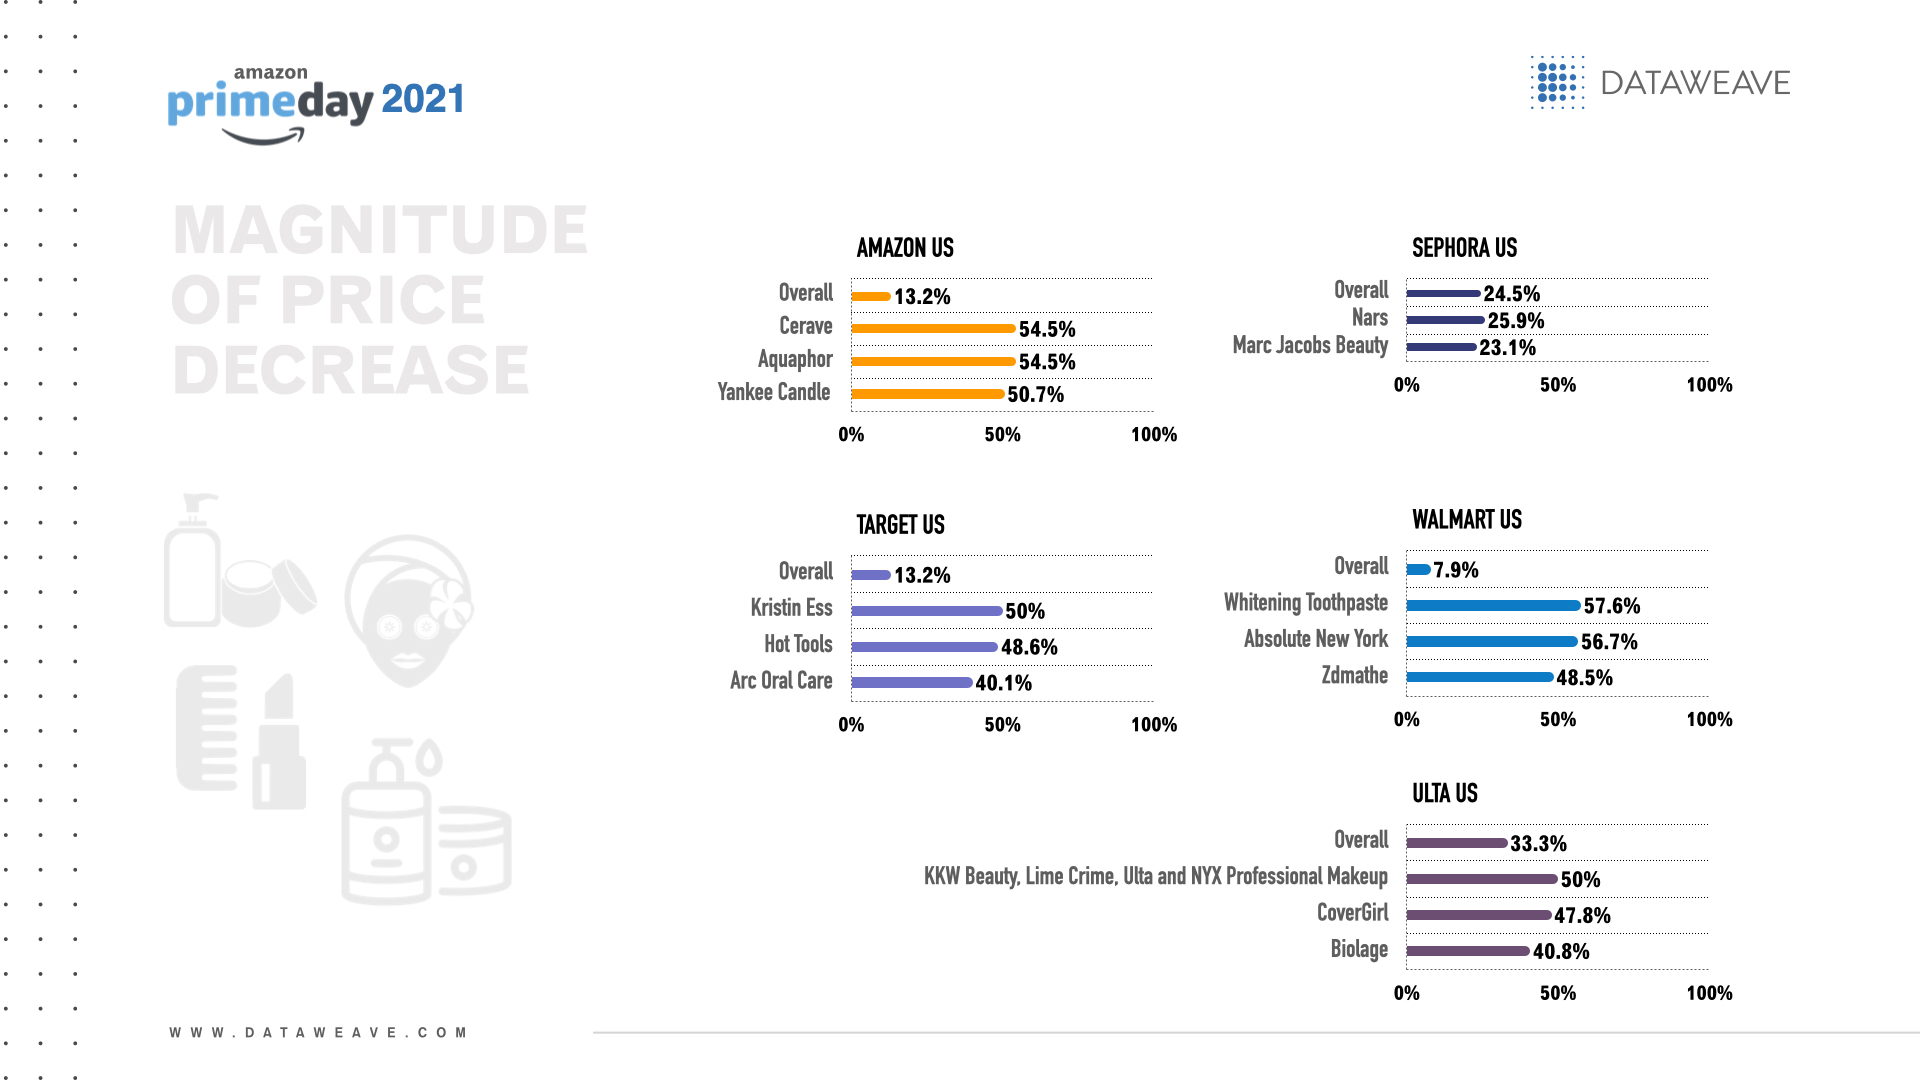
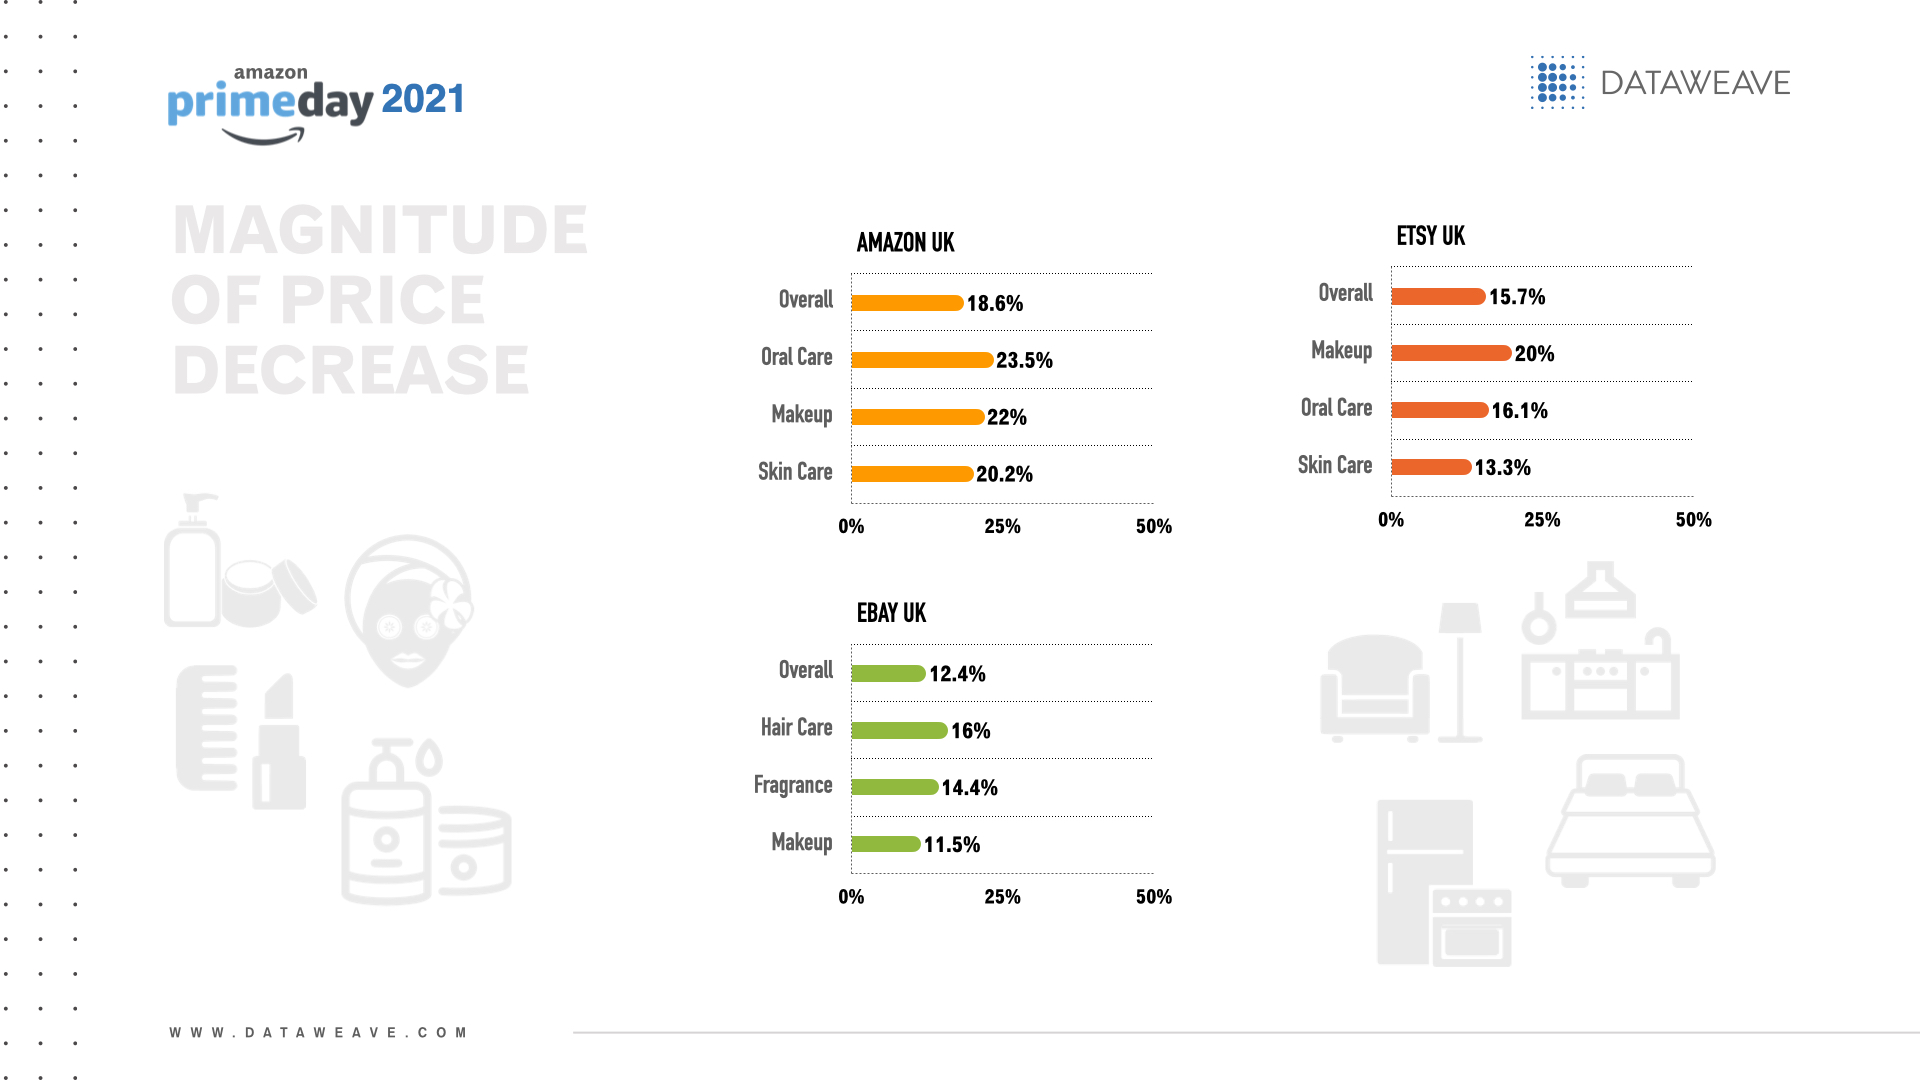
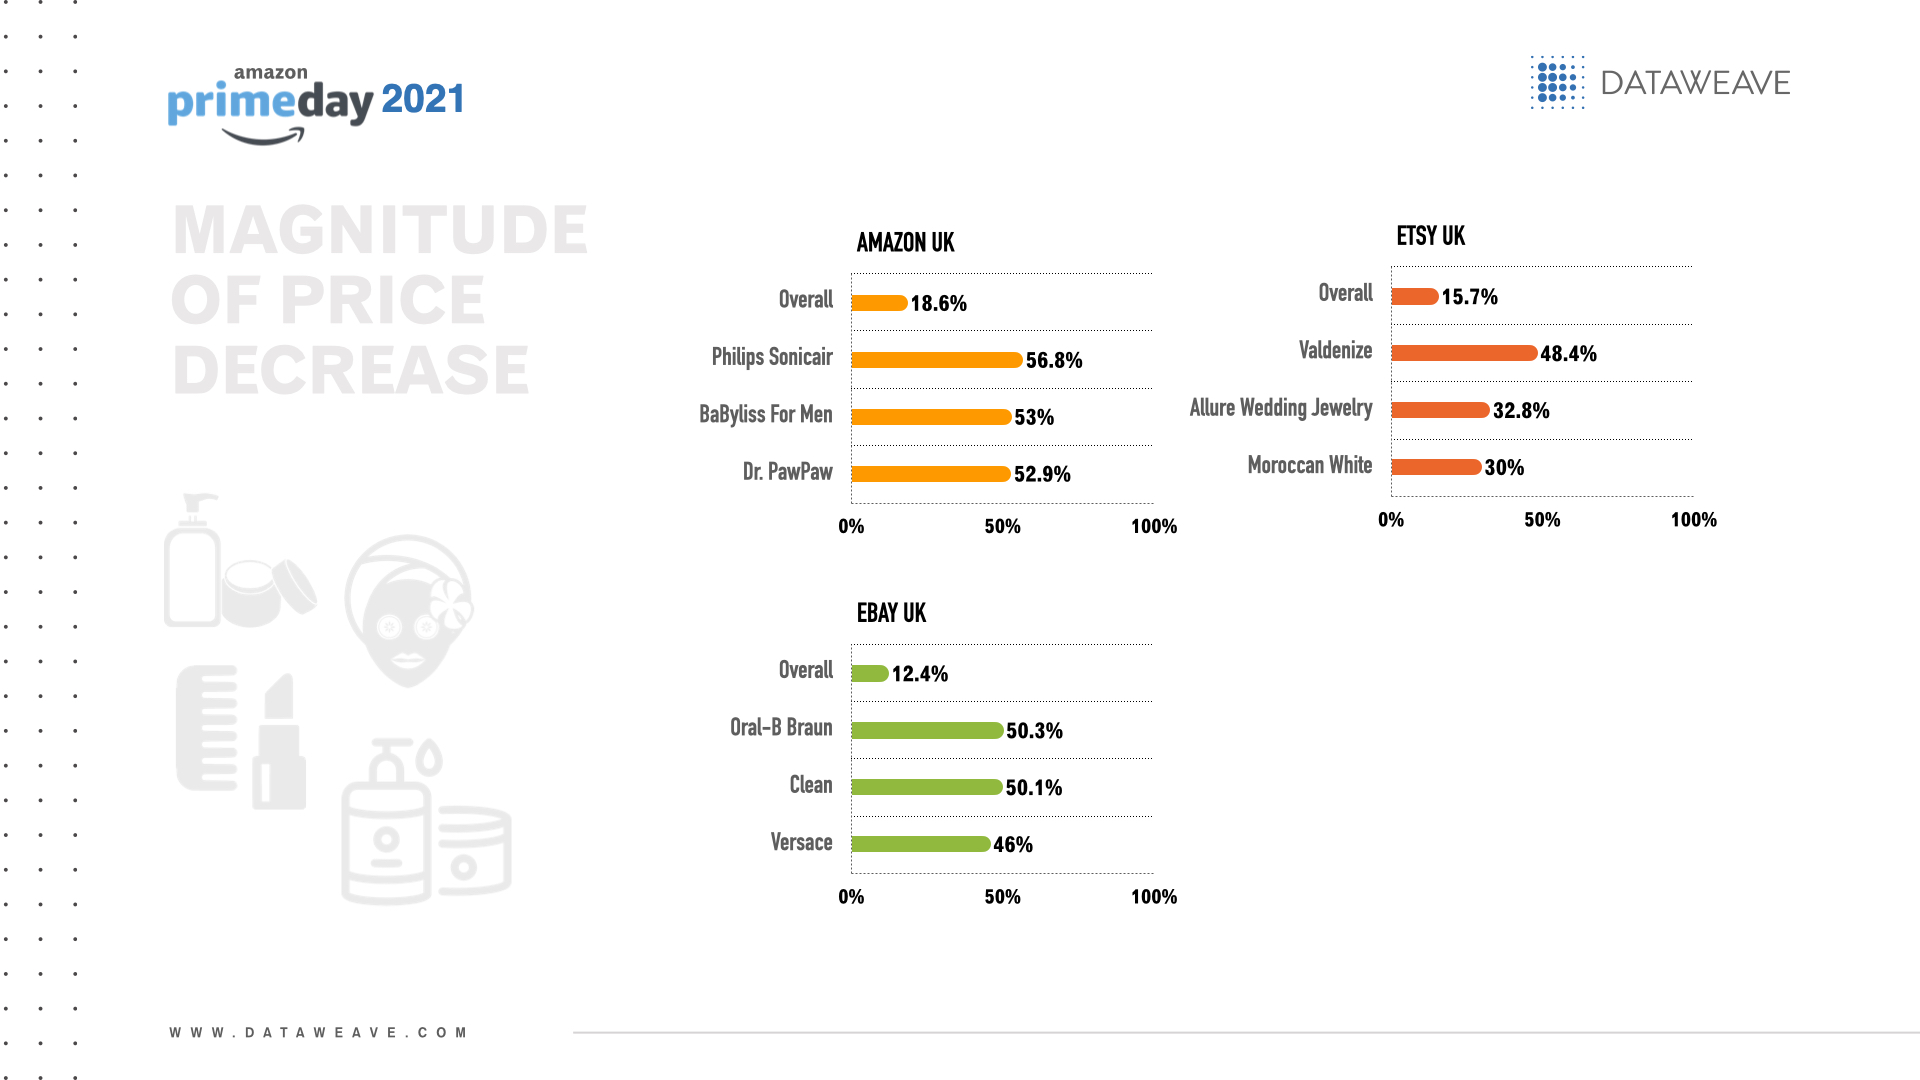
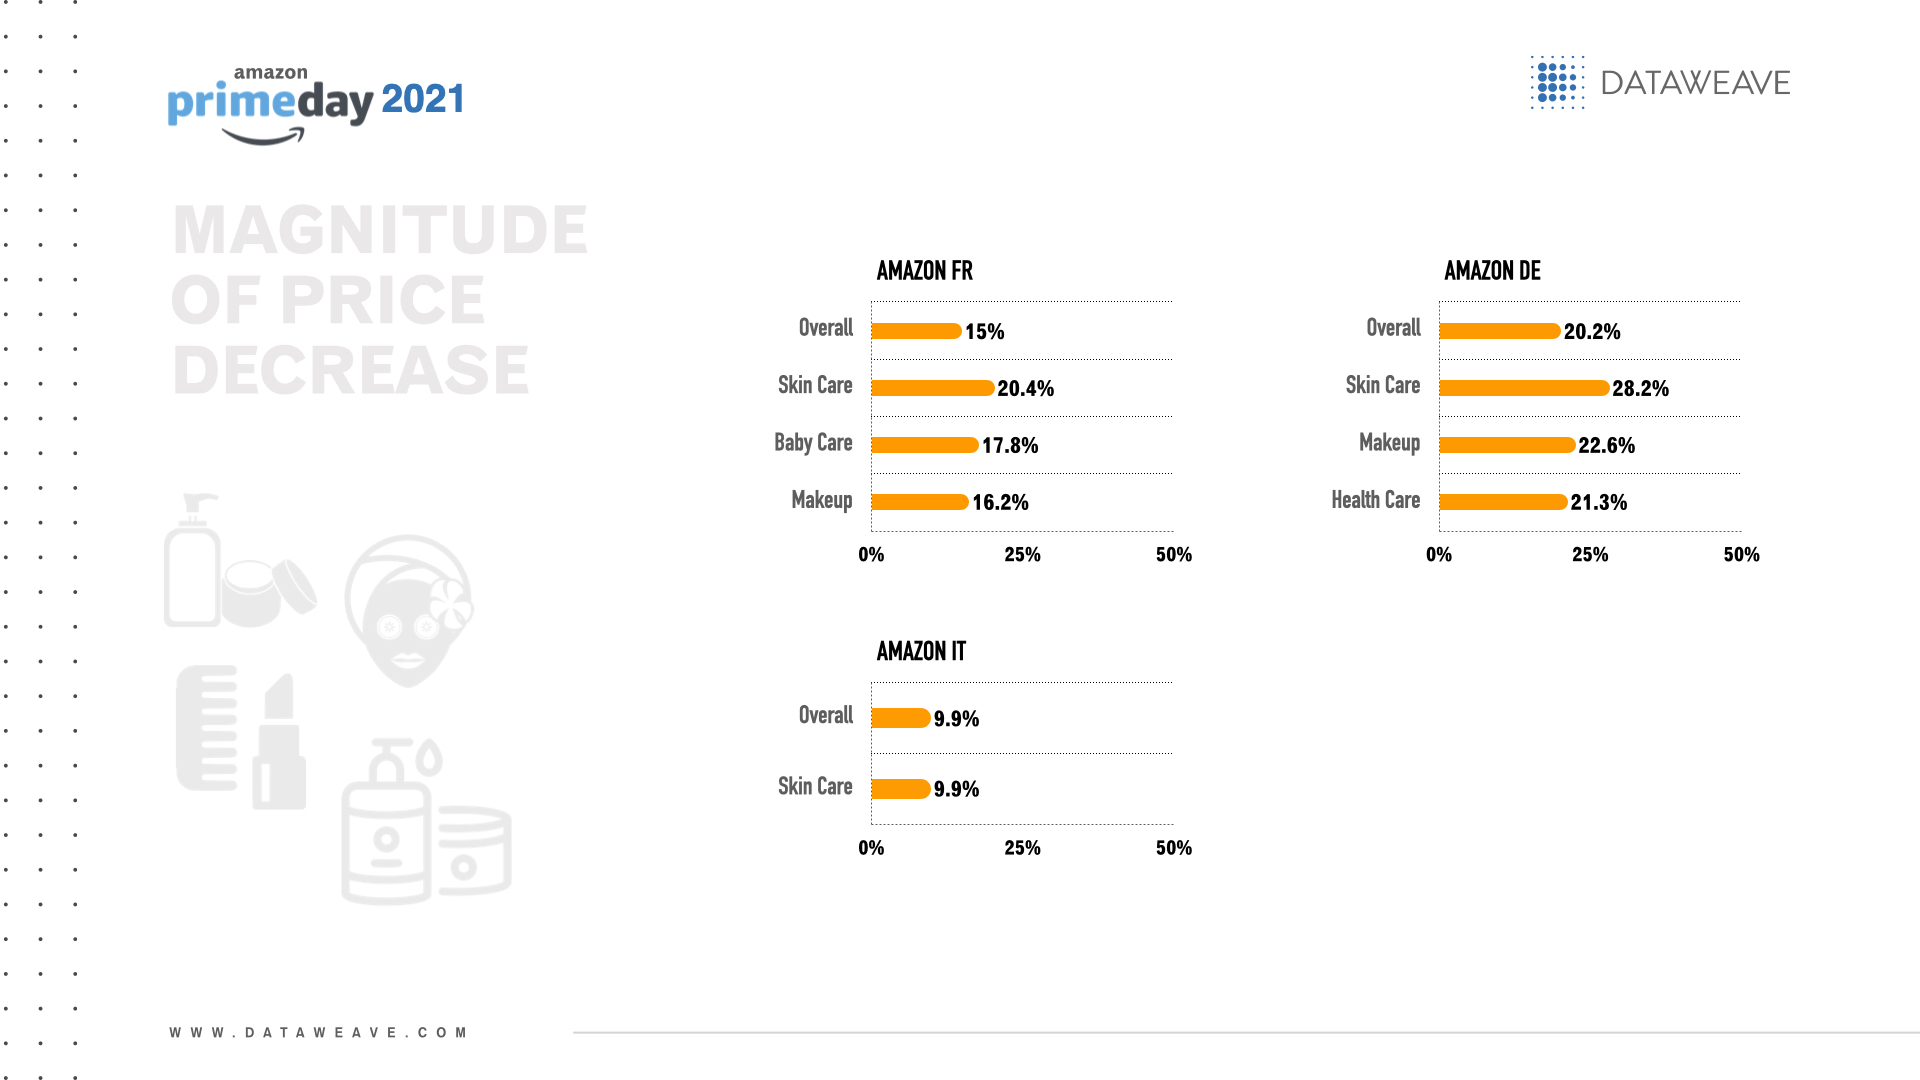
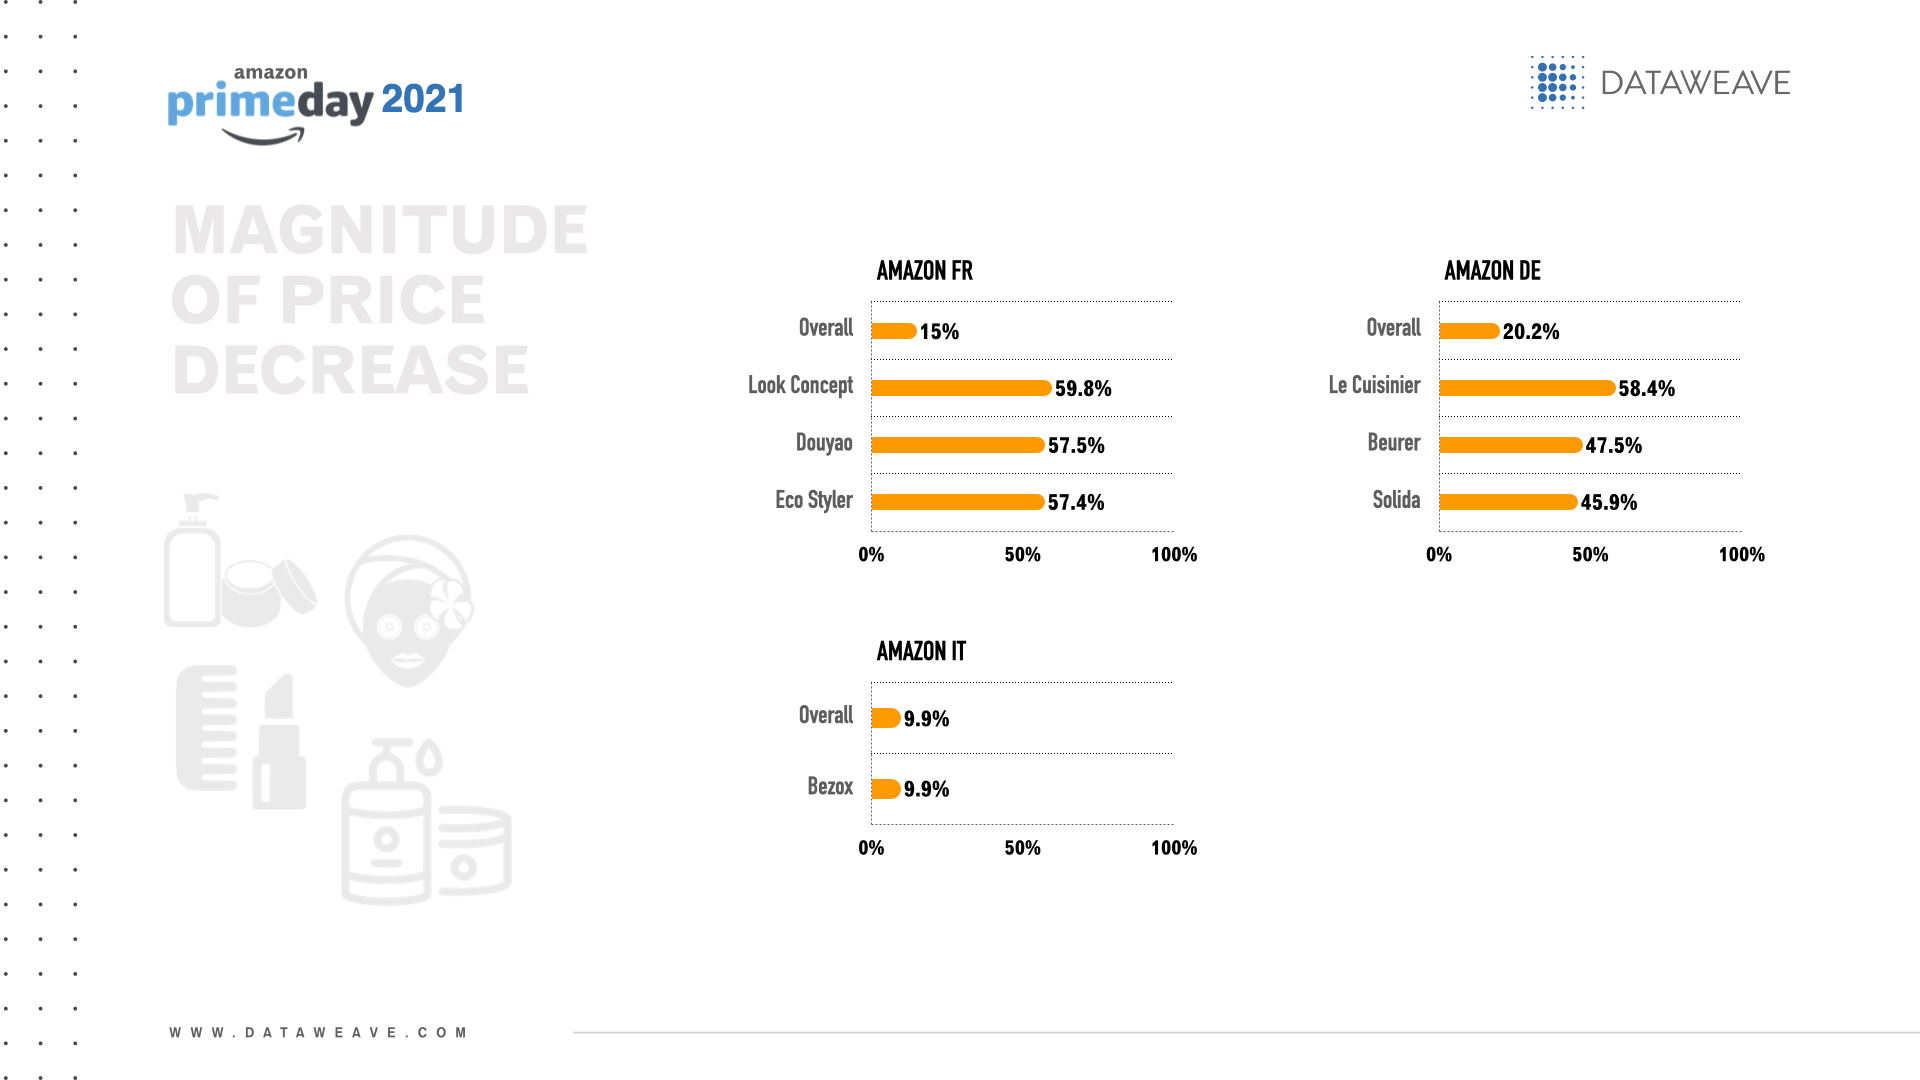
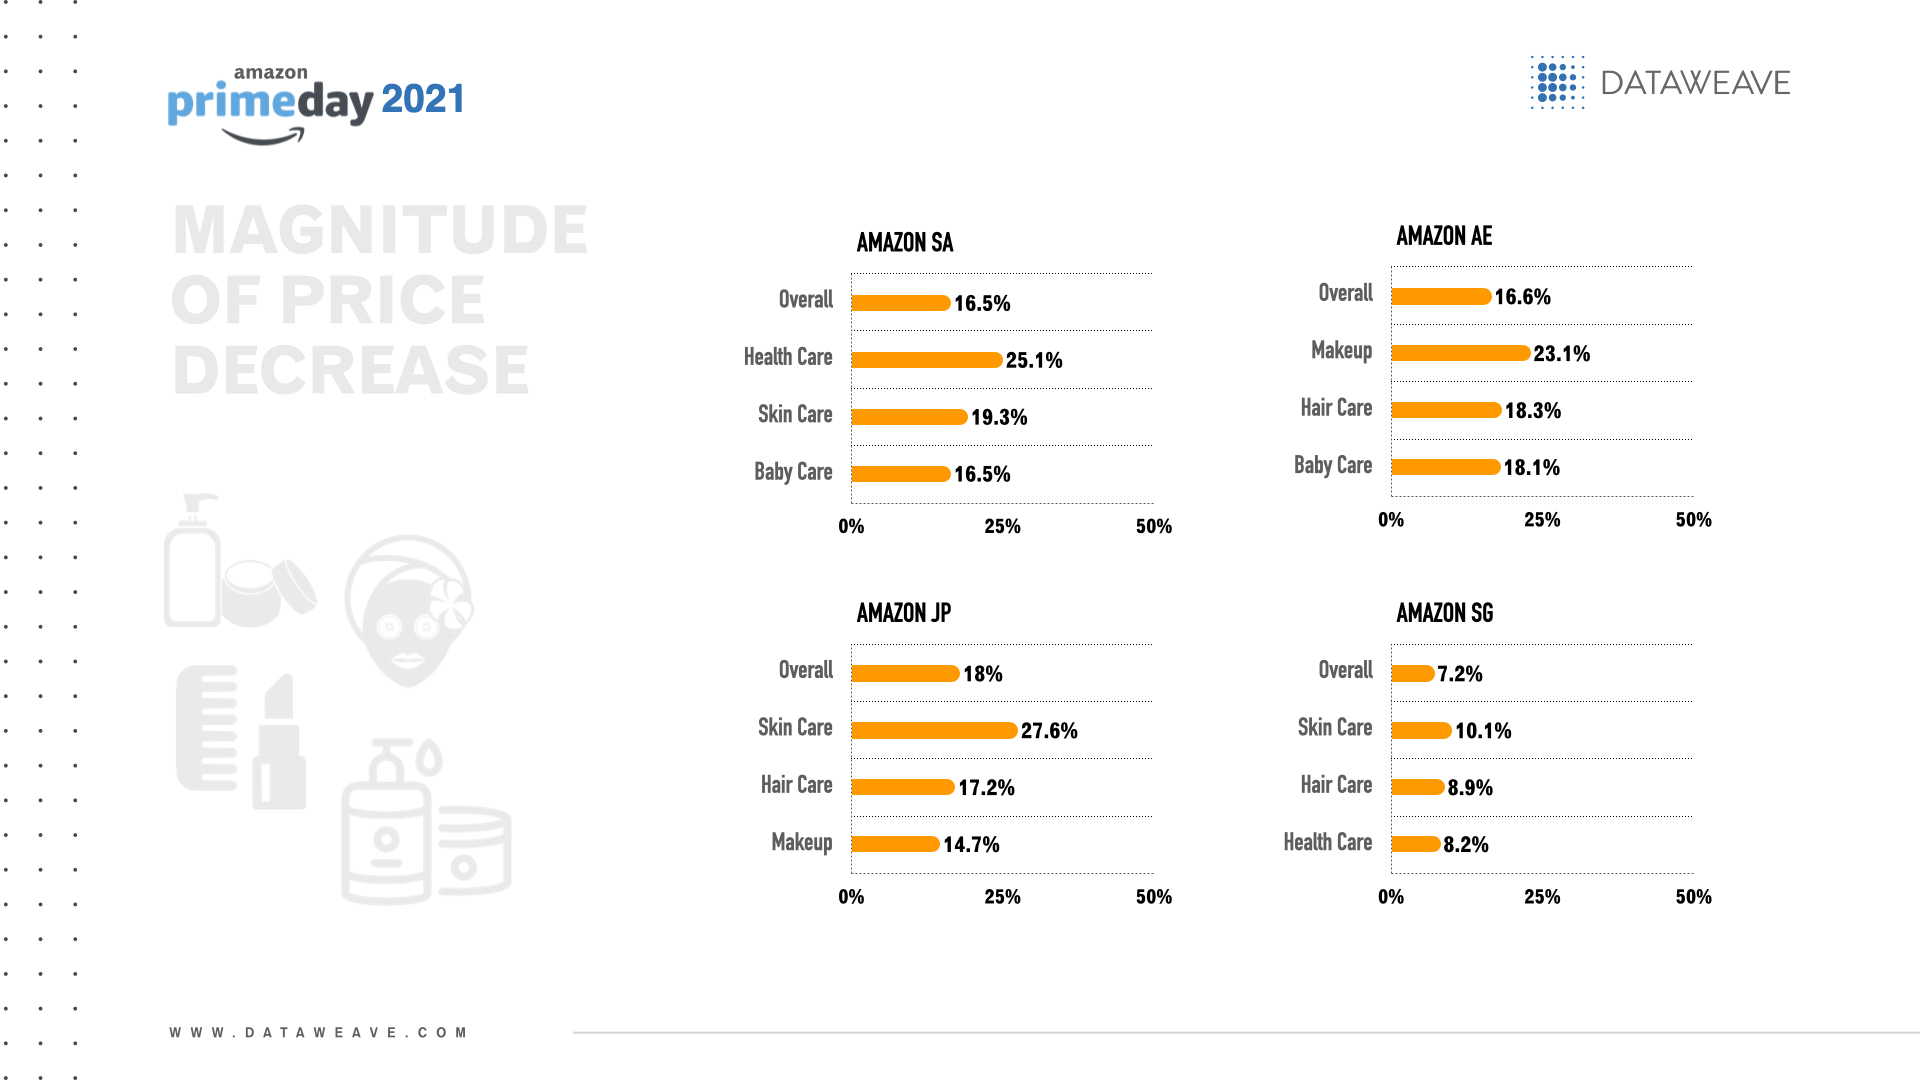
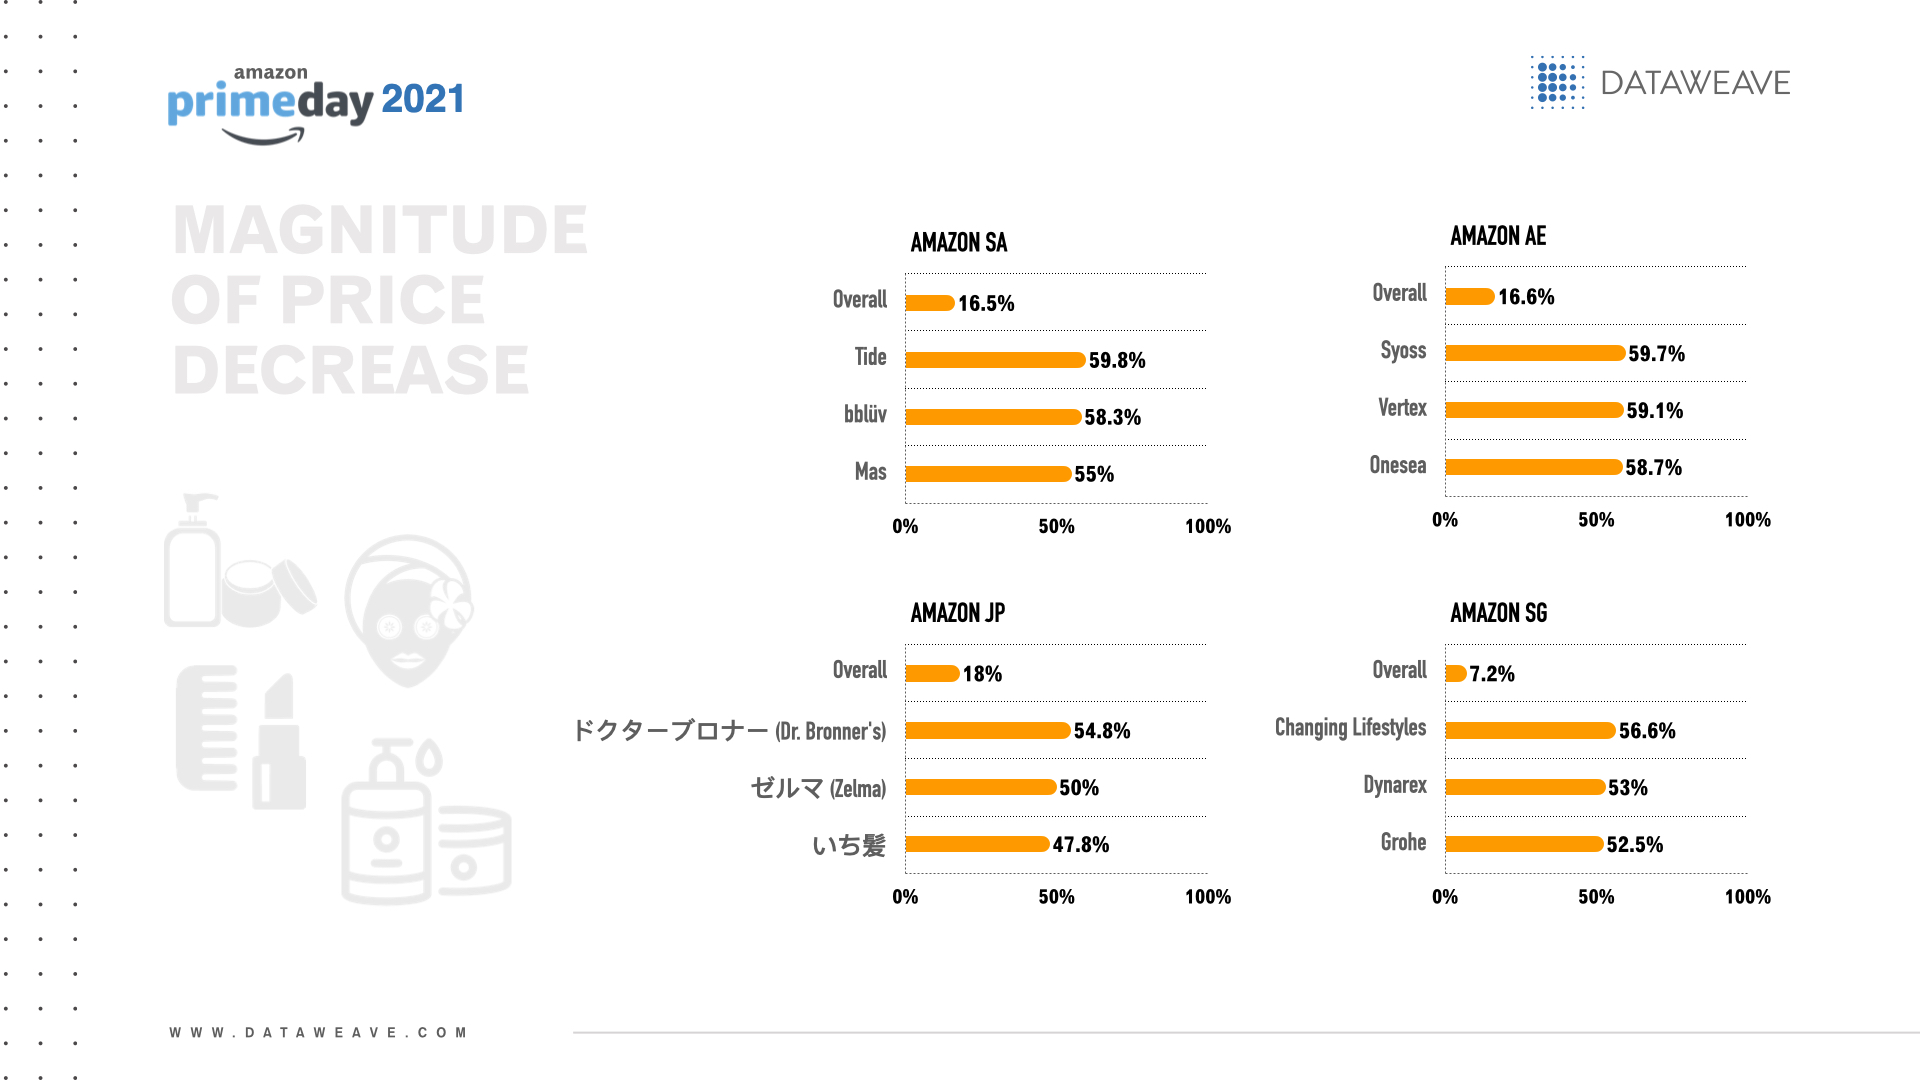
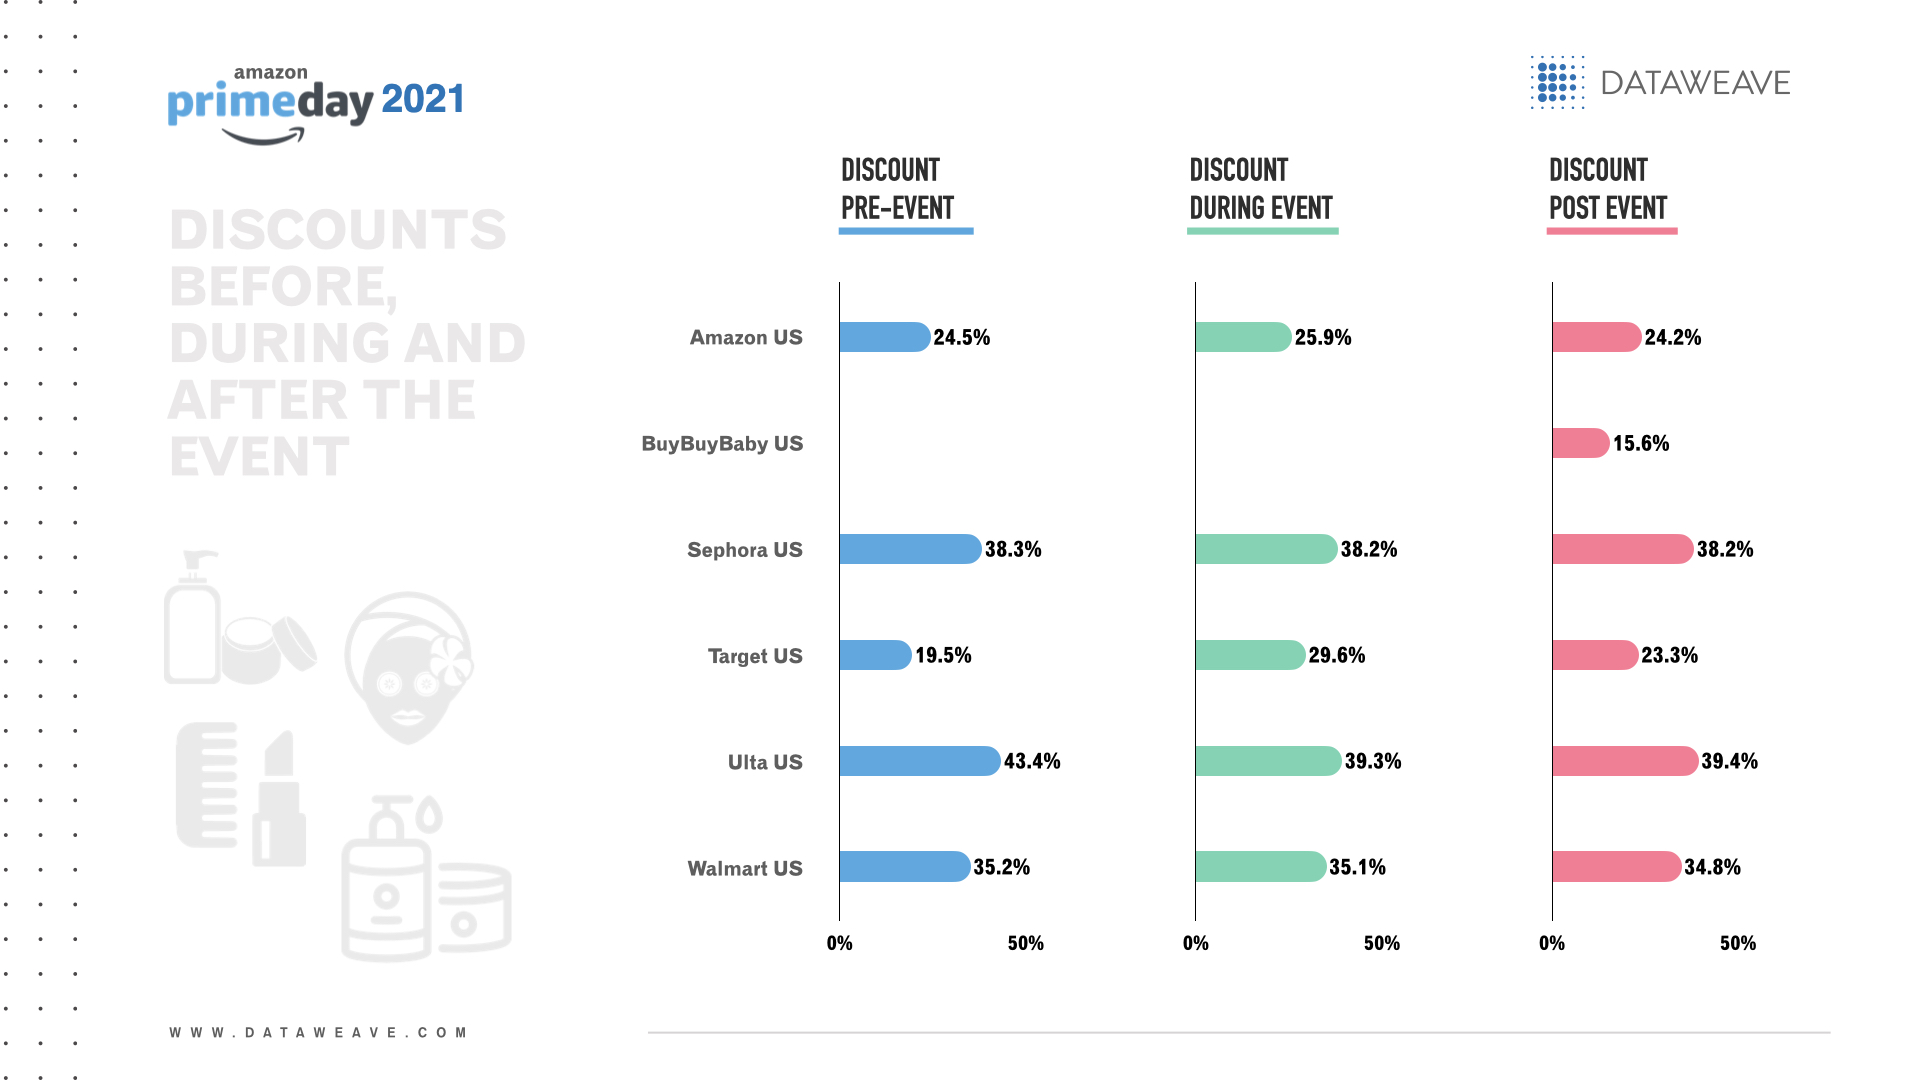
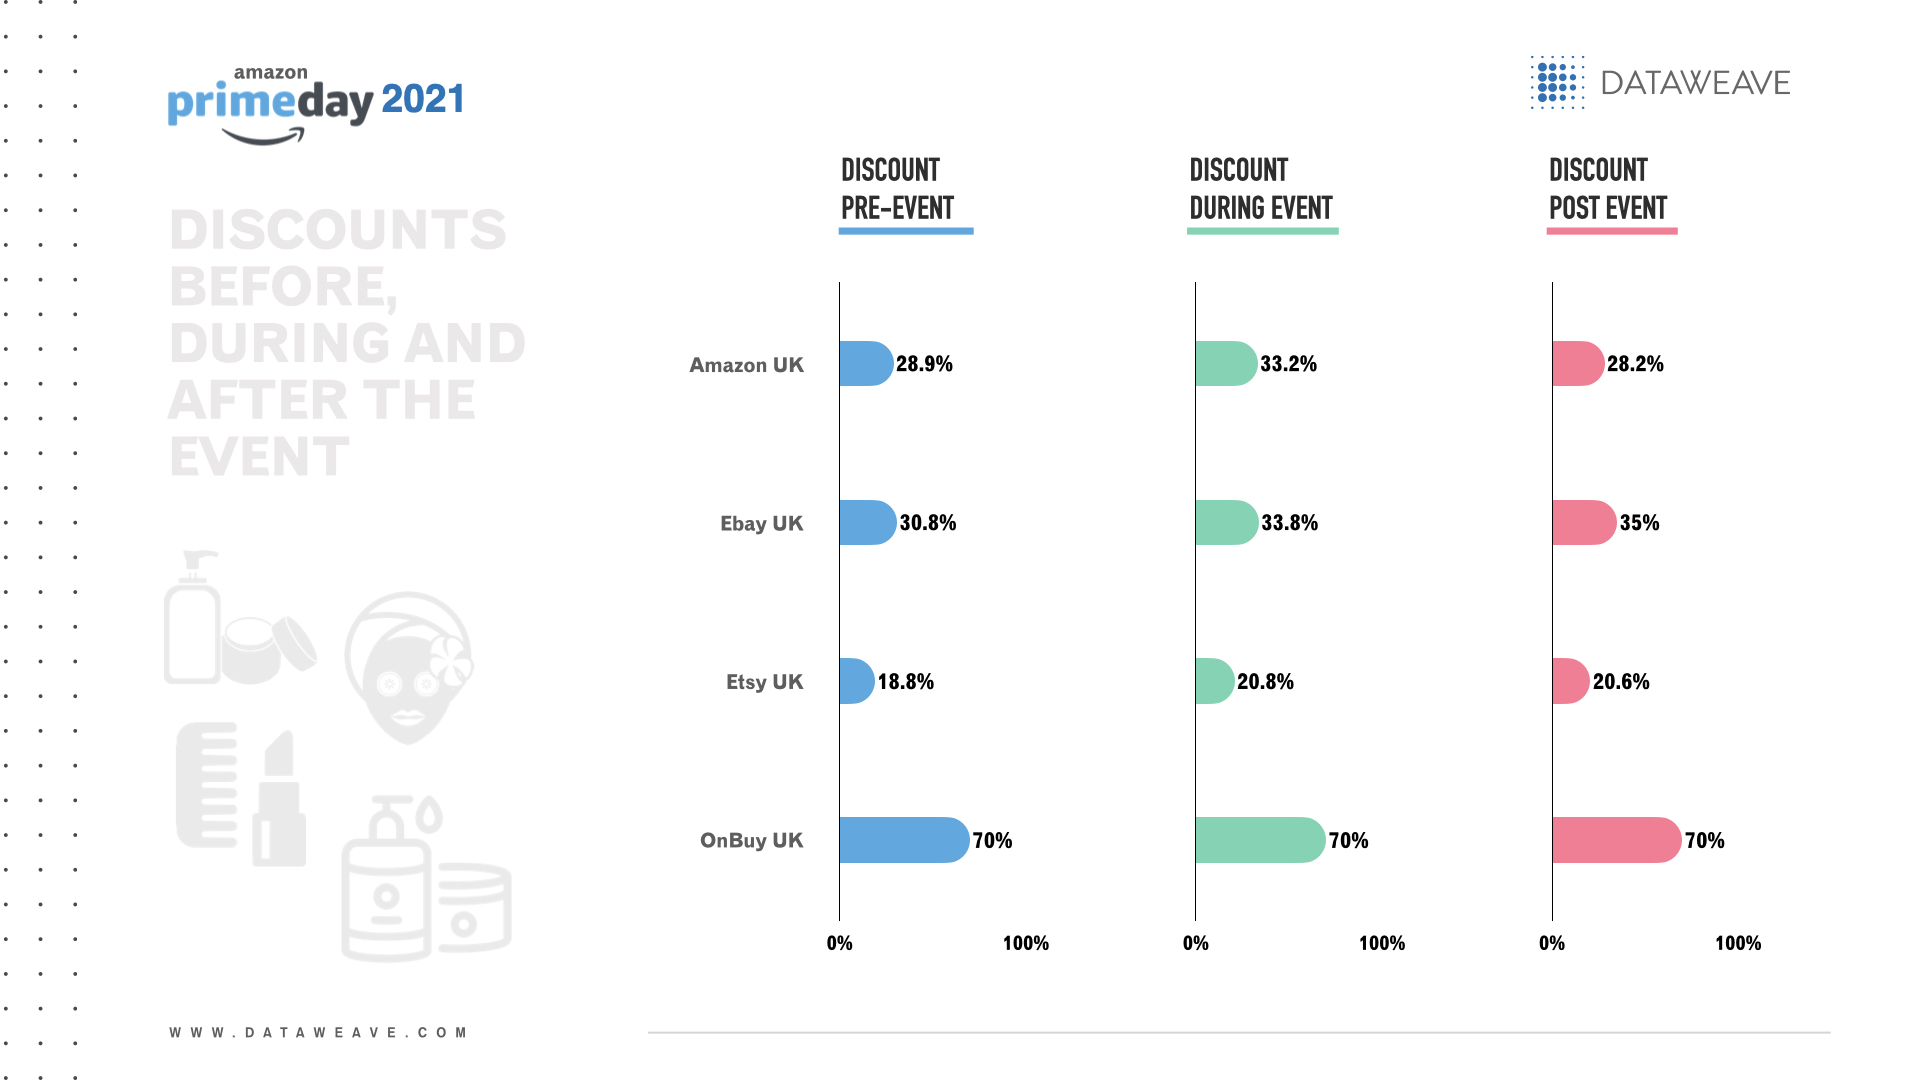

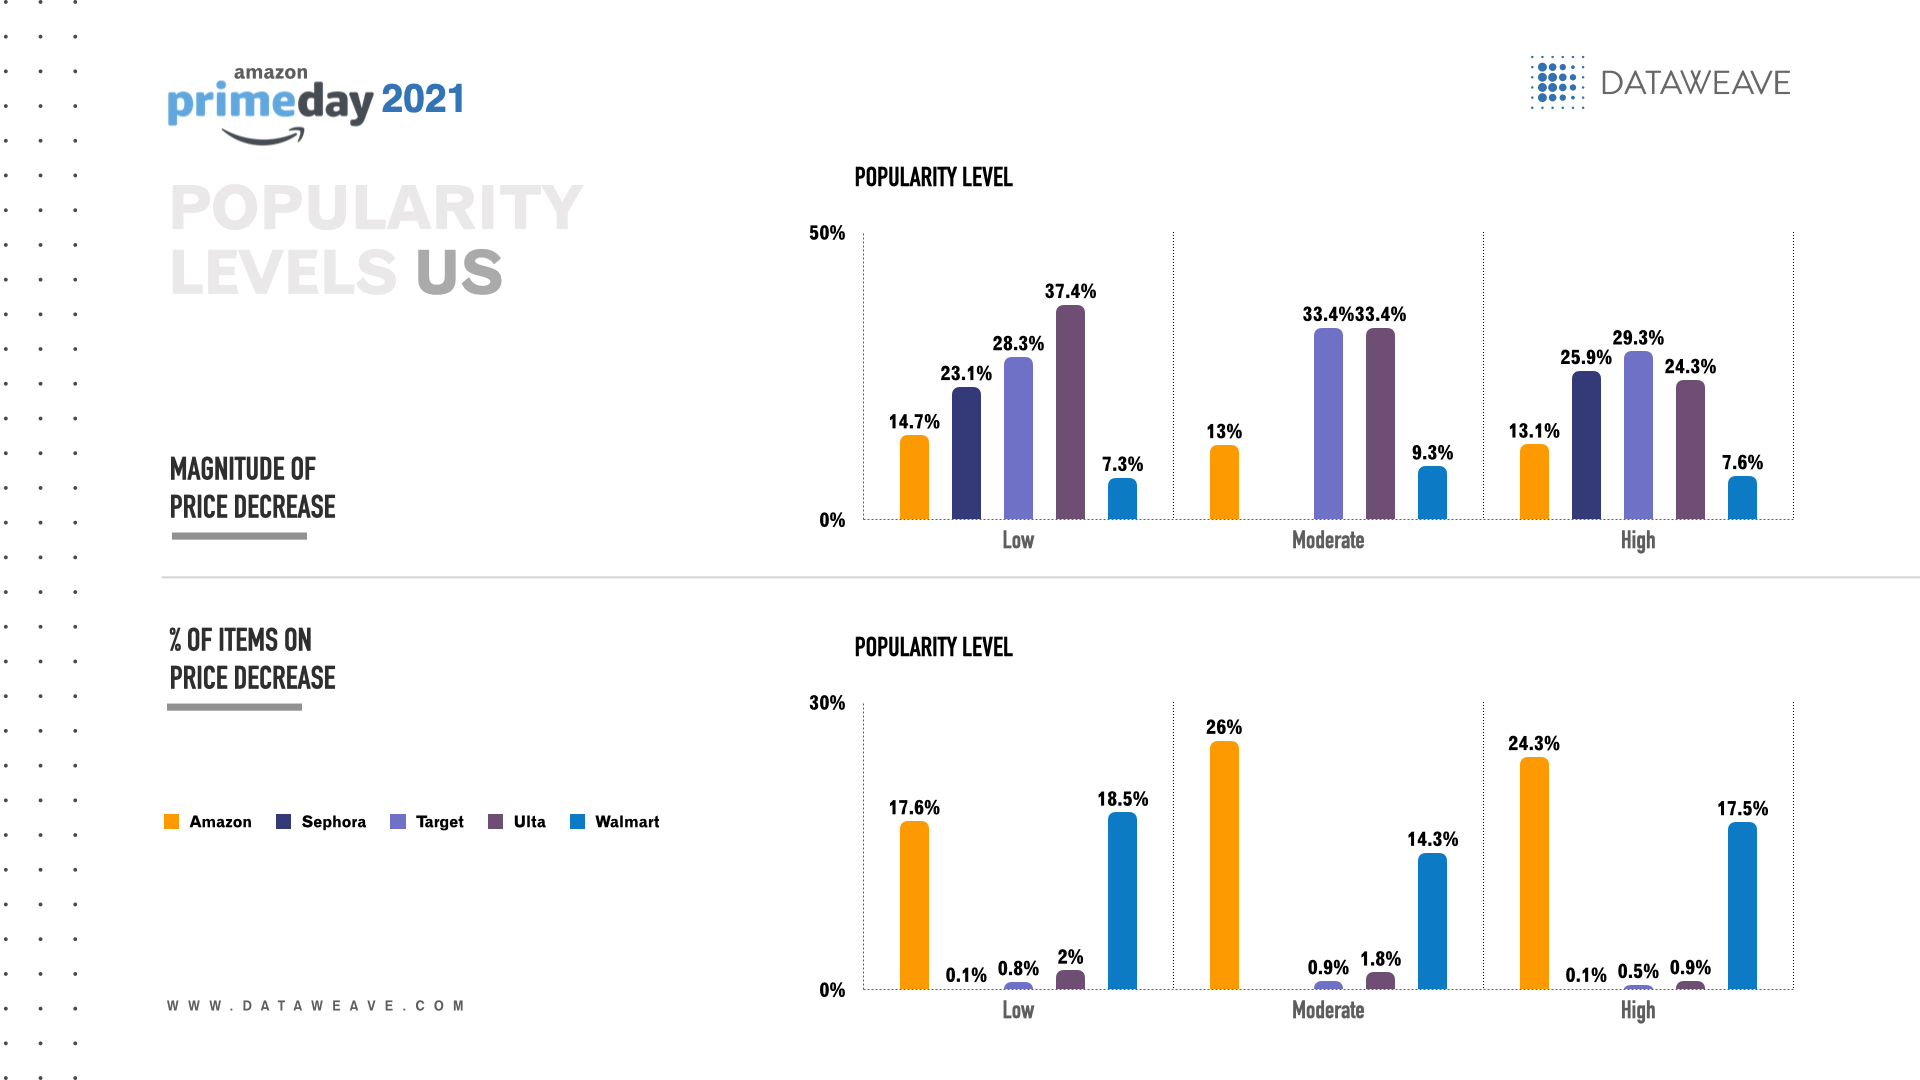
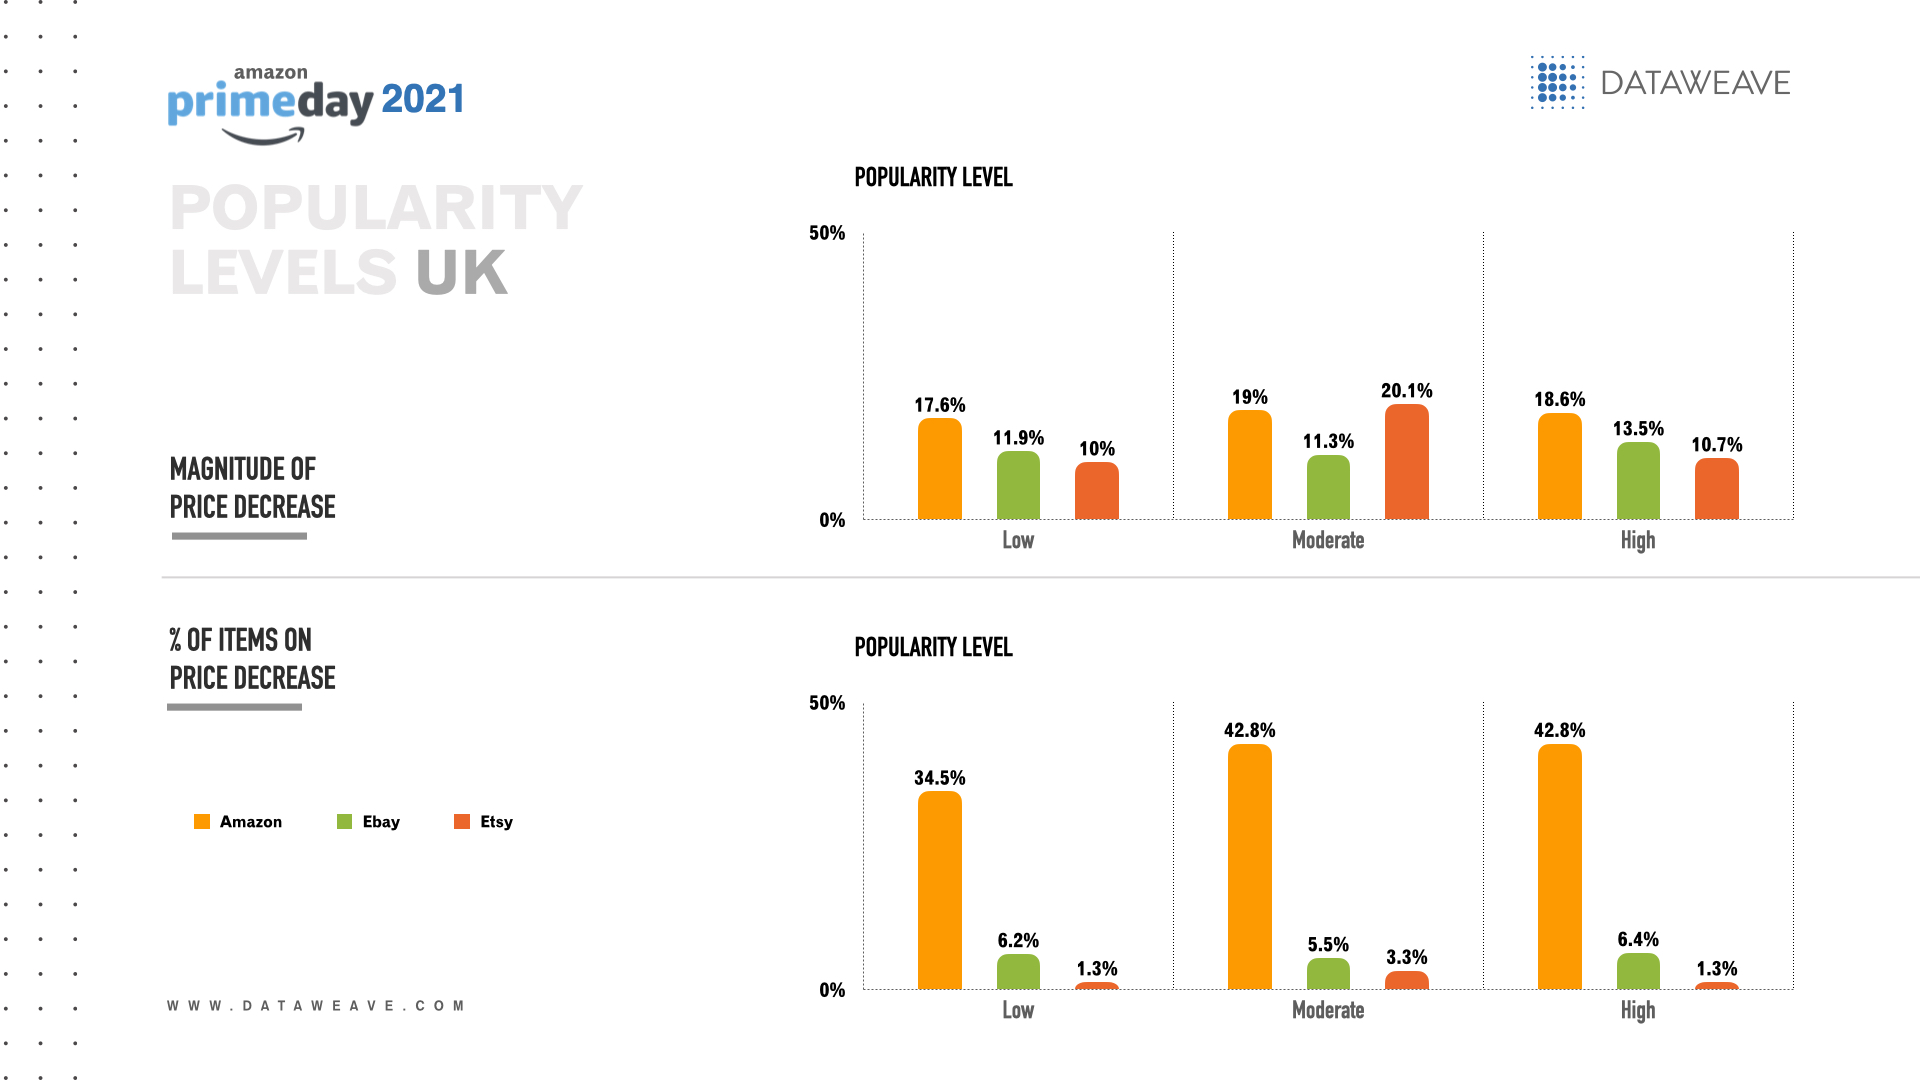
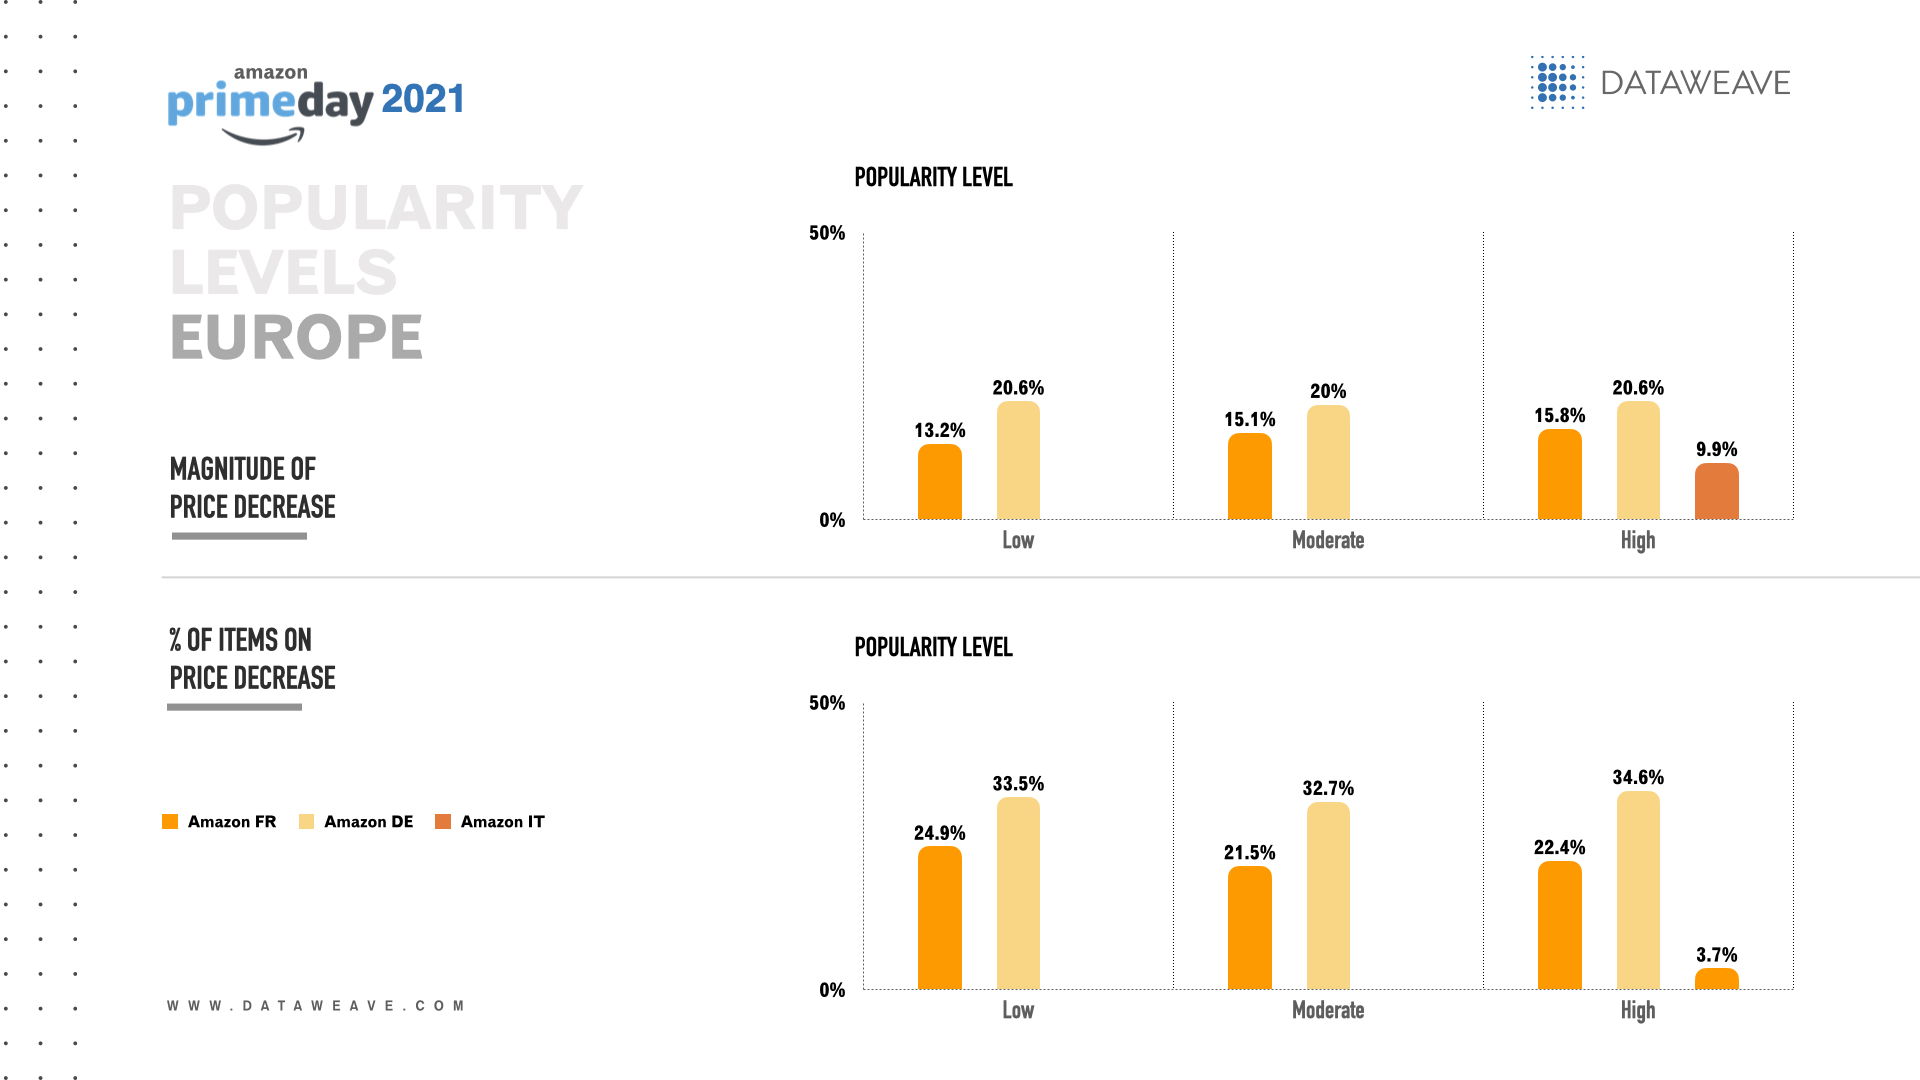
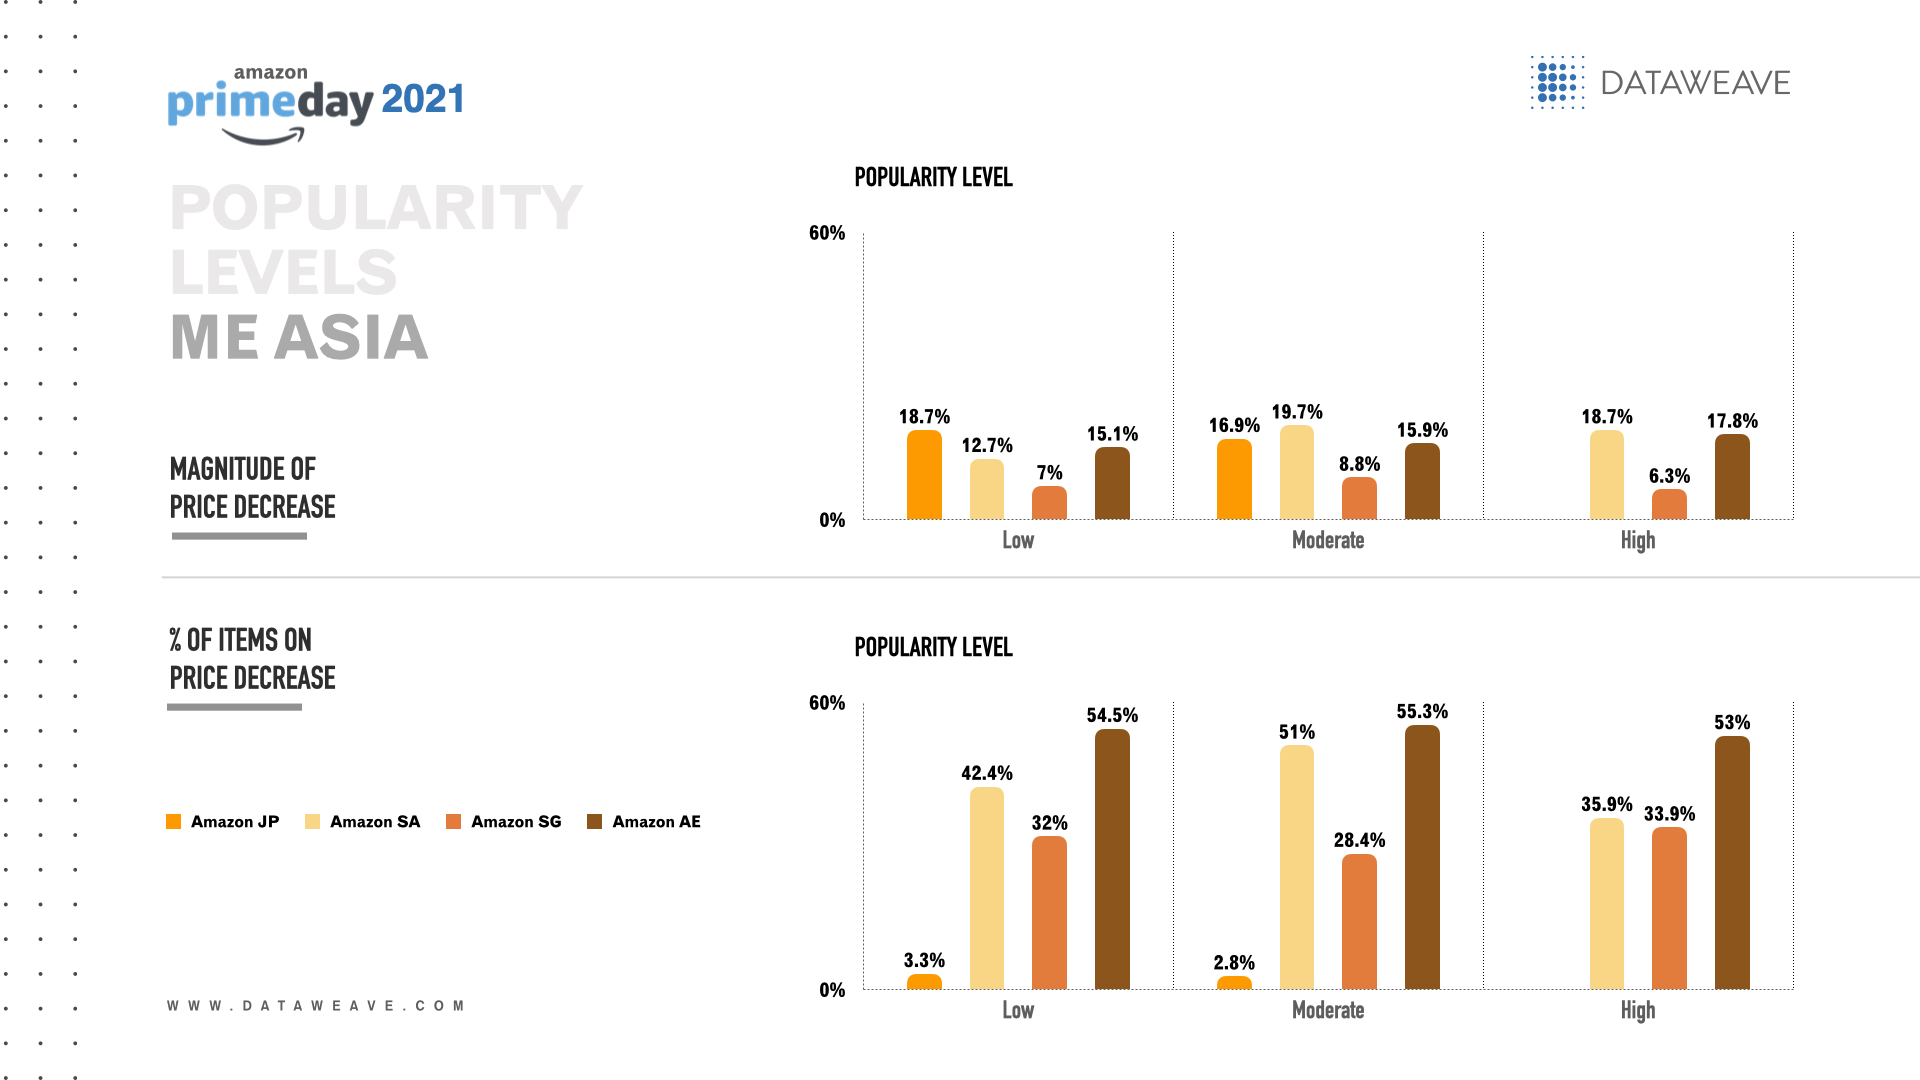

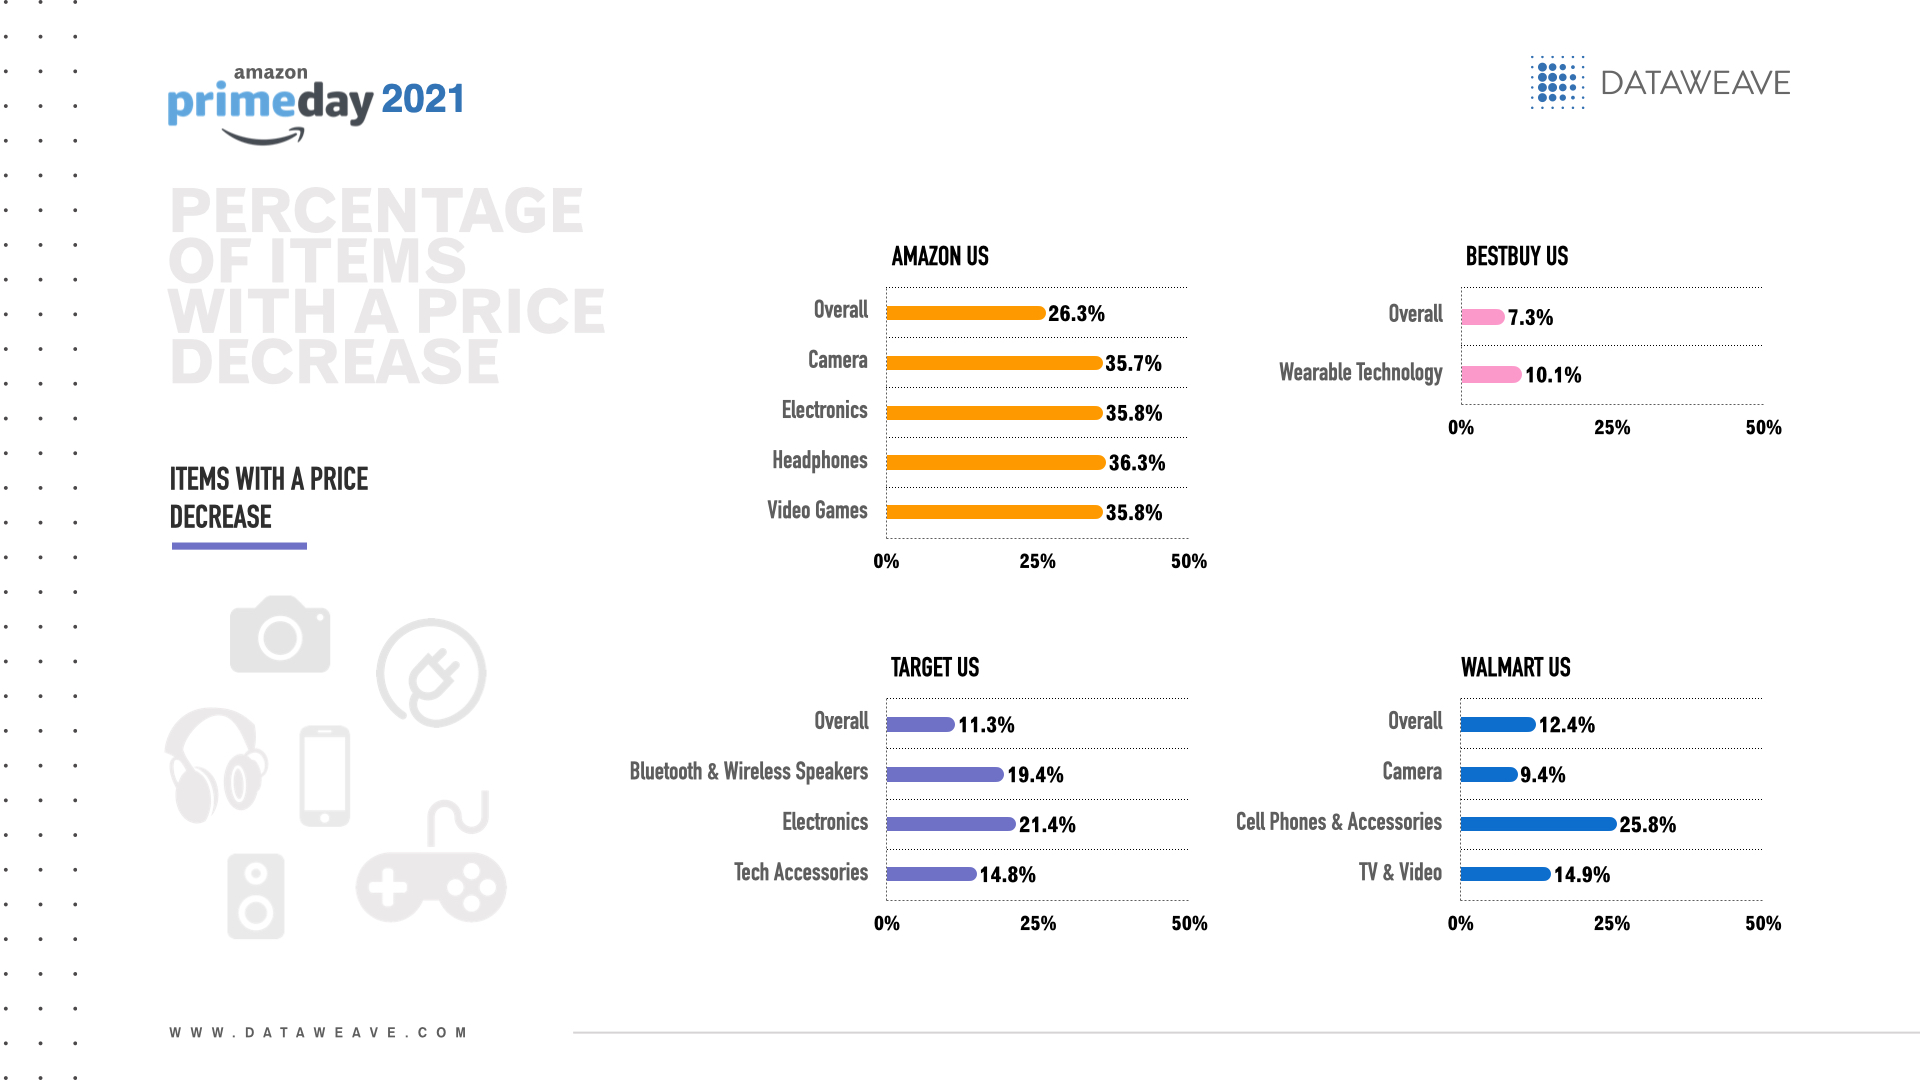
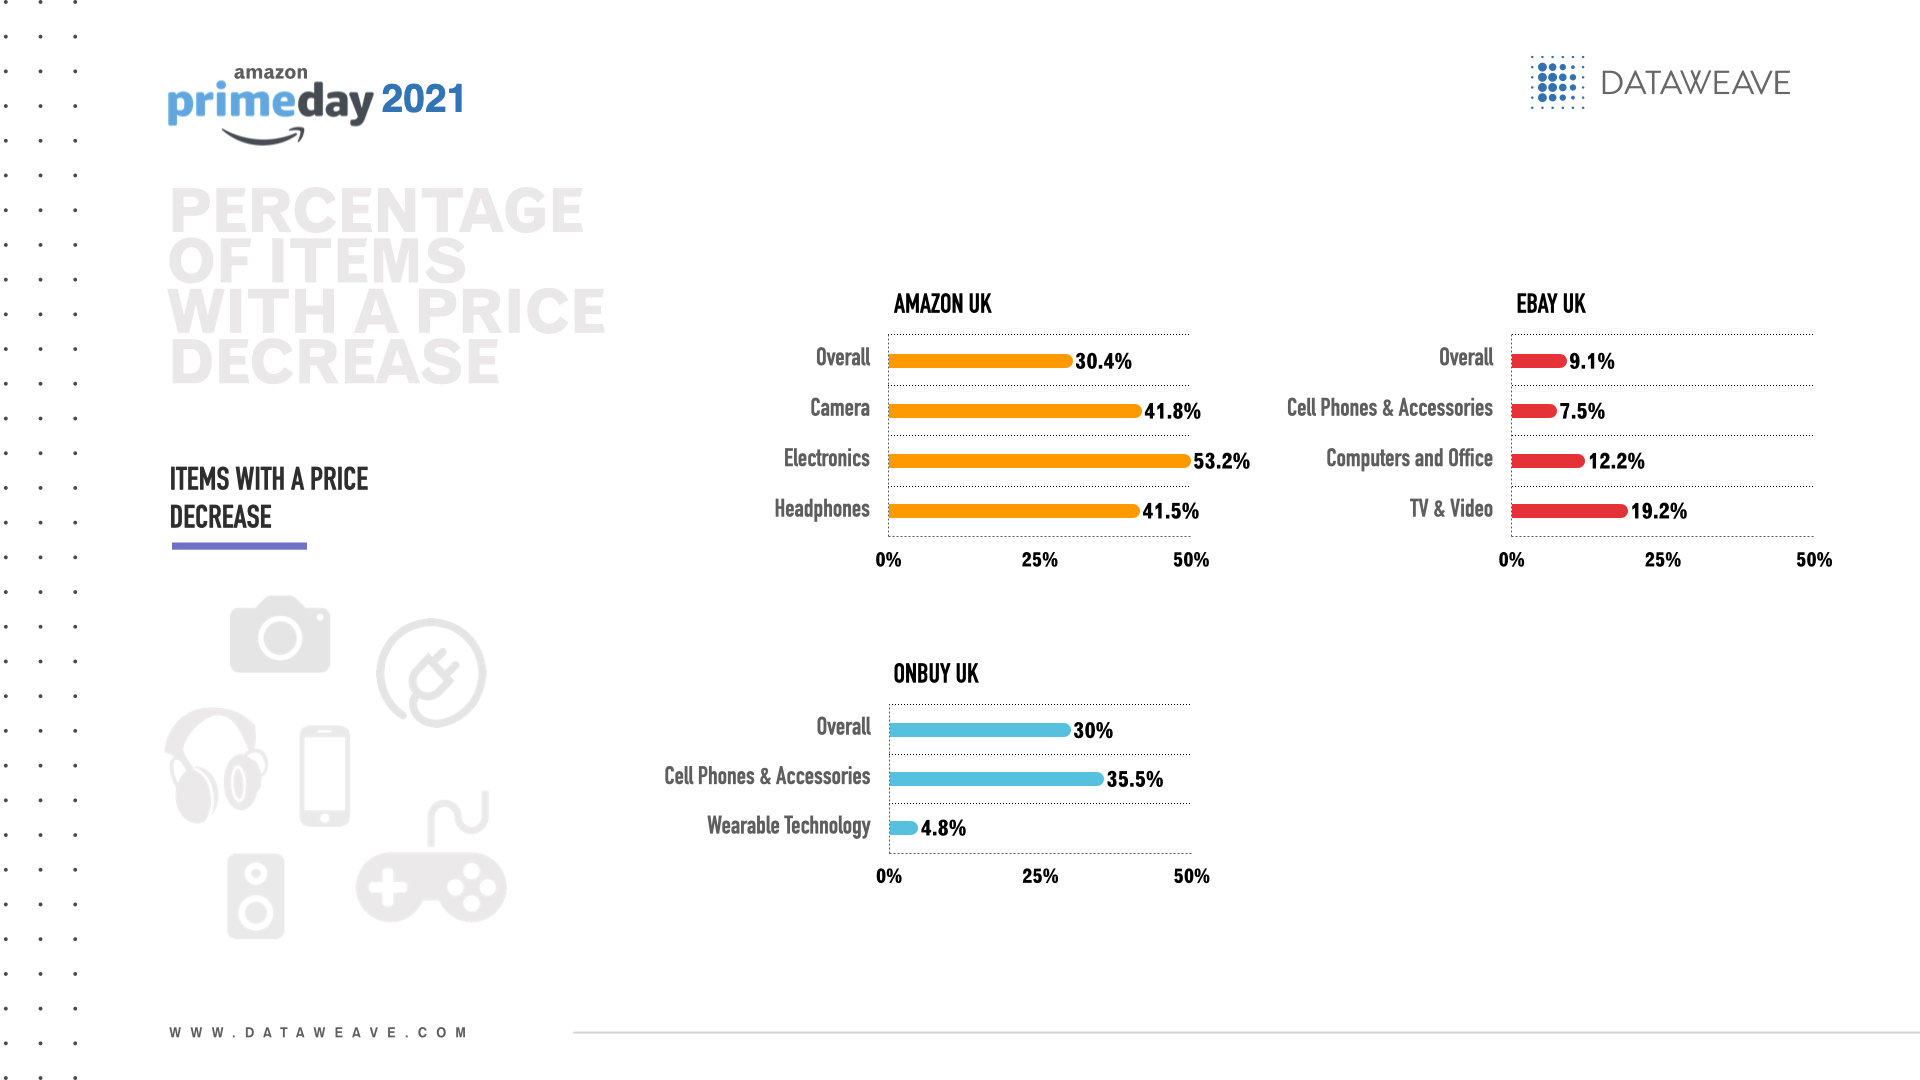
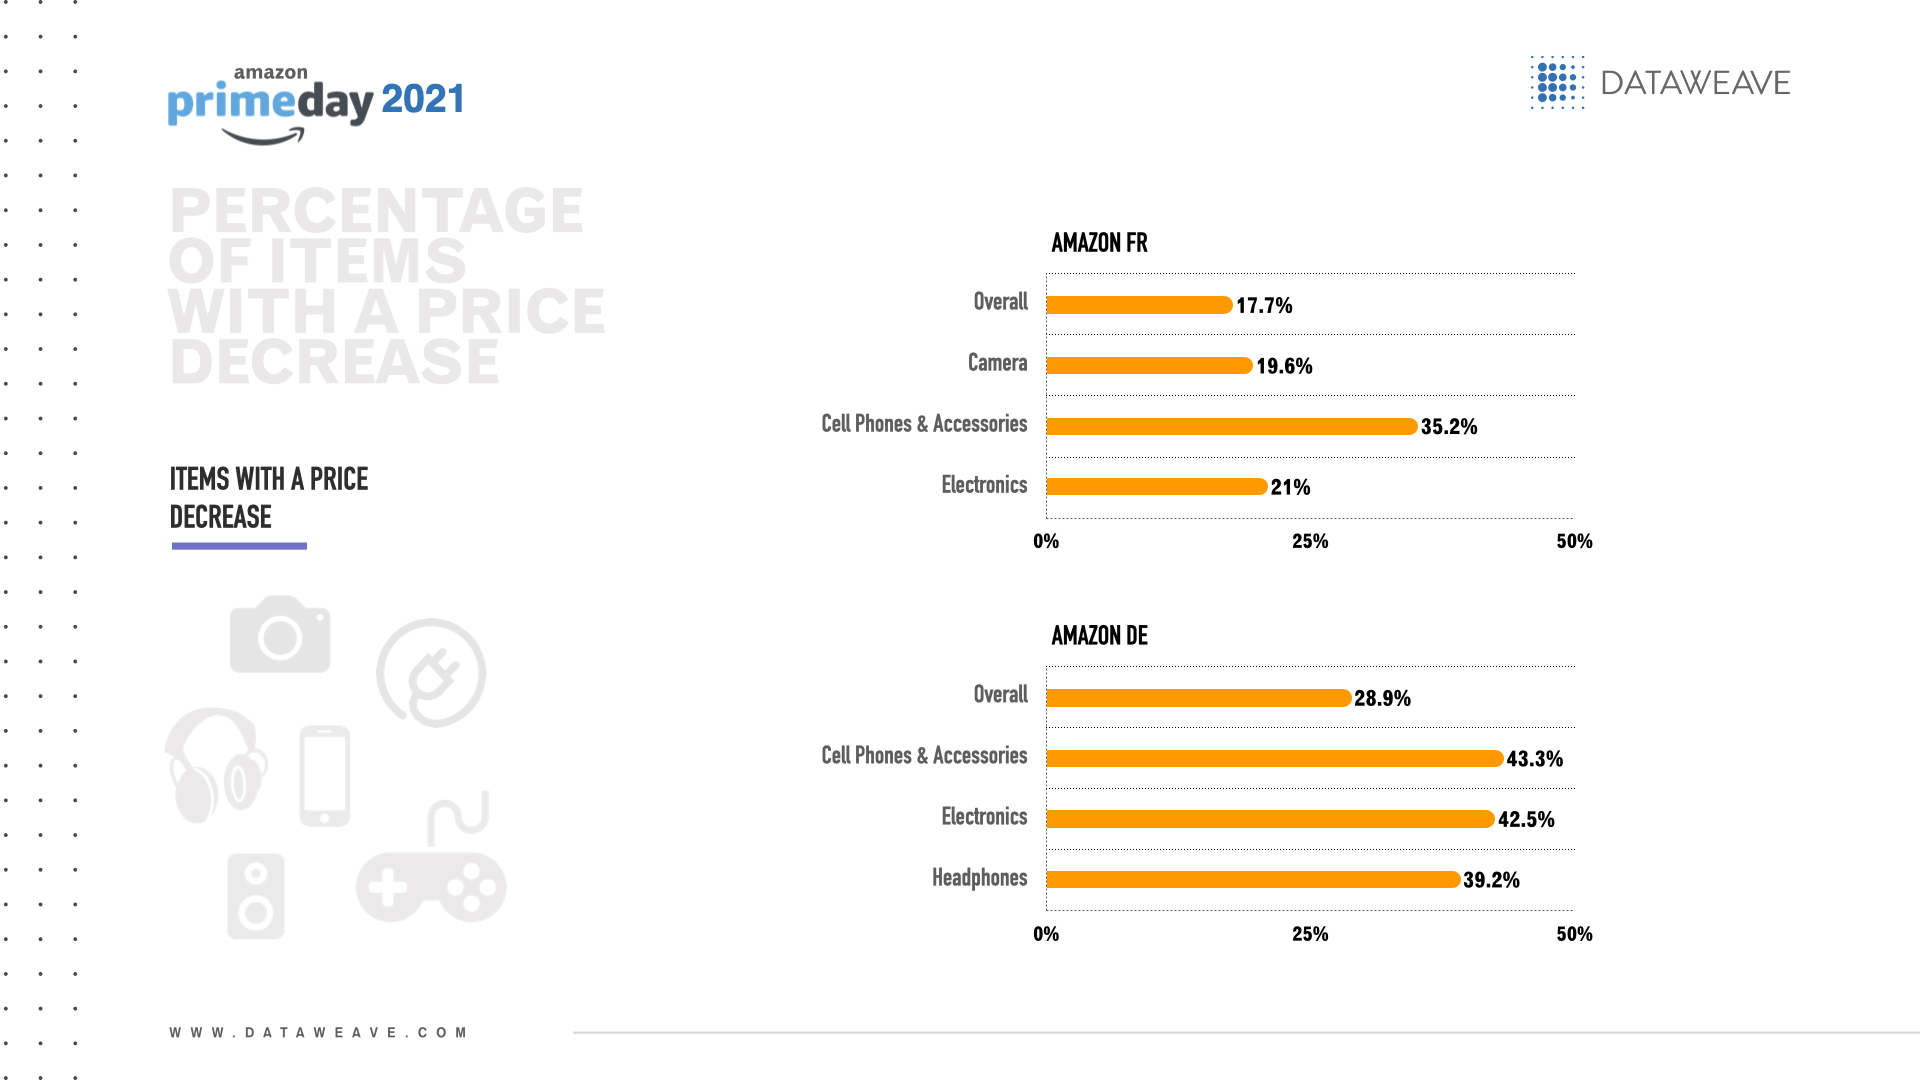
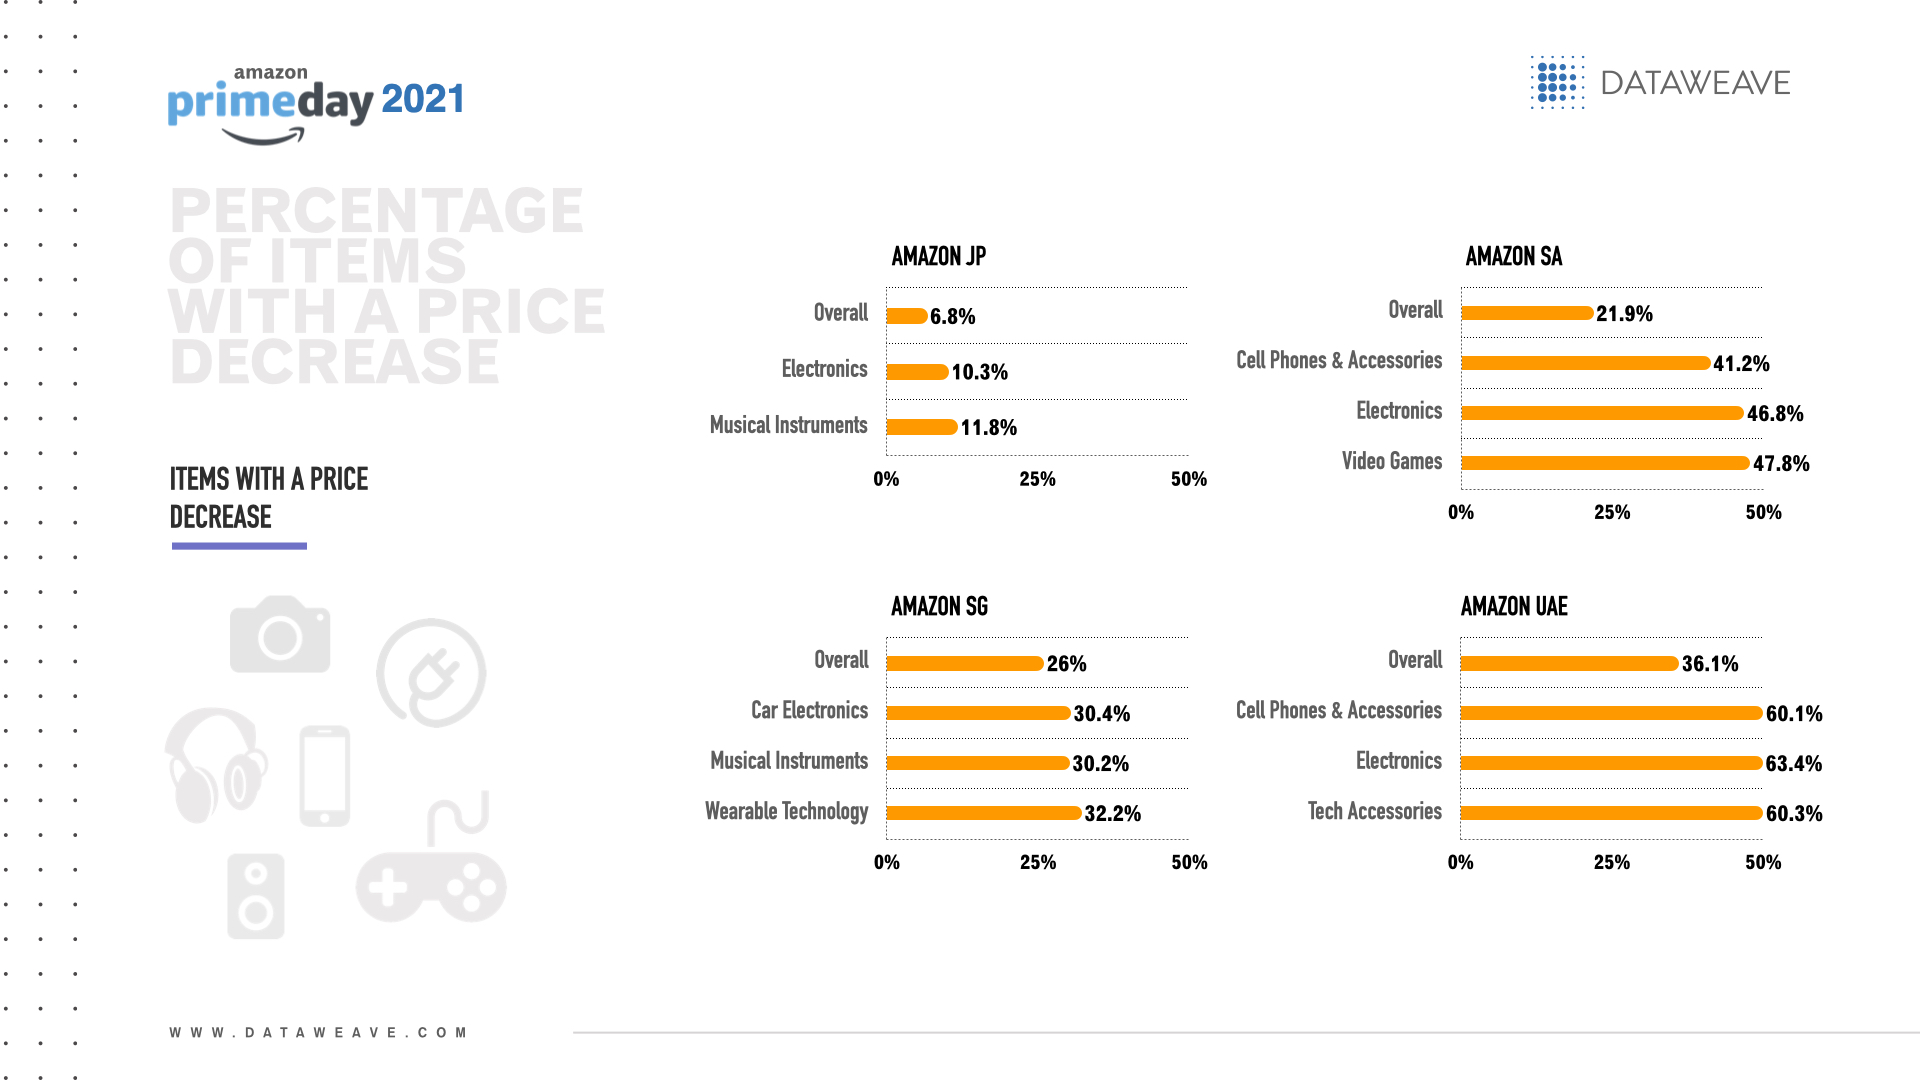
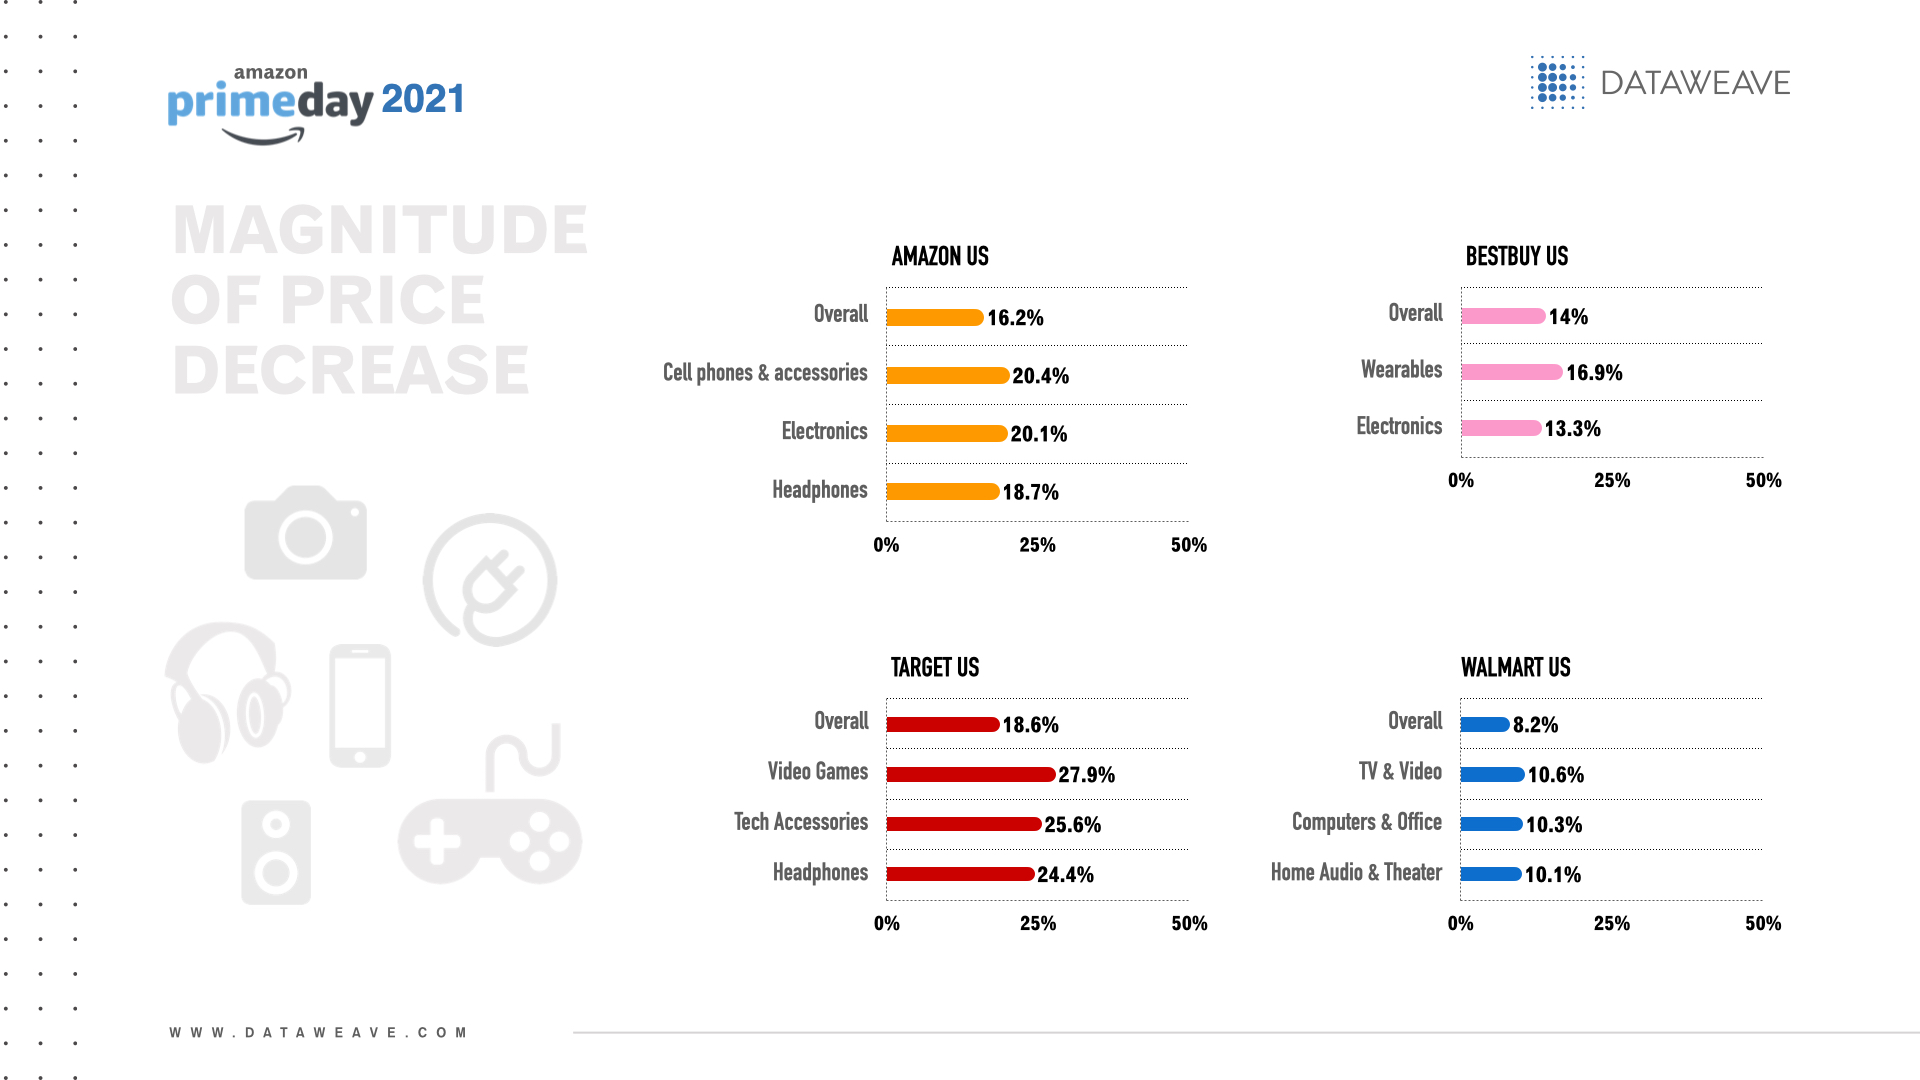
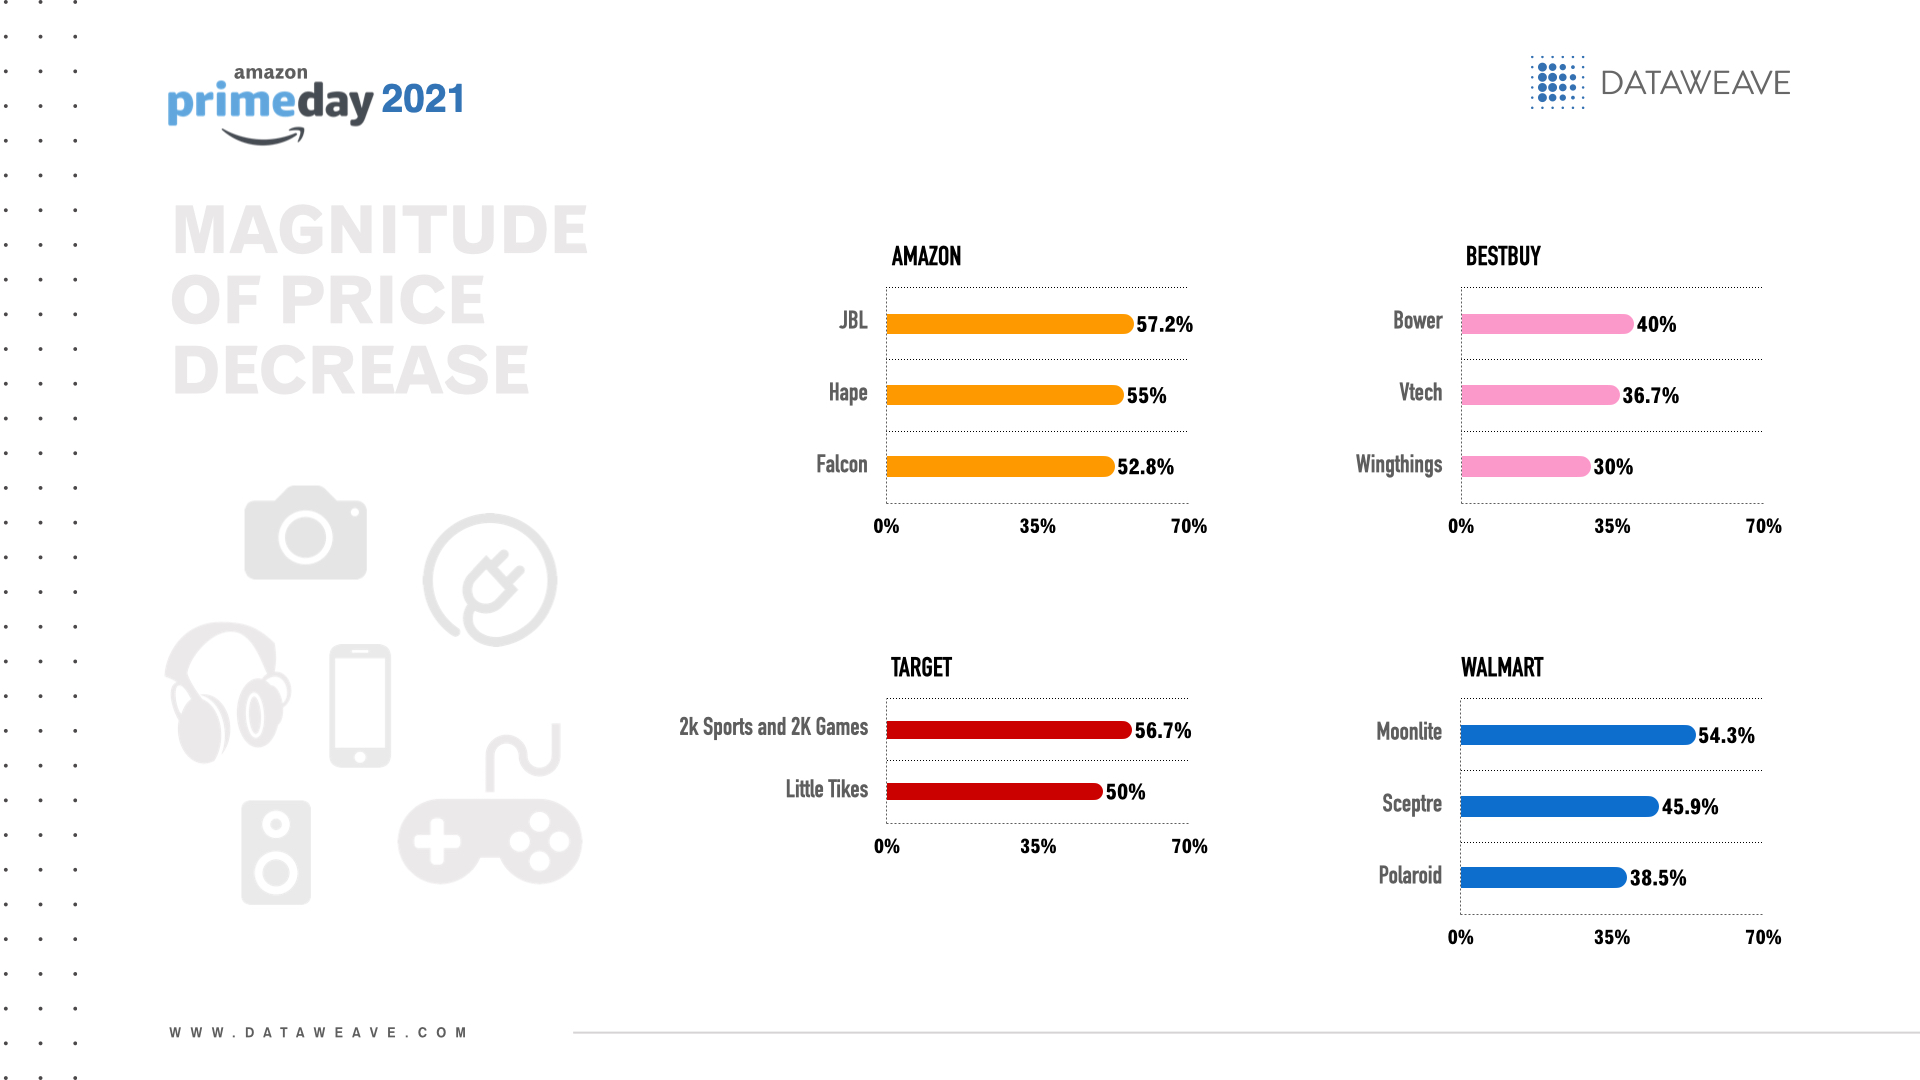

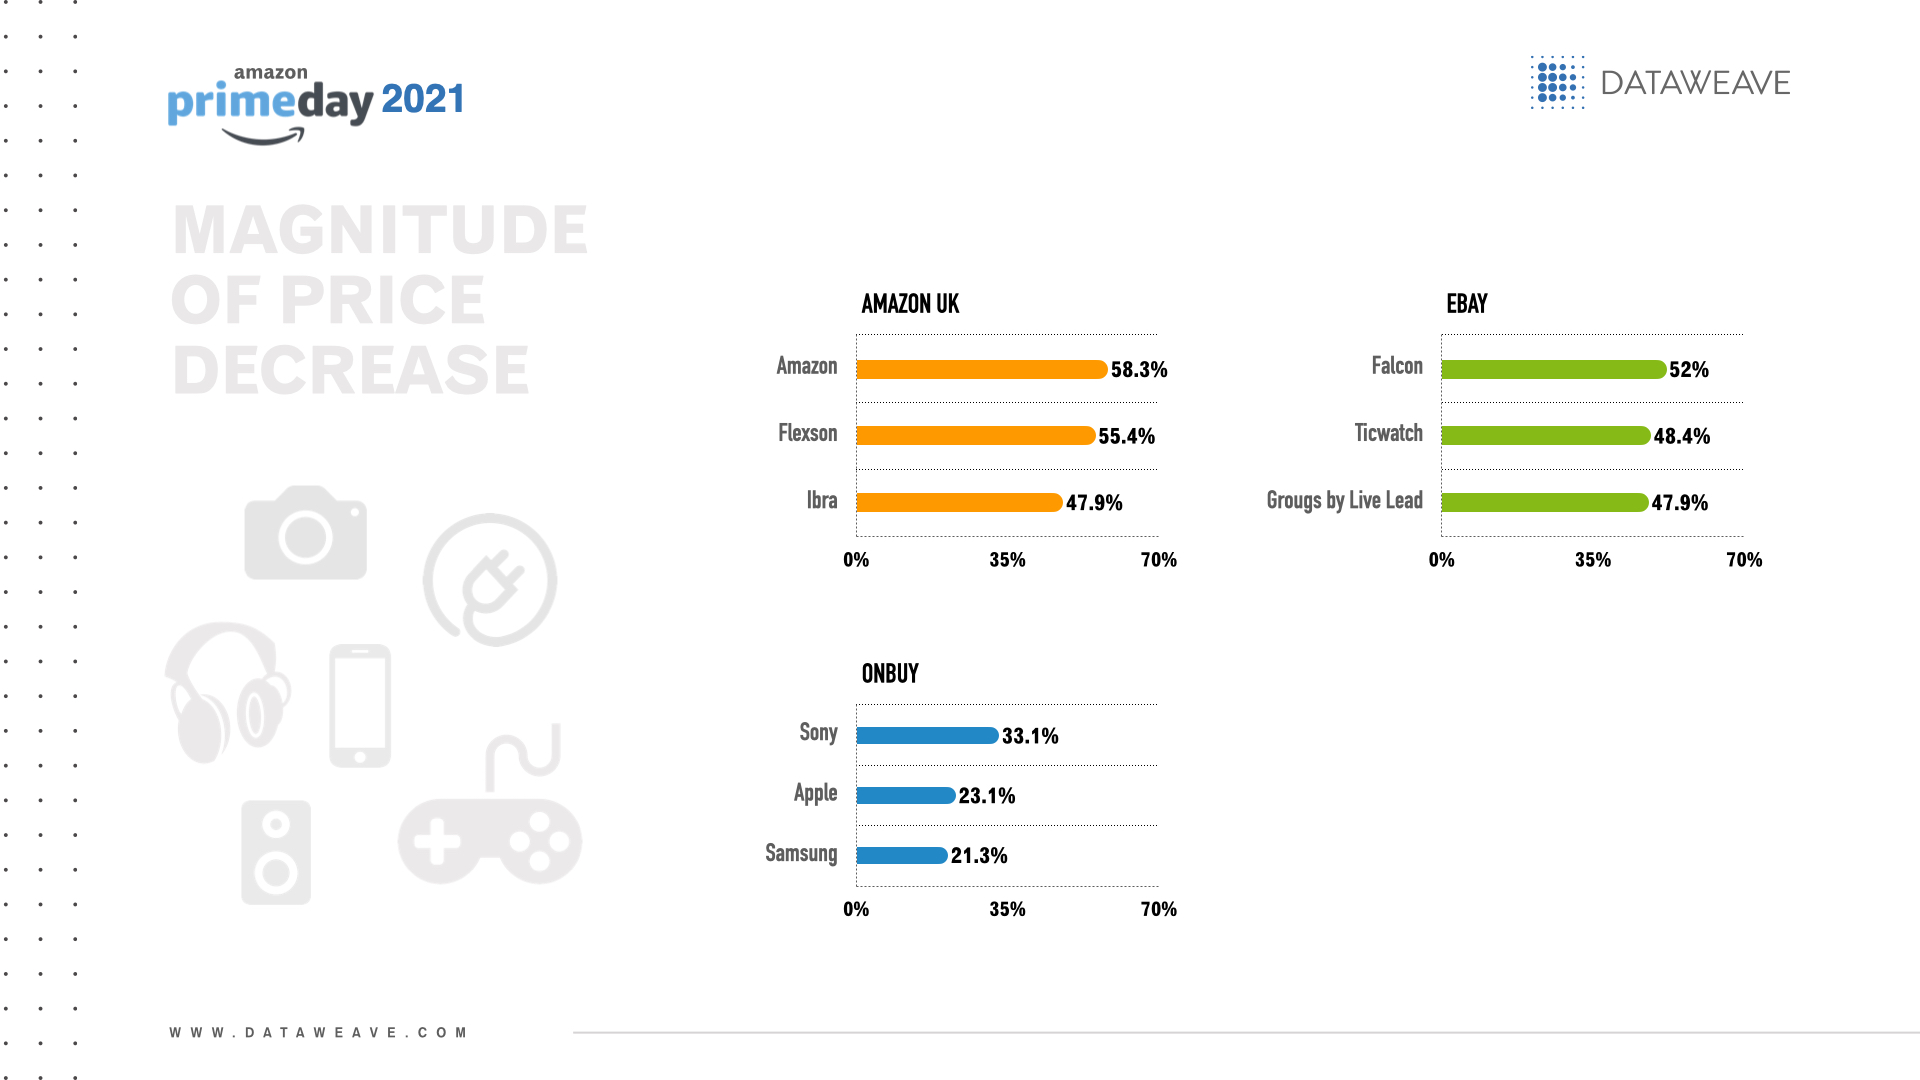
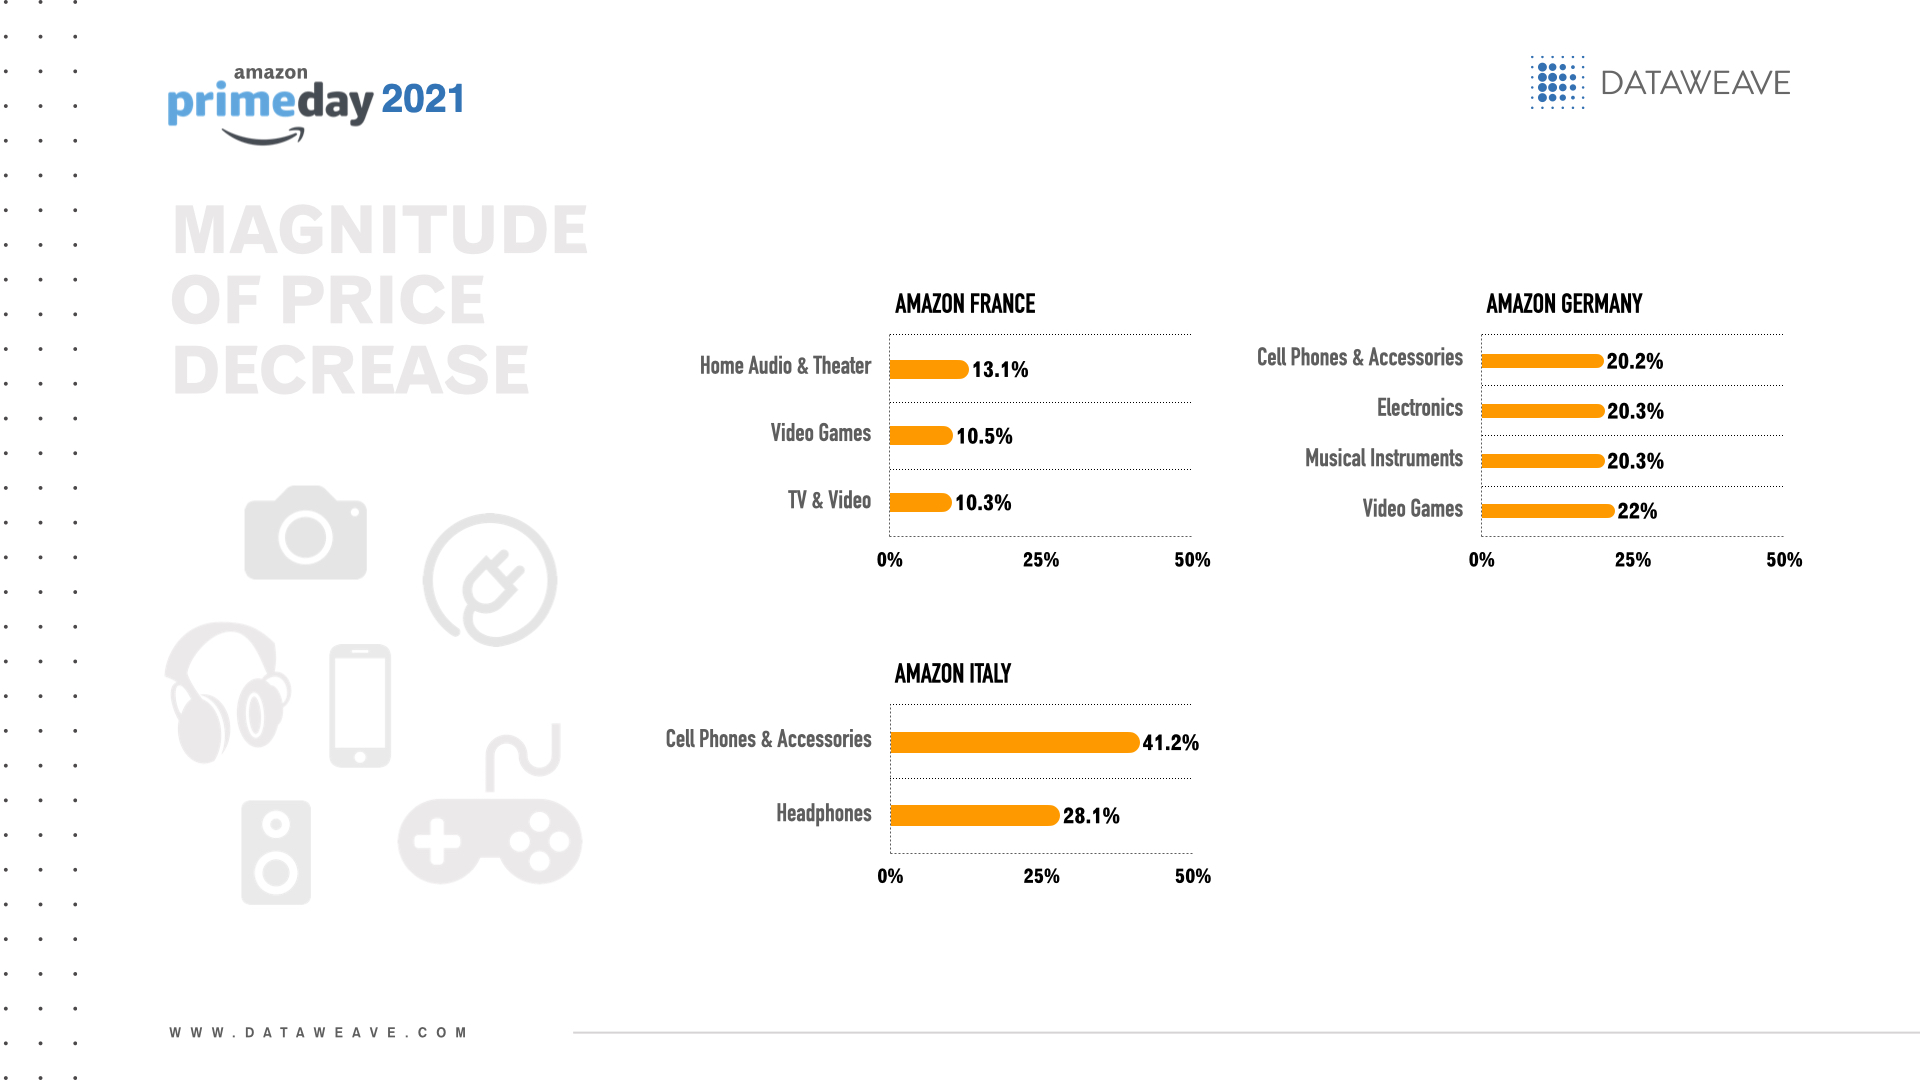
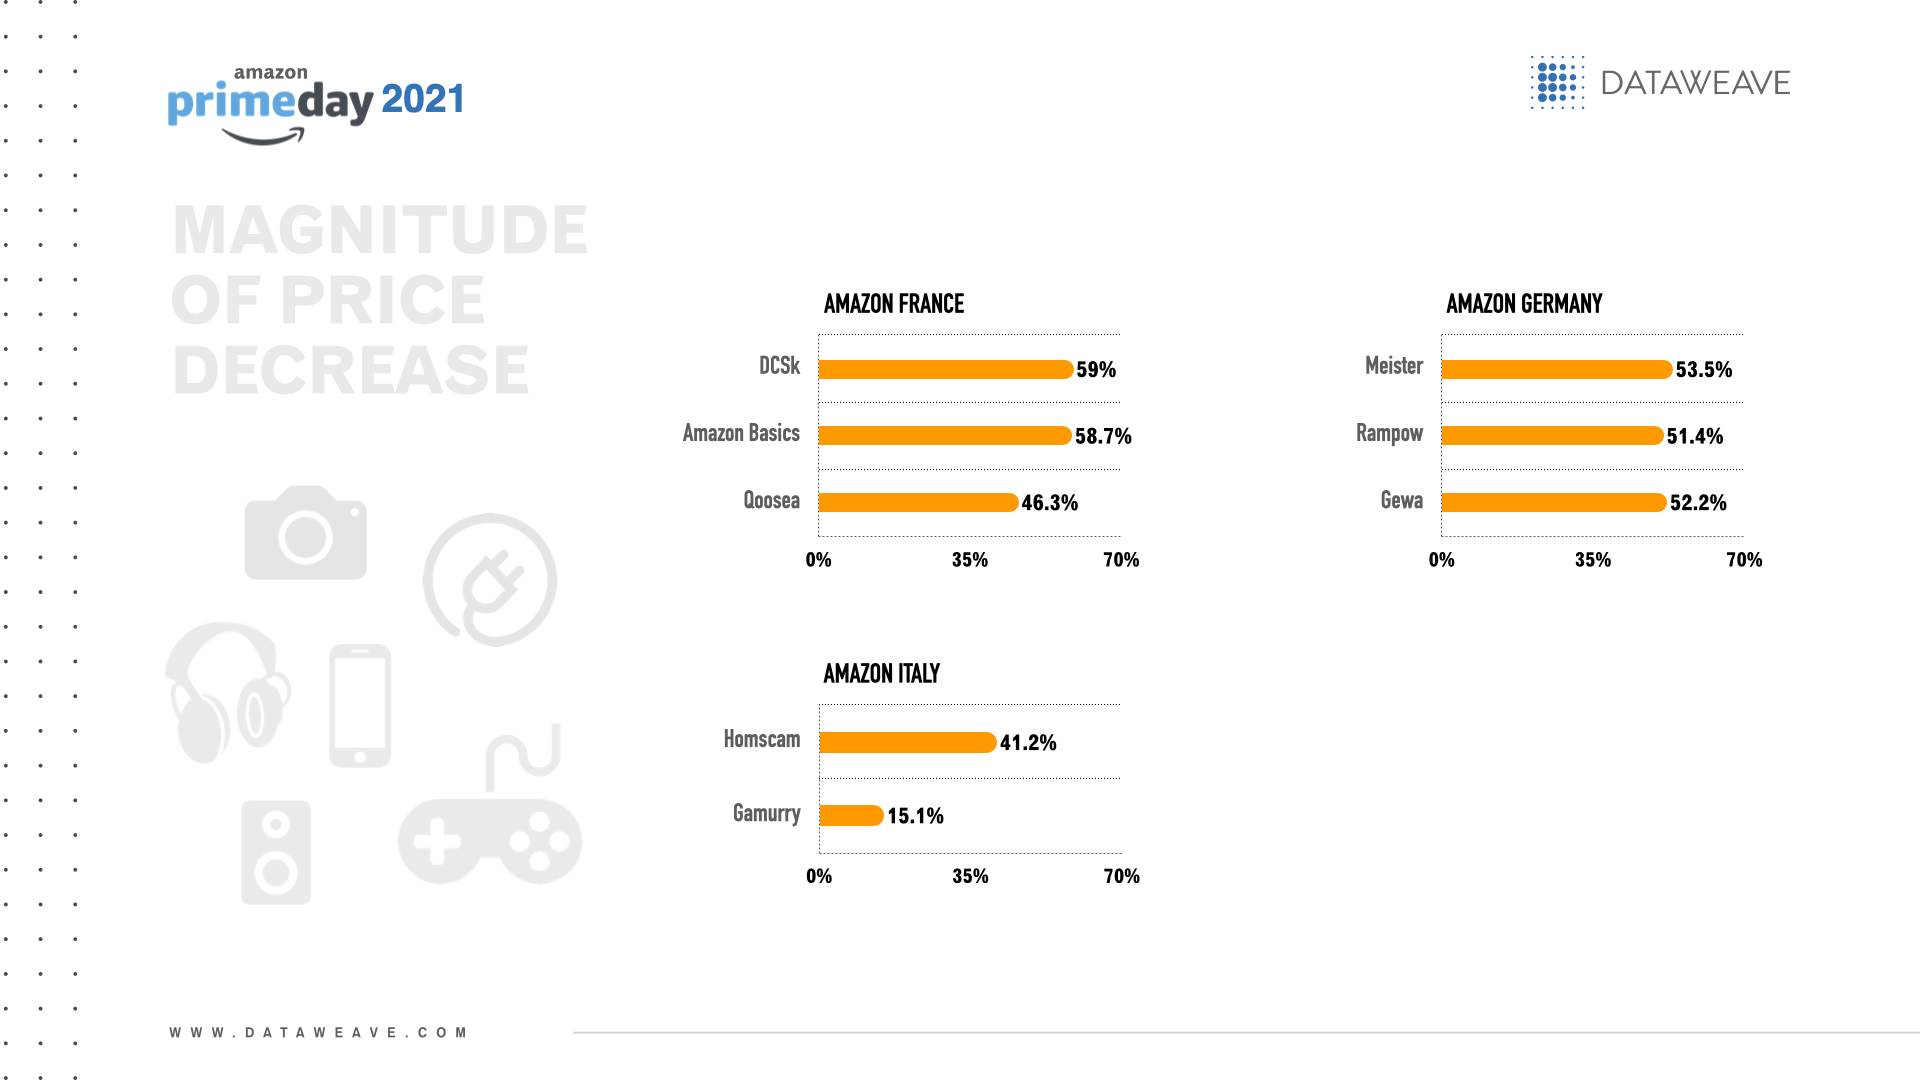
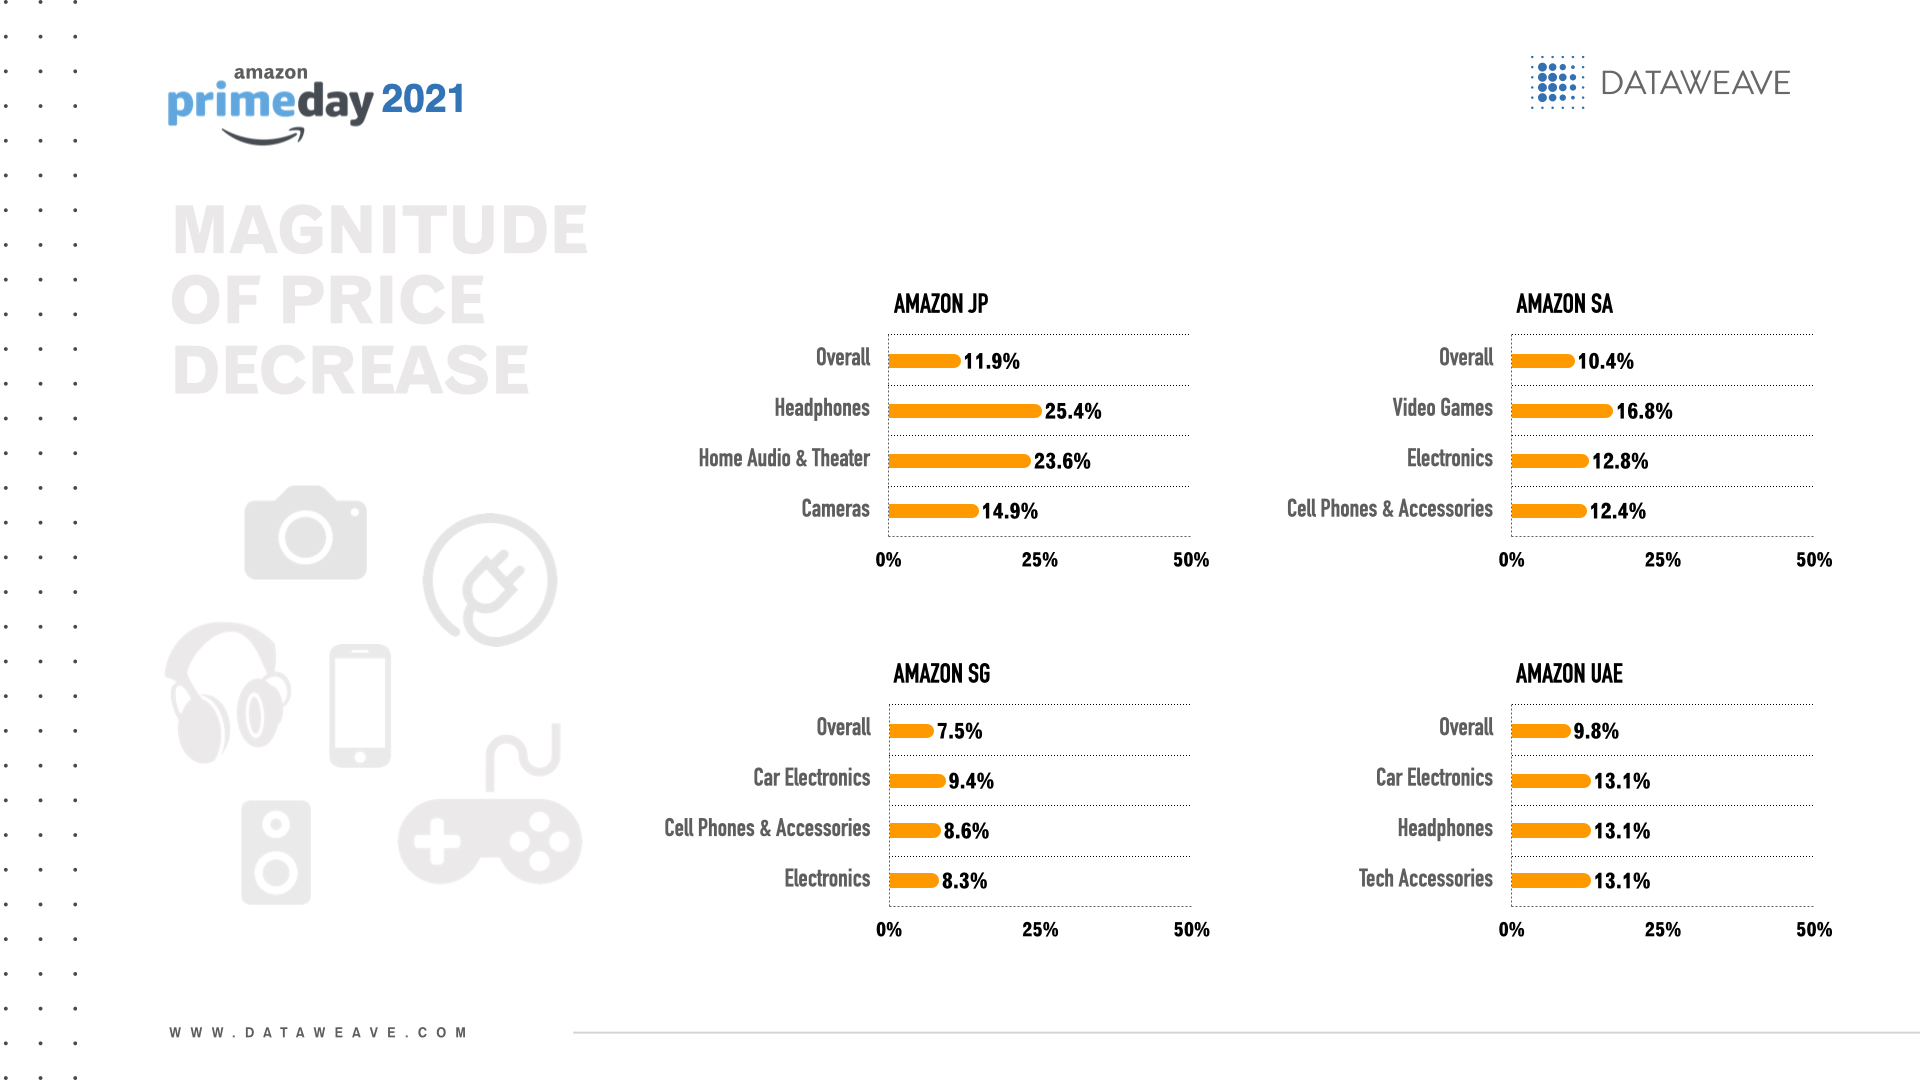
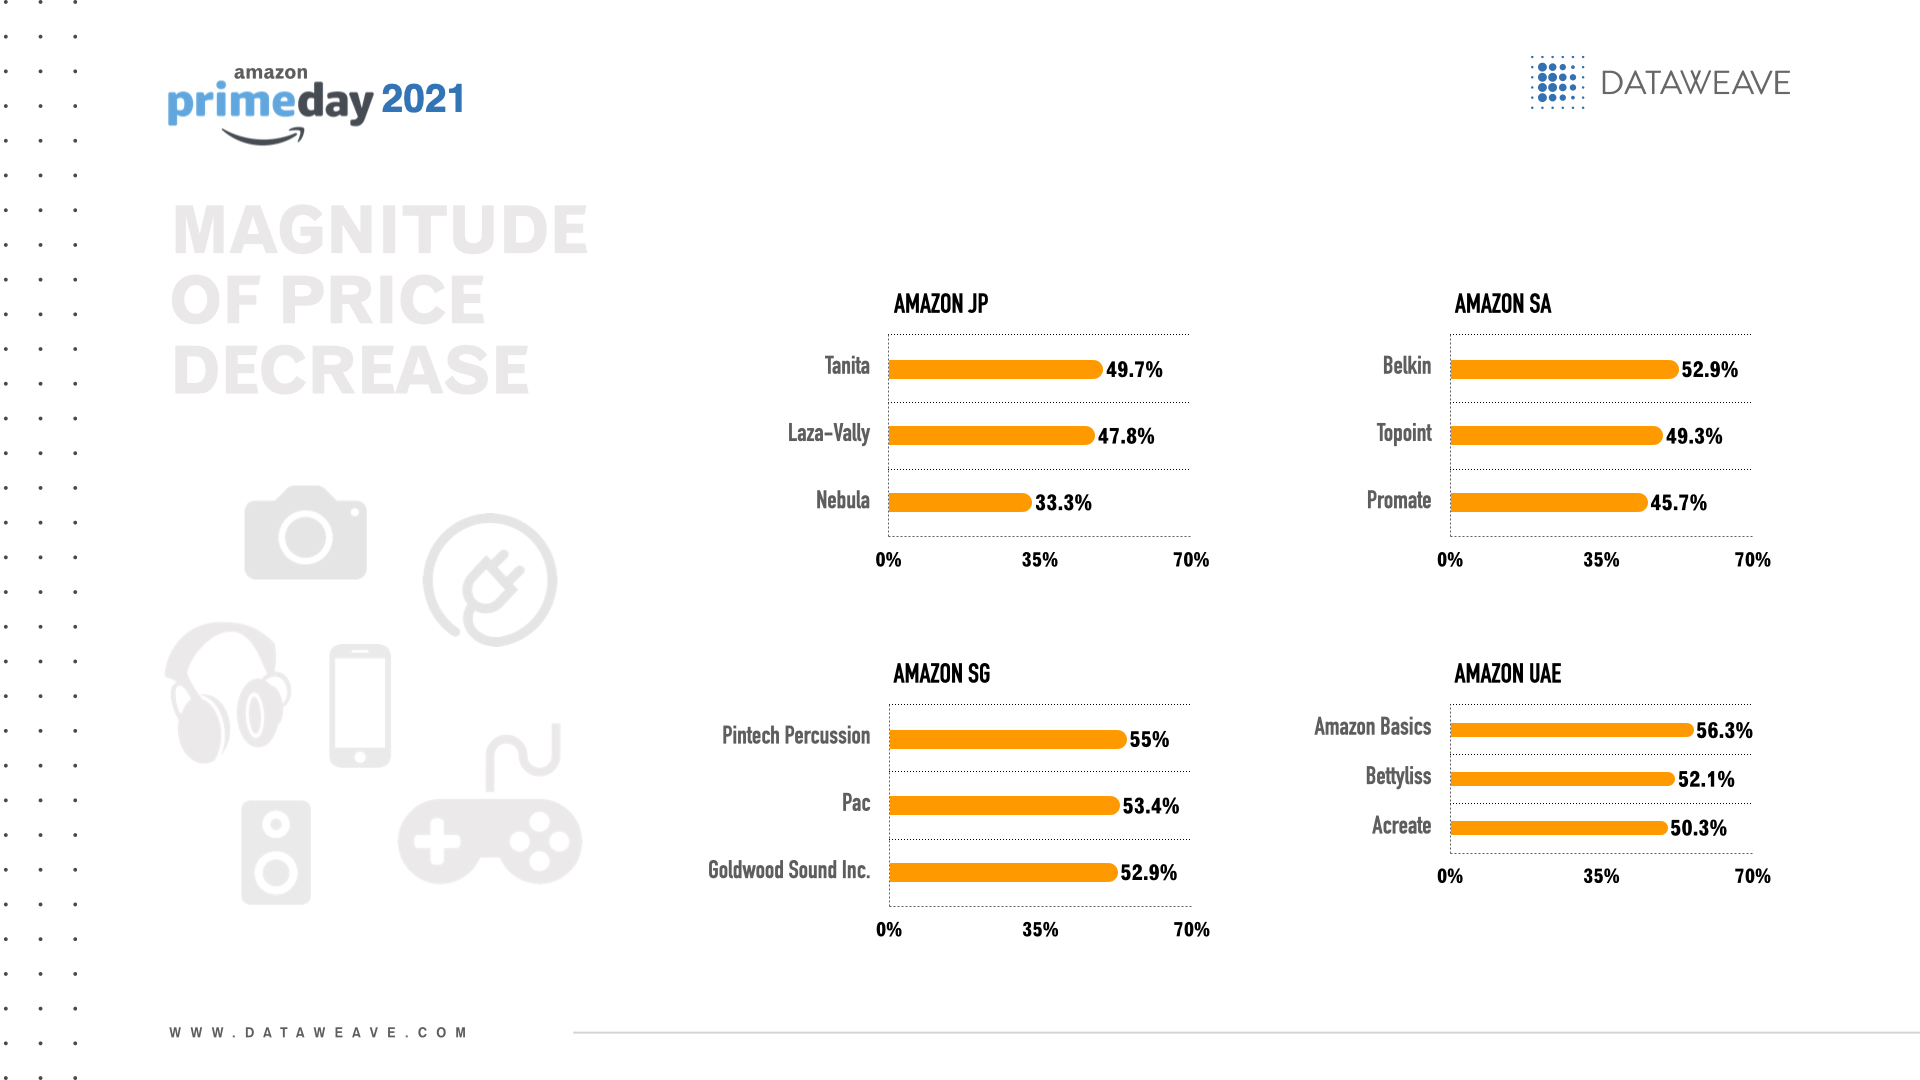
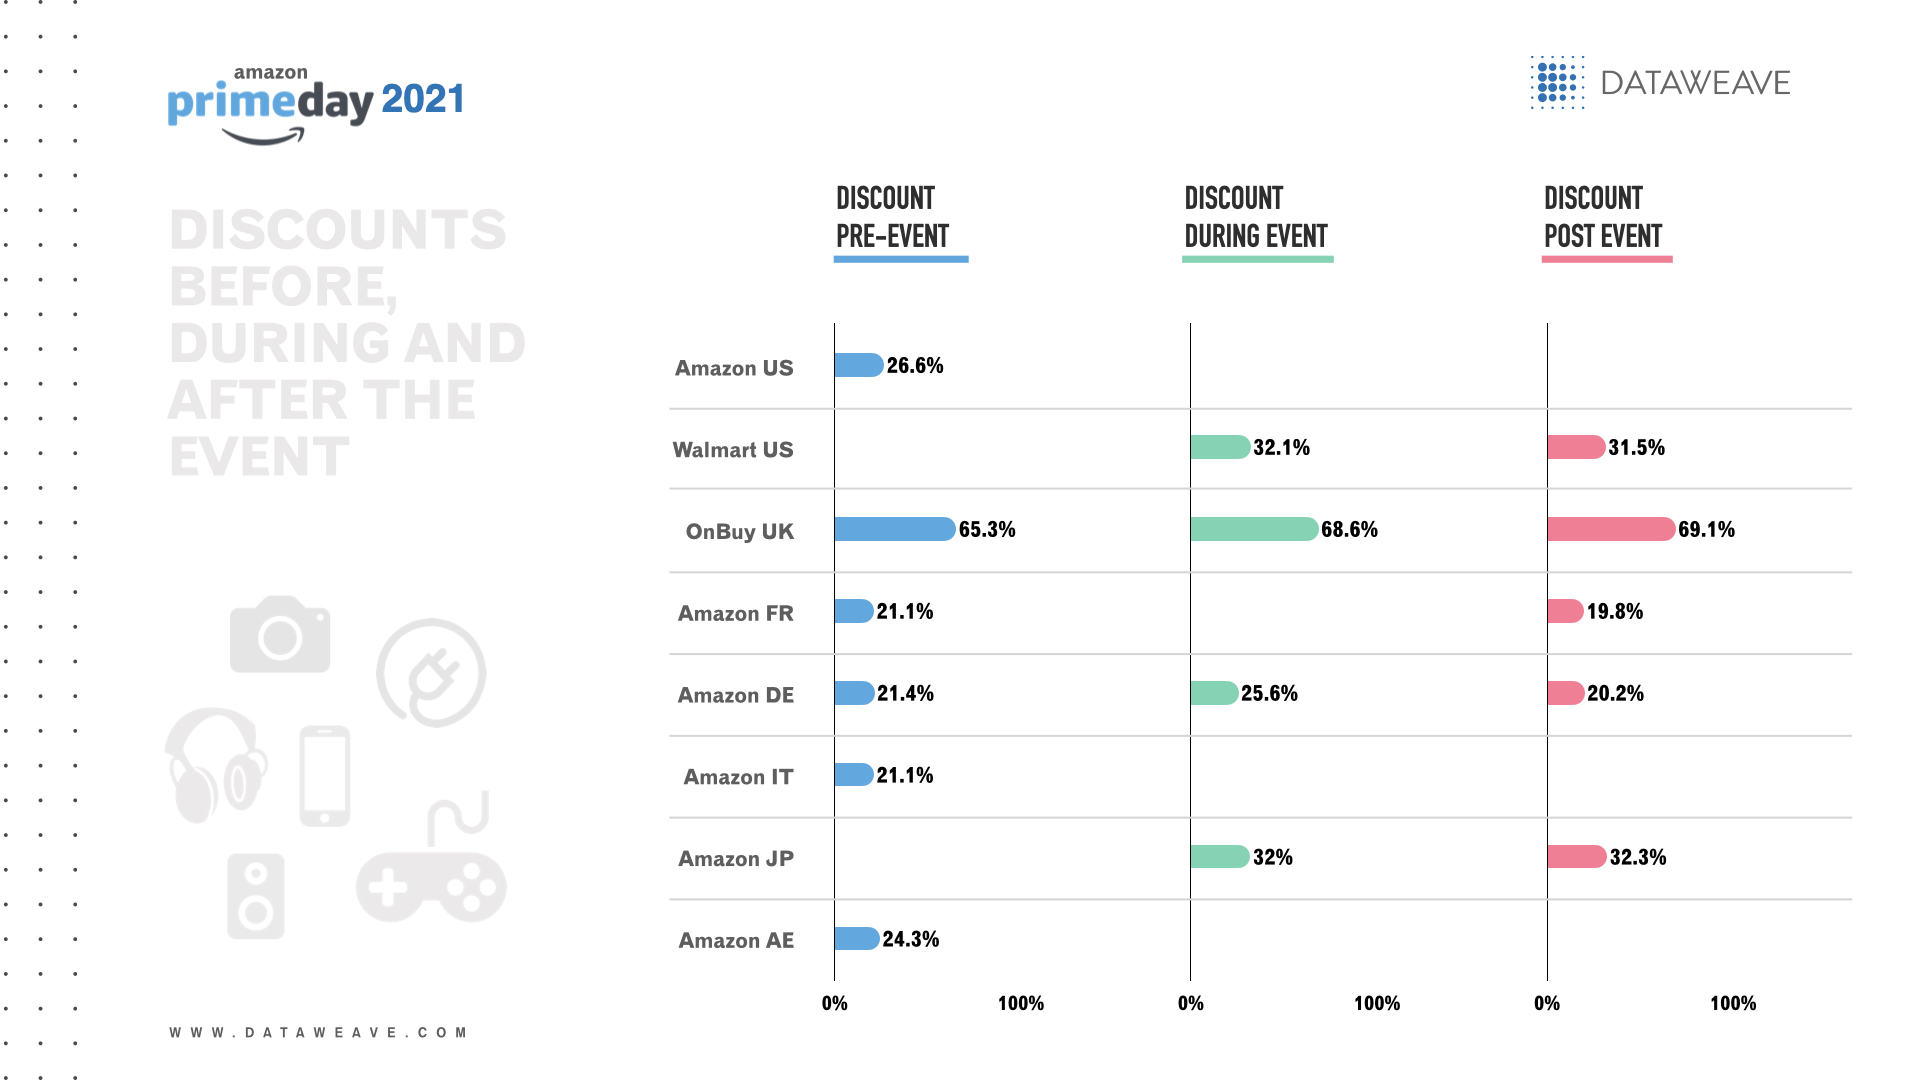
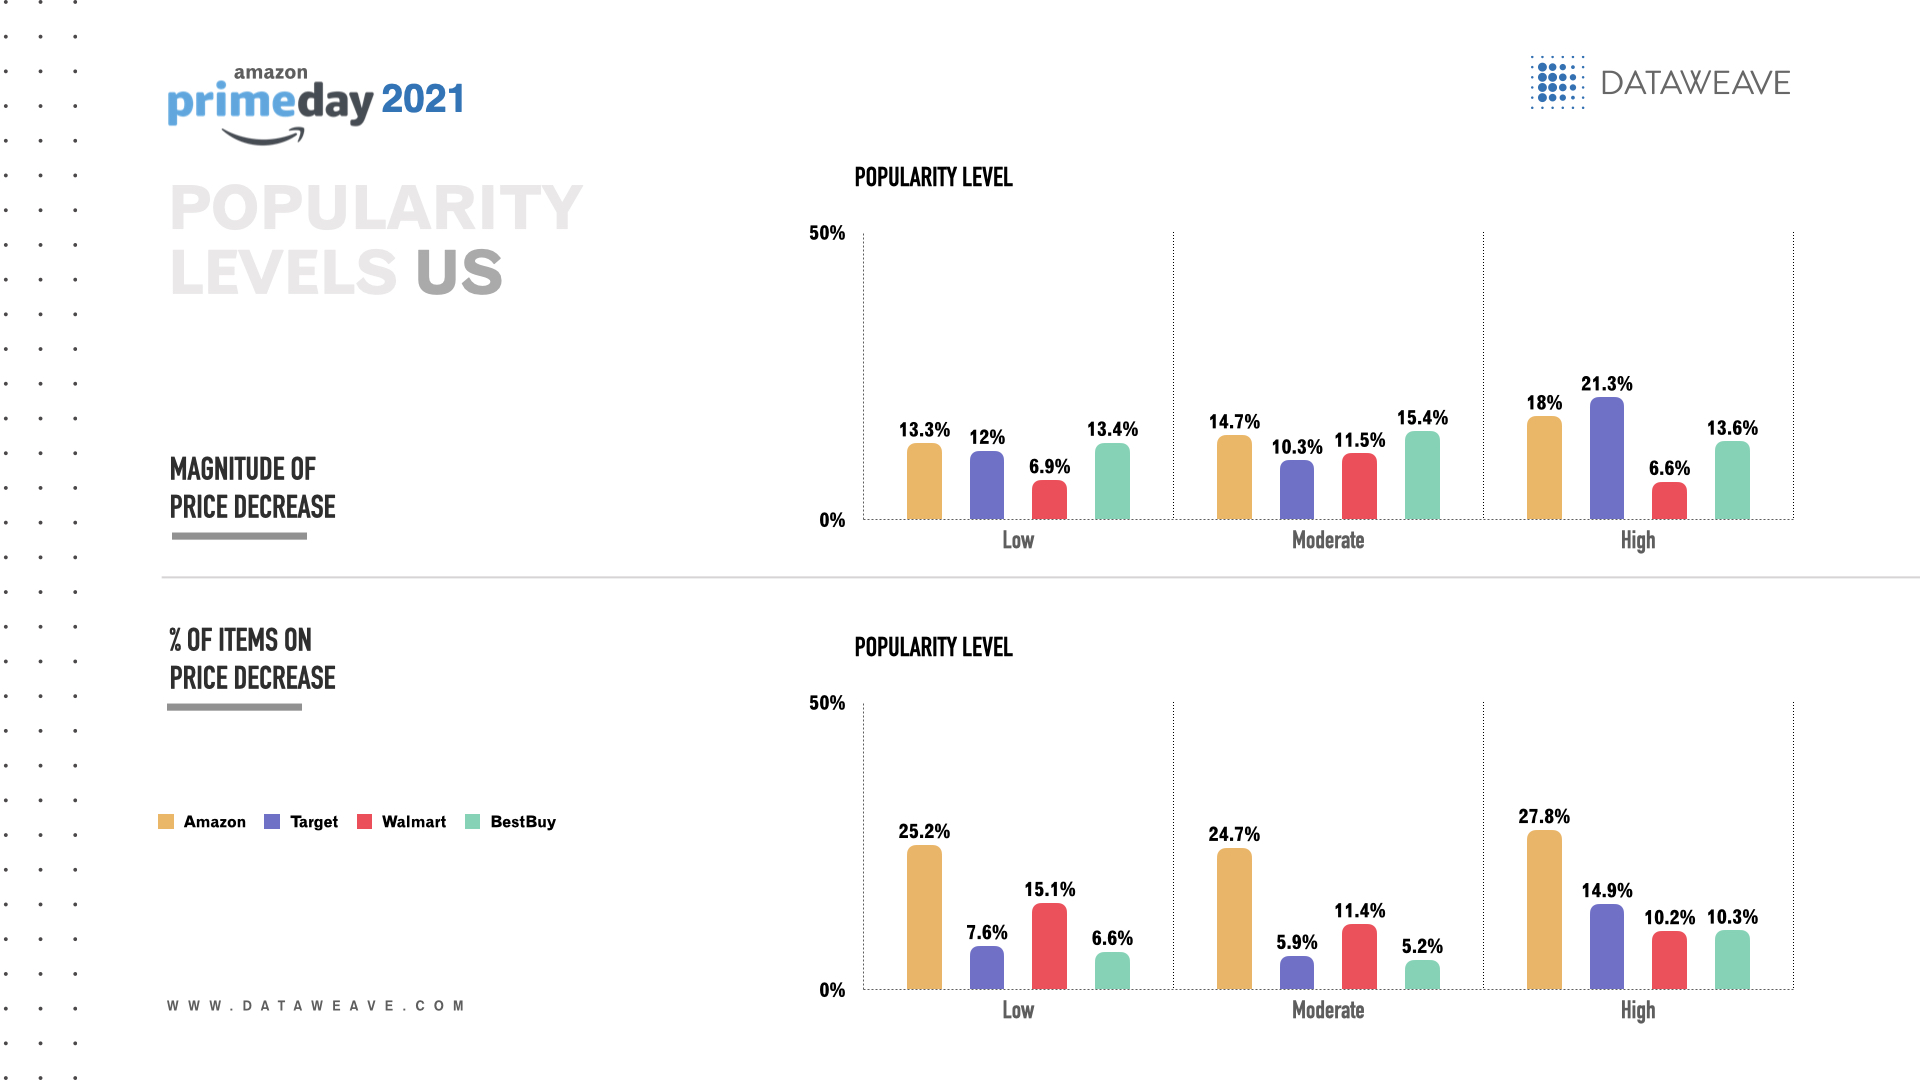
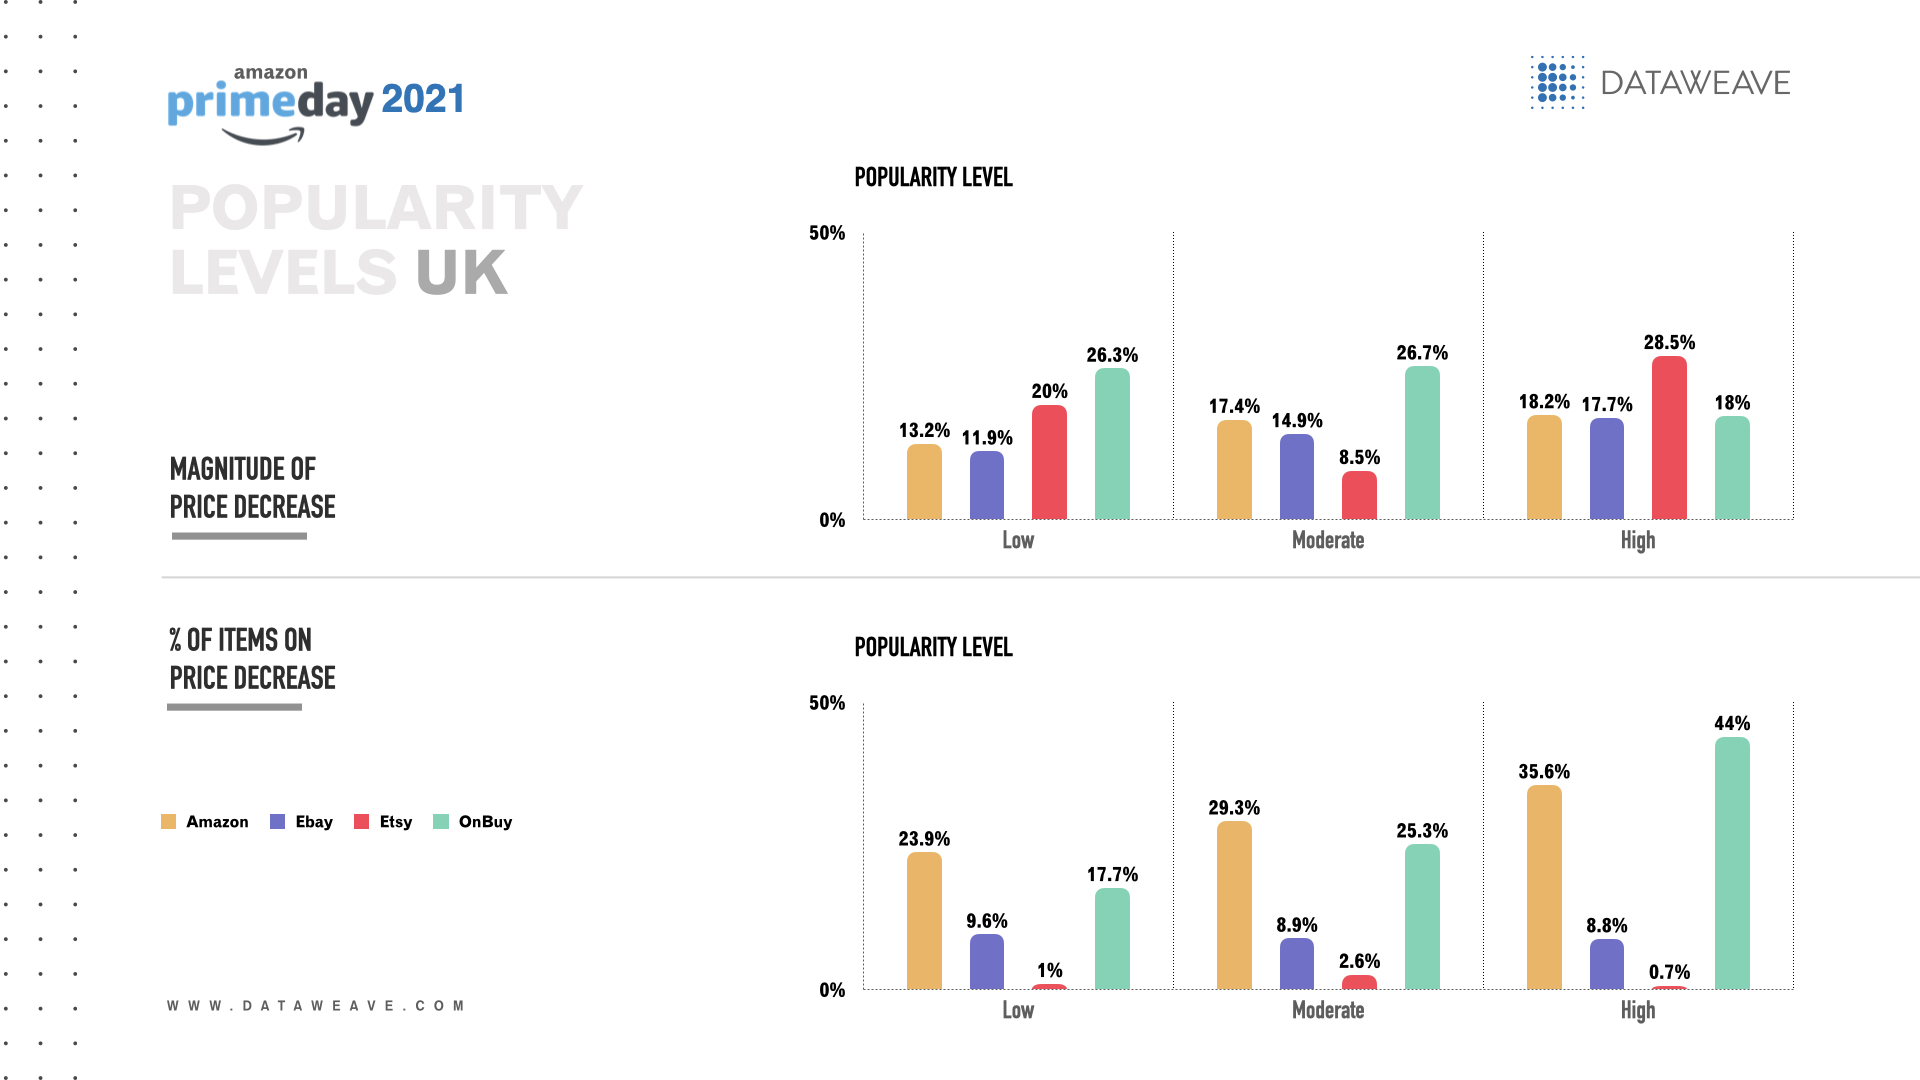

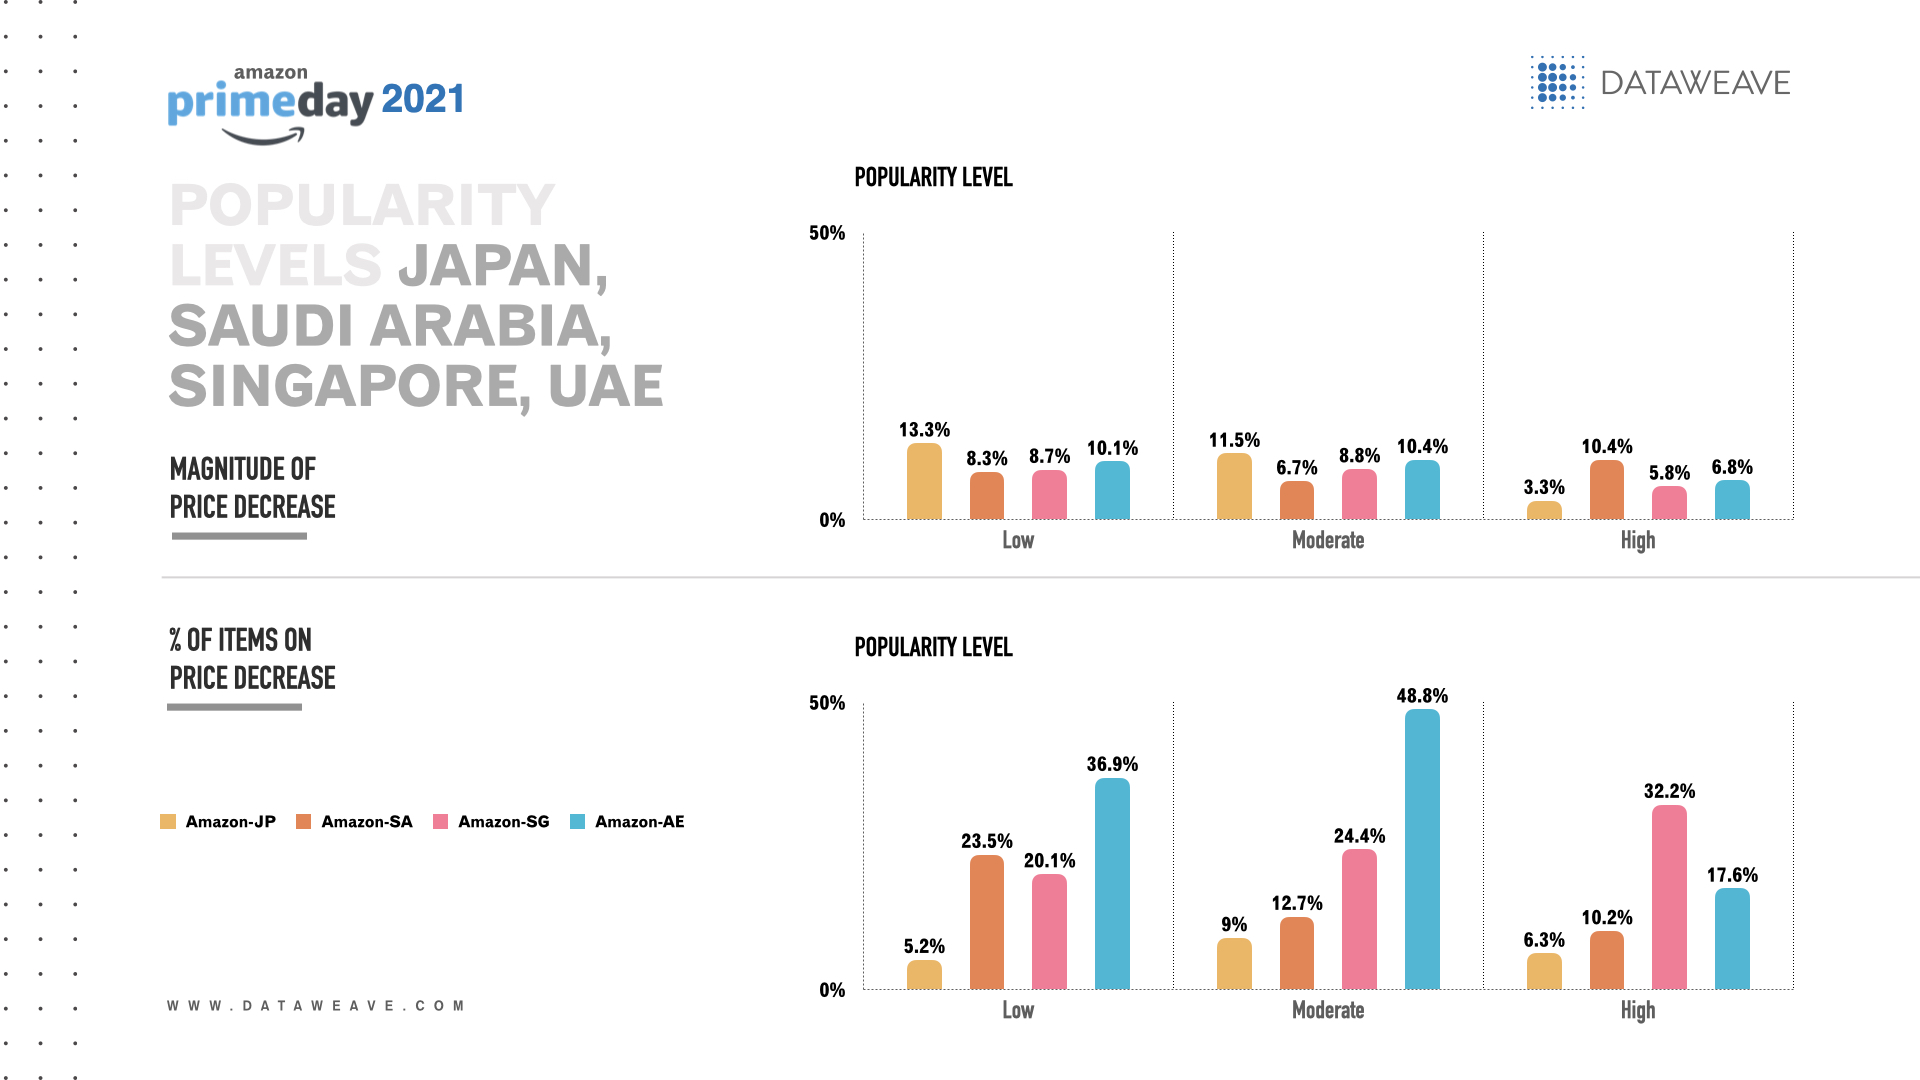


![[INFOGRAPHIC] 2020: The Year the World Navigated Uncertainty Together](https://stage-cdnblog.dataweave.com/wp-content/uploads/2021/01/Year2020_At_DataWeave-e1688039574468.jpg)