Insider Intelligence‘s forecast of a 4.5% growth in US Holiday Sales this year has been validated by the sustained robust spending observed during Black Friday and Cyber Monday. Despite multiple challenges impacting consumer spending, such as escalating prices of everyday products and elevated interest rates, shoppers continued to spend significantly, aligning with these earlier predictions.
However, in response to these projections, retailers strategically adjusted their approach. Our analysis indicates substantial discounts prevalent in the Consumer Electronics and Home & Furniture segments during Cyber Week. Prominent retailers specializing in Home & Furniture, such as Wayfair, Overstock, and Home Depot, notably led the charge in offering attractive discounts.
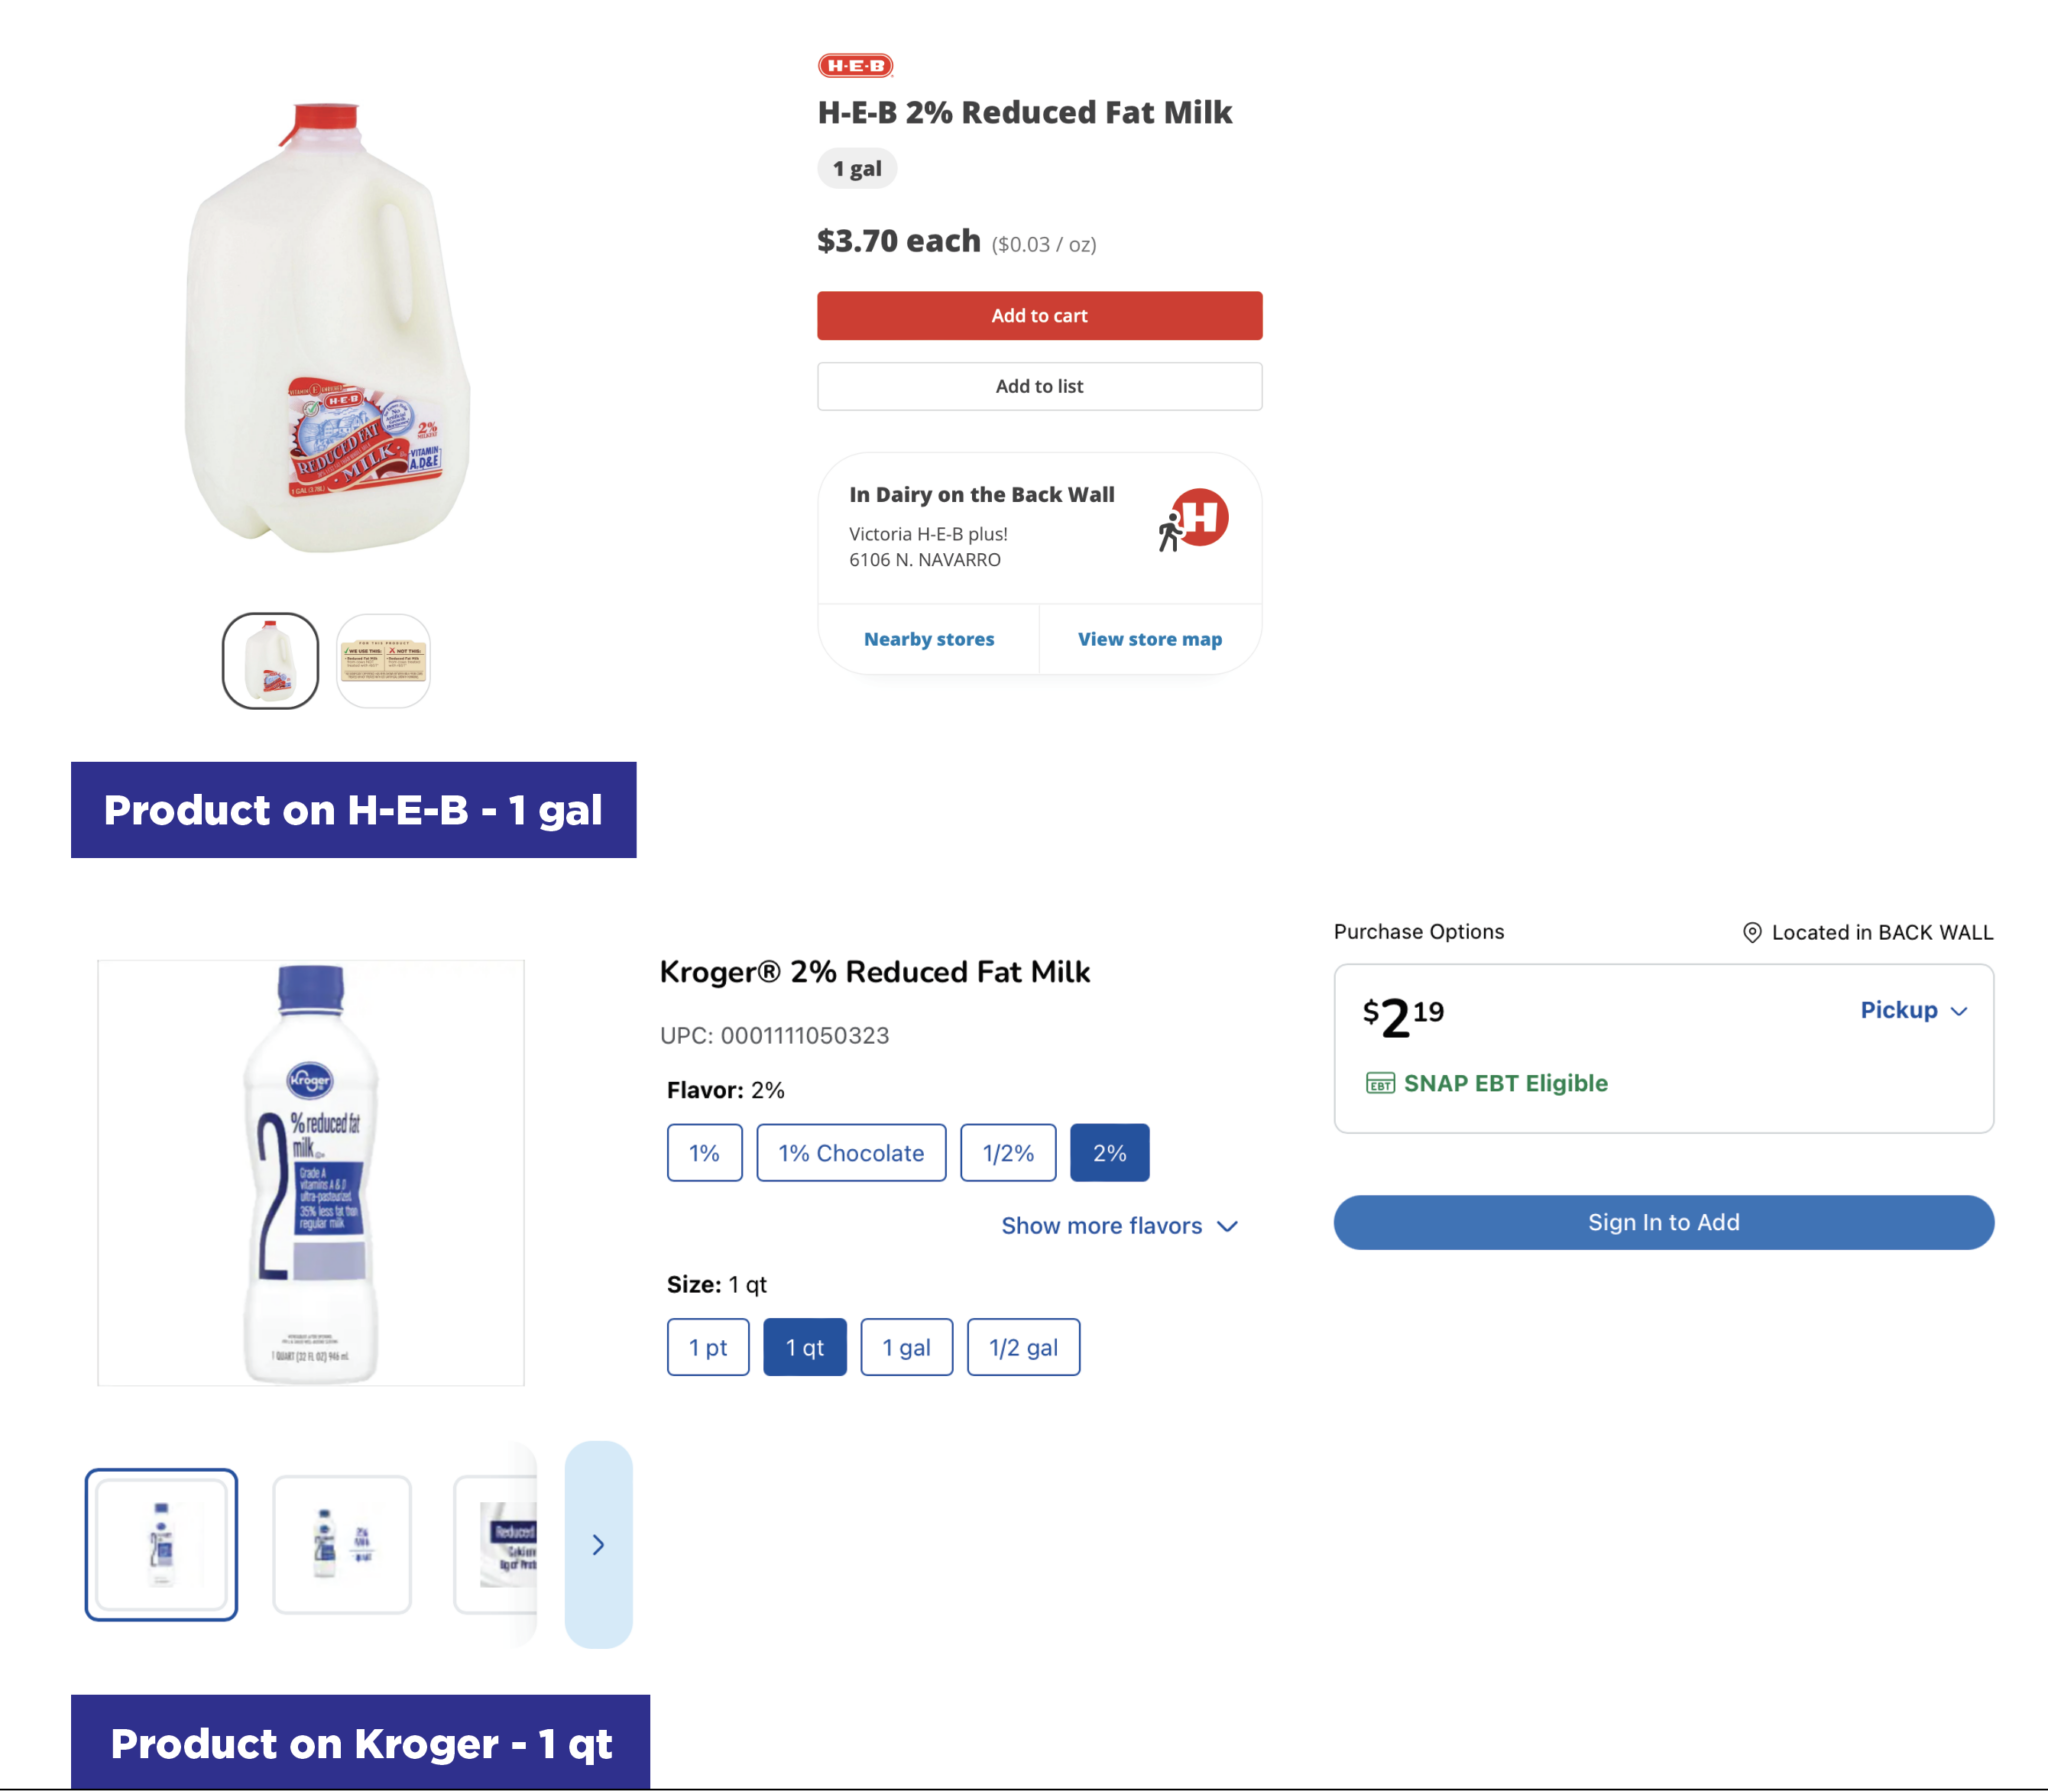
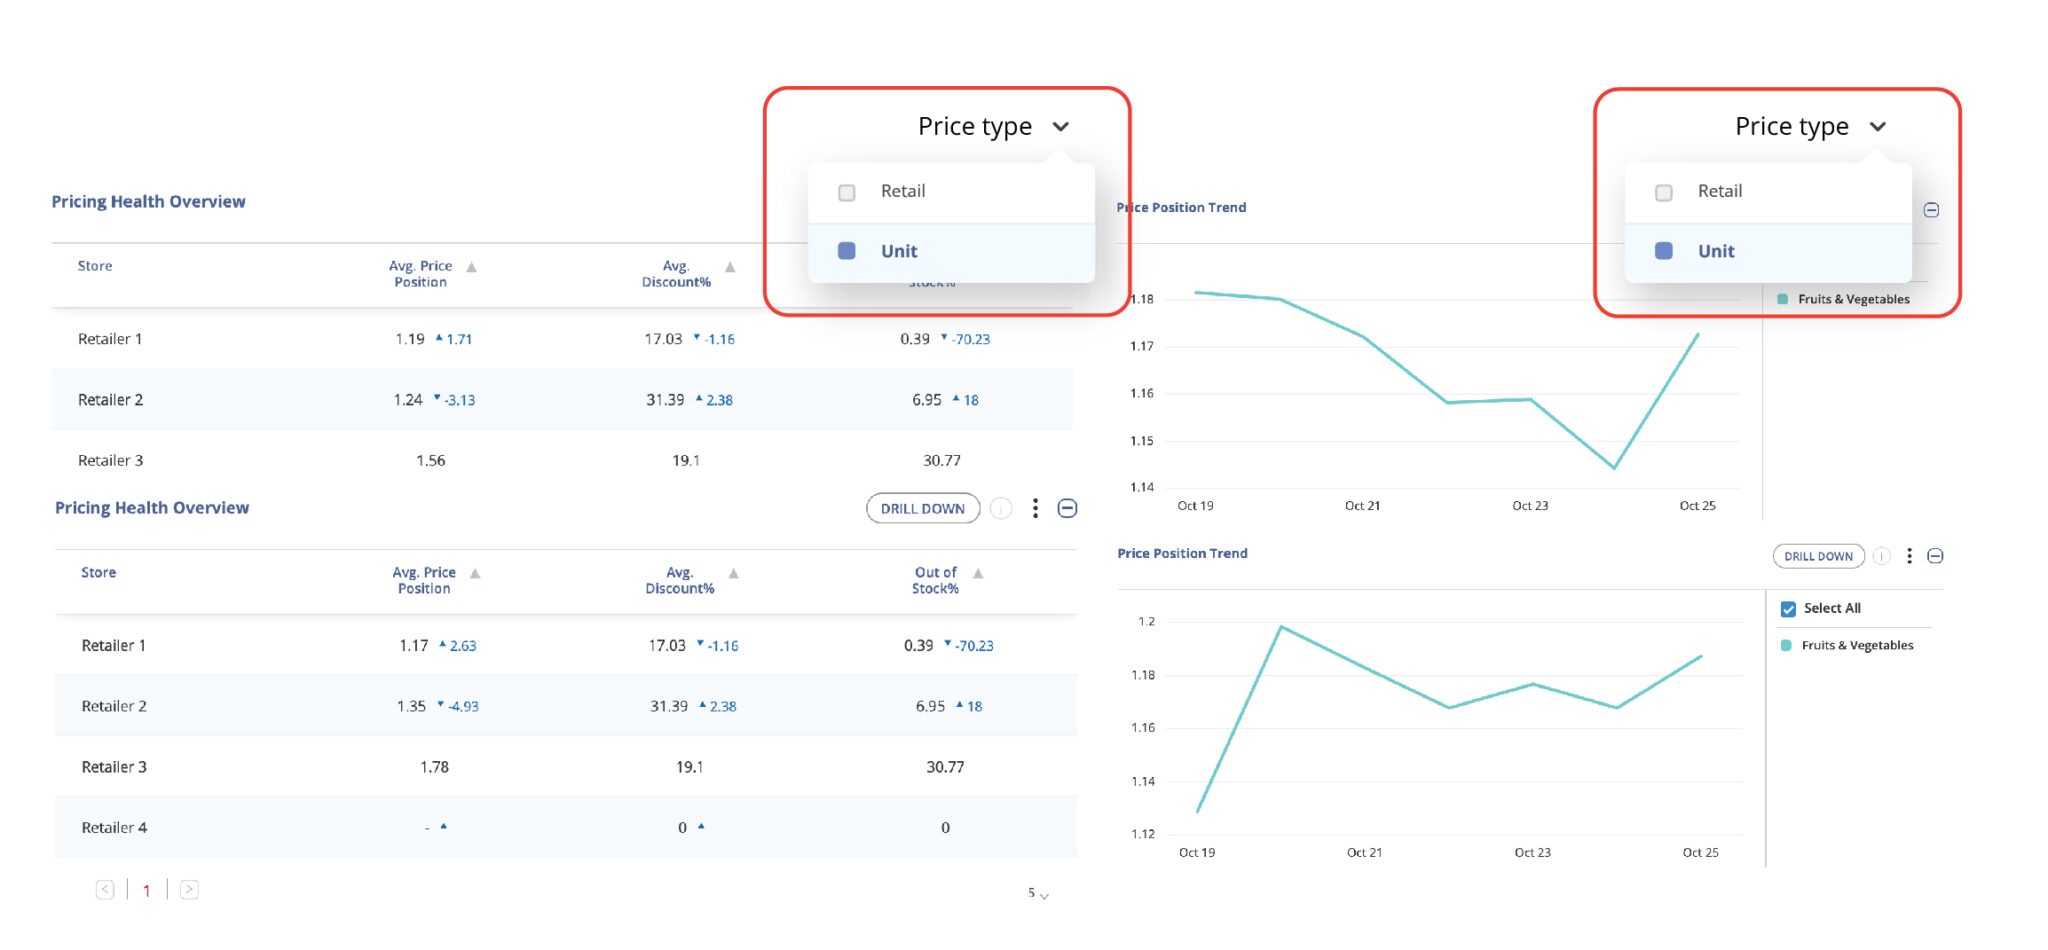
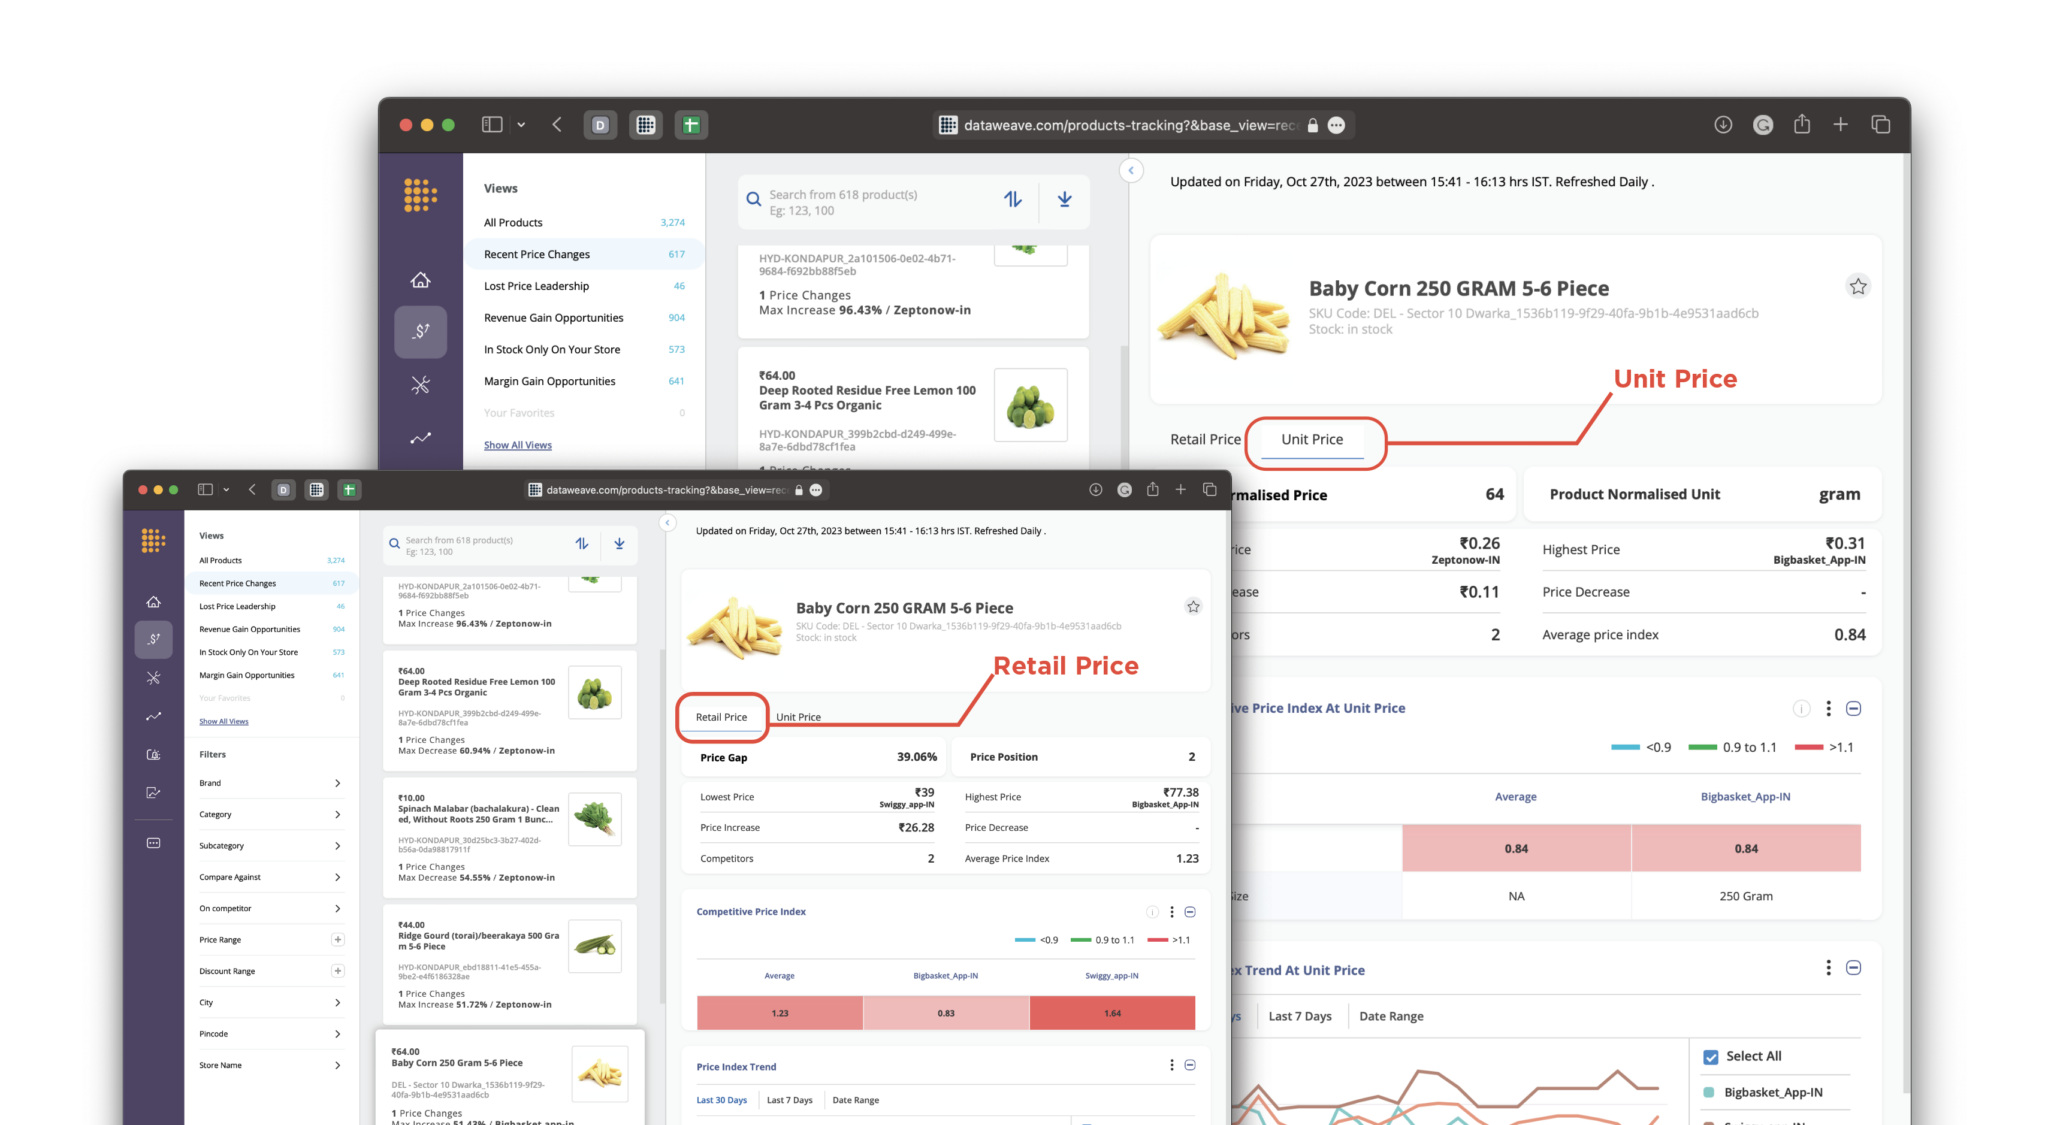
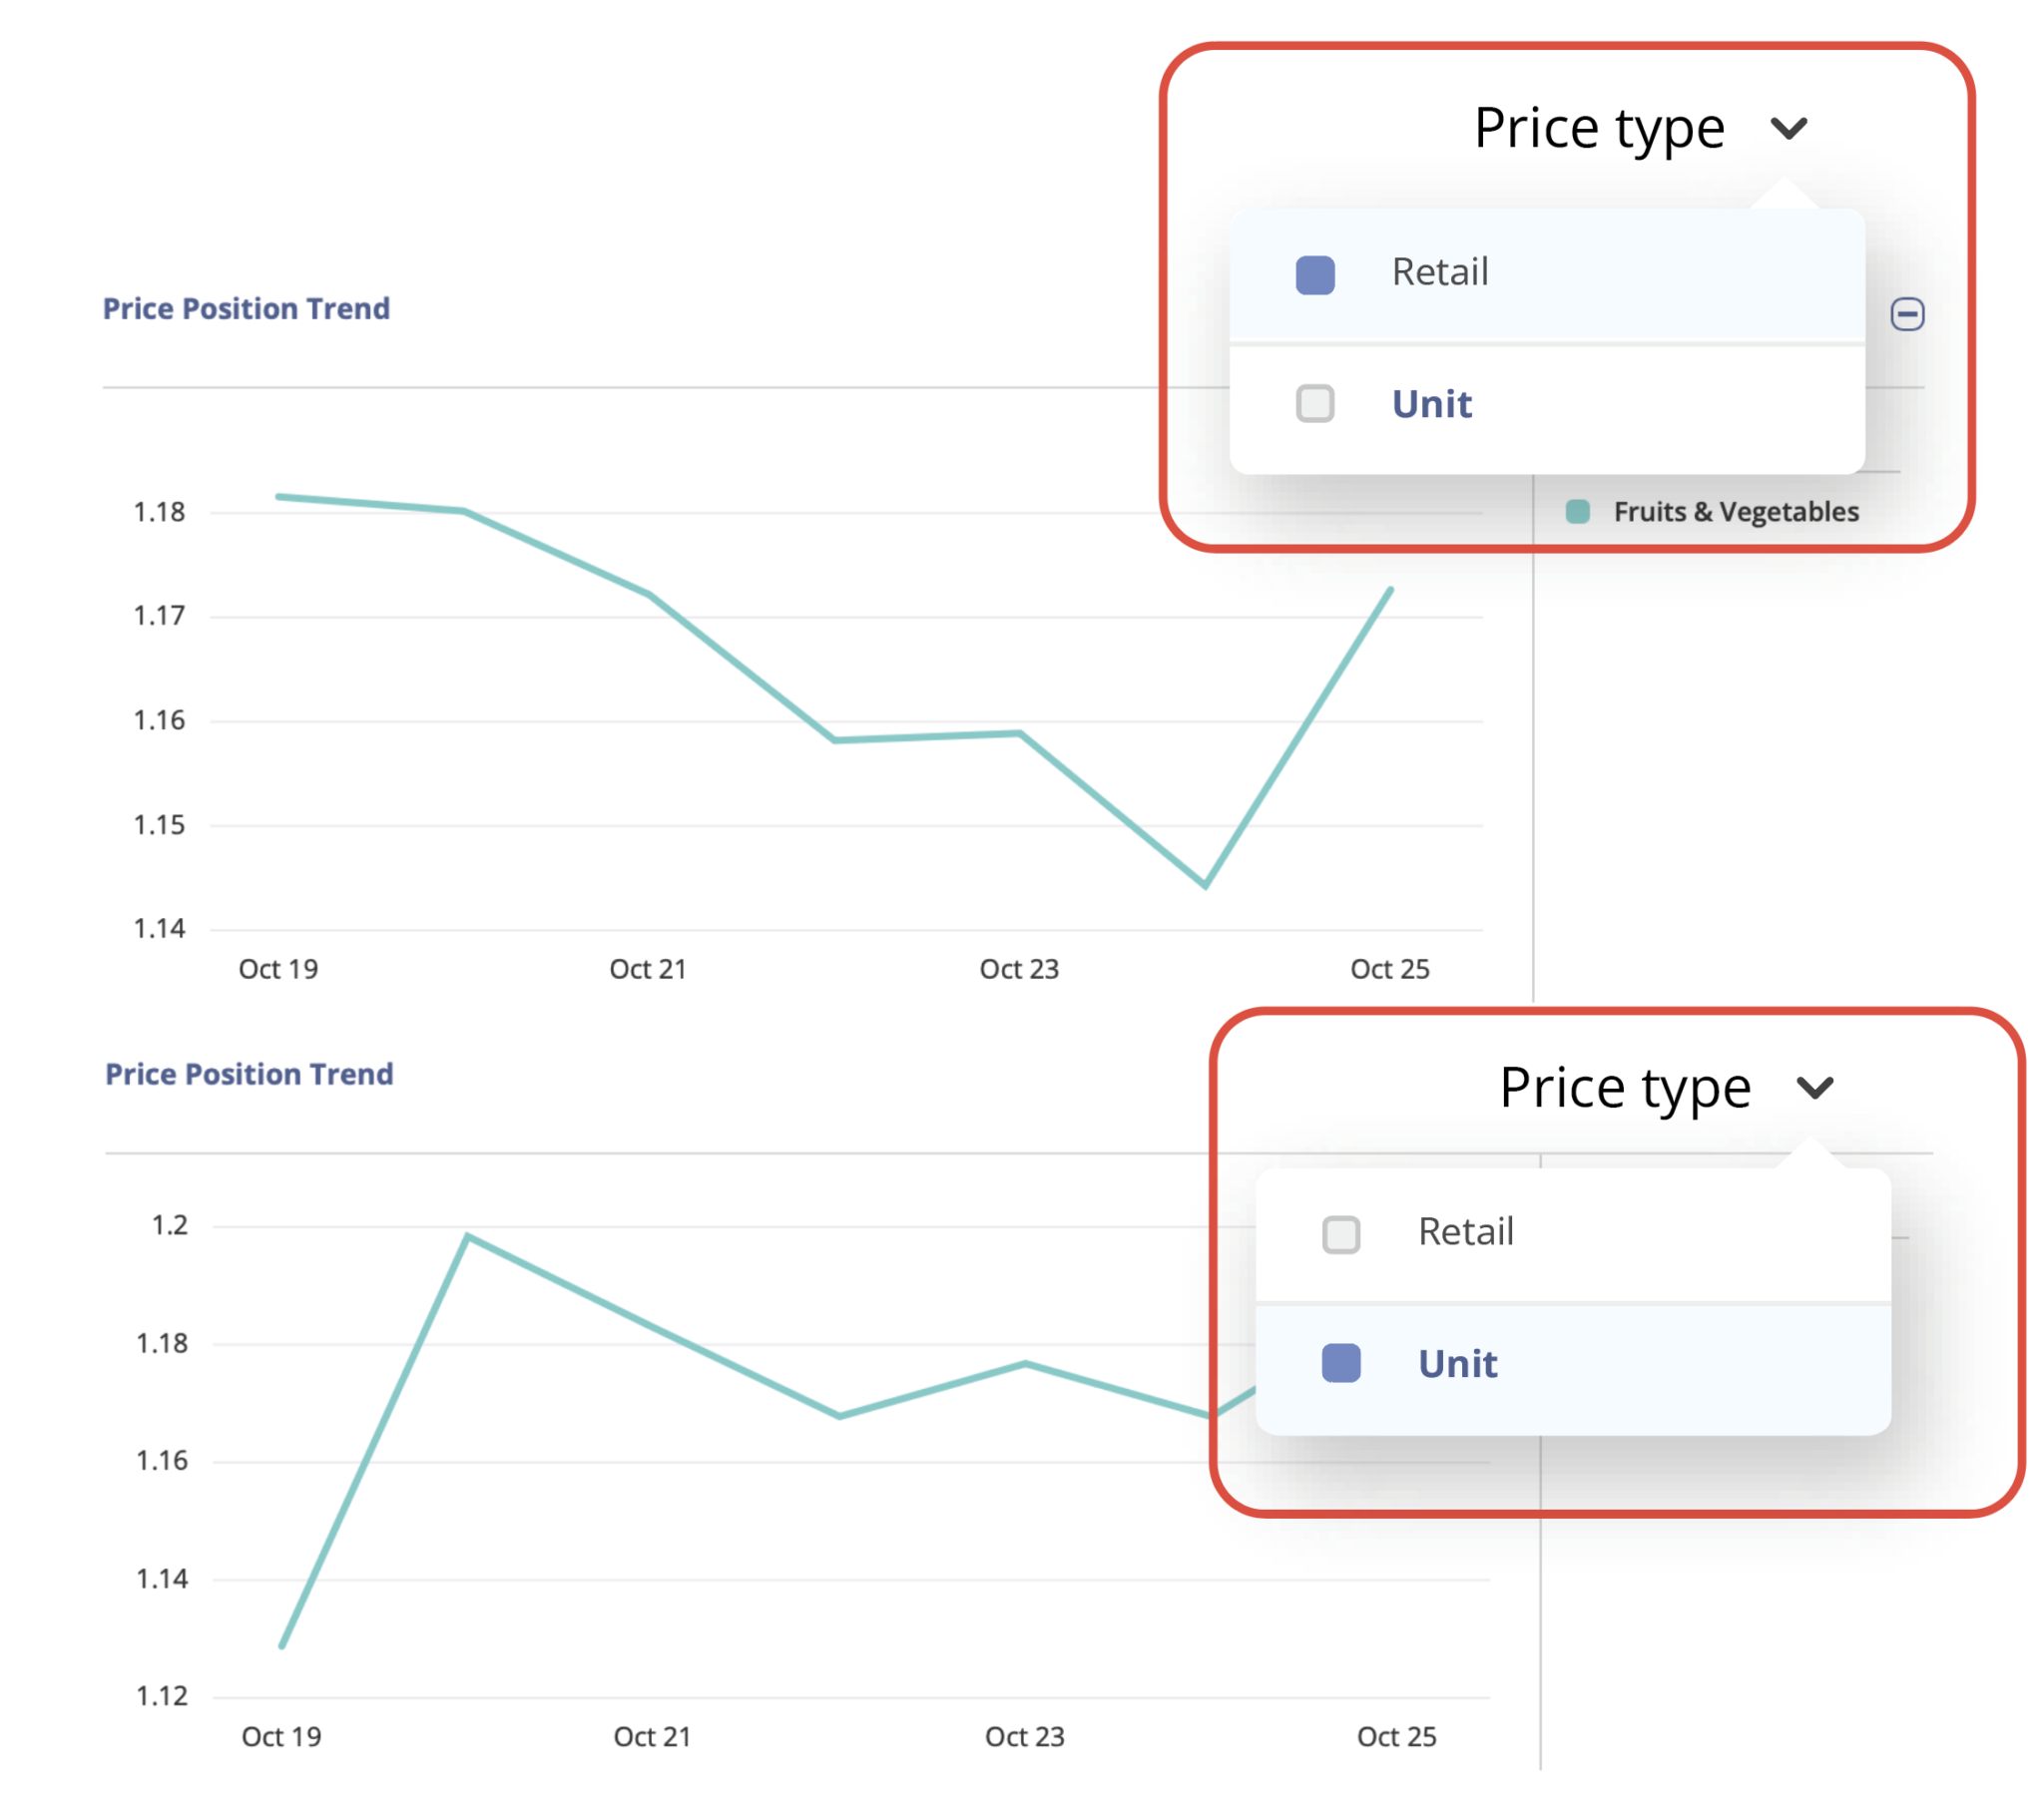
At DataWeave, we harnessed the power of our proprietary data aggregation and analysis platform to track and analyze the prices and deals of home & furniture products across prominent retailers to uncover unique insights into their price competitiveness this BFCM, as well as understand how pricing strategies varied across diverse subcategories and brands.
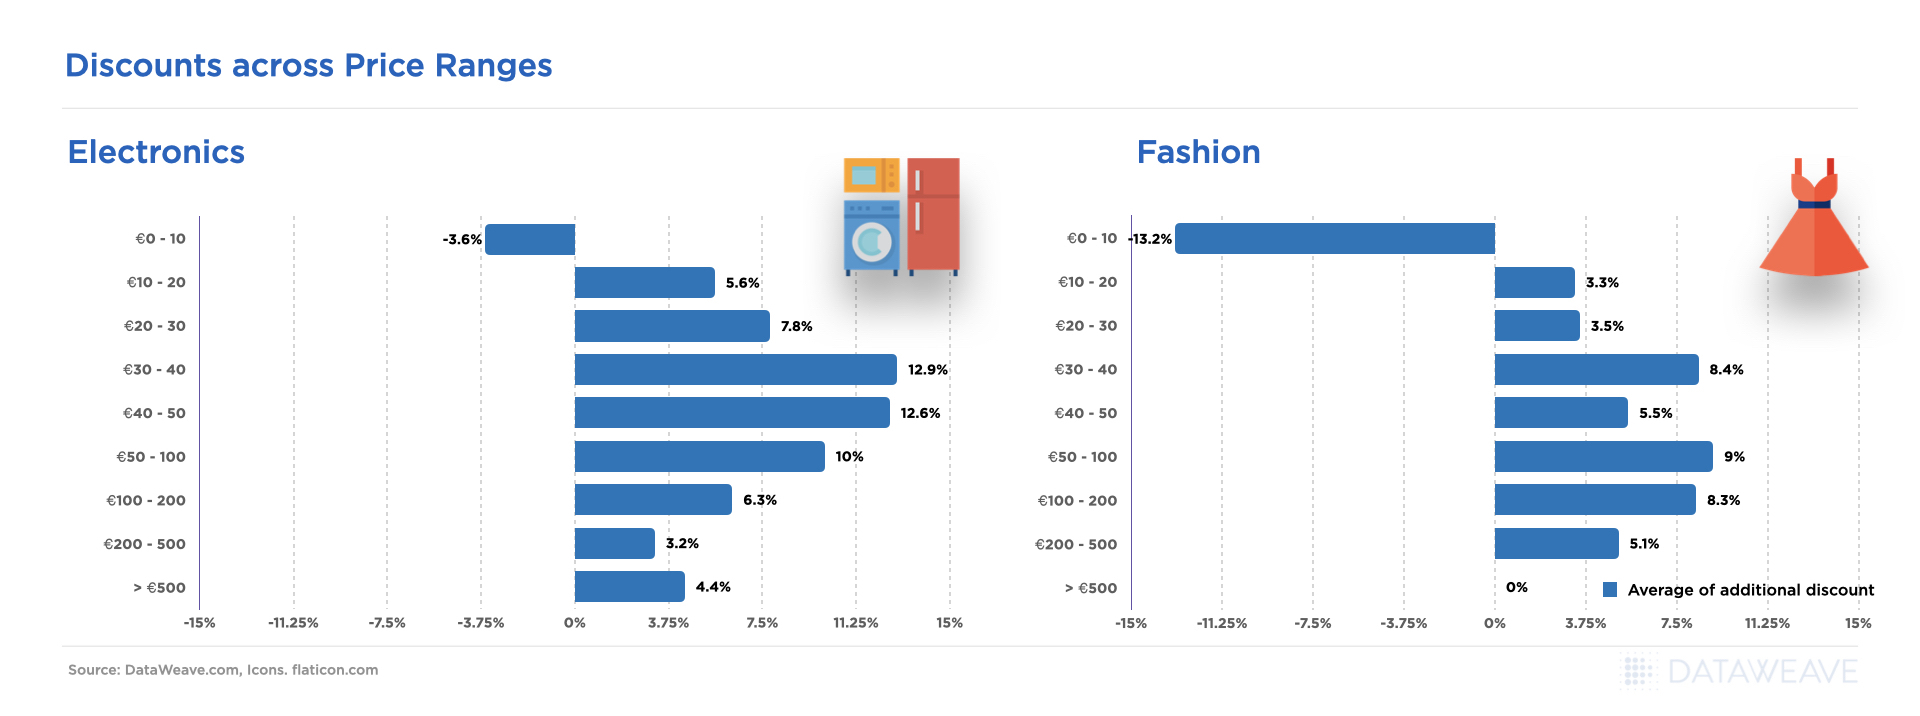
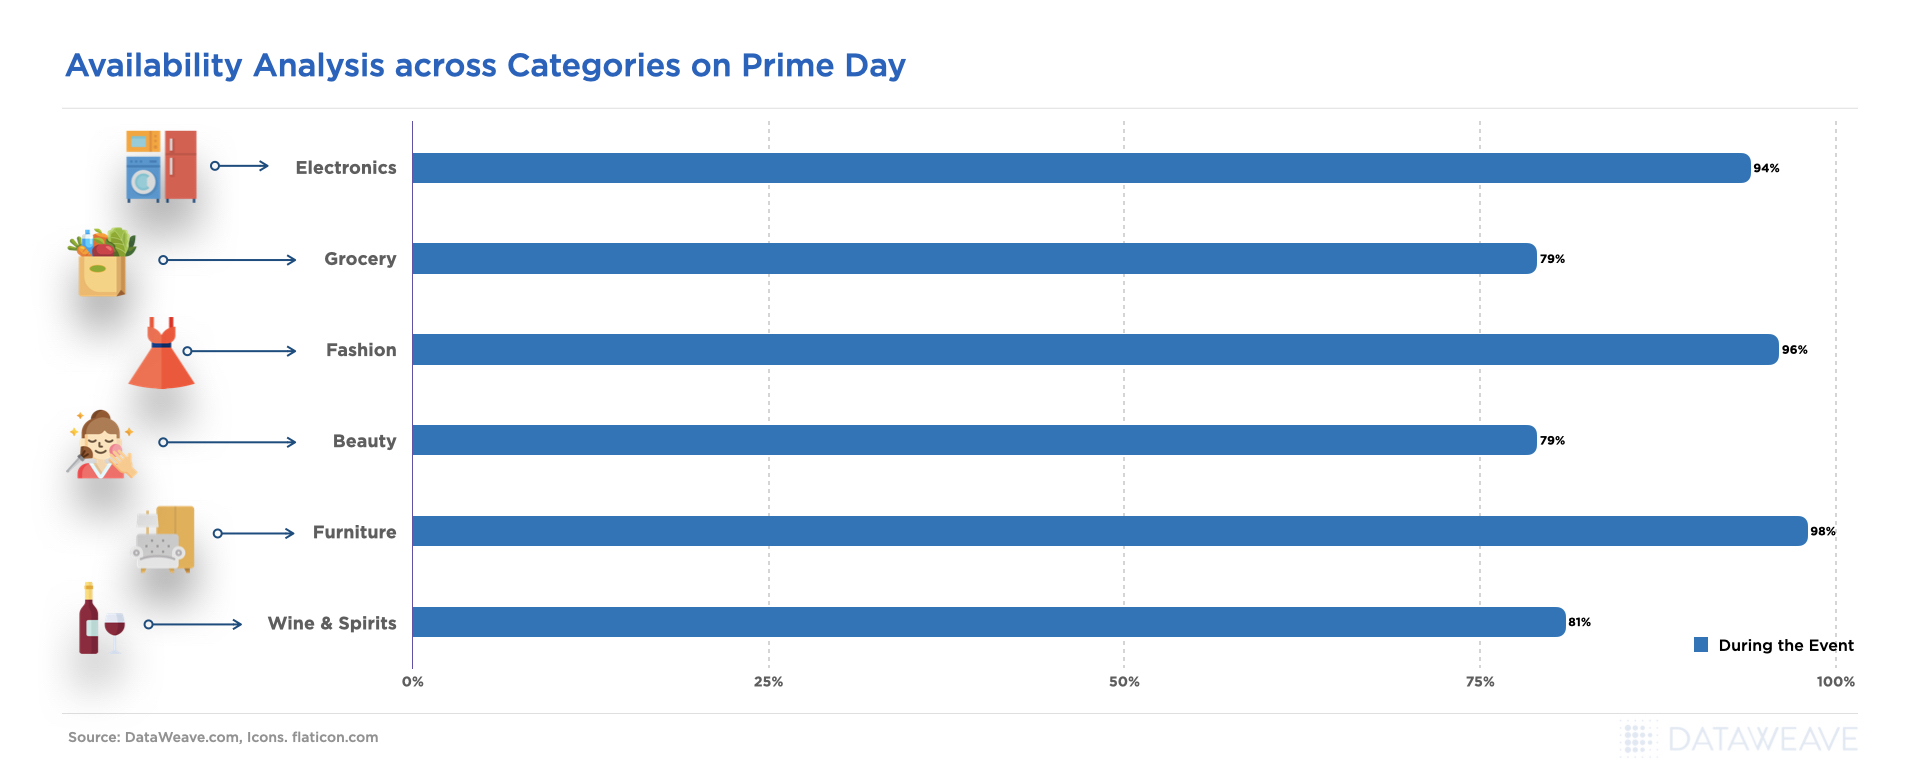
We’ve also recently published our analysis of the Consumer Electronics and Apparel categories this Black Friday and Cyber Monday.
Our Methodology
For this analysis, we tracked the discounts offered by leading US retailers in the Home & Furniture category during the Thanksgiving weekend sale, including Black Friday and Cyber Monday. We noticed prices and discounts didn’t change significantly over the course of the weekend, and hence the average prices of products between the 24th and 27th of November are being reported. Our sample was chosen to encompass the top 500 ranked products in each product subcategory across leading retailers during the sale.
- Sample size: 44,716 SKUs
- Retailers tracked: Amazon, Walmart, Target, Best Buy, Overstock, Wayfair, Home Depot
- Subcategories reported on: Dishwasher, Washer/Dryer, Mattresses, Beds, Dining Tables, Entertainment Units, Rugs, Luggage, Bookcases, Cabinets, Sofas, Coffee Tables
- Timeline of analysis: 24 to 27 November 2023
Our Key Findings
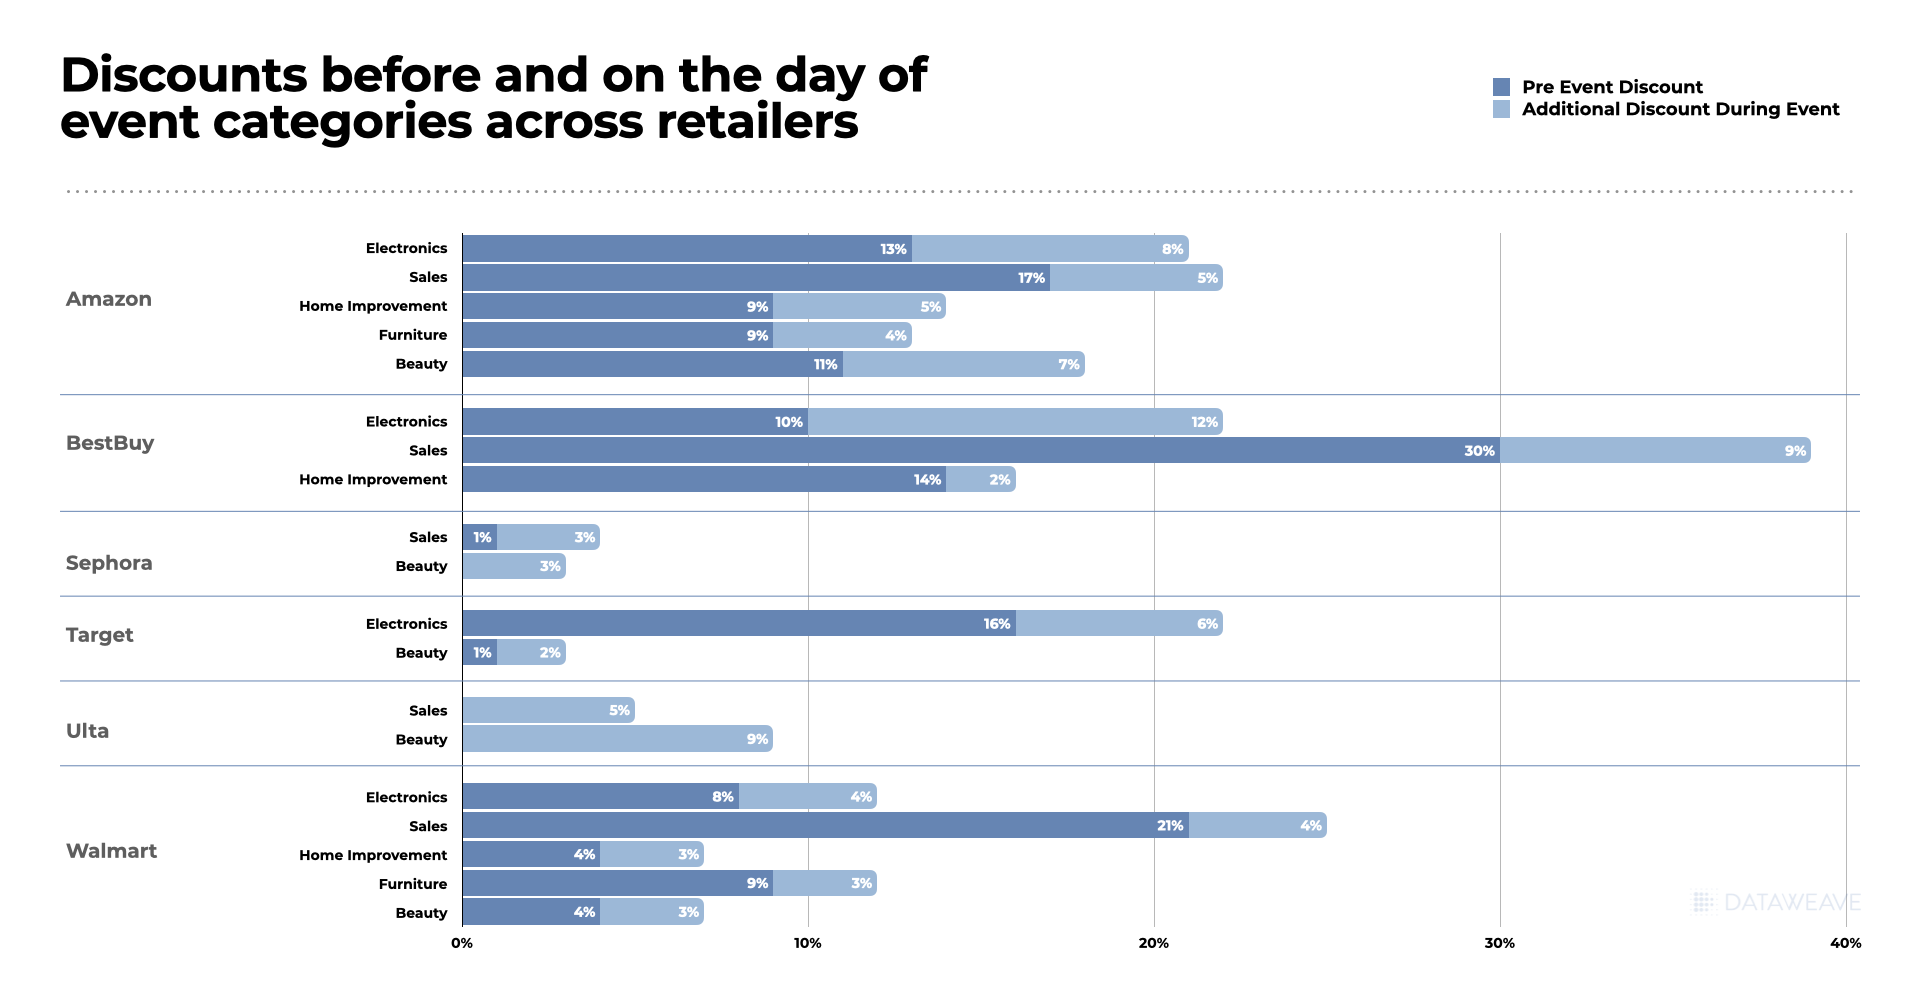
Discounts Across Retailers
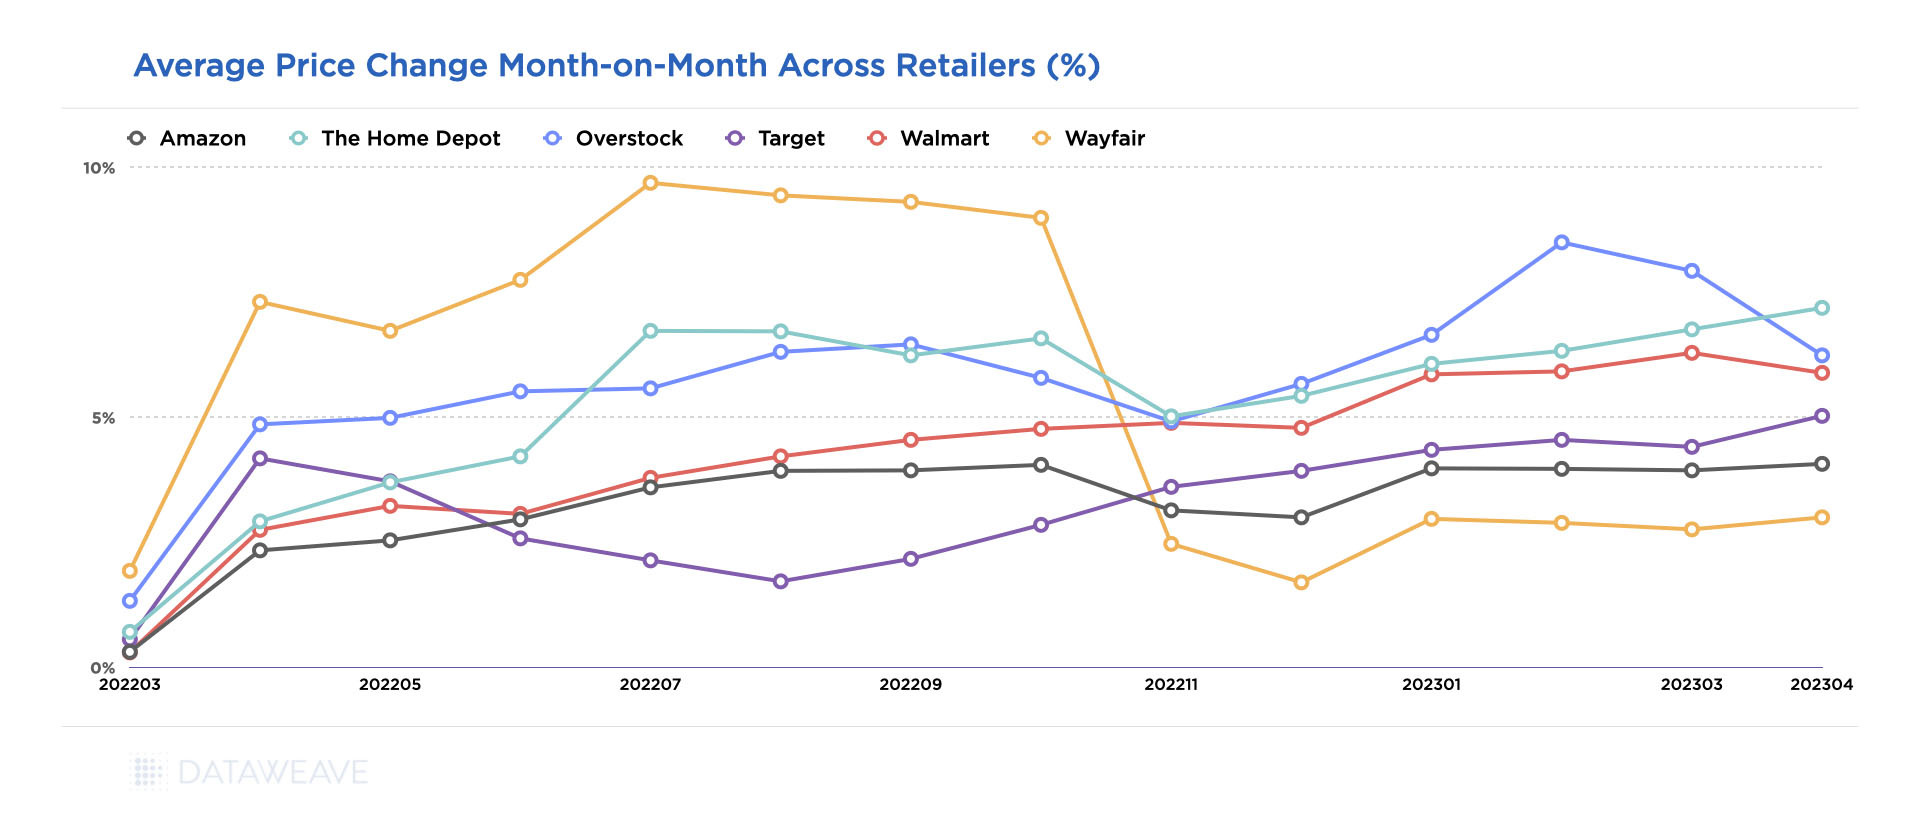
Wayfair led the pack with the highest average discount of 27.5%, covering an impressive 88% of its Home & Furniture inventory. This bold strategy positions Wayfair as a go-to destination for consumers seeking substantial savings on high-quality Home & Furniture items during Black Friday and Cyber Monday.
Home Depot offered an average discount of 17.5%, covering a substantial 69% of the products analyzed, choosing to cash in on the Cyber Week madness. Overstock followed next with an average discount of 16.6%.
Interestingly, Home & Furniture happens to be one of the few categories in which Amazon did not offer the highest discount among the analyzed retailers, choosing a moderate average discount of 13.8%.

Best Buy also maintained a competitive stance in the category, providing an average discount of 12.8% across 58% of their assortment. Target adopted a conservative markdown strategy, offering a relatively low average discount of 6.5%.
In summary, the Home & Furniture category exhibited a diverse range of discounting strategies among retailers, reflecting a balance between competitiveness and profit margins. Consumers could have chosen from a spectrum of discounts based on their preferences and budget considerations during Black Friday and Cyber Monday.
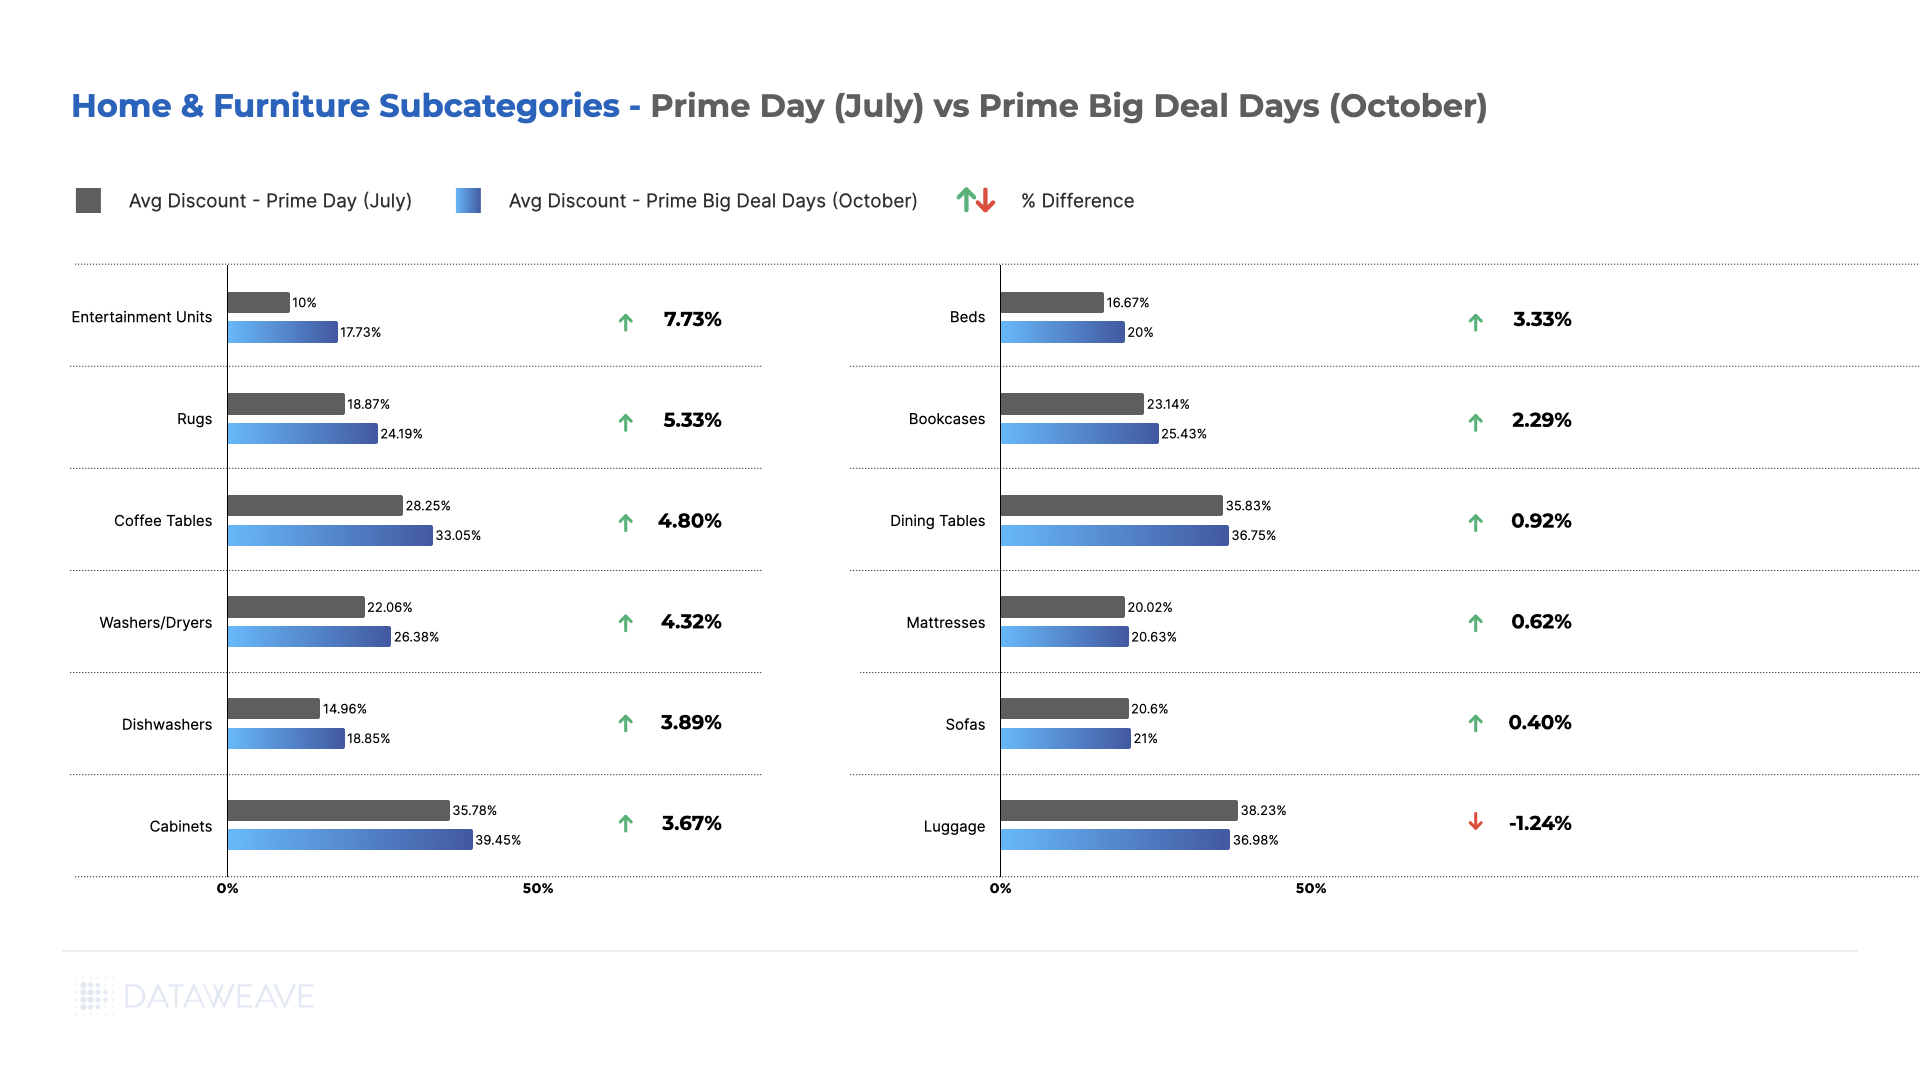
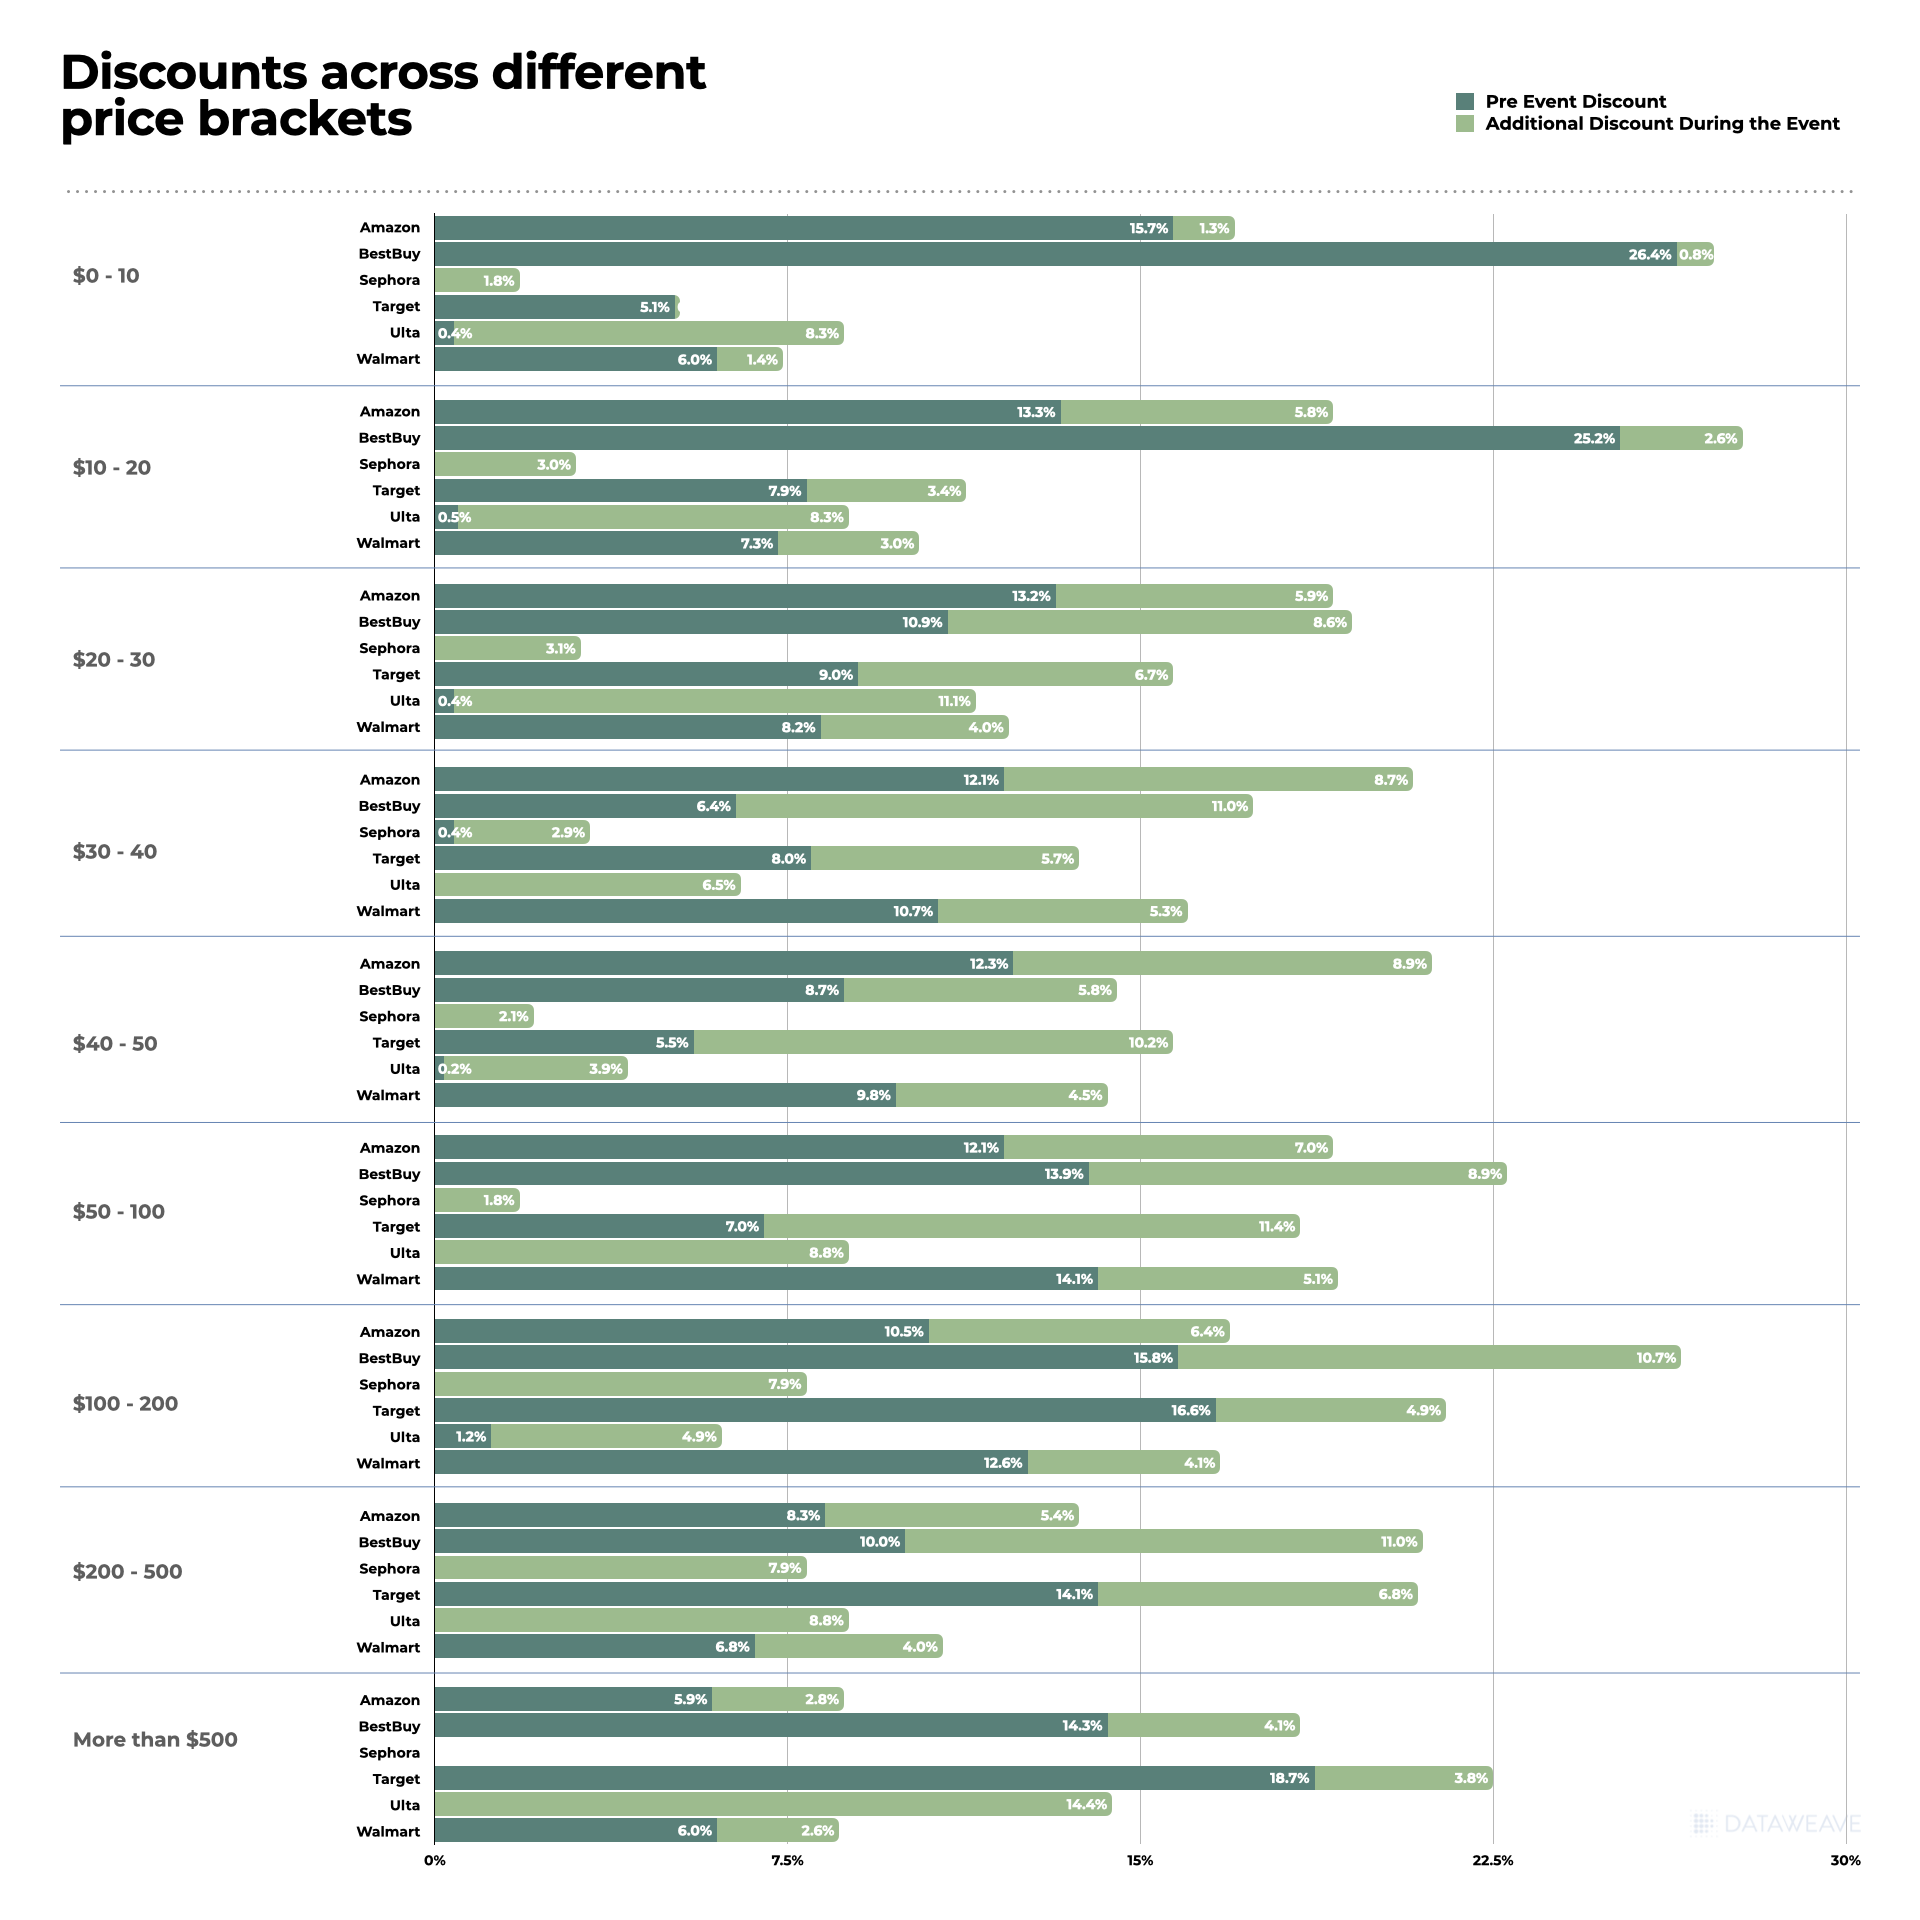
Average Discounts: Subcategories
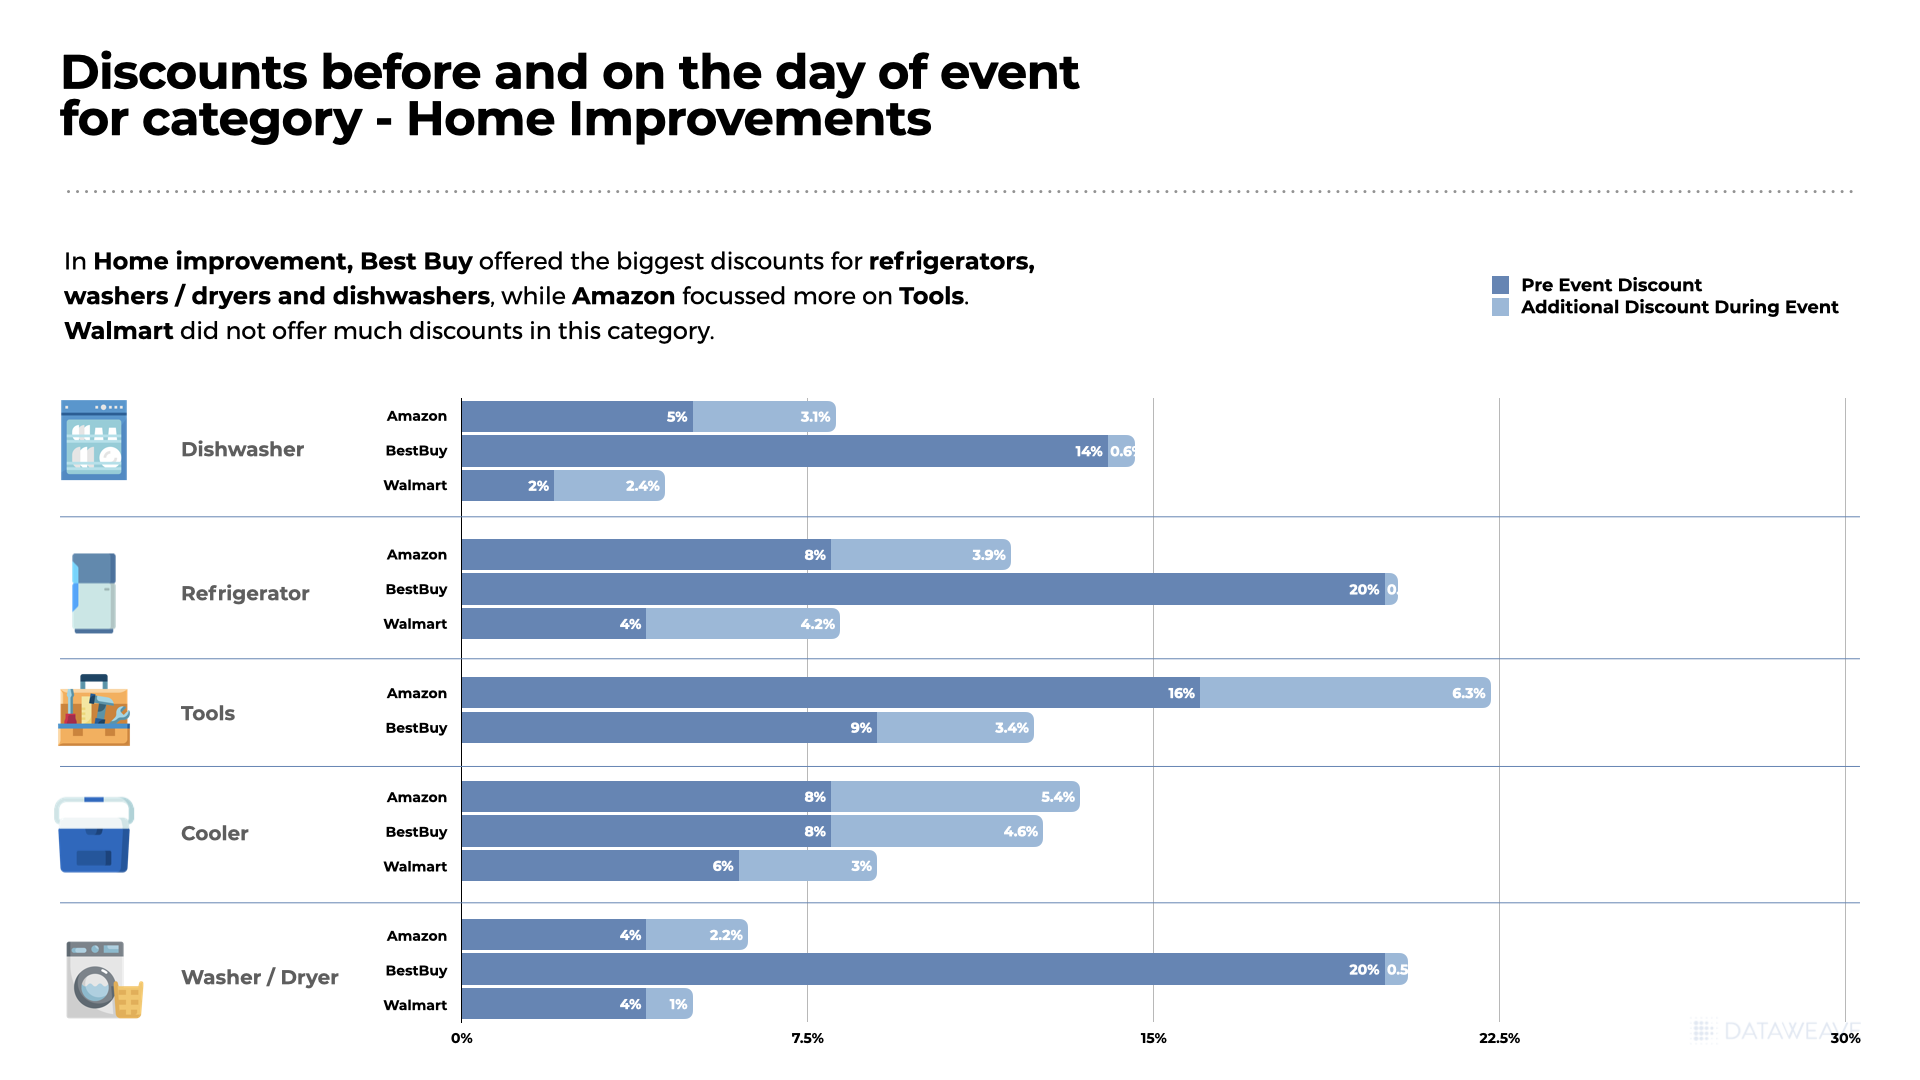
Among subcategories, Amazon offered a moderate 8.3% average discount on 32.9% of its products in this Dishwasher category, while Best Buy took a more aggressive stance with a 14.7% average discount covering 55.9% of its products.
Home Depot emerged as a standout player in the Washer/Dryer category, providing a substantial 21.3% discount on 78.4% of its analyzed inventory. Best Buy closely followed with a 15.1% average discount targeting 67.6% of its products.

Wayfair grabbed attention with a generous 36.9% average discount on Mattresses, covering almost all (99%) of its analyzed products. In addition, Wafair led the discount war in Beds, Dining Tables, Cabinets, Sofas, Coffee Tables, and Entertainment Units. Overstock took an aggressive pricing stance on Rugs, offering a substantial 52.3% average discount, covering 100% of its Rugs inventory.
Average Discounts: Brands
Among brands, Signature Design by Ashley maintained a consistent presence with substantial discounts on both Best Buy (25.24%) and Overstock (16.19%). This could be indicative of the brand’s commitment to appealing to a diverse customer base through varied retail channels. Costway emerges as a standout brand offering exceptionally high discounts at both Target (61.6%) and Walmart (51.7%).
Home Decorators Collection, Home Depot’s in-house brand, offered a significant 30.9% discount at Home Depot. High-margin private label brands like these afford retailers the opportunity to offer markdowns while retaining significant margins.

Strategic positioning on specific platforms, as seen with Alwyn Home on Wayfair and Noble House at Home Depot, suggests brands tailor their approach to the strengths and customer demographics of each retailer. The data suggests a nuanced interplay between brand positioning, discount strategies, and the perceived value offered.
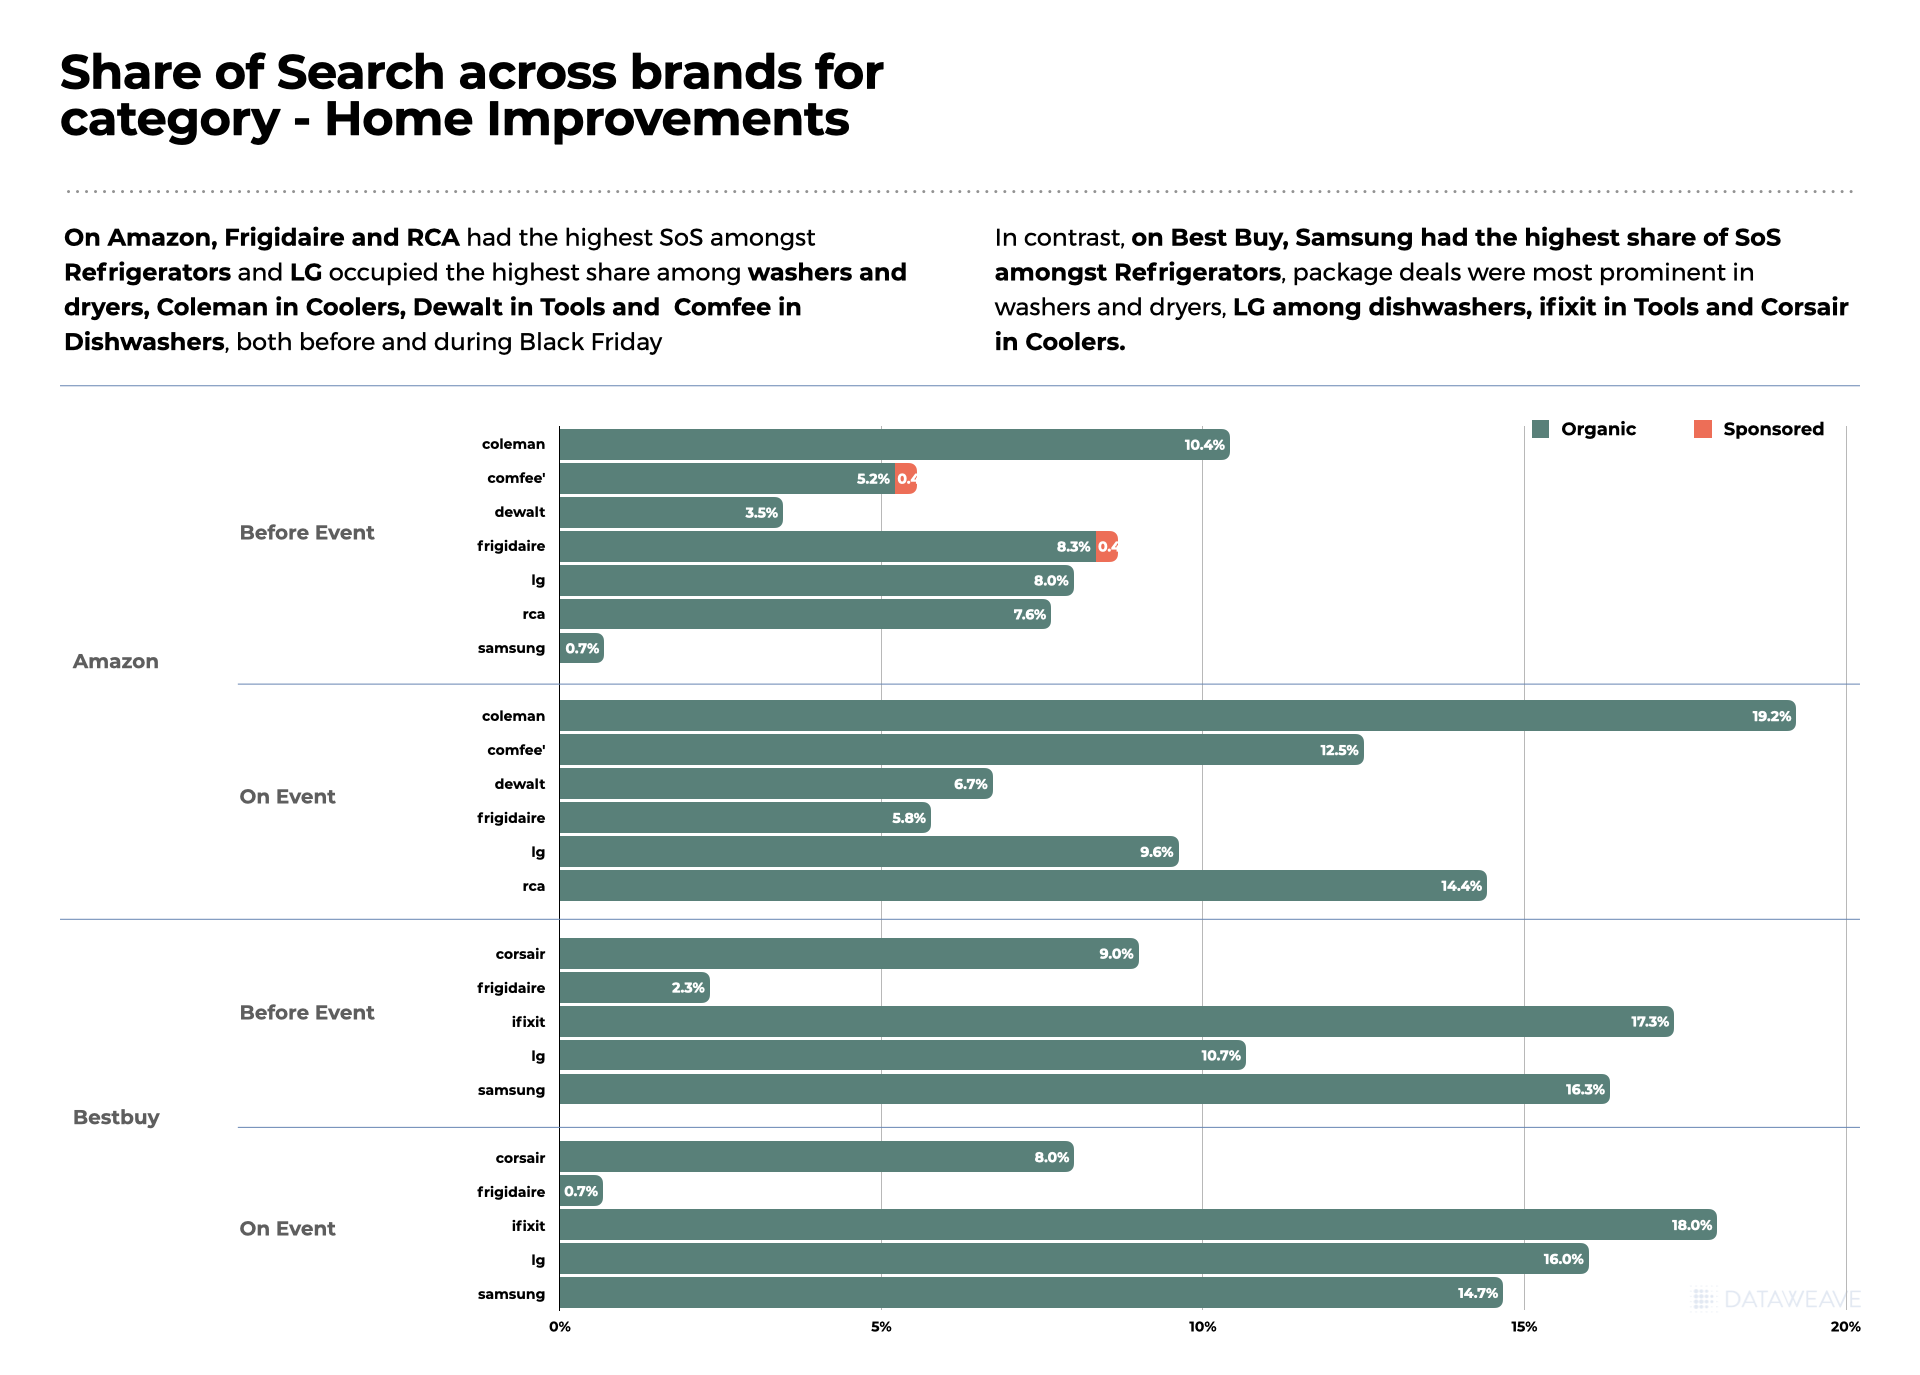
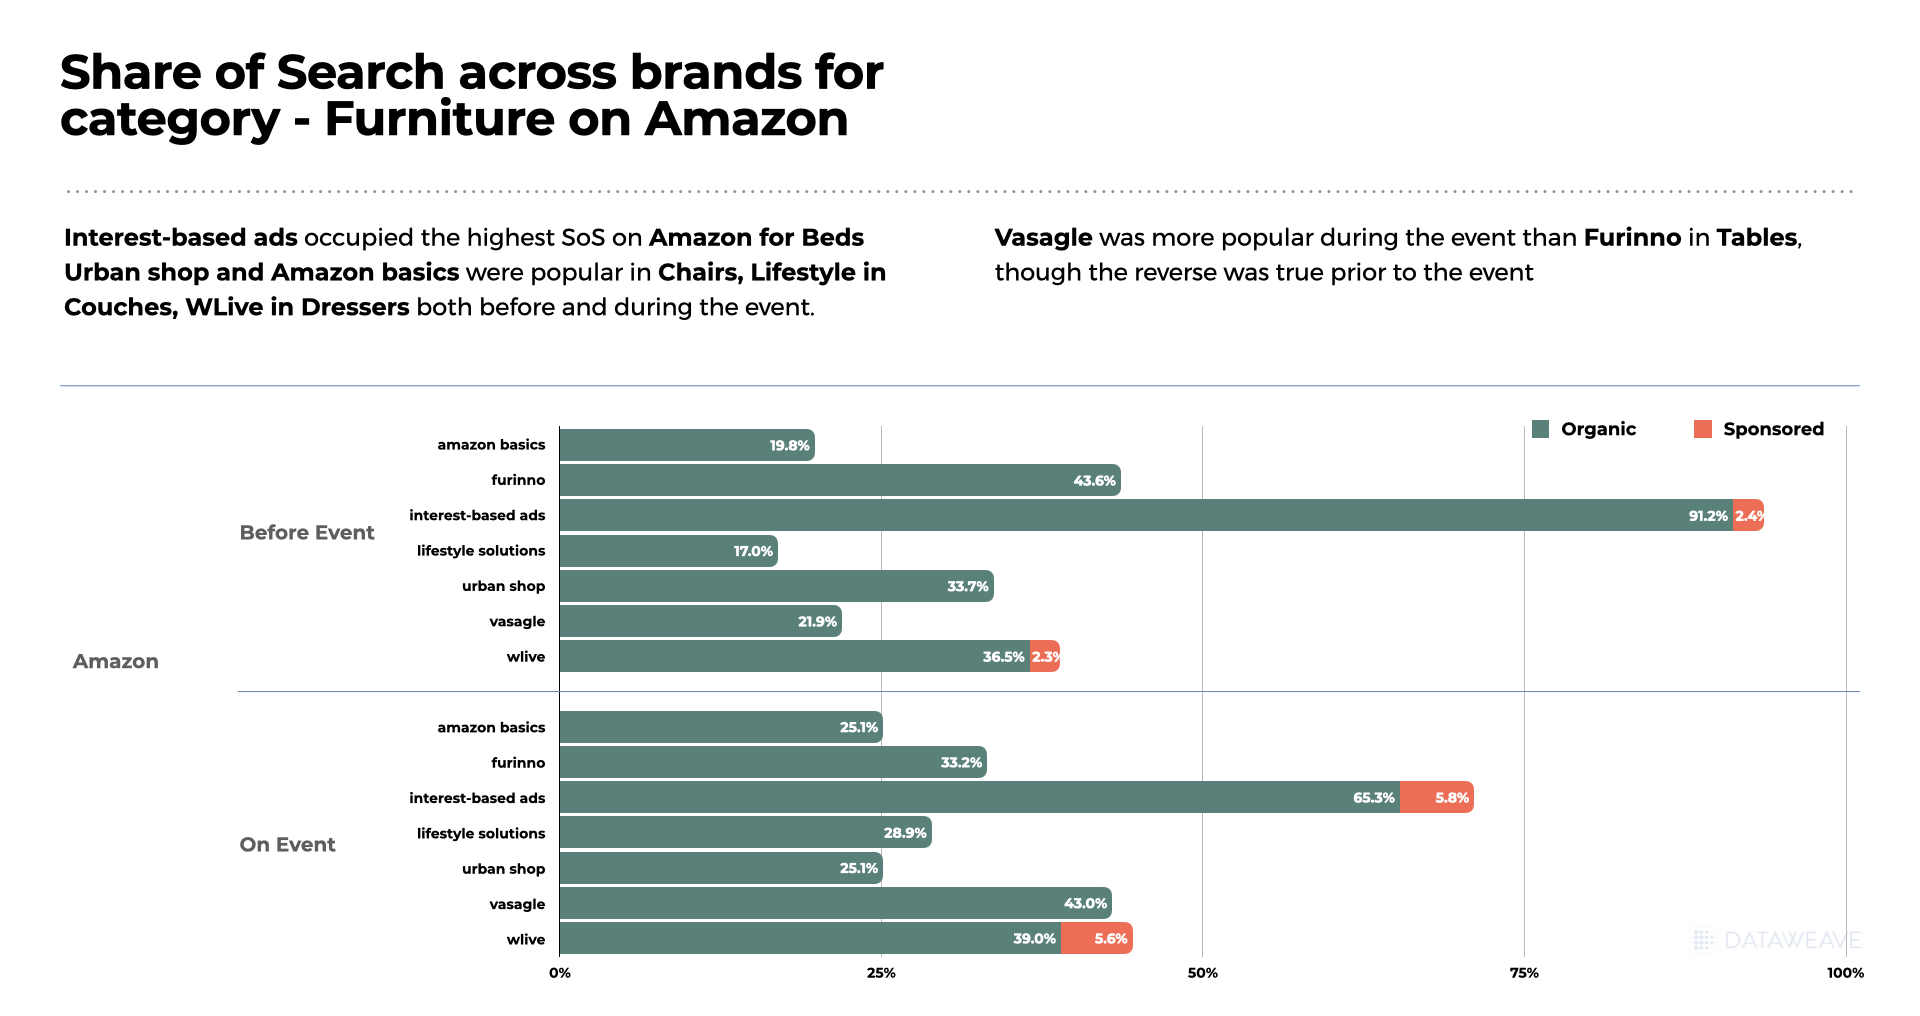
Share of Search For Home & Furniture Brands
The Share of Search data for the Home & Furniture category unveils intriguing insights into brand visibility and performance during the Black Friday and Cyber Monday events. In this competitive landscape, where consumer decisions are influenced not only by discounts but also by brand visibility, the dynamics of Share of Search become pivotal.
Samsung strategically increased its Share of Search during the sale, showcasing a 1.2% improvement. This suggests a deliberate effort to reinforce brand visibility and capture the attention of potential buyers actively searching for Home & Furniture products, in this case, Washer/Dryers and Dishwashers.
Bosch too experienced a notable surge in Share of Search by 1.1%. LG, meanwhile, maintained a consistent Share of Search, with a marginal decrease of 0.1%. American Tourister experienced a modest increase in Share of Search by 0.4%.

Like in the other categories analyzed, the dynamics of Share of Search in the Home & Furniture category reflect brand strategies aimed at not only offering discounts but also ensuring heightened visibility during the critical Black Friday and Cyber Monday shopping events. Positive shifts indicate effective marketing efforts, while stable performers demonstrate a resilient brand presence in a competitive online marketplace.
To explore how our insights can help retailers and brands boost their pricing strategies during sale events, reach out to us today!
For more in-depth analyses and trends across various shopping categories, stay tuned to our blog.