Category: E Commerce

  • Tracing Lazada’s Pricing Across the Month-Long Online Revolution Sale

    Tracing Lazada’s Pricing Across the Month-Long Online Revolution Sale

    Commencing on the 11th of November and ending just a few days ago on the 12th of December, Southeast Asia’s biggest sale event, the Lazada Online Revolution sale rewrote the record books.

    This mega-shopping event is held simultaneously across six Southeast Asian countries, spanning Singapore, Malaysia, Thailand, Indonesia, the Philippines and Vietnam and was bookended by its two biggest sale days, on 11.11 and 12.12.

    In an earlier blog post, we published a highly detailed analysis of the sale on 11.11, using DataWeave’s proprietary data aggregation and analysis platform. This post zoomed in on the pricing and product strategies of Lazada and its competitors in Singapore and Indonesia.

    On the 12th December, Southeast Asian shoppers shattered all retailing expectations by reportedly spending a record-breaking $250 million. This was double both this year’s 11.11 sale and last year’s 12.12 sale. According to Forbes, the 12.12 sales became such a hit that Indonesia even designated the day to be its National Online Shopping Day, or Harlbonas.

    At the end of the sale event on 12th December, DataWeave assimilated all the data we collated throughout the Online Revolution sale and examined pricing trends across the entire span of four weeks, exploring each retailer’s strategy by brand, by category, and by product type.

    We aggregated pricing information on the Top 500 ranked products of over 20 product types featured on each website (Lazada, ListQoo10, and Blibli), spread across the critical Electronics and Fashion categories, covering over 120,000 products in total.

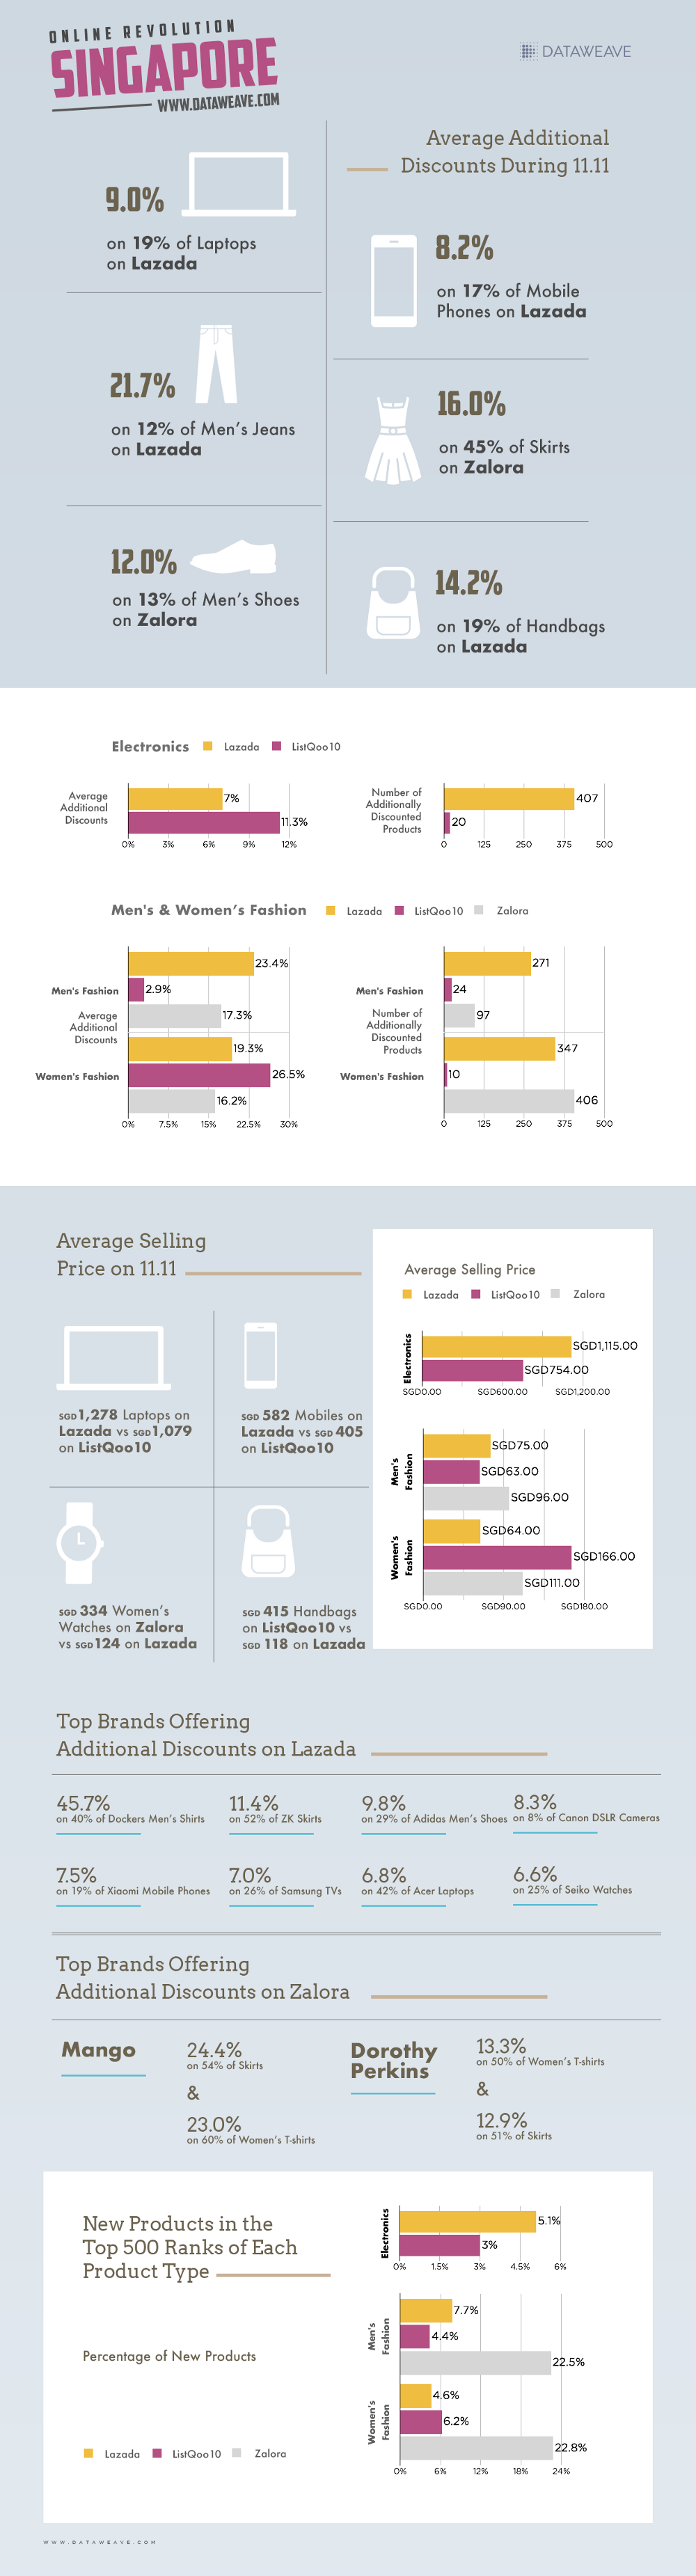
    Online Revolution — Singapore

    Interestingly, one of the trends that became immediately apparent, was the relatively stable track of the average absolute discounts in Electronics, Men’s Fashion, and Women’s Fashion. No significant spikes or drops were evident throughout the duration of the entire sale season.

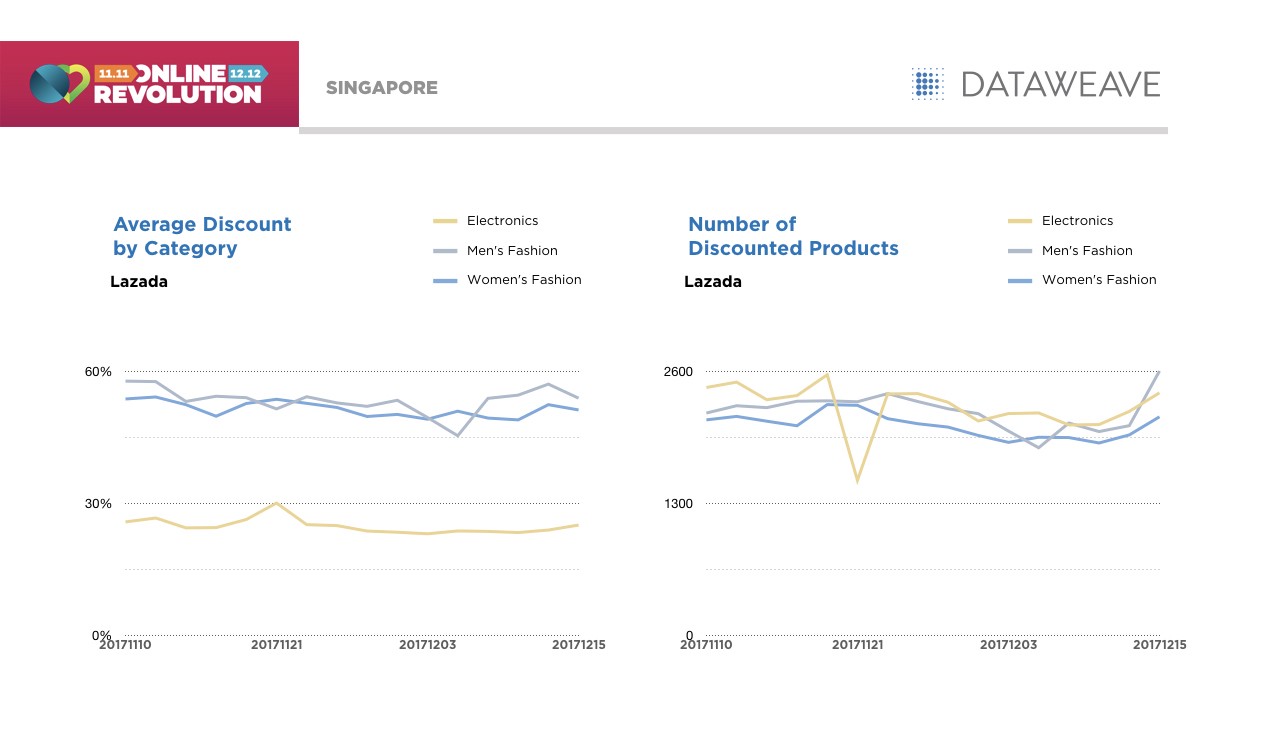
    Similarly, the number of discounted products remained relatively stable. However, in Electronics, there was a conspicuous dip in the number of discounted products, which occurred on the 21st of November. Aside from this anomaly, even the number of products discounted remained relatively stable. The other interesting phenomenon was an uptick in the number of discounted products on the 15th of December, after the Online Revolution sale — something counterintuitive.


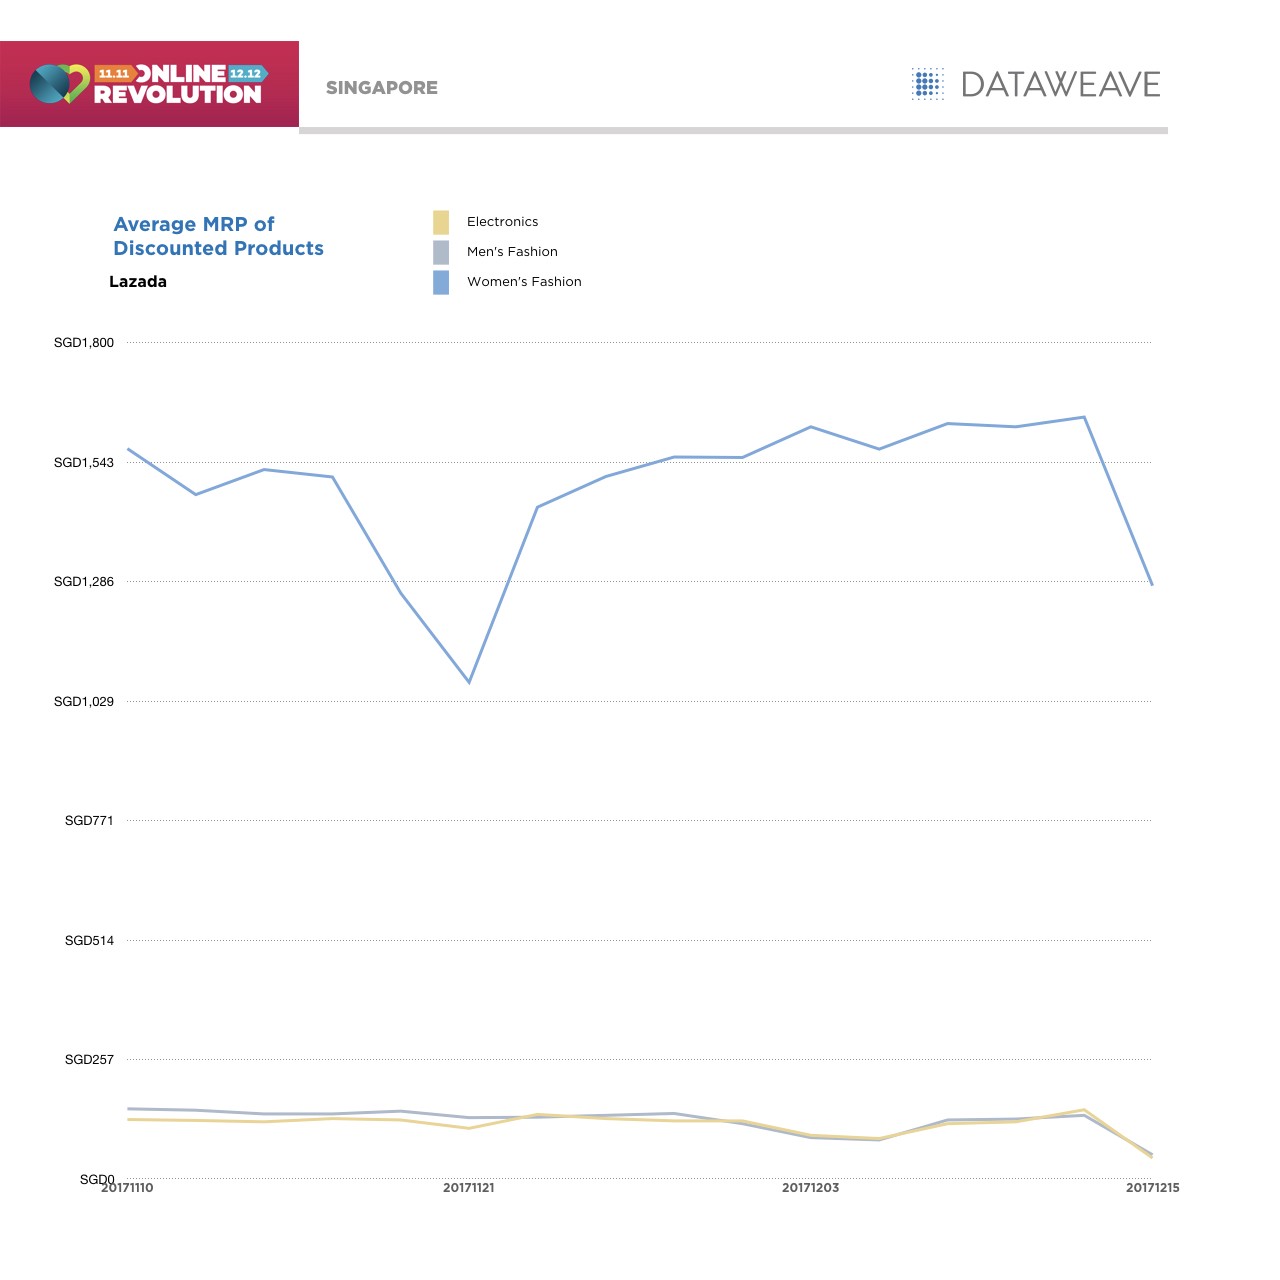
    When we explored the behaviour of the average MRP of discounted products, we noticed a sharp dip on the 21st of November. Clearly, prices were increased specifically on higher-priced electronic products.

    Comparing these numbers with those of ListQoo10’s, who were forced to adopt a more aggressive stance on pricing to stay competitive through this period, we once again see a very consistent discount percentage throughout this period. The average discount in men’s fashion, however, showed a slight upward trend during this period.

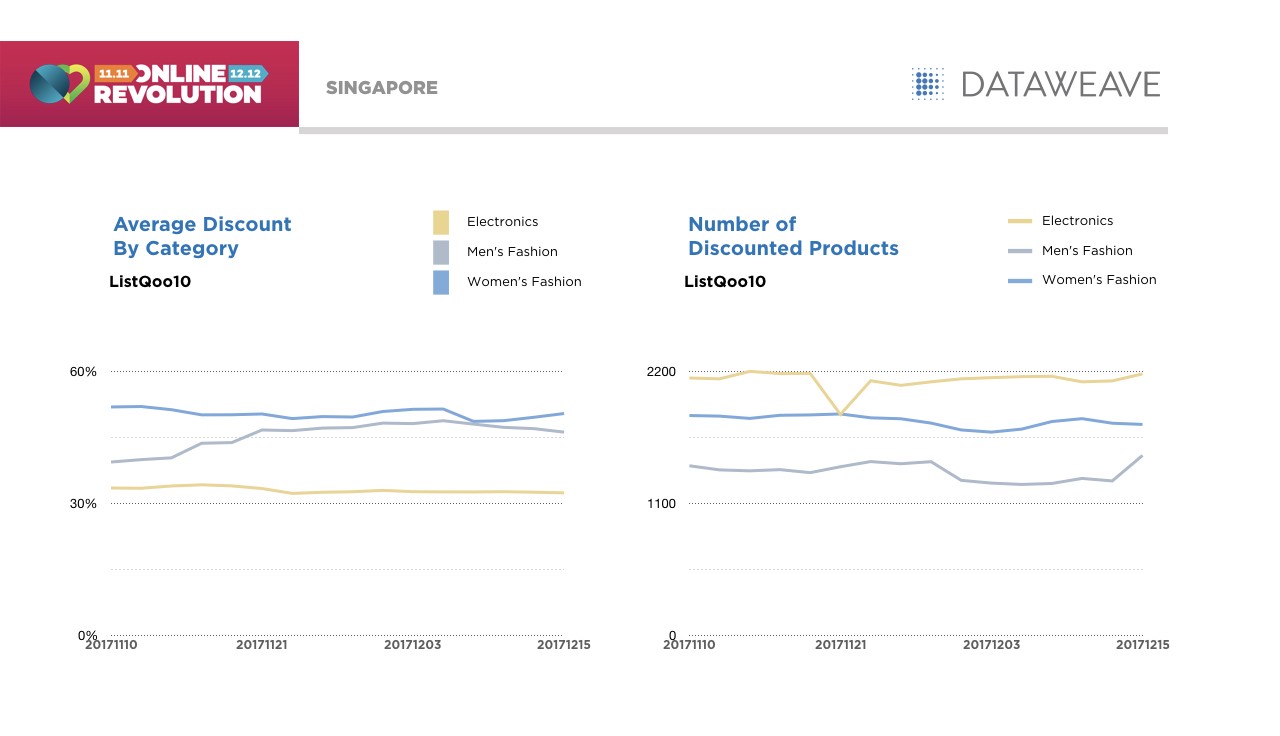
    ListQoo10’s number of discounted products in Electronics dipped as well on the 21st of November, demonstrating the retailer’s ability to dynamically react to competitor strategies. This can be evidence of a robust market monitoring system.

    Returning to Lazada, DataWeave identified several product types displaying a significant variation in average discounts through this period. These included men’s shorts, women’s shoes, men’s Jeans, Laptops, DSLR Cameras, and women’s T-shirts.


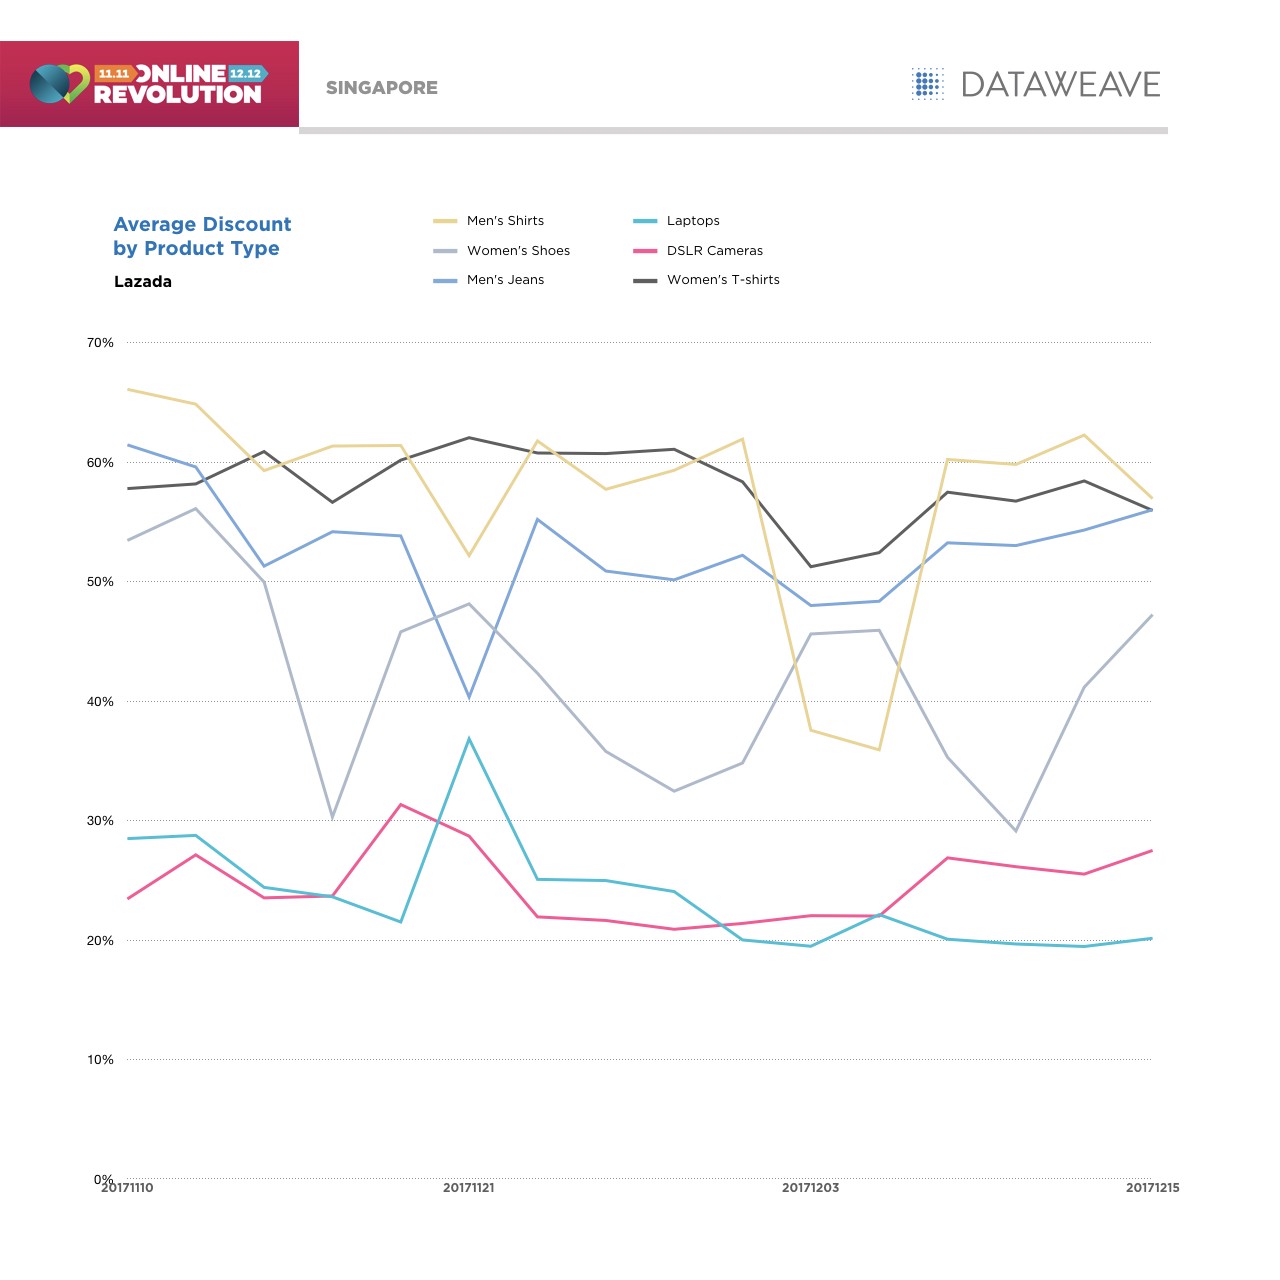
    Once again, our analysis pointed to substantial competitive activity around the 21st of November, together with a second significant dip in discounts on men’s shirts in the period around 5th December. Discounts on women’s shoes, by contrast, proved to be a roller coaster throughout the entire sale period.

    Some of the brands with high variation through this period were Lenovo Laptops, Levi’s T-shirts, Adidas Women’s Shoes, Seiko Watches, and Sony Phones.


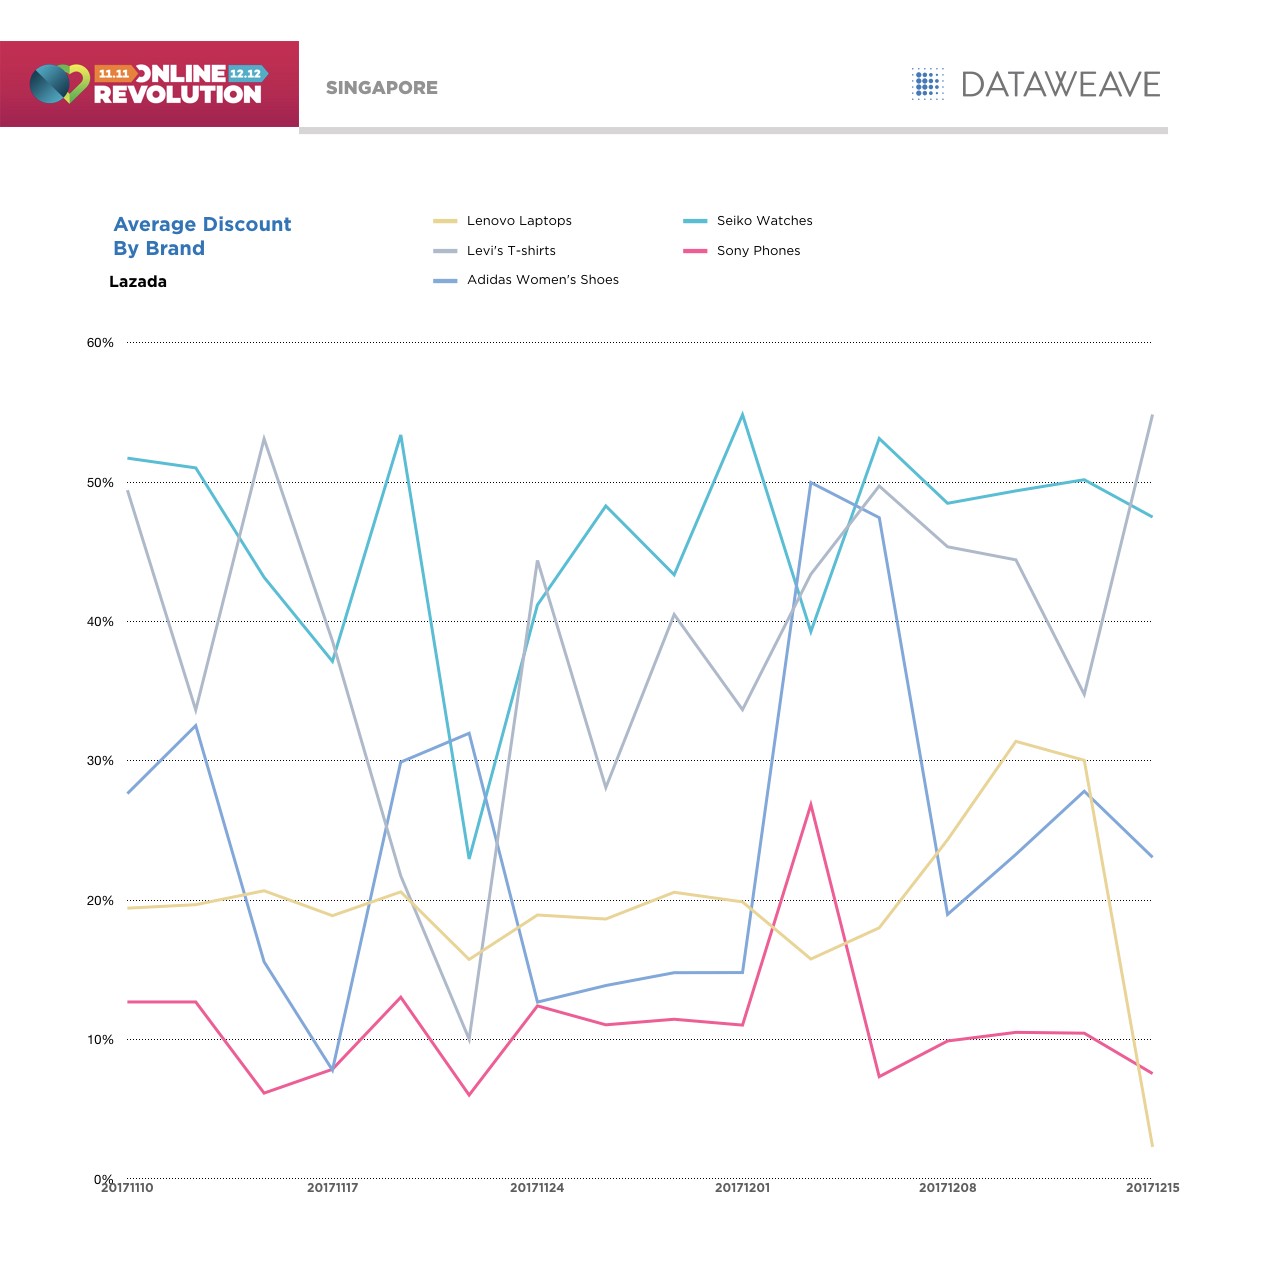
    Discounting activity by these brands appeared to be all over the place during this period, without any discernible pattern or structure. While Sony predictably lowered discounts on its phones after 12.12, Levi’s increased its discounts in the same period

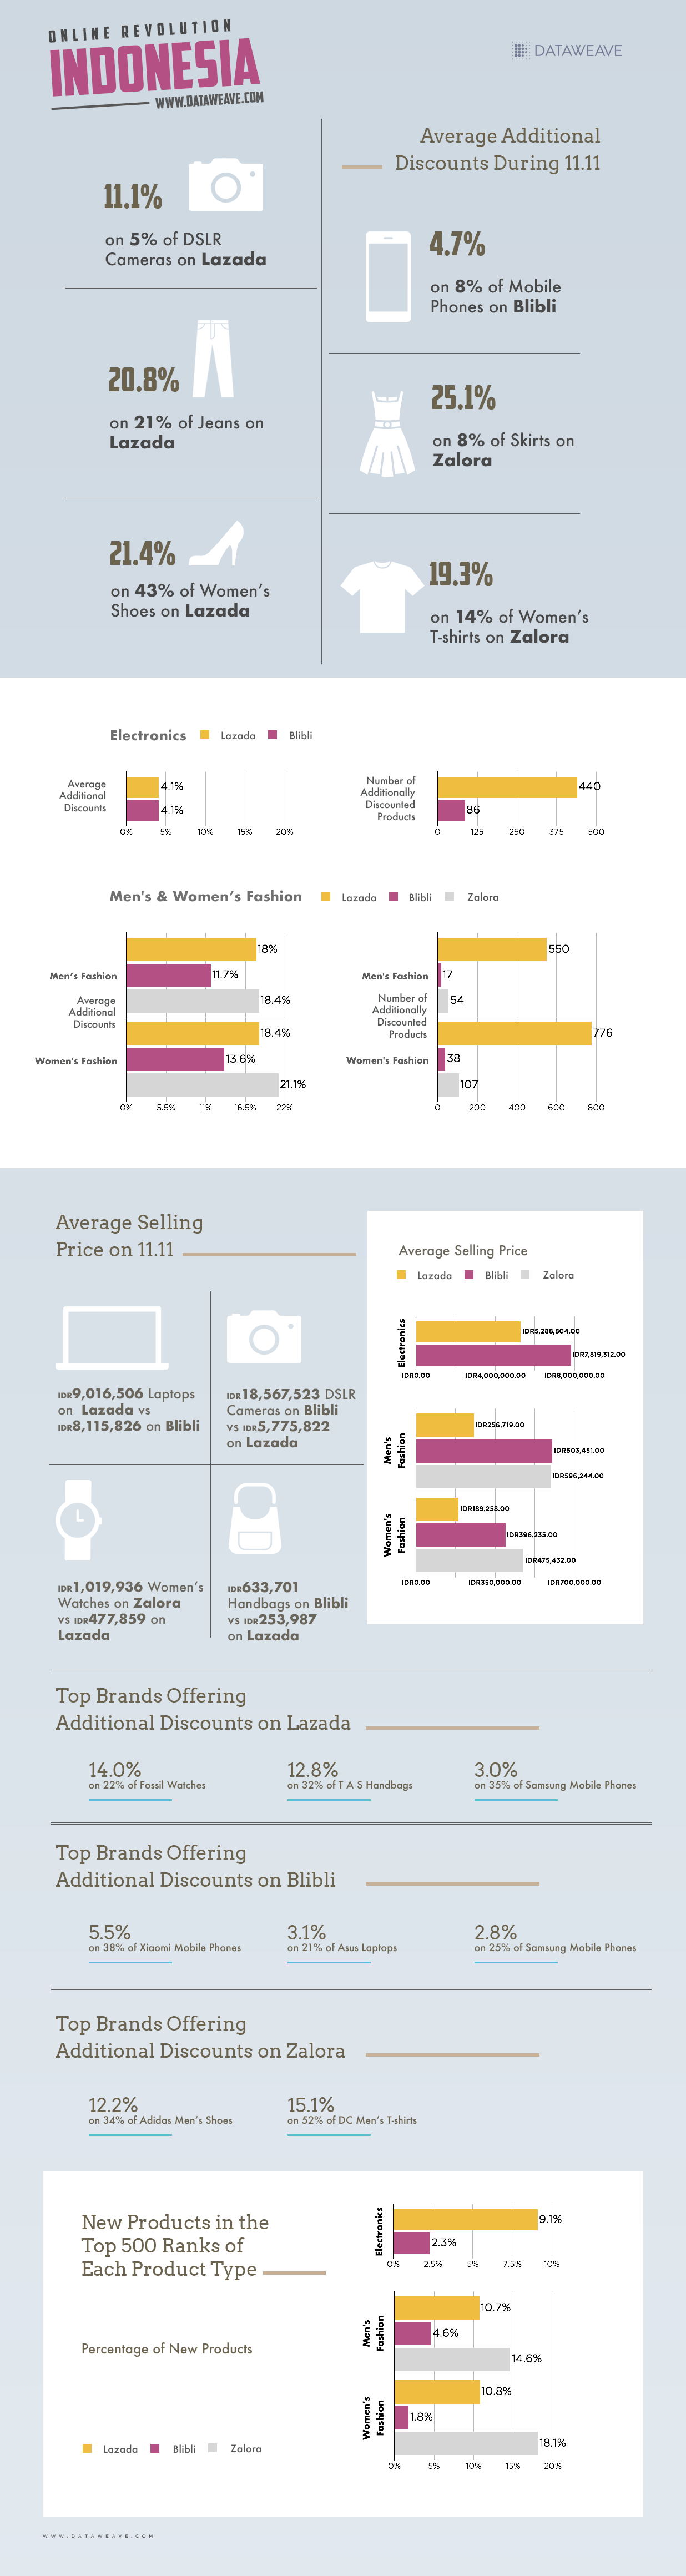
    Online Revolution — Indonesia

    Moving on to Indonesia, we once again witnessed a similar approach to average discounting by category as we saw emerge in Singapore. At a category level, the retailer evidently opted for trading within a narrow discount band across the sale period rather than attempting to inject an overly dynamic discounting approach into their sale execution.


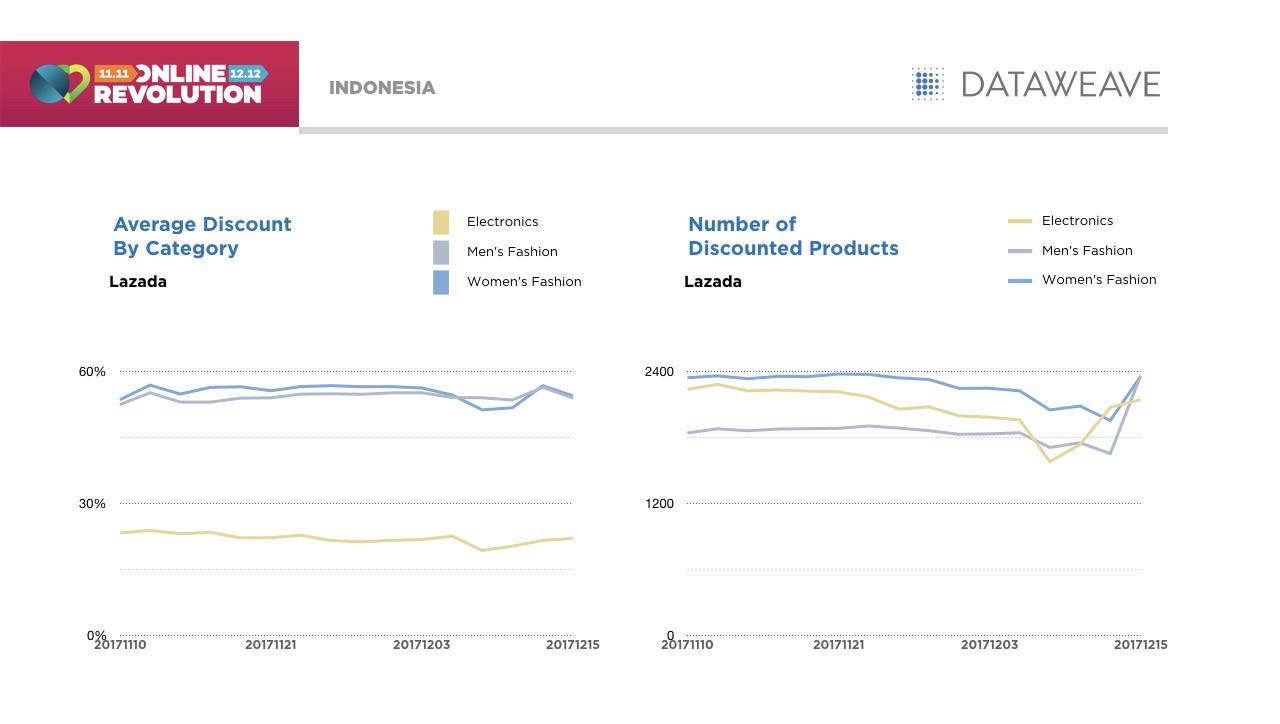
    This is not to say there were not some surprises in store with the number of discounted products in Indonesia. In electronics, there was a noticeable dip in the number of discounted products just ahead of the 12.12 sale. The number of discounted products then surprisingly surged after the 12.12 sale, in combination with a slight reduction in average discount percentage during the period.

    In comparing Blilbi, Lazada’s main competitor in Indonesia, we see a fairly consistent discounting level throughout the sale period, although markedly lower than those rolled out by Lazada across its three core categories.

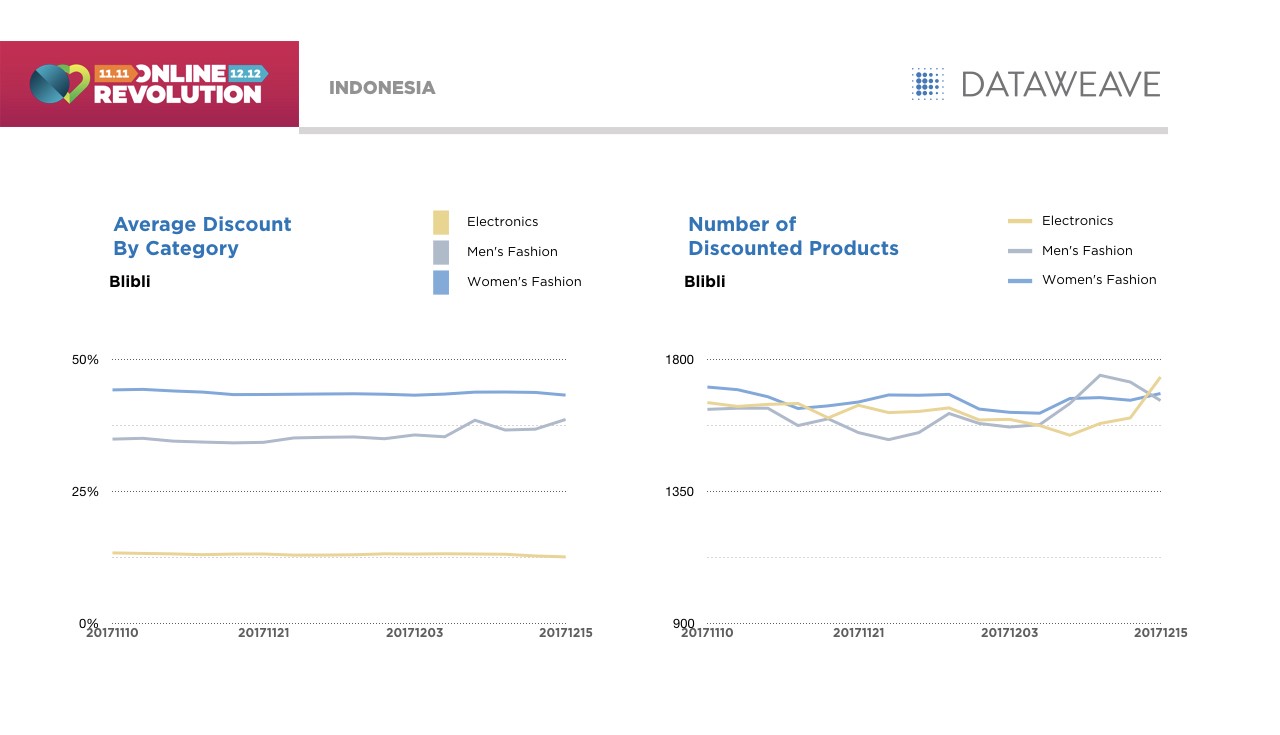
    This approach held true even for the number of discounted products. Blibli seems to have been content to take a backseat to Lazada during the heavily promoted Online Revolution sale period, rather than attempting to compete aggressively in any single category.

    It will be interesting to see if Blilbi is content to repeat this strategy in 2018 as it effectively surrenders the discounting high ground to Lazada during the peak sales period. While this strategy may yet be proven to have paid off in terms of profitability, it may have undesirable consequences for Blilbi’s brand and share performance in the longer term.

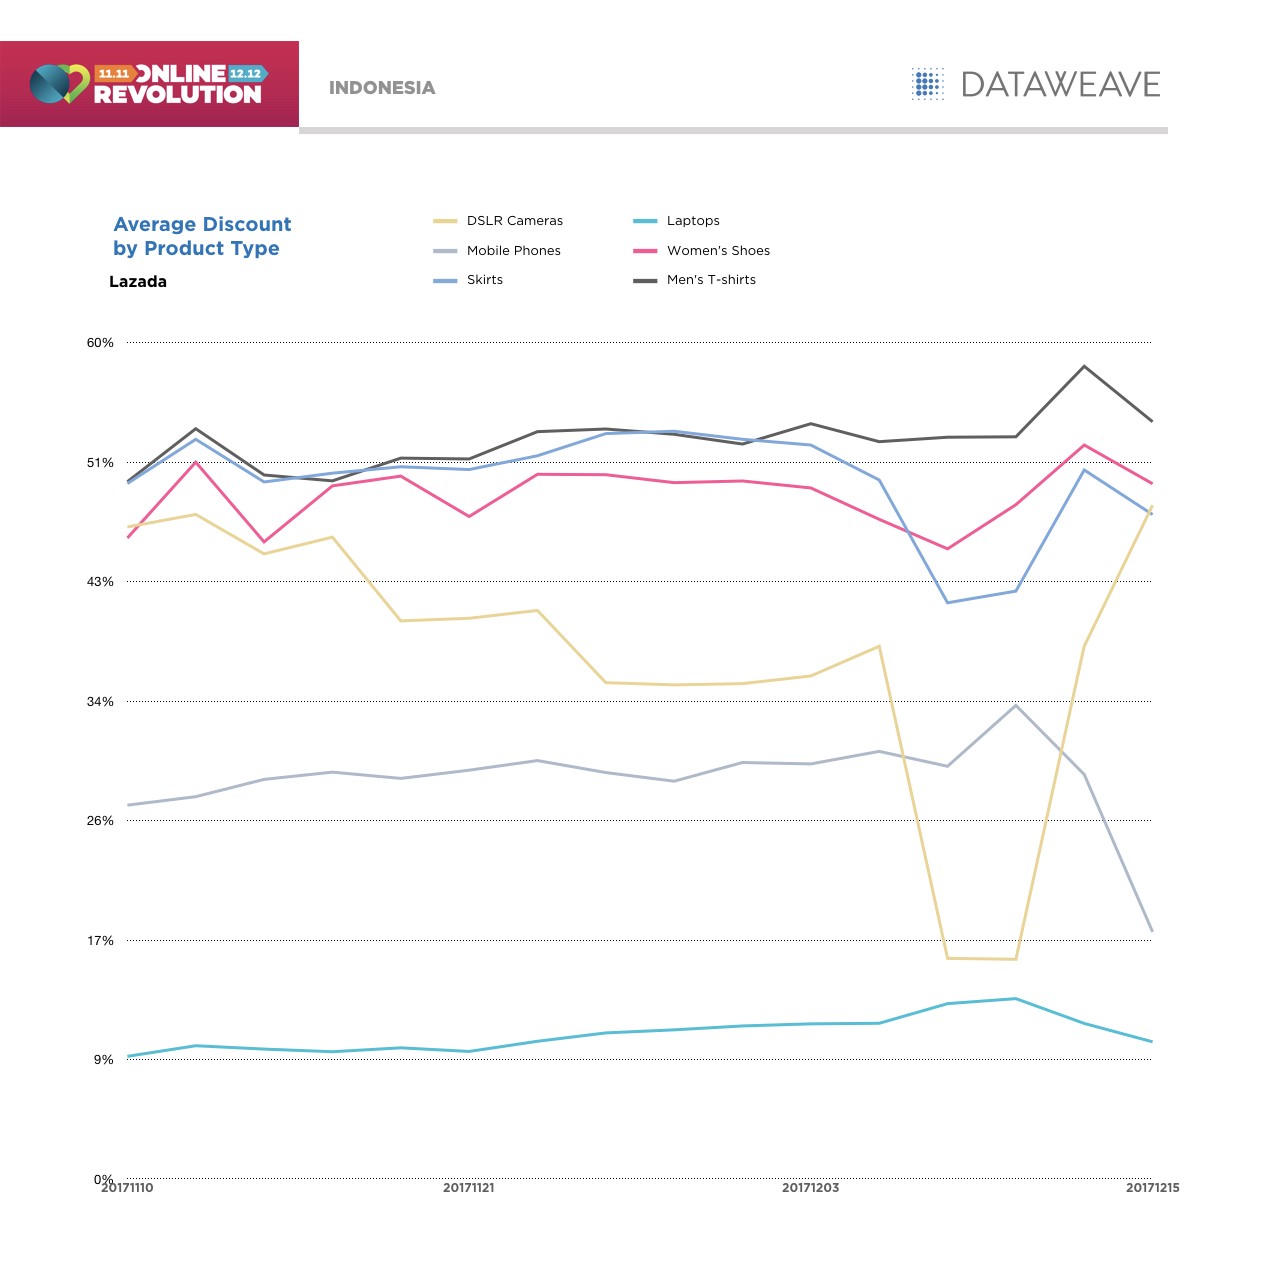
    Returning our focus to Lazada in Indonesia, some product types showed major variation through the sale period, specifically DSLR Cameras, which dipped significantly approximately a week out from the 12.12 sale. However, compared to Singapore, Indonesian discounts by product types appeared relatively more stable, except a few dips prior to 12.12.

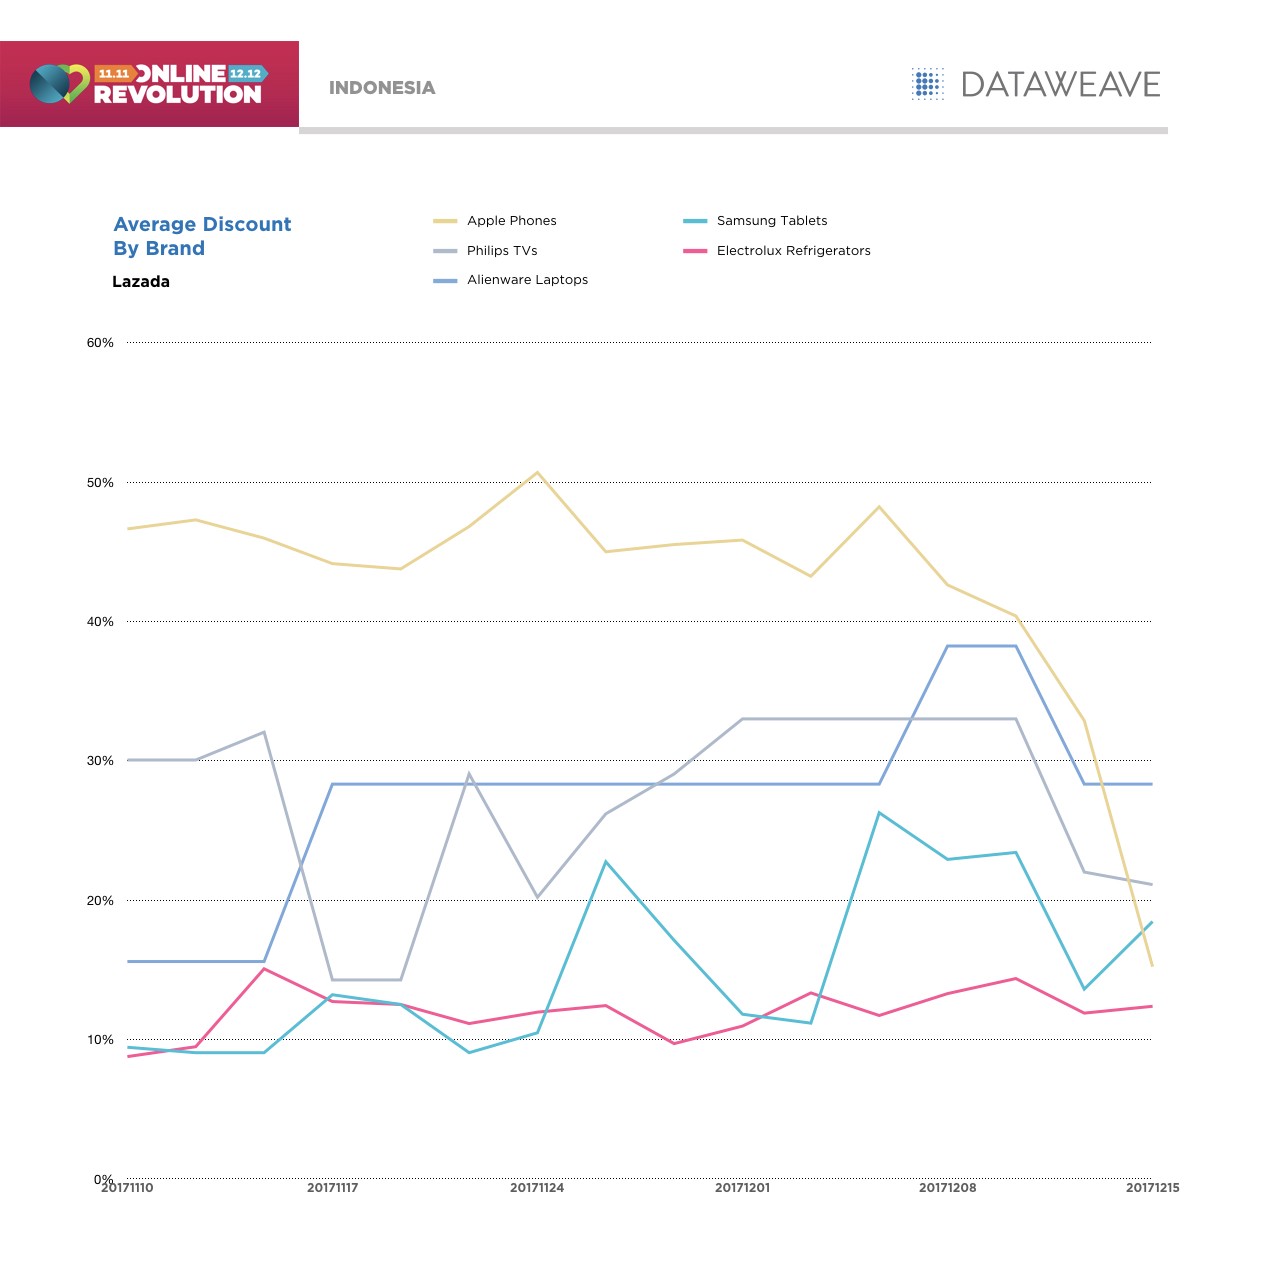
    Three distinct discounting strategies appears to have been adopted by participating brands. Some, such as Electrolux (Refrigerators), opted for a comparatively stable discounting approach. Others, like Apple, increased prices through the sale period, while Alienware, reduced prices through the sale period.

    In particular, Apple’s pricing approach to its iPhones was surprising, given its strong partnership with Lazada during this Online Revolution sale. Yet another example where the marketing hype failed to translate into an aggressive discounting strategy.

    More Talk Than Walk

    For Lazada, the Online Revolution sale proved to be a triumph, effectively extending its record-breaking streak with USD 250 million in sales on 12.12 alone. However, on parsing through the pricing across the entire month of the sale, there is clearly no dramatic increase in discounts either on 11.11 or on 12.12 — some anomalies notwithstanding.

    This goes to show that much of the sales is driven by hype, more than the additional value of discounts. To be fair, 11.11 and 12.12 hosted discounts on some of the more premium products in the assortment, while discounts on most of the mid-range products remained consistent. While some competitors like ListQoo10 chose to stay competitive, so as not to lose out significantly on their customer base and market share, others like Blilbli chose to sit and watch, and pick up on what’s left after the sale.

    This year’s Online Revolution has set the bar high for South East Asian retail, and going by how the event has grown over the last few years, few would be surprised if we witness another record braking sale in 2018.

    If you’re interested in DataWeave’s technology, and how we provide Competitive Intelligence as a Service to retailers and consumer brands, check us out on our website!
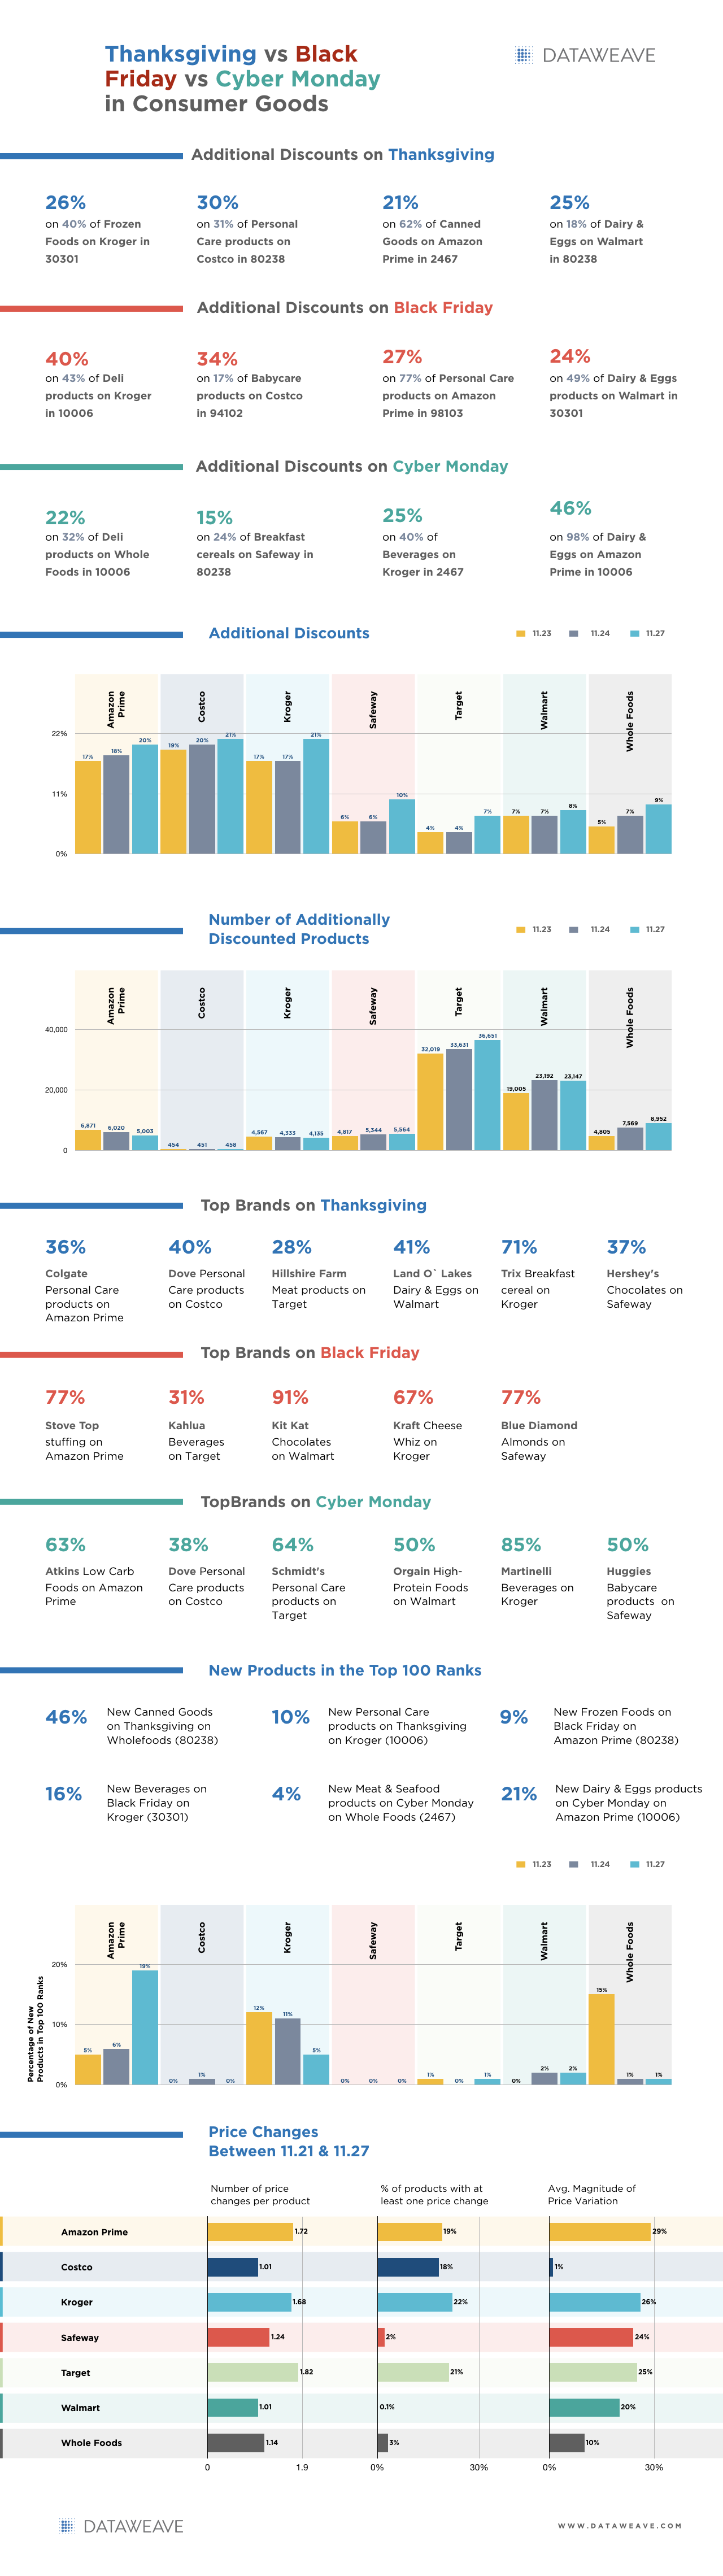
     

  • Consumer Packaged Goods Join The Black Friday Blitz

    Consumer Packaged Goods Join The Black Friday Blitz

    While the Thanksgiving weekend sale, which includes Black Friday and Cyber Monday, is famous for attractive offers across all consumer categories, it remains better known for its discounts on Electronics and Fashion. Consumer goods, traditionally, have evaded much the hype.

    This year, notwithstanding notoriously slim margins, consumer goods and grocery retailers and brands joined Electronics and Fashion in offering sharp discounts on select products in an attempt to carve out increased market share.

    In the past, discounts on consumer packed products have been to drive increased store traffic during the holiday season. Increasingly, however, Thanksgiving has emerged as a viable opportunity for grocers to recruit online shoppers as well and build out their franchise.

    Online Grocers Make Their Move

    Faced with the holiday rush, large numbers of shoppers are proving to be relaxed about trusting the retailer to bag up and deliver their holiday feasts and treats. Grocers themselves have taken the strategic decision to boost their online shopping presence this year.

    They geared up to support their new holiday presence with aggressive price cuts designed to cut through the holiday sales clutter and make direct appeals to a newly-in-play online shopper pool. So transparent was this commercial decision, that many retailers experienced sharp drops in their share prices as industry analysts anticipated the retailers’ new discount-driven strategy.

    Tracking The Numbers

    At DataWeave, using our proprietary data aggregation and analysis platform, we have been tracking, through November, pricing and product information of the Top 1,000 ranked consumer goods products in over 10 product types featured on Amazon Prime, Walmart, Target, Costco, Kroger, Safeway, and Whole Foods, across up to six zip codes each, distributed across the country.

    DataWeave’s major focus was to compare the three main days of the Thanksgiving weekend; Thanksgiving Day, Black Friday, and Cyber Monday. We performed an in-depth analysis of discounts offered across product types and brands, together with how aggressively dynamic retailers were in both their pricing strategy and in the products they displayed.

    In analyzing this major sale event, we observed an extensive range of products enjoying high absolute discounts, but with no additional discounts during the sale, i.e. prices remained unchanged between the period prior to the sale and during each day of the sale, even though high discounts were advertised. The following infographic highlights some of the products where this phenomenon was observed.

    As a result, we focused our analysis only on the additional discounts offered on each day of the sale, compared to the period prior to the sale (we considered 11.21), in order to accurately illustrate the true value shoppers enjoyed during these sale days.

    The following infographic reveals some interesting highlights from our analysis, including the level of additional discounts offered to shoppers, the top brands featured, and the number of dynamic price changes implemented during the sale. All prices analysed are in USD, and all discount percentages represent average values across all zip codes, analyzed for individual retailers.

    In contrast to Amazon Prime, Costco, and Kroger who opted to run with deep discounts on a limited range of products, retailers such as Target and Walmart chose to offer only marginally higher additional discounts but across a large number of products. Others like Safeway adopted a safer approach, combining low discounts on a modest range of products.

    Overall, our analysis discovered little variation in discounts offered across each of the three sale days, with the only enduring trend being a marginally higher discount percentage implemented on Cyber Monday across all retailers.

    Categories significantly discounted across retailers included Personal Care, Deli, Dairy & Eggs, and Babycare products. Stove Top, Martinelli, Colgate, Dove and Hillshire Farm emerged as the leading brands to adopt a more aggressive discount approach.

    While most of the products offered across each of the three peak holiday sale days were comparatively constant (few new products featured amongst the Top 500 ranks), there were a number of conspicuous exceptions. Amazon Prime (19 percent on Cyber Monday), Whole Foods (15 percent on Thanksgiving), and Kroger (12 percent and 11 percent on the first two days of sale respectively), elected to refresh a significant portion of their Top 500 ranked product assortment.

    Across the entire Thanksgiving week, we saw Target, Amazon Prime, and Kroger all highly active in changing prices to stay competitive. Our analysis of these retailers showed more than 1.6 price changes for each price-changed product. While these were implemented on roughly 20 percent of their assortment, itself a significant proportion, the average price variation for each of these retailers was also on the higher side of expectations. In contrast, the other retailers adopted a far more conservative approach to dynamic pricing.

    Consumer Goods Walk The Discount Talk

    In a year when Amazon acquired Whole Foods to forever merge the dynamics of offline and online grocery retail, aggressive discounting by several retailers in specific product categories, combined with high visibility brands, has carved out a new profile for CPG retail.

    Grocers are eyeing a future where online shopping becomes a prime feature of their retail franchise. Amazon for its part demonstrated its prowess in discounting strategy, and its ability to implement a dynamic pricing strategy in tandem with a refreshed Top 500 product assortment.

    Other retailers are not far behind, as the use of market and competitive intelligence technologies pick up steam across the board. In today’s digital economy, data can be the biggest competitive advantage for a retailer, and retail technology providers like DataWeave have upped their game to deliver highly unique and sophisticated data and insights to meet this demand.

    Visit our website, if you’re interested in DataWeave and how we provide zip-code level Competitive Intelligence as a Service to retailers and consumer brands.

  • Thanksgiving, Black Friday and Cyber Monday Parade Discounts in Fashion

    Thanksgiving, Black Friday and Cyber Monday Parade Discounts in Fashion

    Fashion has always been one of the great engines of retail, and two of its iconic sale events are Thanksgiving and Black Friday. While Black Friday was traditionally an in-store shopping event, a large number of shoppers have migrated online taking much of the sales action with them.

    Despite shoppers typically liking to be able to touch and feel fashion and apparel products prior to purchasing them, the convenience of online shopping combined with time-poor shoppers returning to work after their Thanksgiving break has triggered changes to consumer behavior. Today, the retail narrative has shifted to focus on online, with this year’s Thanksgiving weekend turnover up 6.8 percent from last year.

    At DataWeave, using our proprietary data aggregation and analysis platform, we have been tracking the pricing and product information of the Top 500 ranked Fashion products across 15 product types on Amazon, Walmart, Target, Bloomingdales, JC Penney, Macy’s, Neiman Marcus, and Nordstrom.

    Our primary focus was to compare the three key days of the Thanksgiving weekend: Thanksgiving Day, Black Friday, and Cyber Monday. We performed an in-depth analysis of discounts offered across product types and brands, together with how dynamic retailers were in both their pricing strategy and products displayed.

    (Read also: Thanksgiving vs Black Friday vs Cyber Monday: The Electronics Price War Heats Up)

    In analyzing these monster sale events, we observed a range of products sneaking through to enjoy high absolute discounts, but offer no additional discounts during the sale, i.e. prices remained unchanged between before the sale and during each day of the sale, even though high discounts were advertised. The following infographic highlights some of the products where this phenomenon was observed.


    Having identified the aggressive use of high but unchanged absolute discounts among the retailers during the sale, we focused our analysis on the additional discounts offered on each of the days of the sale, compared to before the sale (we considered 11.21), in order to more accurately reflect the true value these sale events deliver to American shoppers.

    The following infographic provides some interesting insights from our analysis along several perspectives, including additional discounts offered, top brands, quality of product assortment, number of price changes, and more. All indicated prices are in USD.


    Our analysis illustrated how aggressive Target was in its strategy for discounting fashion, compared to most other retailers, especially on Thanksgiving and Black Friday. Interestingly, while Macy’s offered reasonably attractive discounts across all product types, it chose to offer them on a much larger product set than any other retailer.

    Overall, the level of discounts, together with the number of products they were offered on, shows no dramatic change for each retailer over the three-day sale period.

    With Neiman Marcus however, we observed a unique pattern. Sharp discounts were offered on Thanksgiving and Black Friday, which were subsequently rolled back completely on Cyber Monday. This represents a clear holiday pricing and discount strategy, albeit conducted on a comparatively compact and highly targeted set of products.

    Other sales discounting phenomena we observed include major discounts on Sunglasses, Shoes, Skirts, and T-shirts across all retailers, clearly representing battleground categories, while some of the top brands offering attractive discounts include Ray Ban, Oakley, Levi’s and Nike.

    Another relatively constant factor across each of the sale days was the average selling price of respective retailers. This parameter indicates how premium each retailer’s product mix is, providing another perspective on each retailer’s customer segment targeting strategy.

    As expected, Target, Walmart and JC Penney housed the more affordable set of products (average selling prices of $25, $31, and $45 respectively). At the other end of the premium spectrum, Neiman Marcus — home to luxury brands and products — adopted a more premium product assortment (average selling price between $820 and $914).

    In fashion, presenting a fresh assortment consistently is key to customer retention, and Amazon leads the pack in this regard, with a product churn rate of 50% in the top 100 ranks each day. Contrast that with Walmart and Target, who follow a more traditional approach, with a largely static set of options to choose from in its top ranks.

    Most of the retailers we analysed implemented several price changes to large percentages of their product sets. Macy’s and Walmart were at the forefront of this dynamic pricing activity. While Bloomingdales too made over 1,300 price changes, the average magnitude of these changes proved to be very high, at 206 percent.

    Fashion Fast-Forwards Its Online Sales

    While the memories of frantic shoppers tussling over fashion and apparel items on Black Friday still linger, they are fast receding as online fashion sales turnover goes from strength to strength. Shoppers are firmly placing long, winding queues in their rearview mirror and embracing the digital shopping cart more with each passing year, as spotlighted this Thanksgiving sale weekend.

    Sunglasses, Shoes, Skirts, and T-shirts emerged as key battleground categories for retailers over the weekend, while individual retailers displayed diverse approaches to capturing and retaining market share with their target demographic — quite assuredly while using modern retail technologies that help develop and execute on competitive strategies.

    As retailers move into the Christmas sales phase it will be fascinating to discover how they are evolving their ability to dynamically change pricing, refresh product categories and focus their shopper promotions.

    Visit our website, if you’re interested in DataWeave’s technology and how we provide Competitive Intelligence as a Service to retailers and consumer brands.


  • [INFOGRAPHIC] Thanksgiving vs Black Friday vs Cyber Monday: The Electronics Price War Heats Up

    [INFOGRAPHIC] Thanksgiving vs Black Friday vs Cyber Monday: The Electronics Price War Heats Up

    Alibaba may have raked in some $25 billion on Singles’ Day in the largest one-day sales turnover ever. In the Western world, however, Black Friday remains an economic force.

    This Black Friday, American shoppers spent a record $5 billion online in just 24 hours, representing a 16.9 percent increase in dollars spent online compared with last year.

    The sale period, though, comprises of Thanksgiving Day and Cyber Monday as well — each generating over a billion and half dollars in online sales this year.

    Cyber Monday has especially been a popular day for buying online, as people head back to work after the long weekend, making a physical visit to the stores to pick up deals less manageable during the day.

    However, the idea of the Thanksgiving weekend as a single shopping event was laid to rest this year.

    It’s Now Black November

    Online sales from November 1st through the 22nd totalled almost $30.4 billion this year, driven by deals available throughout the month on eCommerce platforms. In fact, every single day in November so far saw over $1 billion in online sales, creating a new paradigm for both shoppers and retailers, in stark contrast to the brick-and-mortal retail driven Black Friday sale events of the past.

    Several online retailers began offering attractive discounts from the beginning of November, specifically on “Black Friday Deals” pages of their websites.

    At DataWeave, using our proprietary data aggregation and analysis platform, we have been tracking, through November, pricing and product information of the Top 500 ranked Electronics products across 10 products types on Amazon, Walmart, Target, Best Buy, and New Egg.

    (Read also: Black Friday Sales Season: How US Retailers Are Gearing Up)

    We also took a few snapshots of the products and discounts offered on the “Black Friday Deals” pages of Amazon and Walmart. We saw both websites offering deep absolute discounts in Electronics (40.1 percent on Amazon, 30.4 percent on Walmart) on over 400 products each day.


    Moreover, these discounts weren’t restricted to static product sets. 73.2 percent (Amazon) and 30.6 percent (Walmart) churn of products was observed on these pages each day, providing shoppers with a steady stream of attractive discounts on new products every day.

    Our major focus, though, was to compare the three main sale days of the Thanksgiving weekend. We performed an in-depth analysis of discounts offered across product types and brands, as well as how dynamic retailers were in both the pricing and products displayed — all of these, across Thanksgiving (11.23), Black Friday (11.24) and Cyber Monday (11.27).

    We looked specifically only at additional discounts offered on each of the days of the sale, compared to before the sale (represented by products and its prices on 11.21).

    Overall, we discovered that the level of discounts, together with the number of products they were offered on, does not change dramatically across all 3 days. Some exceptions include –

    • Higher number of additionally discounted products on Amazon and Walmart on Cyber Monday
    • Lower additional discounts offered by Best Buy on Cyber Monday
    • Lower number of products additionally discounted on New Egg on Thanksgiving and Black Friday.

    Discounting strategies across most retailers converged on significant discounts on Pendrives, Smartwatches, DSLR Cameras, and Mobile Phones, while some of the top brands that offered attractive discounts include Apple, Fossil, Canon, Nikon, Sandisk, and HP — across a range of product types.

    While the average selling price (indicative of how premium the product mix is) for each retailer did not change significantly across each of the featured sale days, there was some variation at a product type level, with Laptops and Digital Cameras displaying some variation in average assortment value across Target, Walmart, and New Egg.

    Perhaps the most interesting insight provided by the analysis is just how different each retailer is in its approach to changing its prices. Over the entire week (11.21 to 11.27), Amazon made over 3,600 price changes on over 50 percent of its consistently-top-ranked products. Compare that to Target’s 289 price changes on 30 percent of its products.

    While the average magnitude of price change on Amazon is 27 percent, Best Buy has been far more aggressive with the magnitude of its price adjustments (47 percent), even if it has implemented fewer price changes. Amazon clearly leads the industry here, with its continual focus on employing advanced retail technologies that enable automated, optimized price changes designed to ensure its products are competitively priced.

    How Strategic Is Retail Pricing?

    Another aspect DataWeave explored was whether e-retailers sometimes increase their prices in the lead-up to a sale, only to reduce them during the sale, enabling them to advertise larger discounts. We did observe that all e-retailers effectively increased their prices on a discrete and small set of products prior to their sale. For the purposes of our analysis, price increases before the sale was calculated as an increase in price between 11.14 and 11.21.


    Highlights of our analysis include the discovery that Best Buy increased its prices in Electronics significantly on a small selection (3.5 percent) of its product range prior to the sale, only to reduce those prices immediately during the Thanksgiving weekend sale.

    While Amazon proved not to be as aggressive in the magnitude of this activity as Best Buy, this phenomenon was observed across a larger portion of Amazon’s assortment (6.7 percent)

    Online is Now More Important Than Ever

    While the legend and aura of past Black Friday sale events, complete with long overnight queues and highly publicized stampedes, is ebbing away, in lock-step with the dwindling numbers of store footfall this year (down 2 percent), the Thanksgiving sale season is set for a new transformation, following the growing number of shoppers preferring to shop online.

    A survey by the National Retail Federation found that 59 percent of shoppers plan to shop online this year, marking the first time that online has emerged as the most popular choice for America’s shoppers.

    With an extended sales season to offer discounts, and moving into Christmas, it has become increasingly important for retailers to monitor and react dynamically to their competitors’ pricing, product and promotional activities. Without the ability to track, react, and tweak in real time, retailers risk having their competitive position eroded, dramatically impacting both sales and retail margins.

    Leading eCommerce retailers such as Amazon, and evolving retailers like Walmart have embedded these systems into their overarching strategy and operations, while others are condemned to play catch up.

    As this fascinating cycle of the sale season ends, and retailers crunch their numbers to assess their comparative performance, sights are now set on Christmas to extend this sale extravaganza.

    Visit our website, if you’re interested in DataWeave’s technology and how we provide Competitive Intelligence as a Service to retailers and consumer brands.


  • Under the Microscope: Lazada’s 11.11 Online Revolution Sale

    Under the Microscope: Lazada’s 11.11 Online Revolution Sale

    Lazada’s signature event, Online Revolution, is a month-long sale extravaganza that commenced with a Mega Sale on 11 November, and culminates in an End-Of-Year sale on 12 December. The shopping event is held across six southeast Asian countries — Singapore, Malaysia, Thailand, Indonesia, the Philippines and Vietnam — making it the region’s biggest retail event.

    Lazada Group’s chief executive officer Maximilian Bittner observed, “We aim to provide Southeast Asia’s rapidly growing middle-class the access to a wide range of products with deals and discounts that were previously available only abroad or in the capital cities.”

    On 11.11, the first Mega Sale, shoppers took advantage of great deals, ordering 6.5 million items (nearly doubling last year’s tally), resulting in sales of US$123m, annihilating last year’s takings by a whopping 191 percent.

    At DataWeave, our proprietary data aggregation and analysis platform enabled us to seamlessly analyze and compare Lazada’s discounts during 11.11 with those of its competitors. We focussed specifically on two markets — Singapore and Indonesia. While the sale itself is Lazada’s, we looked at its immediate competitors as well, to study how competitively they position themselves during Lazada’s sale.

    For our analysis, we aggregated pricing information on the Top 500 ranked products of over 20 product types on each website, spread across Electronics and Fashion, covering over 120,000 products in total.

    11.11 — Singapore

    In our analysis, we scrutinized the additional discounts offered by Lazada, ListQoo10, and Zalora during the sale period, compared to prices leading up to the sale. As today’s shoppers often encounter deep discounts on several products even on normal days, our analysis of additional discounts offered during the sale more accurately reflects the true value of the sale event to shoppers.

    In the following infographic, all prices are in Singapore Dollars, and additional discounts are the percentage reduction in price on 11.11 compared to 10.11.

    Lazada’s discounting strategy was more focused on Fashion rather than Electronics. However, Lazada didn’t have it all its own way with Zalora providing comparably high discounts, enabling it to compete effectively, especially in Women’s Fashion (16.2 percent on 406 products).

    Zalora actually exceeded Lazada in the number of additionally discounted products on offer (Zalora 406, Lazada 347). ListQoo10 did not match either Lazada or Zalora’s level of discounting.

    While Lazada held a more premium, high-value product mix in Electronics compared to ListQoo10, it chose to target the more affordable segment in Fashion, with both ListQoo10 and Zalora displaying a higher average selling price in each category.

    Interestingly, Lazada refreshed very few of its Top 500 products during the sale, limiting new options to choose from for its shoppers. On the other hand, Zalora refreshed 22.5 and 22.8 percent of its products in men’s and women’s fashion respectively.

    11.11 — Indonesia

    Using a similar methodology to our Singapore analysis, we analyzed Lazada’s promotions against Blibli and Zalora, three of the top eCommerce websites in the region. In the following infographic, all currencies are in Indonesian Rupiah.

    As with its Singapore strategy, Lazada targeted Fashion as the lead category for discounts in Indonesia. It offered steep discounts in both Men’s and Women’s Fashion (around 18 percent in each) across a large number of products (550 and 776 respectively). While Zalora matched and occasionally exceeded the discounts offered by Lazada, it did so across a significantly smaller range of additionally discounted products.

    Surprisingly, Electronics were de-emphasised in Indonesia (4.1 percent compared to 9 percent in Singapore).

    Compared to the market leaders Lazada and Zalora, Blibli struggled to be competitive from both an absolute discount level and a product assortment perspective.

    Like in Singapore, Lazada looked to be targeting the affordable value end of the product mix spectrum across all categories, and introduced very few new products in its Top 500 ranks.

    Zalora had a healthier churn rate of 14.6 percent and 18.1 percent in Men’s and Women’s Fashion, compared to Lazada’s 9.1 percent (Electronics), 10.7 percent (Men’s Fashion) and 10.8 percent (Women’s Fashion).

    It’s Not Just About Discounts

    Lazada’s ‘Fashion First’ targeting strategy creates an effective tie-in to its broader model of surfing the convergence wave between entertainment and eCommerce, something unique to southeast Asia.

    Together with sumptuously attractive discounts, major sale events in South East Asia are fast becoming characterized by entertainment. By launching Southeast Asia’s first star-studded eCommerce TV show, Lazada continues to be the region’s eCommerce innovator, following in the footsteps of its pioneering parent company, Alibaba.

    While time will tell how effective Lazada’s strategy ultimately proves to be, together with Alibaba, it has set up a fascinating and uniquely Asian retail sale model. No doubt another milestone will be set on 12.12 when the Online Revolution Mega Sale returns with even greater deals. At DataWeave, we’ll be sure to analyze that sale as well and bring you all its highlights.

  • Black Friday Sales Season: How US Retailers Are Gearing Up

    Black Friday Sales Season: How US Retailers Are Gearing Up

    In today’s rapidly evolving online and mobile worlds, few things encapsulate the competitive nature of the online retail battlefield like the Black Friday sales season. With this year’s Black Friday and Cyber Monday sale events just around the corner, 2017 promises another titanic tussle between contenders.

    The holiday shopping season commences on Black Friday, November 24, and continues through much of December. Anticipating the sales season, many retailers are already offering discounts on several key categories and anchor products, providing a sneak peek into what we can expect towards the end of the month.

    While traditionally, Black Friday sales were dominated by brick and mortar retail stores, with the odd shopper stampede not unheard of, retail dynamics have changed in the recent past. Online sales now consume a larger proportion of Black Friday spending, and for the first time, consumers are expected to spend more online in the 2017 holiday season than in-store.

    In anticipation of this mammoth sale event, we at DataWeave trained our proprietary data aggregation and analysis platform on several major US retailers to understand the competitive market environment before the sales kick off.

    Between the 15th and 29th of October, we tracked the prices of the top 200 ranked products each day in the Electronics and Fashion categories across several major retailers. For Electronics, we analyzed Amazon, Walmart, Best Buy, and New Egg, while Amazon, Walmart, Bloomingdales, Nordstrom, Neiman Marcus, New Egg, and JC Penney provided our insights into the pivotal Fashion category. Product types analyzed include mobile phones, tablets, televisions, wearables techs, digital cameras, DSLRs, irons, USB drives, and refrigerators in Electronics, and T-shirts, shirts, shoes, jeans, sunglasses, watches, skirts, and handbags in Fashion.

    Automated Competitive Pricing Is the New Norm

    With the accelerated evolution of online commerce, retailers have increasingly harnessed the power of competitive data to drive changes on the go to their pricing, product assortment, and promotional strategy. During sale events, however, these numbers spike significantly. Amazon famously made 80 million price changes each day during 2014’s Christmas Season sale. Similarly, even on normal days some retailers have adopted the tactics of changing their product pricing more frequently than others, in their quest to stay competitive and build their desired price perception amongst shoppers.

    In our analysis of price changes, we considered the set of products that ranked consistently in the Top 200 from the 20th to the 25th of October. We identified the number of price changes together with the number of products affected by price changes that were implemented by the retailers.

    As anticipated, Amazon led the way with 508 price changes on 236 products in the Electronics category during the period compared to Walmart’s 413. By comparison, New Egg’s 95 price changes trailed the field by a significant margin and illustrate the tactical advantage Amazon’s dynamic pricing technology confers. However, the price variation (8.0%) of Amazon’s was also the lowest of the four retailers included in the study, showing that Amazon makes short, sharp tweaks to its pricing at a higher frequency than its competitors.

    By comparison, the Fashion category demonstrated a much lower level of price changes than Electronics, albeit with significantly higher price variations. Walmart leads the pack, adopting an order of magnitude greater number of price changes across a significantly larger number of products compared to the majority of its competitors.

    Product Mix Suited to Target Market Segments

    While competitive pricing is one strategy for attracting new customers and retaining existing ones, the selection of products featured in a retailer’s inventory is just as important. Ensuring a disciplined product assortment, which caters exclusively to a retailer’s target market segments is key. While some retailers such as Walmart choose to house a more affordable range of products, Neiman Marcus and Bloomingdales target the more premium segment of shoppers.

    It is clear from the data that Walmart has aligned its pricing strategy to support its affordability pitch to its shopper base, while Neiman Marcus and Nordstrom use pricing to juggle the demands of a more premium inventory with perceptions of price competitiveness.

    Product Movement In The Top 200

    Much of a retailer’s sales performance comes down to how effectively it maintains the optimal mix of reassuring bestsellers complemented by attractive new arrivals. Sound product assortment clearly provides shoppers with a variety of options each time they visit the retailer’s website. To achieve this balance, retailers typically employ their own, unique algorithm that ranks products in their listings based on several factors, including price range, discount offered, review ratings, popularity and promotions by brands.

    To study this, we evaluated the average percentage of products that were replaced in the Top 200 ranks for each product type of each website.

    Amazon has clearly adopted a strategy of offering new options to its shoppers each day, with an average of 60% new products in the Top 200 ranks of the Fashion category. Contrast that with Walmart which appears to be more conservative in its approach to churning its Top 200 products. In the case of Neiman Marcus however, the reason for the lower volume of product pricing movements in its Top 200 ranks may be due to the relatively high value of its premium product assortment, which imposes the internal constraints of having a smaller pool of new products to choose from.

    Online-First, This Black Friday Sale Season

    Amazon continues to demonstrate its dominance as a pacesetter in US retail, largely due to its progressive online pricing and merchandising strategies. These embrace the power of big data in its approach to online retail.

    Research shows online is consistently outperforming in-store along critical customer satisfaction dimensions spanning: product quality, selection and/or variety, availability of hard-to-find and unique products, ease of searching and delivery options.

    According to global consultancy Deloitte, for the first time ever, American shoppers will purchase more online than they buy offline in the 2017 holiday shopping season — 51 percent, up from 47 percent in 2016. With Black Friday looming in the next few weeks, it will be interesting to see how US retailers push to seize a larger piece of this growing pie.

    Check out our website to learn more about how DataWeave provides Competitive Intelligence as a Service to retailers and consumer brands globally.

  • Our Analysis of Diwali Season Sales

    Our Analysis of Diwali Season Sales

    As the battle of the Indian eCommerce heavyweights continues to accelerate, we have witnessed three separate sale events compressed into the last four weeks of this festive season. Flipkart has come out with all guns blazing following its multi-billion-dollar funding round, leaving Amazon with little choice but to follow suit with its own aggressive promotions. At this stage of a highly competitive eCommerce cycle, market share is a prize worth its weight in gold and neither Flipkart nor Amazon are prepared to blink first.

    At DataWeave, our proprietary data aggregation and analysis platform enables us to seamlessly analyze these sale events, focusing on multiple dimensions, including website, category, sub-category, brand, prices, discounts, and more. Over the past six weeks, we have been consistently monitoring the prices of the top 200 ranked products spread over sub-categories spanning electronics, fashion, and furniture. In total, we amassed data on over 65,000 products during this period.

    The first of these pivotal sale events was held between the 20th and 24th September, which we earlier analyzed in detail. Another major sale soon followed, contested by Amazon, Flipkart and Myntra for varying periods between the 4th and 9th of October. Lastly, was the Diwali season sale held by Amazon, Flipkart, and Myntra between the 14th and 18th of October, joined by Jabong between the 12th and 15th of October.

    In analyzing these significant sale events for all eCommerce websites, we observed an extensive range of products enjoying high absolute discounts, but with no additional discounts during the sale, i.e. prices remained unchanged between the day before the sale and the first day of the sale. The following infographic highlights some of the sub-categories and products where this phenomenon was more pronounced during the recently concluded Diwali season sale. Here, discount percentages are average absolute discounts of products with unchanged discounts during the sale.

    Having identified the aggressive use of high but unchanged absolute discounts amongst eCommerce heavyweights during the sale, we focused our analysis on the additional discounts offered during the sale, to more accurately reflect the value these sale events deliver to Indian consumers.

    Several categories, sub-categories and brands emerged as enjoying substantial additional discounts. The following infographic details our analysis:

    Amazon and Flipkart continue to stand toe to toe on discounts in Electronics, although Amazon offered discounts across a greater number of products. Flipkart adopted a more premium brand assortment in the Electronics category with an average MRP of INR 30,442 for additionally discounted products.

    What stands out in our analysis is Amazon’s consistently aggressive discounting in fashion compared to Flipkart. As anticipated, Jabong and Myntra continued to offer attractive discounts in a large number of fashion products, seeking to maintain their grip in their niche. Furniture, too, is a category where Amazon out-discounted Flipkart, albeit through a less premium assortment mix (average MRP of INR 23,580 compared to Flipkart’s INR 34,304).

    Several big brands elected to dig deep into their pockets during the sales to offer very high discounts. These included attractive discounts from Redmi, Asus, and Acer in Electronics, and W, Wrangler, Levi’s, Puma, Fossil, and Ray Ban in Fashion.

    Which Sale Delivered Greater Value For Consumers?

    Since DataWeave has extensive data on both the pre-Diwali sale (held between 4th and 9th of October), and the Diwali season sale (held between 12th and 18th October), we compared prices to identify which of the sale events offered more attractive discounts across categories, sub-categories and products.

    While the discount levels were generally consistent across most sub-categories, only varying by a few percentage points, we identified several sub-categories and products that displayed a large variation in the absolute level of discount offered.

    As the infographic above shows, Amazon identified women’s formal shoes as a key category in its discounting strategy, which saw its level of discounting triple during the Diwali sale. By comparison, Flipkart doubled its discount in men’s jeans, and Myntra tripled its discounts on Men’s shirts and sunglasses.

    Similarly, during the Diwali sale Amazon, Flipkart and Myntra all offered selected products with an aggressive 40% to 50% discount level.

    Interestingly, Amazon, Flipkart and Myntra all elected to reduce the level of discounts offered on specific products as well. One of the biggest discount moves was Amazon’s reduction on iPhone 6s from 34% to only 4%. Flipkart recorded a similar price move on Adidas originals Stan Smith sneakers (30% to 5%) and Canon EOS 200D DSLR cameras (20% to 8%).

    Market Share Reigns Supreme

    Based on our analysis of the festive season sales, Flipkart’s aggressive approach powered by its multi-billion-dollar funding round enabled it to stave off Amazon’s discounting strategy in the annual eCommerce festive season sales this year, increasing its lead over Amazon India in a market where the total sales is believed to have surged by up to 40 percent over 2016’s sales.

    Based on several reports, Flipkart’s share of total festive season sales appears to have increased from 45 percent in 2016 to 50 percent this year, capturing much of the market up for grabs from a now relegated Snapdeal. Amazon’s market share during a festive sales period that stretched over a month is estimated to have remained steady at 35 percent, though the company reported it saw a 50 percent share in other metrics such as order volume and active customers.

    The key question for both industry analysts and consumers alike is, how much deeper are retailers willing to go in their quest to capture market share at the expense of operating margins?

    If you’re interested in DataWeave’s data aggregation and analysis platform, and how we provide Competitive Intelligence as a Service to retailers and brands, visit our website!

  • Top 5 Drivers of Successful eCommerce | DataWeave

    Top 5 Drivers of Successful eCommerce | DataWeave

    Retail has undergone a dramatic transformation over the last decade. Once dominant retailers are today being given a run for their money amid a gradual decline in mall traffic and sharply growing consumer preference for shopping online.

    Surfing this online retail wave is Internet behemoth Amazon, which is raking in 43% of all new eCommerce dollars, leaving other retailers floundering in its wake.

    As it unfolded, this transformation has unleashed changes across many areas of retail, a phenomenon that’s been well documented by industry commentators in the media. Some of these shifts include:

    Customer preferences: Customers today are spoilt for choice, both in terms of being able to quickly and easily compare product prices across websites, as well as consistently driving the demand for new and unique products from retailers.

    Hyper-personalization: With shoppers increasingly relying on mobile apps, highly personalized shopping experiences are becoming the new normal.

    Delivery: e-Retailers are competing on faster home deliveries, stretching themselves to guarantee same day delivery, or even (as in the case of hyper-local grocery retailers) within a few hours. Drones, anyone?

    Payment Modes: Even the more tactical aspects of retail, like payment modes, have been forced to evolve. Starting with cash-on-delivery, this trend quickly spread to embrace card payments and digital wallets. These initiatives have posed significant technological and security challenges for retailers.

    As with a forced move in chess, traditional retailers have had to evolve and embrace changes like the ones listed above, in order to survive the incredibly cutthroat world of modern retail. Similar challenges exist for up-and-coming eCommerce companies as well.

    However, many pundits and retailers alike often forget that doing even simple, time-tested things correctly can go a long way in forging an effective competitive position, helping win both market share and customer affections. While digital transformation has altered how these strategies were routinely executed, the fundamentals remain as relevant today as they ever were.

    1. Smarter Pricing

    With 80 percent of first-time shoppers comparing products prior to buying, the need for an eCommerce website to offer competitive pricing has become a mandatory cost-of-entry capability. While dynamic pricing poses a challenge for e-retailers to stay competitive, it also presents them with an opportunity to track their competitors’ pricing and exploit that information to optimize their own pricing.

    However, e-retailers today are frequently forced to perform millions of price-changes every day in the eternal quest to either offer the lowest price or entrench a calculated premium price perception among shoppers.

    For instance, as far back as Christmas season 2014, Amazon is estimated to have made a total of 80 million price changes per day. Similarly, today’s hyper-local grocery retailers offer differentiated and targeted prices for shoppers living in specific zip codes.

    To achieve price controls on this level of scale demands sophisticated automated tracking of competitor pricing to facilitate timely, data-driven dynamic pricing decisions. This has, today, become a table stakes requirement.

    2. Variety and Depth of Product Range

    If customers cannot find what they are looking for on a website, all other aspects of how an eCommerce operator optimizes their retail strategy falls by the wayside.

    A website’s success remains dependent largely on it being able to cater effectively to the needs, wants and desires of its target audience. Simply put, a website offering a mammoth product range may still end up failing compared to a small niche website with a limited but highly targeted assortment that understands closely its customer’s sweet spot.

    However, with millions of products on offer online all day every day, gathering and harvesting deep insights into a competitor’s assortment mix can appear daunting. Include dynamically changing product assortments and different product taxonomies into the standard research mix, and many who lack access to automated competitive intelligence systems find themselves struggling to find the expertise required to gather and summarize this information in an actionable form.

    3. Customer Centricity

    Today, customers demand to be heard. As competitive pricing becomes an expected cost of doing business, retailers will need to place greater support resources and more effective processes to resolve customer problems and complaints in a timely fashion at the heart of their customer service model.

    Following the online social revolution, 9 out of 10 retail customers now expect a consistent response across all social media channels.

    Successful companies like Zappos, Best Buy and Amazon have been quick to understand this significant shift in customer preferences. These retailers have demonstrated their willingness to go the extra mile by establishing a robust, scalable omni-channel support structure.

    The level of this commitment can be seen in Amazon’s recent vision statement announcement, “Amazon today boasts of one of the most responsive omni-channel customer support and Zappos takes pride in sending a personalized response to customer queries. We seek to become Earth’s most customer centric company.” This aggressive customer centric sentiment drives a stake in the ground for all competing eCommerce companies’ to match via their customer service strategy.

    4. Superior Customer Experience

    While bricks and mortar retail stores continue to attract customers by enabling shoppers to touch, feel and test items before they purchase, online and omni-channel retailers have channelized their efforts into increasingly refining their web user experience.

    Several studies reveal it takes only a couple of seconds for a website visitor to decide whether to stay on or leave a website. Aspects such as visual design, ease of use, content attractiveness, website loading time and pervasive calls to action (CTA) are a few of the key user experience parameters that influence visitors to stay on a website.

    eCommerce sites such as Zara, Graze, Asos, and Amazon offer attractively organized and clutter-free designs, which are visually engaging and easy to navigate. While these design elements help them keep their customers engaged, it’s their disciplined focus on content that stimulates visitor conversions.

    Detailed product descriptions and high-quality images are helping these eCommerce sites educate their customers about their products while simultaneously boosting their website’s SEO ranking, helping it attract and engage still more online visitors.

    Complementing the online retailing revolution are substantial efforts by omni-channel retailers to optimize O2O (online to offline) strategies designed to bring together the best of both worlds — the discoverability of online, with the touch-and-feel of an offline environment.

    5. Optimized Promotional Strategies

    With so many options for a shopper to choose from in an increasingly cluttered and competitive online retailing environment, attracting new customers and entrenching customer loyalty is an ongoing challenge. Strategic online promotions are emerging as an effective technique in solving the customer recruitment and retention dilemma. Online promotions if executed effectively are doing wonders for generating inbound website traffic.

    However, for online promotions to be effective, it is critical for e-retailers to understand their competitor’s strategy if they are going to be able to sustain their competitiveness. Key questions to answer in this context are, what brands are they promoting more than others? For how long? At what frequency?

    Keeping a keen eye on and reacting to competitors’ promotions is a key aspect to designing effective online promotions. Being able to exploit this competitive intelligence not only boosts their own sales volumes but erodes that of their competitors as well.

    Competitive Intelligence As A Service

    Having understood the far-reaching impact of these evergreen drivers of eCommerce success, we at DataWeave work with omni-channel and online retailers to provide Competitive Intelligence as a Service and help them evaluate and optimize their strategic approach across the eCommerce landscape.

    If you’re interested in DataWeave’s solutions and would like to learn more about how we help retailers and brands optimize their retail strategies, visit our website!

  • Festive Season Sale: Who’s Winning the Great Indian eCommerce Battle?

    Festive Season Sale: Who’s Winning the Great Indian eCommerce Battle?

    In the lead up to October’s Diwali celebrations, almost all major Indian e-retailers had announced mammoth sale events for last week. Resuming the epic battle of India’s online shopping carts during festival seasons, Flipkart, together with Jabong and Myntra, kicked off their five-day-long “Big Billion Days” sales on September 20, while Amazon India‘s “Great Indian Festival” launched the next day.

    The stakes were high as Amazon and Flipkart are more evenly matched this year than ever before, making predicting an eventual winner of these dueling discounters a lot tougher than in previous years.

    At DataWeave, our proprietary data aggregation and analysis platform enabled us to easily assess which e-retailer offered better deals and discounts. Over the last two weeks, we have been consistently monitoring the prices of the top 200 ranked products in Amazon, Flipkart, Myntra, and Jabong, across several sub-categories of Electronics, Men’s Fashion, and Women’s Fashion, encompassing over 35,000 products in total.

    Divergent Discount Strategies

    In our analysis, we bring focus to the additional discounts offered by competing e-retailers during the sale, compared to prices before the sale. This is key, as today’s shoppers often encounter deep discounts on several products even on normal days, which could potentially dampen the value suggested by the large discounts advertised during the sale.

    Based on our analysis, Flipkart clearly adopted a more aggressive pricing strategy this year, establishing a lead over Amazon in average discount percentage for Electronics and Women’s Fashion. Moreover, Flipkart launched additional discounts on a larger number of products across categories. Amazon, though, offered 6.9 percent additional discounts on smartphones compared to Flipkart (6.2 percent), led by 10.7 percent discount on Apple and 7.7 percent discount on Redmi smartphones.

    Flipkart has already reported a doubling of revenue from the sale (which includes sales volumes of Myntra and Jabong) compared to last year, and claimed it accounted for 70 percent of eCommerce sales during these five days — beating Amazon by a considerable margin. Amazon, for its part, reported a “2.5X growth in smartphone sales, 4X increase in large appliances and 7X in fashion sales.”

    The difference in discounting strategies between Amazon and Flipkart is starkly illustrated by their respective highest discounts. Flipkart led the way with a 65.5 percent discount on Vero Moda skirts, a 65 percent discount on Tommy Hilfiger skirts, and 50 percent off Calvin Klein sunglasses.

    By contrast, Amazon’s greatest discounts were an 83.4 percent discount on Redfoot formal shoes, 45.5 percent on Motorola Tablets, a 40 percent on US Polo T-shirts, and a 25.1 percent discount on Puma sports shoes.

    Also, Flipkart hosted a more premium range of products in its assortment compared to Amazon, evidenced by a higher average MRP for its discounted products. Surprisingly, Amazon’s spread of discounted products has the least average MRP in Electronics and Women’s Fashion, compared to all other competitors.

    New Products Break Through the Top 200

    What’s fascinating in this battle of the e-retail giants is the correlation we uncovered between prices and rank. During the sale, as prices dropped on hundreds of products across the board, newer products successfully broke through into the Top 200 ranks for each sub-category. New products in the top 200 ranks had higher discount levels than the ones they replaced.

    This trend was especially pronounced in fashion, where we observed an almost complete overhaul of products filling the Top 200 during the sale period, led by sports shoes in Amazon, Men’s shirts in Flipkart, and Men’s formal shirts in Jabong.

    What About Pre-Sale Prices?

    Another angle we explored was whether (like most of us suspect) e-retailers increase their prices before a sale, only to reduce them during the sale, so they can advertise higher discounts. We observed that all e-retailers did increase their prices for an albeit small set of products before the sale.

    While the number of products where the prices increased for each website prior to the sales is small, it is interesting to observe that certain brands choose to perform the oldest trick in the retail book even today — raising prices to accentuate the degree of discount during the sale period, something shoppers need to keep an eye out for.

    A Sign of Things to Come?

    Based on our analysis, Flipkart has recognized the threat from Amazon and has approached this year’s “Big Billion Days” sale aggressively. It has dug deep into its freshly funded pockets, and offered better discounts for a larger set of products across most categories, in its attempt to lock down a greater market share in the burgeoning Indian eCommerce space.

    Amazon, though, has continued to maintain a firm grip on the Indian consumer, having achieved tremendous growth in specific categories during the sale.

    What’ll be interesting now is to see how these pricing strategies impact company revenues and margins, and how this will shape the soon-to-follow Diwali sales in mid-October.

    If you’re intrigued by DataWeave’s data aggregation and analysis technology, and would like to learn more about how we help retailers and brands build and maintain a competitive edge, please visit our website.


  • The Role of Competitive Intelligence in Modern Retail

    The Role of Competitive Intelligence in Modern Retail

    When retailers today look to compete in the cutthroat world of online commerce, they face several challenges unique to the nature of modern retail. It is now significantly harder for retailers to benchmark their pricing, assortment, and promotions against their competition, as the online world is highly dynamic and significantly more complex than before.

    Trends like the growing adoption of mobile shopping apps, the rising influence of customer reviews in buying behavior, hyperlocal e-commerce websites differentiating themselves by fulfilling deliveries in a matter of hours — the list goes on — have only added to this complexity.

    However, this complexity also presents an opportunity for retailers to incorporate layers of external competitive information into their merchandising strategies to deliver more value to customers and personalize their experience.

    Vipul Mathur, Chief Branding and Merchandising Officer at Aditya Birla Online Fashion, recently published an article highlighting some of the areas in which Competitive Intelligence providers like DataWeave can strategically influence modern merchandising.

    “The consumer is often driven by the aesthetics of a product, more so in the fashion and lifestyle industries than others. Hence, the choices of buyers are hard to interpret. However, innovative modern technologies are helping us understand these decisions,” says Vipul.

    He provides an example of how using AI-based tools (like DataWeave’s) to unearth the sentiments behind thousands of online reviews can help retailers better channel and message their online promotions.

    “Deciphering the consumers’ comments and converting them into tangible insights is incredible proof of the refinement possible with data analysis tools. It’s like knowing that consumers are delighted by the quality of the soles of a pair of Adidas running shoes. Using this, marketing communication can be modified to highlight this specific product feature,” explains Vipul.

    And it’s not just merchandising. This data can percolate across multiple functions in retail, enabling greater efficiency in operations. “If we have data on the best-selling styles across websites, including other attributes like pricing, region/locality (through pin-code mapping), and possibly even rate of sales, it’s up to our supply-chain systems to ensure that the supply is in accordance with demand.”

    DataWeave’s Retail Intelligence offers global retailers and e-commerce websites with these benefits and more. Our AI-powered technology platform aggregates and analyzes vast volumes of online competitive data and presents them in an easily consumable and actionable form, aiding quick, data-driven merchandising decisions.

    “DataWeave, our partner, has helped us refine our merchandising decisions, saving cost and creating value,” sums up Vipul.

    Read the entire article here, and if you’re intrigued by what DataWeave can do for retail businesses and wish to learn more, visit our website!


  • Video: Using Product Images to Achieve Over 90% Accuracy in Matching E-Commerce Products

    Video: Using Product Images to Achieve Over 90% Accuracy in Matching E-Commerce Products

    Matching images is hard!

    Images, intrinsically, are complex forms of information, with varying backgrounds, orientations, and noise. Developing a reliable system that achieves human-like accuracy in identifying, interpreting, and comparing images, without investing in expensive resources, is no mean task.

    For DataWeave, however, the ability to accurately match images is fundamental to the value we provide to retailers and consumer brands.

    Why Match Images?

    Our customers rely on us for timely and actionable insights on their competitors’ pricing, assortment, promotions, etc. compared to their own. To enable this, we need to identify and match products across multiple websites, at very large scale.

    One might hope to easily match products using just the product titles and descriptions on websites. However, therein lies the rub. Text-based fields are typically unstructured, and lack consistency or standardization across websites (especially for fashion products). In the following example, the same Adidas jacket is listed as “Tiro Warm-Up Jacket, Big Boys (8–20)” on Macy’s and “Youth Soccer Tiro 15 Training Jacket” on Amazon.

    Hence, instead of using text-based information, we considered using deep-learning techniques to match the images of products listed on e-commerce websites. This, though, requires massive GPU resources and training data fed into the deep-learning model — an expensive proposition.

    The solution we arrived upon, was to complement our image-matching system with the text-based information available in product titles and descriptions. Analyzing this combination of both text- and image-based information enabled us to efficiently match products at greater than 90% accuracy.

    How We Did It

    A couple of weeks ago, I gave a talk at Fifth Elephant, one of India’s renowned data science conferences. In the talk, I demonstrated DataWeave’s innovation of augmenting the NLP capabilities of Solr (a popular text search engine) with deep-learning features to match images with high accuracy.

    Check out the video of the presentation for a detailed account of the system we built:

    Human-Aided Machine Intelligence

    All products matched with the seed product are tagged with a corresponding confidence score. When this score crosses a certain threshold, it’s presumed to be a direct match. The ones that are part of a lower range of confidence scores are quickly examined manually for possible direct matches.

    The outcome, therefore, is that our technology narrows down the consideration set of possible product matches from a theoretical upper limit of millions of products, to only a few tens of products, which are then manually checked. This unique approach has two distinct advantages:

    • The human-in-the-loop enables us to achieve greater than 90% accuracy in matching millions of products — a key differentiator.
    • Information on all manually matched products is continually fed to the deep-learning model, which is used as training data, further enhancing the accuracy of the product matching mechanism. As a result, both our accuracy and delivery time keep improving with time.

    As the world of online commerce continues to evolve and becomes more competitive, retailers and consumer brands need the ability to make quick proactive and reactive decisions, if they are to stay competitive. By building an automated self-improving system that matches products quickly and accurately, DataWeave enables just that.

    Find out more about how retailers and consumer brands use DataWeave to better understand their competitive environment, optimize customer experience, and drive profitable growth.

  • Was Amazon’s Prime Day Sale Really That Big a Deal?

    Was Amazon’s Prime Day Sale Really That Big a Deal?

    Hint: Only in some product categories

    Amazon’s Prime Day sale, the first-of-its-kind in India, made a conspicuous splash across the media a couple of weeks ago, with several stories of the sale’s dramatic success doing the rounds. For 30 hours spread over 10th and 11th of July, the online retail giant rolled out deals as frequently as every five minutes, exclusively for Amazon Prime subscribers. And online shoppers lapped it up.

    According to Amazon India, more customers signed up for Prime on the day of the sale and in the week leading up to it, than on any other month since Prime’s launch in India last year. To boot, Prime subscribers shopped three-times more during the sale compared to other days.

    The discounts offered on several products were quite frequently in the range of 60–70% and beyond, with some products reaching absurd discount levels of up to 85%. However, for a retailer as competitively priced as Amazon, what’s interesting to explore is how much additional discount was offered during the sale. After all, even on normal days, Amazon discounts aggressively on its top 20% selling SKUs, in order to reinforce the commonly held perception that the company is the lowest priced retailer around.

    More Than Meets the Eye

    At DataWeave, our AI-based technology platform aggregates and analyzes publicly accessible data on the Web, at large scale, to deliver insights on competitors to retailers and consumer brands. We collected pricing and discount information for the Electronics and Fashion categories on Amazon during the sale, and compared it to numbers from before the sale. Thus, we evaluated just how much additional value Prime subscribers could’ve potentially drawn from this sale.

    We performed a similar analysis on Flipkart as well, to examine how competing e-commerce websites react to big-ticket sale events.

    The infographic below lists out some of the more interesting bits of our analysis.

    Unsurprisingly, Amazon strengthened its grip in the electronics category by offering, on average, 3.9% higher discount than Flipkart, even with a higher-value assortment mix. Subsequently, Amazon reported a 5X increase in sales of smartphones and an 8X increase in sales of televisions during Prime Day.

    While Apple discounted its phones by 8.5% during the sale, Sanyo was among the top discounting brands (10%) in Televisions, with the company reporting a 4X jump in television sales. TCL offered 20% additional discount, the highest for televisions.

    What stands out from this analysis, though, is that Flipkart beat Amazon on price definitively in the fashion for women category, by extending 6.8% more discount than Amazon on a significantly higher-value assortment mix.

    It’s not uncommon to see e-commerce companies lowering their prices across the board to take advantage of the hype surrounding a competing e-commerce website’s promotional activity. Clearly, it’s a good idea for shoppers to always compare prices across websites before buying any product online.

    The New Age of Retail

    That shoppers today can easily compare products and prices across different e-commerce websites has brought about greater competition among online retailers. With the consequent margin pressure, comes the need for retailers to be able to react to price changes by their competitors in near-real-time.

    And it’s no mean task. Amazon has been found to effect over 80 million price changes a day during holiday season, and retailer-driven sale events like the Prime Day Sale are here to stay. Consequently, retailers look to Competitive Intelligence providers like DataWeave for easily consumable competitive information that enables them to react effectively and compete profitably.

    DataWeave’s AI-powered technology platform aggregates, compiles, and presents millions of data points to provide e-commerce companies with actionable competitive insights. With our solutions, retailers can effect profitable price changes, implement high-value assortment expansion, and proactively monitor and respond to promotional campaigns by competitors.

    Find what we do interesting? Visit our website to find out more about how modern retailers benefit from using DataWeave’s Competitive Intelligence as a Service.

  • Implement a Machine-Learning Product Classification System

    Implement a Machine-Learning Product Classification System

    For online retailers, price competitiveness and a broad assortment of products are key to acquiring new customers, and driving customer retention. To achieve these, they need timely, in-depth information on the pricing and product assortment of competing retailers. However, in the dynamic world of online retail, price changes occur frequently, and products are constantly added, removed, and running out of stock, which impede easy access to harnessing competitive information.

    At DataWeave, we address this challenge by providing retailers with competitive pricing and assortment intelligence, i.e. information on their pricing and assortment, in comparison to their competition’s.

    The Need for Product Classification

    On acquiring online product and pricing data across websites using our proprietary data acquisition platform, we are tasked with representing this information in an easily consumable form. For example, retailers need product and pricing information along multiple dimensions, such as — the product categories, types, etc. in which they are the most and least price competitive, or the strengths and weaknesses of their assortment for each category, product type, etc.

    Therefore, there is a need to classify the products in our database in an automated manner. However, this process can be quite complex, since in online retail, every website has its own hierarchy of classifying products. For example, while “Electronics” may be a top-level category on one website, another may have “Home Electronics”, “Computers and Accessories”, etc. as top-level categories. Some websites may even have overlaps between categories, such as “Kitchen and Furniture” and “Kitchen and Home Appliances”.

    Addressing this lack of standardization in online retail categories is one of the fundamental building blocks of delivering information that is easily consumable and actionable.

    We, therefore, built a machine-learning product classification system that can predict a normalized category name for a product, given an unstructured textual representation. For example:

    • Input: “Men’s Wool Blend Sweater Charcoal Twist and Navy and Cream Small”
    • Output: “Clothing”
    • Input: “Nisi 58 mm Ultra Violet UV Filter”
    • Output: “Cameras and Accessories”

    To classify categories, we first created a set of categories that was inclusive of variations in product titles found across different websites. Then, we moved on to building a classifier based on supervised learning.

    What is Supervised Learning?

    Supervised learning is a type of machine learning in which we “train” a product classification system by providing it with labelled data. To classify products, we can use product information, along with the associated category as label, to train a machine learning model. This model “learns” how to classify new, but similar products into the categories we train it with.

    To understand how product information can be used to train the model, we identified what data points about products we can use, and the challenges associated with using it.

    For example, this is what a product’s record looks like in our database:

    {
    “title”: “Apple MacBook Pro Retina Display 13.3” 128 GB SSD 8 GB RAM”,
    “website”: “Amazon”,
    “meta”: “Electronics > Computer and Accessories > Laptops > Macbooks”,
    “price”: “83000”
    }

    Here, “title” is unstructured text for a product. The hierarchical classification of the product on the given website is shown by “meta”.

    This product’s “title” can be represented in a structured format as:

    {
    “Brand”: “Apple”,
    “Screen Size”: “13.3 inches”,
    “Screen Type”: “Retina Display”,
    “RAM”: “8 GB”,
    “Storage”: “128 GB SSD”
    }

    In this structured object, “Brand”, “Screen Size”, “Screen Type” and so on are referred to as “attributes”. Their associated items are referred to as “values”.

    Challenges of Working with Text

    Lack of uniformity in product titles across websites –

    In the example shown above, the given structured object is only one way of structuring the given unstructured text (title). The product title would likely change for every website it’s represented on. What’s worse, some websites lack any form of structured representation. Also, attributes and values may have different representations on different websites — ‘RAM’ may be referred to as ‘Memory’.

    Absence of complete product information –

    Not all websites provide complete product information in the title. Even when structured information is provided, the level of detail may vary across websites.

    Since these challenges are substantial, we chose to use unstructured titles of products as training inputs for supervised learning.

    Pre-processing and Vectorisation of Training Data

    Pre-processing of titles can be done as follows:

    • Lowercasing
    • Removing special characters
    • Removing stop words (like ‘and’, ‘by’, ‘for’, etc.)
    • Generating unigram and bigram tokens
    • We represented the title as a vector using the Bag of Words model, with unigram and bigram tokens.

    The Algorithm

    We used Support Vector Machine (SVM) and compared the results with Naive Bayes Classifiers, Decision Trees and Random Forest.

    Training Data Generation

    The total number of product data we’ve acquired runs into the hundreds of millions, and every category has a different number of products. For example, we may have 40 million products in “Clothing” category but only 2 million products in the “Sports and Fitness” category. We used a stratified sampling technique to ensure that we got a subset of the data that captures the maximum variation in the entire data.

    For each category, we included data from most websites that contained products of that category. Within each website, we included data from all subcategories and product types. The size of the data-set we used is about 10 million, sourced from 40 websites. We then divided our labelled data-set into two parts: training data-set and testing data-set.

    Evaluating the Model

    After training with the training dataset, we tested this machine-learning classification system using the testing dataset to find the accuracy of the model.

    Clearly, SVM generated the best accuracy compared to the other classifiers.

    Performance Statistics

    • System Specifications: 8-Core system (Intel(R) Xeon(R) CPU E3–1231 v3 @ 3.40GHz) with 32 GB RAM
    • Training Time: 90 minutes (approximately)
    • Prediction Time: Approximately 6 minutes to classify 1 million product titles. This is equivalent to about 3000 titles per second.

    Example Inputs and Outputs from the SVM Model (with Decision Values)

    • Input: “Washing Machine Top Load”

    Output: {“Home Appliances”: 1.45, “Home and Living”: 0.60, “Tools and Hardware”: 0.54}

    • Input: “Nisi 58 mm Ultra Violet UV Filter”

    Output: {“Cameras and Accessories”: 1.46, “Eyewear”: 1.14, “Home and Living”: 1.12}

    • Input: “NETGEAR AirCard AC778AT Around Town Mobile Internet — Mobile hot”

    Output: {“Computers and Accessories”: 0.82, “Books”: 0.61, “Toys”: 0.27}

    • Input: “Nike Sports Tee”

    Output: {“Sports and Fitness”: 1.63, “Footwear”: 0.63, “Toys and Baby Products”: 0.59}

    Largely, most of the outputs were accurate, which is no mean feat. Some incorrect outputs were those of fairly similar categories. For example, “Home and Living” was predicted for products that should have ideally been part of “Home Appliances”. Other incorrect predictions occurred when the input was ambiguous.

    There were also scenarios where the output decision values of the top two categories were quite close (as shown in the third example above), especially when the input was vague. In the last example above, the product should have been classified as “Clothing”, but got classified as “Sports and Fitness” instead, which is not entirely incorrect.

    Delivering Value with Competitive Intelligence

    The category classifier elucidated in this article is only the first element of a universal product organization system that we’ve built at DataWeave. The output of our category classification system is used by other in-house machine-learning and heuristic-based systems to generate more detailed product categories, types, subcategories, attributes, and the like.

    Our universal product organization system is the backbone of the Competitive Pricing and Assortment Intelligence solutions we provide to online retailers, which enable them to evaluate their pricing and assortment against competitors along multiple dimensions, helping them compete effectively in the cutthroat eCommerce space.

    Click here to find out more about DataWeave’s solutions and how modern retailers harness the power of data to drive revenue and margins.

  • Advantage Flipkart: The Motives Behind Acquiring eBay India

    Advantage Flipkart: The Motives Behind Acquiring eBay India

    Flipkart recently acquired eBay’s India business in an announcement that made a huge splash across the country. With Flipkart already having acquired Myntra and Jabong, and talks of a Snapdeal acquisition picking up steam, this level of consolidation comes clearly as a direct response to internet behemoth Amazon’s aggressive expansion strategies in India.

    With this acquisition play, Flipkart stands to gain primarily on two fronts.

    eBay’s Seller Network

    Firstly, eBay has built a strong network of authorized and highly-rated global sellers, something that Flipkart can leverage to drive increased sales and market share.

    Per Flipkart’s announcement to the press — “Flipkart and eBay have signed an exclusive cross-border trade agreement, as a result of which customers of Flipkart will gain access to the wide array of global inventory on eBay, while eBay’s customers will have access to unique Indian inventory provided by Flipkart sellers. Thus, sellers on Flipkart will now have an opportunity to expand their sales globally.”

    At DataWeave, we ran our proprietary data aggregation and analysis algorithms over eBay’s websites and unearthed some interesting numbers about their seller network.

    eBay.com has a global network of 17,361 sellers, 41% of whom ship to India. Therefore, this acquisition opens the door for Flipkart to gain access to over 7000 global eBay.com sellers who ship to India — a huge boost to the range of products Flipkart can host on its platform.

    Additionally, a sizable chunk — 14% — of eBay.in sellers ship to international destinations. This provides Flipkart with opportunities to expand its reach globally.

    The other, rather lesser known advantage that Flipkart stands to gain from this acquisition is in the refurbished and pre-owned goods space.

    The Emergence of Refurbished and Pre-Owned Goods

    The market for refurbished and pre-owned products is estimated to be between $15 billion and $20 billion globally, with exponential growth forecast for the near future.

    Part of the reason for growth in this segment is it yields higher returns on investment for retailers. While a retailer typically earns 3–5% margin by selling a new smartphone, refurbished smartphones fetch 7–8% margin, and pre-owned smartphones 9–10%.

    The Hidden Advantage

    eBay has established itself over the years as a reliable source of refurbished and pre-owned products, with impressive levels of authentication and warranties. We did a quick analysis of eBay.in, Flipkart, and Amazon to identify their relative strengths in this space.

    Unsurprisingly, Flipkart has close to zero refurbished or pre-owned products hosted on their website. With Amazon, 12% of mobile phones and 9% of Books on their website are refurbished or pre-owned, the largest selling categories in this space.

    eBay.in, though, has a significant share of these products across categories — 95% of books & magazines, 36% of mobile phones, and 28% of televisions — a substantial portion of eBay’s business.

    With this acquisition, Flipkart can now take a gigantic step into the relatively more profitable and exponentially growing refurbished and pre-owned products space. It will also be a strong competitive differentiator for the company as they go head to head with Amazon in India.

    While the refurbished and pre-owned goods space poses a series of advantages for retailers, it sits well with consumer preferences as well, drawing more shoppers, and retaining existing ones.

    Influence of Shopping Behavior on Product Assortment

    Refurbished and pre-owned products provide consumers with attractive alternatives, both in terms of price and variety. Shoppers today explore and research new, pre-owned and refurbished products, all at the same time, and compare prices across e-commerce websites before deciding on a purchase.

    As a result, comprehensive product assortments across price ranges and attributes drive higher engagements, traffic and improve customer conversion and retention rates, as they cater to a more diverse set of consumers.

    For modern retailers, this reinforces the importance of investing in tools that enable to them to identify high-value gaps in their assortment and plug them. To achieve this, they need up-to-date, accurate data, at scale, on the assortments of their competitors.

    DataWeave’s Assortment Intelligence solution is designed to give retailers near-real-time insights on competing retailers’ product mix and suggests product additions to retailer catalogs.

    Click here to know more about how Assortment Intelligence can help your retail business manage assortment efficiently and profitably.


  • Dissonance in Online MRP Prices Across Retailers | DataWeave

    Dissonance in Online MRP Prices Across Retailers | DataWeave

    We all know, online shopping offers a lot of benefits to shoppers. Apart from the convenience it offers access to a wide-assortment base and, of course, discounts are an added benefit. Often we see, retailers claiming large discounts on products.

    Many-a-time, the percentage discount that is mentioned drives price perception. Customers when comparing prices across stores view larger percentage discounts as a better deal. However, this is not necessarily the case. To present this case, let us look into how discounts are calculated:

    Percentage discounts are a function of the MRP / MSRP and the Selling Price. The MRP / MSRP is set by the manufacturer and the selling price is more often than not determined by the retailer.

    Selling price of products being different across retailers is a well-known fact. When the MRP of the same products tend to vary across retailers, it gets confusing for a customer, which in turn leads to a brand equity dilution of the brand or manufacturer.

    To analyse how deep this discord is, we decided to dive deeper into its working dynamics. Amongst all the data that we aggregate at DataWeave, analysing discounts of the same product across retailers gives us the ability to discern pricing strategies of retailers. We used this dataset to monitor and analyse MRPs.

    What we found

    1. We analysed MRPs of around 400 brands across 10 categories. Around 44% of products in these brands have no variance in MRPs across retailers

    2. This also means there is a variance in 56% of products

    3. Products in the ‘Mobile Phones and Tablets’ category have the most price variance; 65% of the products have price variance

    4. Fashion and Fashion accessories have the least price variance; around 20%

    5. Brands having the most variance:

    6. Brands having the least variance:

    What are the implications of the above insights?

    1. Brands & manufacturers need to be aware of how their brand products are being represented and sold online
    2. Consumers shopping online need to look at end prices, and not focus on the discount percentage, before making a purchase-decision on a particular store

    This article was previously published on Yourstory

    DataWeaves Brand Intelligence provides consumer brands with the ability to track their products, pricing, discoverability vis-a-vis their competitors across e-commerce platforms.

  • Smart Practices for Pricing Products

    Smart Practices for Pricing Products

    Top pricing strategies for online retailers

    “When it comes to retail markets, law of one price is no law at all” — Hal Varian

    Hal Varian, in his seminal paper “A Model of Sales”, further remarks that most retail markets are instead characterized by a rather large degree of price dispersion.

    Do you know how much your products are worth? How low are you willing to price an item to compete with another ecommerce retailer?

    Today, online retail has become increasingly competitive. If you are priced higher than your competitors, you may end up losing customers who are sensitive to prices. With the advent of highly competitive pricing tools, winning the online pricing war is an uphill task. Having a differentiated competitive strategy is critical to your e-commerce success.

    We bring to you a list of smart practices that we have seen being played out across online retailers in 10 countries that we actively monitor and analyze.

    Analyzing Competitor Prices And Stock Availability

    Product pricing is one of the largest driver of profitability. So you know who your main competitors are, but do you know how they are priced? Compare prices and stock availability of products that are popular across all your competitors and do the same for products that are popular at your store. If you know that certain products are “not in stock”, you know you need not discount. Look at products that are popular across competition and know your price position. Try for an opportunity to increase prices without losing your price position. However, for products popular on your store, you may want to stay competitive.

    Knowing Price Variations

    You get the right price, and then it’s not right anymore. That’s the story of online retail. But when you are equipped with the knowledge of price variations on popular marketplaces, it gives you an idea of where the market is heading. This, in turn, will help you adjust your prices to get the consumers. For instance, Amazon changed prices of more than 50% of their products in Hair Care category more than once in a week including ~20% of the products at least 4 times in the same week.

    Product Bundling

    A marketer of a successful product may bundle a new or less successful product with its stronger product to edge its way into a new market. This allows you to charge a unique, competitive price that can’t be copied by others. If you realize that you may not be able to compete on direct discounts, bundle products together and offer them at a lower price. You can either bundle in multiples of the same product or pack different products together. One of the more famous examples of this is Microsoft’s bundling of various software applications. In the onsite retail space, for example, on a particular day we noticed ~400+ combo offers from SnapDeal in the camera & accessories category whereas PayTM has ~200+ combo offers and Amazon has ~3000+ combo offers in the same category. Similarly, in hair care category we observed significant variance in combo offers across marketplaces (~900+ by Amazon, ~250+ by PayTM and ~100 by SnapDeal on a specific day). We also noticed that marketplaces have varied number of products sold in packs across different brands (~2500 in Amazon, ~800+ in PayTM and ~500 in Snapdeal on a specific day).

    Shipping Fees & Delivery Time

    Free shipping attracts customers to e-commerce platforms like a moth to a flame. Monitor shipping fees across competition for products you are interested in. There will be cases where your competitor is pricing a product at a lower price than you, but does not offer free shipping. That is your signal to promote your platform.

    Price Match Guarantees

    Price match is an easy way for customers to save money on their day-to-day purchases. During Black Friday sales in the US, a lot of popular stores go for the price match guarantee feature to drive sales. It’s a smart trick to let your customers show you the lowest price and then match them accordingly.

    No Discounts On Unique Products

    No matter how much you dress it up, cutting prices hurts. It might be unavoidable, but you can get rid of discounts on unique products. When you analyze gaps and strengths of your catalog and realize that there are products that are available only on your store, why would you need to provide discounts? So, for instance, it seems that only Flipkart is carrying Icon LaserJet Pro Black Toner currently and it is being sold at 75% discount. Unless the objective is to get rid of the inventory, this product could be priced higher. Another example is, Nikon Coolpix S1100PJ Point & Shoot Camera is out of stock with most of the key marketplaces. Hence if anyone gets this replenished, this should not be discounted. Similarly, unique brands in hair care category, say LeModish, is sold primarily on PayTM. So, PayTM could look at reducing discount for this brand.

    Don’t Price Above Market Rate

    Some retailers price products above the market rate (MRP / MSRP) so that they can show substantial discounts. But your customers are smart and research well. If they realize that this is not really ‘low price’, you may end up losing them.

    Dynamic Pricing

    This is one trend you should definitely follow. Constantly monitor competitor prices and drop or increase prices whenever you see an opportunity. This process is highly tech-driven, so ensure that you work with a vendor who provides the same or you have the in-house capability to do this in a sustained and scalable manner.

    There are multiple product strategies that have to be considered, including cross-border commerce and highly spread out markets like SEA where there exists a lot more C2C marketplaces. However, as with many things in ecommerce, one size does not fit all. Combine the powers of your service and price to drive your bottom line and emerge as an undisputed leader in the retail space.

    Note: This article has been previously published on Inc42 and on Indian Retailer.

    DataWeave Retail Intelligence provides competitive intelligence solution to retailers. DataWeave’s solution is both language and geography agnostic and is built for significant scale

  • Introducing the new PriceWeave

    Introducing the new PriceWeave

    PriceWeave provides Competive Intelligence for eRetailers, brands, and manufacturers. Competitive Intelligence helps businesses understand their competition better, take timely decisions, and increase sales. Our retail pricing intelligence tool serves the following major purposes:

    Compare: PriceWeave lets you access products from across any number of sources and organize them for a straightforward apples-to-apples comparison.

    Monitor: Our intuitive dashboards help you monitor prices, assortments, products, brands, and deals across competition on a daily basis.

    Discover: Discover gaps in your product catalog. Discover products that are unique to you. Discover new brands and categories your competitors have introduced. Find new competitors.

    Analyze: Get customized alerts and reports on anything that you want to track. Access historical pricing data to understand pricing strategies. Visualize data across facets at different levels of granularity.

    If you are an eRetailer, PriceWeave powers your sales, marketing, and analytics team with actionable data–for both day to day operations, as well as long term strategy. With retail pricing intelligence, an eRetailer can:

    • understand pricing opportunitiesand implement an effective pricing strategy
    • get pricing variation for the products you are tracking across competition
    • get apples-to-apples product comparison and historical pricing data
    • optimize assortment planningthrough assortment intelligence
    • continuously monitor product assortment width and depth
    • understand gaps in your (and your competition’s) product catalog
    • manage featured products and promotions
    • develop overall sales and marketing strategy
    • big picture as well multi-dimensional faceted views: price bands, discount bands, categories, brands, and features

    If you are a brand or a manufacturer who sell your products through retailers, PriceWeave helps you as well. A Brand (or a Manufacturer) can:

    • ensure brand equity
    • monitor MOP violations and discover unauthorized resellers
    • increase market penetration
    • track retailer assortment across competing brand products.
    • discover new retailers — new distribution channels
    • increase engagement with retailers as well as customers
    • get regular reports on availability, pricing, offers, and discounts

    In short, PriceWeave is a product that gives you all the data and tools to help you gain and sustain an edge over your competition.

    For a demo of the product do reach out to us at (contact@dataweave.com). You can sign up for a free evaluation at dataweave.com.

  • Benefits of Competitive Marketing Intelligence | DataWeave

    Benefits of Competitive Marketing Intelligence | DataWeave

    In the aggressive business of online retail every detail you know about your competitor gives you an edge over them. To help you stay ahead of your competition we have designed a series of blog posts that familiarize you with competitive intelligence and equip you to get maximum mileage out of competitive intelligence tools. This is the first post of the series.

    Let’s begin at the beginning.

    What is Competitive Intelligence?

    Competitive intelligence (CI) is the gathering of publicly-available information about an enterprise’s competitors and the use of that information to gain a business advantage.

    Competitive marketing intelligence helps managers and executives to make data-driven decisions both in the short term, as well as formulate medium to long term strategy.

    Why is Competitive Intelligence important?

    Competitive marketing intelligence is critical because it helps businesses stay ahead of the competition by:

    1. Augmenting one’s experience and instincts with hard data and analyses on a regular basis
    2. Delivering reasonable assessments of one’s own business vis-a-vis competitors’ businesses
    3. Identifying and alerting new business opportunities as well as threats
    4. Helping shape short term and long term strategies to grow and consolidate one’s business

    How does Competitive Intelligence help achieve the core objectives of retail business?

    Retail is a particularly competitive sector. Given the volume of transactions that happen in the retail sector, even a slight improvement in metrics has a huge impact. Thus, competitive Intelligence has a direct effect on the bottom line. It helps in the following ways:

    > Improve margins

    This is a result of optimized pricing of products. Knowing the competitors pricing goes a long way in pricing your products right and improving margins. With Competitive Intelligence on your side, you can take pricing decisions backed by data.

    > Reduce customer acquisition costs

    By improving your assortment mix more users looking for products that your site offers become your users. This helps reduce customer acquisition costs. This also helps in retaining existing customers

    > Optimize marketing spend

    Competitive Intelligence brings more clarity and sharper objectives for the marketing team. You get good indicators which products/categories your competitors are promoting, and which new brands/categories they have introduced. This helps streamline and optimize your market spend.

    This is where DataWeave comes in. DataWeave provides Competitive Intelligence for retailers, brands, and manufacturers. DataWeave is built on top of huge amounts of product data to provide features such as: pricing opportunities (and changes), assortment intelligence, gaps in catalogs, reporting and analytics, and tracking promotions, and product launches.

    DataWeave is powered by distributed data crawling and processing engines that enables serving millions of data points around products data refreshed on a daily basis. This data is presented through dashboards, notifications, and reports. PriceWeave brings the ability to use BigData in compelling ways to retailers.

    DataWeave lets you track any number of products across any categories against your competitors. If you wish to try this out, just book a free discovery call with us.

    In the next few posts, we will dig deeper into DataWeave and introduce its major features. We will also talk about how each of these features help you in improving your business metrics.

  • Why is Product Matching Difficult? | DataWeave

    Why is Product Matching Difficult? | DataWeave

    Product Matching is a combination of algorithmic and manual techniques to recognize and match identical products from different sources. Product matching is at the core of competitive intelligence for retail. A competitive intelligence product is most useful when it can accurately match products of a wide range of categories in a timely manner, and at scale.

    Shown below is PriceWeave’s Products Tracking Interface, one of the features where product matching is in action. The Products Tracking Interface lets a brand or a retailer track their products and monitor prices, availability offers, discounts, variants, and SLAs on a daily (or a more frequent) basis.


    A snapshot of products tracked for a large online mass merchant


    Expanded view for a product shows the prices related data points from competing stores

    Product Matching helps a retailer or a brand in several ways:

    • Tracking competitor prices and stock availability
    • Organizing seller listings on a marketplace platform
    • Discovering gaps in product catalog
    • Filling the missing attributes in product catalog information
    • Comparing product life cycles across competitors

    Given its criticality, every competitive intelligence product strives hard to make its product matching accurate and comprehensive. It is a hard problem, and one that cannot be complete addressed in an automated fashion. In the rest of this post, we will talk about why product matching is hard.

    Product Matching Guidelines

    Amazon provides a guideline to sellers about how they should write product catalog information in order to achieve a good product matching with respect to their seller listings. These guidelines apply to any retail store or marketplace platform. The trouble is, more often than not these guidelines are not followed, or cannot by retailers because they don’t have access to all the product related information. Some of the challenges are:

    • Products either don’t have a UPC code or it is not available. There are also non-standard products, unbranded products, and private label products.
    • There are products with slights variations in technical specifications, but the complete specs are not available.
    • Retailers manage a huge catalog of accessories, for instance Electronics Accessories (screen guards, flip covers, fancy USB drives, etc.).
    • Apparels and Lifestyle products often have very little by way of unique identifiers. There is no standard nomenclature for colors, material and style.
    • Products are often bundled with accessories or other related products. There are no standard ways of doing product bundling.

    In the absence of standard ways of representing products, every retailer uses their own internal product IDs, product descriptions, and attribute names.

    Algorithmic Product Matching using “Document Clustering”

    Algorithmic product matching is done using some Machine Learning, typically techniques from Document Clustering. A document is a text document or a web page, or a set of terms that usually occur within a “context”. Document clustering is the process of bringing together (forming clusters of) similar documents, and separating our dissimilar ones. There are many ways of defining similarity of documents that we will not delve into in this post. Documents have “features” that act as “identifiers” that help an algorithm cluster them.

    A document in our case is a product description — essentially a set of data points or attributes we have extracted from a product page. These attributes include: title, brand, category, price, and other specs. Therefore, these are the attributes that help us cluster together similar products and match products. The quality of clustering — that is how accurate and how complete the clusters are — depends on how good the features are. In our case, most of the times the features are not good, and that is what makes clustering, and in turn product matching, a hard problem.

    Noisy Small Factually Weak (NSFW) Documents

    The documents that we deal with, the product descriptions, are not well formed and so not readily usable for product matching. We at PriceWeave characterize them endearignly as Noisy Weak and Factually Weak (NSFW) documents. Let us see some examples to understand these terms.

    Noisy

    • Spelling errors, non-standard and/or incomplete representations of product features.
    • Brands written as “UCB” and “WD” instead of “United Colors of Benetton” and “Western Digital”.
    • Model no.s might or might not be present. A camera’s model number written as one of the following variants: DSC-WX650 vs DSCWX650 vs DSC WX 650 vs WX 650.
    • Noisy/meaningless terms might be present (“brand new”, “manufacturer’s warranty”, “with purchase receipt”)

    Small

    • Not much description. A product simply written as “Apple iPhone” without any mention of its generation, or other features.
    • Not many distinguishable features. Example, “Samsung Galaxy Note vs Samsung Galaxy Note 2”, “Apple ipad 3 16 GB wifi+cellular vs Apple ipad mini 16 GB wifi-cellular”

    Factually Weak

    • Products represented with generic and subjective descriptions.
    • Colours and their combinations might be represented differently. Examples, “Puma Red Striped Bag”, “Adidas Black/Red/Blue Polo Tshirt”.

    In the absence of clean, sufficient, and specific product information, the quality of algorithmic matching suffers. Product matching include many knobs and switches to adjust the weights given to different product attributes. For example, we might include a rule that says, “if two products are identical, then they fall in the same price range.” While such rules work well generally, they vary widely from category to category and across geographies. Further, adding more and more specific rules will start throwing off the algorithms in unexpected ways rendering them less effective.

    In this post, we discussed the challenges posed by product matching that make it a hard problem to crack. In the next post, we will discuss how we address these challenges to make PriceWeave’s product matching robust.

    PriceWeave is an all-around Competitive Intelligence product for retailers, brands, and manufacturers. We’re built on top of huge amounts of products data to provide real-time actionable insights. PriceWeave’s offerings include: pricing intelligence, assortment intelligence, gaps in catalogs, and promotion analysis. Please visit PriceWeave to view all our offerings. If you’d like to try us out request for a demo.

    Originally published at blog.priceweave.com.

  • How Colors Influence Consumer Buying Patterns | DataWeave

    How Colors Influence Consumer Buying Patterns | DataWeave

    Research shows that the colour of the clothes we wear significantly affect our day to day lives. For instance wearing black might help us appear powerful and authoritative at the workplace, while a red dress can make us look more attractive to a date. A yellow top might brighten up one’s day and a blue one land us a nifty bonus.

    Oftentimes buyers navigating the myriad nuances of current fashion look for help from friends, popular media and retailers themselves. Retailers, for their part, try to stay ahead of fashion trends by meticulously studying trends from magazines, keeping a close eye on competitors and wading through the chatter on social media and fashion blogs.

    Now that most of retail is metrics driven and becoming smarter by the day, we asked ourselves whether there is a more optimal way to analyse the influence of colors on customer buying decisions. Here’s how we went about doing it:

    Method:

    Thanks to the internet, a huge mine of valuable fashion data is available to us through e-commerce sites, brand Pinterest pages and fashion blogs, which regularly update their content streams with the newest fashion offerings. Data ranging from featured fashion of the current season including the complete product catalogue of brands as well as combinations of dresses that go together (even between brands) are all available for us to collect and analyse.

    By crawling these sites, pages and blogs periodically we can extract the colors on each of the images shared. This data is very helpful for any online/offline merchant to visualize the current trend in the market and plan out their own product offering. It is also possible to plot monthly data to capture the timeline of trends across different fashion websites.

    How is it Useful?

    Let us assess the applications made possible from this data. How would color analysis assist product managers, category heads and merchandising heads?

    1.Spotting current trends:

    Color analysis can spot current trends across brands and various filters. This gives decision makers the ability to gauge and respond to current trends and offerings. Some filters that can be used to analyse this are price, colors, categories, subcategories etc

    2.Predictive trends:

    Using historical color data future trends can be spotted with greater accuracy. With this data decision makers can stay ahead of the demands and the predictions of the market and gain a foothold on the ever changing nature of fashion.

    3.Assortment Analysis:

    Assortment Analysis can become more in depth and insightful with color analysis. Assortment comparisons of one’s offerings v/s competitor’s offerings can give a clear cut decision pointers on both one’s color offerings present and categories one can focus on to get ahead of the competition.

    4.Recommendations

    A strong recommendation feature is vital in driving up sales by offering the right products to buyers at the right time. Analysis of colors helps recommendations become smarter and more relevant. For instance, the algorithm can help understand what tops go with which jeans or which shirts go with what ties.

    Colours add a new dimension to current business analytics. Decision makers will be able to access enhanced analytics on existing products and compare across sources based on parameters such as price, categories, subcategories etc.

    Color Analysis in retail is largely unexplored and rife with possibilities. Doing it at scale presents a number of unique challenges that we are addressing. We’re excited to bring novel techniques and the power of large scale data analytics to retail.

    Color analysis will add to a retailer’s understanding of consumer buying patterns. This will help retailers sell better and improve profit margins. We are currently working on integrating this feature into PriceWeave so that our customers can do a comparative assortment analysis with color as an additional dimension.

    About Priceweave:

    PriceWeave provides Competitive Intelligence for retailers, brands, and manufacturers. We’re built on top of huge amounts of products data to provide features such as: pricing opportunities (and changes), assortment intelligence, gaps in catalogs, reporting and analytics, and tracking promotions, and product launches. PriceWeave lets you track any number of products across any number of categories against your competitors. If you’d like to try us out request for a demo.

    Originally published at blog.priceweave.com.