Just as with electronics, other retailers actually offered far better discounts than Amazon during Prime Day 2019.
Online furniture sales have risen significantly since the 2000s, driven largely by a growing array of products, and even more so by the convenience of avoiding travel and crowded stores. According to Statista, online furniture and homeware sales were estimated to reach approximately $190 billion in 2018, with China and the United States accounting for over $60 billion in revenue each.
Thus, furniture has quickly become a key product category during sale events globally – and Prime Day was no different. At DataWeave, we got down to figuring out exactly how plum those deals were this year.
Our Methodology
We tracked the pricing of several leading retailers selling home and furniture products to assess their pricing and product strategies during the sale events. Our analysis was focused on additional discounts offered during the sale to estimate the true value that the sale represented to its customers. We calculated this by comparing product prices on Prime Day versus the same prices prior to the sale. Our sample consisted of the top 1,000 ranked products across 10 popular product types, including beds, dining table sets, sofas, entertainment units, and coffee tables – analyzed for five retailers (Amazon, Home Depot, Target, Walmart, and Wayfair).
The Verdict
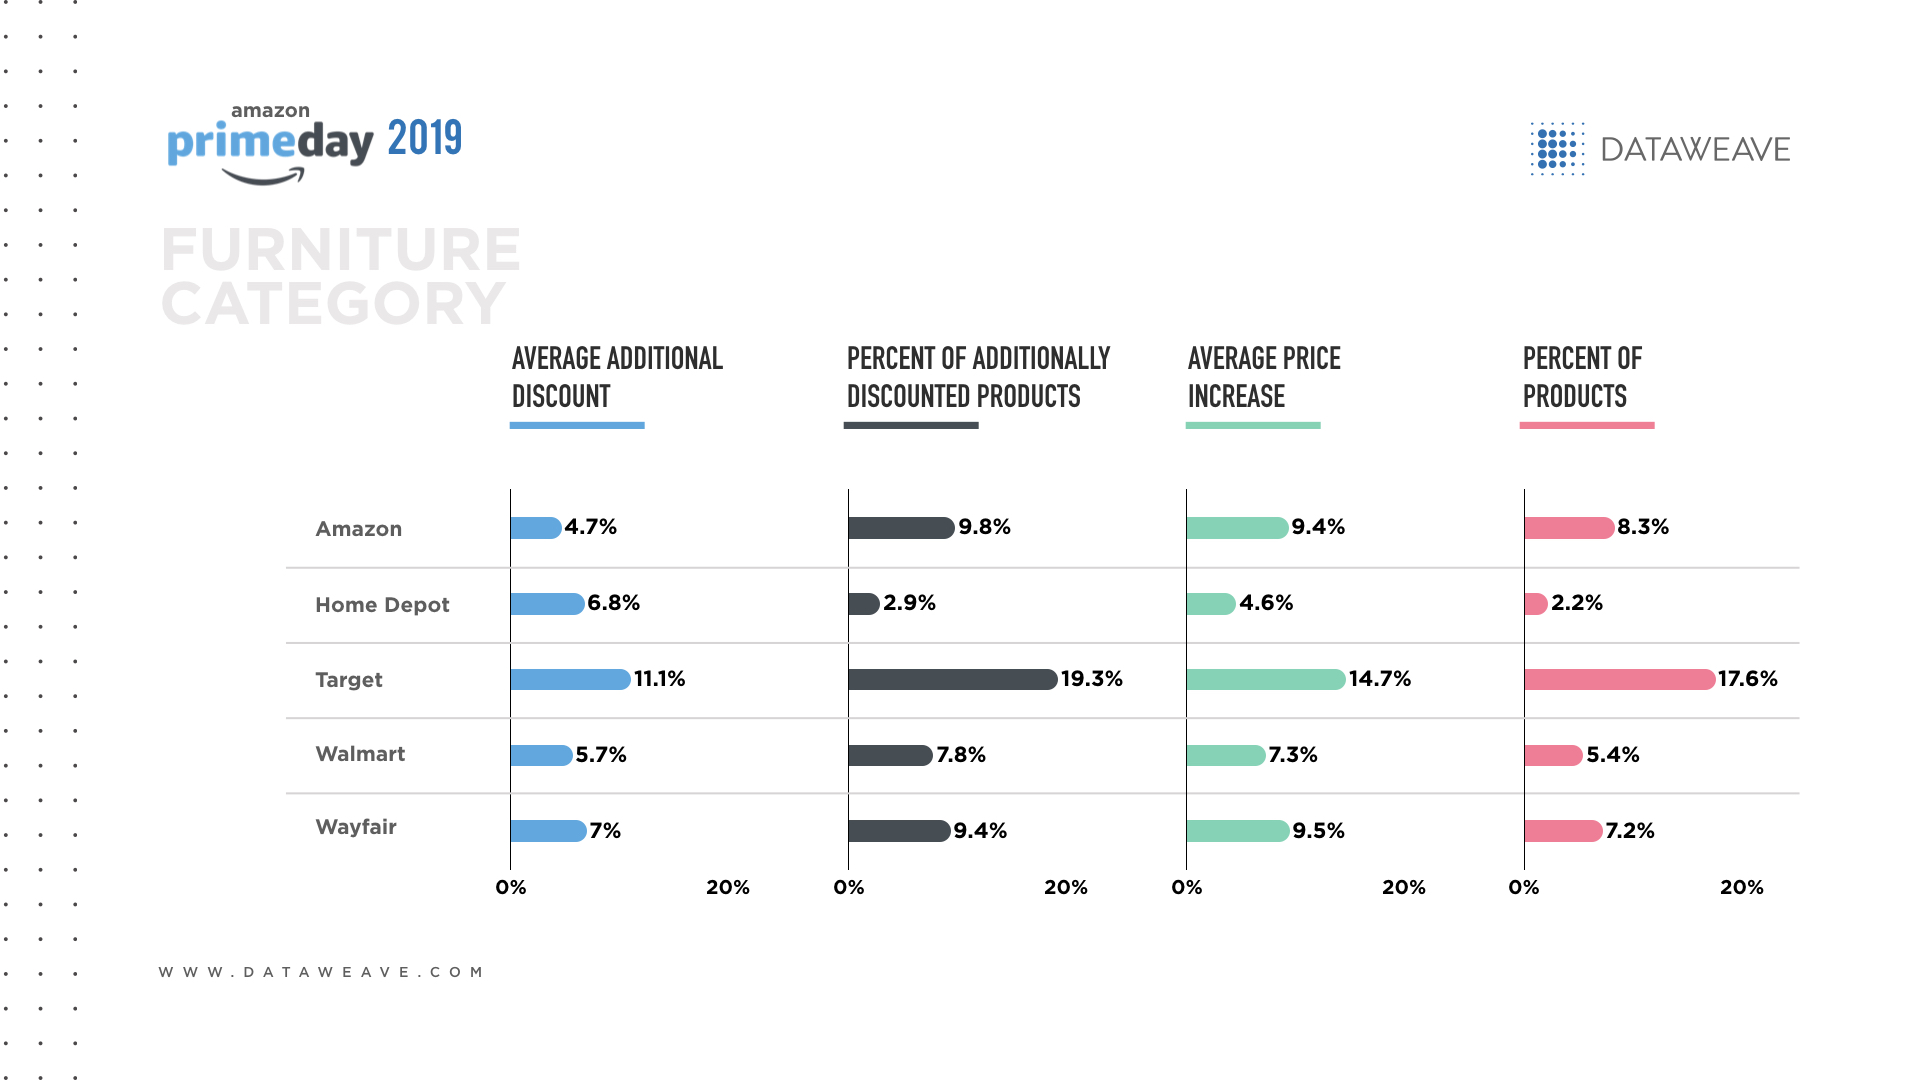
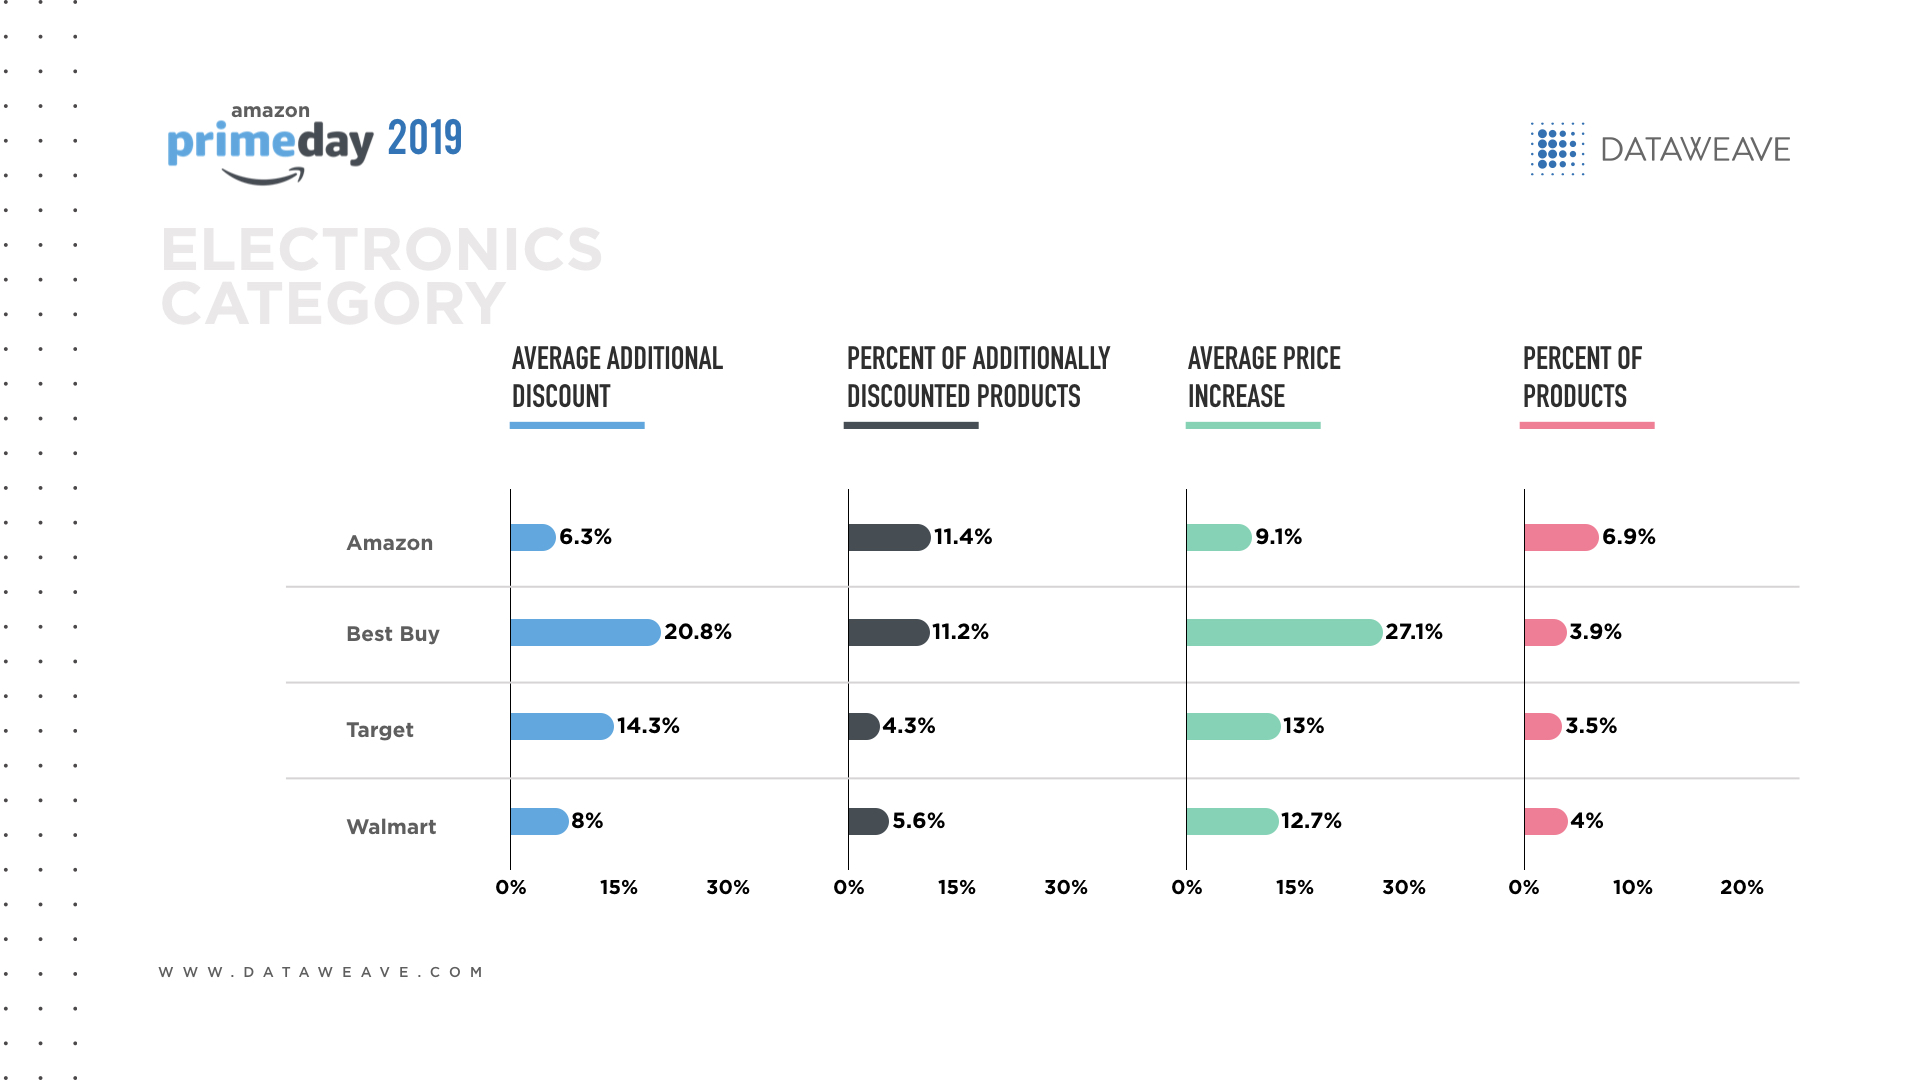
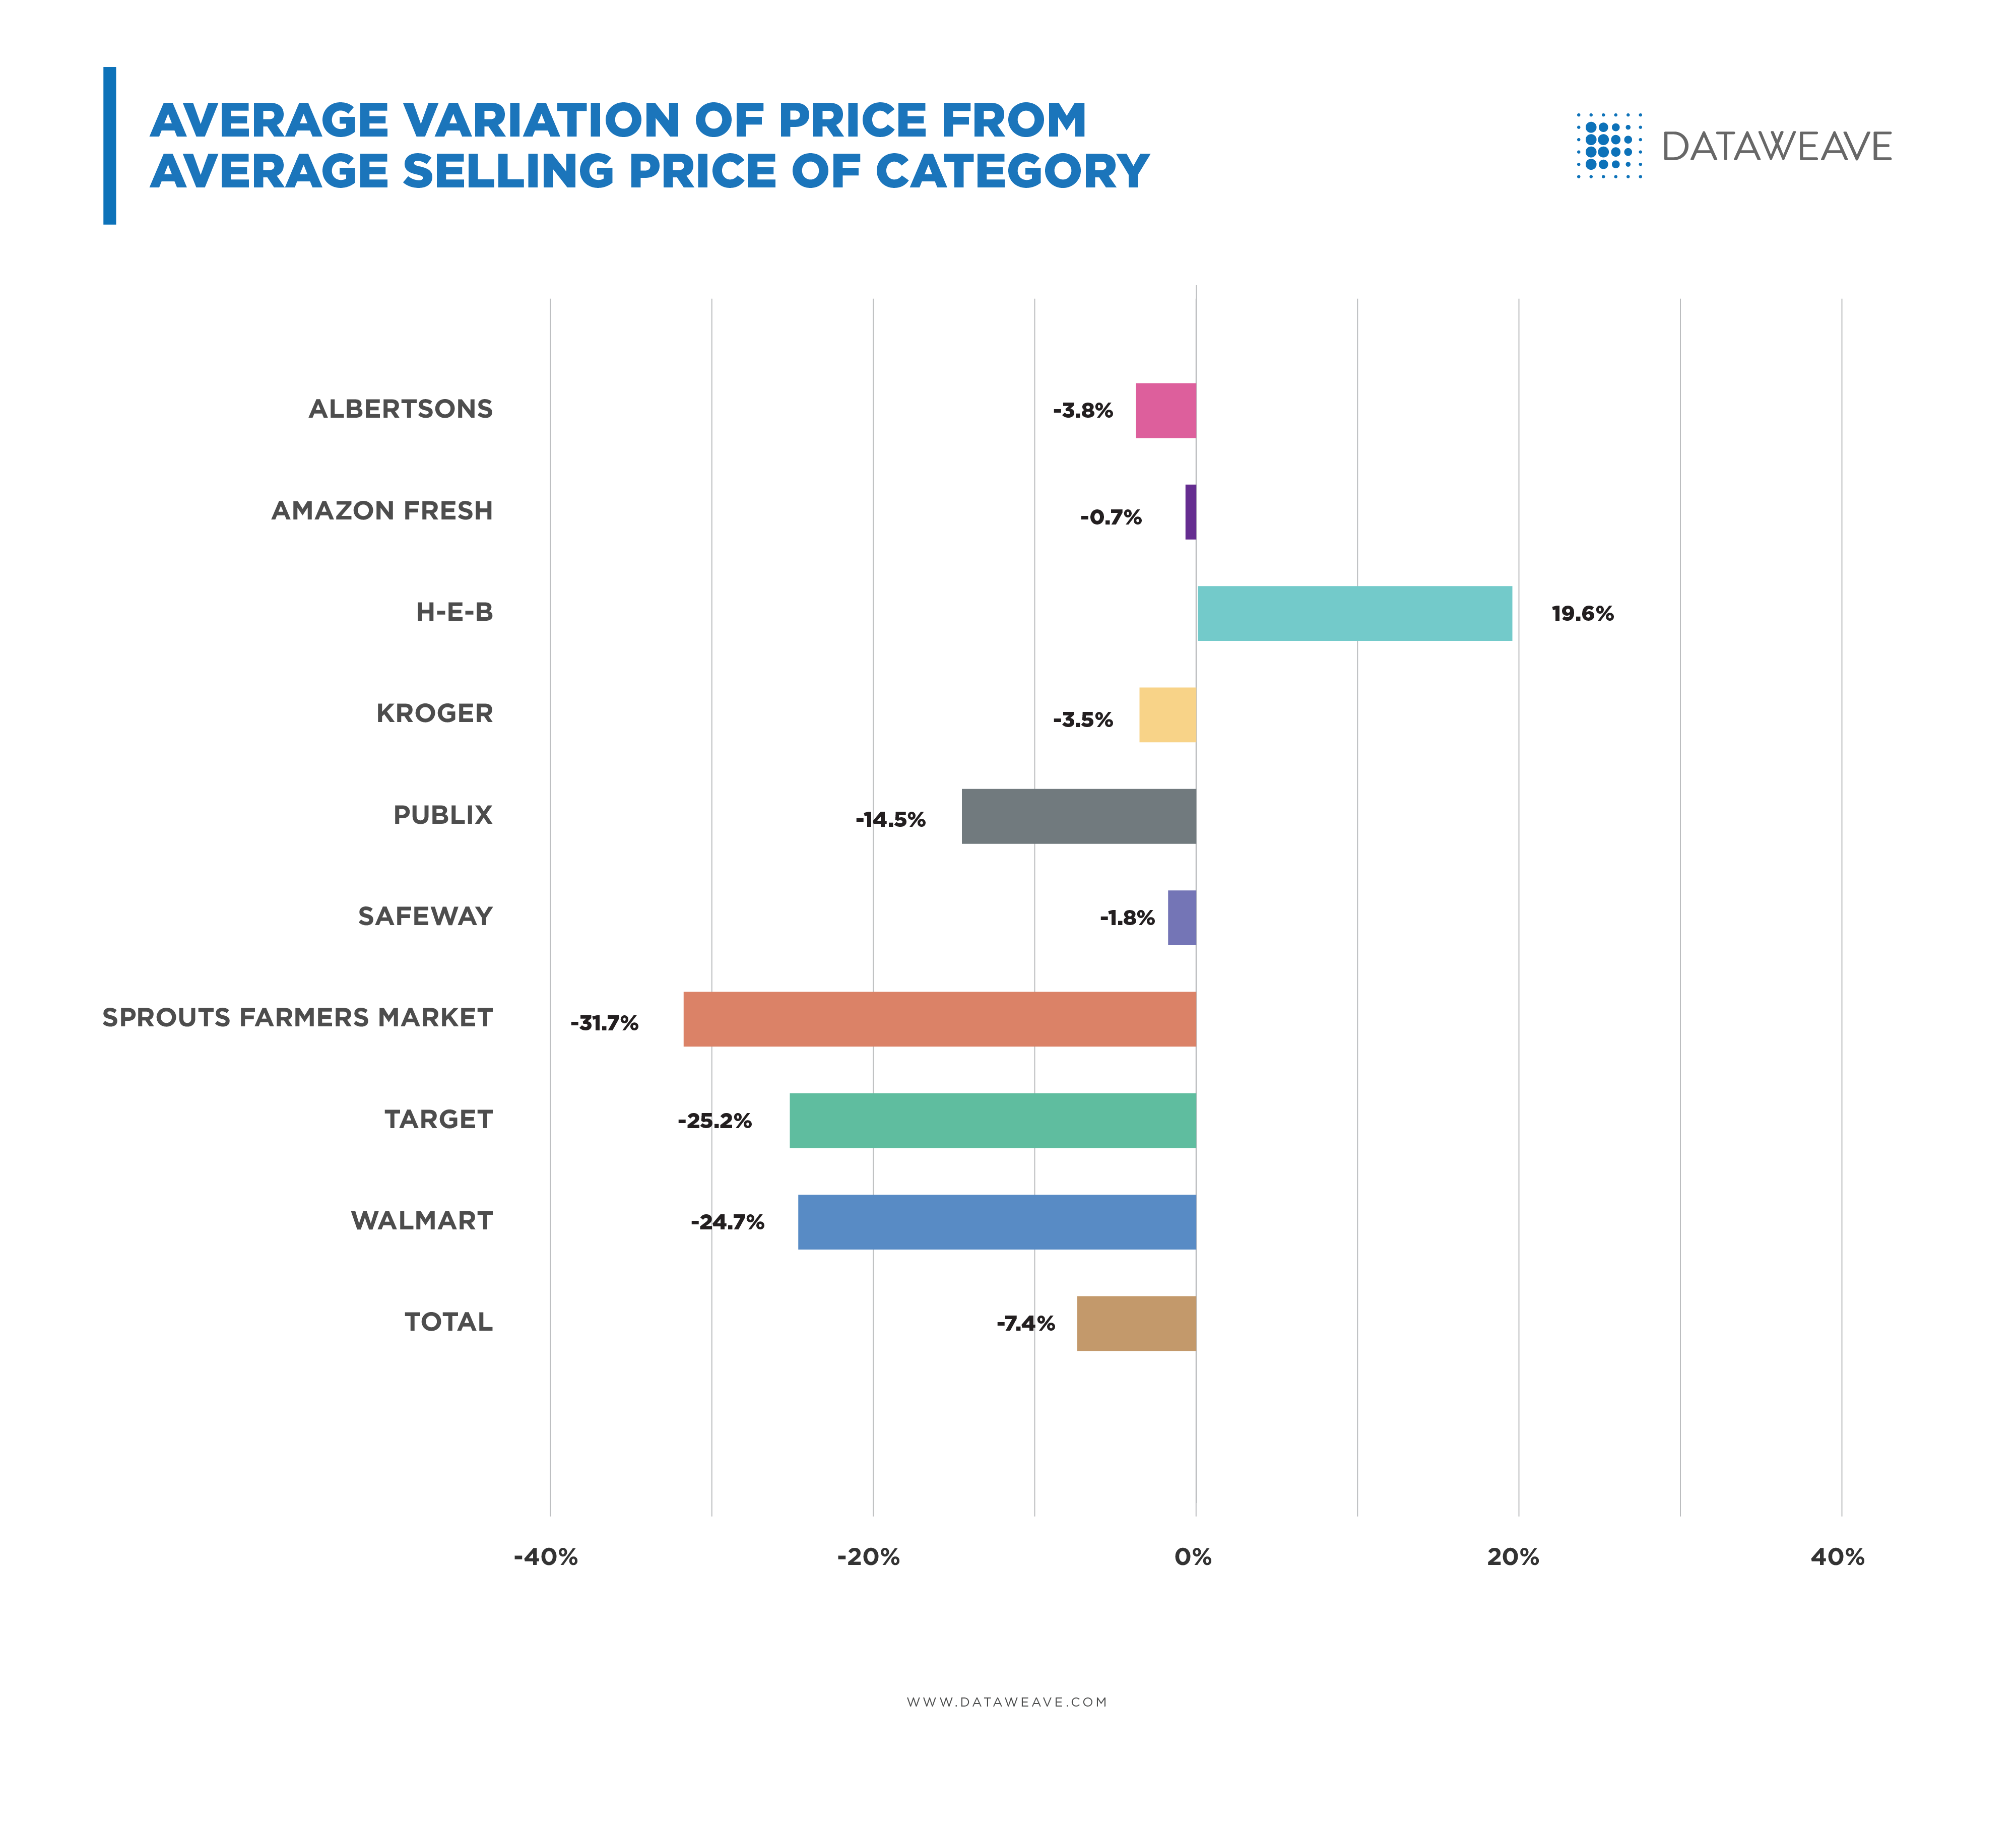
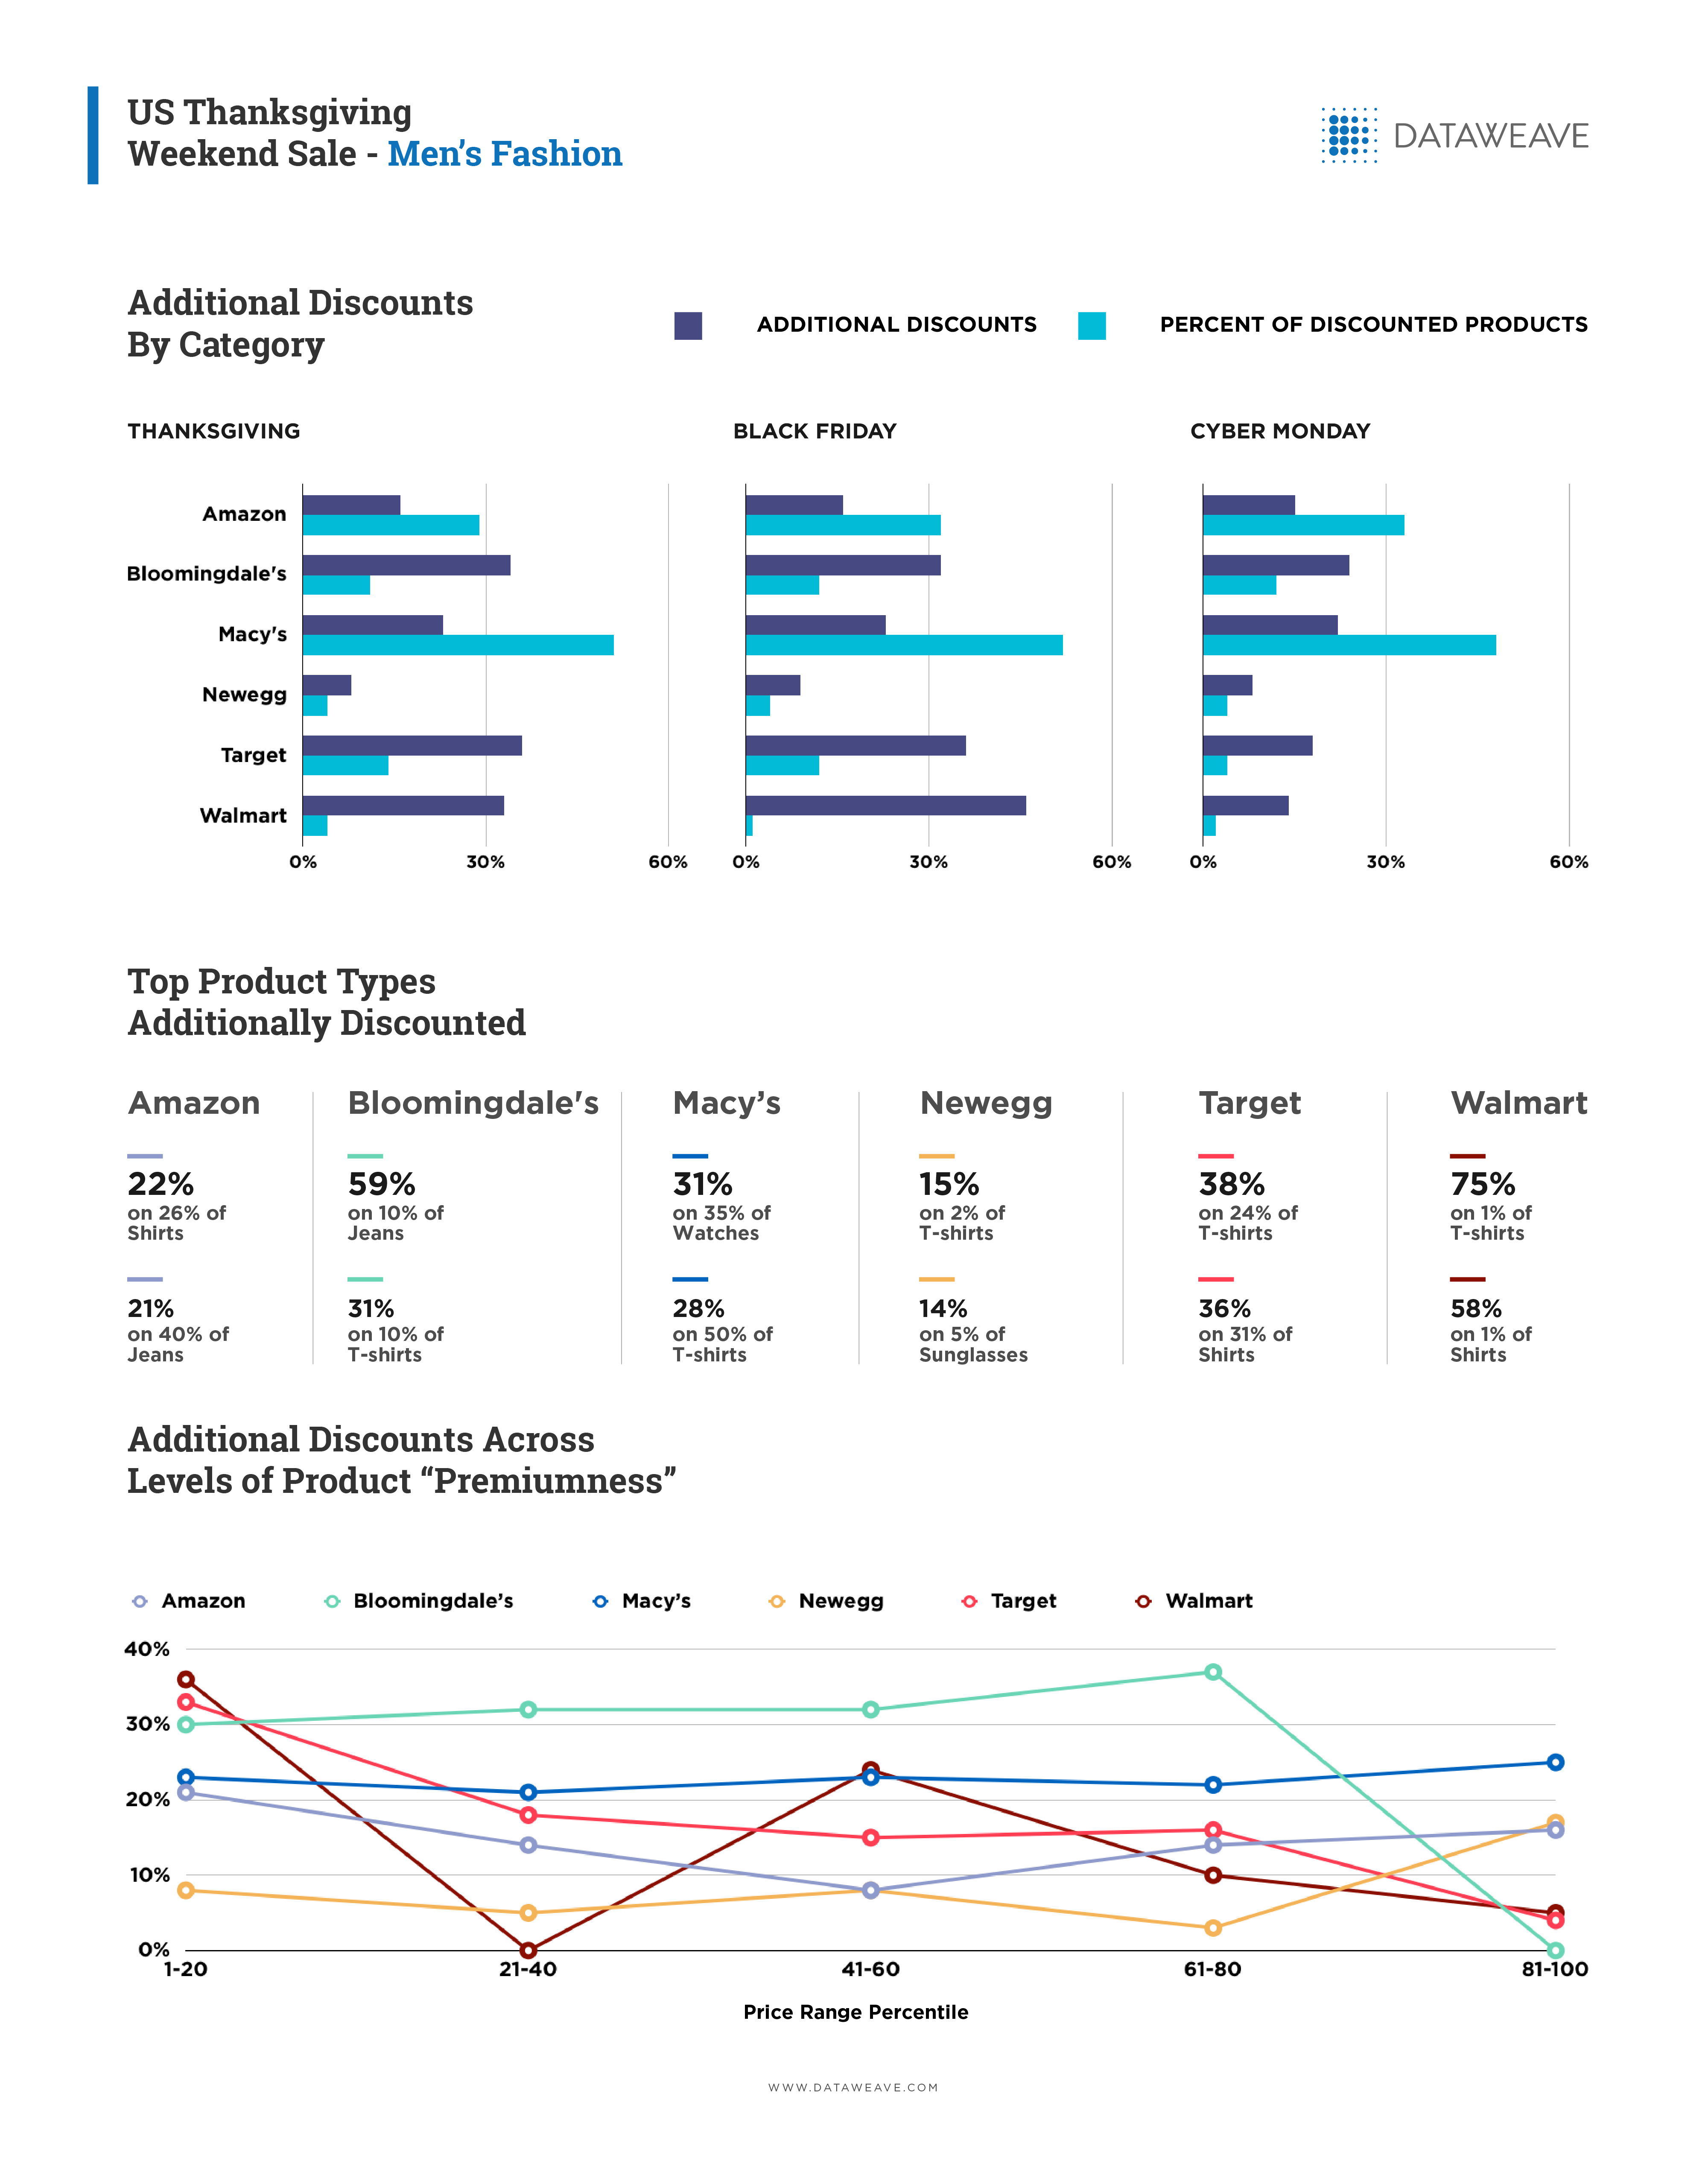
As we found in the electronics category, there were surprising price spikes in this category too – with Target reporting an average increase as high as 14.7%, and Amazon clocking a still moderately high 9.4%. Target also reported the highest distribution of products with price markups. Home Depot indicated the lowest price increase at 4.6%.
When it came to additional discounts, Amazon fell short of expectations – at 4.7%, it offered the lowest average among its competitors. Target, on the other hand, was extremely aggressive both in terms of additional discounts and volume of discounted products.
To conclude, all the retailers observed seemed to be keeping a close watch on their margins by countering price reductions with nearly equivalent surges elsewhere in their assortment.
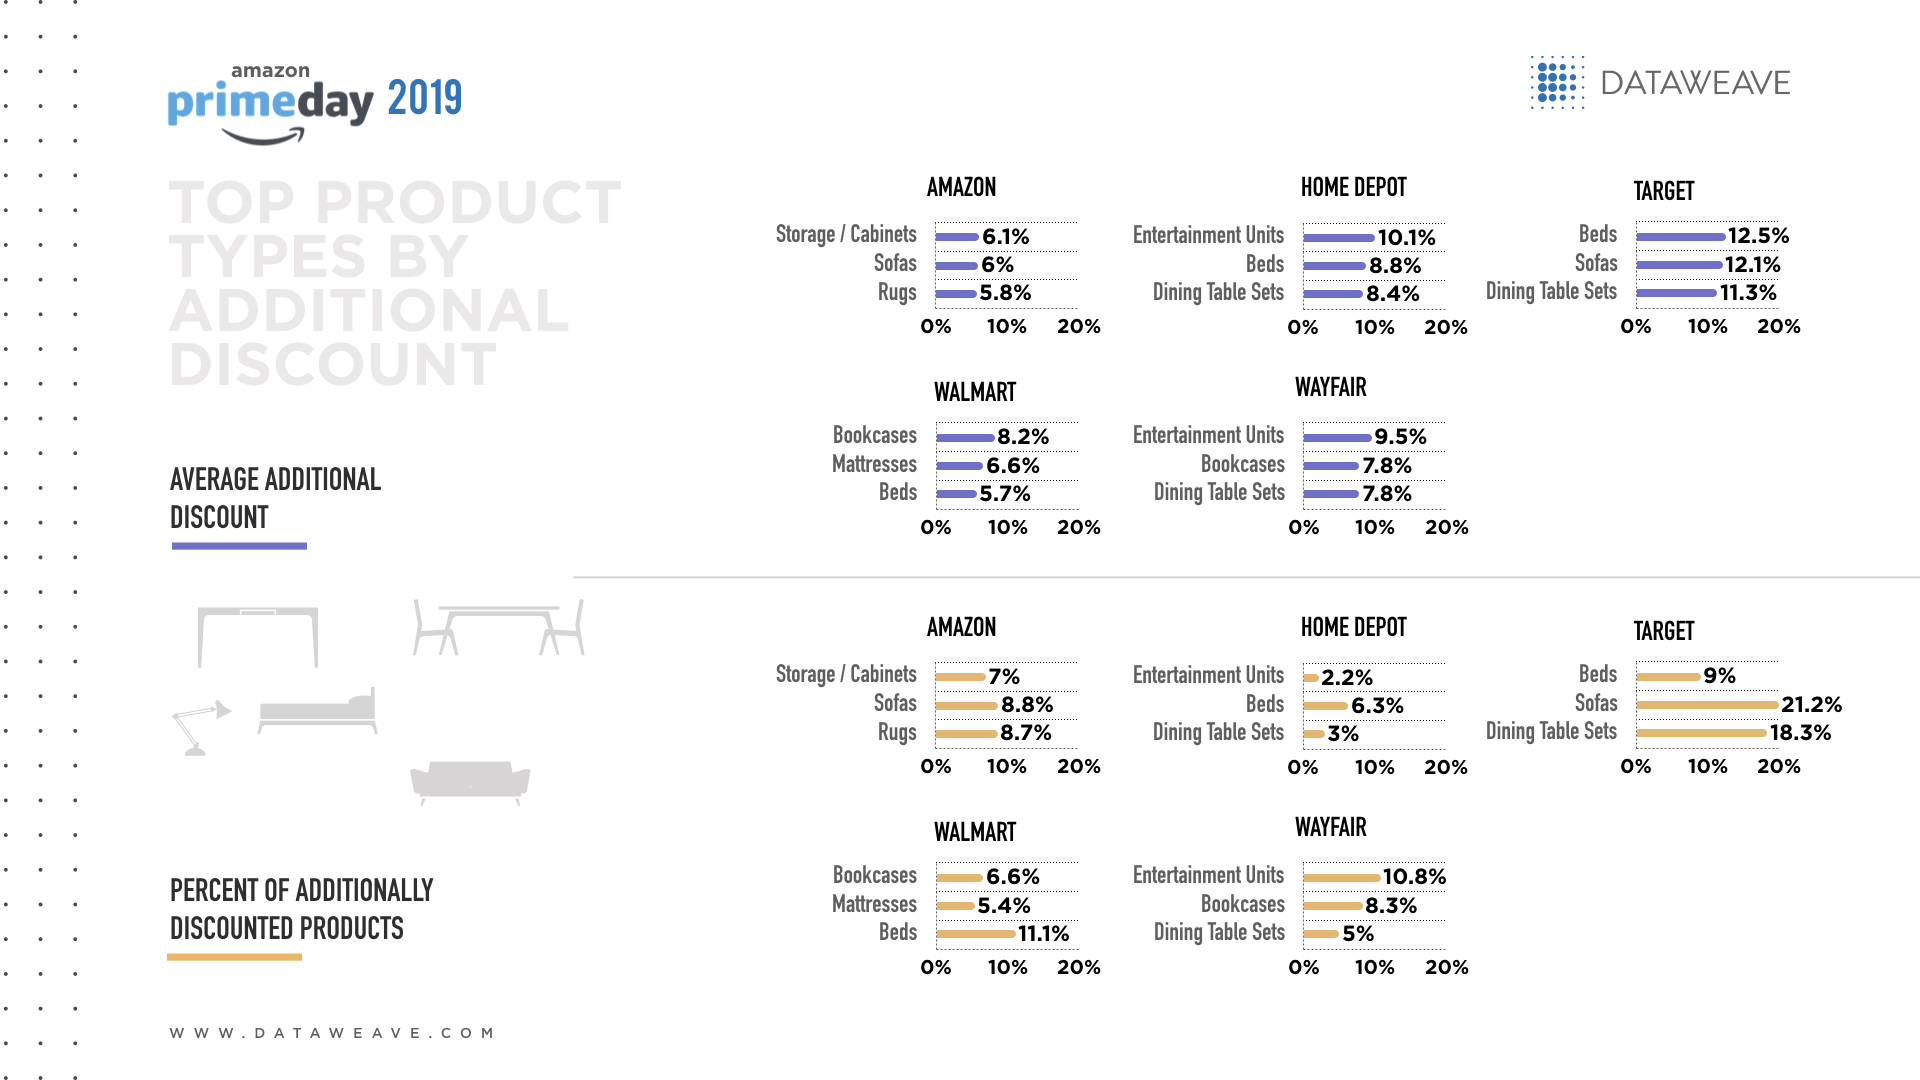
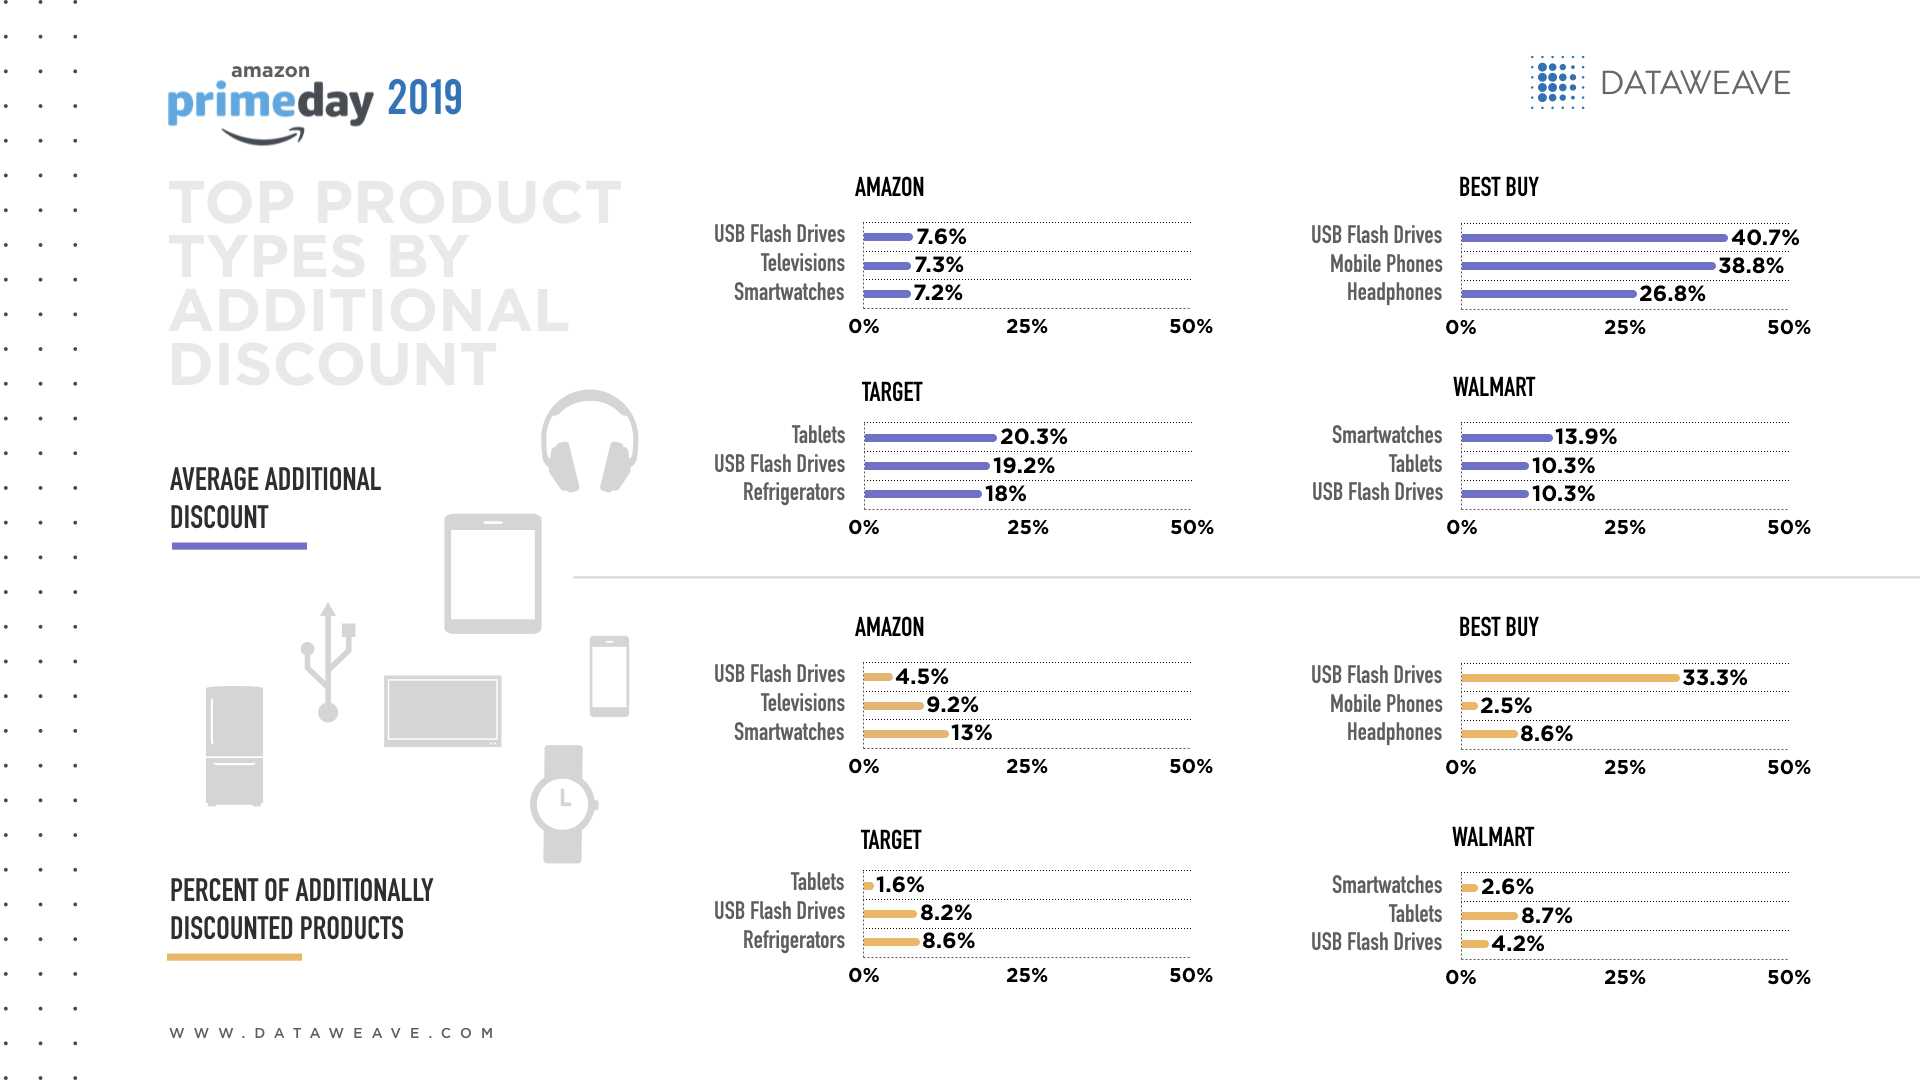
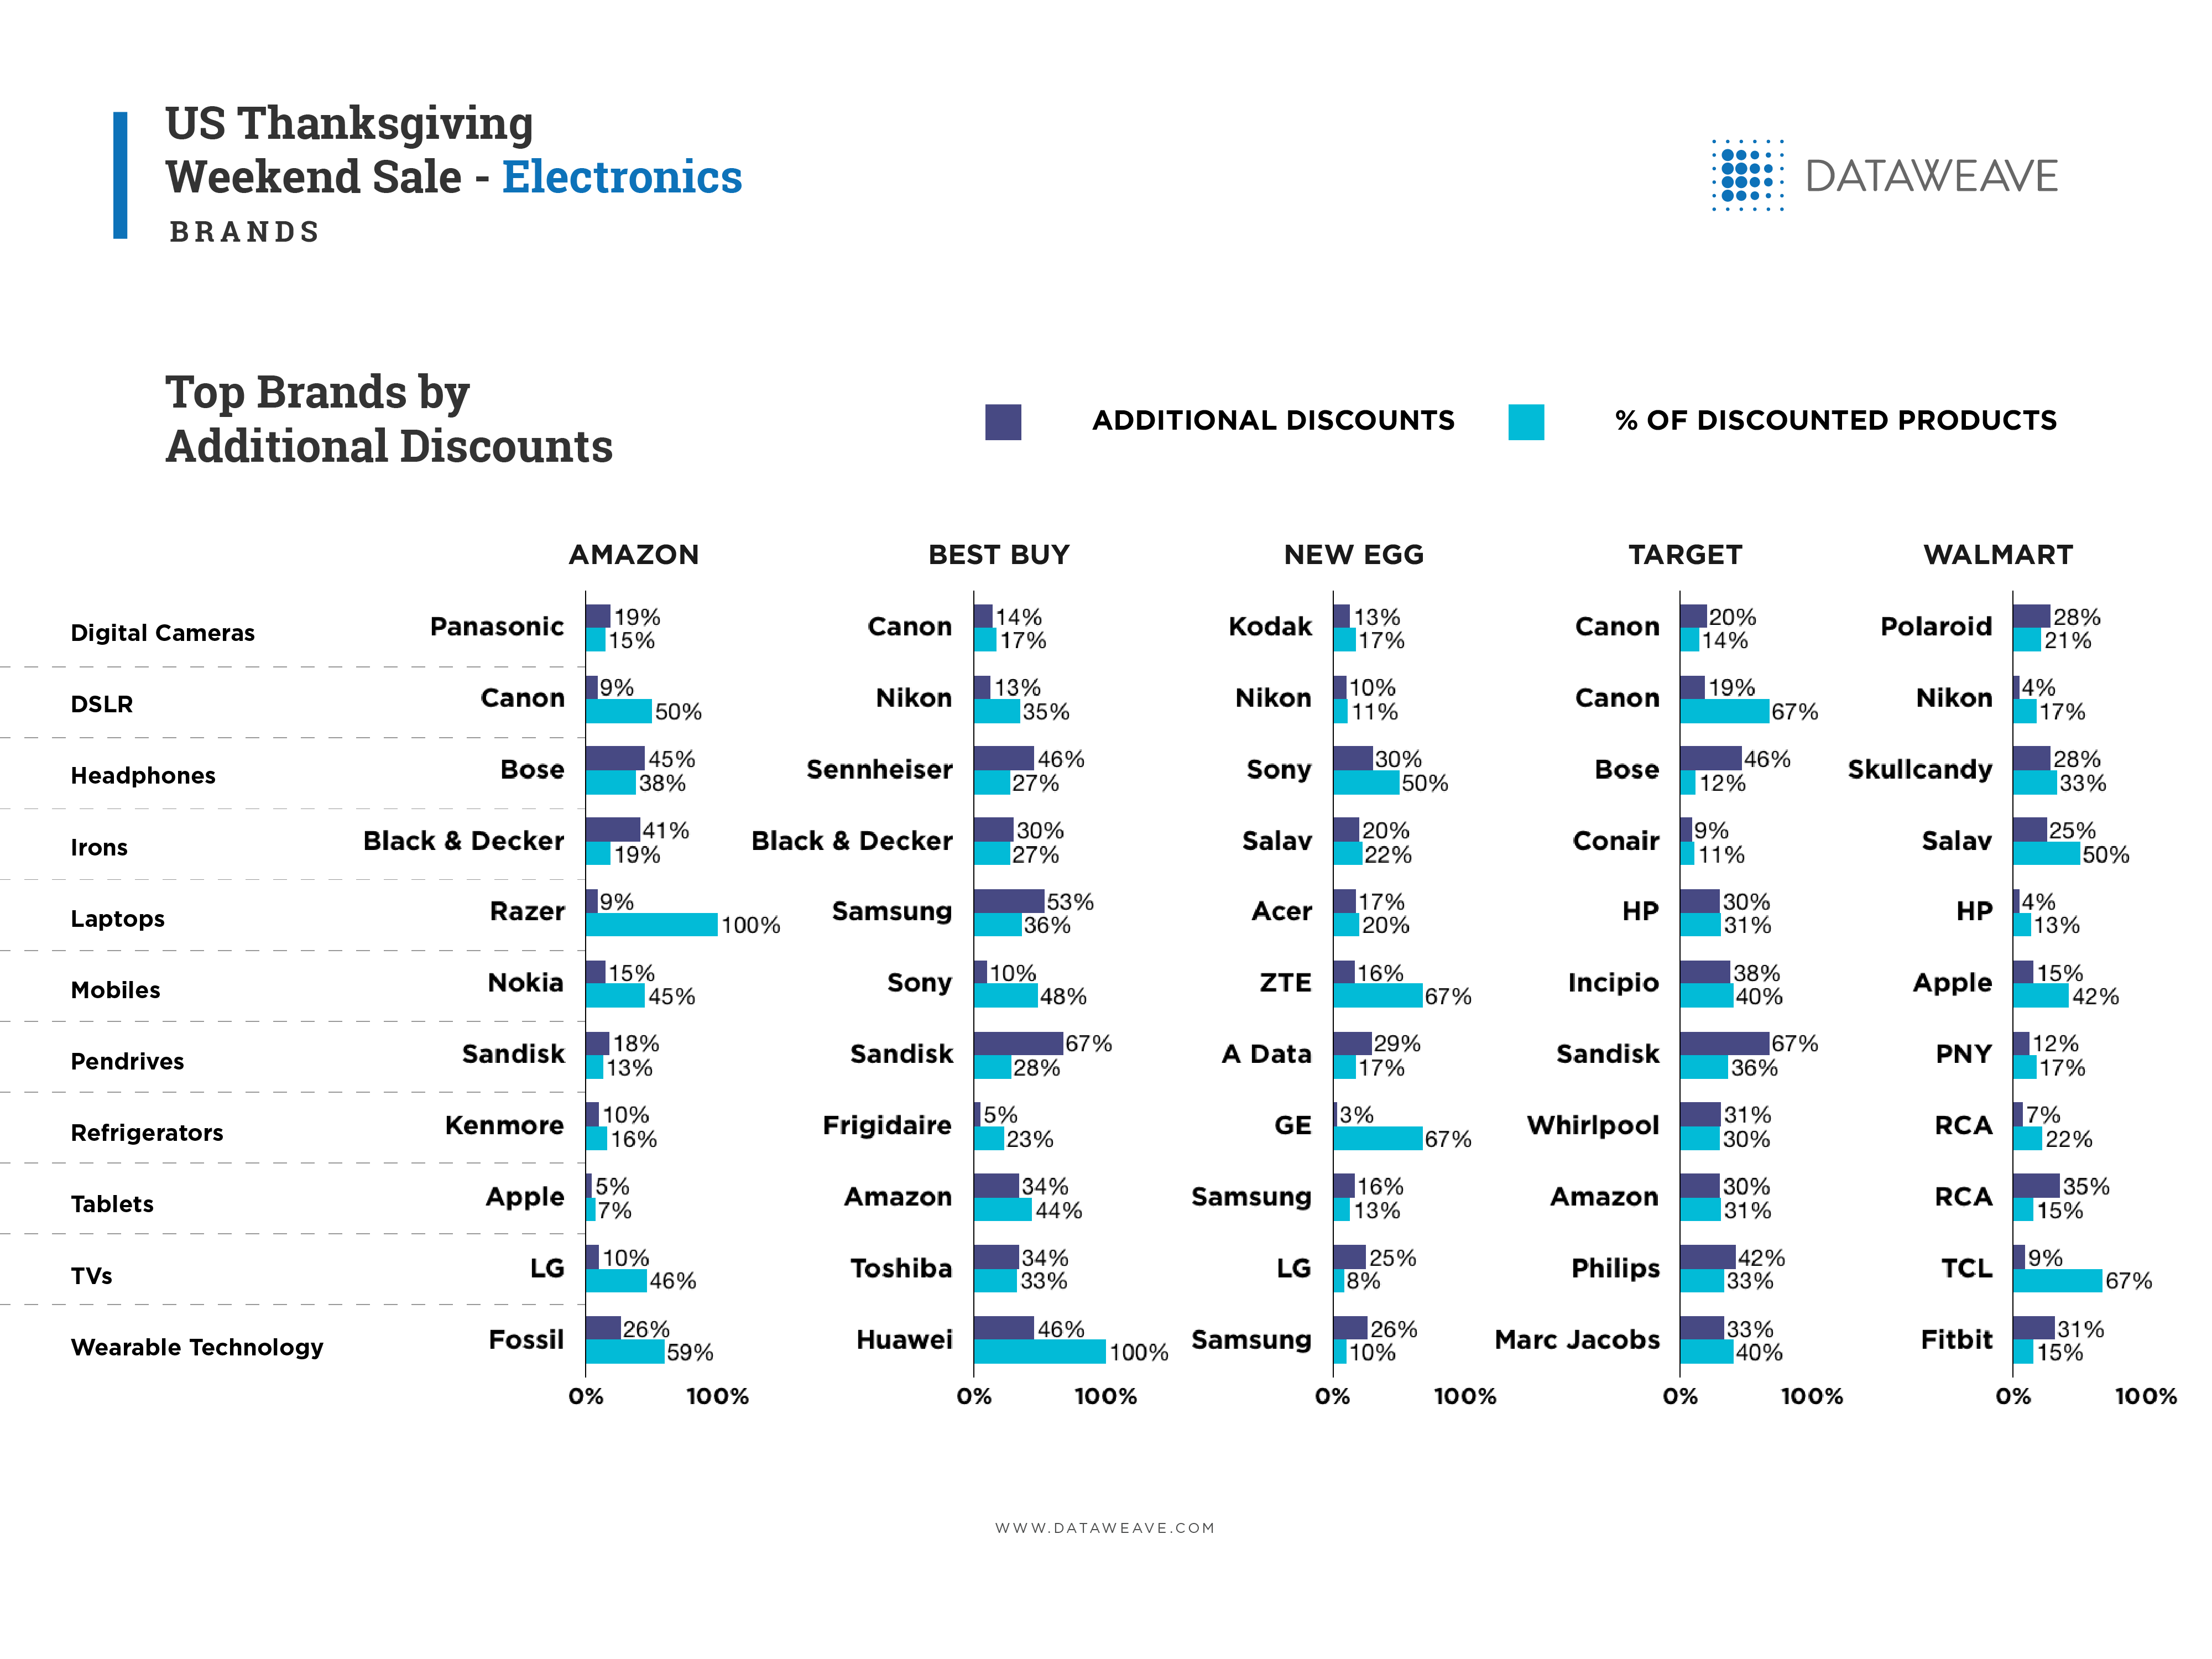
While there was no single product type that was found to be popular across all five retailers, it was clear that Target was again the most aggressive at offering discounts. It also had among the largest product ranges on discount.
Amazon chose to follow a very moderate route both in terms of average discount and discounted product volume.
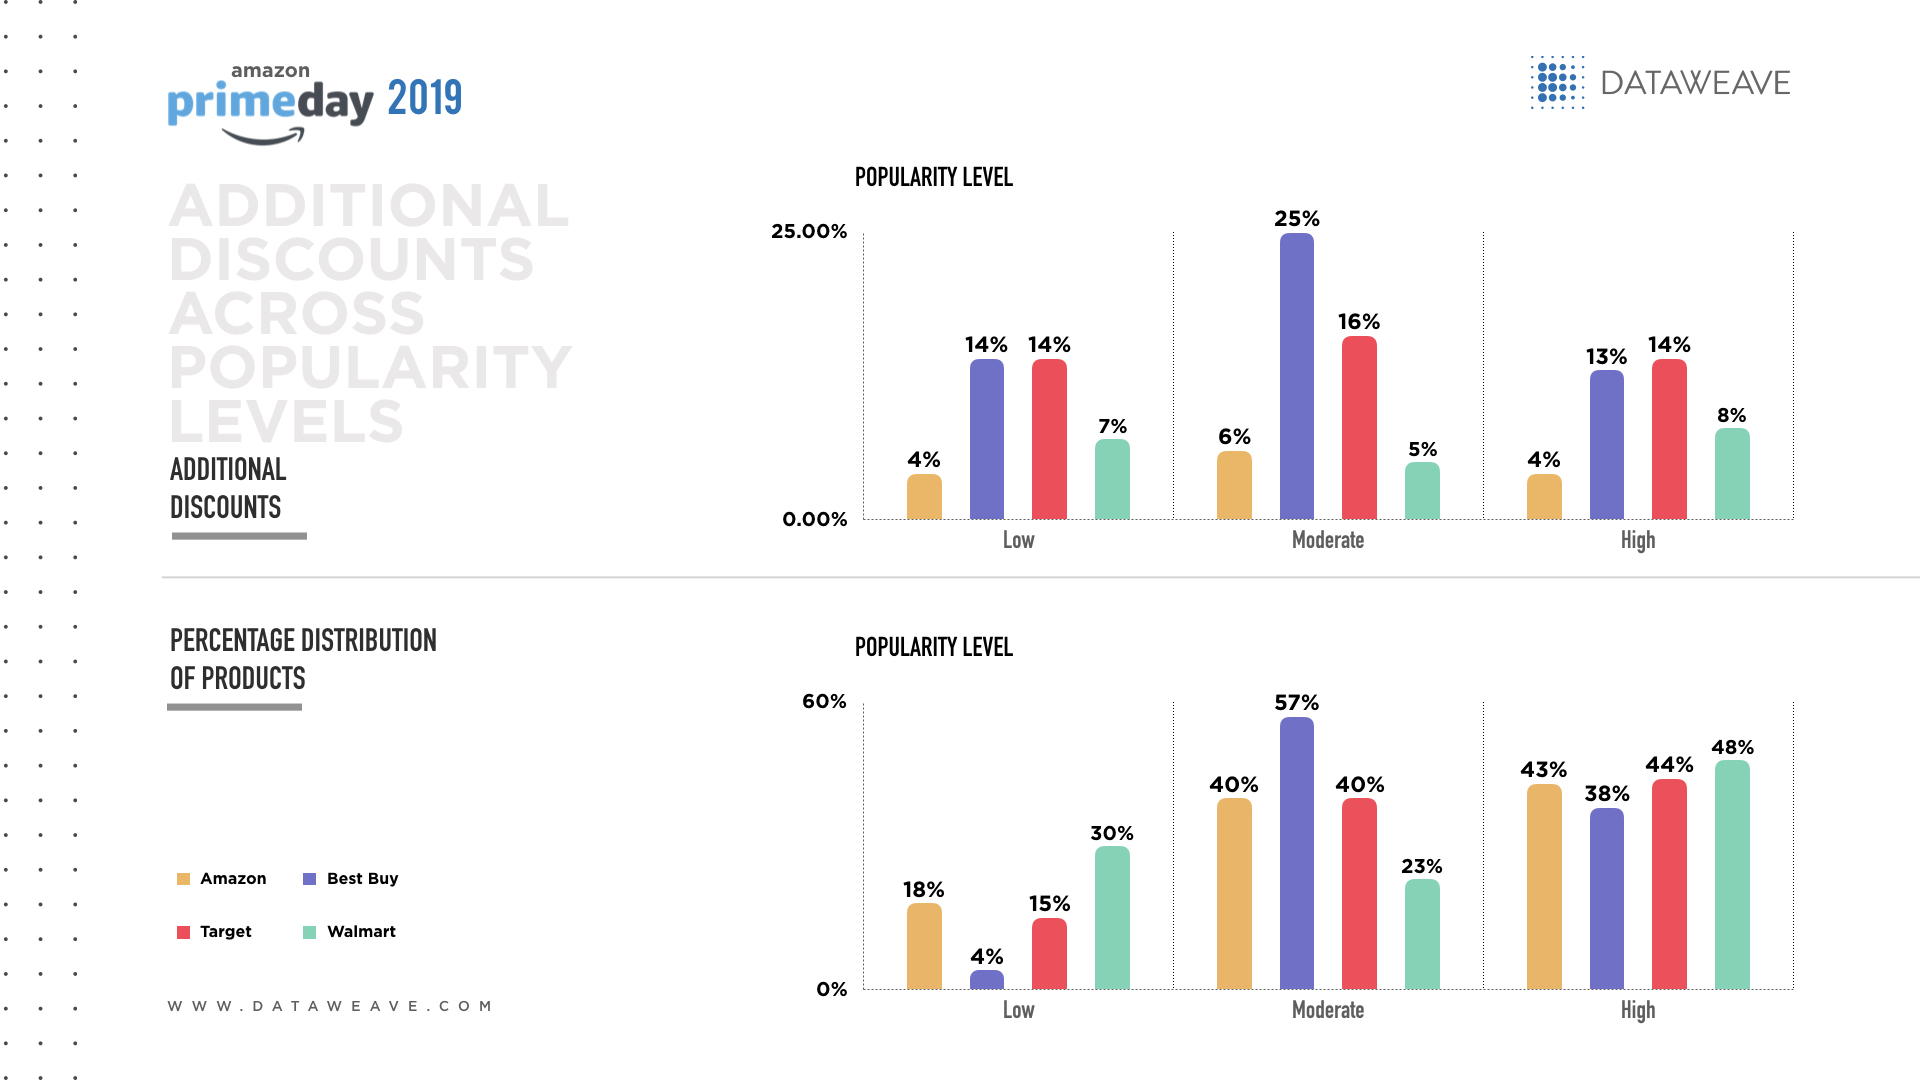
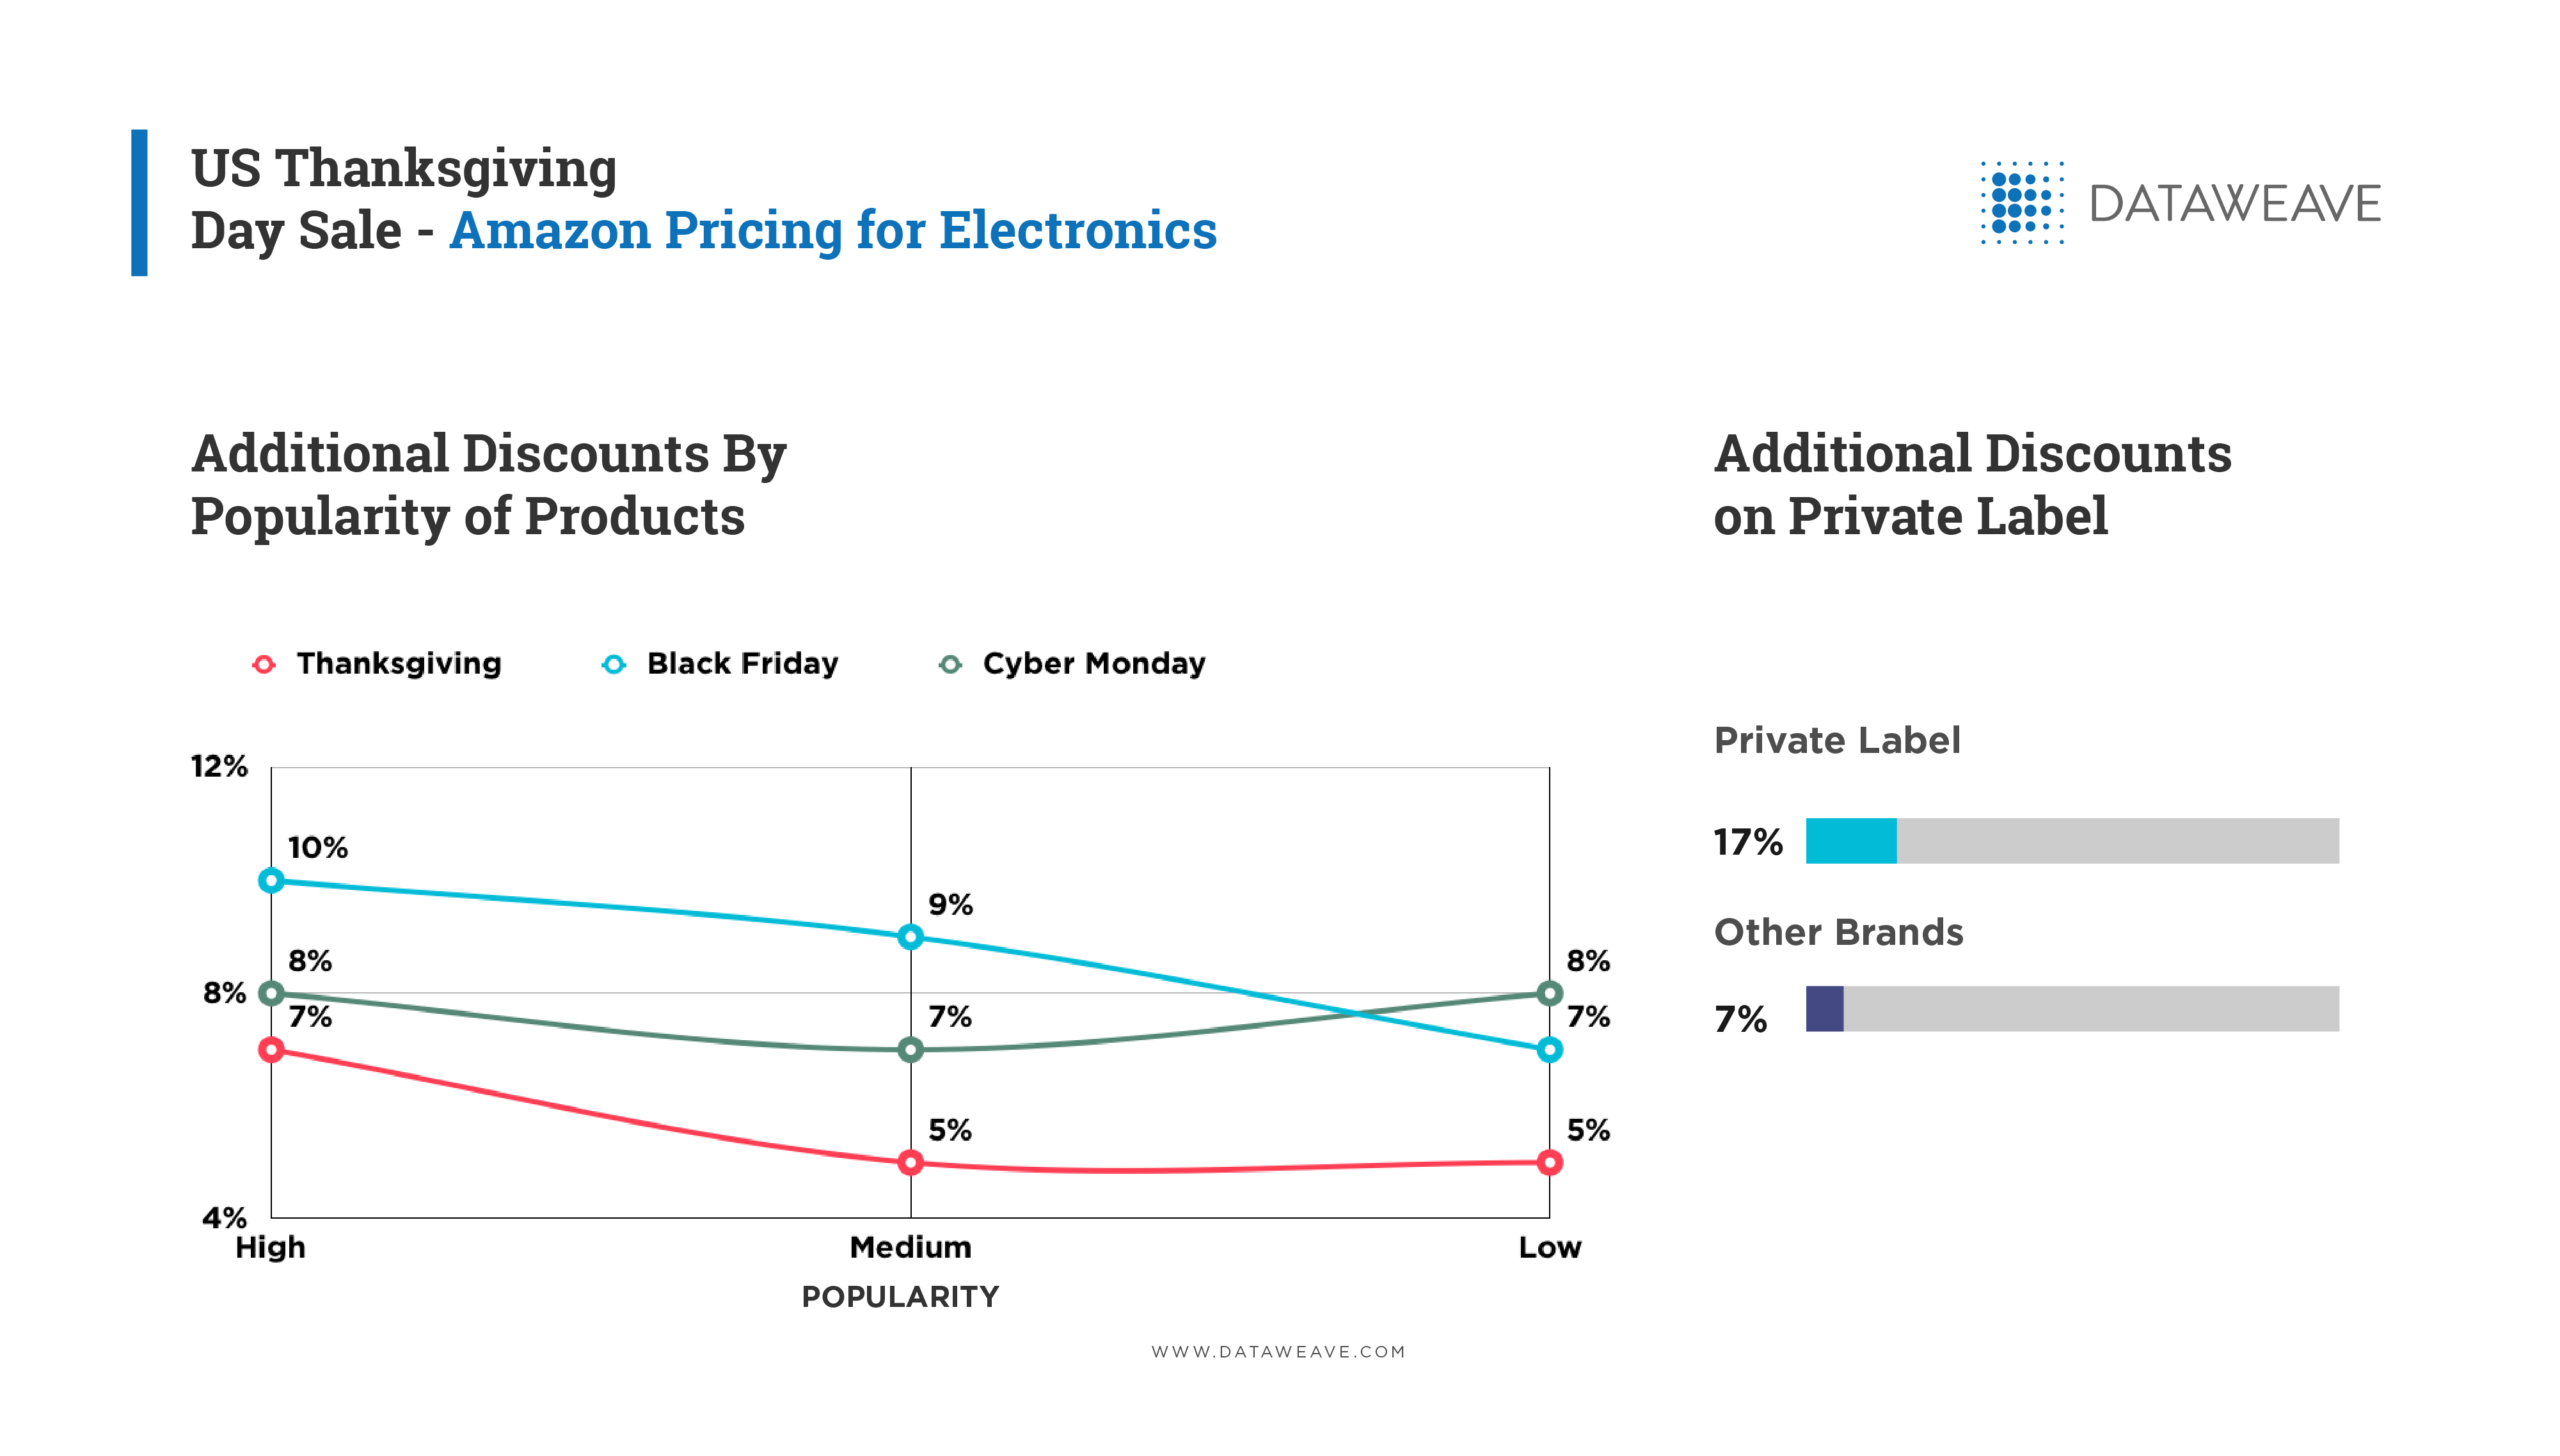
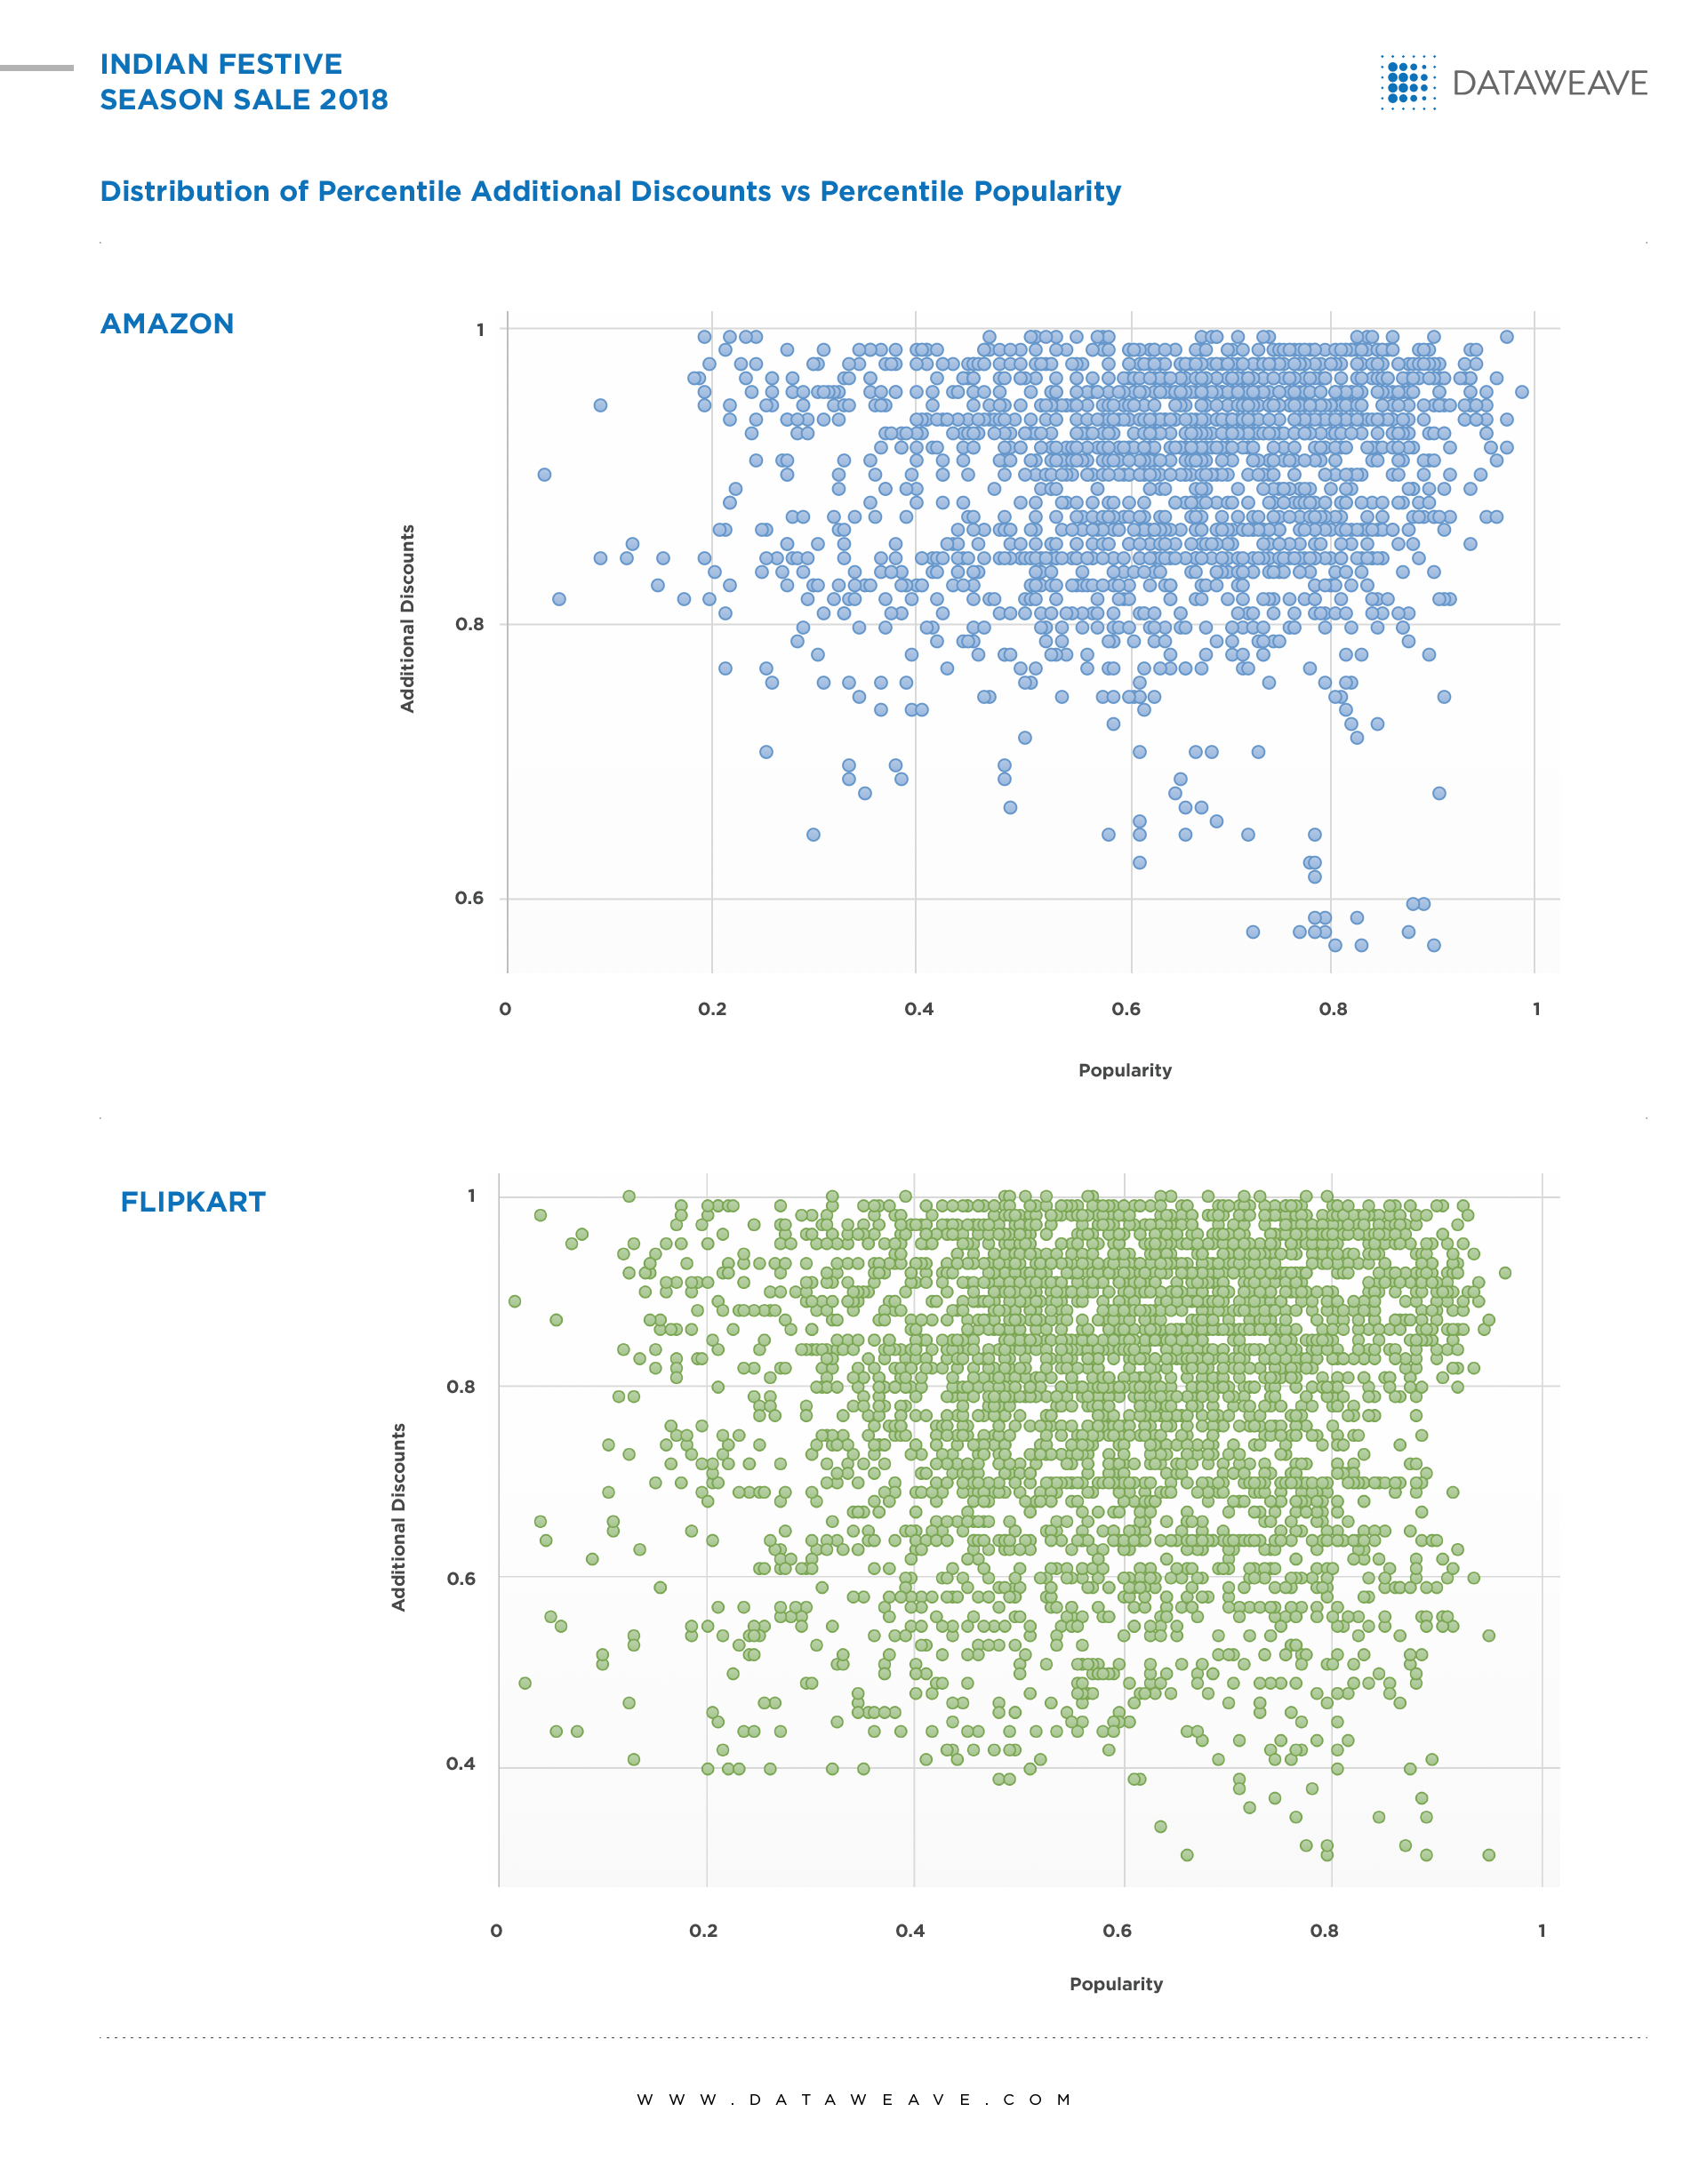
Additional discounts across popularity levels
We determined popularity using a combination of average review rating and number of reviews, and the resulting scores were categorized as low, moderate, and high.
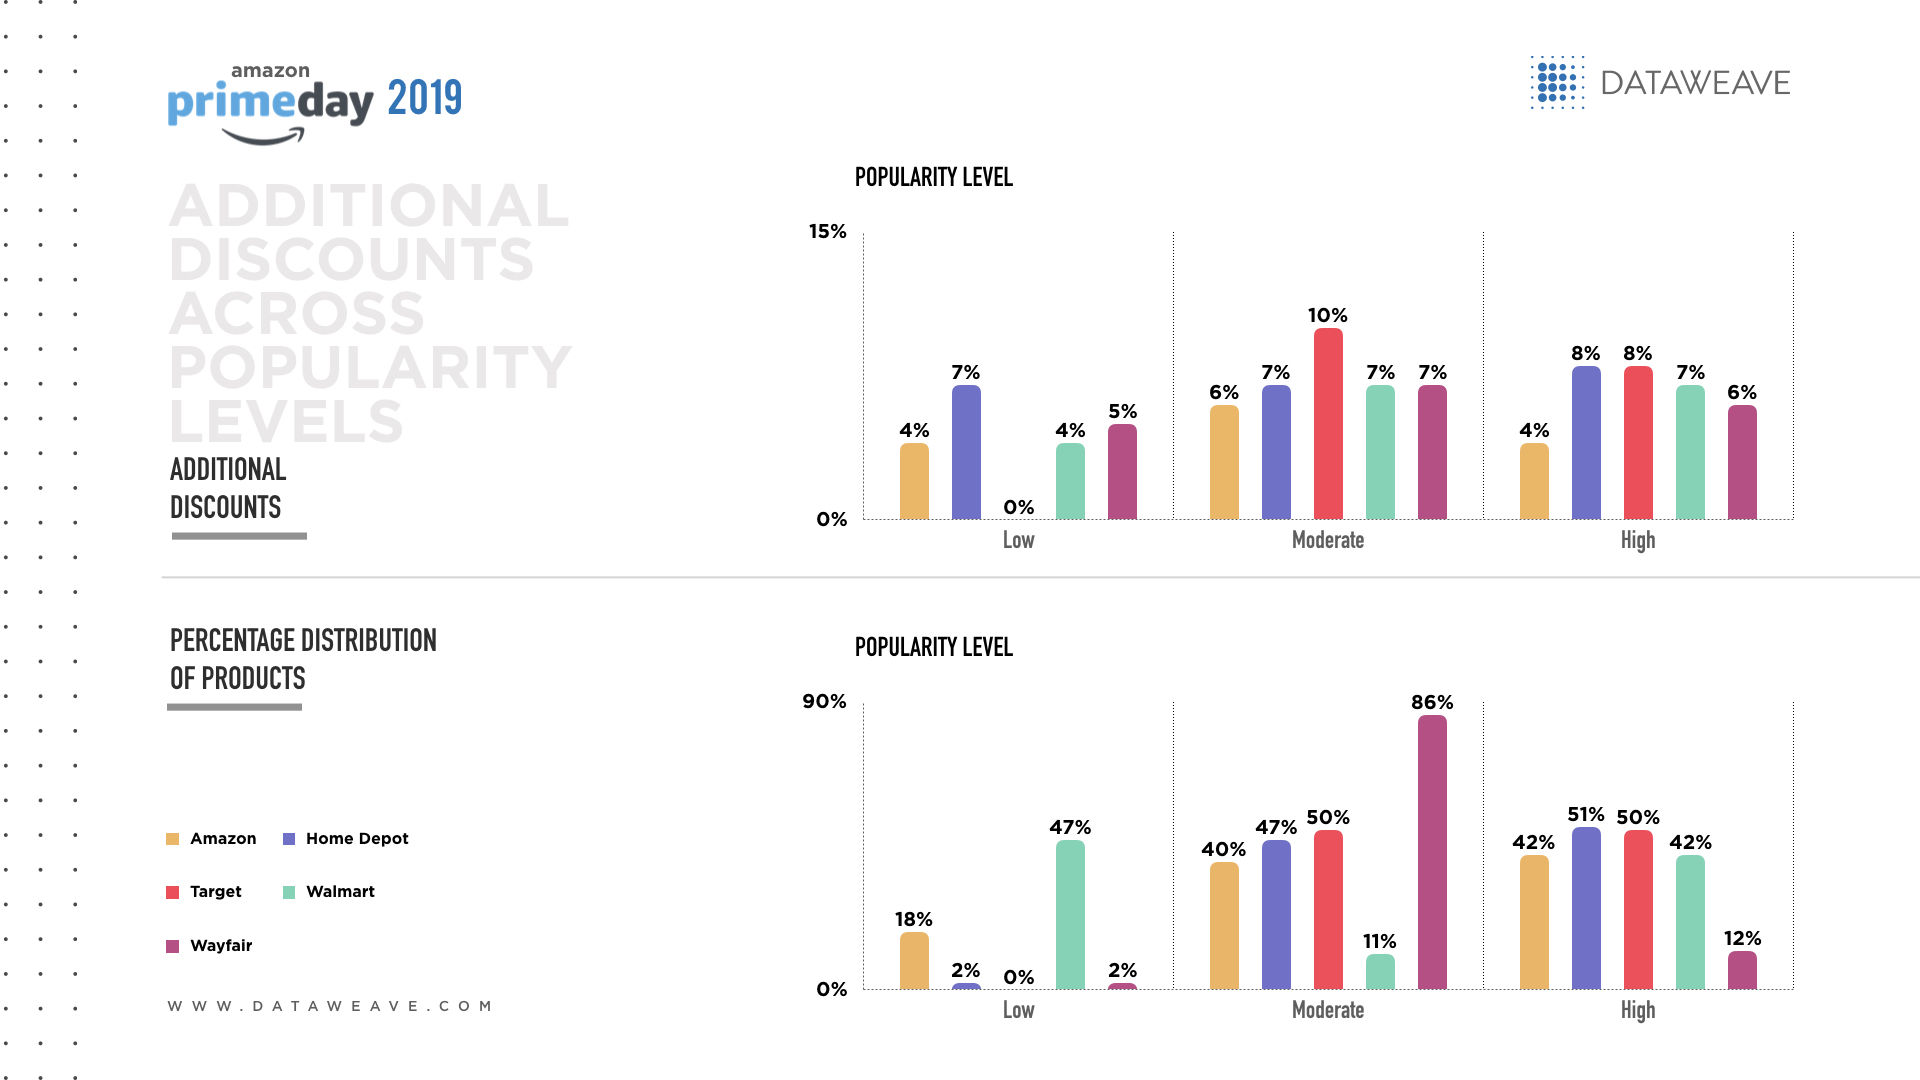
There doesn’t seem to have been much of a focus on low-popularity products in terms of additional discounts. Most of the attention was focused on products with moderate popularity, since there isn’t much of a need to be aggressive on price for highly popular products, and products with lower popularity aren’t really worth promoting.
The only retailer that offered a higher discount on its most popular products was Home Depot. Walmart, too, seemed reluctant to let go of the opportunity to capitalize on popularity – it chose to offer the same discount on moderately as well as highly popular products.
Interestingly, Walmart seems to have a disproportionately large share of products in its low popularity category – something it should possibly evaluate in the future in terms of brand quality, products, and service.
The percentage distribution of products mostly indicated a linear relationship, with the highest distribution usually being offered for highly popular products. The exception was Wayfair, which offered a much larger array in its moderately popular category.
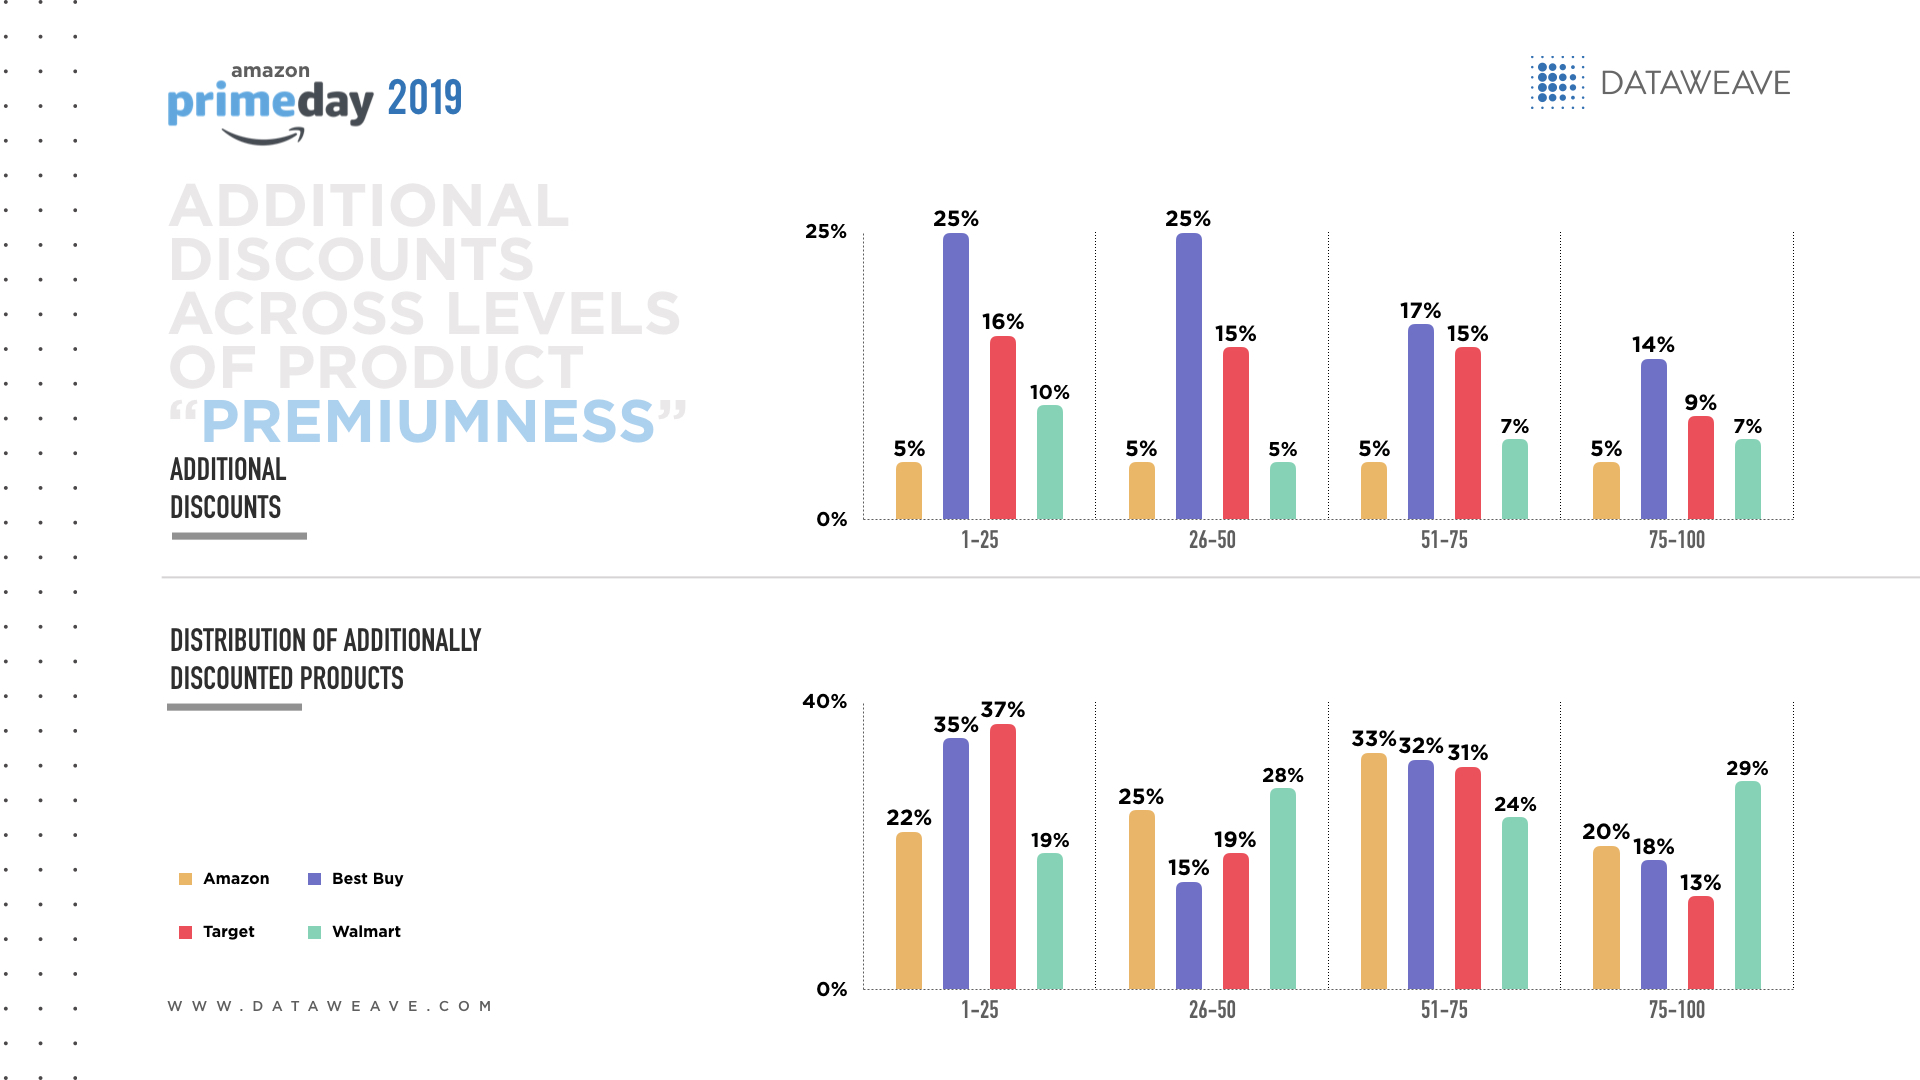
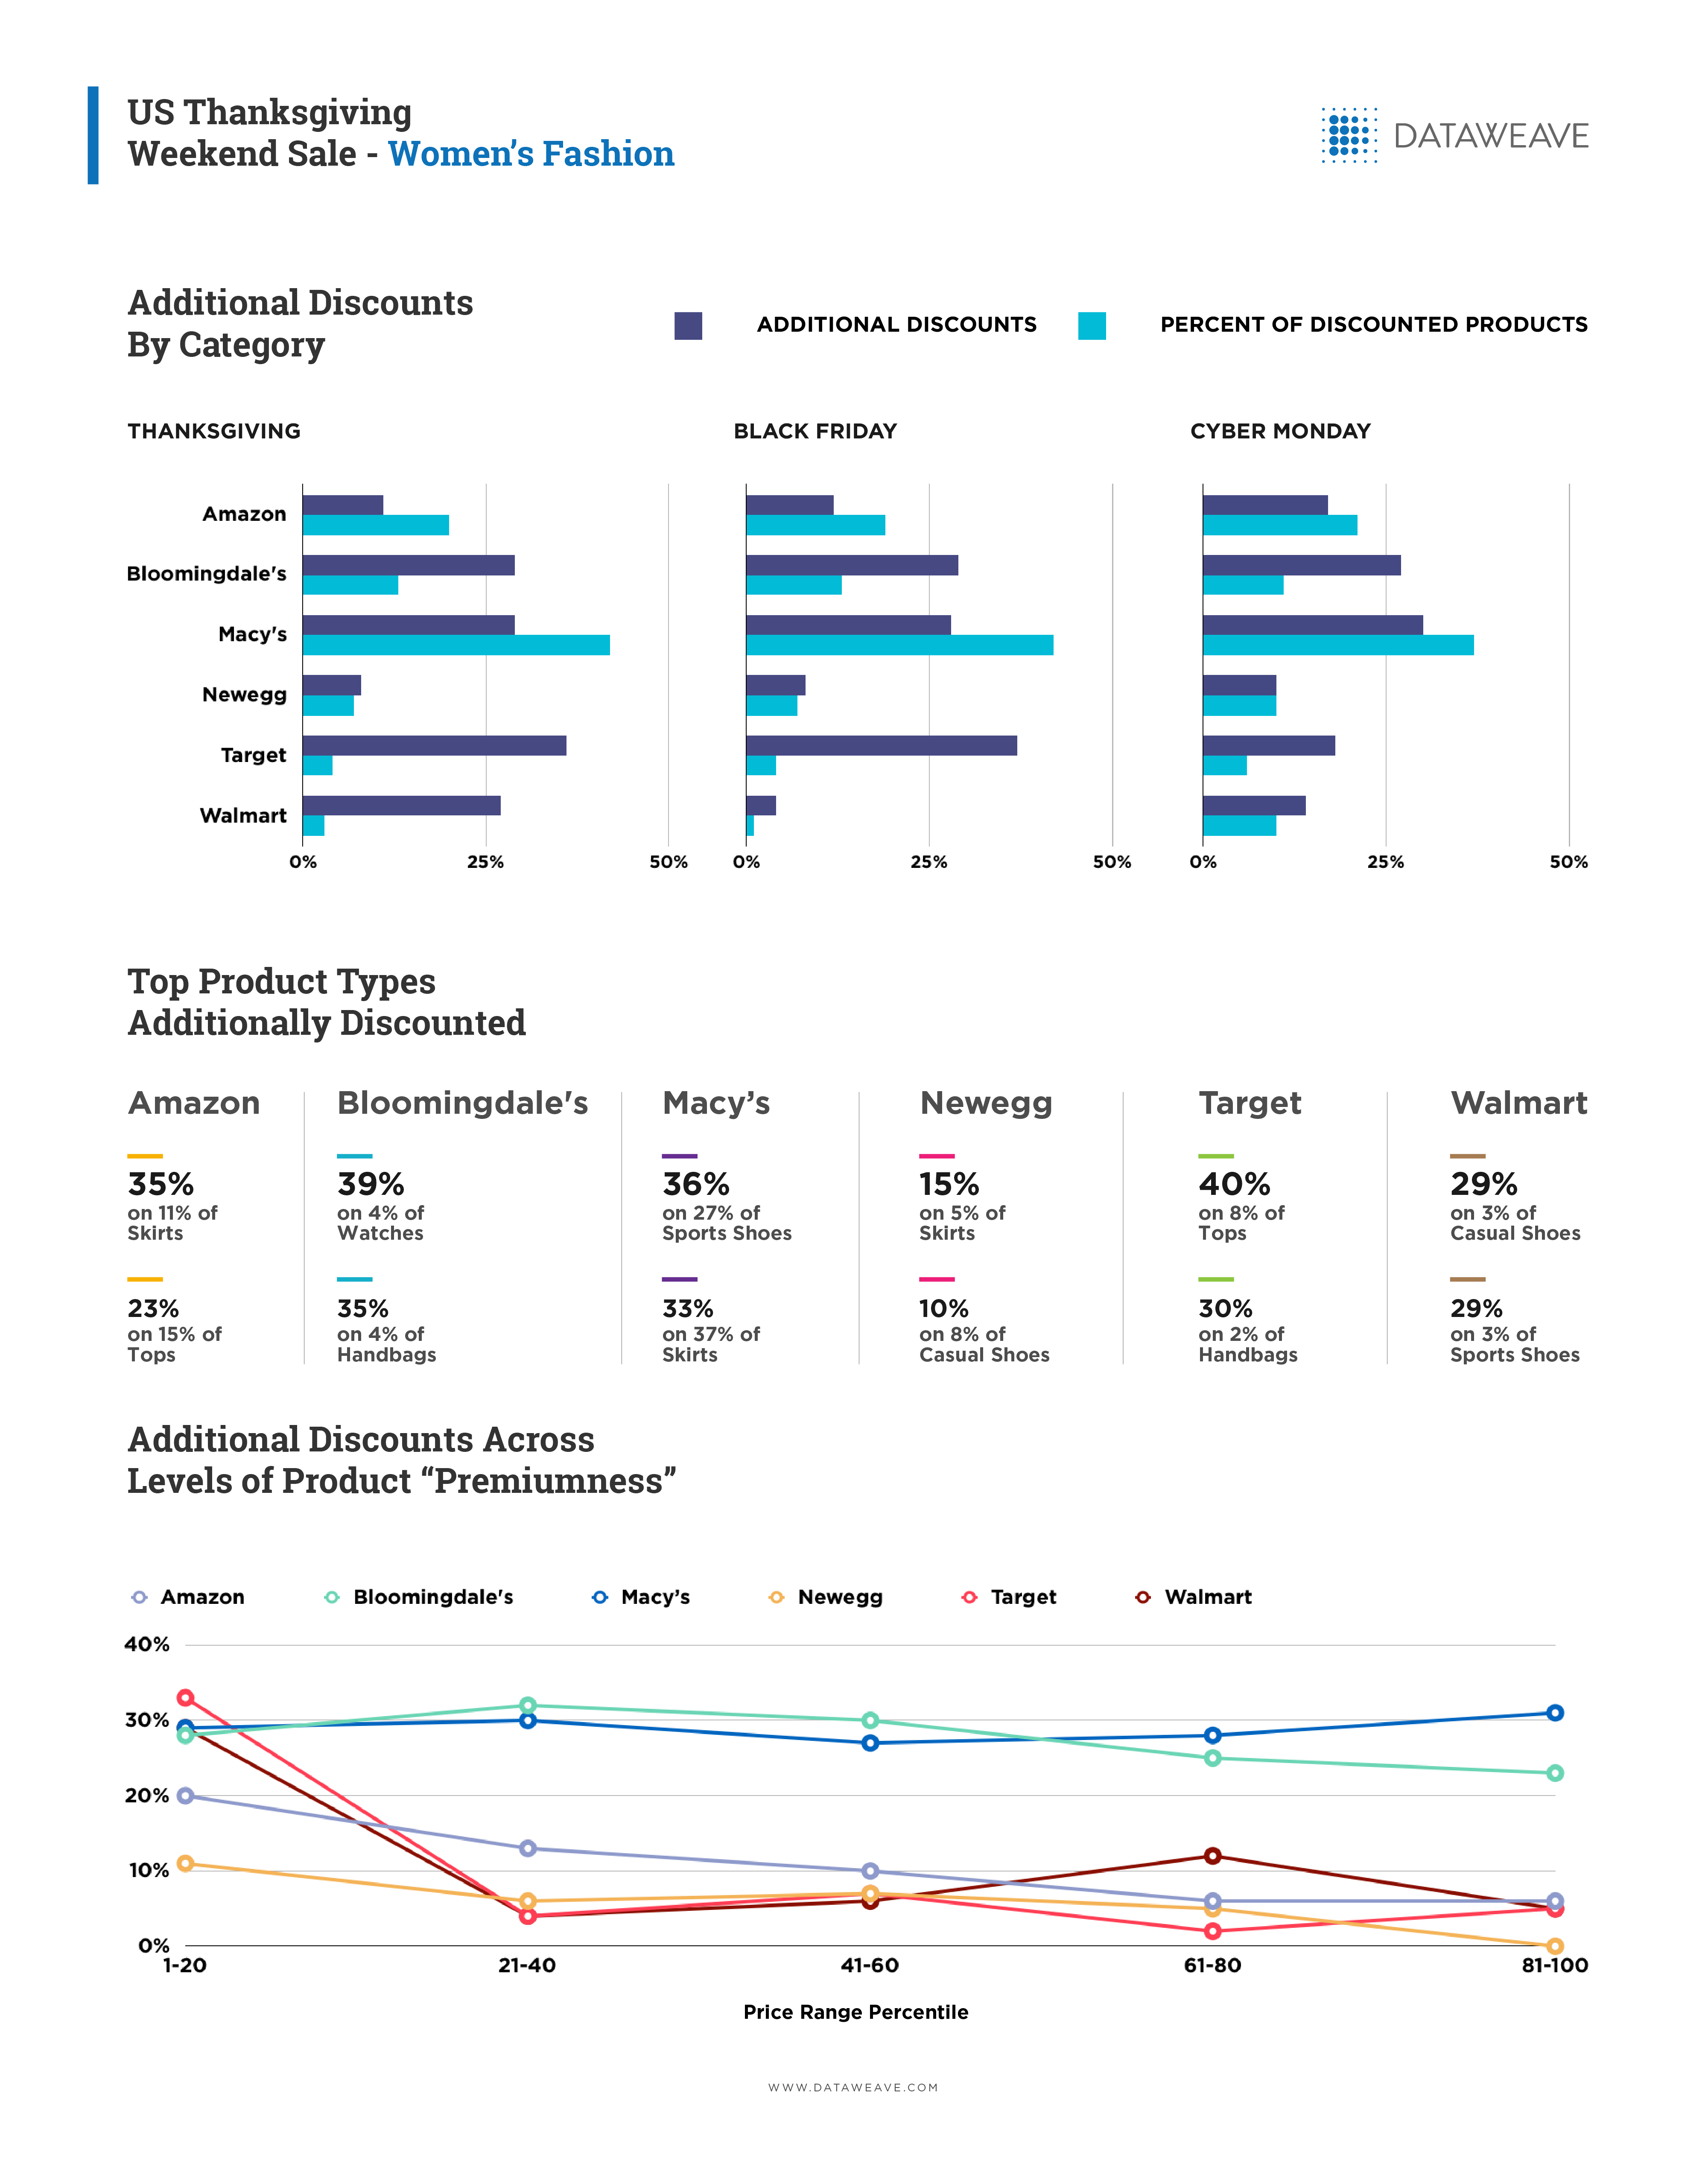
Additional discounts across product “premiumness” levels
Premiumness was calculated as the average selling price before the sale event. This was divided into four percentile blocks, with higher percentile blocks indicating higher selling prices.
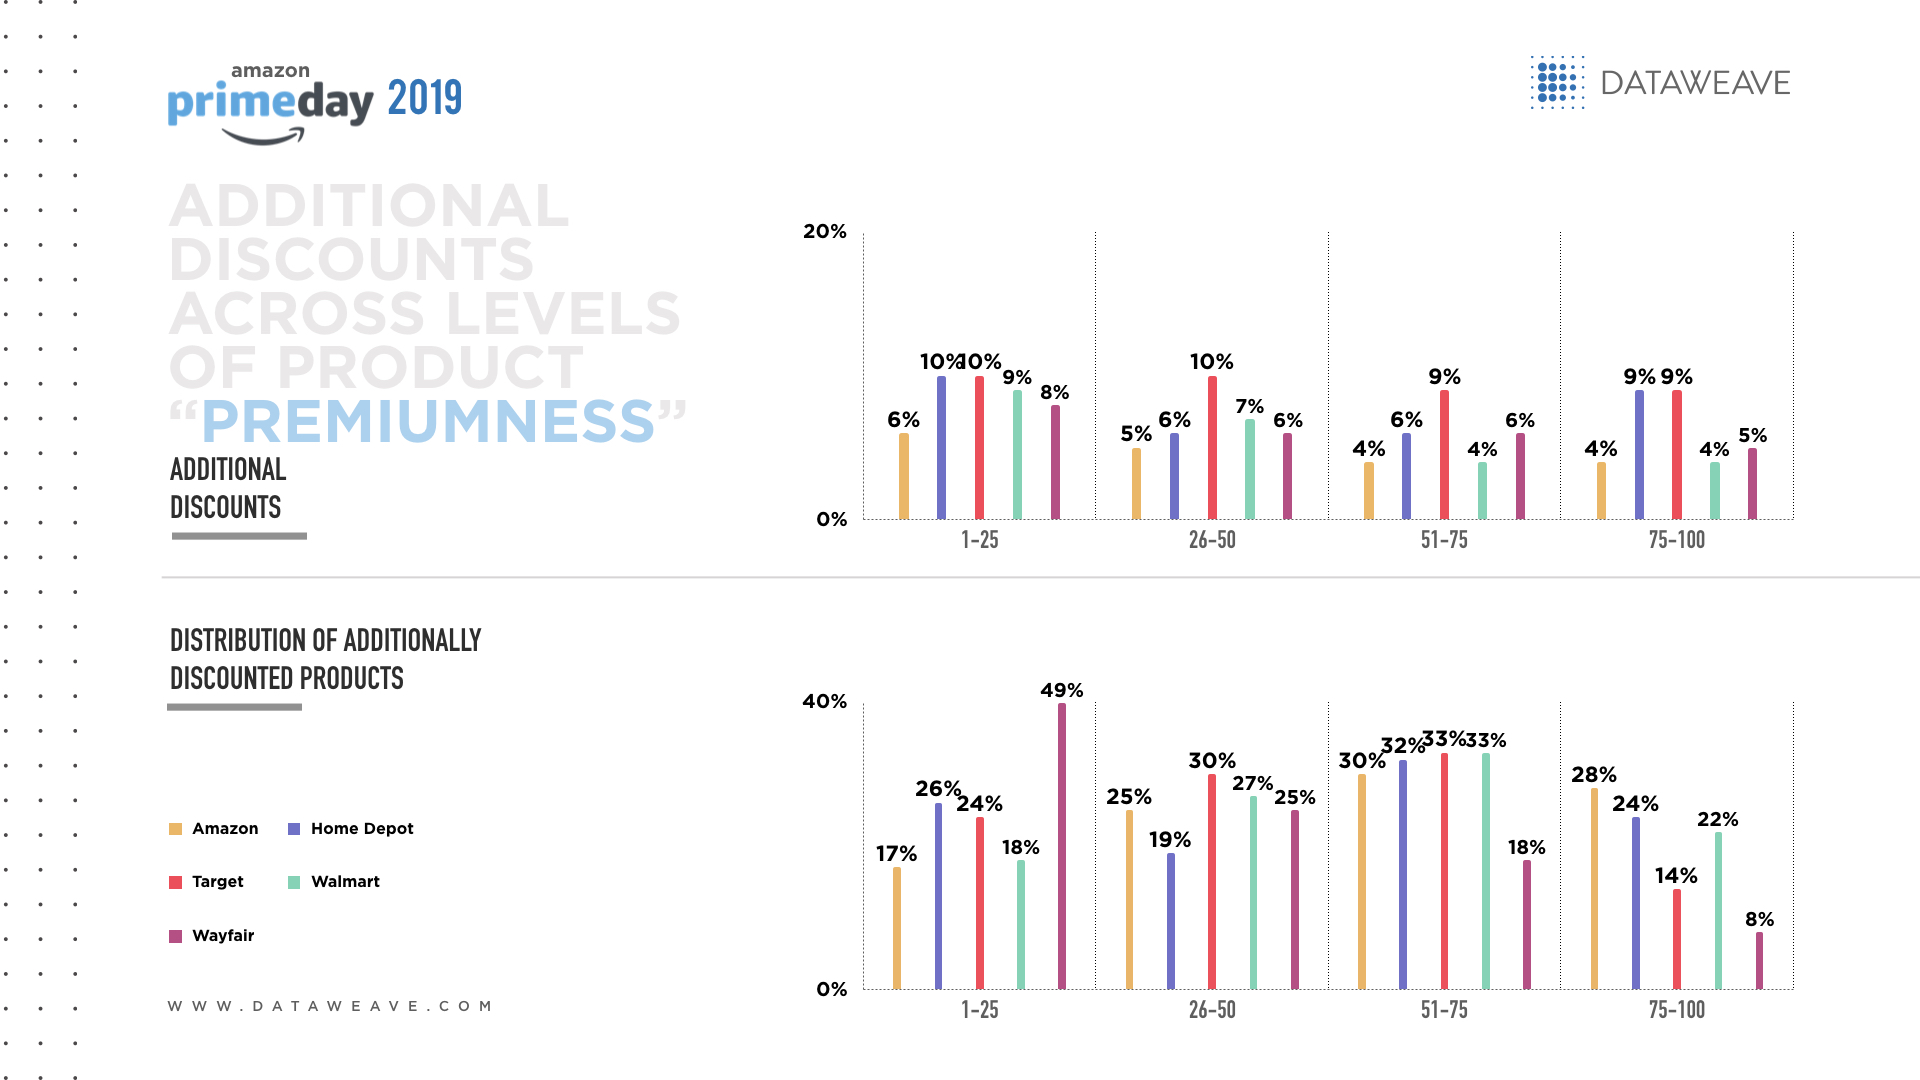
Most of the discounting activity seems to have occurred in the lower end of the premium spectrum, with a view to protect margin – despite a largely healthy distribution of products across percentile ranges. This indicates a clear strategy to protect margins, while also promoting attractive offers to draw traffic.
However, there are a couple of exceptions – Target was consistent throughout the “premiumness” spectrum, resulting in the highest overall discounting activity. Home Depot too was aggressive, but selectively so – it chose attractive pricing for the lower and higher ends of its assortment.
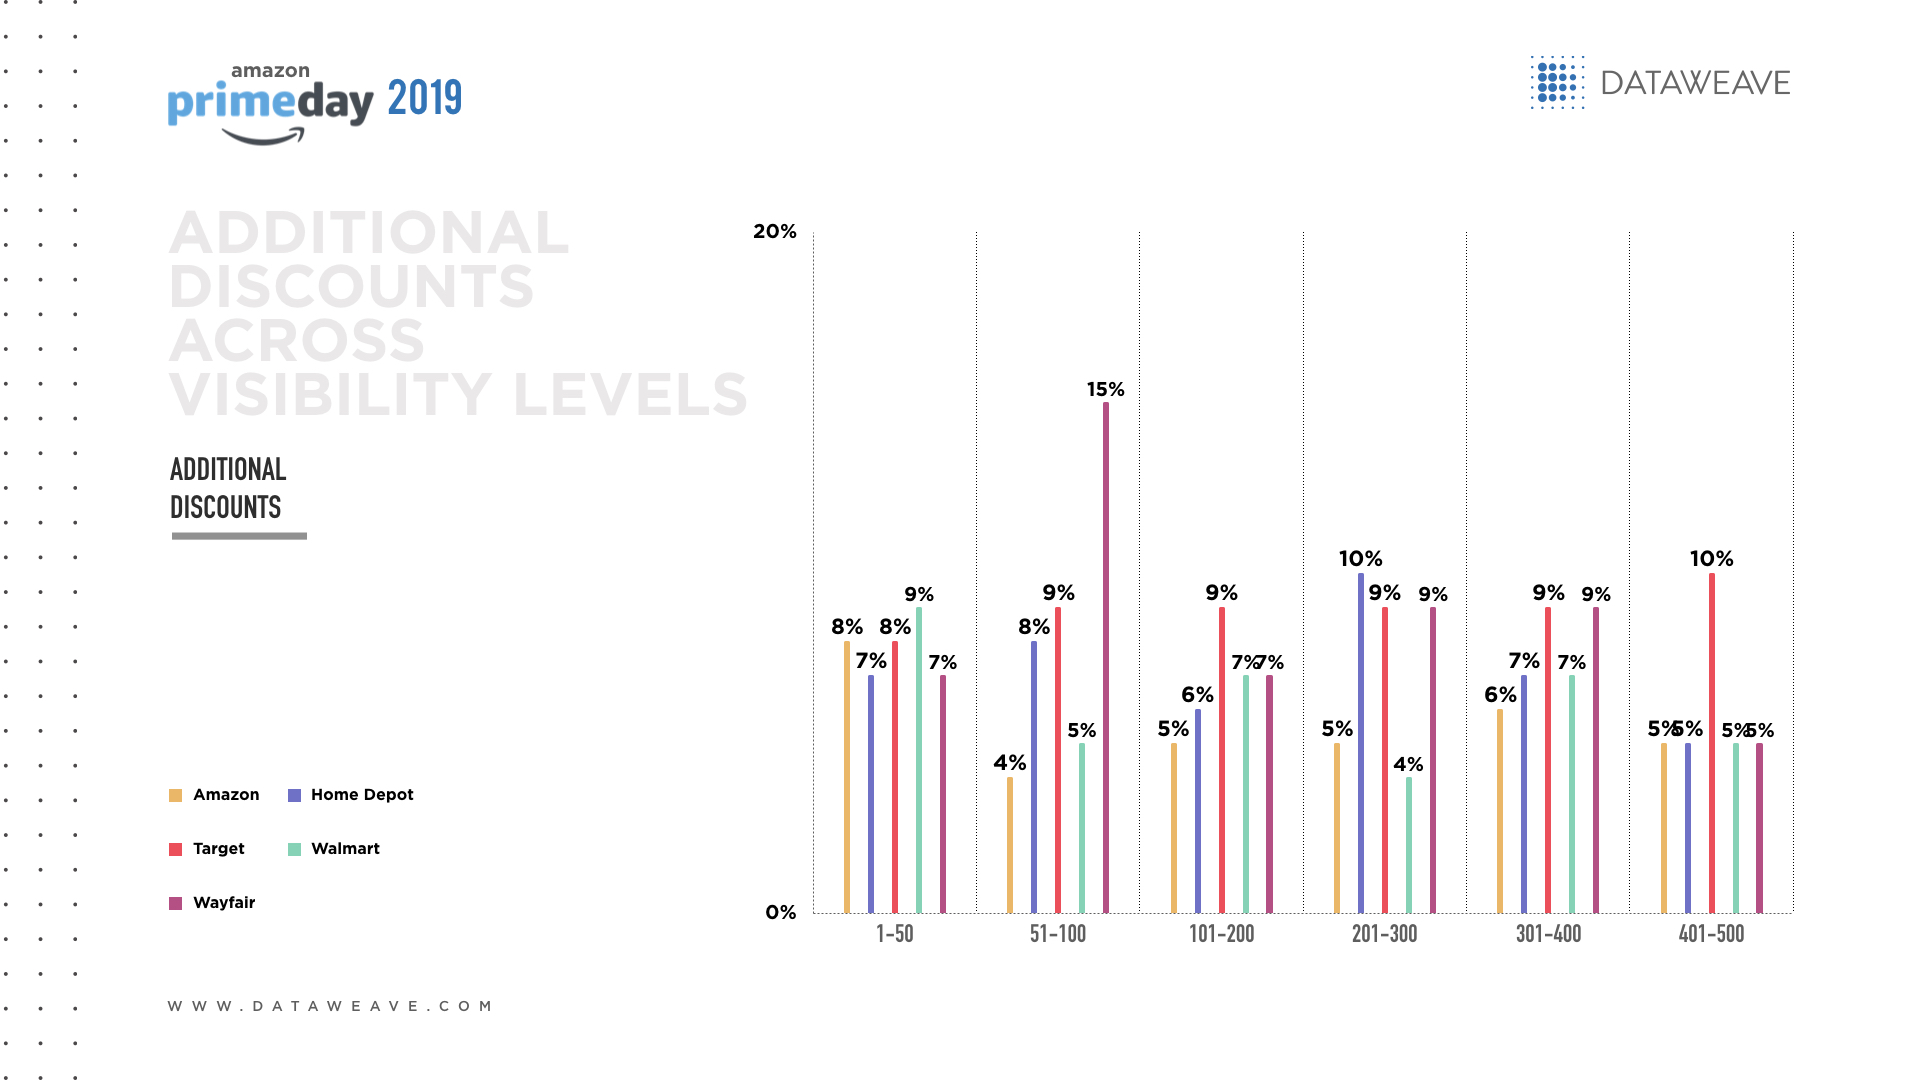
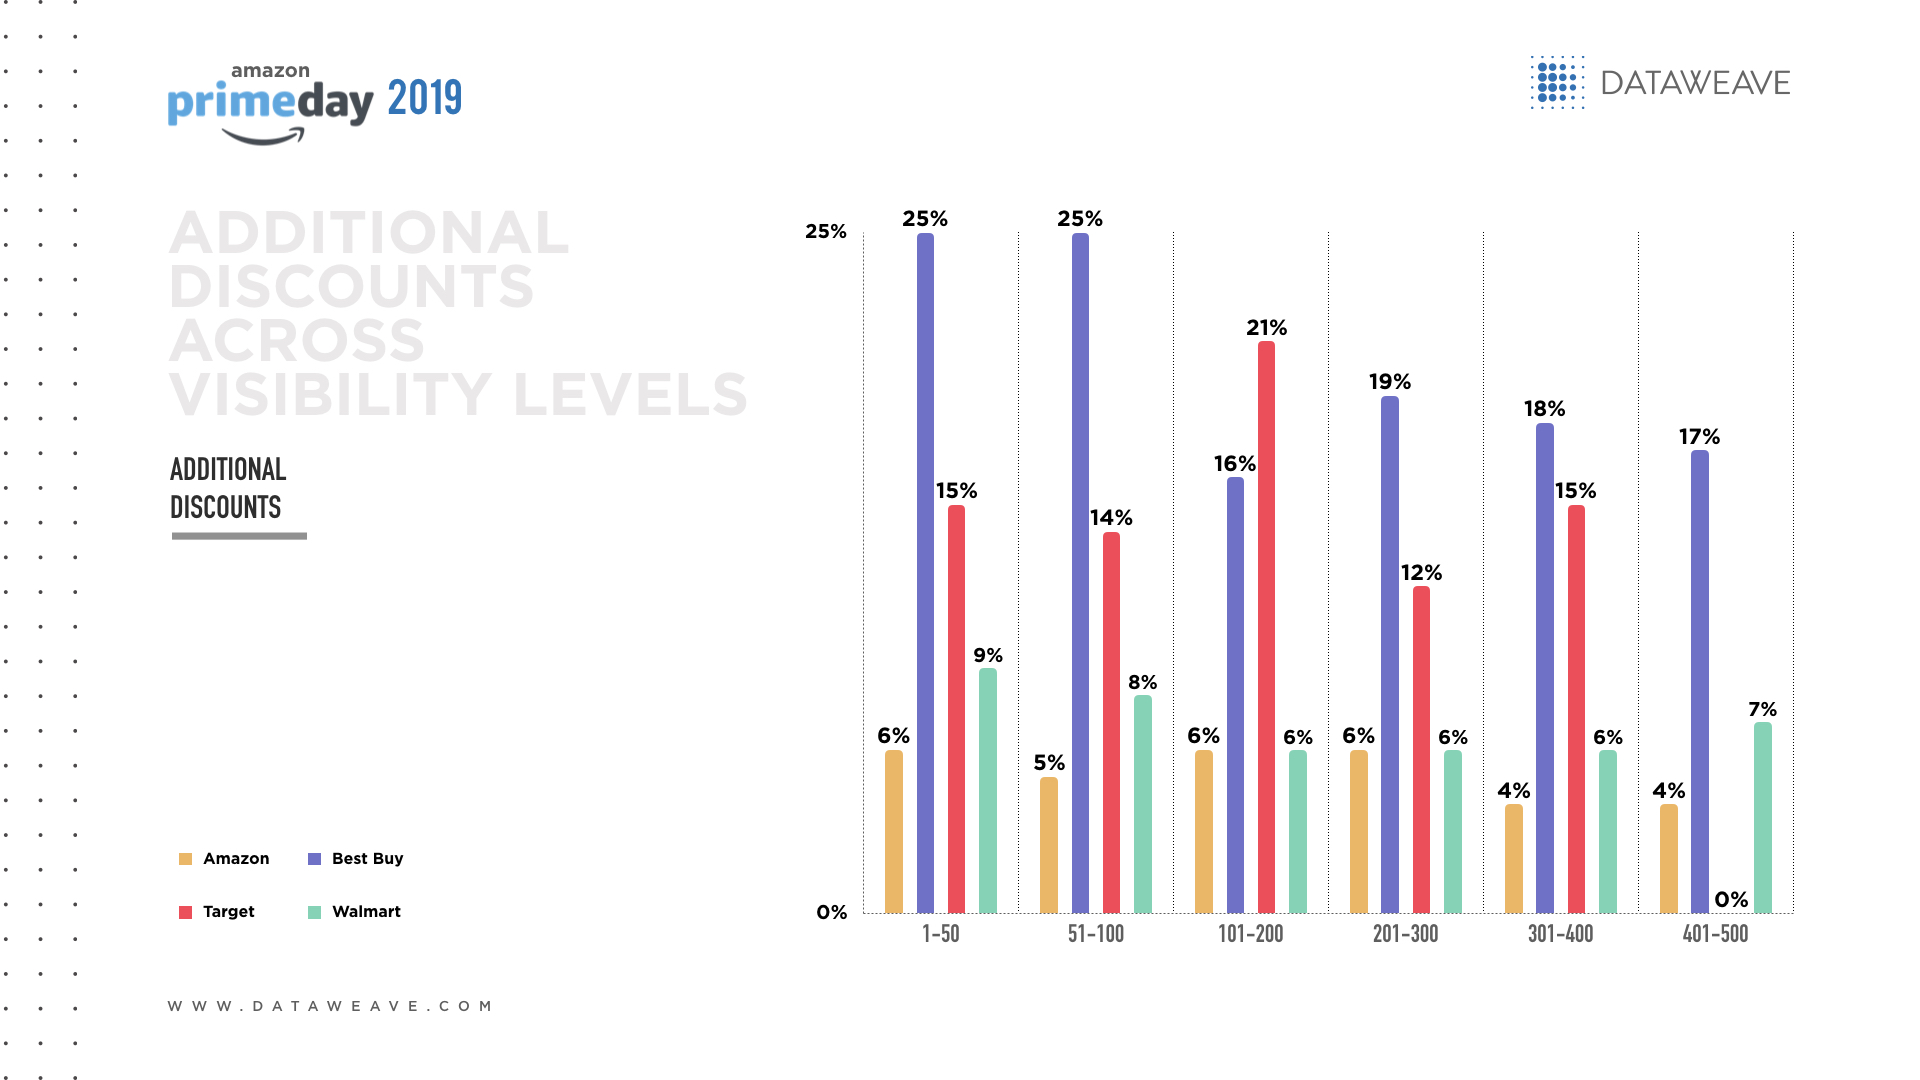
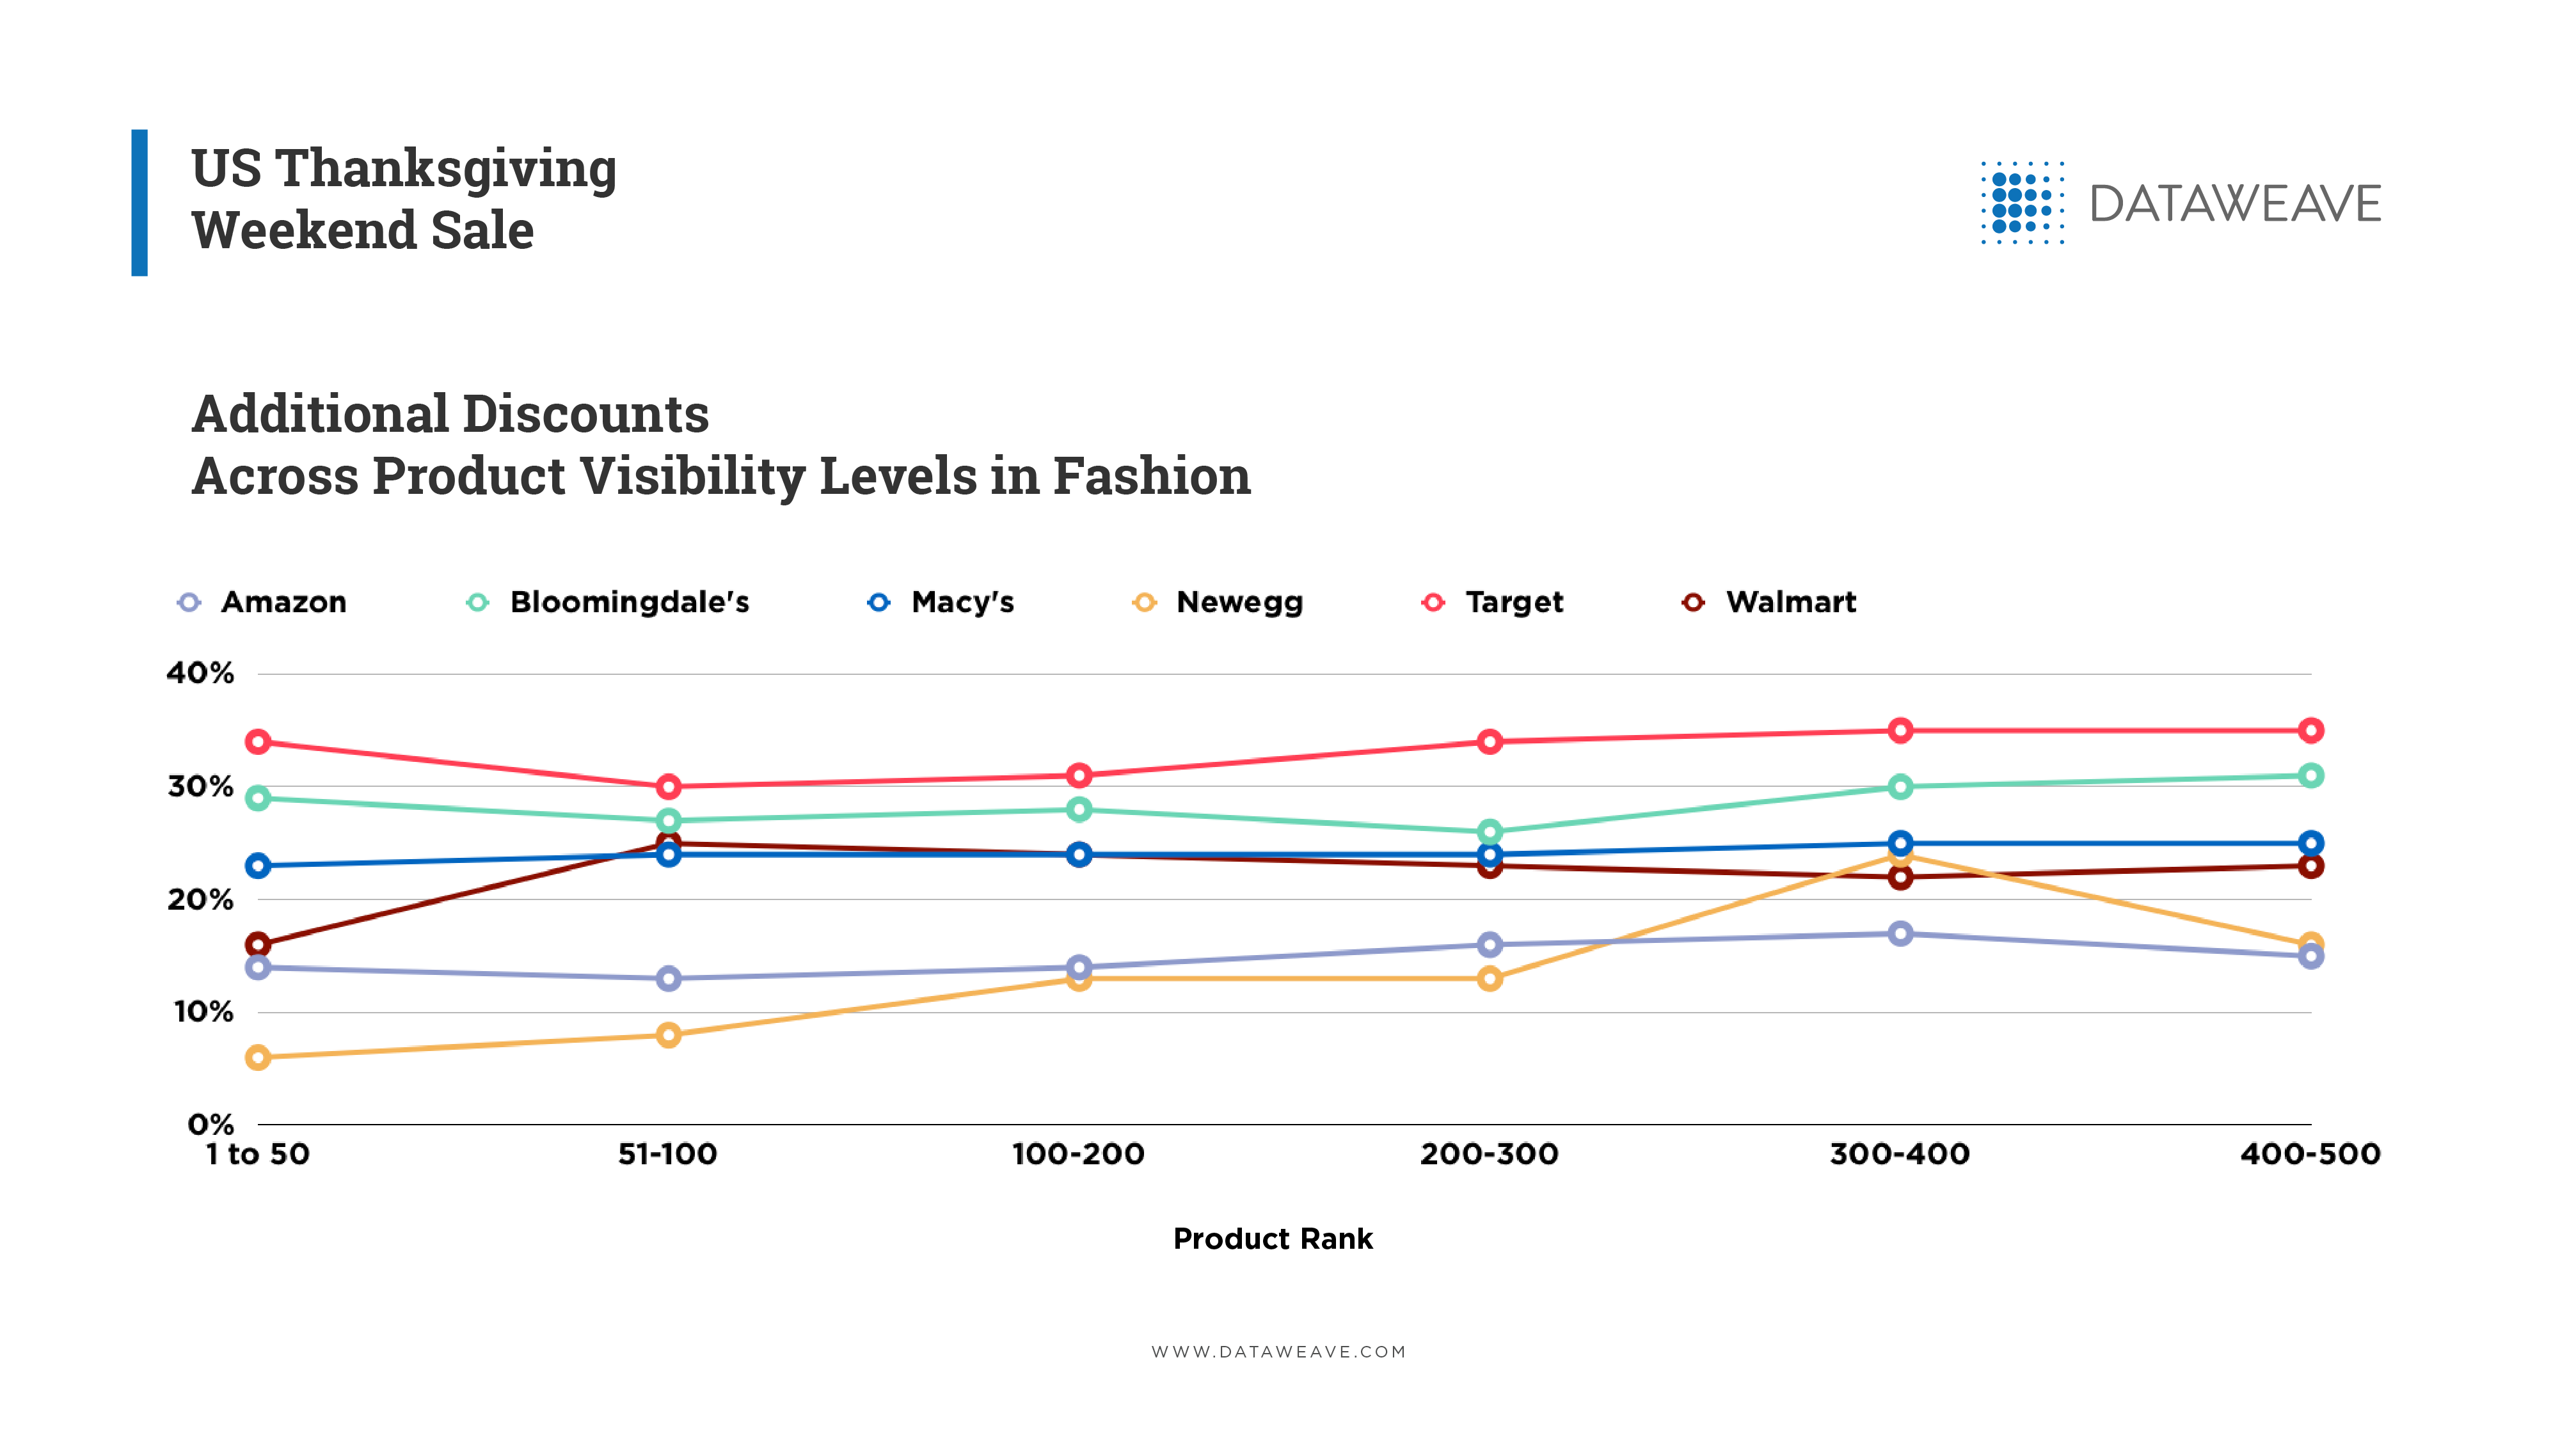
As expected, many retailers showed higher discounting activity in the higher ranks of their listing pages. As usual, though, there are a few exceptions here too. Home Depot and Wayfair indicated unusual patterns – perhaps relying on search results as opposed to organic listing page results. On the other hand, Target again indicated a consistent pattern, with mostly similar discounts across visibility levels.
Overall, across all parameters analyzed, both the Electronics and Furniture categories have been treated quite similarly in terms of pricing activity by most retailers. Is Prime Day really all about its marketing hype, or will it live up to its promise in at least one segment? Stay with us to find out as we follow through with our series of articles analyzing various product categories on this year’s Prime Day.