Black Friday 2025 marked another significant shopping event for Canadian consumers, with retailers deploying sophisticated pricing strategies to capture holiday spending. Online and in-store spending on Black Friday reached an estimated $865 million in Canada, which marked a 6% increase compared to last year.
At DataWeave, we analyzed Black Friday 2025 pricing dynamics across two major categories in the Canadian market: Consumer Electronics and Home & Furniture. Our AI-powered pricing intelligence platform tracked approximately 16,000 SKUs across leading Canadian retailers like Target, Walmart, Wayfair, Home Depot, Amazon, Best Buy, Loblaws, Metro and more, uncovering distinct patterns in how brands and retailers structured their promotional calendars this year.
Our Methodology
DataWeave monitored pricing and discount trends across Canadian retailers during two key timeframes:
Pre-Black Friday Period: Up to November 23, 2025 – establishing baseline promotional activity and early holiday deals
Black Friday Week: November 24 – December 1, 2025 – spanning Thanksgiving through Black Friday (November 28) and Cyber Monday (December 1)
Our dataset included top-performing products across multiple subcategories on major Canadian retail platforms. We also tracked Share of Search metrics, measuring brand prominence by analyzing which brand names appeared in the top 20 search results for high-value keywords during each period.
Black Friday 2025 Canada: Overview
Here’s how average discounts compared between the Pre-Black Friday period and Black Friday Week:
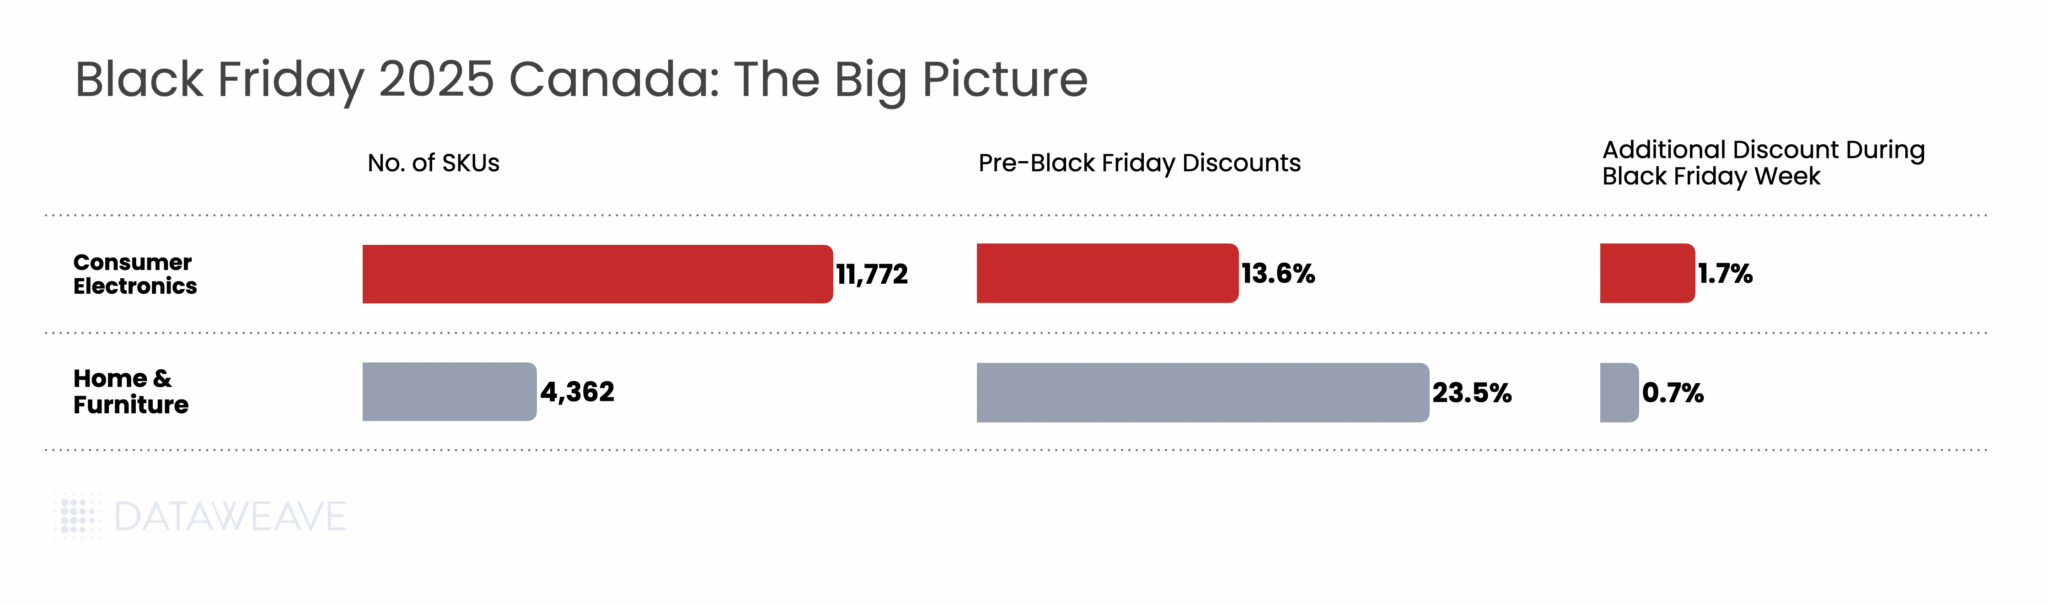
Key Finding: Canadian retailers front-loaded their promotional strategy significantly, with Pre-Black Friday discounts averaging 16.3% across categories. The additional lift during Black Friday Week was modest at 1.4%.
Consumer Electronics
Consumer electronics consistently drives Black Friday traffic, and Canadian retailers delivered compelling early-season value. Our analysis of 11,772 SKUs reveals nuanced subcategory performance.
Subcategory Discount Breakdown
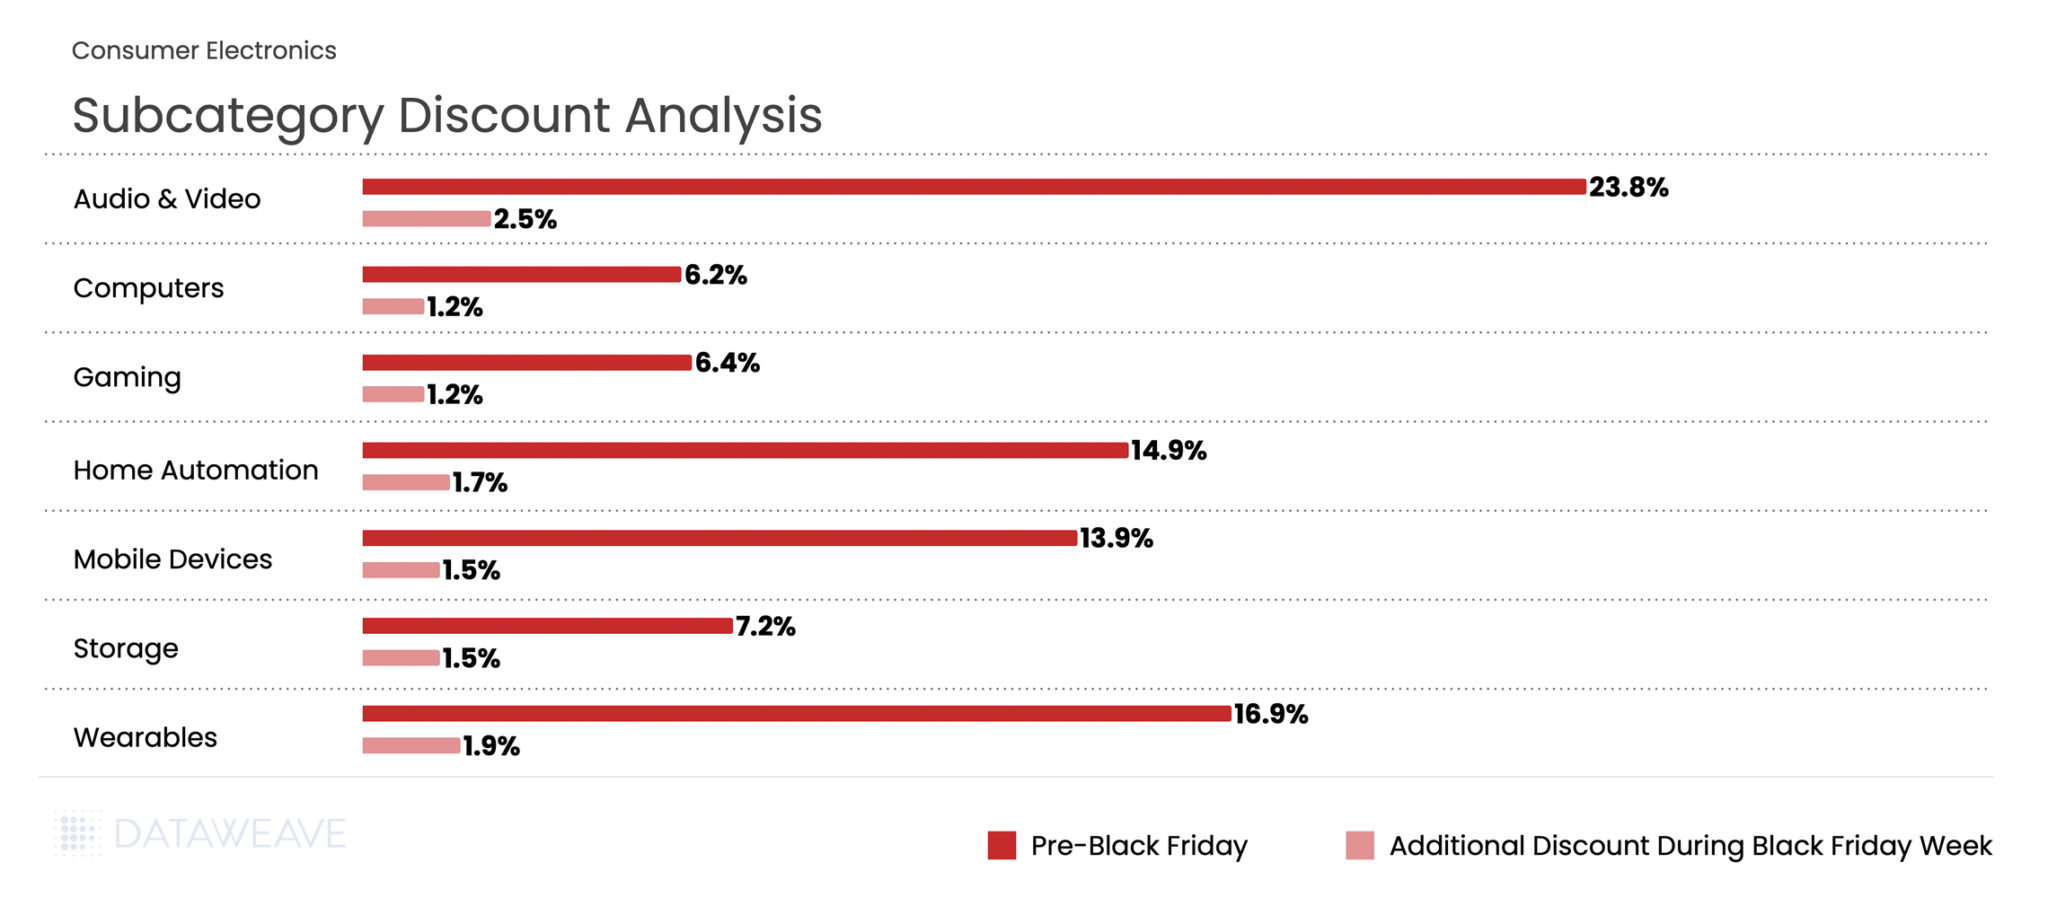
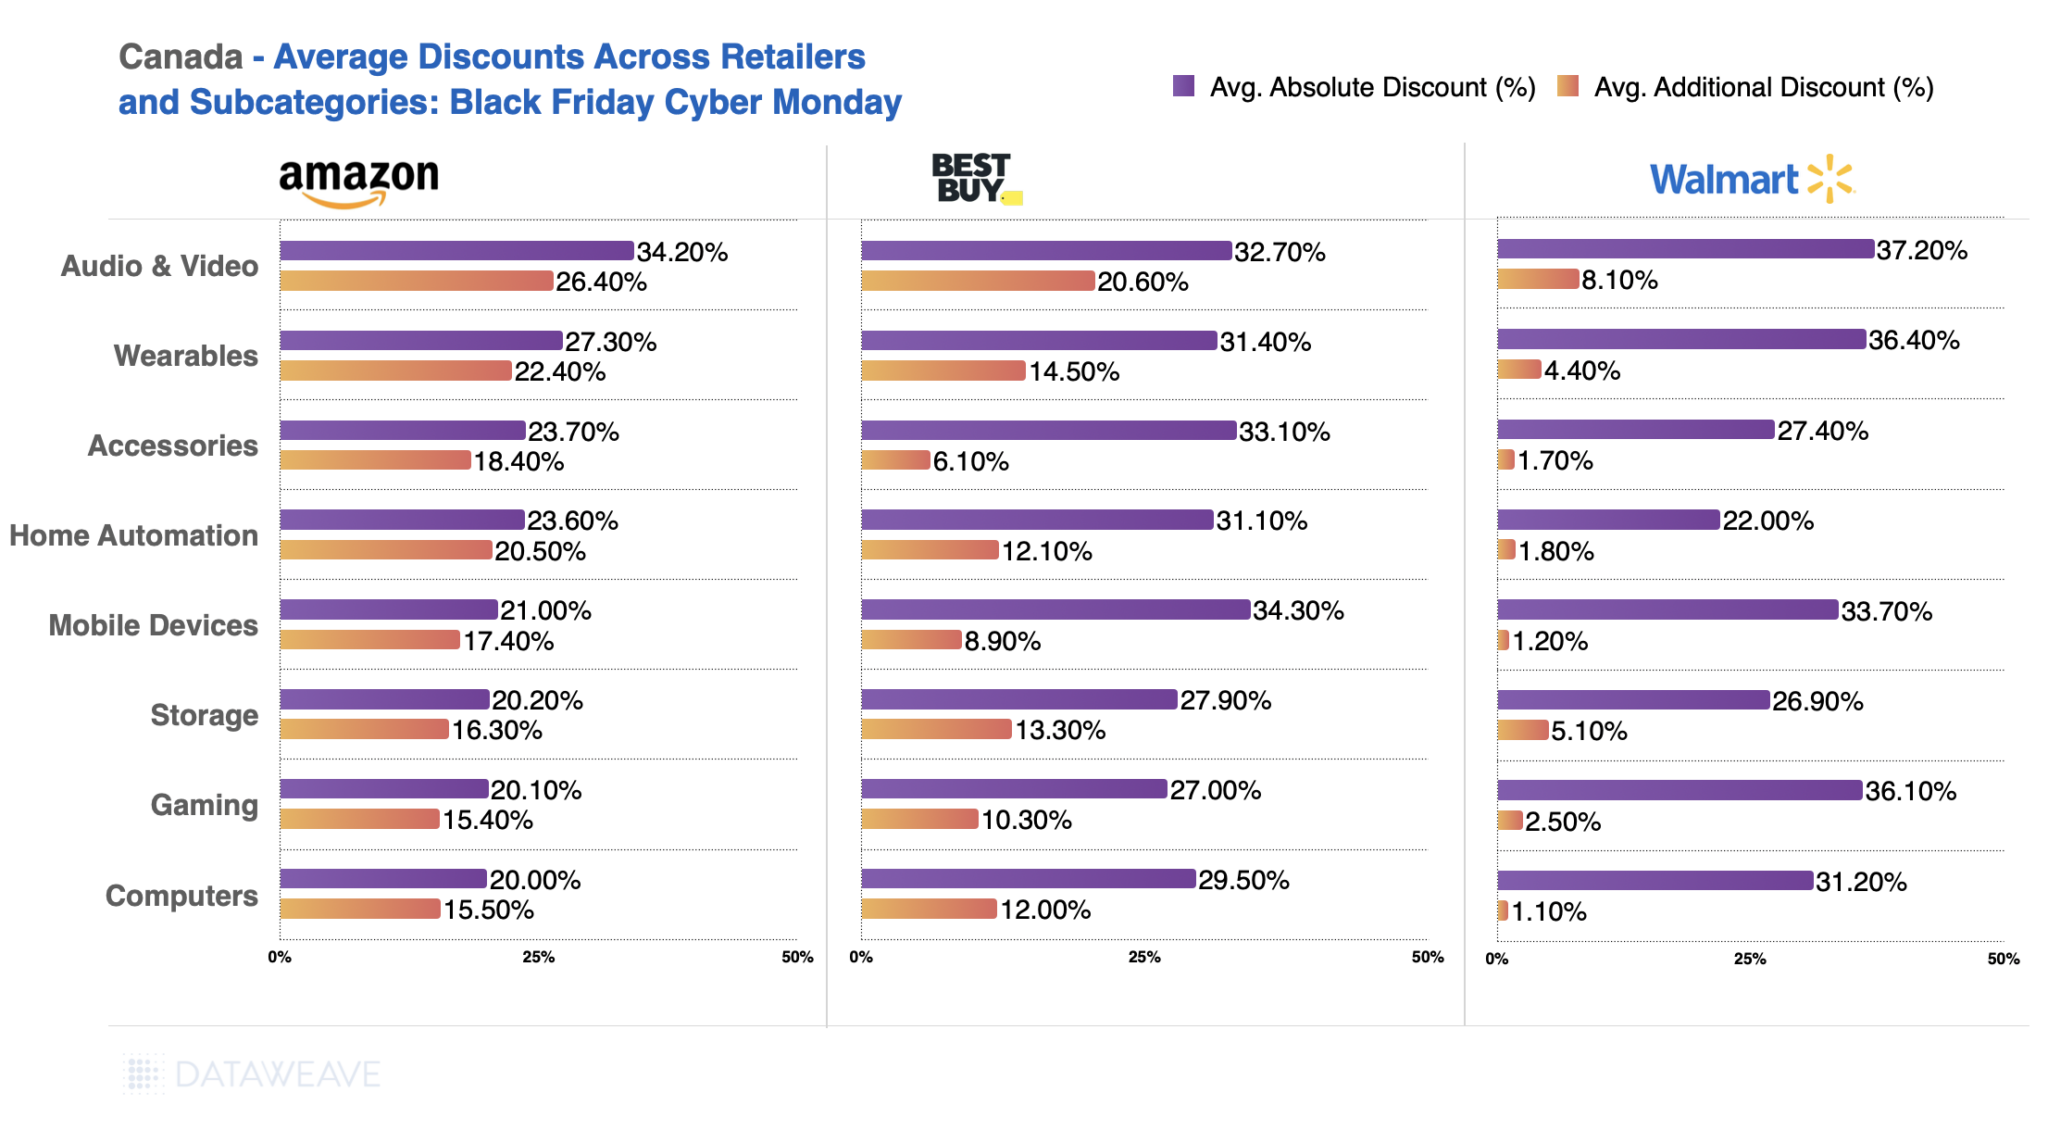
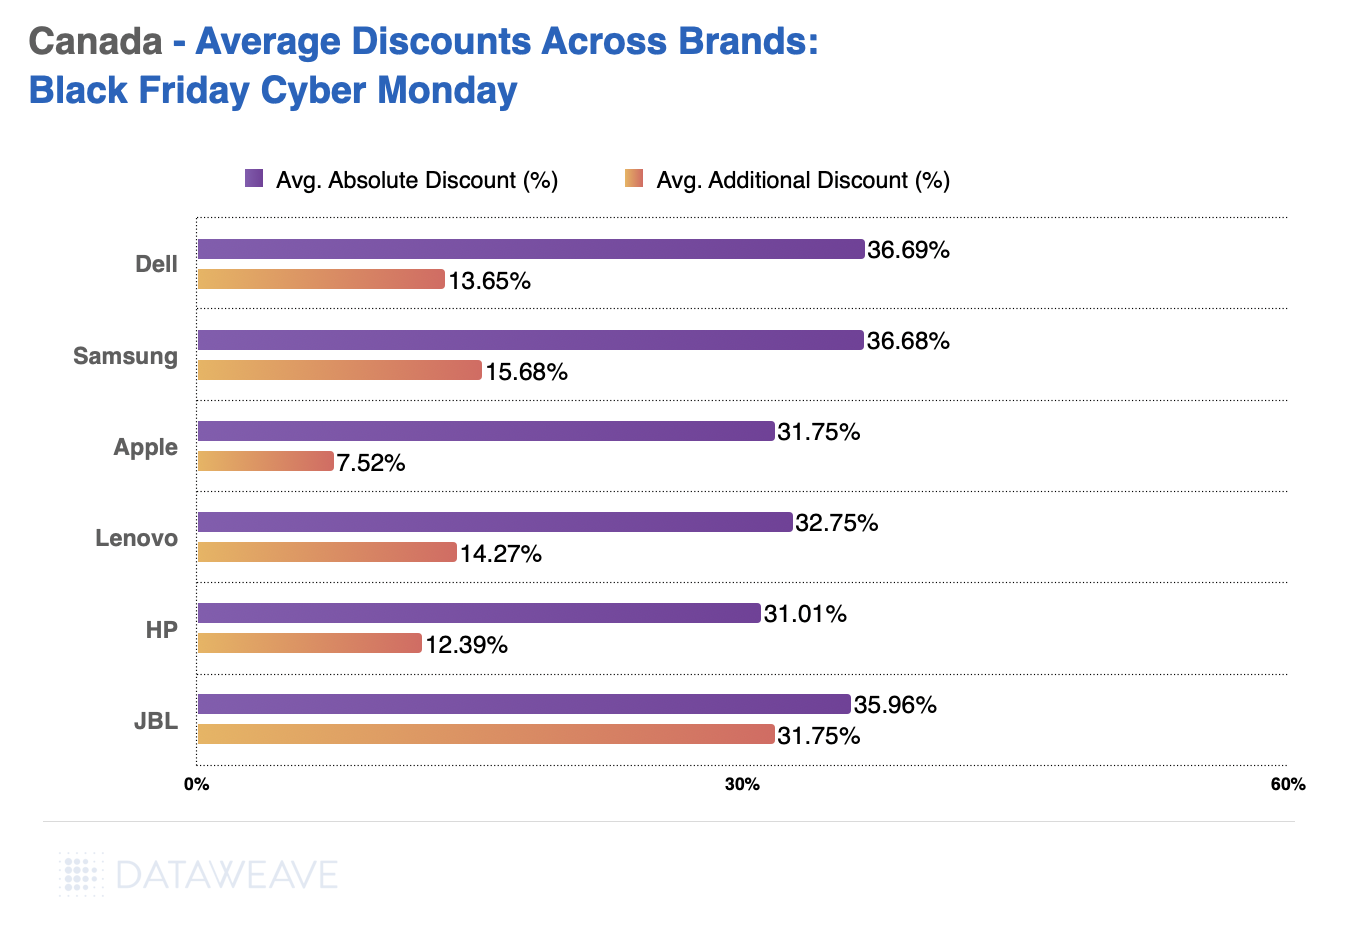
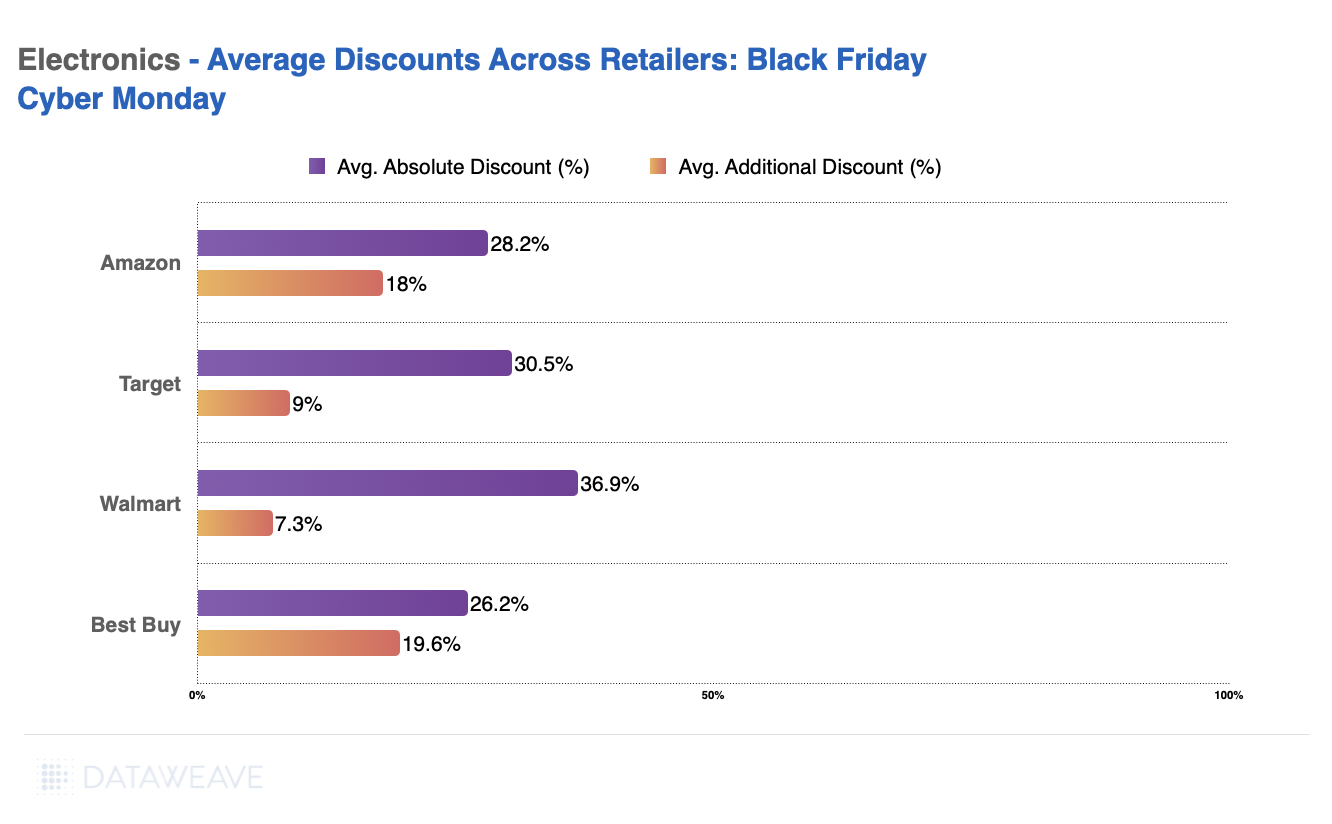
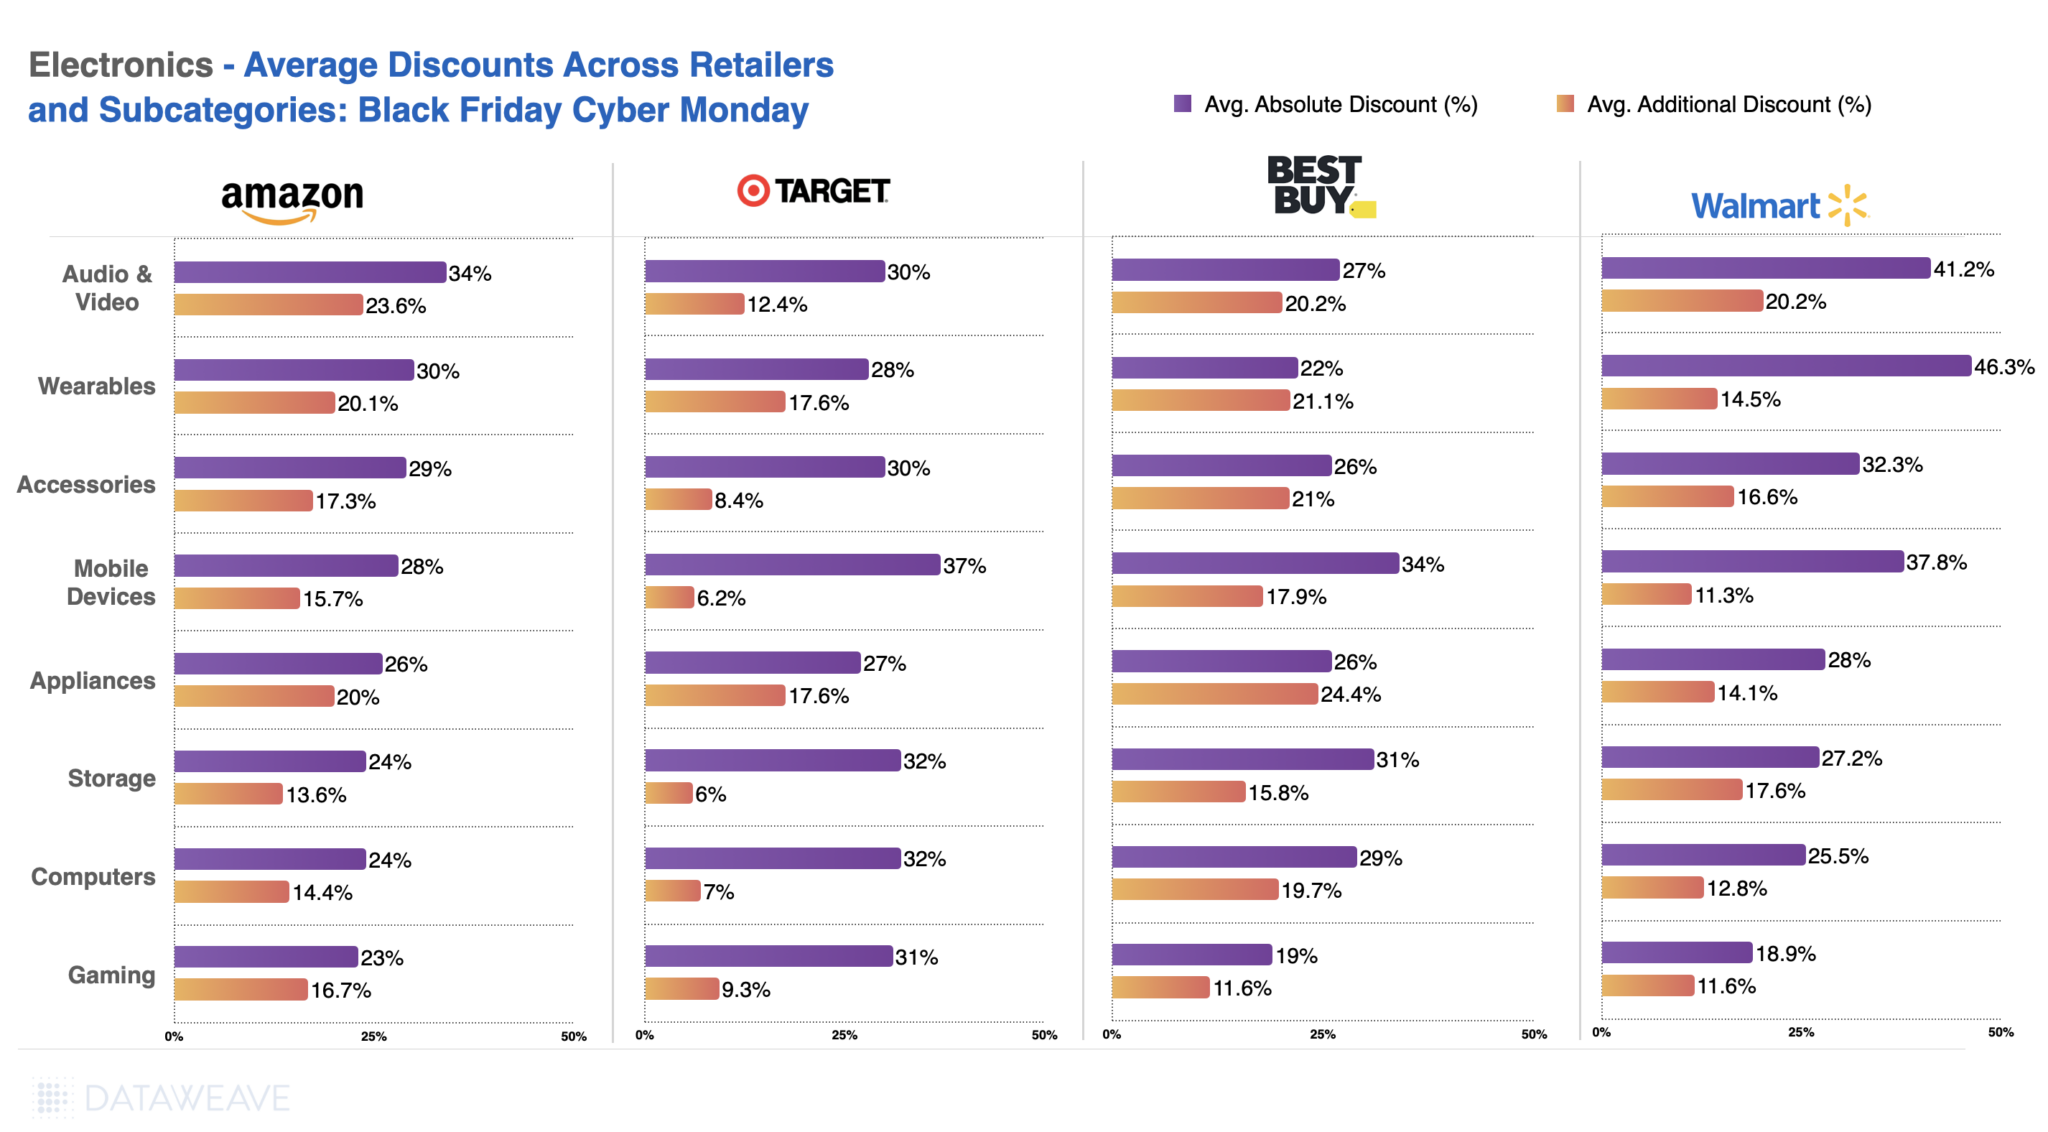
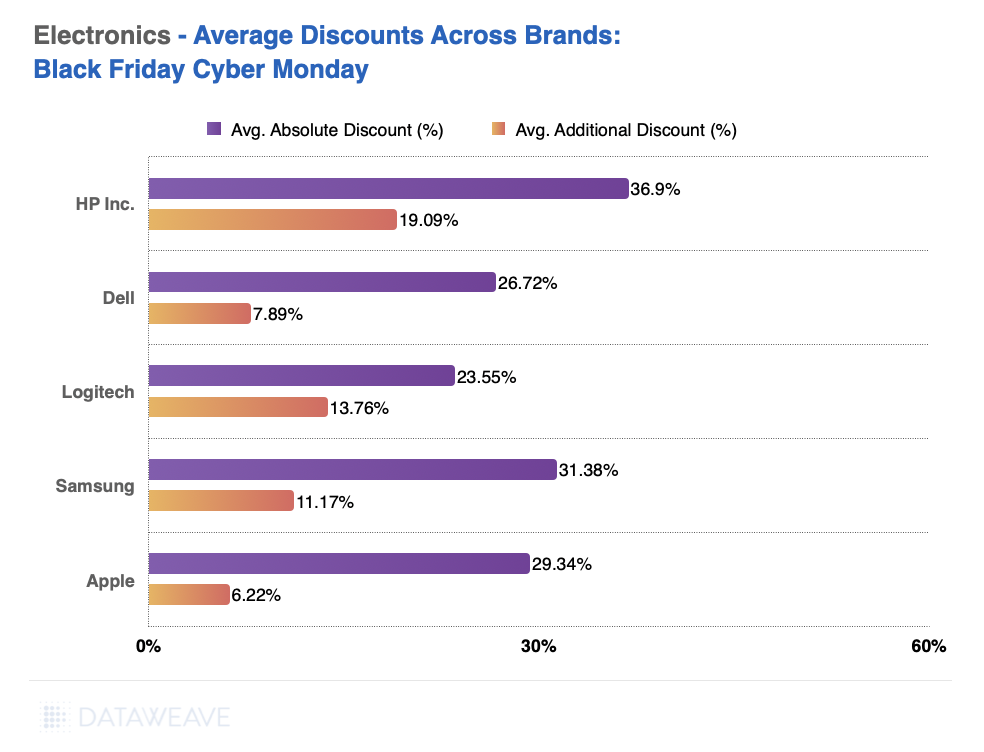
Consumer Electronics averaged 13.6% discounts in the Pre-Black Friday period, with Black Friday Week adding 1.7%. Audio & Video dominated early promotional activity at 23.8%, signalling retailers’ intent to clear inventory ahead of the main event. Wearables followed at 16.9%, likely timed to capture gift-buying momentum.
During Black Friday Week, Audio & Video maintained leadership with an additional 2.5% discount, the highest incremental lift in the category. Meanwhile, Computers and Gaming, already positioned at modest pre-sale discounts of 6.2% and 6.4%, saw minimal additional movement, suggesting constrained inventory or deliberate pricing discipline in these segments.
Share of Search: Brand Visibility Trends
Our Share of Search data reveals which brands gained or lost prominence during Black Friday Week:
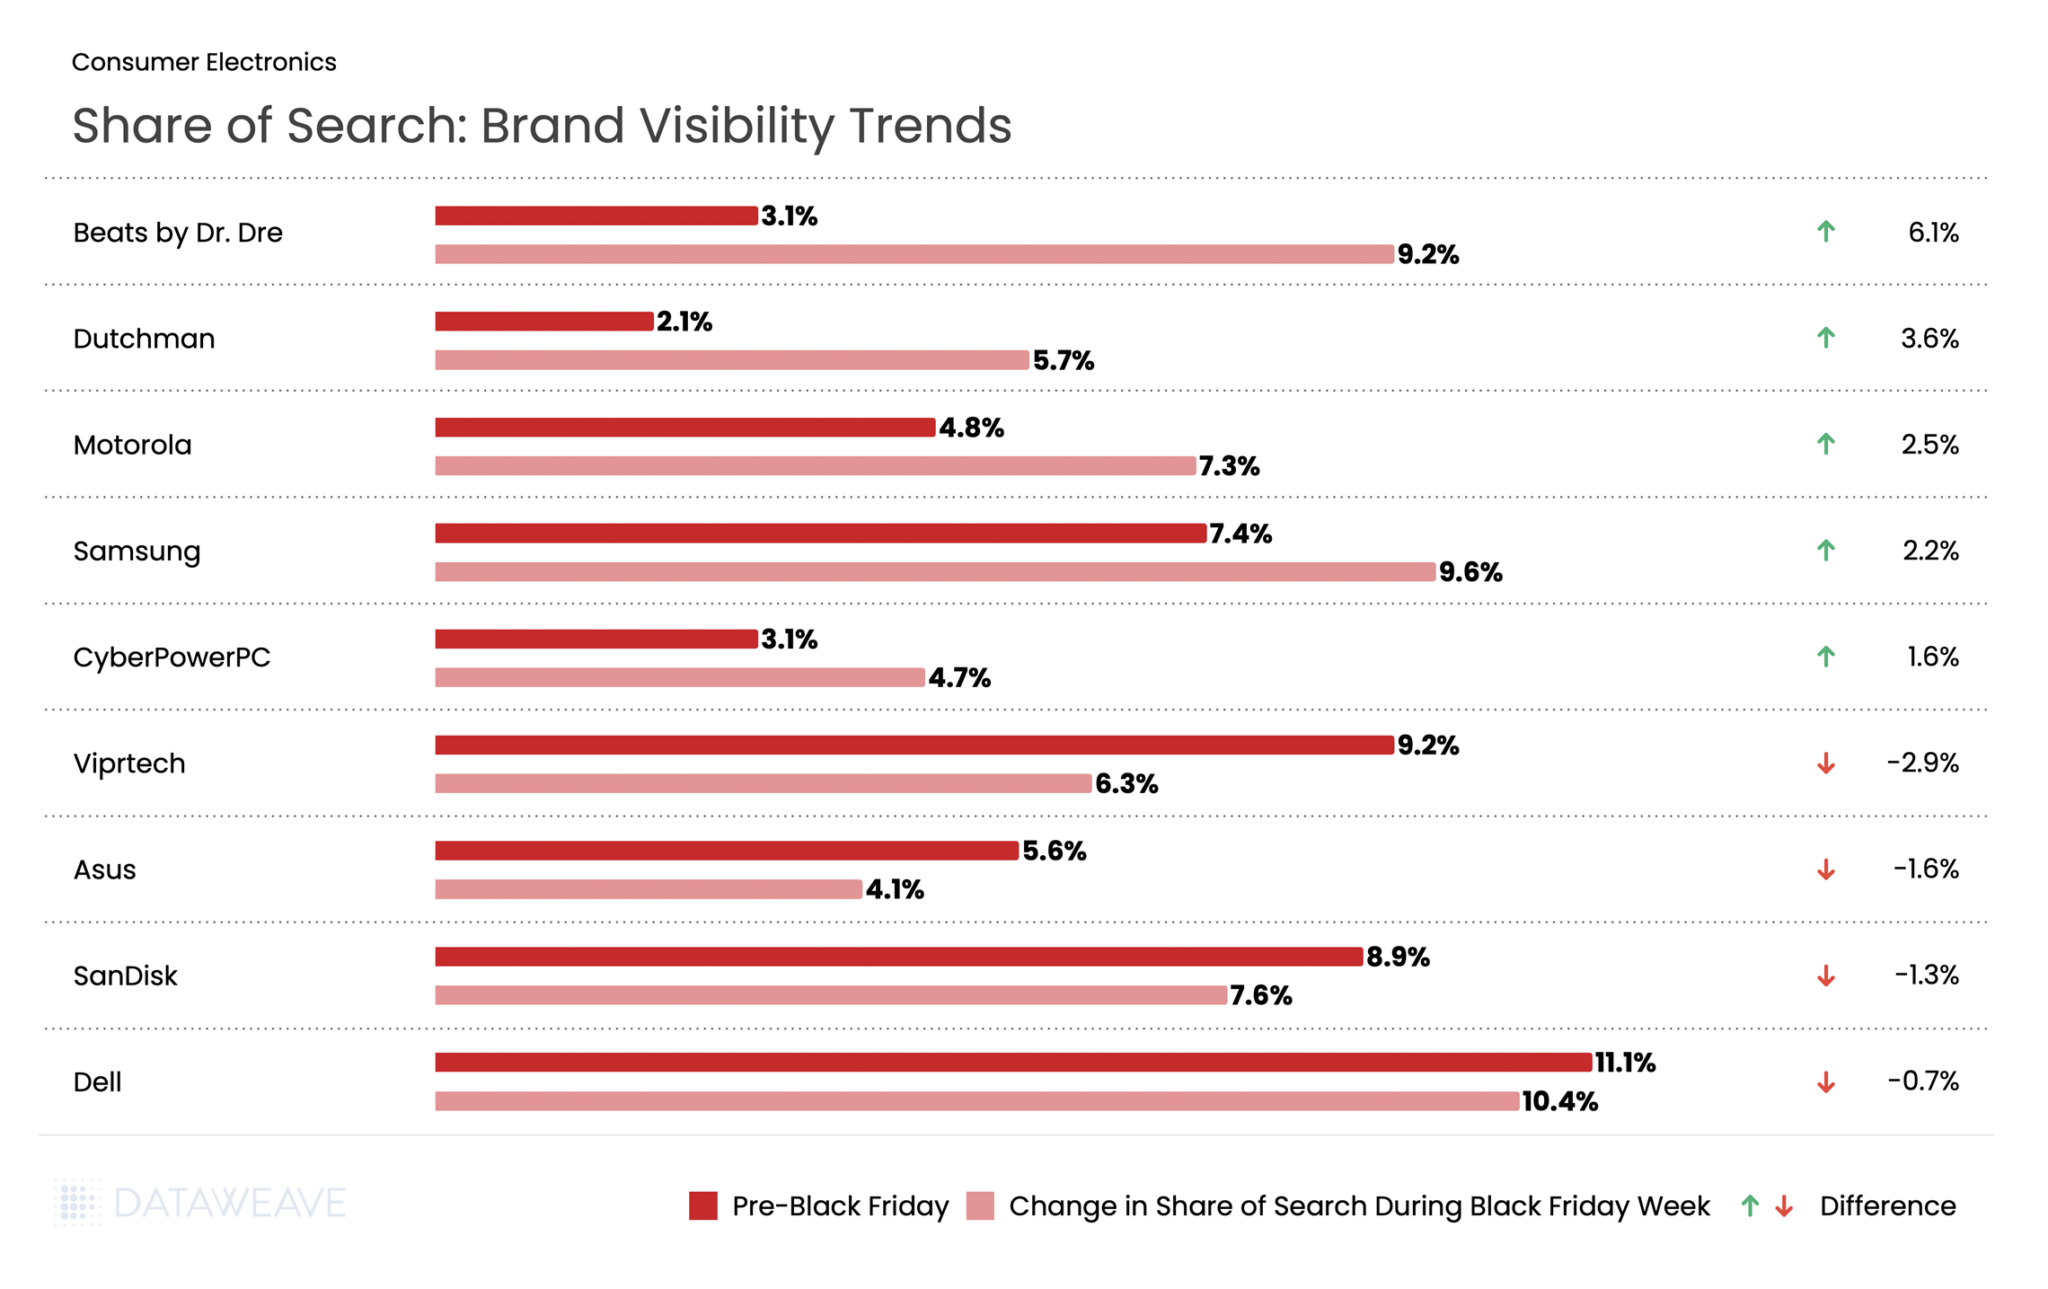
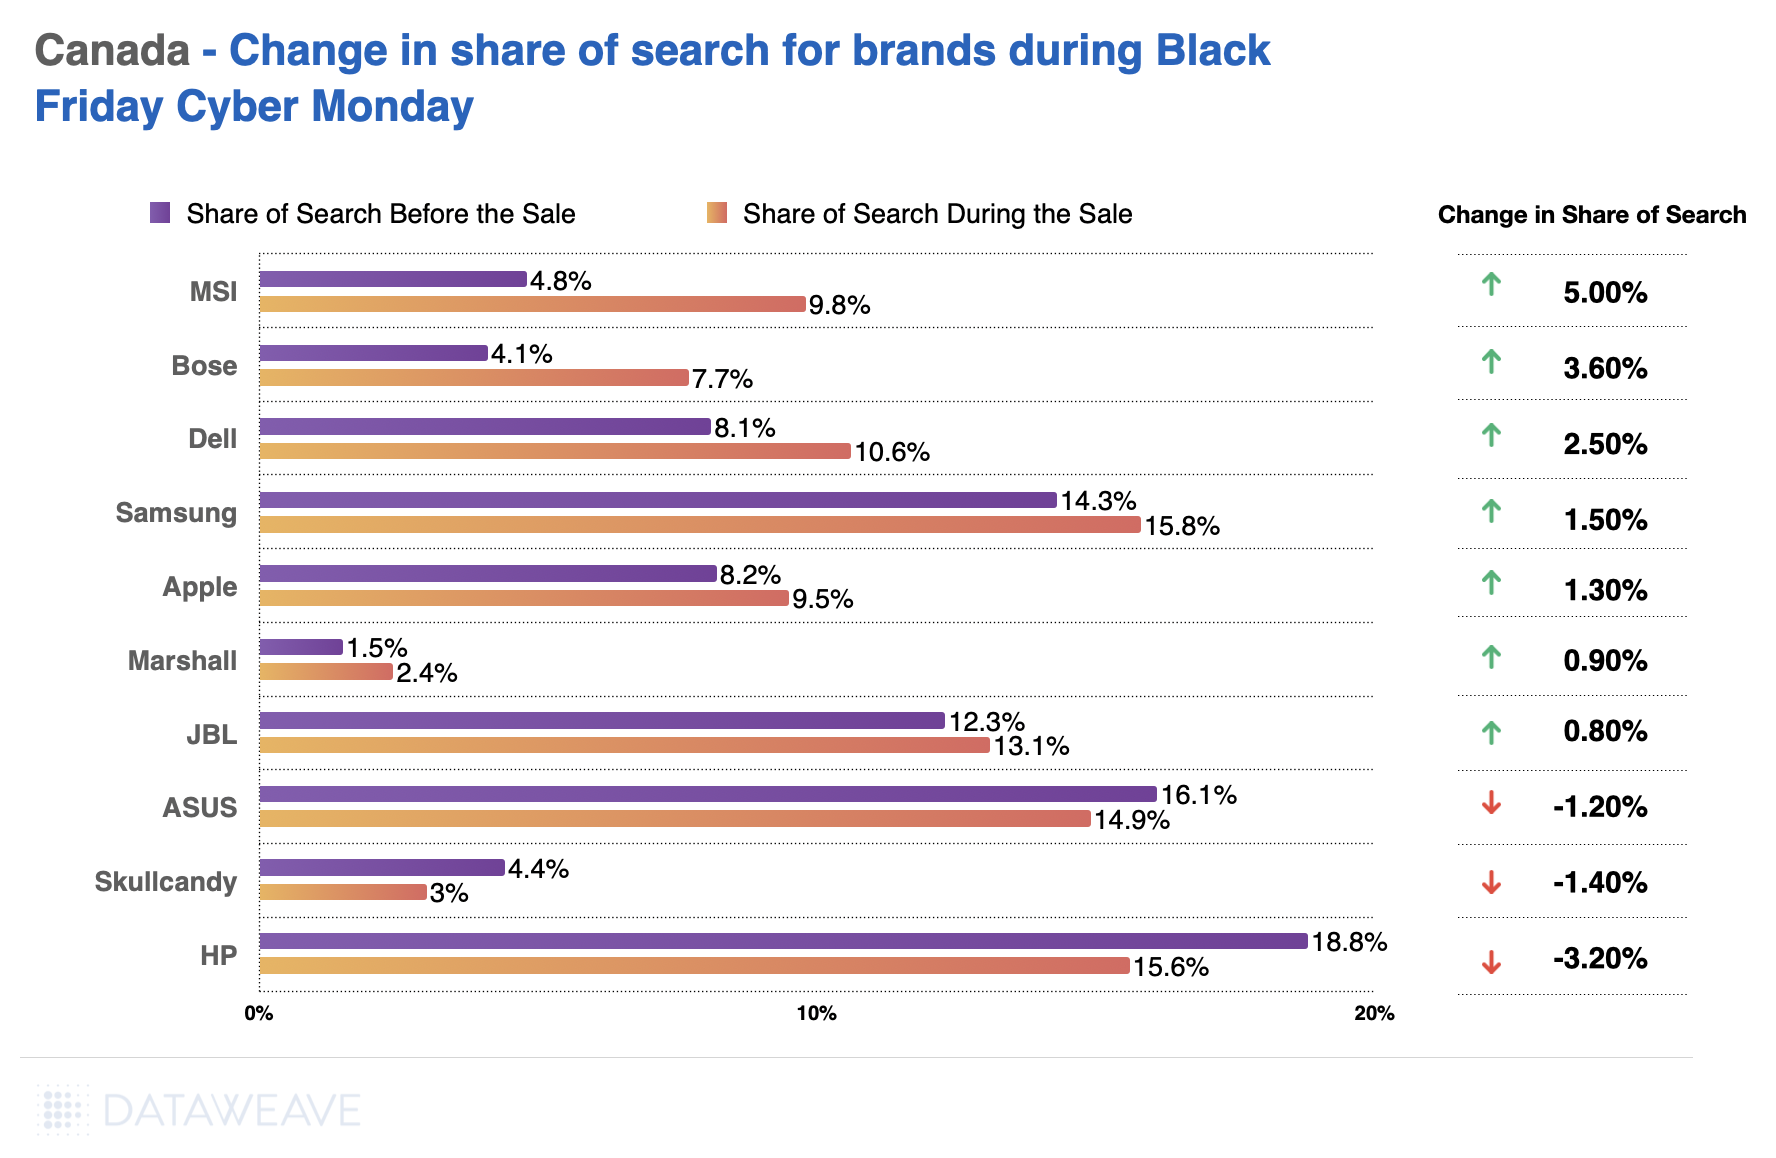
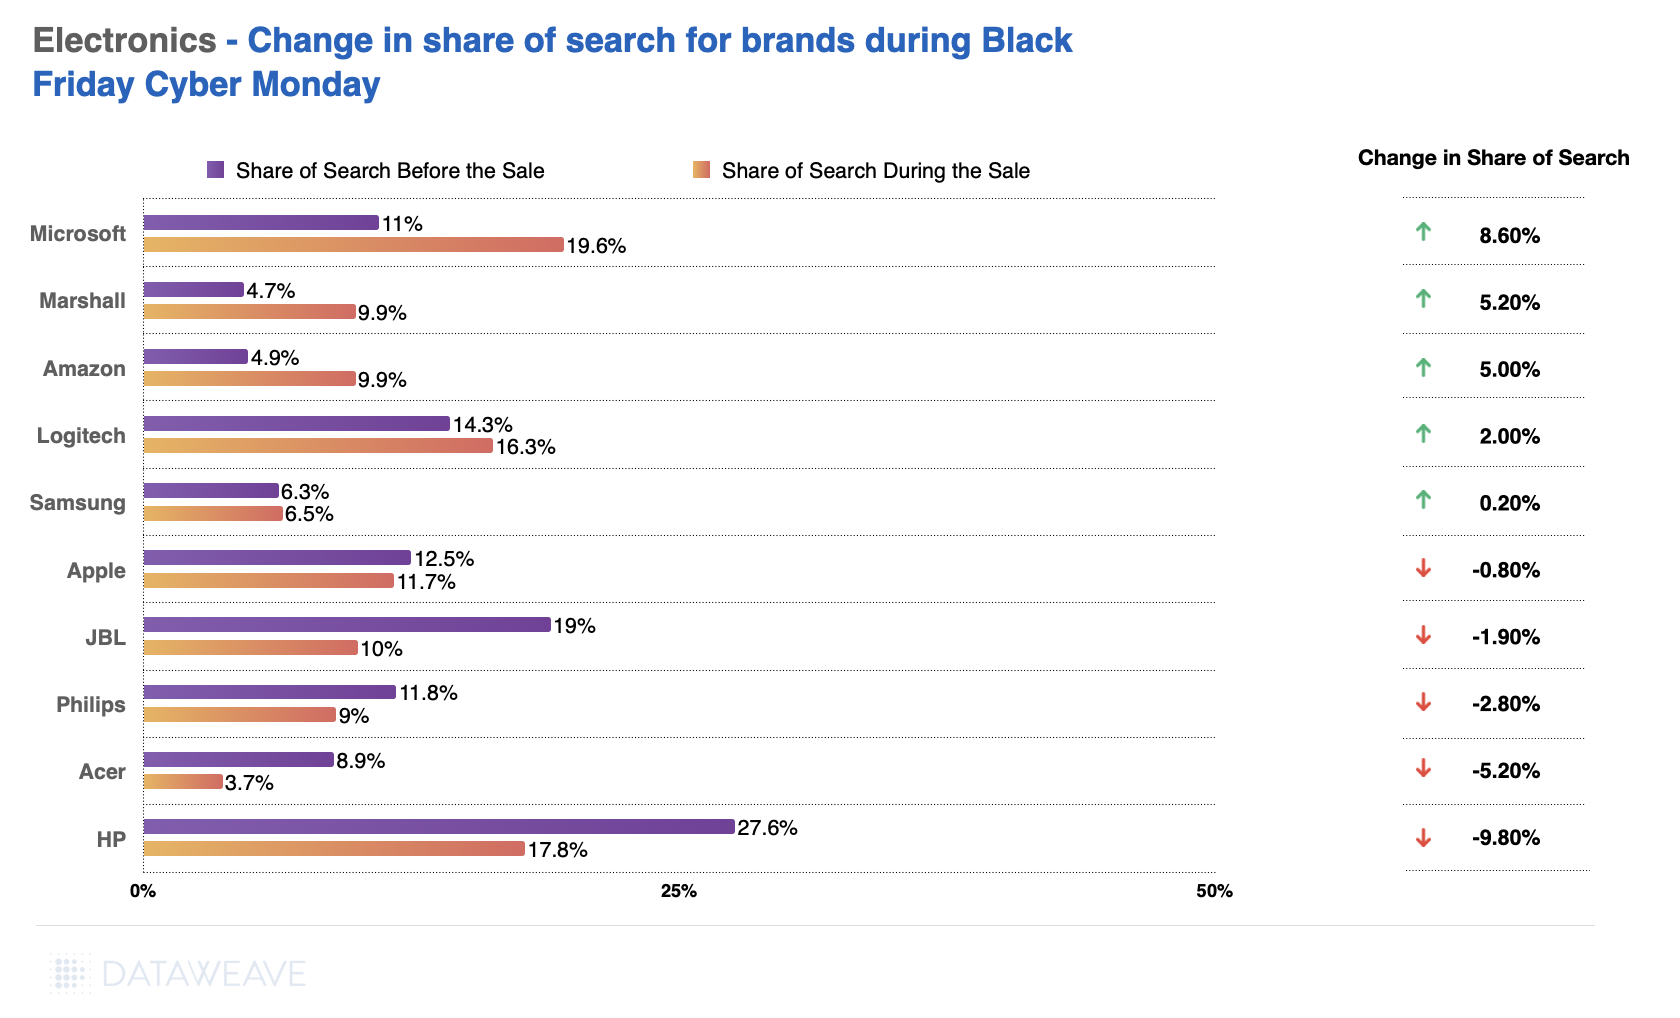
Audio brands dominated visibility gains during Black Friday Week. Beats by Dr. Dre nearly tripled its Share of Search from 3.1% to 9.2%, showing the strongest gains. Visibility for Dutchman climbed 3.6%. Motorola and Samsung also captured increased search prominence with gains of 2.5% and 2.2% respectively.
Conversely, some established tech brands experienced visibility declines. Gaming brand Viprtech by 2.9%. Asus declined by 1.6%, and SanDisk dropped by 1.3%.
Home & Furniture
Home & Furniture showed the most aggressive early discounting of any category in our Canadian analysis. Tracking 4,362 SKUs, we found retailers heavily promoted home goods well before Black Friday weekend.
Subcategory Discount Breakdown
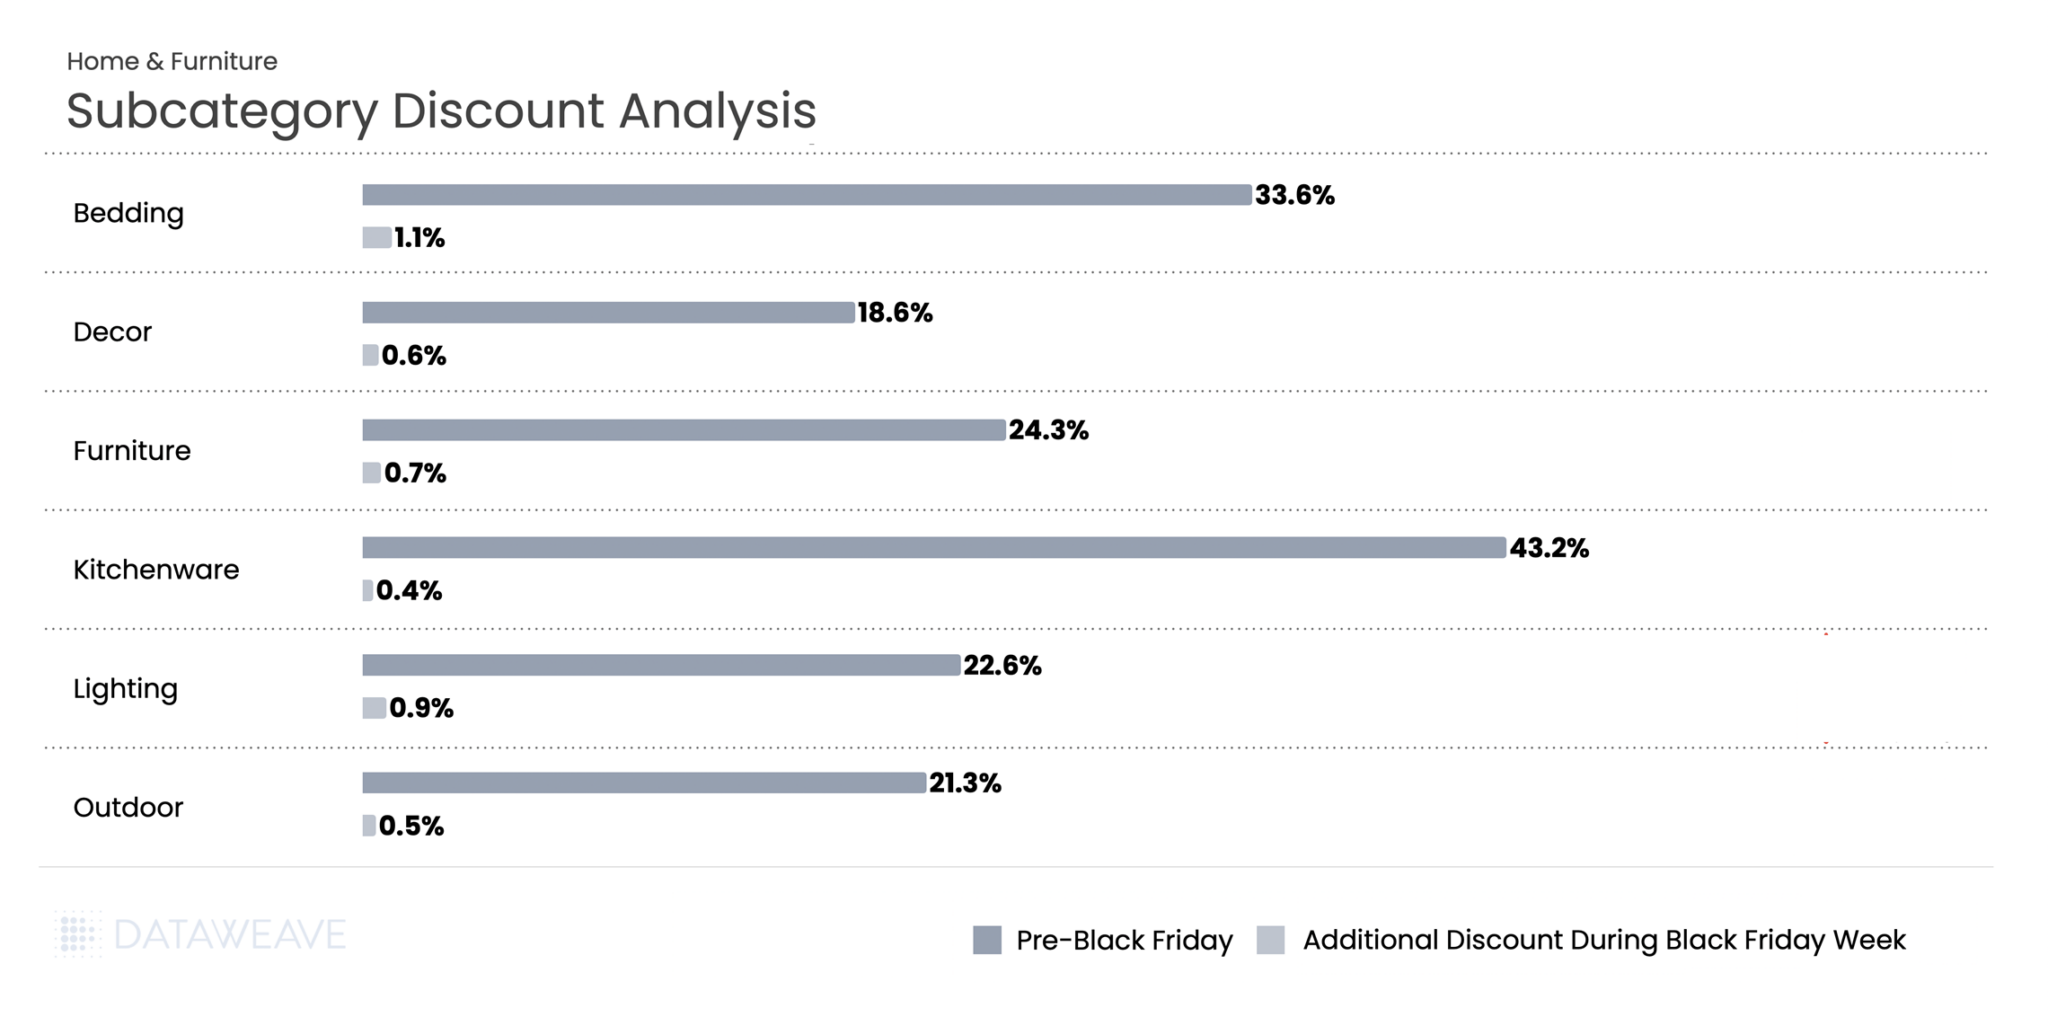
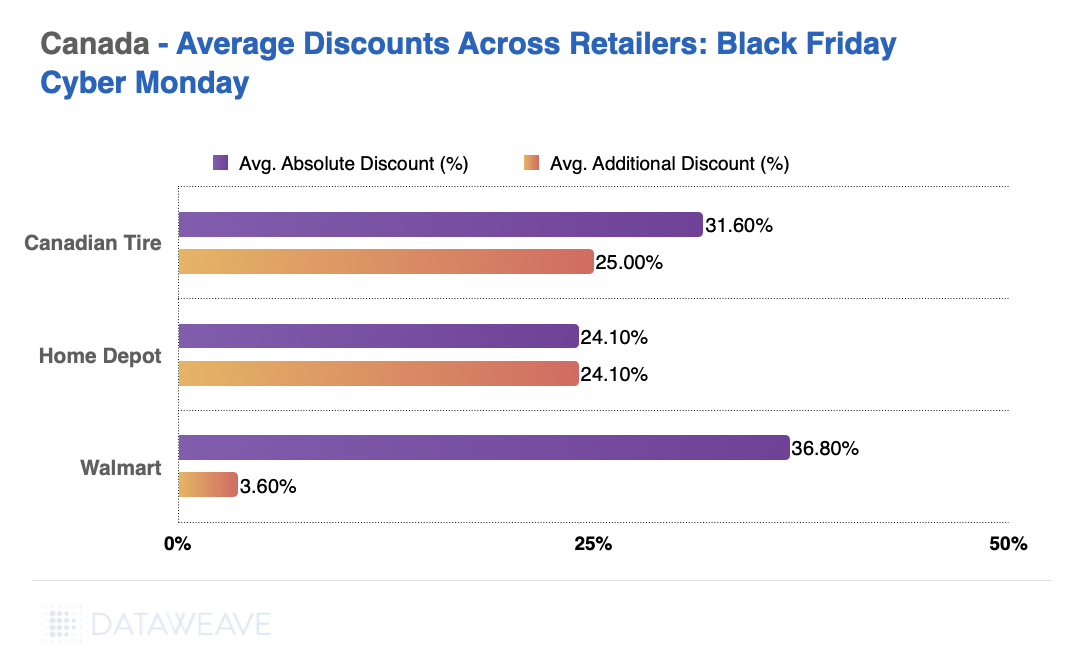
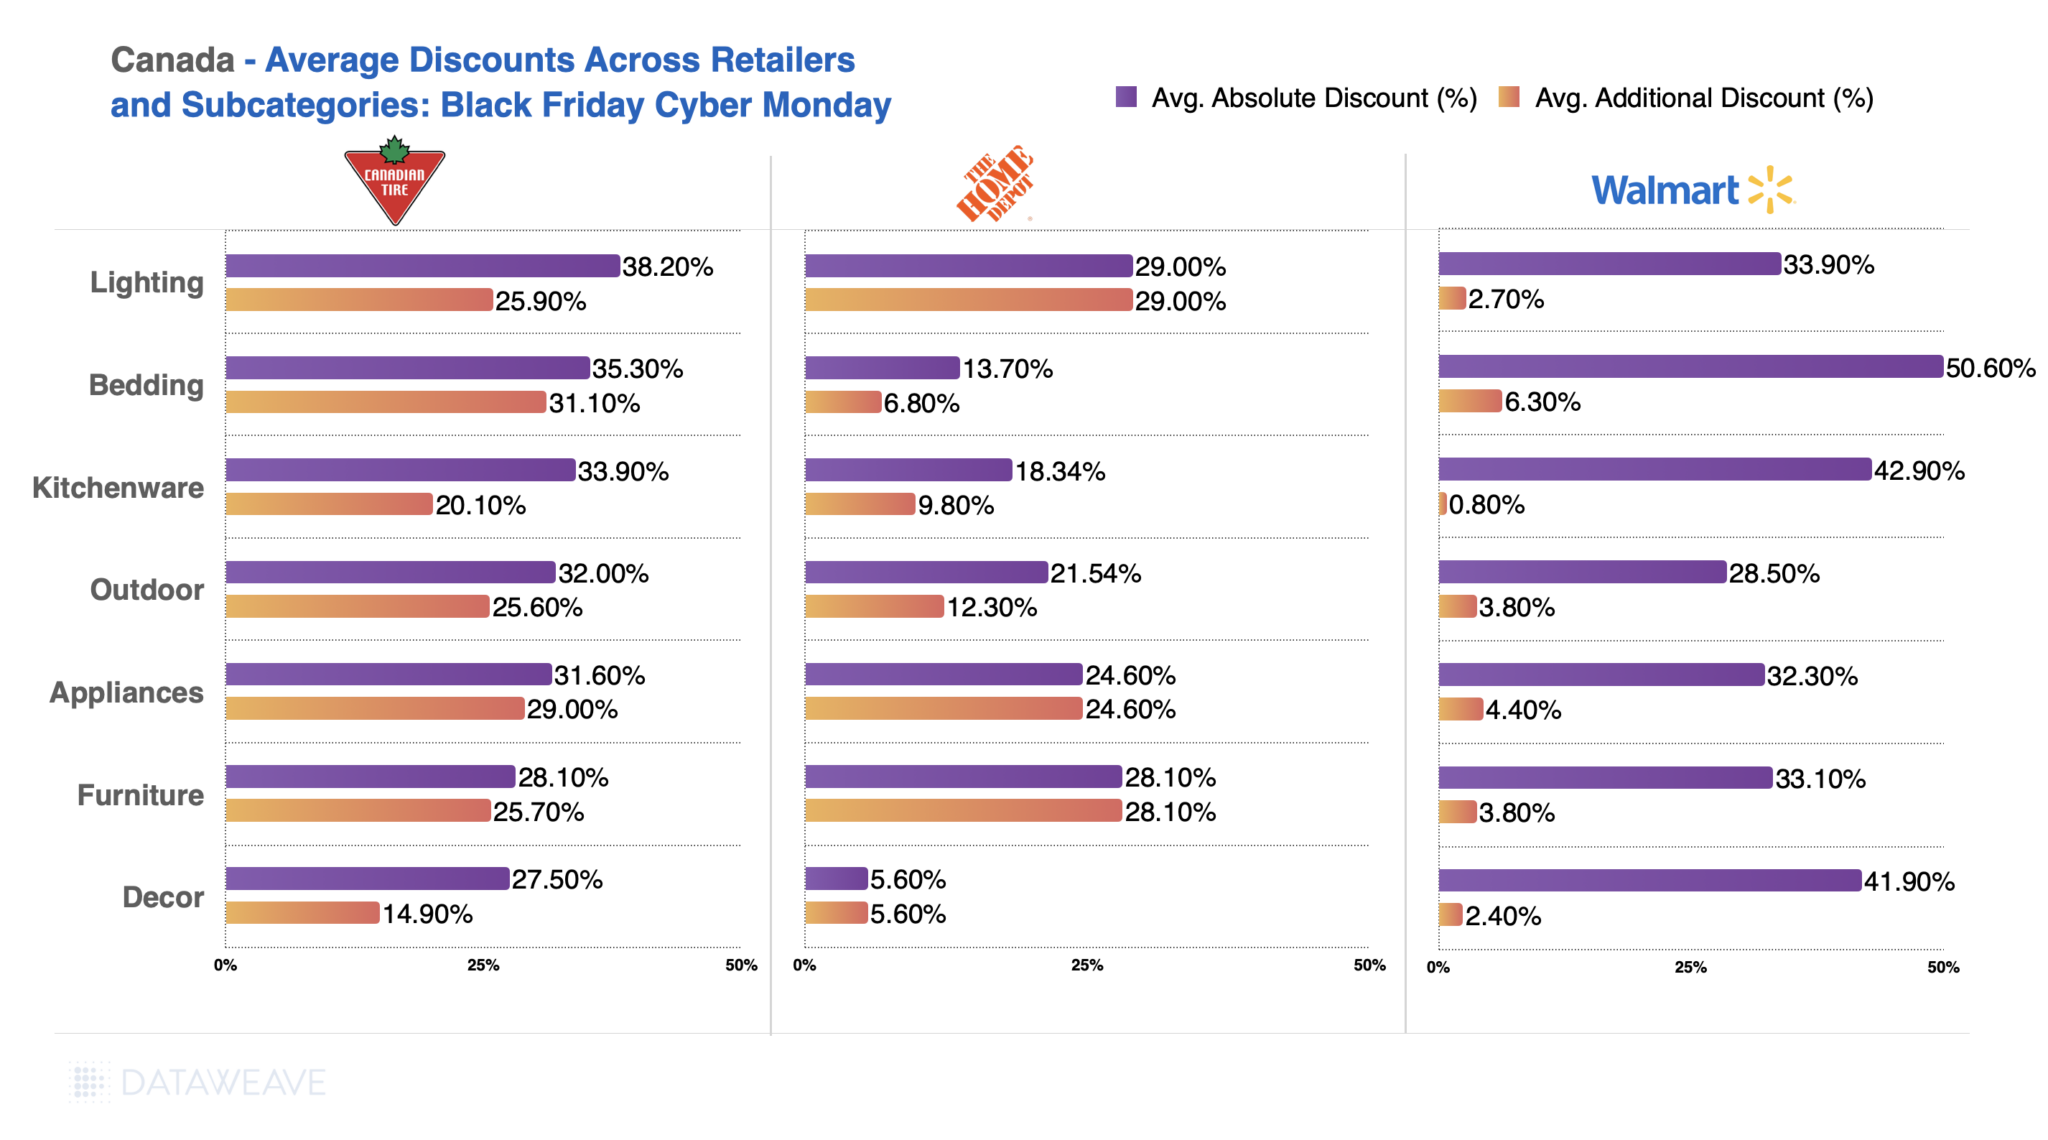
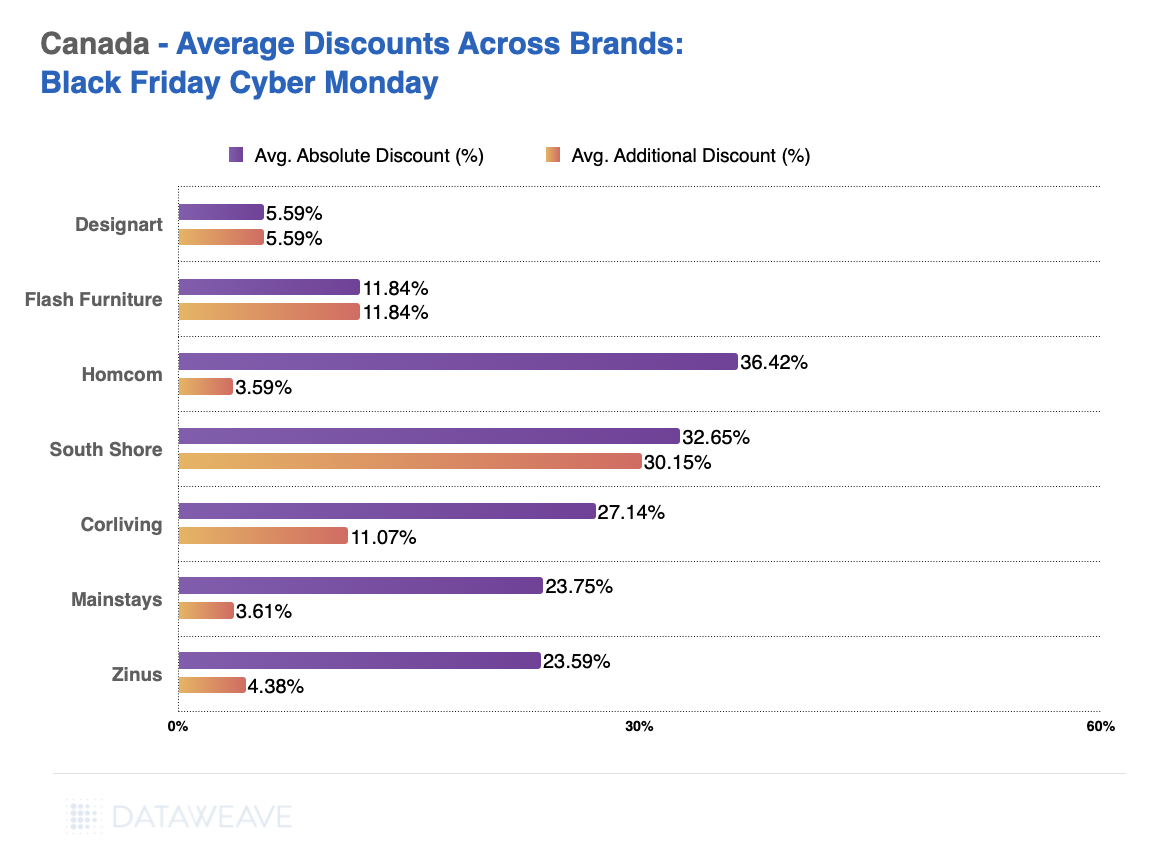
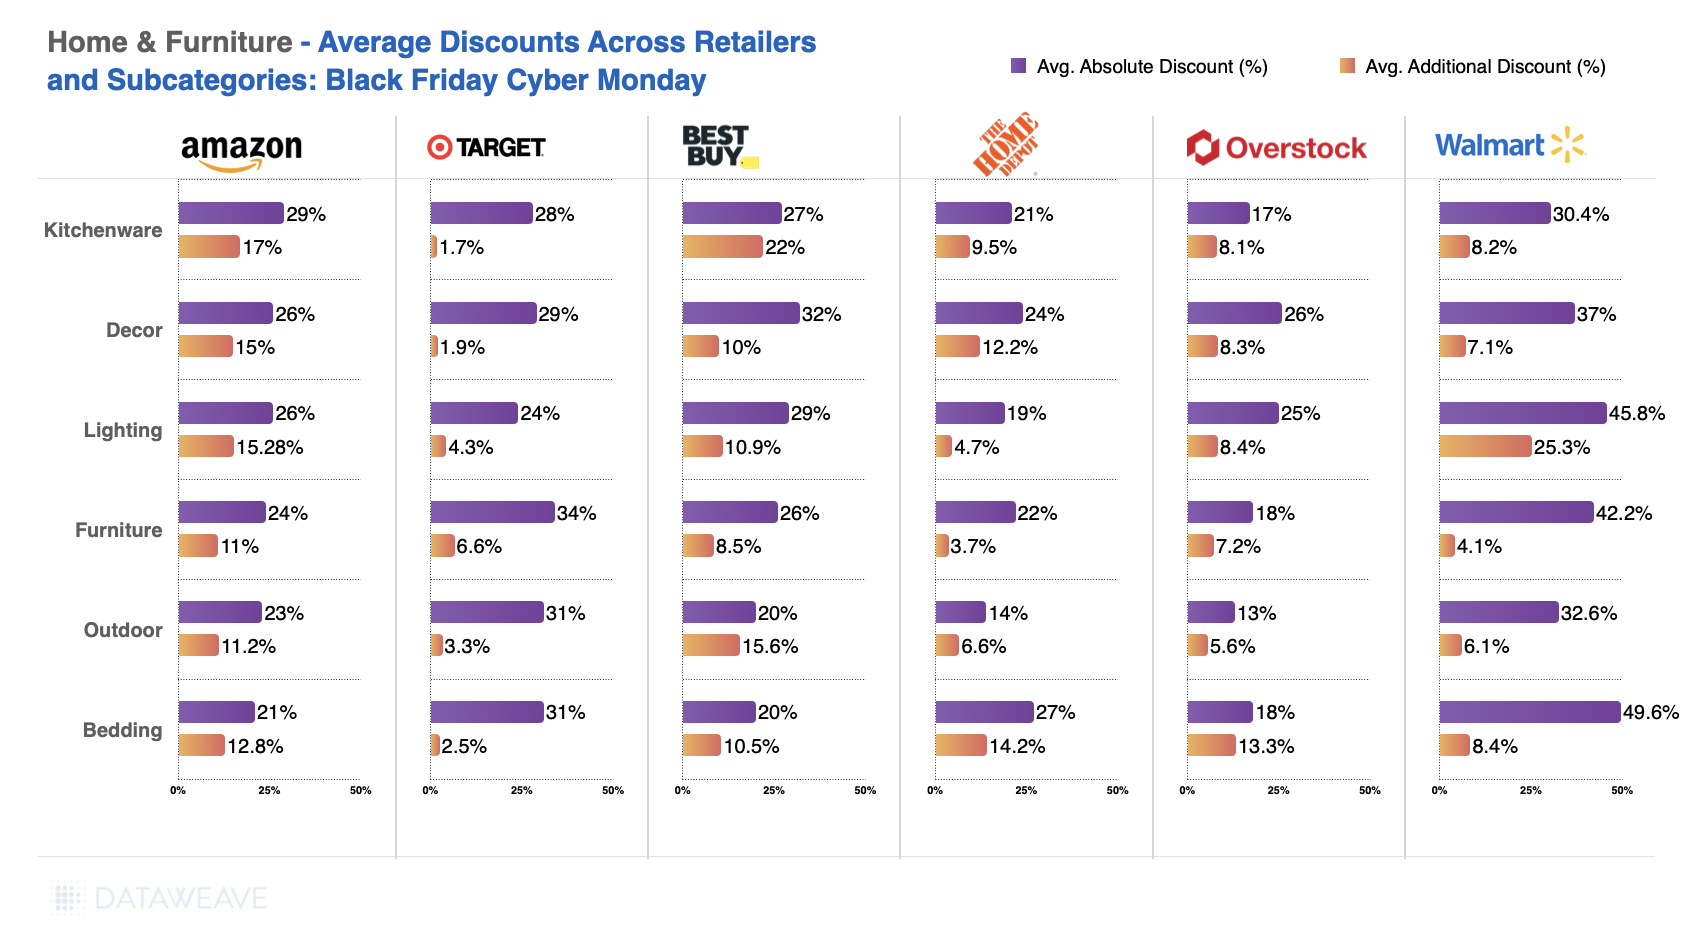
Home & Furniture led all categories with Pre-Black Friday discounts averaging 23.5%, but Black Friday Week added only 0.7%, the smallest incremental discount in our entire study. Kitchenware saw extraordinary pre-sale discounts of 43.2%, the highest in any subcategory we tracked. Bedding followed at 33.6%, while Furniture reached 24.3%. These deep early discounts likely aimed to drive early conversions and manage bulky inventory ahead of peak logistics constraints.
During Black Friday Week, additional discounting remained minimal across the board. Bedding posted the highest lift at 1.1%, while Kitchenware saw just 0.4%. The data suggests Canadian home goods retailers viewed the pre-sale period as their primary promotional window, with Black Friday serving more to sustain momentum than deliver new value.
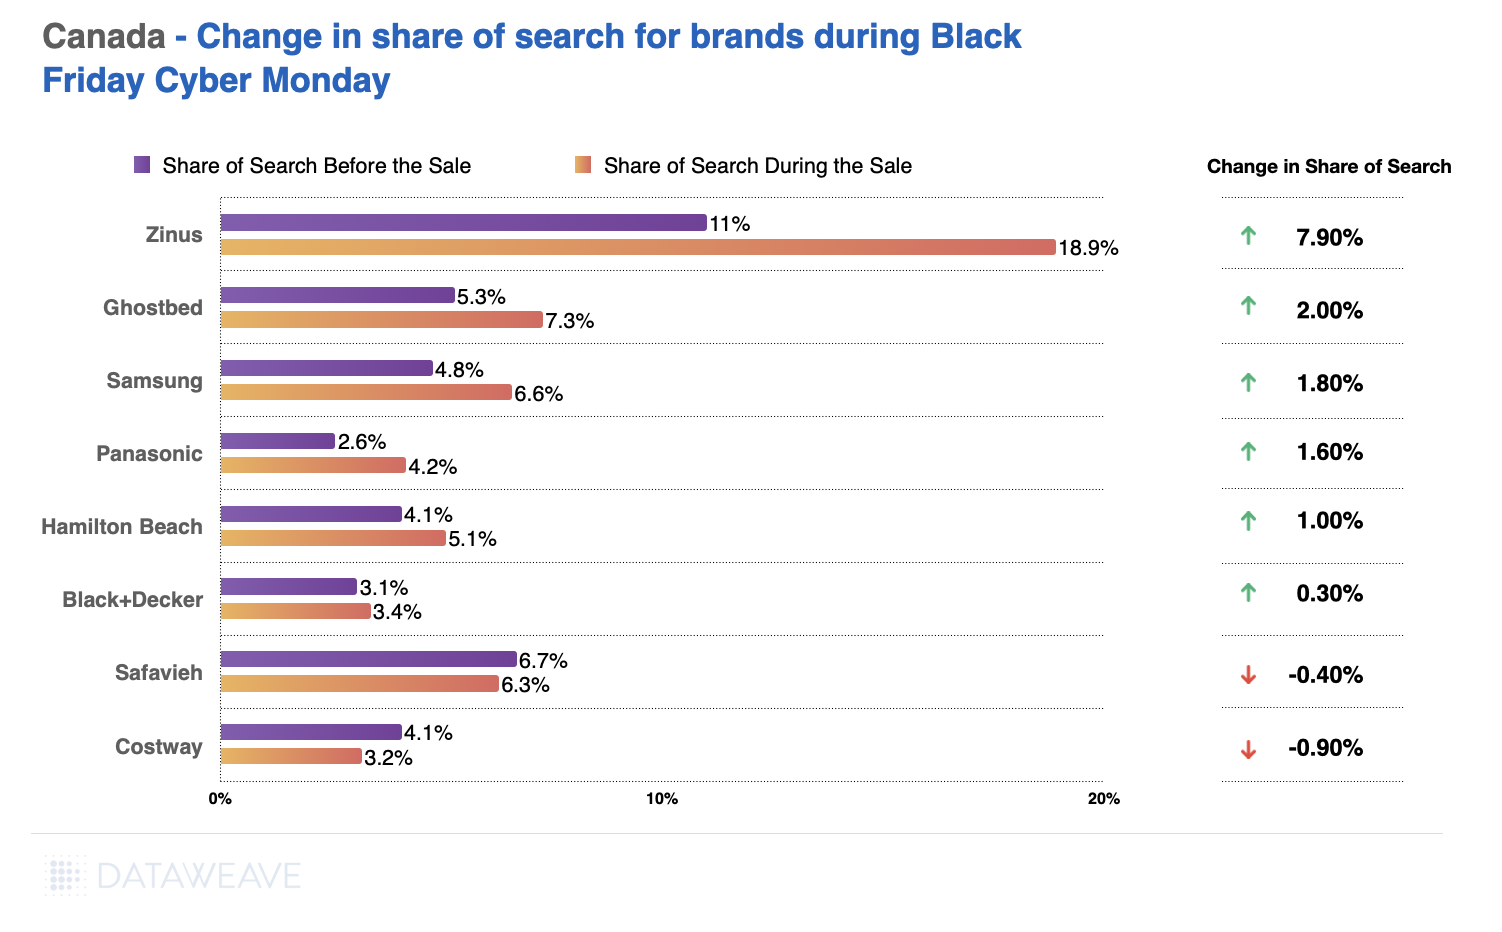
Share of Search: Brand Visibility Trends
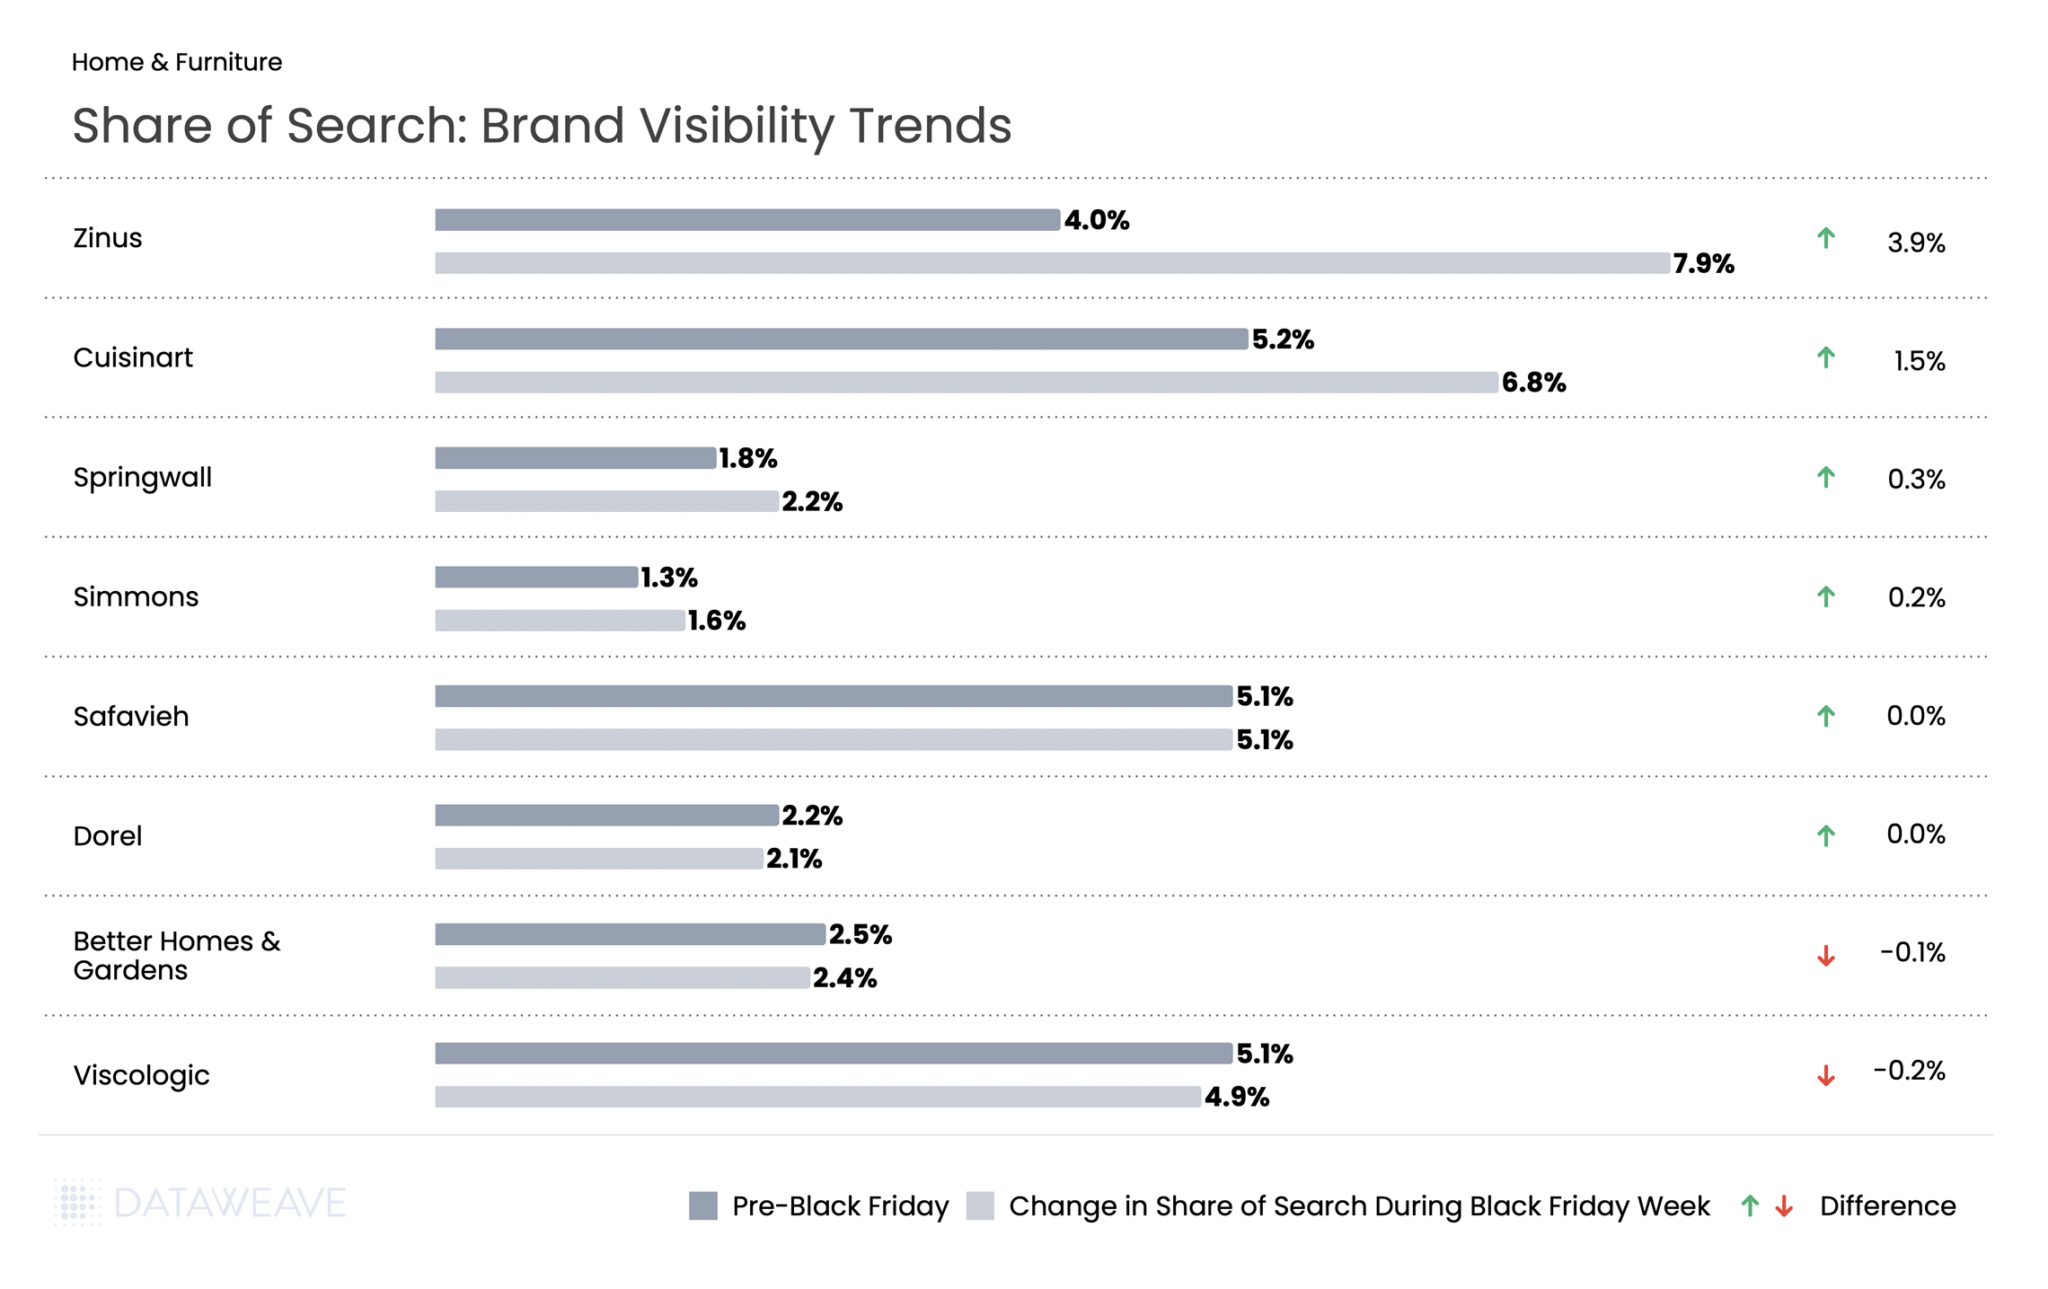
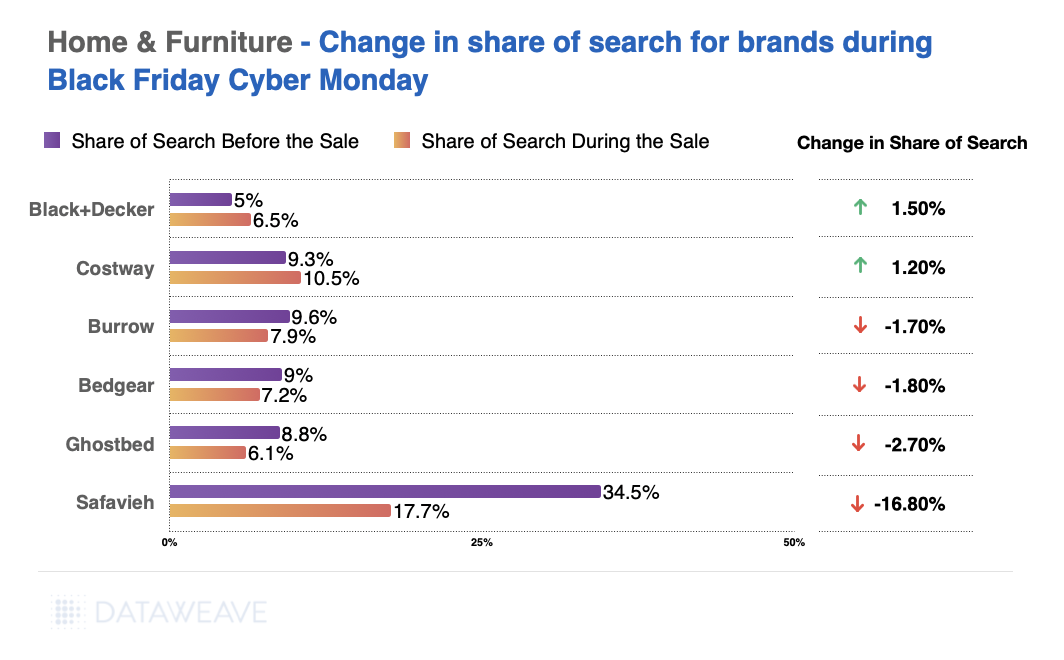
Mattress brand Zinus led gains with a 3.9% increase, positioning itself as a value-focused furniture leader during the sale period. Cuisinart climbed by 1.5%, suggesting strategic amplification of this established kitchenware brand.
Most home brands maintained relatively stable visibility throughout the sale period. Safavieh and Dorel showed essentially no change, while Better Homes & Gardens and Viscologic experienced only minor declines of 0.1% and 0.2% respectively.
Want to understand how DataWeave’s pricing intelligence platform can help your business make data-driven decisions during peak sales events? Contact us to learn more about competitive insights, price intelligence, assortment analytics, content analytics, and digital shelf analytics.
Check out our coverage on Black Friday 2025 across US, UK, and Germany. Follow our blog for more insights on retail pricing trends, brand visibility analysis, and data-driven commerce intelligence.
Black Friday 2025 solidified its position as a major retail event in the German market. German consumers demonstrated an average Black Friday budget of €317, the highest among select European countries.
The German market, however, exhibited unique consumer behavior patterns during Black Friday 2025. Rather than meticulous planning, 59% of German shoppers allowed deals to inspire their purchases, compared to just 32% who shopped with predetermined lists and budgets. This spontaneous yet budget-conscious approach distinguishes German consumers from other markets, where FOMO-driven purchasing tends to dominate.
Against this backdrop of rational deal-seeking and regional diversity, how did retailers and brands perform across key categories this Black Friday?
At DataWeave, we conducted a comprehensive analysis of Black Friday 2025 discounting trends across five major categories in the German market: Consumer Electronics, Home & Furniture, Health & Beauty, Grocery, and Apparel. Our AI-powered pricing intelligence platform monitored over 16,000+ SKUs across leading German retailers like Amazon, Aldi, Douglas, Nutritienda, Carethy, Bofrost, and more, revealing fascinating patterns in how retailers and brands approached this year’s sale season.
Our Methodology
For this analysis, DataWeave monitored average discounts across leading German retailers during two distinct periods:
Pre-Black Friday: November 6 – November 23, 2025 – capturing early holiday deals and baseline pricing
Additional Discounts During Black Friday Week: November 24 – December 1, 2025 – covering Thanksgiving week through Black Friday (November 28) and Cyber Monday (December 1)
Our sample encompassed the top-ranked products across subcategories on major retail sites. We also analyzed Share of Search data, which measures brand visibility by monitoring which brand names appear in the top 20 search results for critical keywords.
Black Friday 2025 Germany: The Big Picture
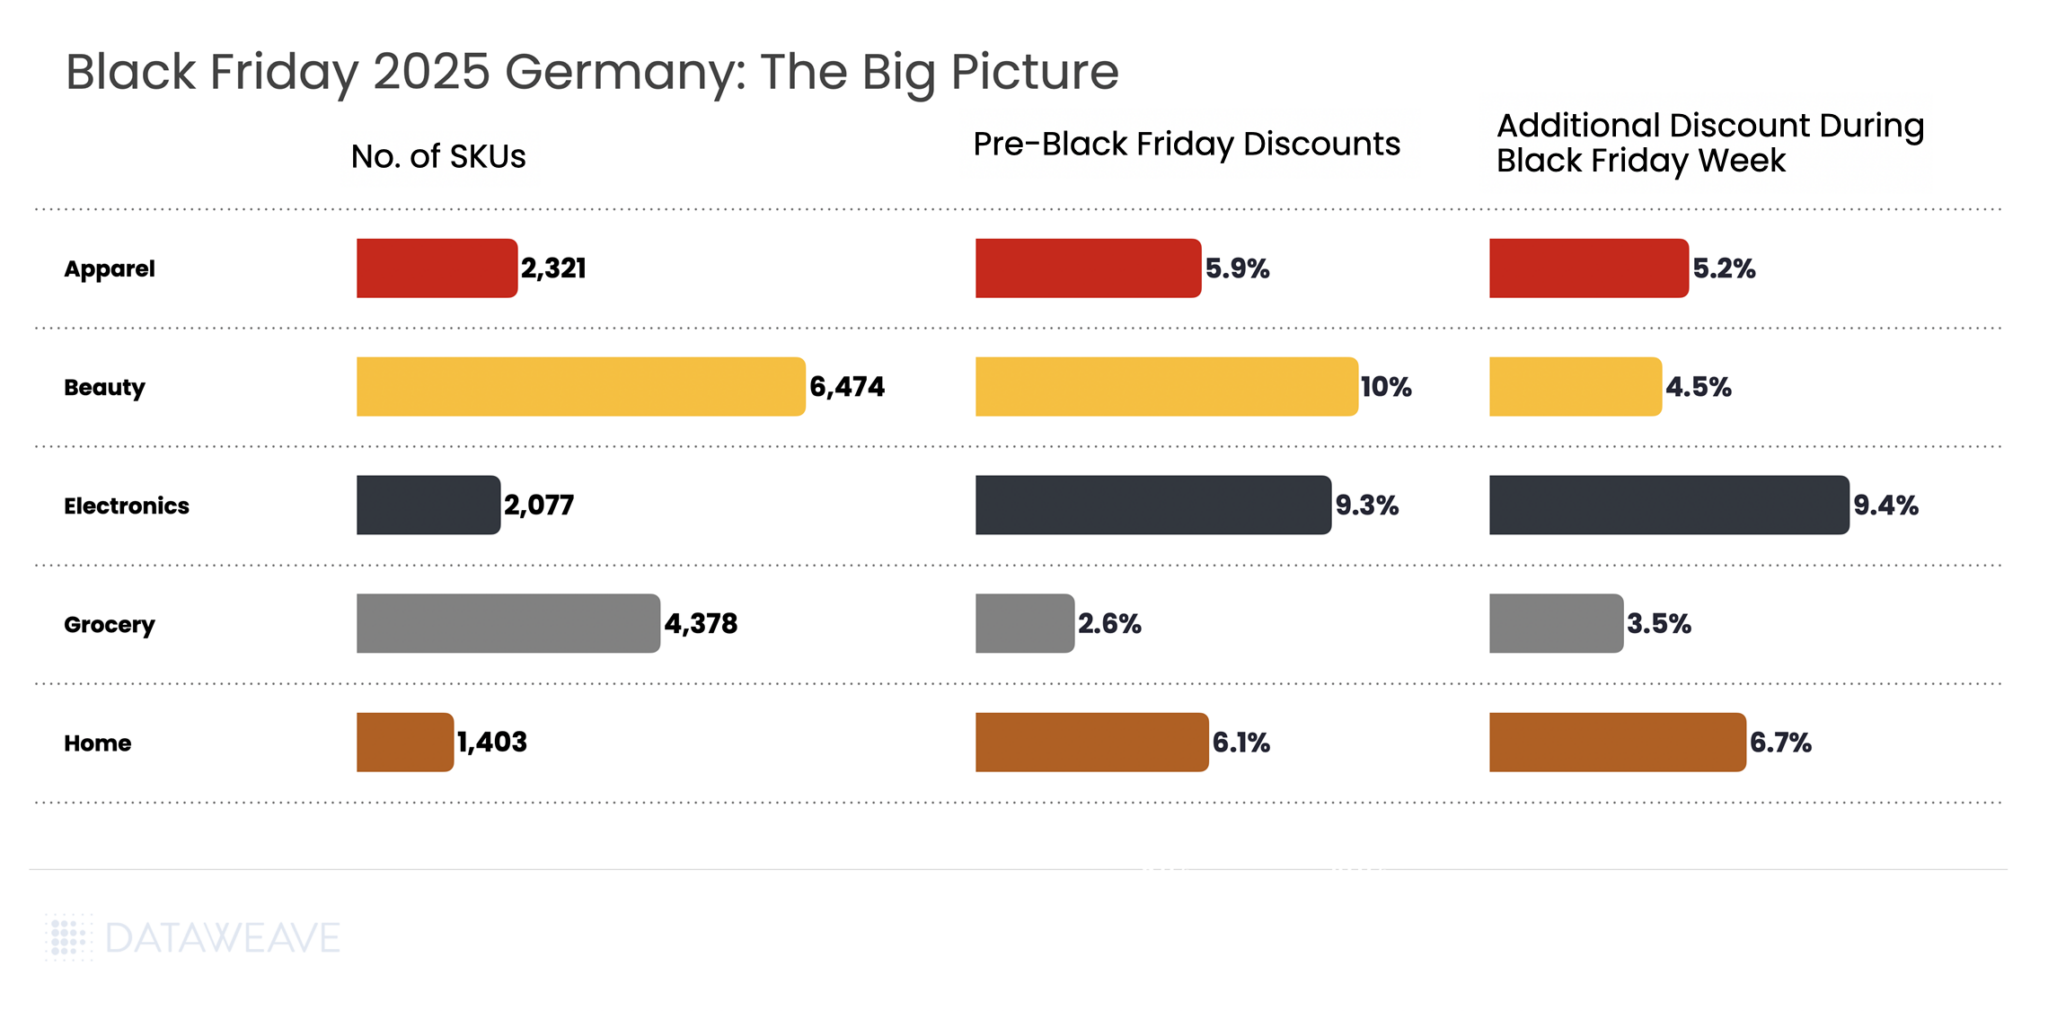
Our analysis covered 16,653 SKUs across five major categories. Here’s the snapshot of average discounts during the Pre-Black Friday period compared to Black Friday Week:
Key Insight: The German market presented a notably different discounting pattern compared to other markets. Pre-Black Friday discounts averaged 7% across all categories, with Black Friday Week adding 5.1% on average. Unlike the UK and US markets where retailers front-loaded promotions heavily, German retailers took a more balanced approach, with several categories actually seeing higher discounts during the main Black Friday Week.
Beauty led pre-sale discounts at 10%, followed by Electronics at 9.3%. Consumer electronics stood out with the highest Black Friday Week discounts at 9.4%, slightly exceeding even the pre-sale period at 9.3%.
Shopping Behavior Patterns: The relatively modest discount levels reflect the rational, value-oriented approach of German consumers. With the majority of shoppers setting budgets between €100-€299 and prioritizing wish fulfillment over impulse purchases, German retailers focused on strategic discounting rather than aggressive margin erosion.
Consumer Electronics
Consumer electronics dominated German Black Friday interest, with 77% of German shoppers most interested in electronics deals, making it the most anticipated category during the sales period. Our analysis of 2,077 SKUs reveals how discounts varied across subcategories and which brands dominated search visibility in this highly competitive category.
Subcategory Discount Analysis
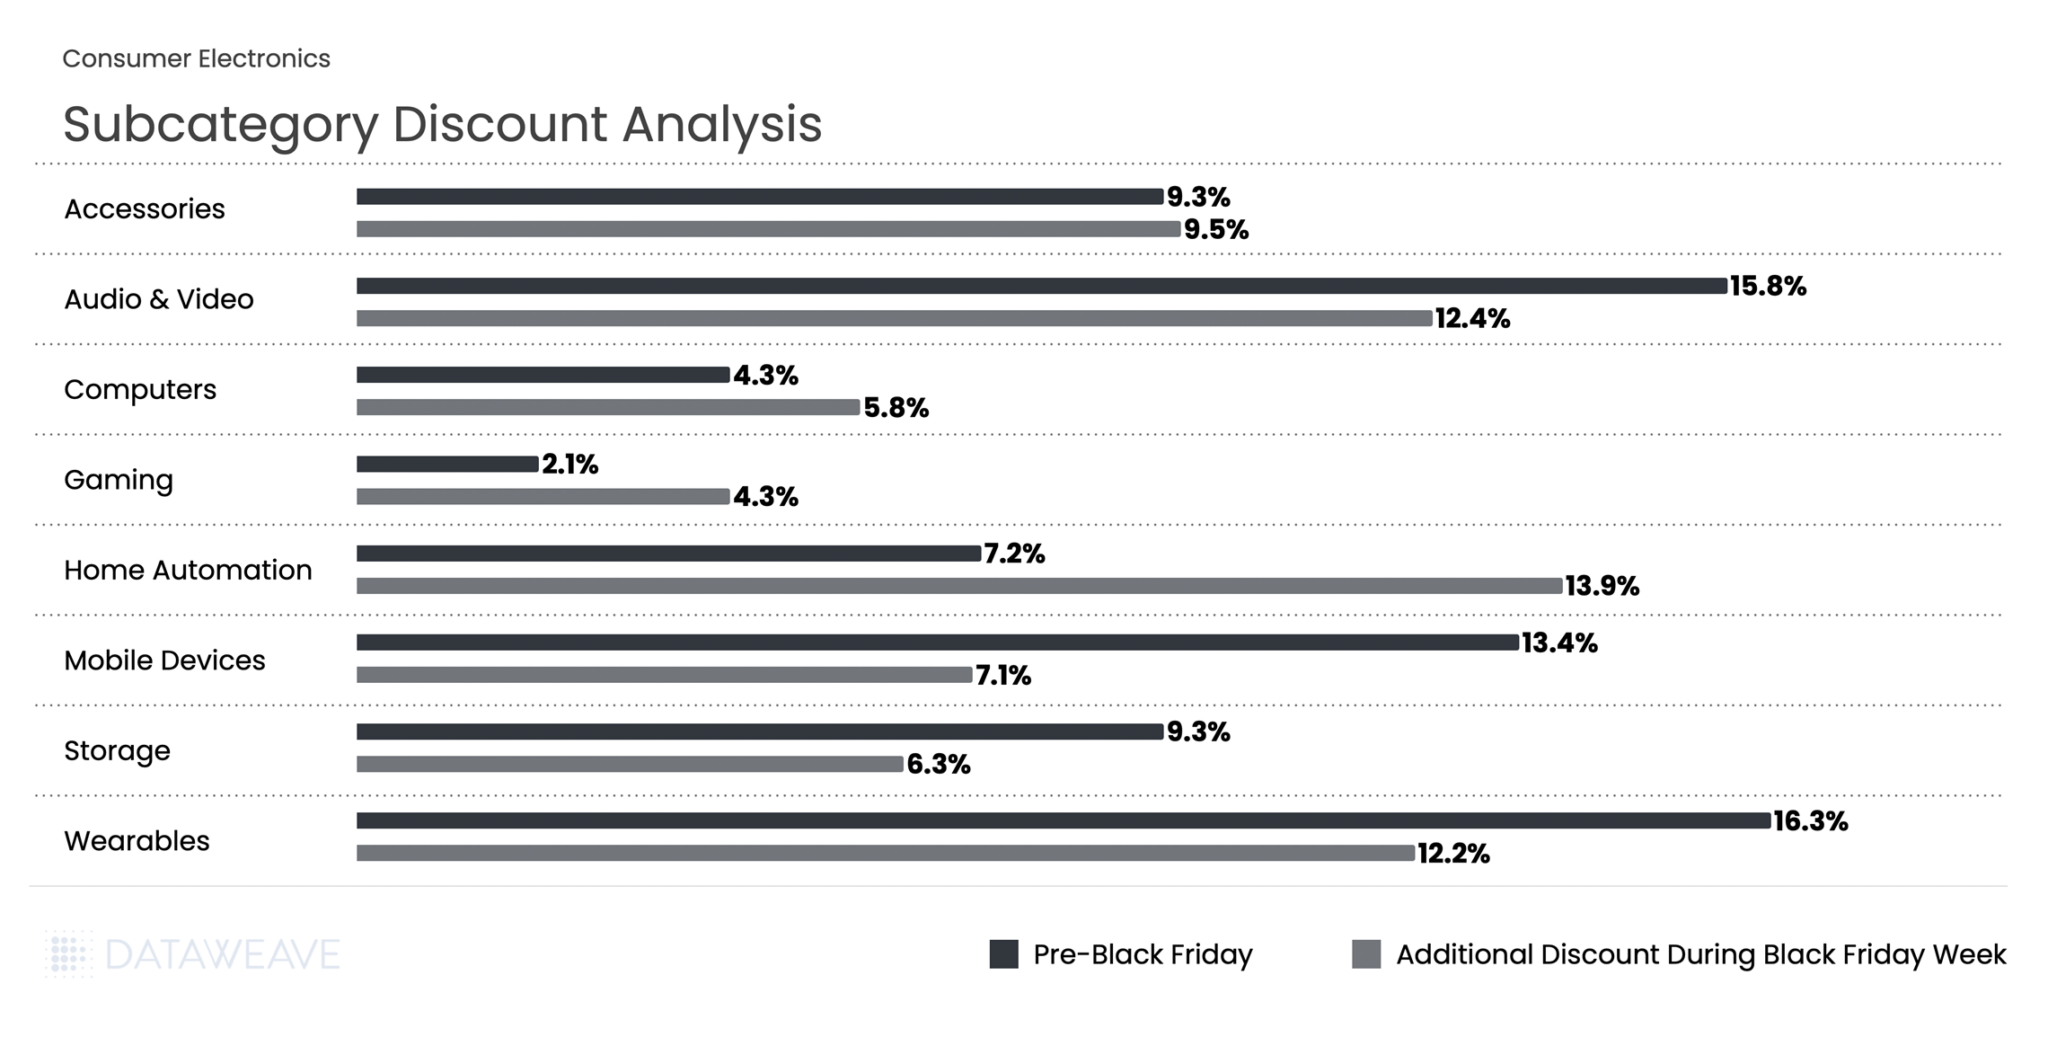
This was one of the few categories where Black Friday Week discounts matched or exceeded pre-sale levels. Wearables led pre-sale discounting at 16.3%, followed closely by Audio & Video at 15.8%. During Black Friday Week, these categories saw additional discounts of 12.2% and 12.4% respectively.
The standout performer was Home Automation, which nearly doubled its additional discount from 7.2% to 13.9% during Black Friday Week. Mobile Devices saw additional discounts dropping from 13.4% pre-sale to 7.1% during Black Friday Week. Meanwhile Gaming doubled additional discounting from 2.1% to 4.3%.
Share of Search: Brand Visibility Trends
Our Share of Search analysis reveals significant shifts in brand visibility during Black Friday Week:
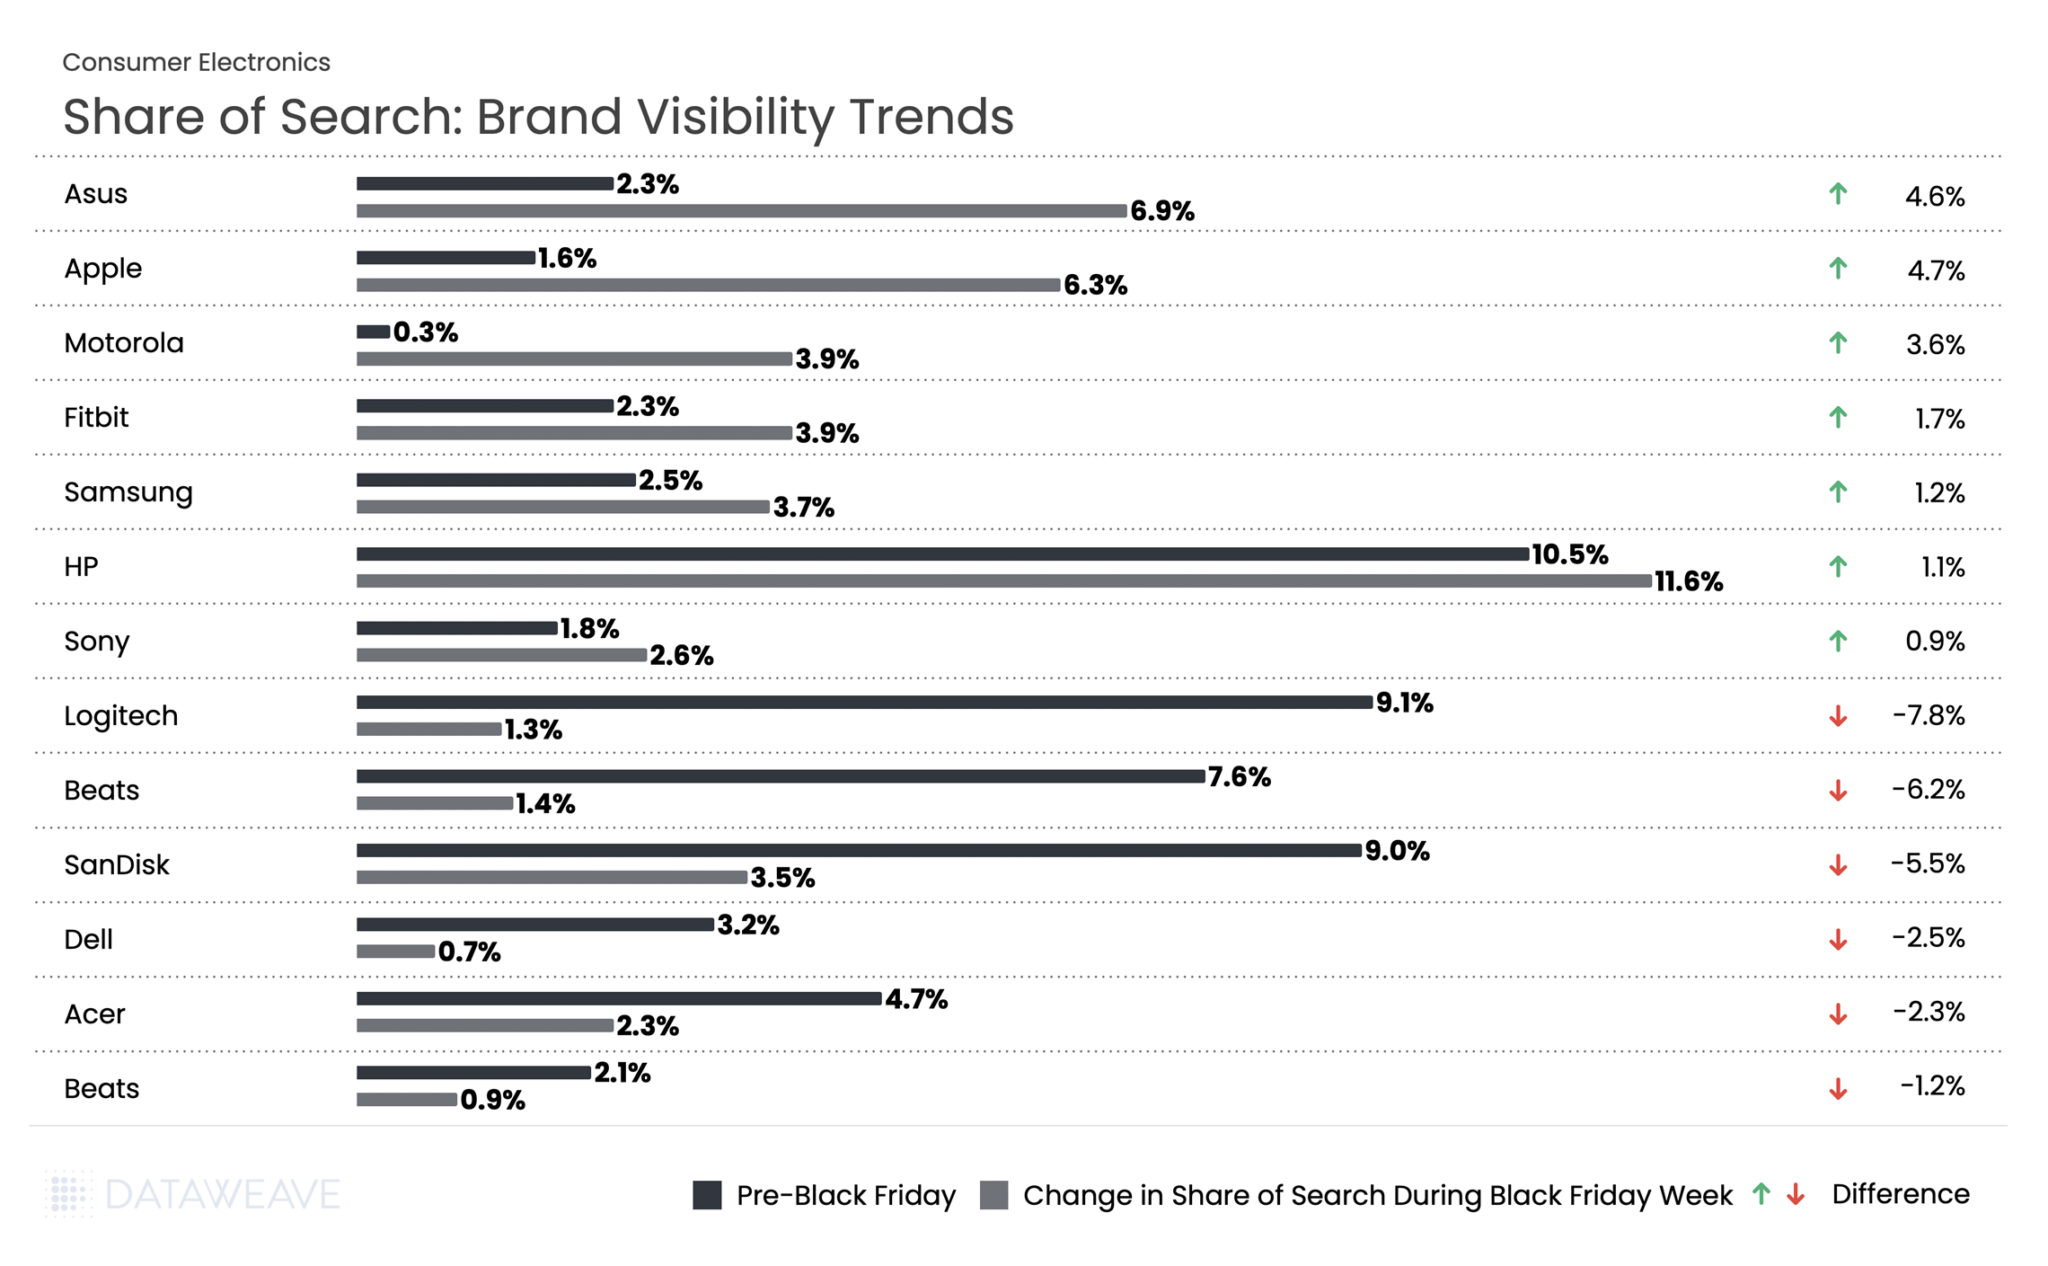
HP saw the highest share of search across Black Friday at 10.5% pre event and 11.6% during the event. Apple led with a 4.7% increase in visibility, jumping from 1.6% to 6.3%. Asus followed at 4.6%. Motorola surged 3.6 %, while wearables brand Fitbit gained 1.7%.
In stark contrast, Logitech dropped by 7.8 %, Beats fell 6.2 %, and SanDisk declined 5.5 %. Computer manufacturers Dell and Acer also struggled, falling 2.5 and 2.3 % respectively.
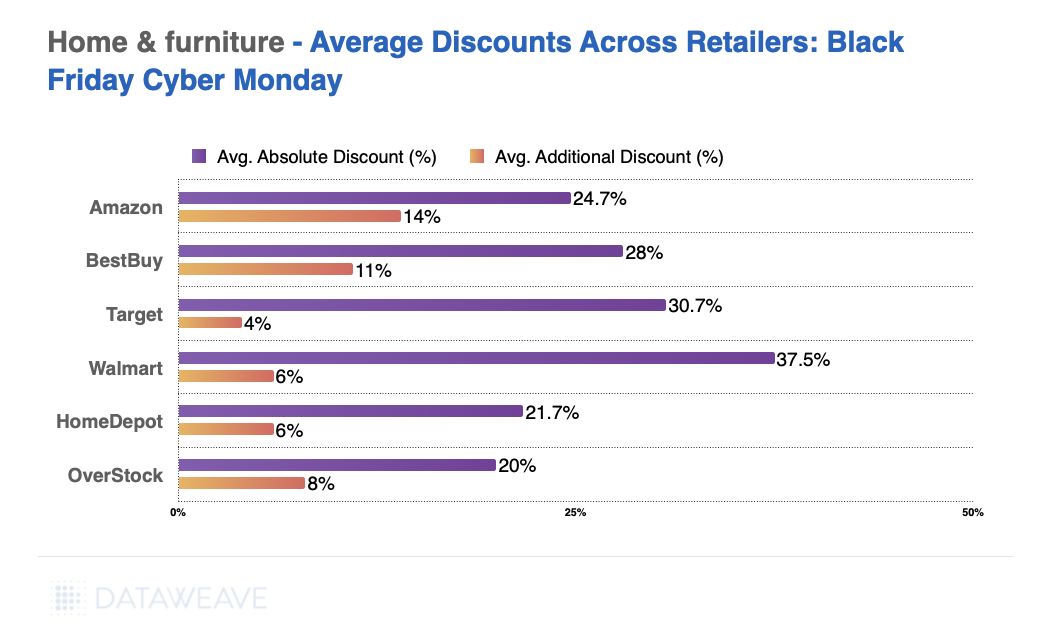
Home & Furniture
The Home & Furniture category in Germany showed unique discounting behavior compared to other markets, with additional Black Friday Week discounts (6.7%) actually exceeding Pre-Black Friday levels (6.1%). Our analysis of 1,403 SKUs shows how discounts were distributed across subcategories.
Subcategory Discount Analysis
Kitchenware led pre-sale discounts at 8.7%. Decor surged from 5% to 7.5%, lighting jumped from 5% to 6.9%, and bedding more than doubled from 3.2% to 6.6%. These substantial increases suggest strategic timing to capture consumer attention during peak shopping days.
Share of Search: Brand Visibility Trends
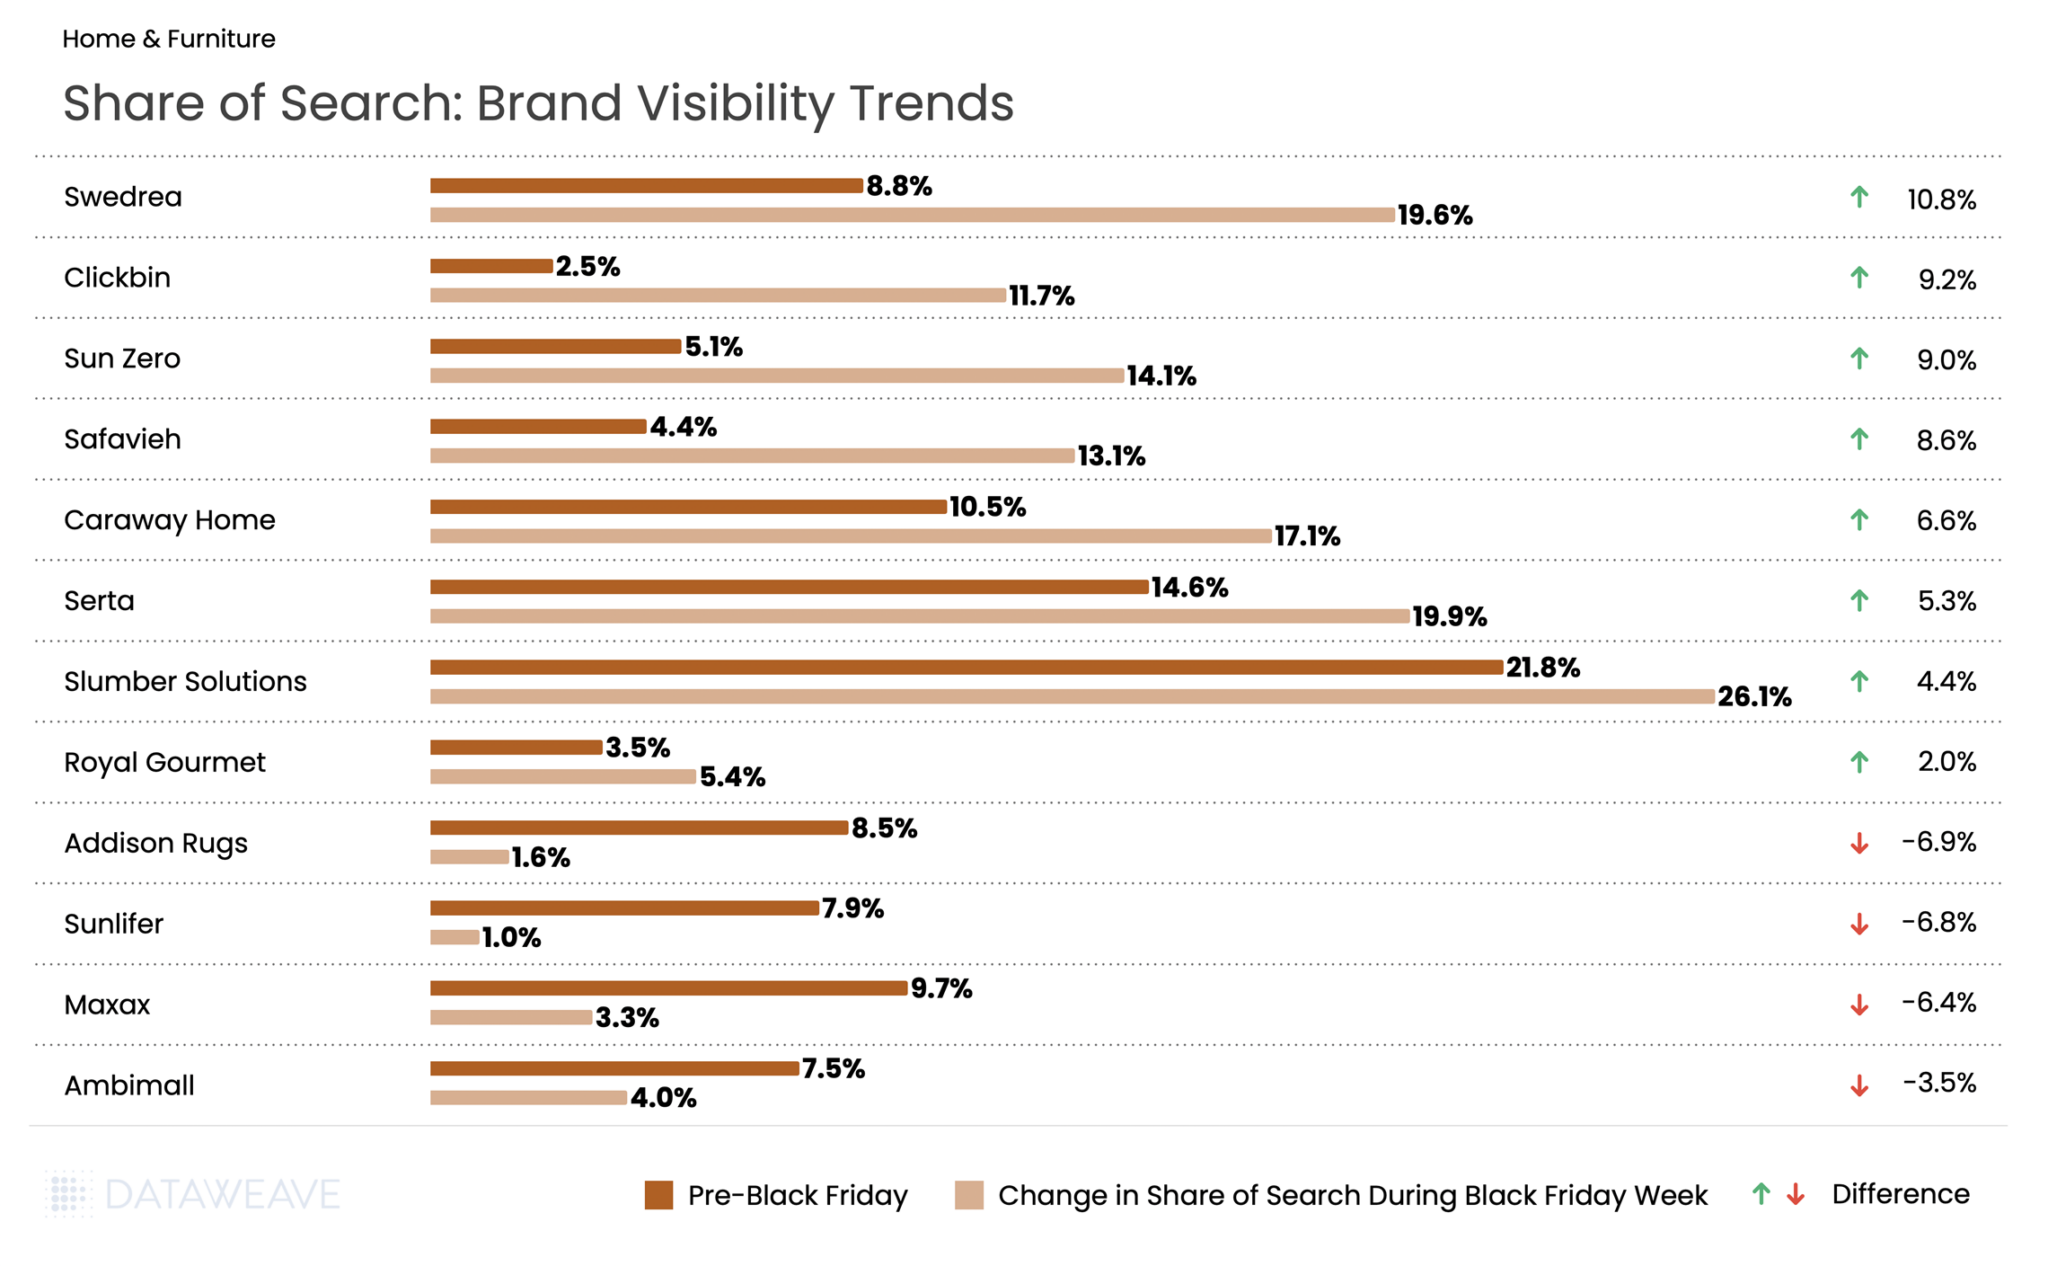
Mattress brand Slumber Solutions saw the highest share of search at 21.8% pre event and 26.1% during Black Friday week. Meanwhile, another mattress brand Swedrea led all brands with a remarkable 10.8% surge in visibility, jumping from 8.8% to 19.6%. Budget-friendly furniture brand Clickbin gained 9.2%, while window treatment brand Sun Zero increased 9% and home textiles brand Safavieh surged 8.6%.
Premium and established brands also performed well: Caraway Home (cookware) rose 6.6%, mattress brand Serta gained 5.3%, and Slumber Solutions added 4.4%. Royal Gourmet, specializing in outdoor cooking equipment, gained 2.0%.
However, several mid-tier brands faced steep declines. Addison Rugs dropped 6.9% from 8.5% to just 1.6%, while Sunlifer fell 6.8 % and Maxax declined 6.4 %.
Health & Beauty
Our analysis of 6,474 SKUs reveals subcategory-level insights and dramatic brand visibility shifts that highlight the evolving German beauty landscape.
Subcategory Discount Analysis
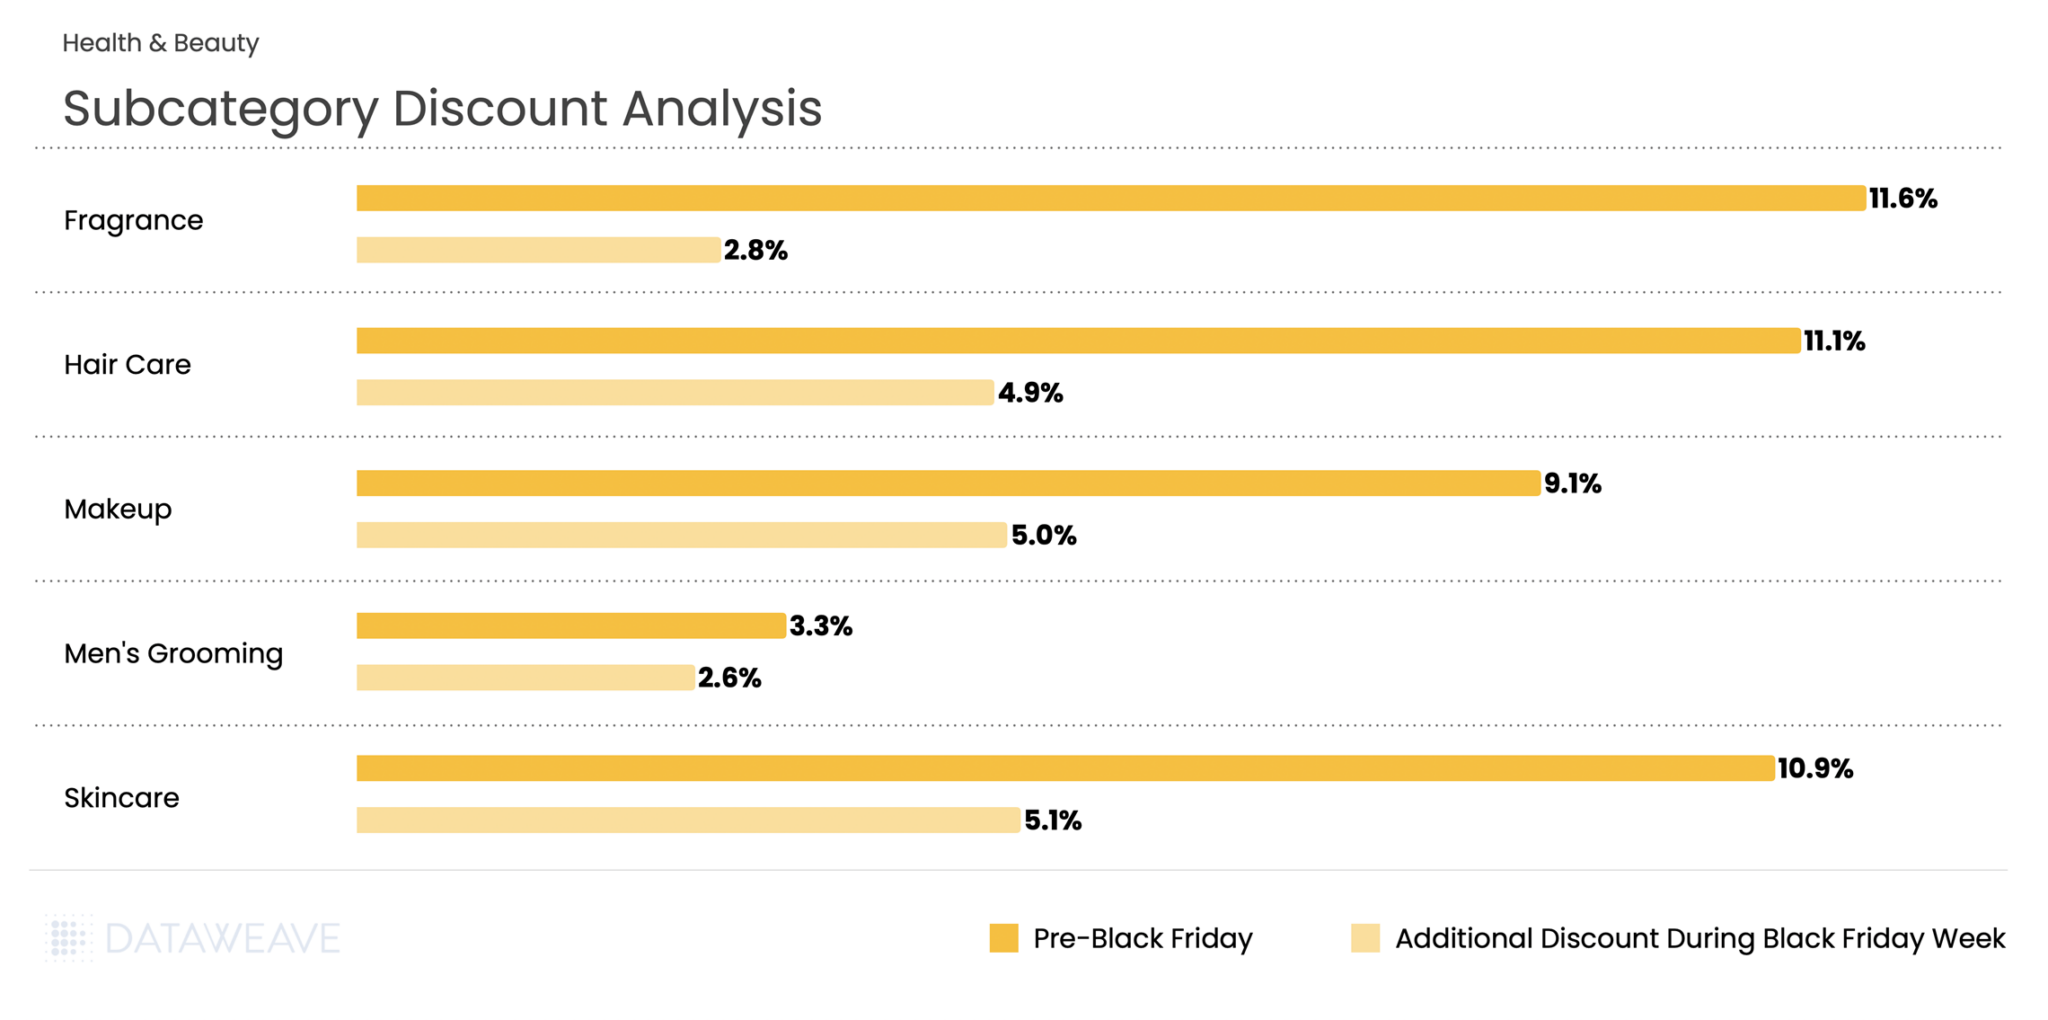
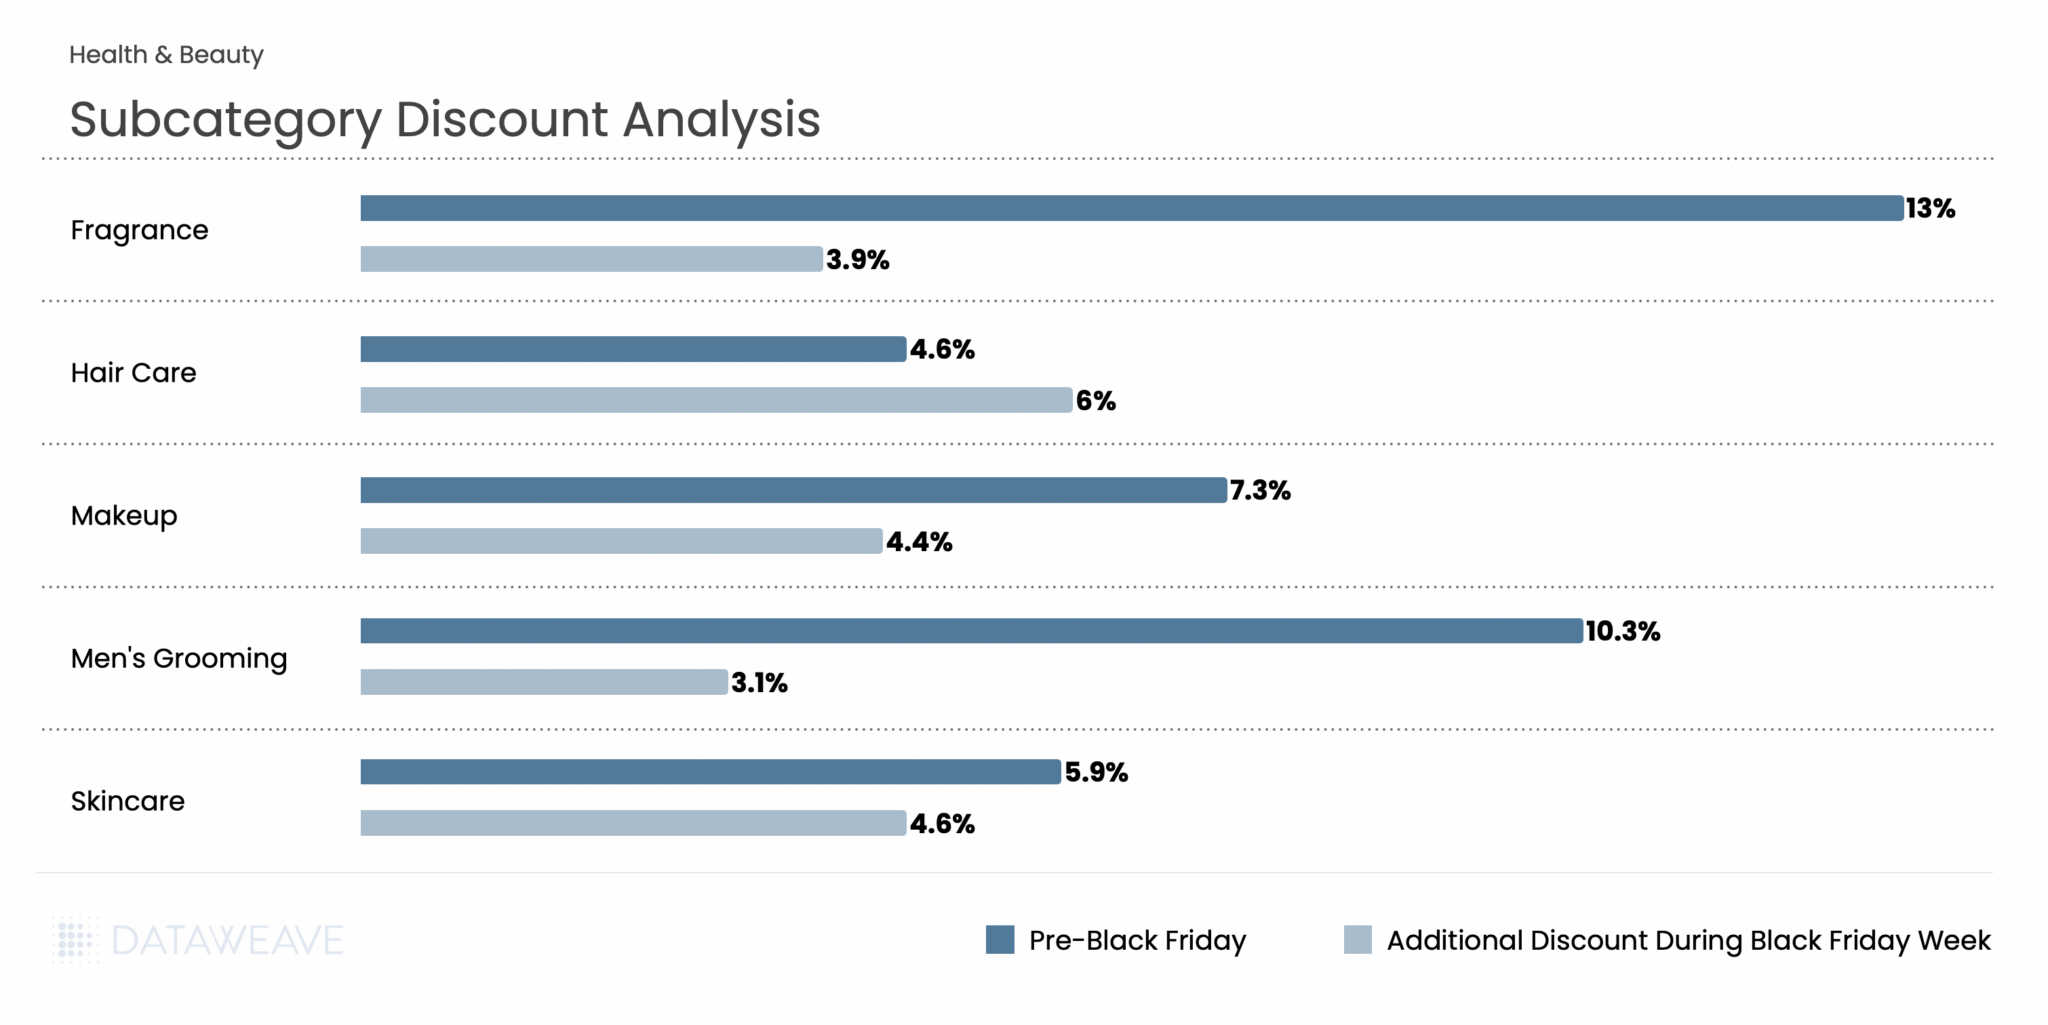
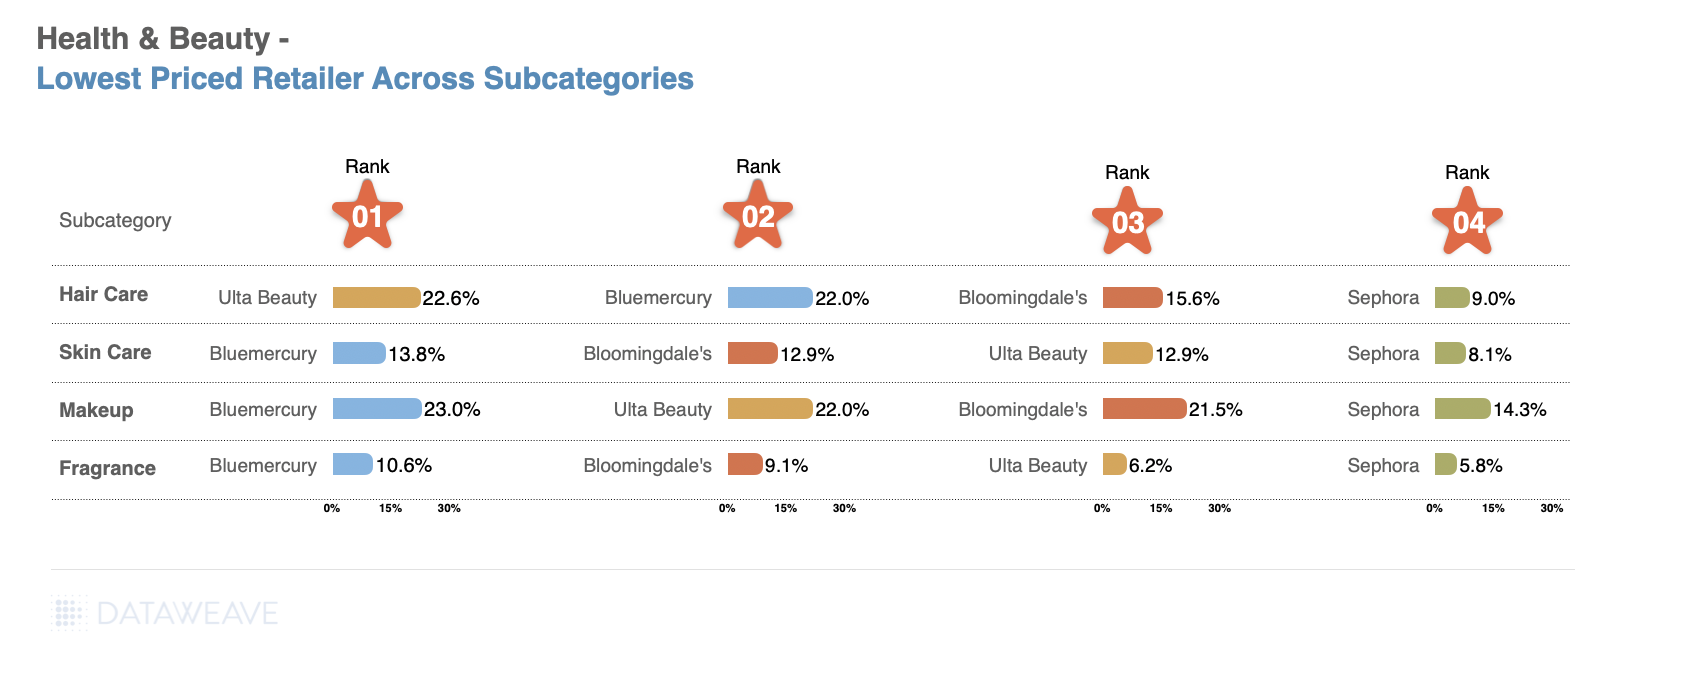
Pre-Black Friday discounts averaged 10%, with Black Friday Week adding 4.5% on average. Fragrance led pre-sale discounting at 11.6%, positioning perfumes and colognes as attractive early holiday purchases. However, Fragrance saw the smallest Black Friday Week addition at just 2.8%.
Hair Care and Skincare both showed strong performance across both periods, with Hair Care at 11.1% pre-sale and 4.9% during Black Friday Week, while Skincare registered 10.9% and 5.1% respectively. Skincare’s 5.1% Black Friday Week discount was the highest in the category.
Men’s Grooming stood apart with notably lower discounts at 3.3% pre-sale and 2.6% during Black Friday Week, suggesting either tighter margins in this subcategory or strategic positioning at different price points.
Share of Search: Brand Visibility Trends
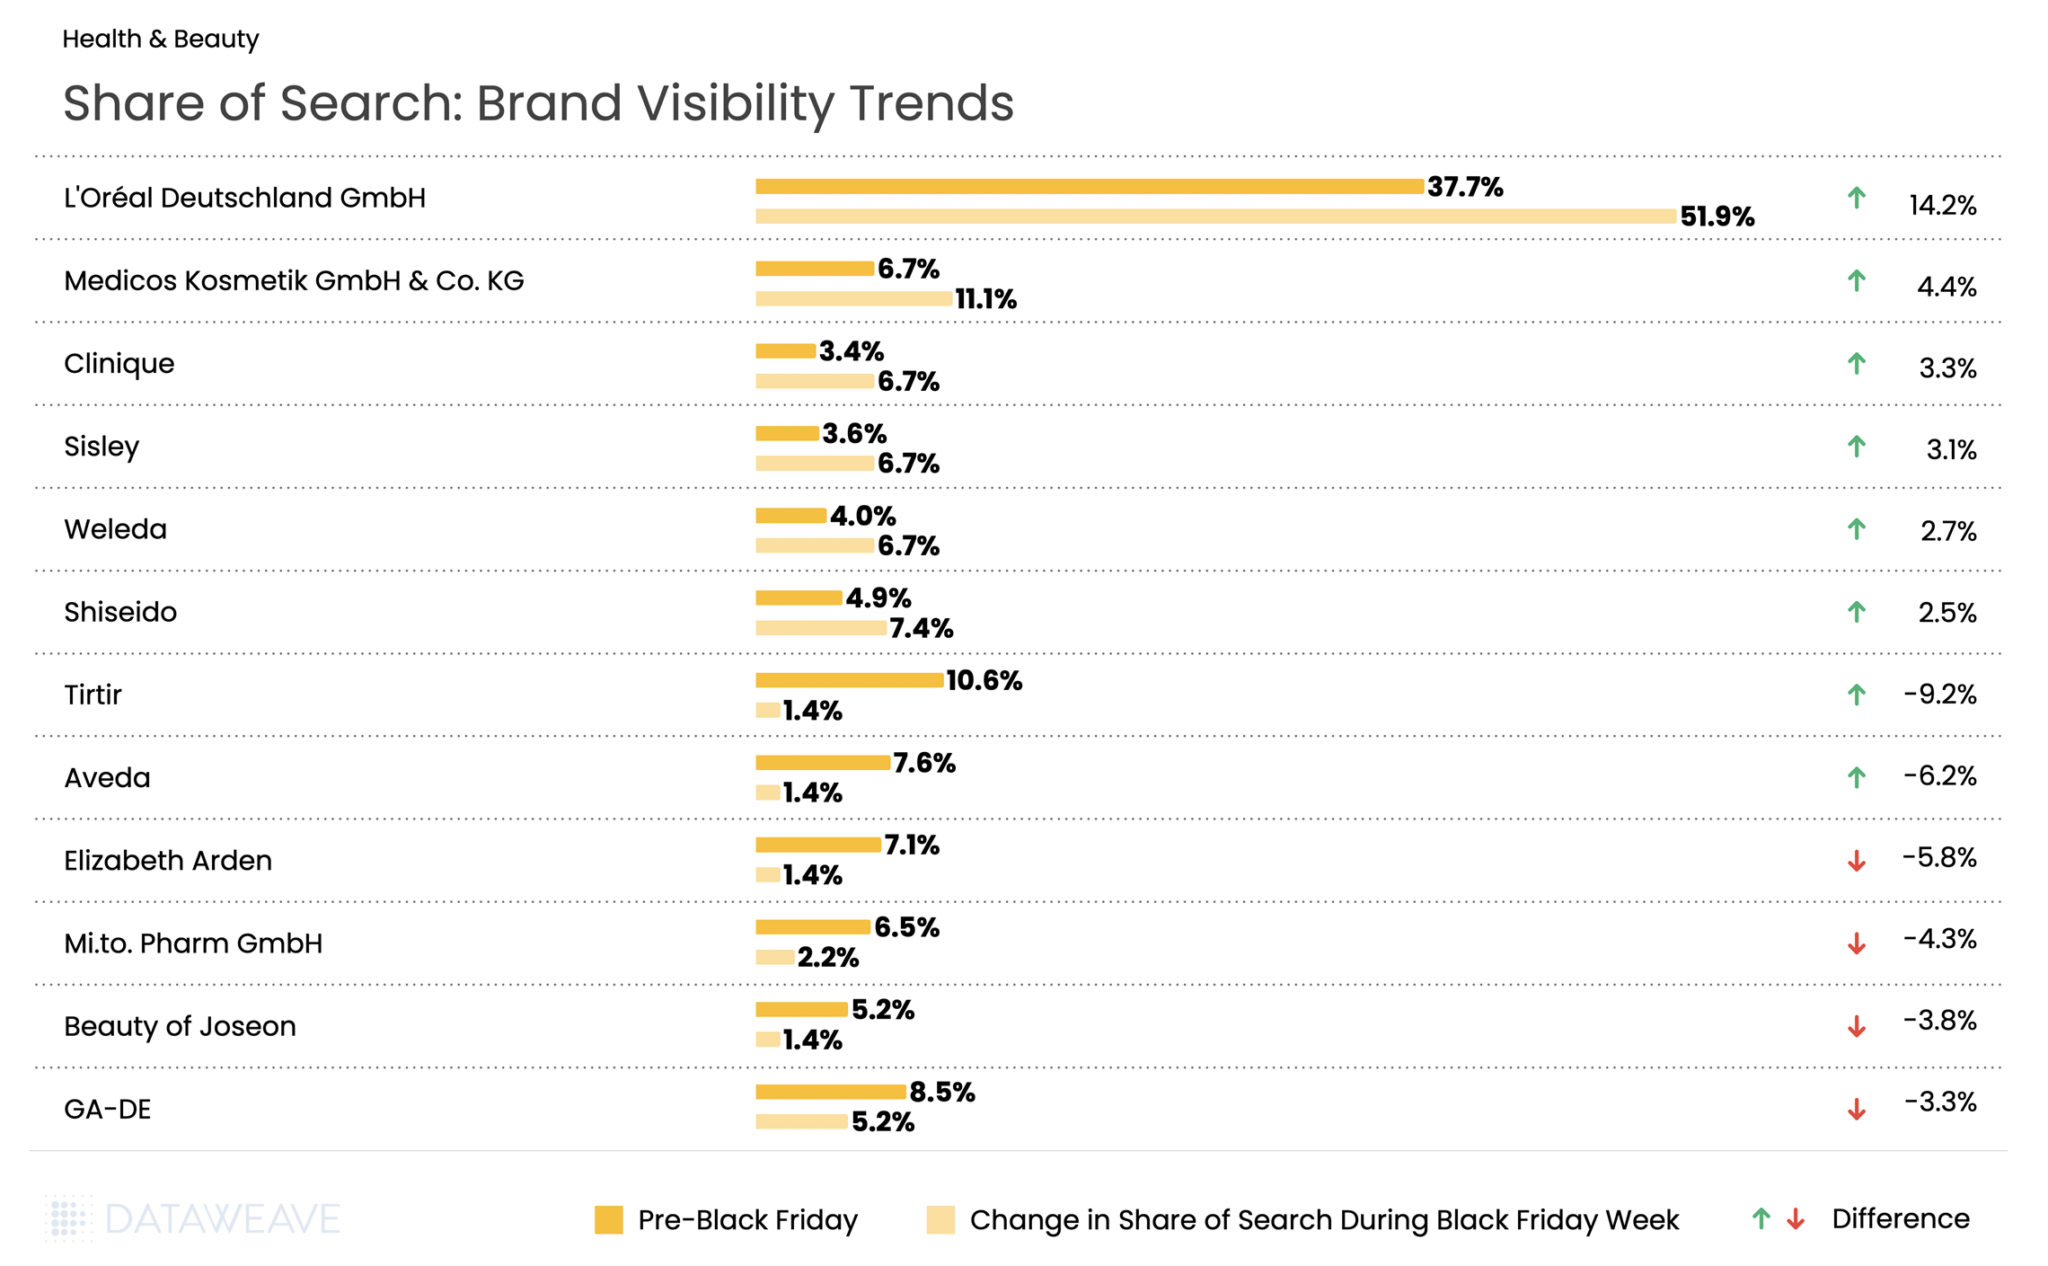
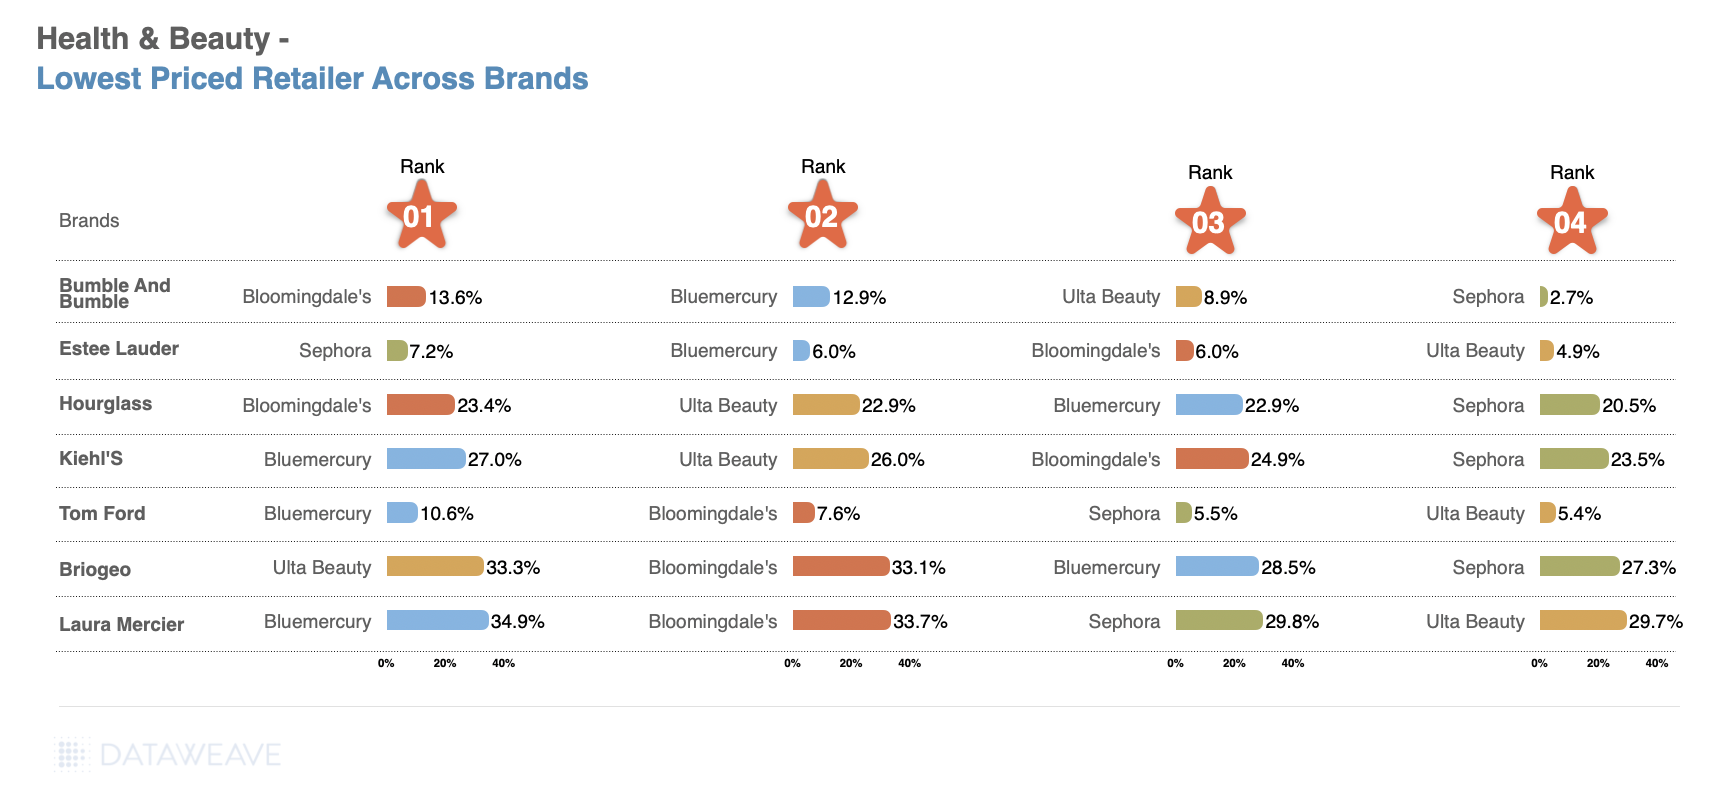
L’Oréal Deutschland GmbH emerged as the most visible brand, surging from 37.7% to 51.9%, (+14.2). German pharmaceutical cosmetics company Medicos Kosmetik GmbH & Co. KG gained 4.4 %. Clinique gained 3.3 %, and French luxury brand Sisley added 3.1 %, German natural cosmetics brand Weleda rose 2.7 %, and Japanese prestige brand Shiseido gained 2.5 %.
The flip side? K-beauty brands and some international names faced significant challenges. Viral make-up brand Tirtir experienced the steepest decline visibility, dropping by 9.2 %. Aveda fell 6.2 %, Elizabeth Arden dropped 5.8 %, and Beauty of Joseon declined 3.8 %. German pharmacy brand Mi.to. Pharm GmbH lost 4.3 %, while Israeli makeup brand GA-DE fell 3.3 %.
The data reveals a clear German preference for European beauty heritage, pharmaceutical-grade cosmetics, and established prestige brands during Black Friday, rather than trendy K-beauty products or mid-tier international brands.
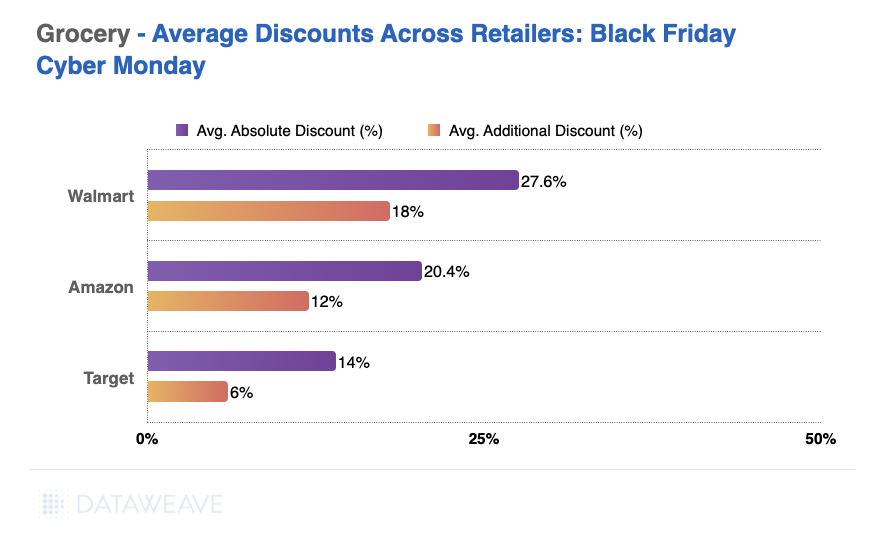
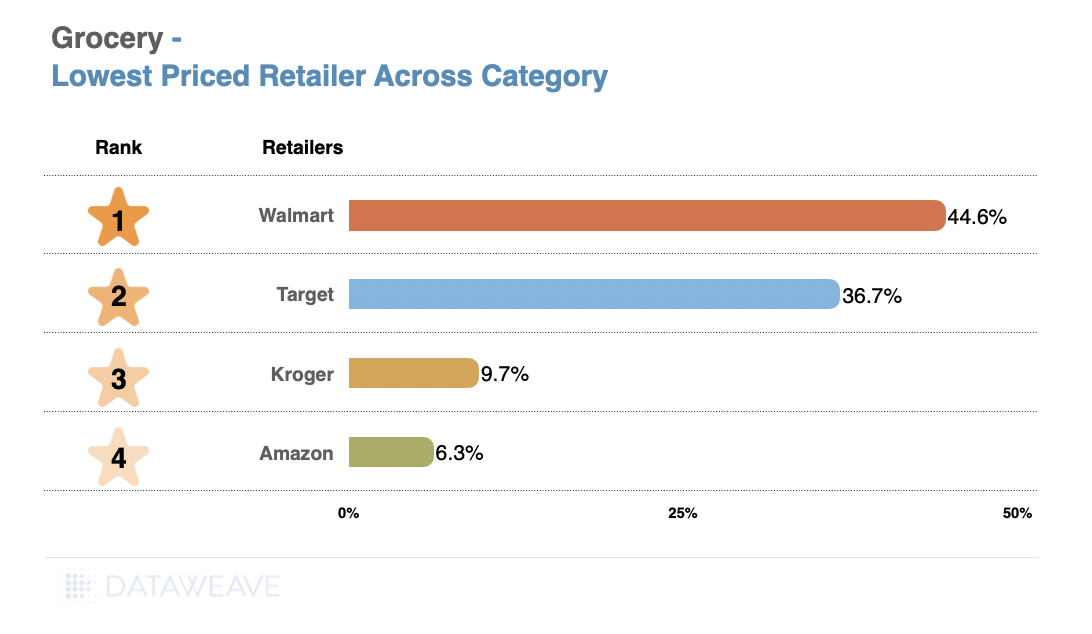
Grocery
While Grocery typically sees more modest discounts compared to discretionary categories, the German market showed interesting patterns with Black Friday Week discounts (3.5%) actually exceeding Pre-Black Friday levels (2.6%). Our analysis of 4,378 SKUs shows how German retailers approached promotions across essential and indulgent subcategories.
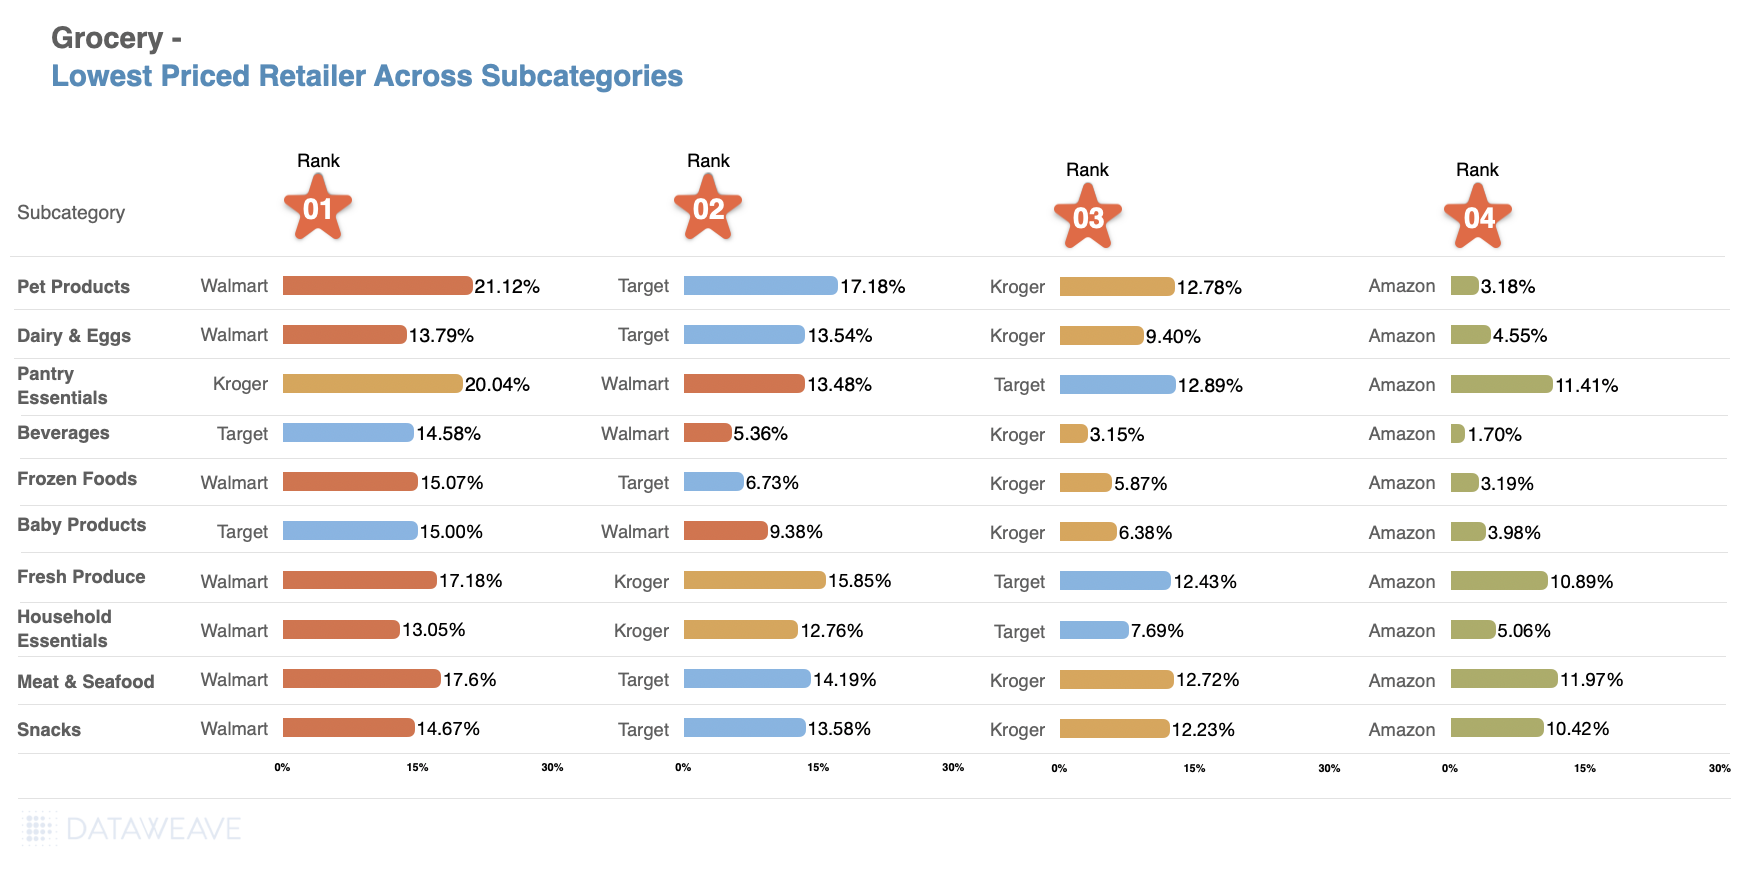
Subcategory Discount Analysis
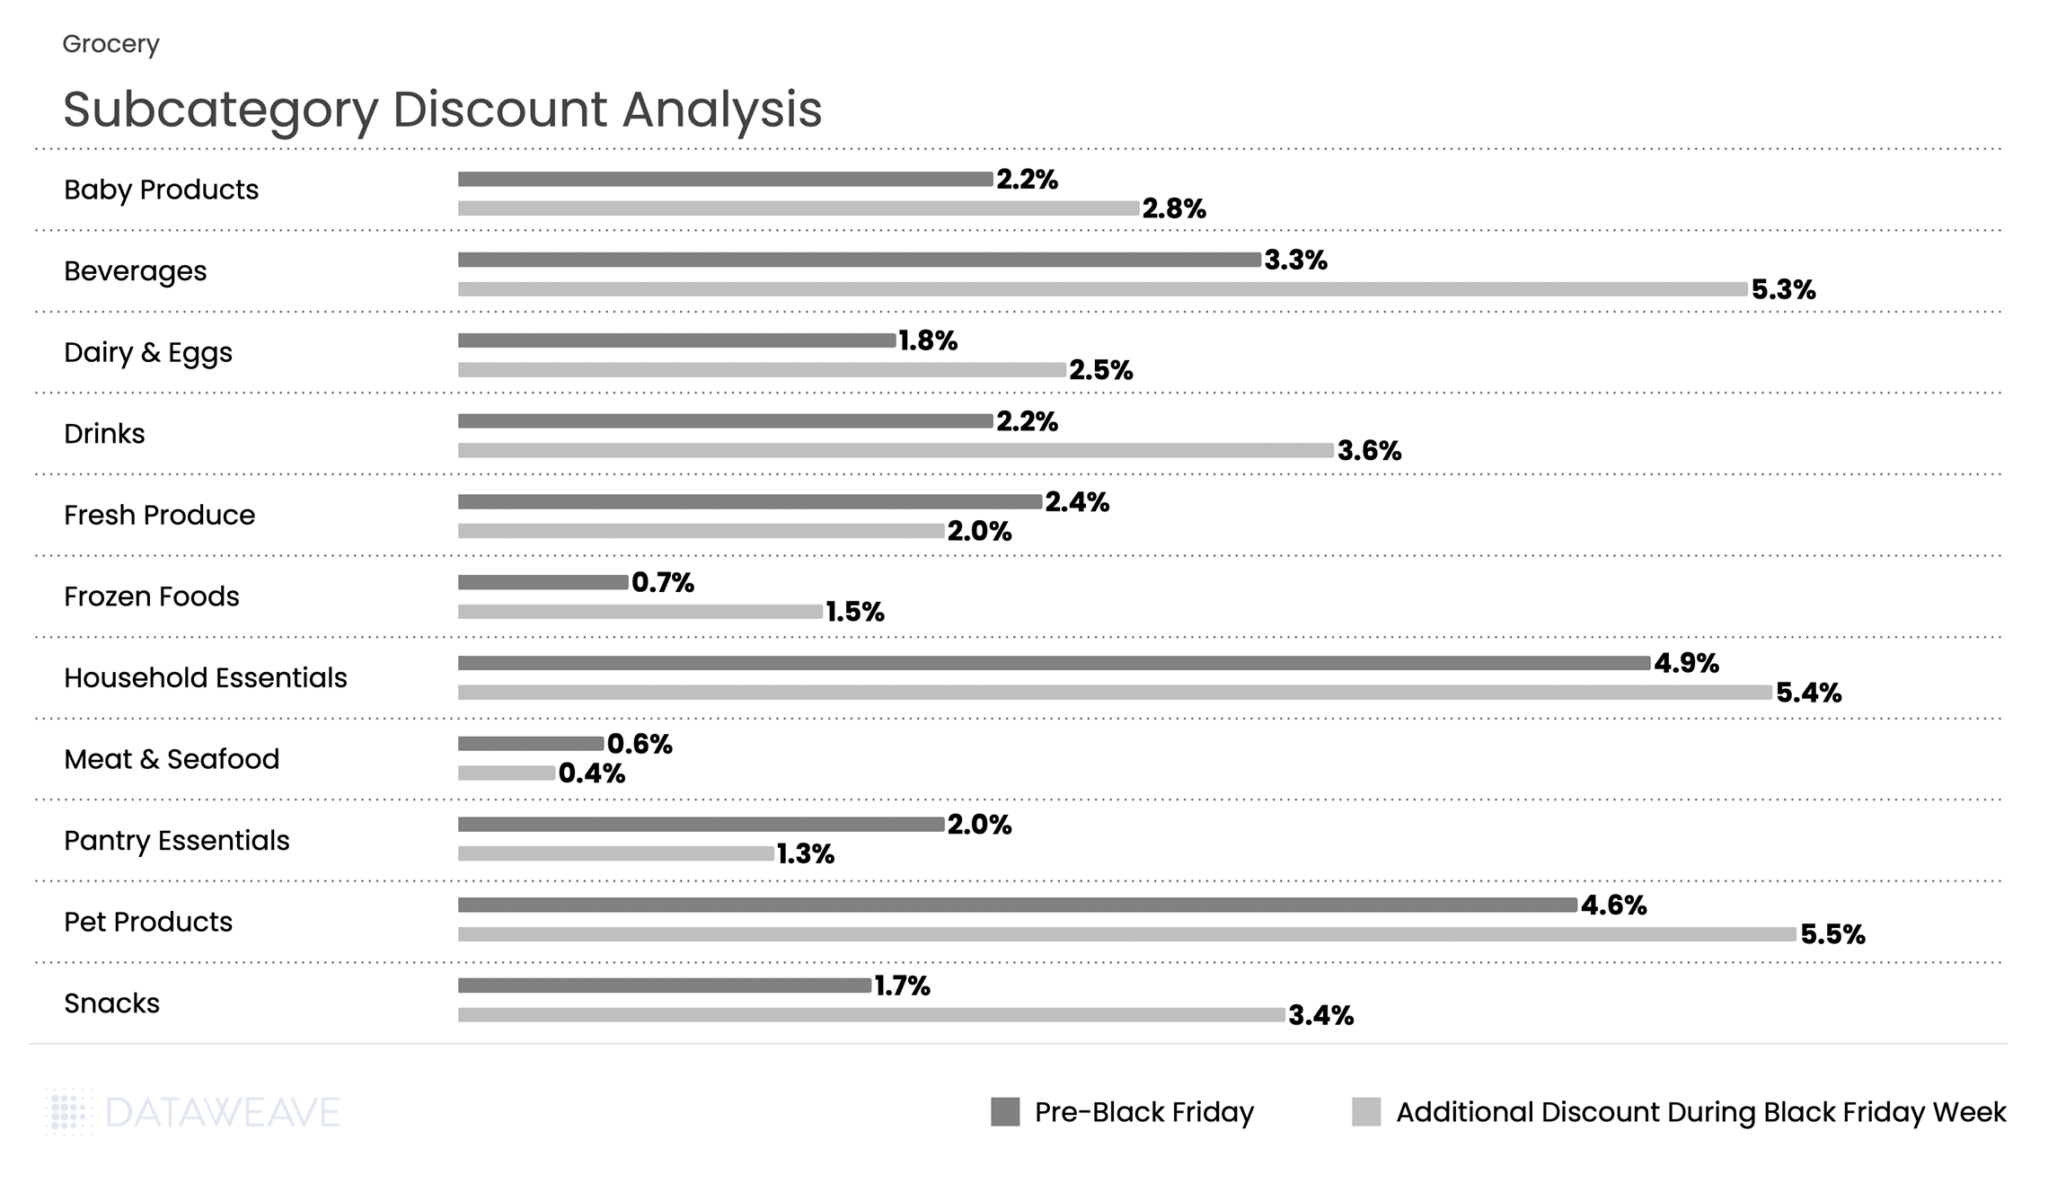
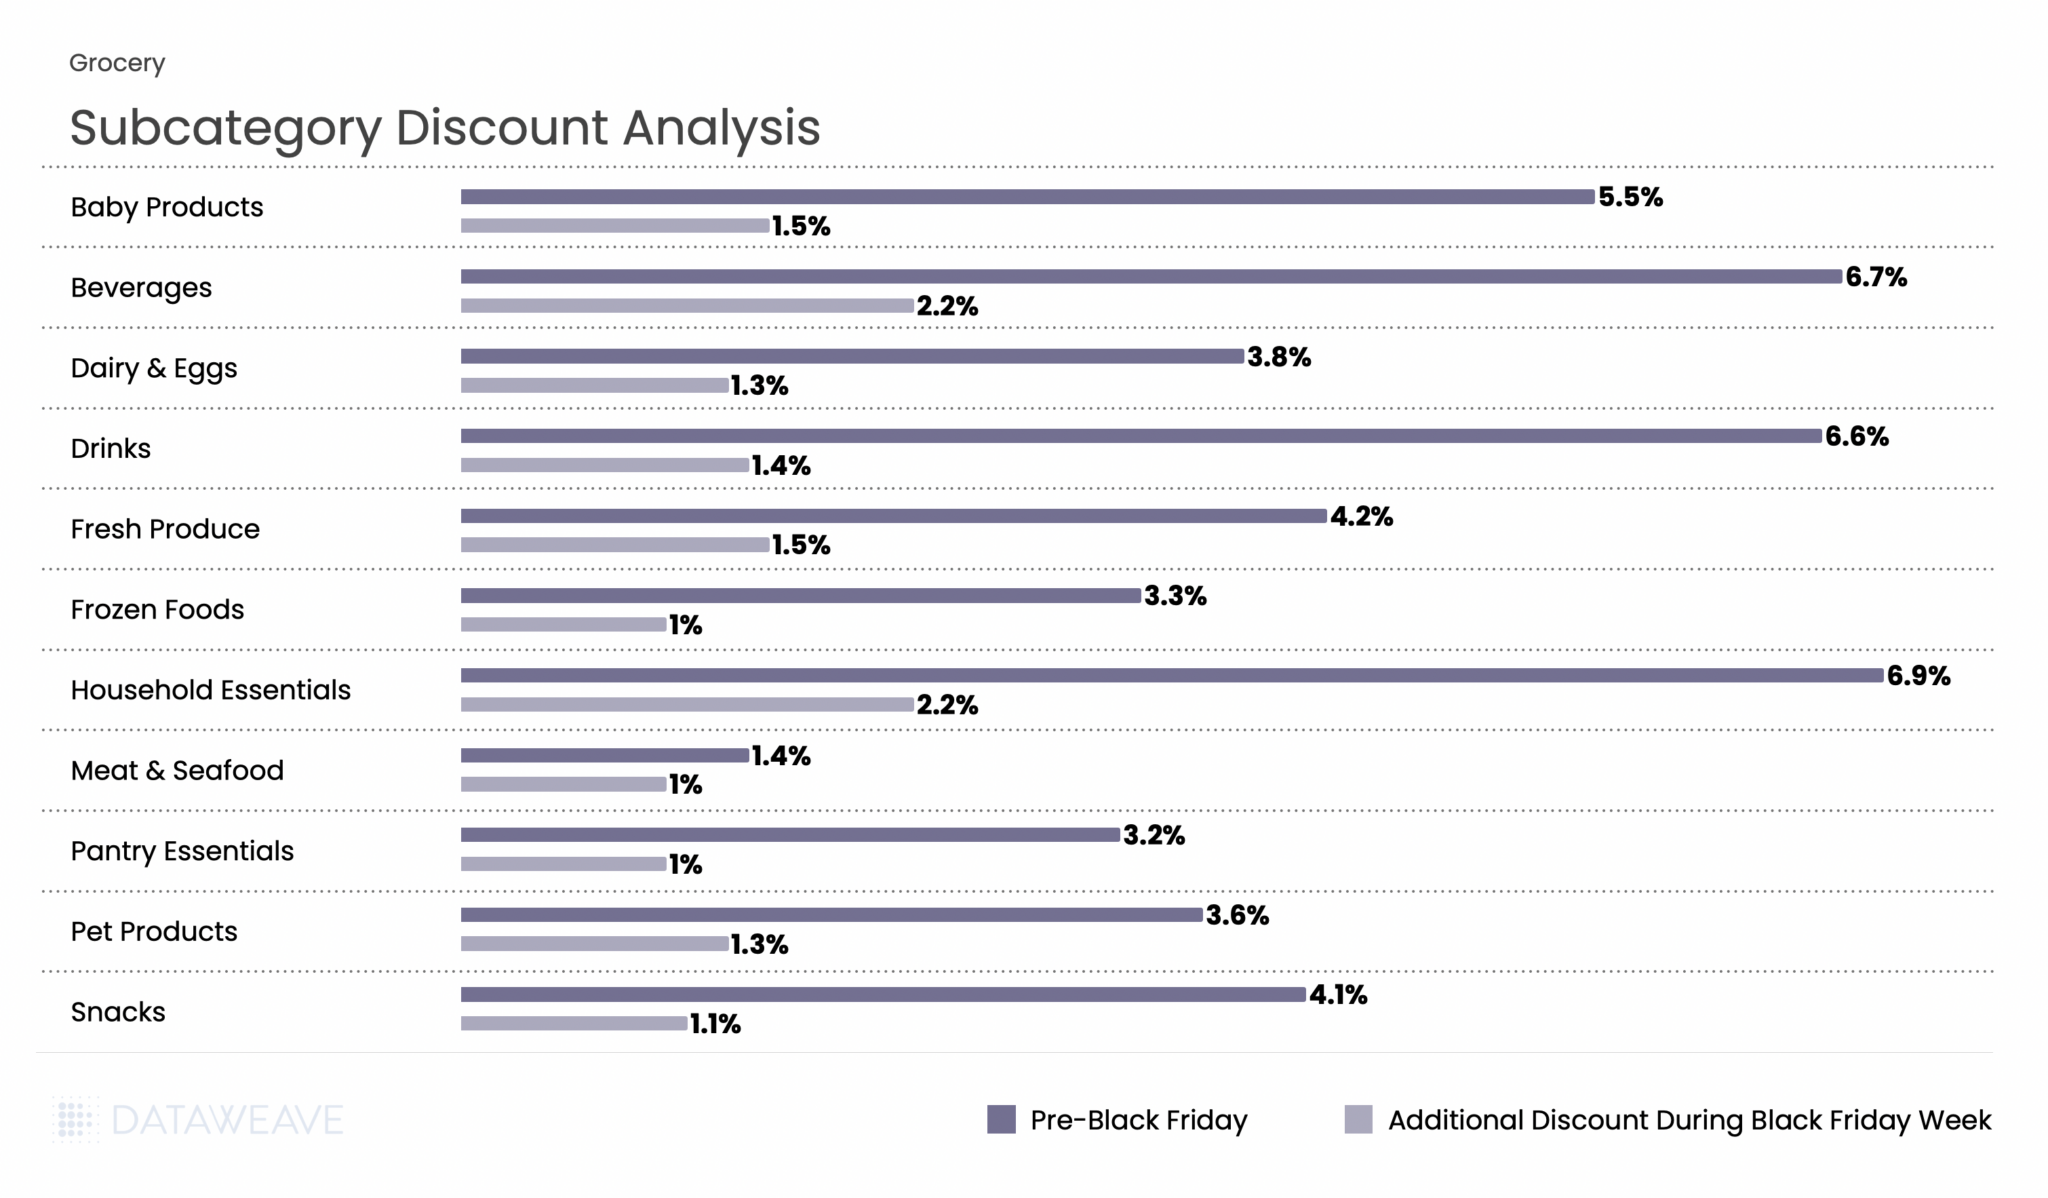
Pre-Black Friday discounts averaged just 2.6% in grocery. But Black Friday Week saw this surging to 3.5%, an increase that represents the highest proportional jump among all categories.
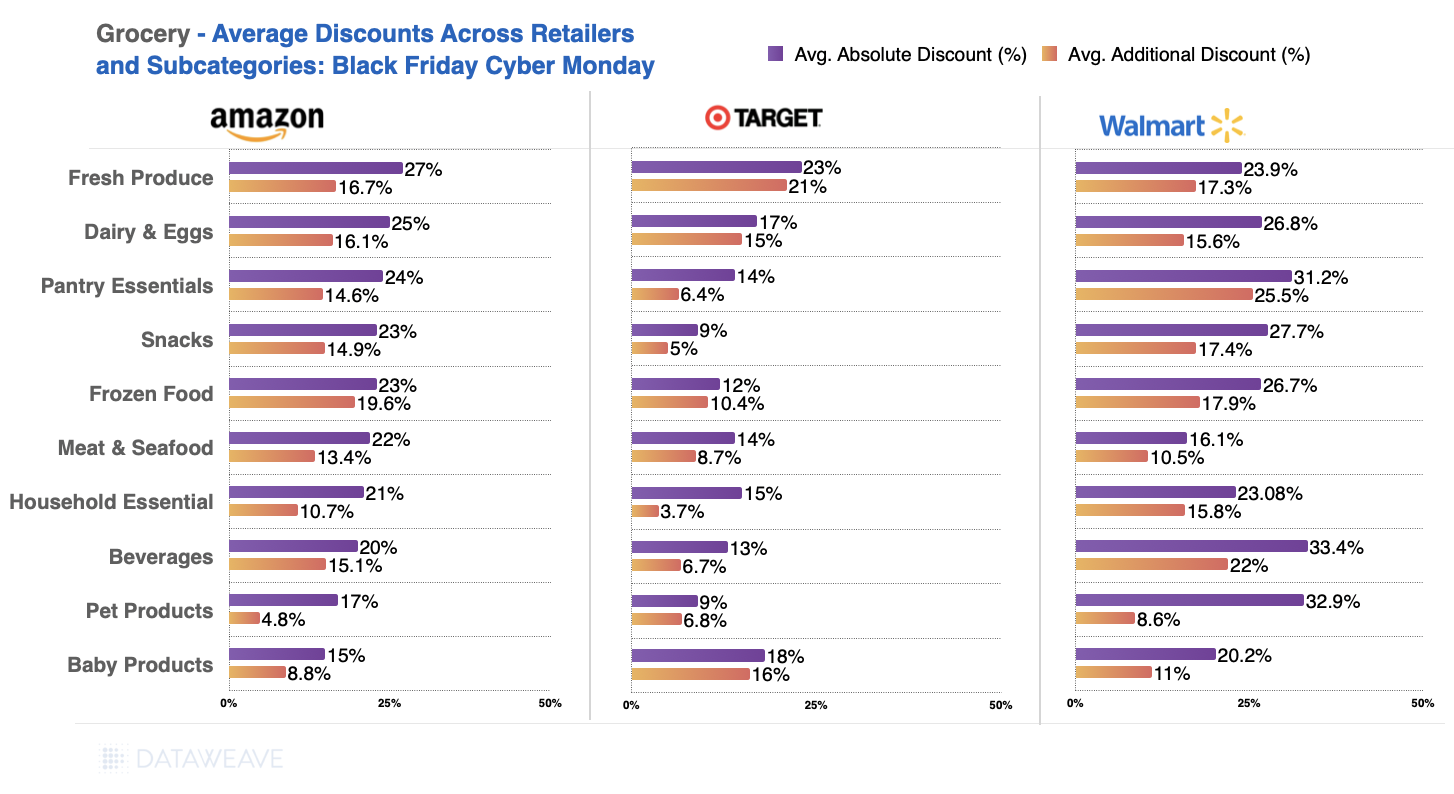
Pet Products and Household Essentials led discounting, with Pet Products at 4.6% pre-sale and an additional 5.5% during Black Friday Week. Meanwhile Household Essentials registered 4.9% and 5.4% respectively.
Beverages showed particularly strong Black Friday Week performance, jumping from 3.3% to 5.3%, while snacks doubled from 1.7% to 3.4%. Fresh categories maintained minimal promotional activity consistent with perishable inventory constraints: Meat & Seafood saw negligible discounts (0.6% pre-sale, 0.4% Black Friday Week), while Fresh Produce actually decreased from 2.4% to 2% during the main event.
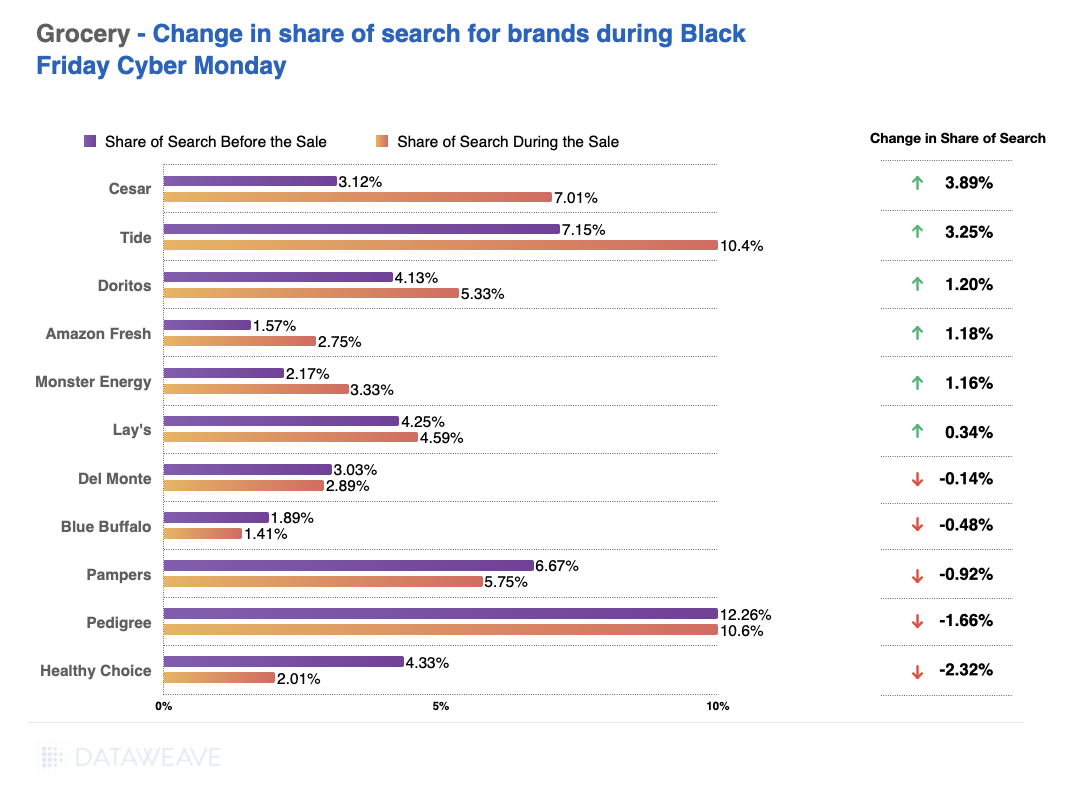
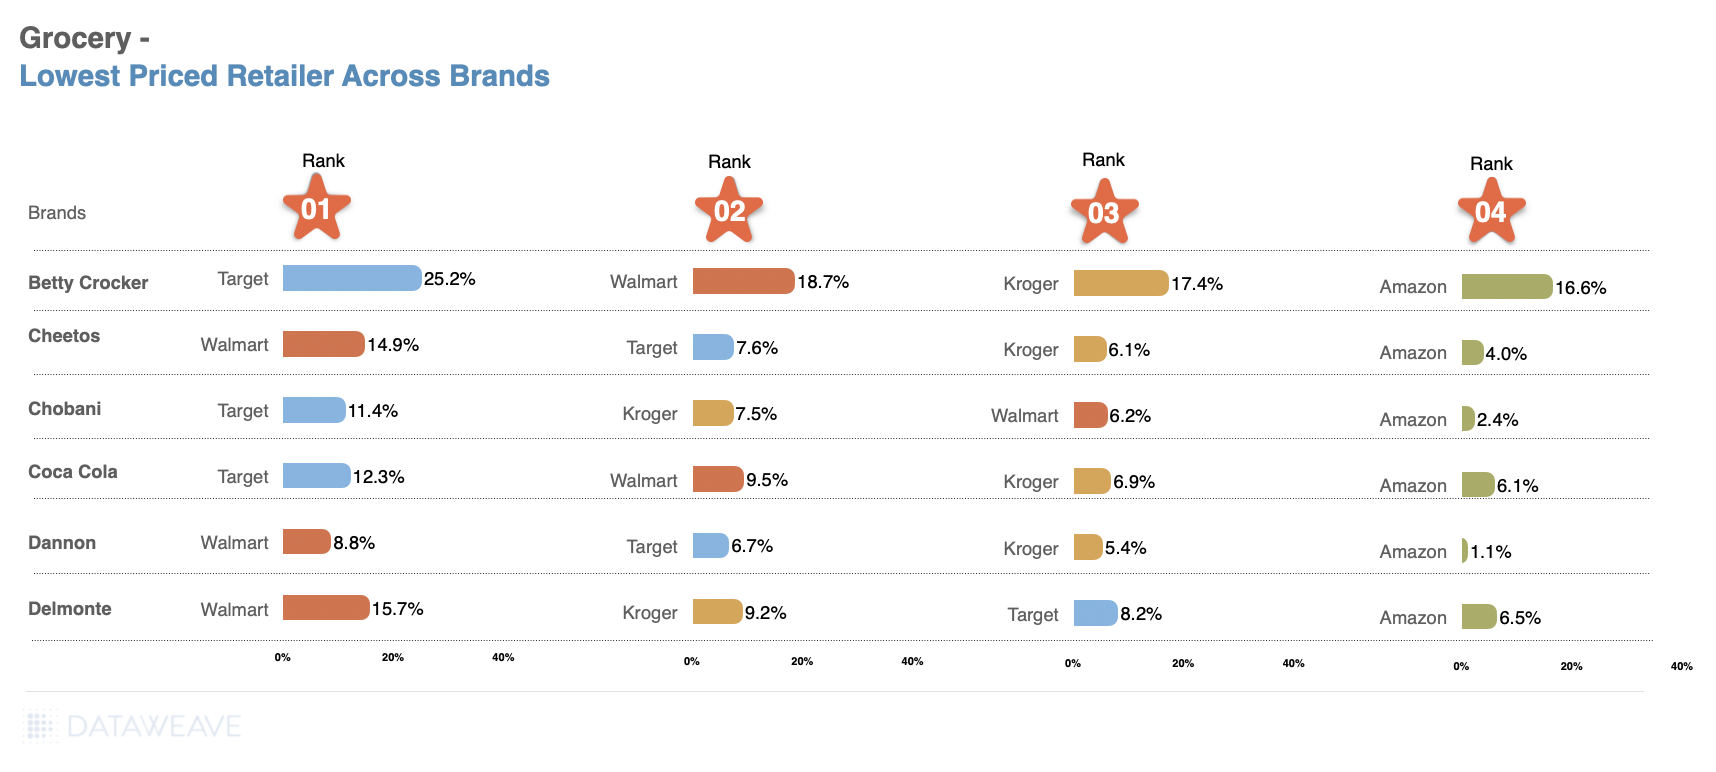
Share of Search: Brand Visibility Trends
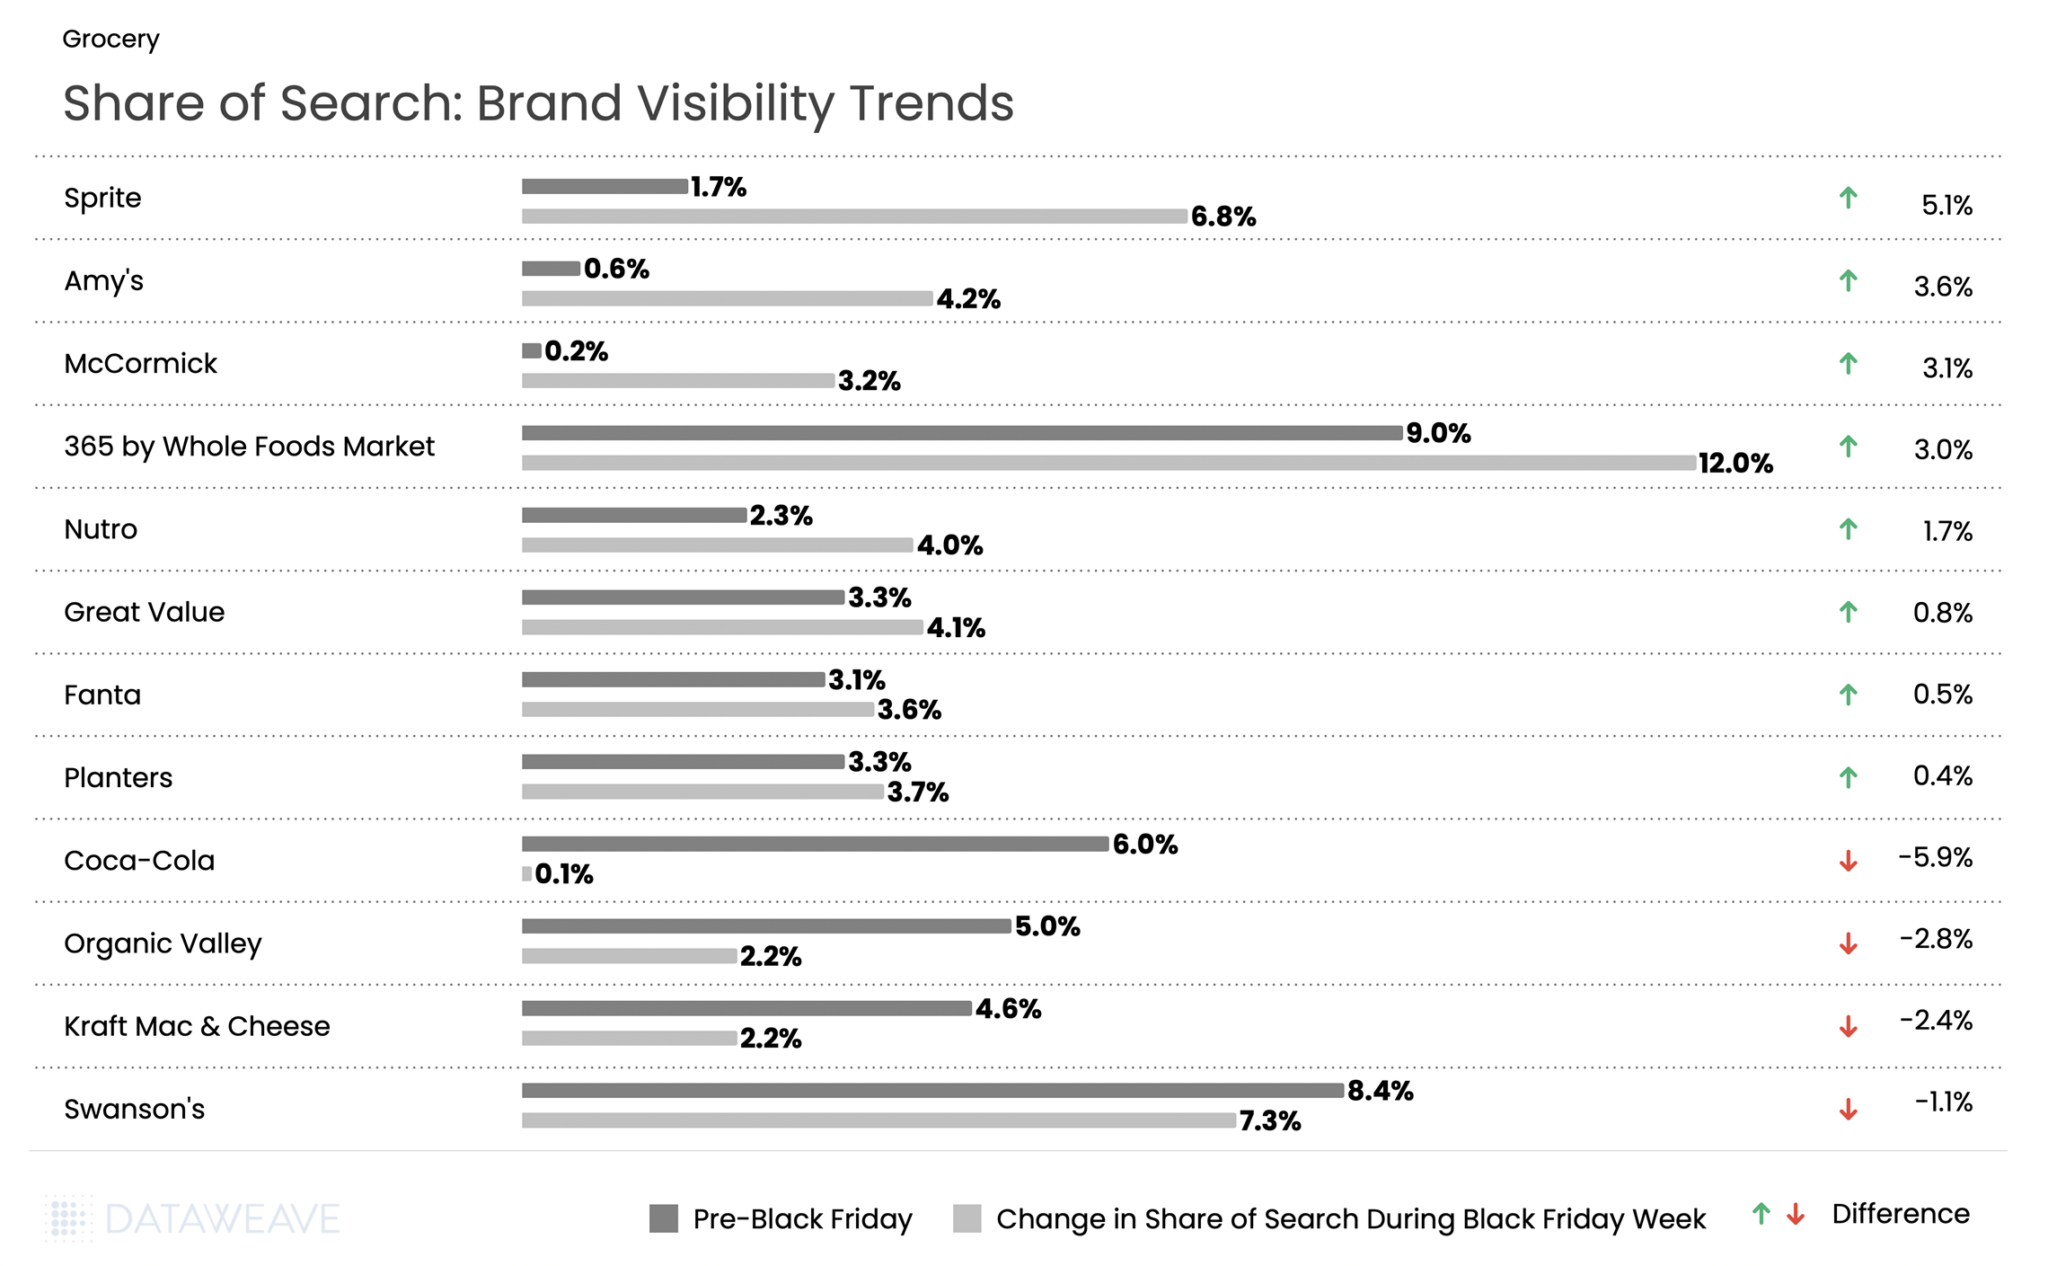
365 by Whole Foods saw the highest share of search at 9% pre event and 12% during Black Friday week. But Sprite led all brands with a 5.1% surge in share of search. Meanwhile, sister brand Coca-Cola experienced one of the steepest declines in our analysis, with visibility plummeting from 6.0% to just 0.1%. Fanta maintained modest search growth at 0.5 %. This stark divergence between two brands from the same parent company suggests vastly different promotional strategies during Black Friday Week.
Specialty and organic food brands performed well: Amy’s (organic/natural foods) gained 3.6 %, while spice brand McCormick surged 3.1 %. Pet food brand Nutro gained 1.7 %, while value-oriented Great Value added 0.8 %.
Snack brand Planters gained 0.4 %. On the decline side, Organic Valley dropped 2.8 %, Kraft Mac & Cheese fell 2.4 %, and Swanson’s declined 1.1 %.
Apparel
Apparel in the German market showed modest promotional activity compared to other markets, with Pre-Black Friday discounts averaging 5.9% and Black Friday Week at 5.2%. Our analysis of 2,321 SKUs reveals interesting patterns across fashion segments in the German market.
Subcategory Discount Analysis
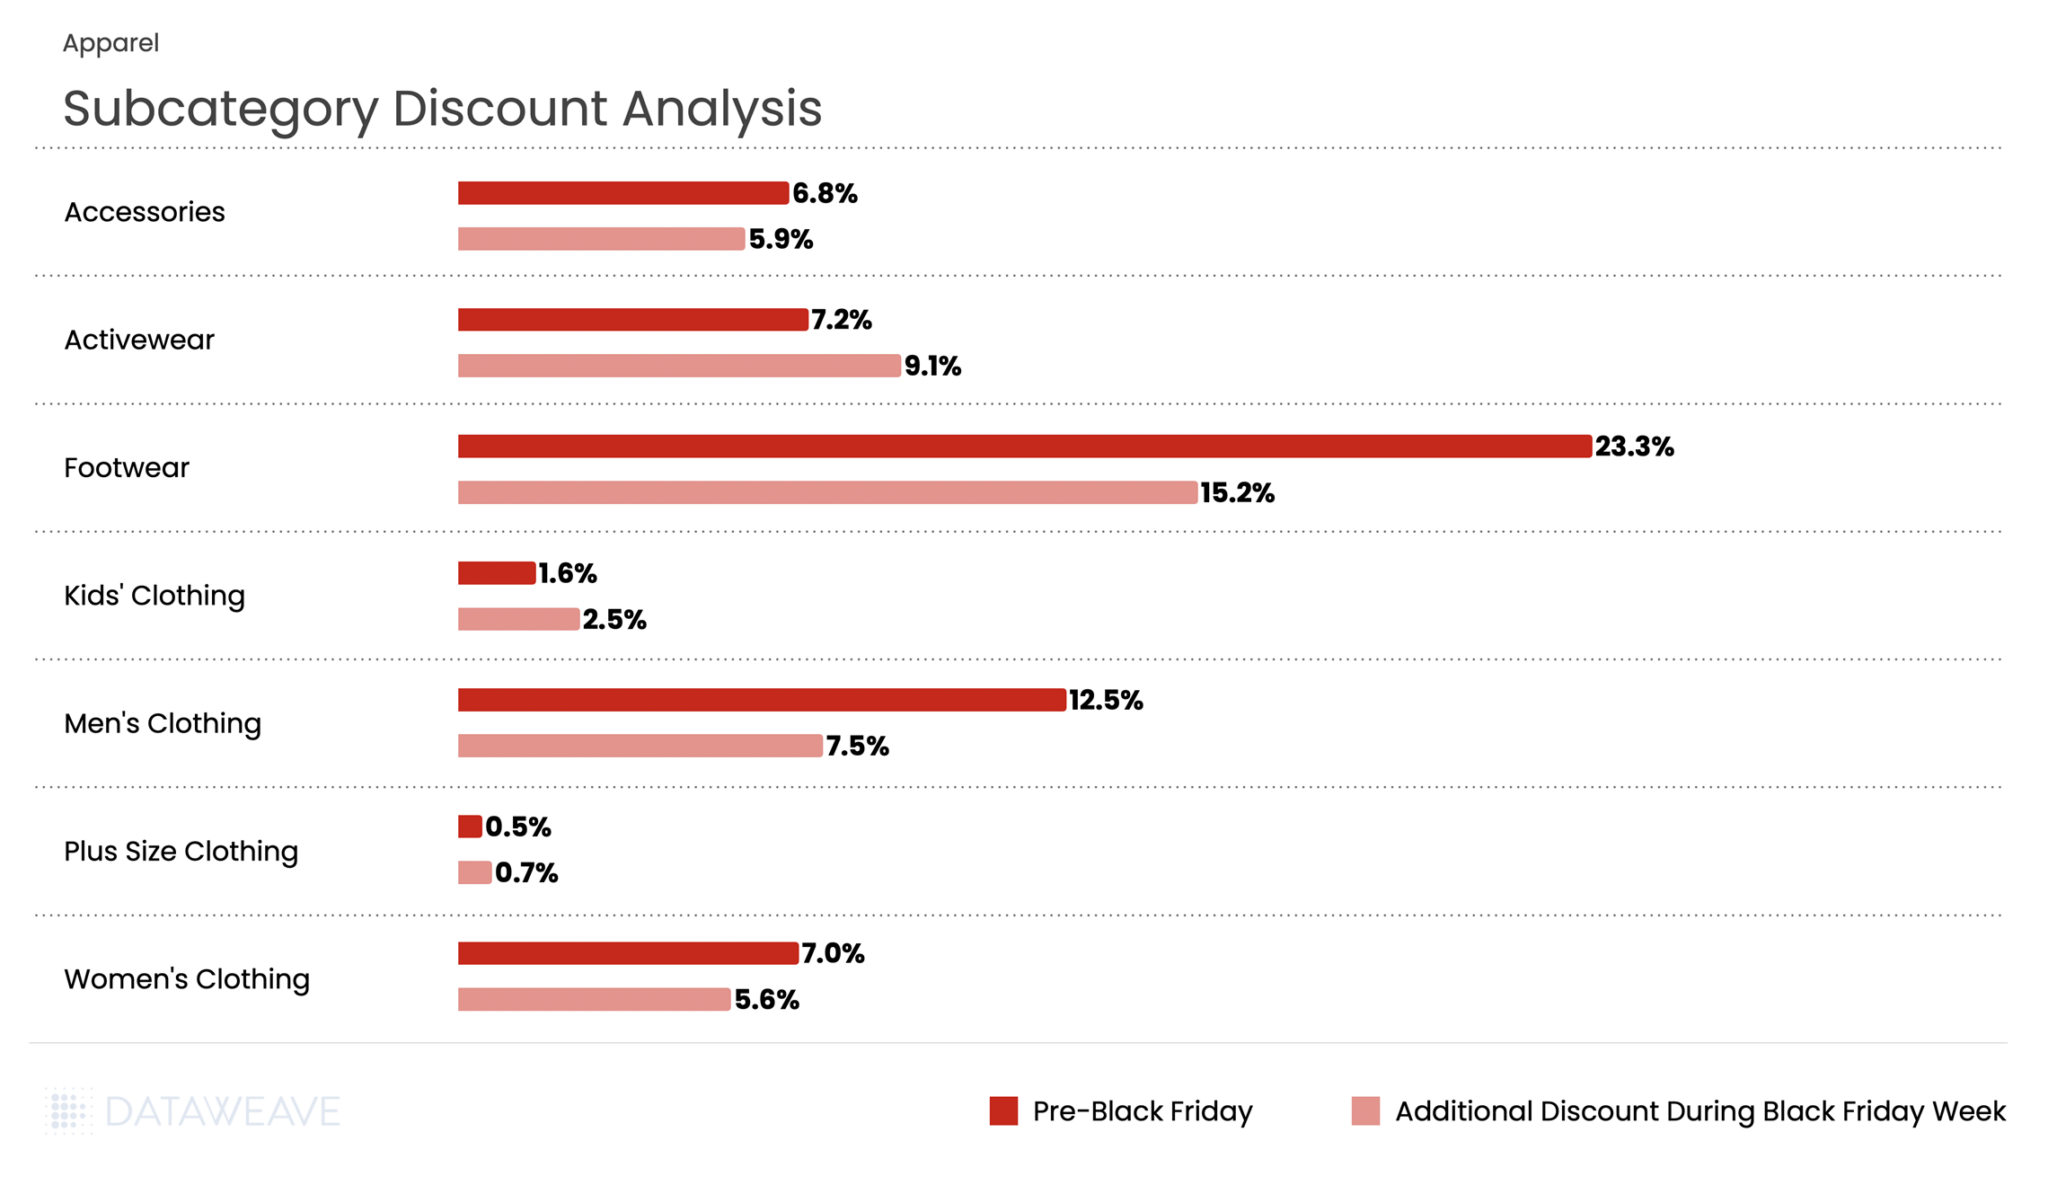
Footwear dominated discounting in both periods, with an impressive 23.3% pre-sale discount, and 15% additional discount during Black Friday Week. Men’s Clothing followed at 12.5% pre-sale, with additional 7.5% during Black Friday Week.
Activewear presented a unique pattern, with discounts increasing from 7.2% pre-event to additional 9.1% during Black Friday Week: one of the few subcategories to show higher discounts during the main event. Plus Size Clothing saw minimal promotional activity at 0.5% pre-sale and 0.7% during Black Friday Week, the lowest discounts in the entire category.
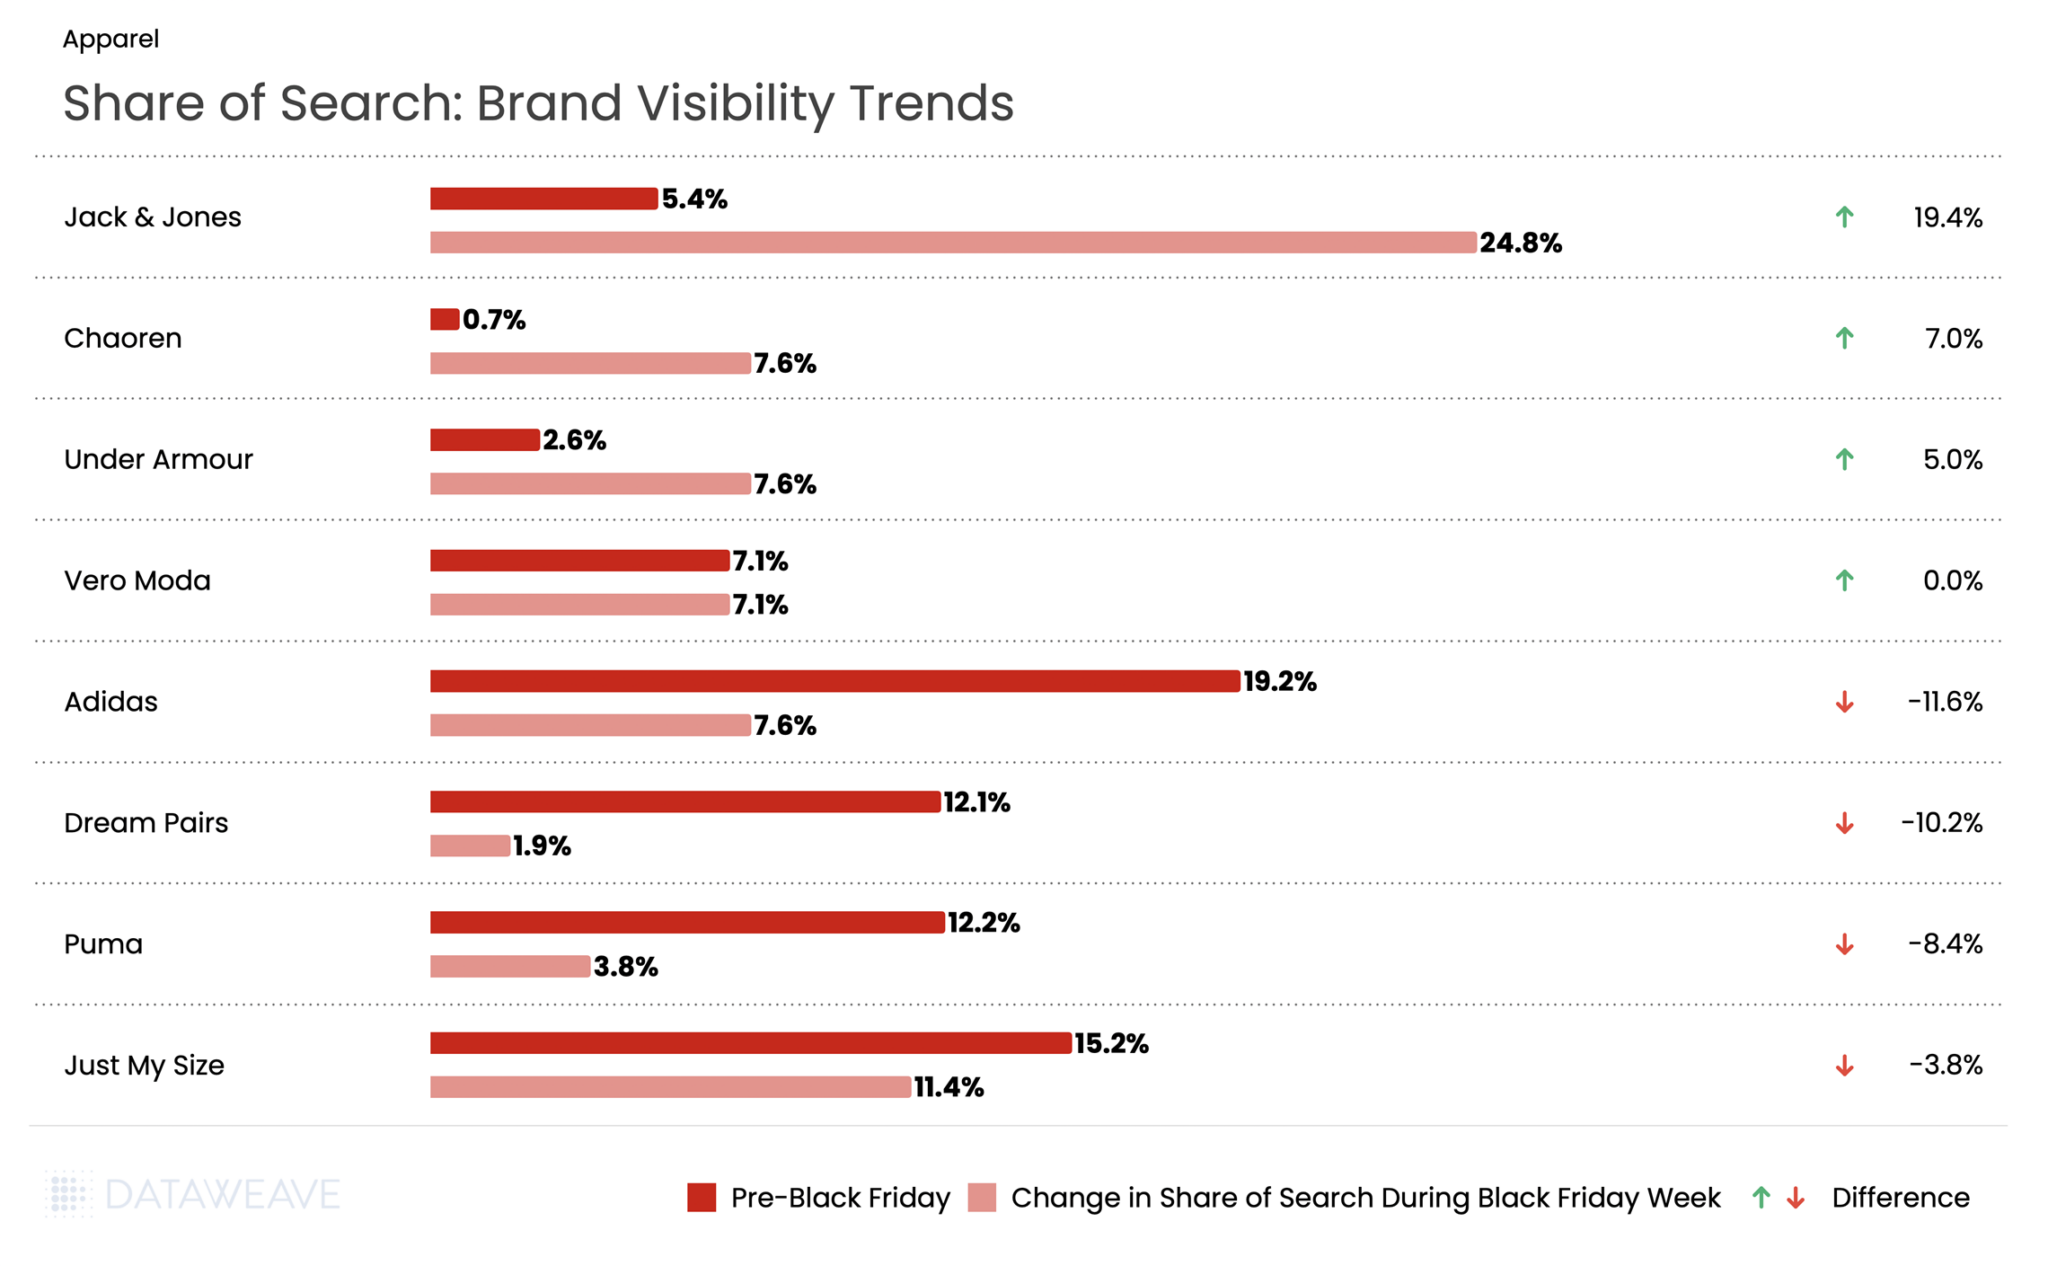
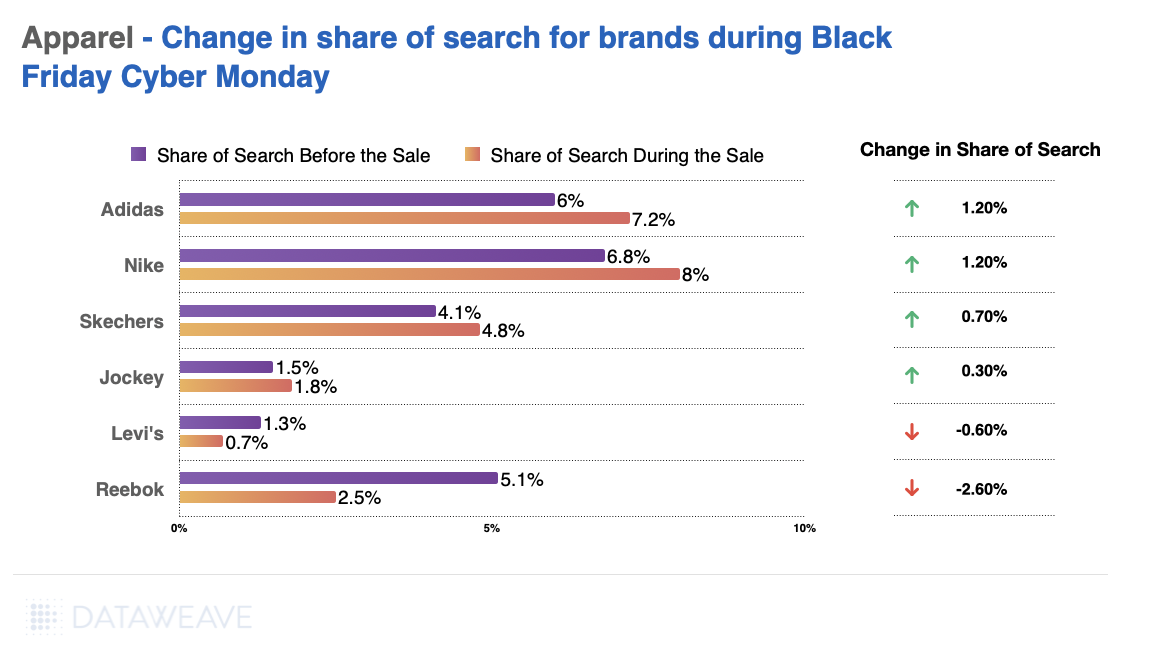
Share of Search: Brand Visibility Trends
Danish fashion brand Jack & Jones experienced an unprecedented surge with a staggering 19.4% gain in visibility. Sister brand Vero Moda (also owned by Jack & Jones’ parent company Bestseller) maintained flat visibility at 7.1%. Footwear brand Chaoren gained 7%. Meanwhile activewear giant Under Armour rose by 5%.
However, established sportswear giants suffered dramatic visibility losses. Adidas experienced an 11.6% decline in share of search. Dream Pairs saw visibility drop by 10.2%, Puma fell 8.4%, and plus-size brand Just My Size declined by 3.8 %.
Want to understand how DataWeave’s pricing intelligence platform can help your business make data-driven decisions during peak sales events? Contact us to learn more about competitive insights, price intelligence, assortment analytics, content analytics, and digital shelf analytics.
Check out our analysis on Black Friday Pricing and Discount trends in the USA and UK. Follow our blog for more insights on retail pricing trends, brand visibility analysis, and data-driven commerce intelligence.
Black Friday 2025 saw British shoppers spend an average of £430 each this year representing a £91 increase from last year and totaling over £10.2 billion across the sales period.
The 2025 sales event arrived at a pivotal moment for UK retail. Retail sales fell 1.1% in October 2025 as consumers held back spending in anticipation of Black Friday promotions, according to the Office for National Statistics. Over 2 in 5 UK adults participated in Black Friday shopping, with 45% planning to pick up Christmas gifts at a discount, according to a Barclays study.
Against this backdrop of cautious optimism and strategic consumer behavior, how did retailers and brands perform across key categories this Black Friday? At DataWeave, we conducted a comprehensive analysis of Black Friday 2025 discounting trends across five major categories in the UK market: Consumer Electronics, Home & Furniture, Health & Beauty, Grocery, and Apparel. Our AI-powered pricing intelligence platform monitored over 71K SKUs across leading UK retailers like Costco, Selfridges, Boots, Debenham’s, Carethy, Argos, John Lewis, Amazon, and more, revealing fascinating patterns in how retailers and brands approached this year’s sale season.
Our Methodology
For this analysis, DataWeave monitored average discounts across leading UK retailers during two distinct periods:
Pre-Black Friday: November 6 – November 23, 2025 – capturing early holiday deals and baseline pricing
Additional Discounts During Black Friday Week: November 24 – December 1, 2025 – covering Thanksgiving week through Black Friday (November 28) and Cyber Monday (December 1)
Our sample encompassed the top-ranked products across subcategories on major retail sites. We also analyzed Share of Search data, which measures brand visibility by monitoring which brand names appear in the top 20 search results for critical keywords.
Black Friday 2025 UK: The Big Picture
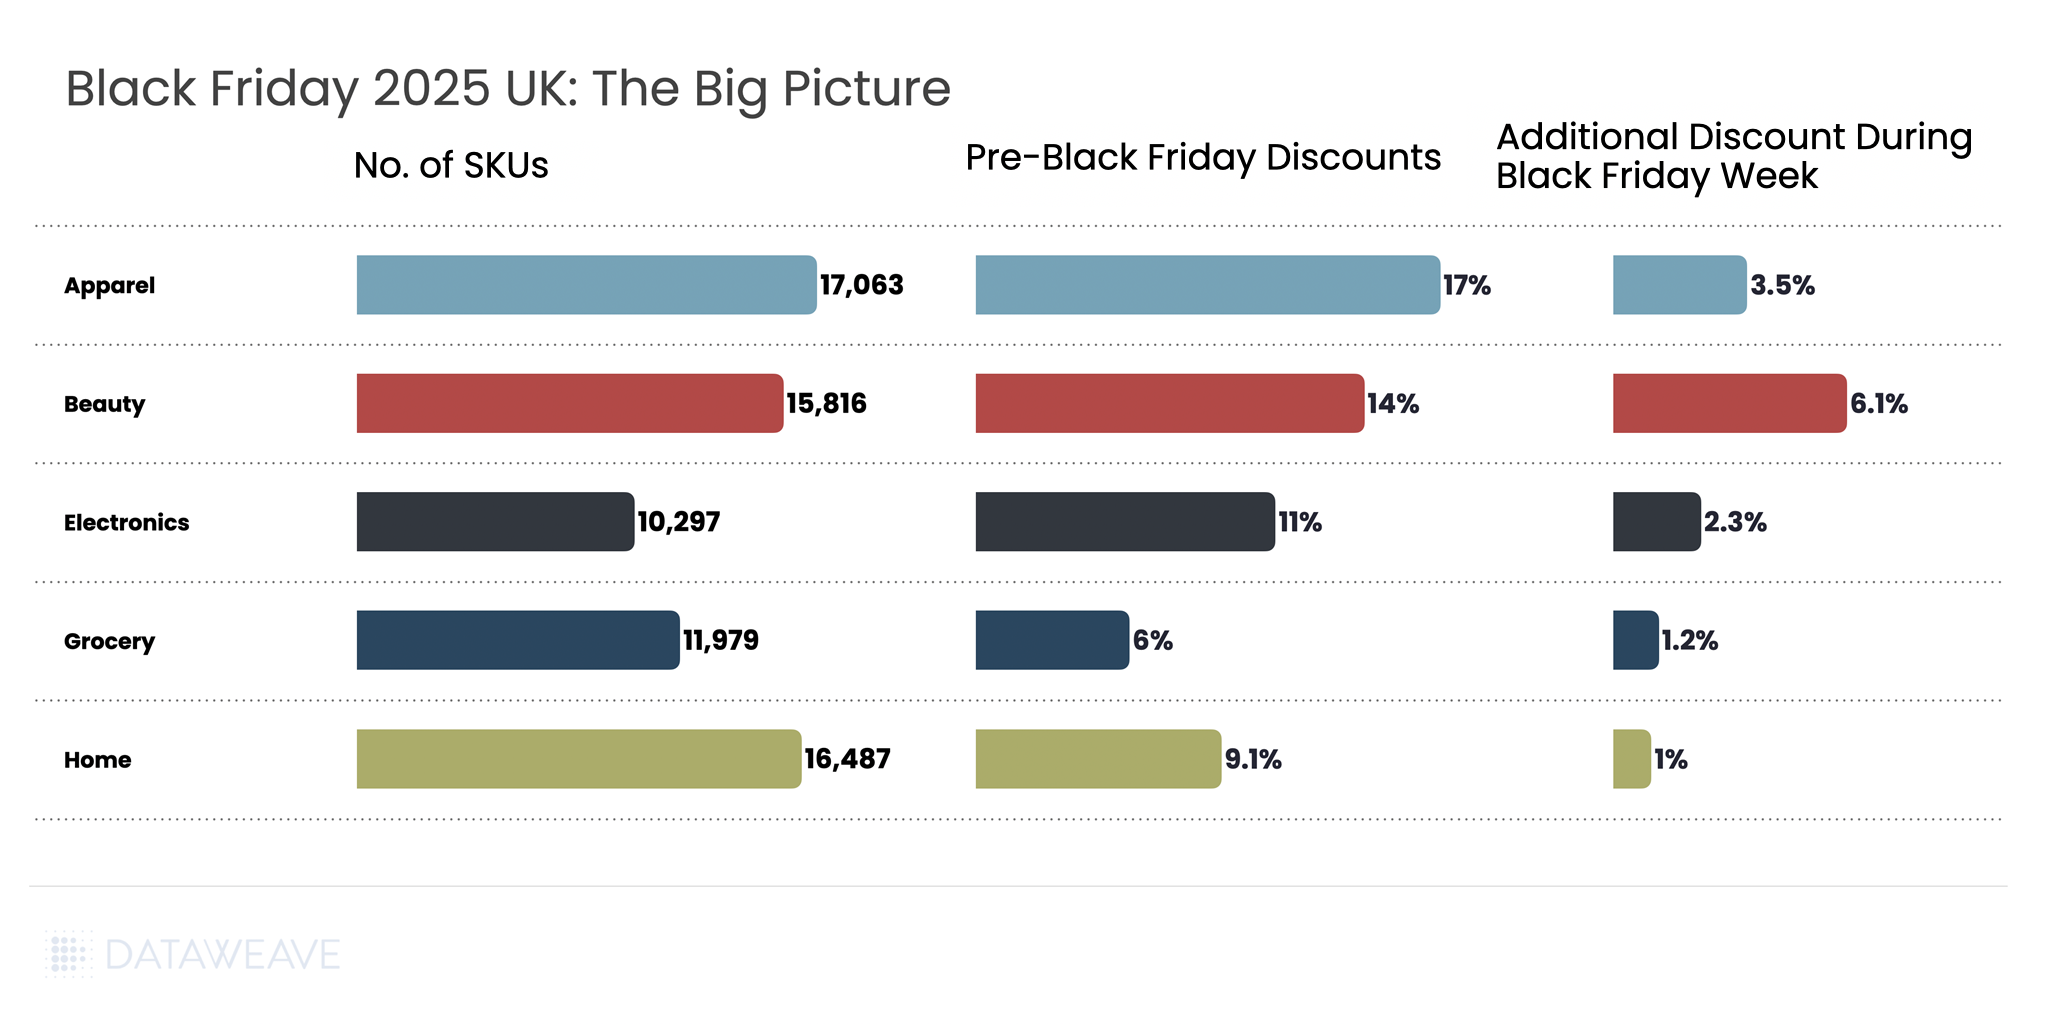
Our analysis covered 71,642 SKUs across five major categories. Here’s the snapshot of average discounts during the Pre-Black Friday period compared to Black Friday Week:
Key Insight: Pre-Black Friday discounts were substantial across all categories. This suggests UK retailers front-loaded their promotions to capture early holiday shoppers, with additional discounts during Black Friday Week adding to the baseline discounts already in place. The extended promotional period transformed Black Friday from a single-day event into a month-long campaign, with 60% of UK shoppers beginning their deal searches as early as October.
Consumer Electronics
Consumer electronics remains a cornerstone of Black Friday shopping in the UK, with technology accounting for 48% of planned consumer spending during the sales period, according to PwC.
AI is transforming how consumers shop for electronics, with AI-driven traffic to retail sites expected to rise 410% year-on-year during the 2025 holiday season. Younger shoppers particularly embraced AI tools, with 17% of Gen Z consumers using AI platforms like Chat GPT and Gemini to source and compare deals. Our analysis of 10,297 SKUs reveals how discounts varied across subcategories and which brands dominated search visibility.
Subcategory Discount Analysis
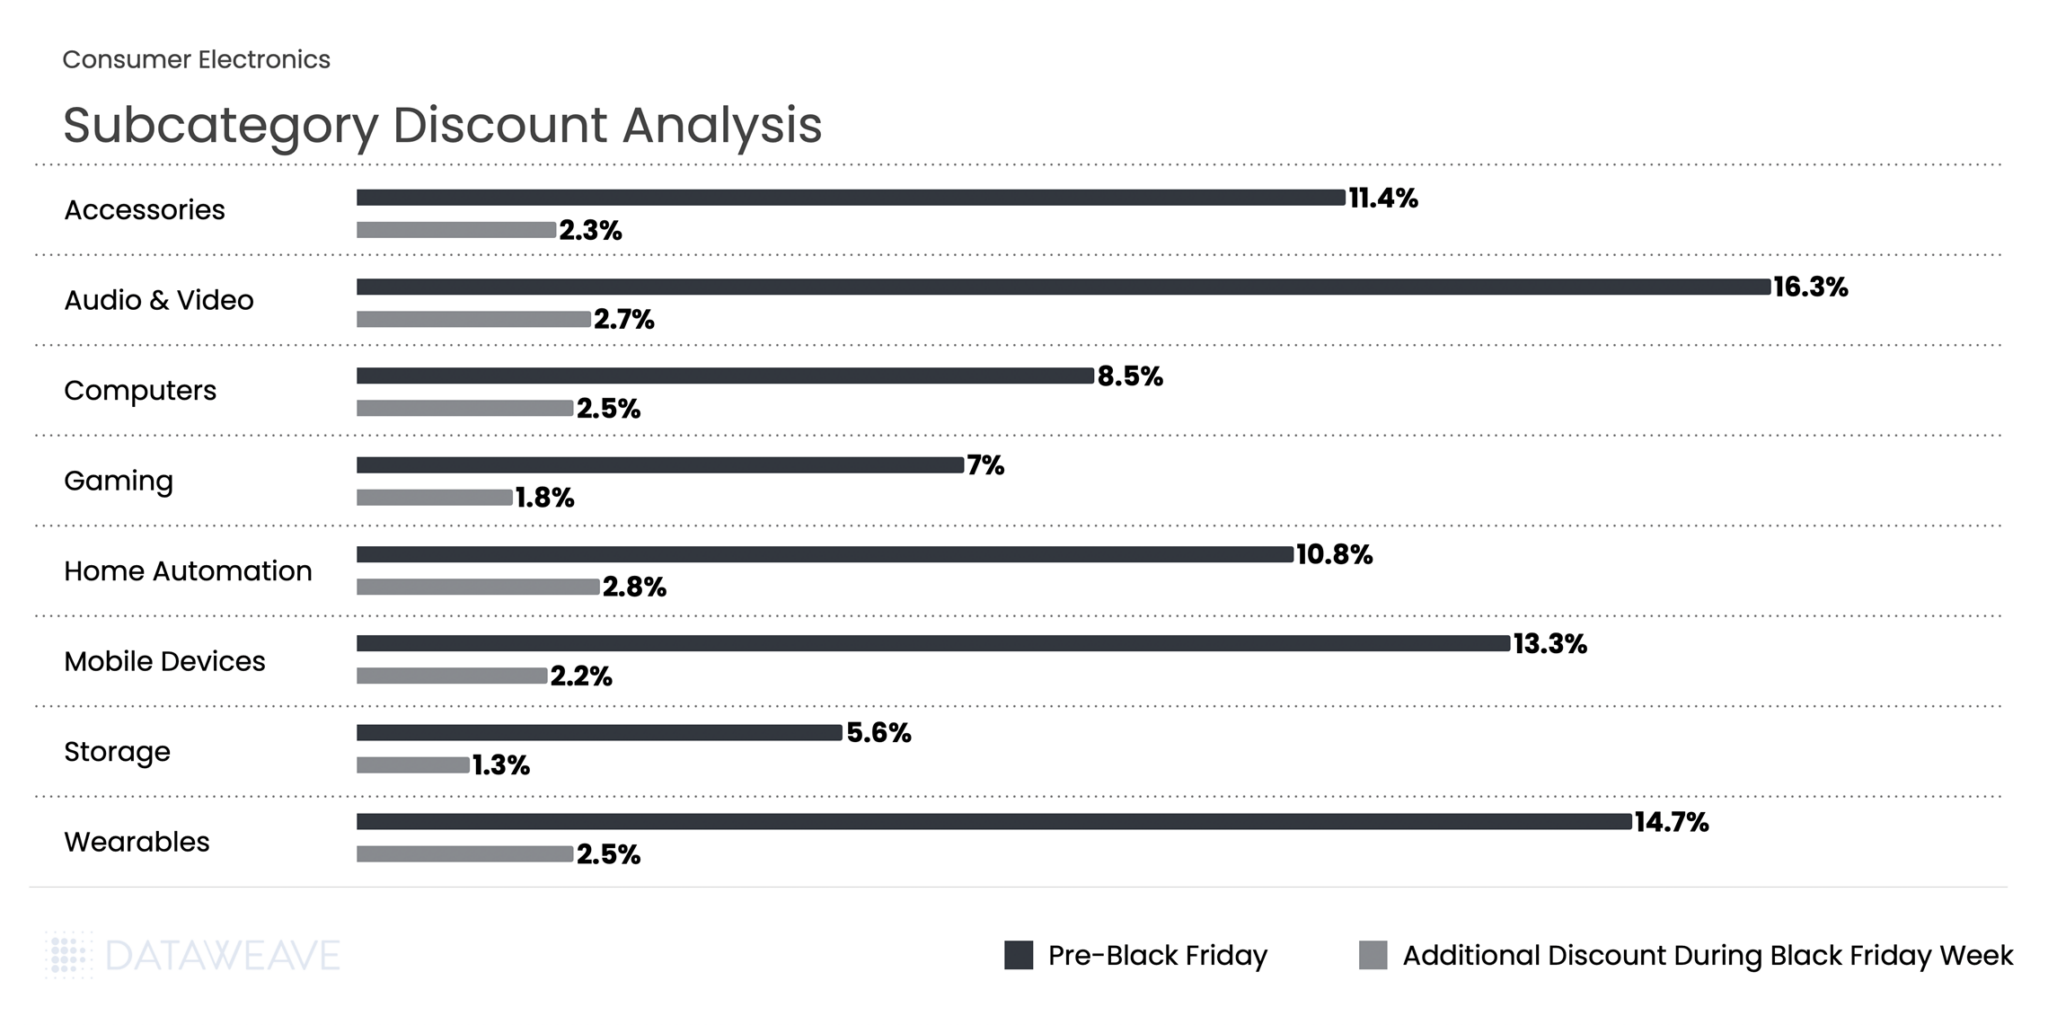
Pre-Black Friday discounts averaged 11.1% across subcategories, while Black Friday Week saw an additional 2.3% discount on average. Audio & Video products led the pre-sale discounting at 16.3%, indicating retailers were eager to move inventory early in the season.
During Black Friday Week, Home Automation saw the highest additional discount at 2.8%. Wearables and Computers both saw solid 2.5% additional discounts, making them attractive categories during the peak shopping period.
Share of Search: Brand Visibility Trends
Our Share of Search analysis reveals significant shifts in brand visibility during Black Friday Week:
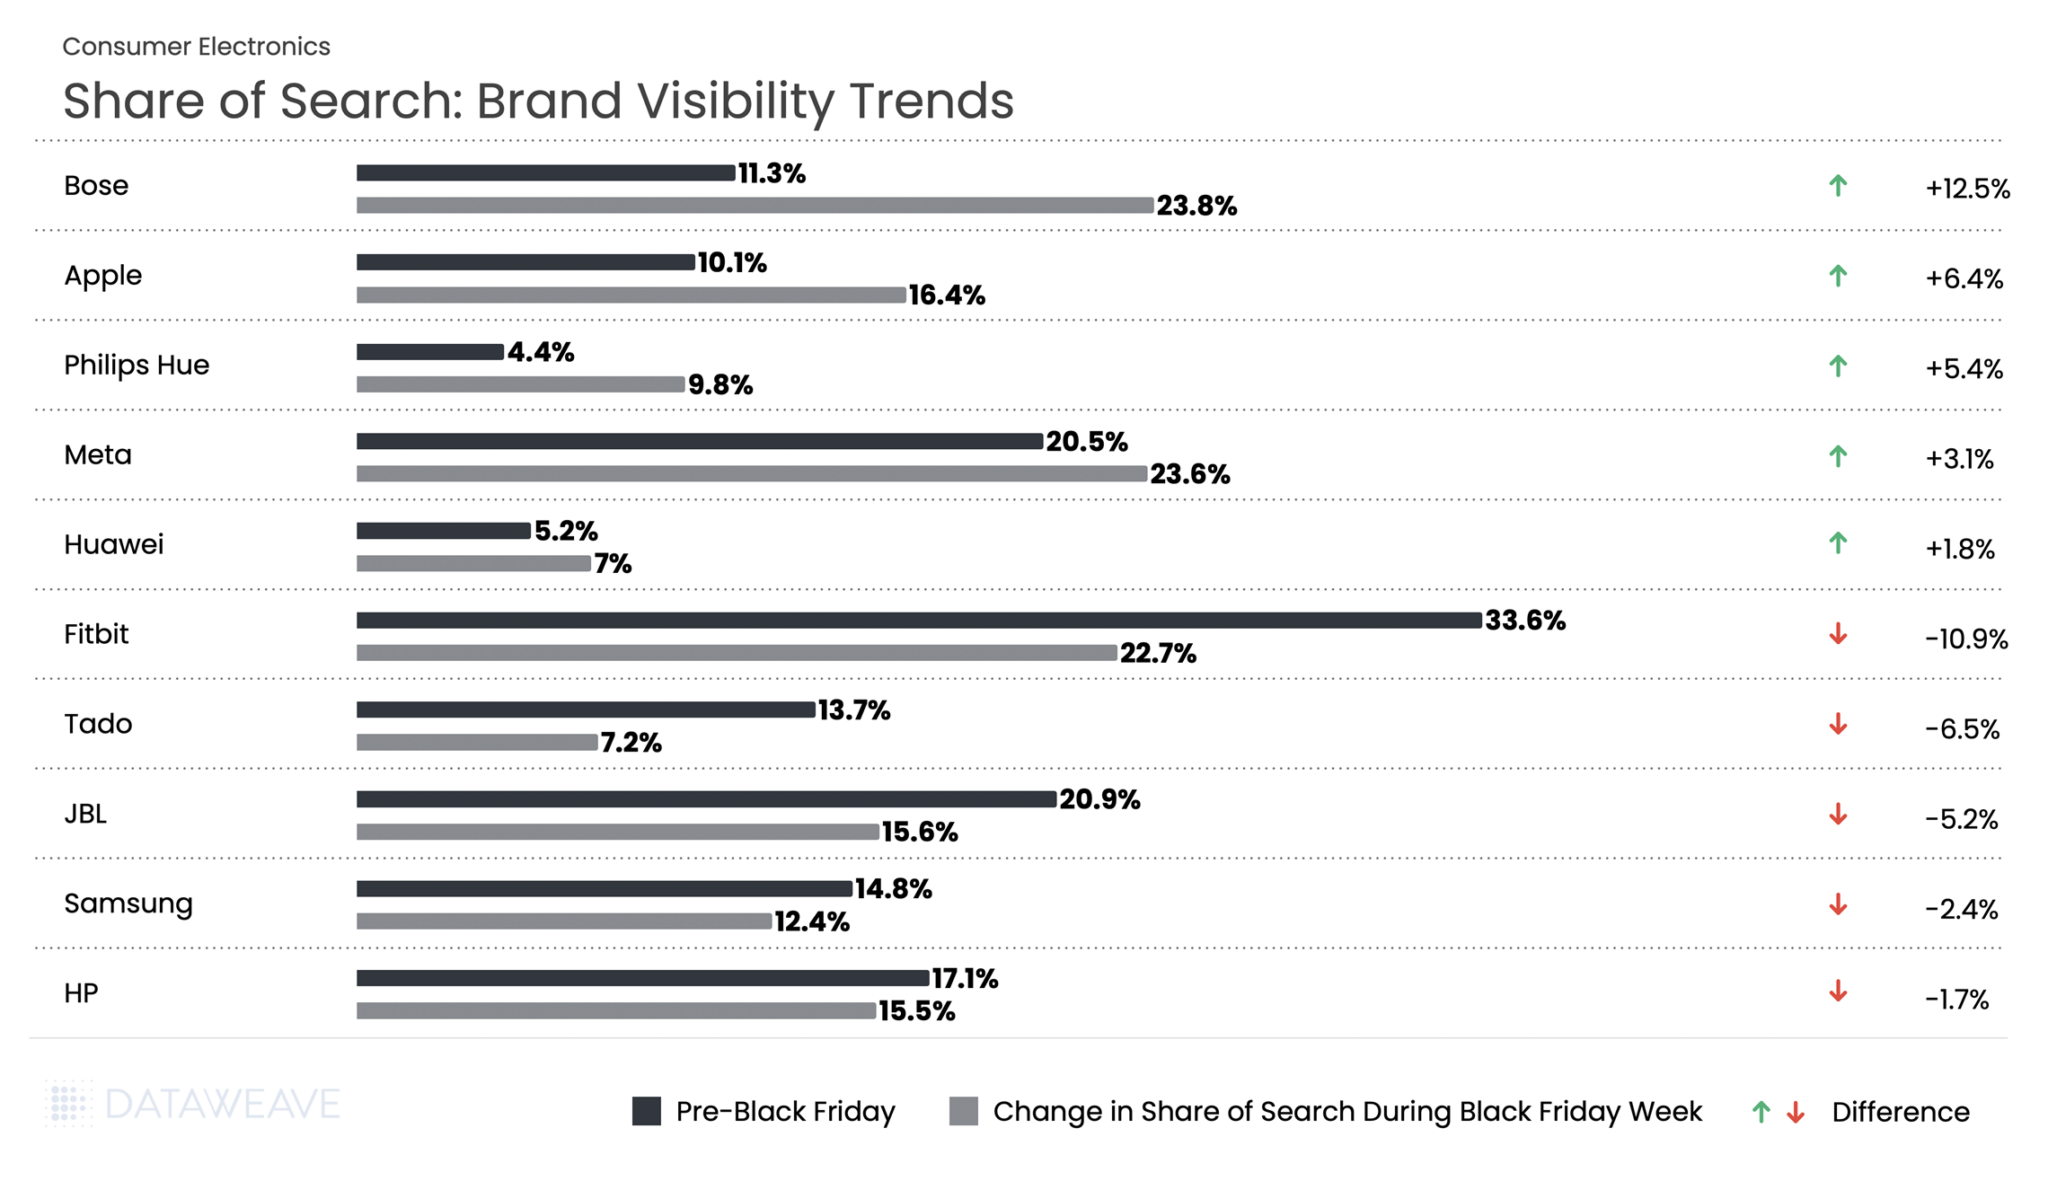
Bose dominated with its Share of Search more than doubling from 11.3% to 23.8%, a remarkable +12.5% gain. Lighting brand Philips Hue followed, gaining by +5.4% in share of search during Black Friday week. Notably, Meta, with it’s range of wearables, stands out for a +3.1% increase in visibility.
Apple’s Share of Search jumped from 10.1% to 16.4%, a gain of 6.4%. At the same time, Fitbit’s share dropped nearly 11%, the steepest decline in the entire electronics category. Meanwhile, Samsung and HP also lost on visibility this Black Friday in the UK.
Home & Furniture
The Home & Furniture category continues to attract UK consumers during Black Friday, though with a more measured discounting approach compared to other categories. Our analysis of 16,487 SKUs shows how discounts were distributed across subcategories.
Subcategory Discount Analysis
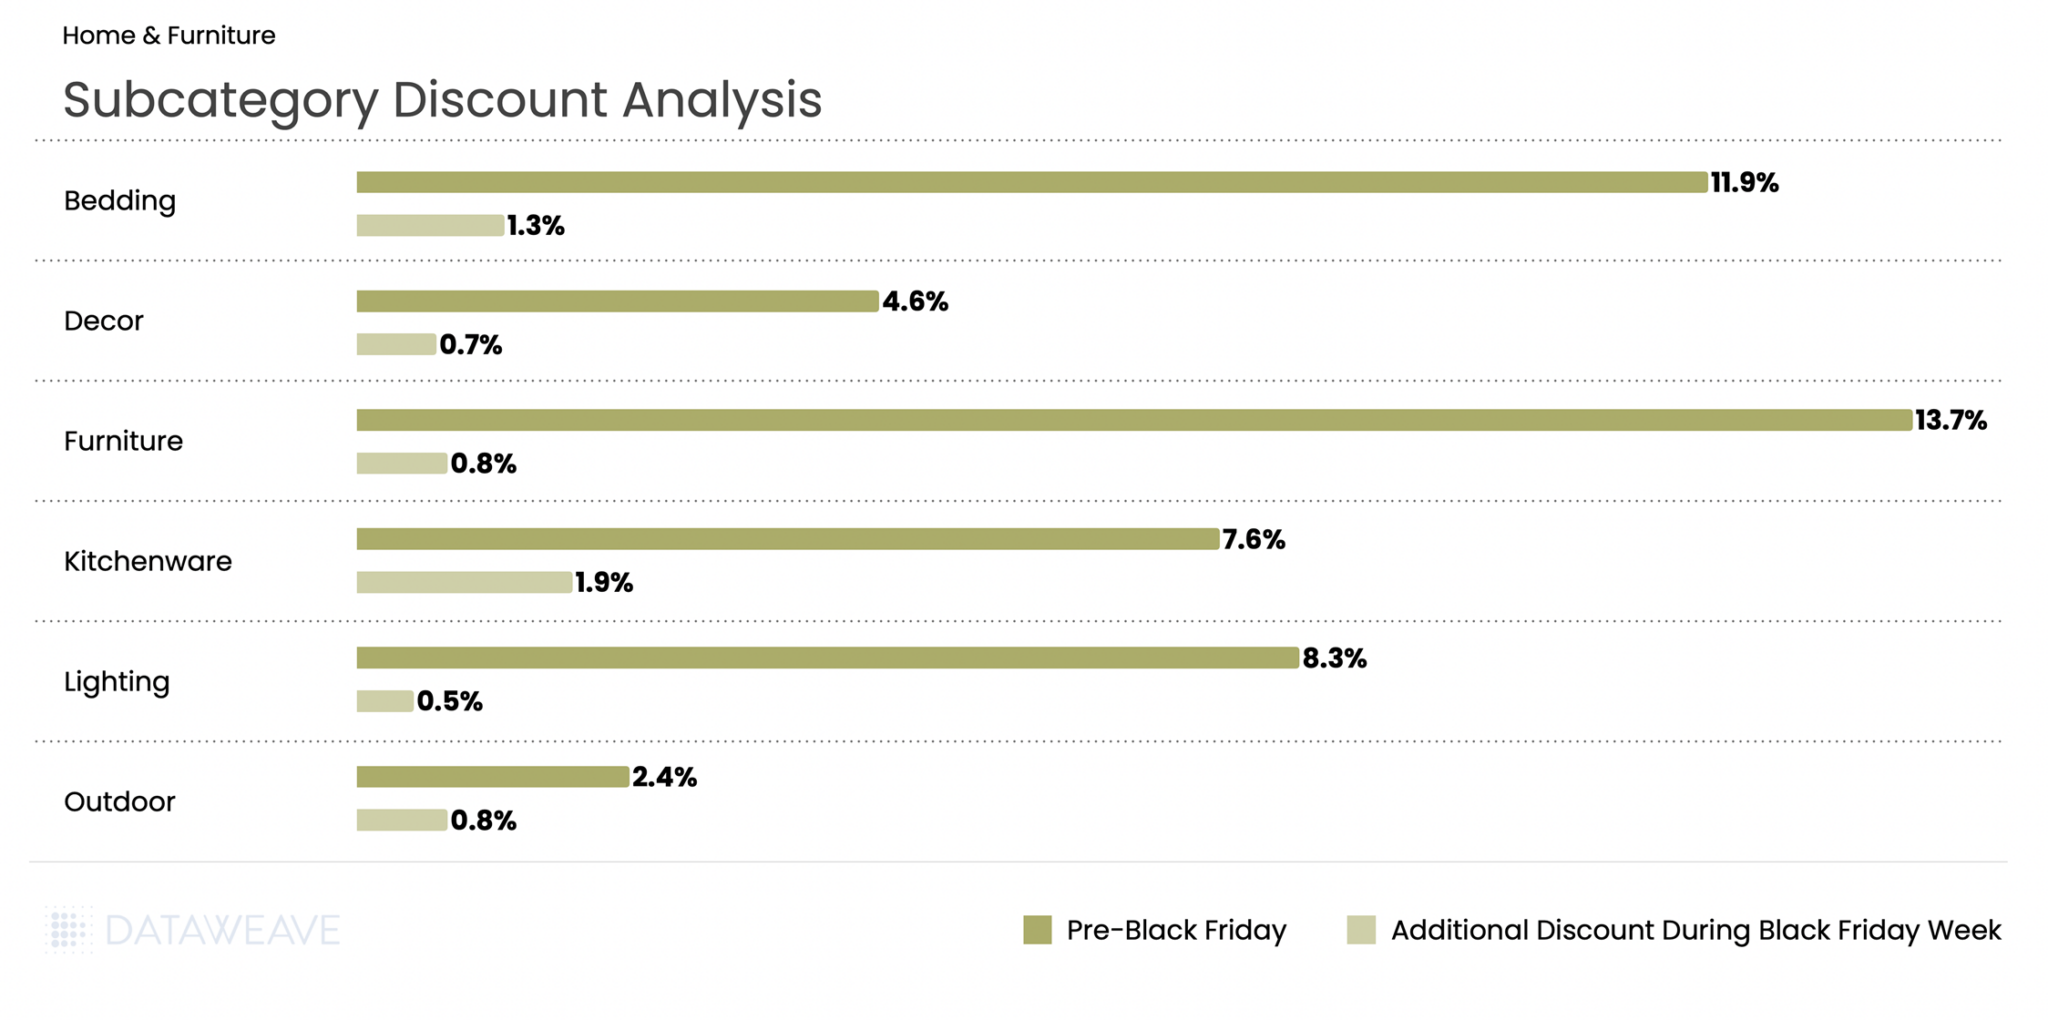
Home & Furniture saw Pre-Black Friday discounts averaging 9.1%, with Black Friday Week adding just 1% on average, the lowest additional discount among all categories. Furniture led pre-sale discounts at 13.7%, followed by Bedding at 11.9%. This suggests retailers aggressively promoted larger home goods early in the season to capture deal-seekers.
During Black Friday Week, Kitchenware saw the highest additional discount at 1.9%, making it attractive for holiday cooking and gifting needs. Conversely, Lighting saw minimal additional promotion at just 0.5%.
Share of Search: Brand Visibility Trends
Made.com, the contemporary furniture brand, saw visibility surge during Black Friday with an impressive 8.9% increase. Similarly, emerging mattress brand Vesgantti gained 5.4%. Rug specialist Gooch Oriental also made significant gains with a 4.9% increase.
On the flip side, British heritage brands faced challenges. Both Laura Ashley and Julian Bowen saw share of search drop 2.2%. Premium mattress maker Vispring also declined 2.1%, while French cookware brand Le Creuset fell 1.9%.
Health & Beauty
Health & Beauty has emerged as a growth engine during Black Friday in the UK. The beauty industry is projected to grow 5% annually through 2030 according to a McKinsey survey. The category continues to demonstrate resilience even as consumers show caution in other discretionary categories. Our analysis of 15,816 SKUs reveals fascinating subcategory-level insights and dramatic brand visibility shifts that highlight evolving consumer preferences in the beauty space.
Subcategory Discount Analysis
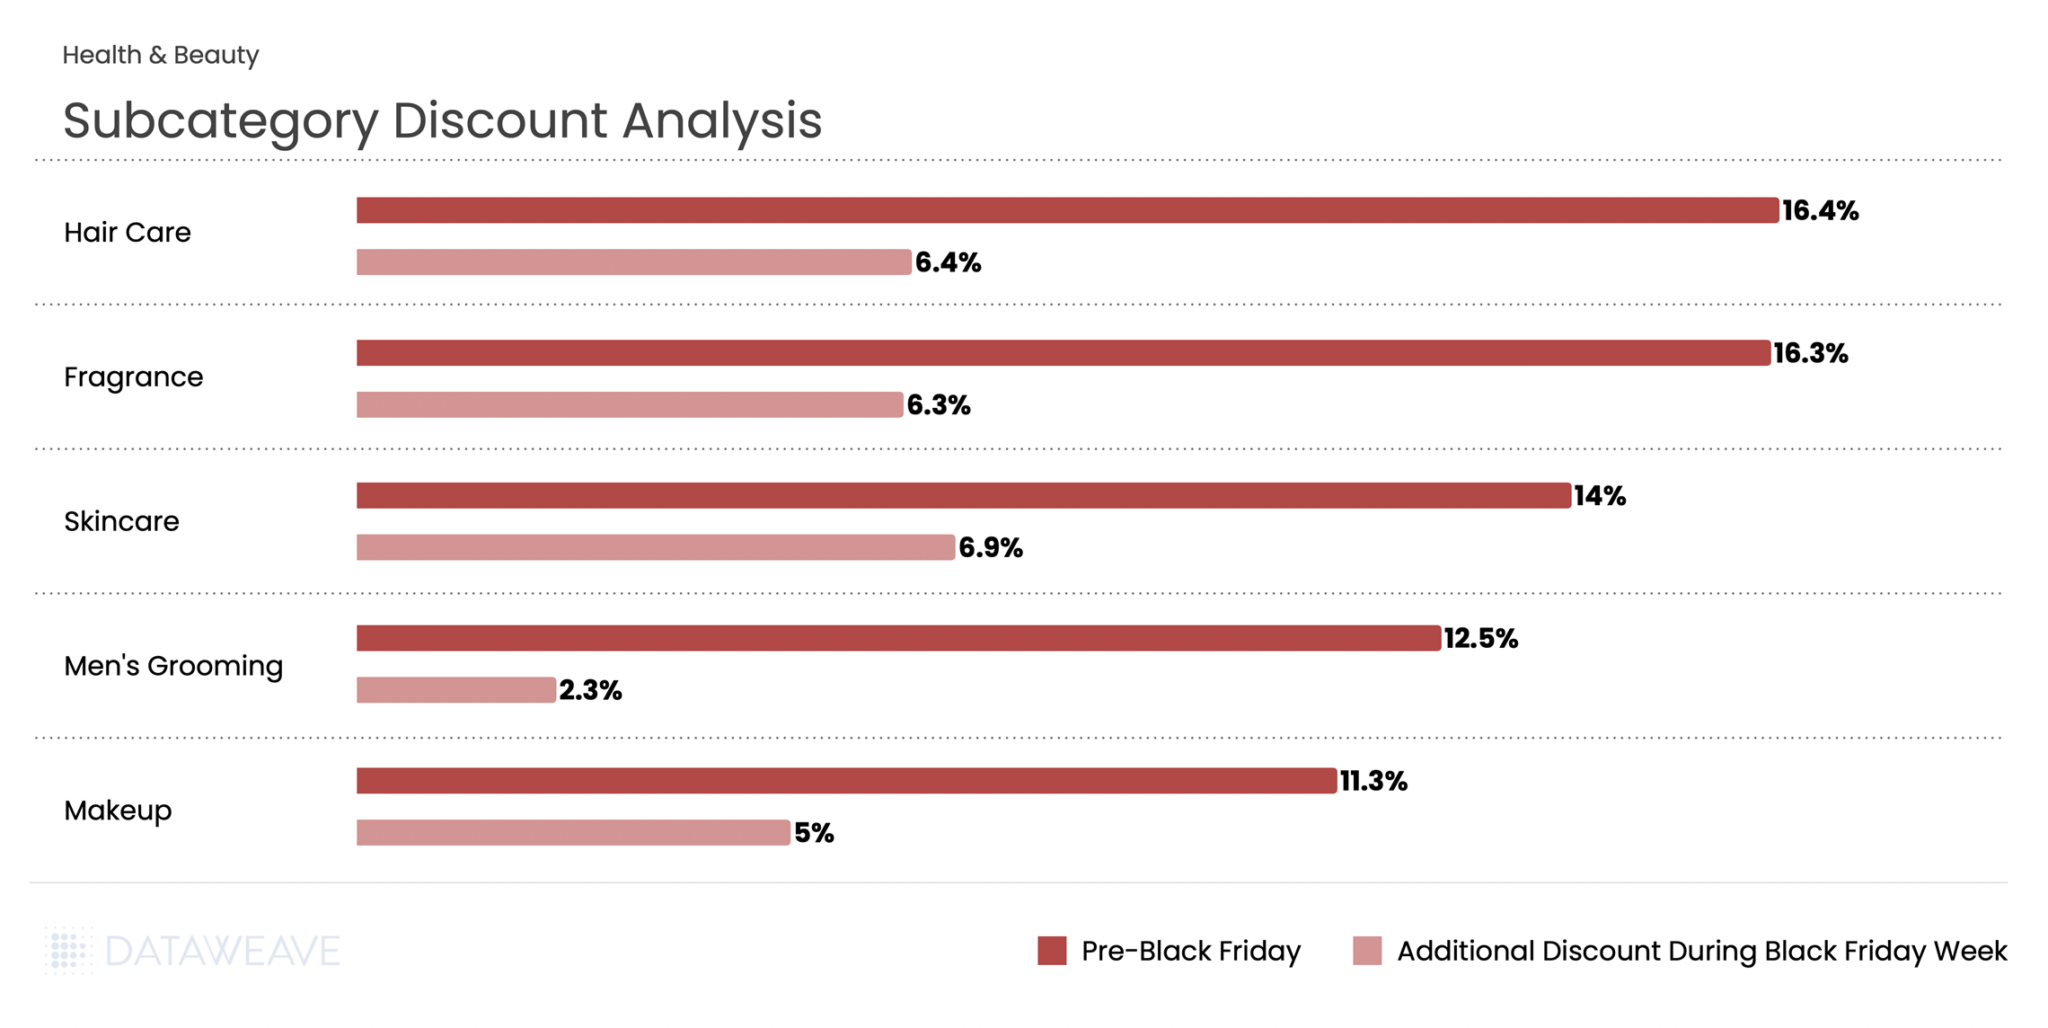
Health & Beauty presented a unique discounting pattern compared to other categories. Pre-Black Friday discounts averaged 14.4%, the second-highest among all categories. But Black Friday Week discounts were also robust at 6.1%, the highest additional discount increase.
Hair Care led both periods with 16.4% pre-sale discounts and an additional 6.4% during Black Friday Week. Skincare saw the highest Black Friday Week discount at 6.9%, suggesting retailers strategically saved their best skincare promotions for the main event when consumers are actively seeking holiday gift sets. Men’s Grooming stood apart with strong pre-sale discounts of 12.5% but more modest Black Friday Week additions of just 2.3%.
Share of Search: Brand Visibility Trends
The UK Beauty category saw some of the most dramatic Share of Search swings in our analysis.
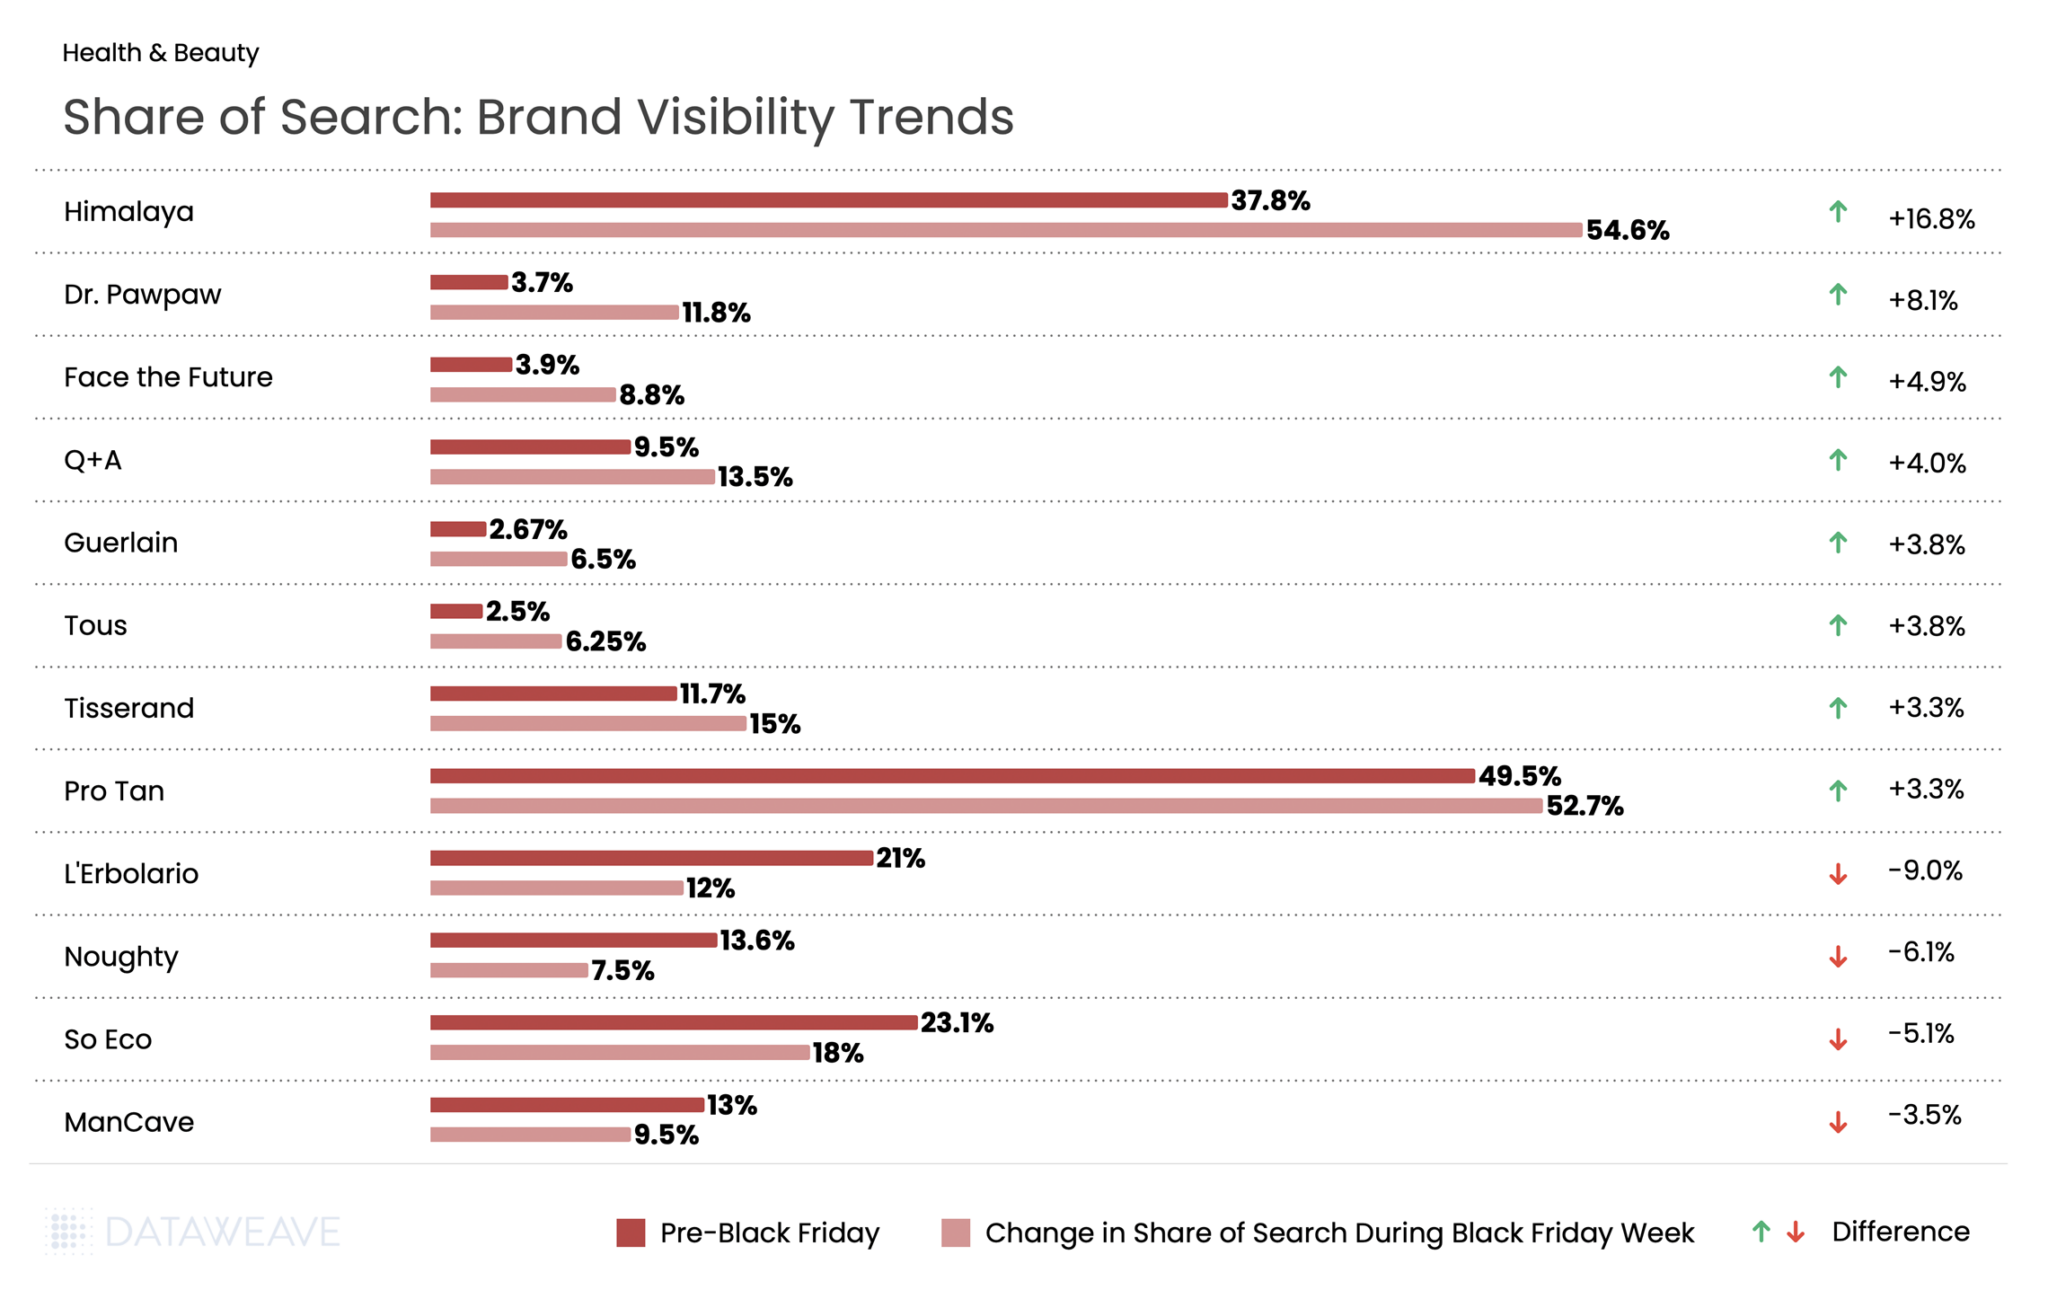
Himalaya, the Ayurvedic skincare brand, dominated the category with a stunning 16.8% gain. British cult favorite Dr. Pawpaw exploded from 3.7% to 11.8%, a gain that reflects the brand’s growing mainstream appeal. Face the Future, the skincare specialist, also gained significant ground with a 4.9% increase.
Budget-friendly British brand Q+A continued its momentum, rising 4%, while prestige names like Guerlain and Tous each gained 3.8%.
Italian natural beauty brand L’Erbolario saw the steepest decline, with visibility dropping by 9%. Haircare brand Noughty fell 6.1%, and eco-beauty brand So Eco declined by 5.1%.
Grocery
While Grocery typically sees more modest discounts compared to discretionary categories, the sector remains a critical part of Black Friday shopping in the UK, particularly as consumers prepare for holiday entertaining and gifting. Our analysis of 11,979 SKUs shows how UK retailers approached promotions across essential and indulgent subcategories.
Subcategory Discount Analysis
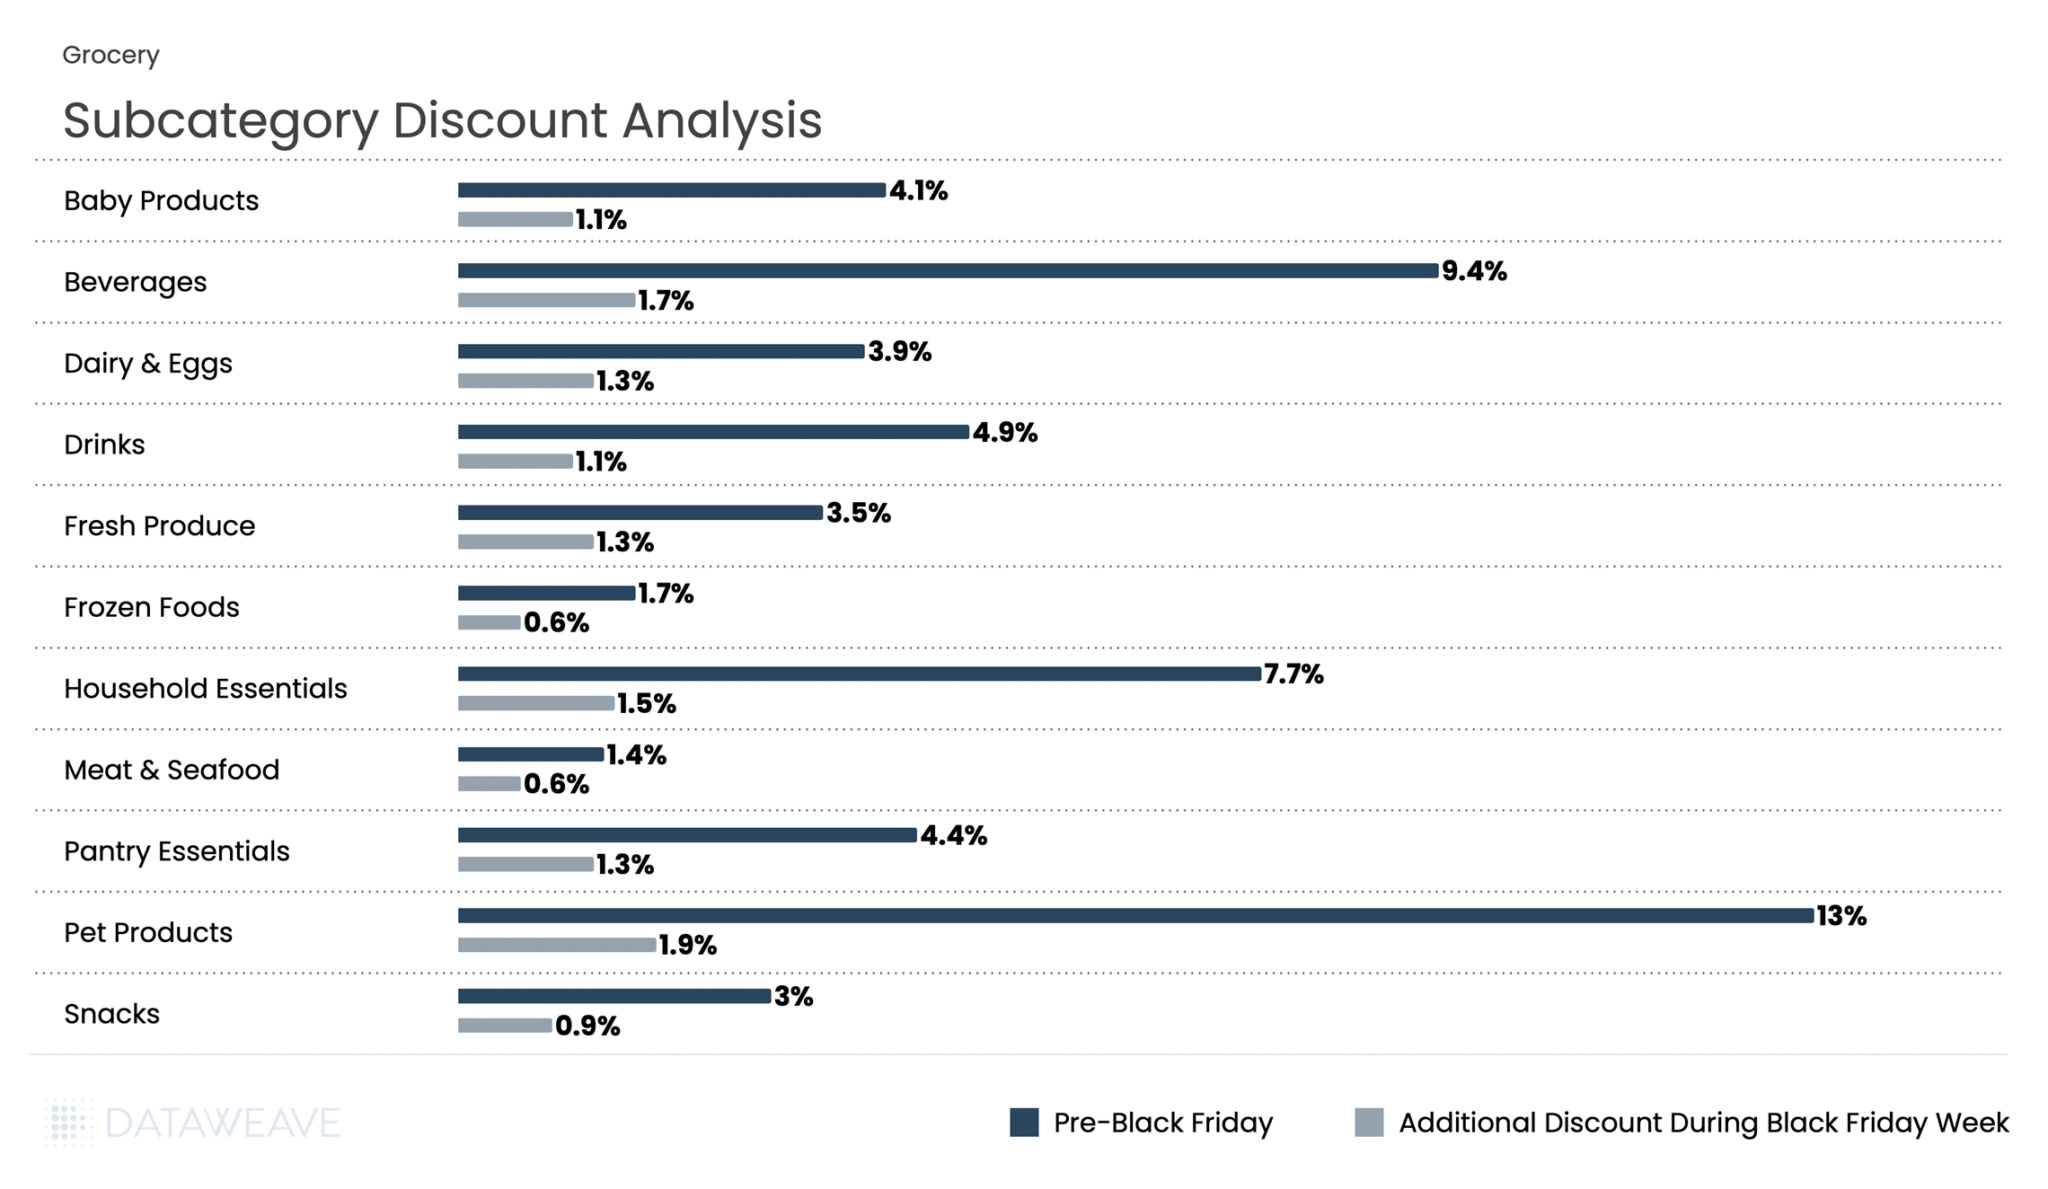
Grocery had the lowest discounts across all categories, reflecting the already-thin margins in food retail. Pre-Black Friday discounts averaged just 5.7%, with Black Friday Week adding only 1.2%. Pet Products led pre-sale discounts at an impressive 13%, significantly outpacing other grocery subcategories.
Beverages and Household Essentials followed with 9.4% and 7.7% pre-sale discounts respectively, and maintained their lead during Black Friday Week with 1.7% and 1.5% additional discounts each. Fresh categories like Meat & Seafood (1.4% pre-sale, 0.6% Black Friday Week) and Frozen Foods (1.7% pre sale, 0.6% additional discounts during Black Friday week) saw minimal promotional activity, consistent with perishable inventory constraints and tight margins.
Share of Search: Brand Visibility Trends
Doritos led with a 7.3% surge in visibility. Pepsi delivered an equally impressive performance, rising from 3.6% pre Black Friday to 10.7% during Black Friday week. Fanta too saw 5.2% gain in share of search.
Conversely, Coca-Cola gained more modestly at 1.6%, while its Sprite brand actually declined 0.9%.
Apparel
Apparel remains a Black Friday staple in the UK and is projected to deliver the strongest year-on-year growth of any UK retail segment this festive season. With clothing accounting for 39% of planned Black Friday purchases, the category represents one of the most hotly contested battlegrounds during the sales period.
Our analysis of 17,063 SKUs, the largest category in our study, reveals interesting patterns across fashion segments that demonstrate both the opportunities and competitive intensity in UK apparel retail.
Subcategory Discount Analysis
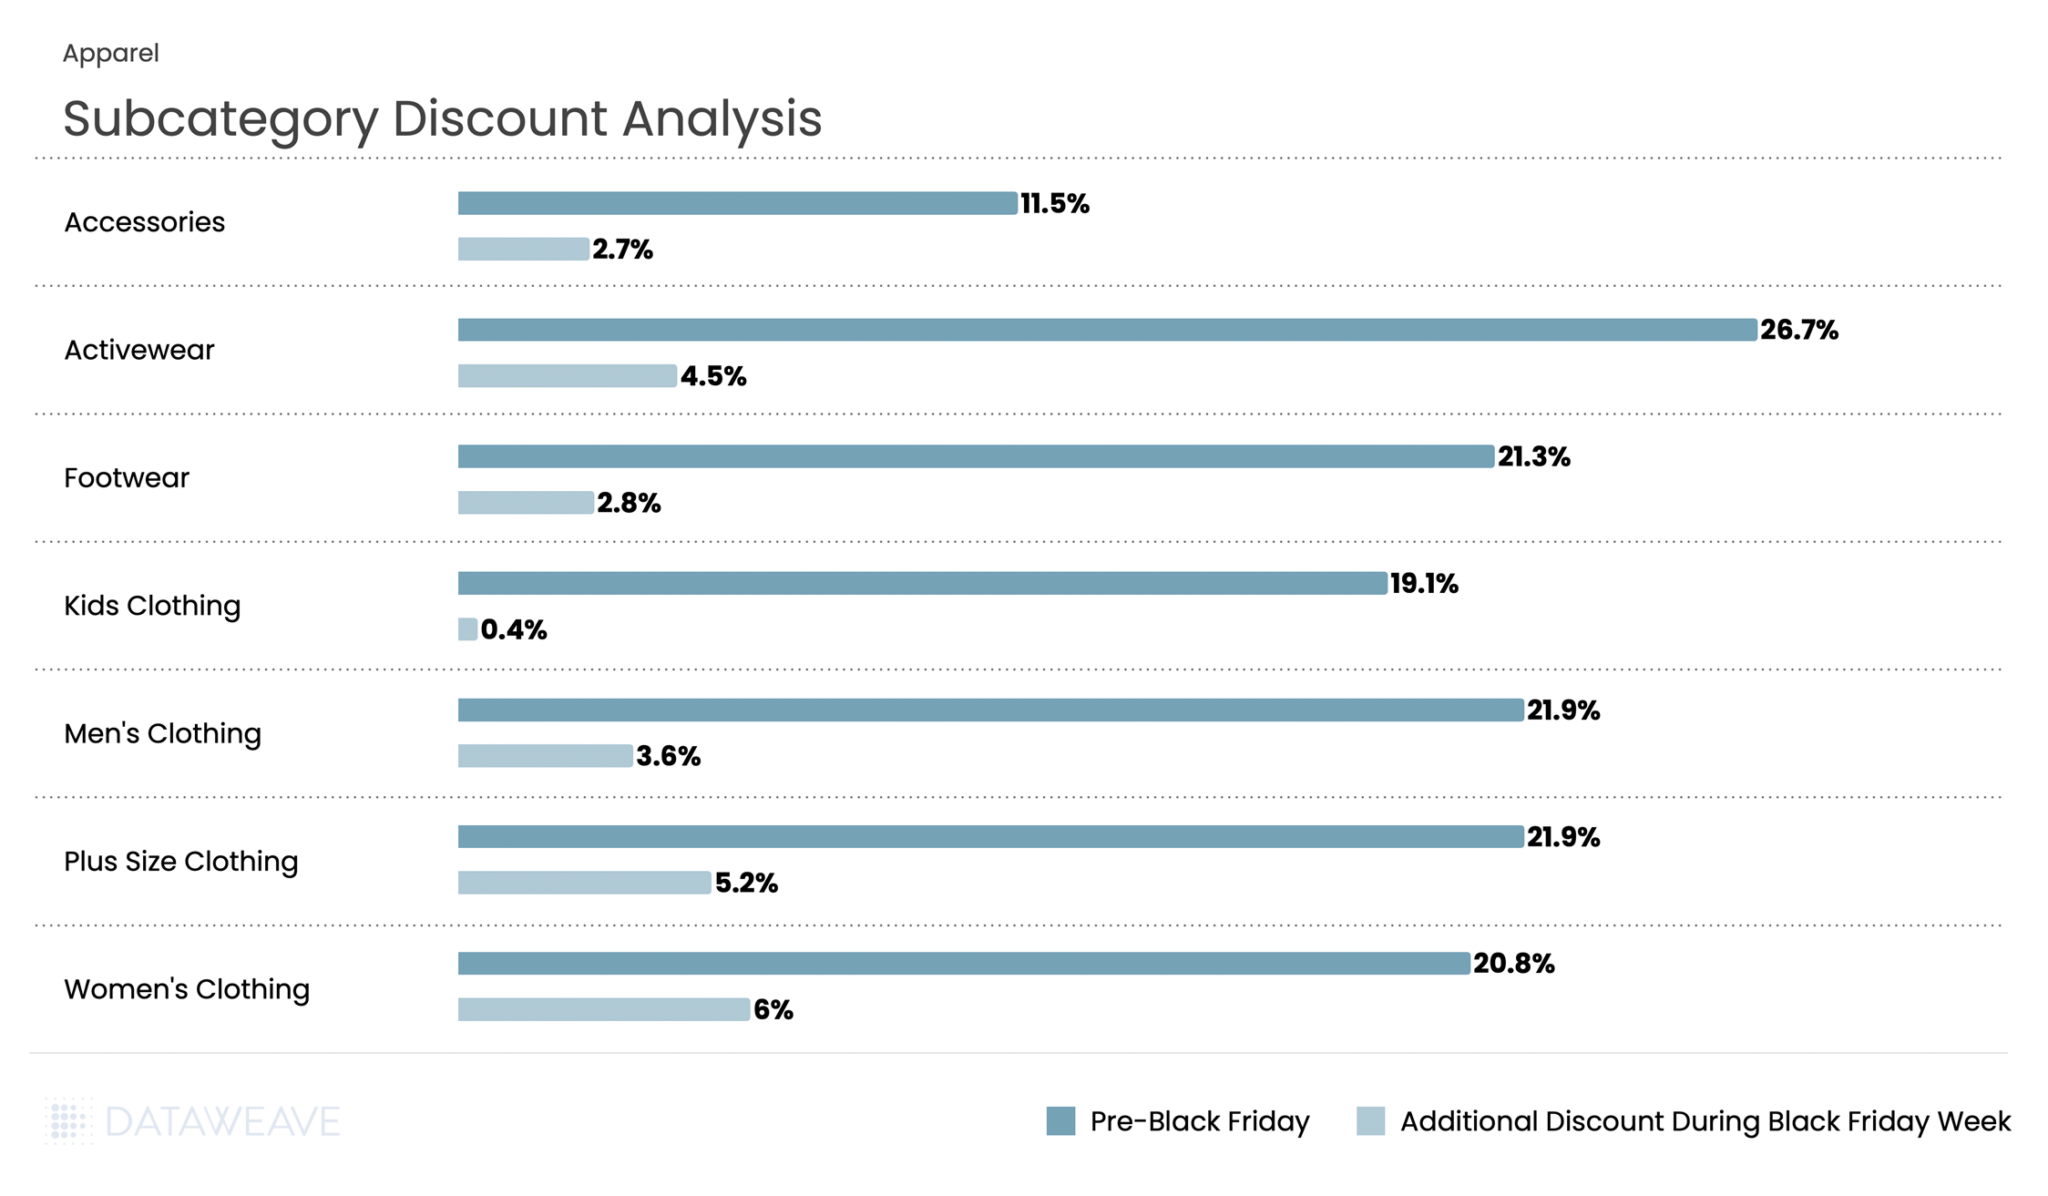
Apparel showed the strongest discounting activity throughout the BFCM period among all categories. Pre-Black Friday discounts averaged 17.2%, with Black Friday Week adding 3.5%, making it one of the most heavily promoted categories.
Activewear led pre-sale discounts at an impressive 26.7%, with an additional 4.5% discount during Black Friday week. Plus Size Clothing and Men’s Clothing tied for second place in pre-sale discounts at 21.9% each. Notably, Plus Size Clothing saw the highest Black Friday Week discount at 5.4%.
Women’s Clothing saw robust discounts throughout, with 20.8% pre-sale and an additional 6% during Black Friday Week (the highest additional discount in the category).
Share of Search: Brand Visibility Trends
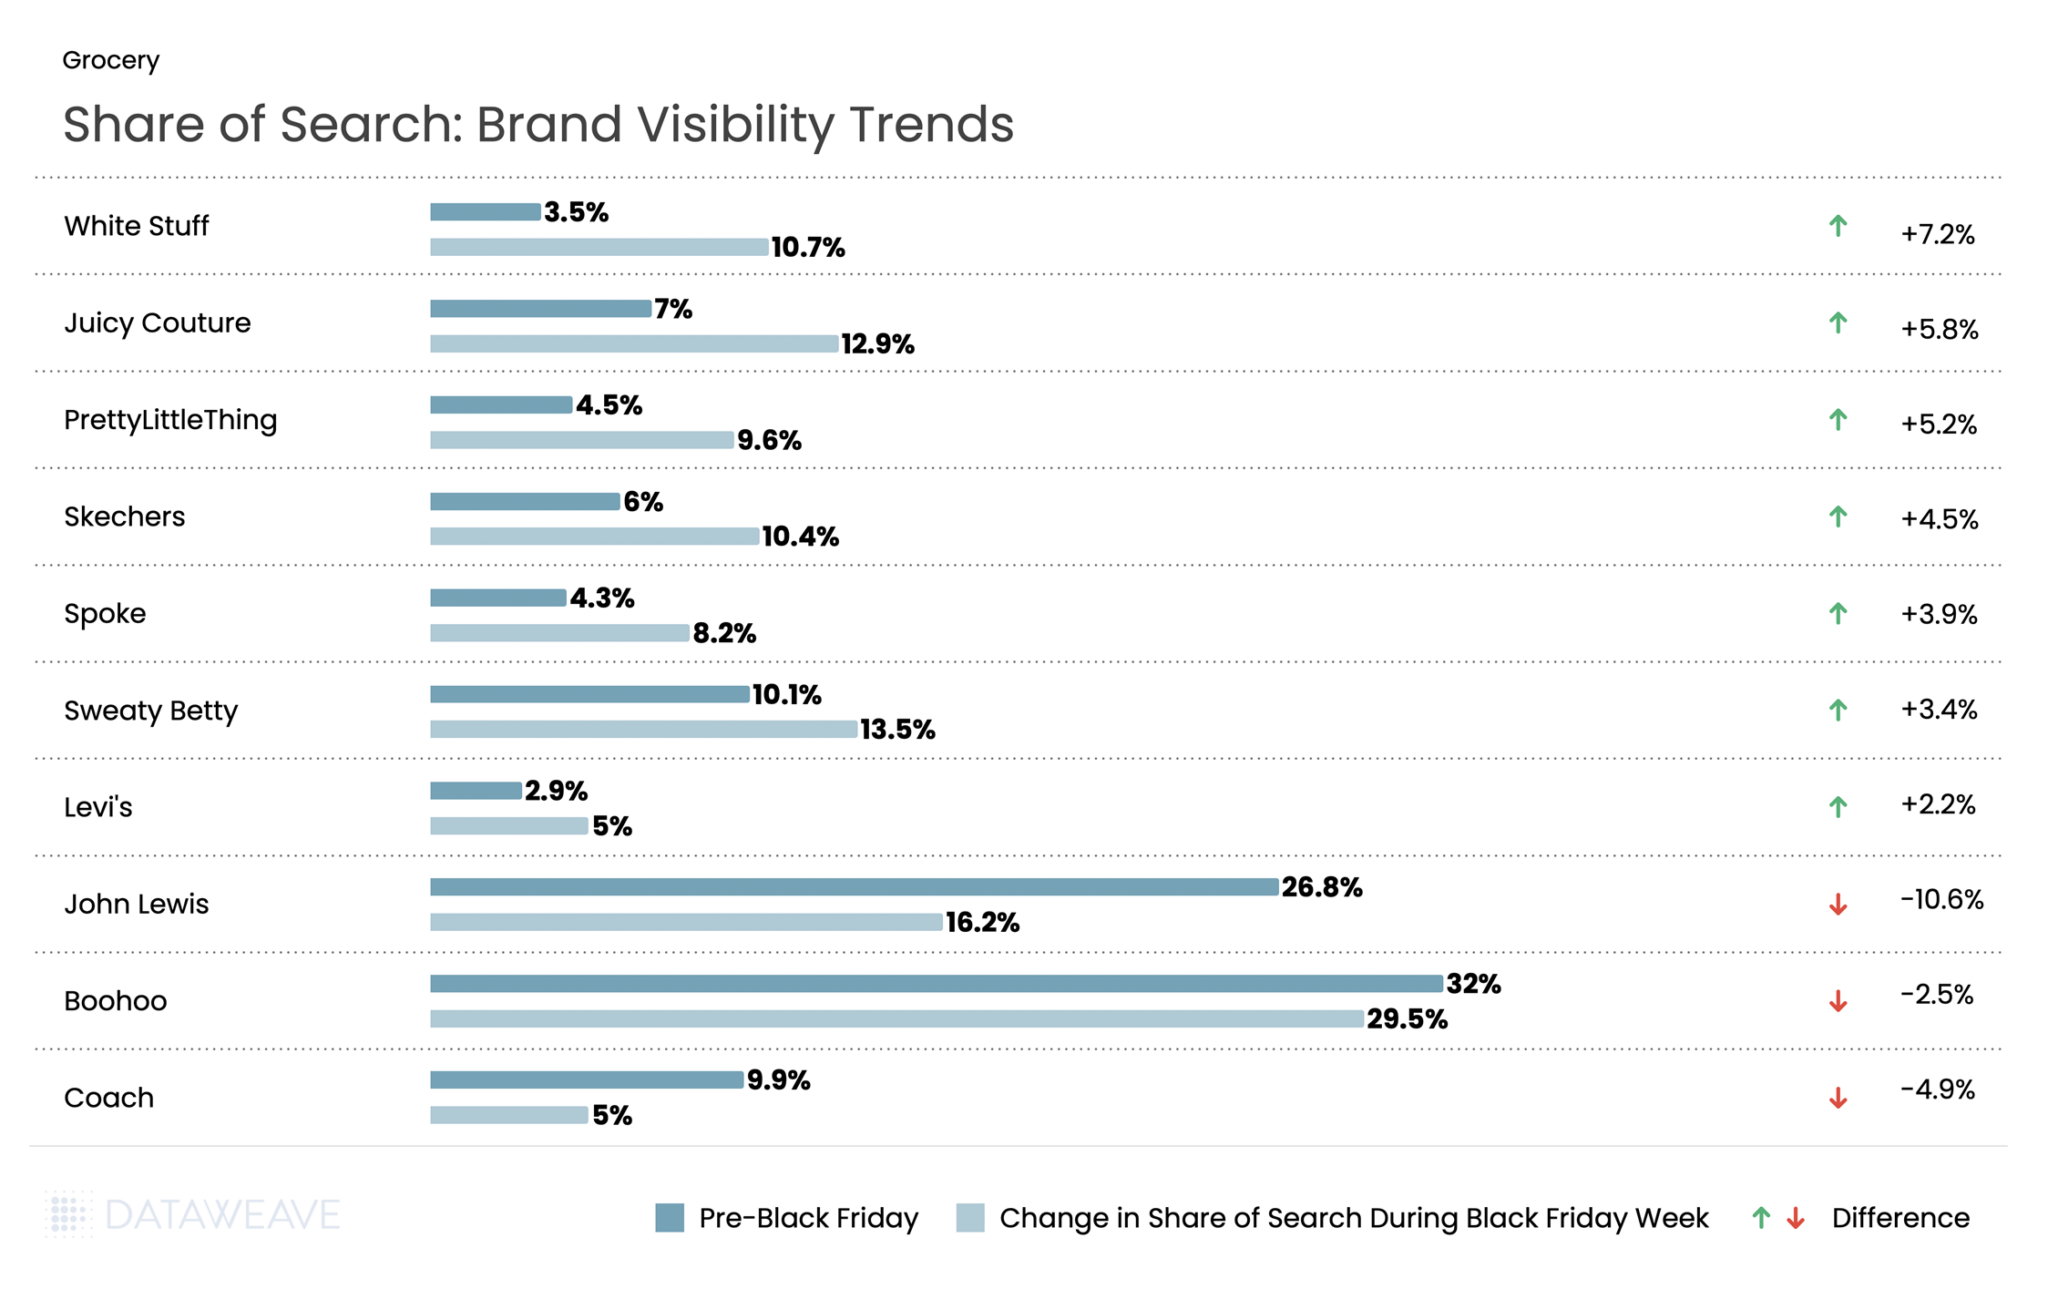
White Stuff, the British lifestyle brand, saw a 7.2% surge in visibility during Black Friday. Y2K fashion made a statement as Juicy Couture jumped 5.8 %. Fast fashion player Pretty Little Thing gained in visibility by 5.2%. Comfort brands performed strongly, with Skechers gaining 4.5% and activewear specialist Sweaty Betty rising 3.4%. Even premium denim brand Levi’s gained ground, increasing share of search by 2.2%.
However, retail giants faced significant visibility challenges. John Lewis saw the steepest decline in the Apparel category, with share of search dropping by 10.6% during Black Friday week. Fast fashion giant Boohoo declined 2.5%. Premium accessory brand Coach’s share fell 4.9%.
The data suggests UK consumers gravitated toward distinctive brands with clear identities during Black Friday, whether heritage British labels, Y2K nostalgia, or comfort-focused specialists, rather than generalist retailers or fast fashion platforms.
Want to understand how DataWeave’s pricing intelligence platform can help your business make data-driven decisions during peak sales events? Contact us to learn more about competitive insights, price intelligence, assortment analytics, content analytics, and digital shelf analytics.
Black Friday 2025 shattered records once again. U.S. consumers spent a record $11.8 billion online on Black Friday, a 9.1% increase from 2024 and the first time online sales exceeded $11 billion. The National Retail Federation (NRF) projects holiday retail sales (November-December) to grow 3.7% to 4.2% over 2024, with total holiday spending expected to surpass $1 trillion for the first time ever. Against this backdrop of robust consumer spending, how did leading retailers and brands perform across key categories this Black Friday?
At DataWeave, we conducted a detailed analysis of Black Friday 2025 pricing trends across five major categories: Consumer Electronics, Home & Furniture, Health & Beauty, Grocery, and Apparel. Our AI-powered pricing intelligence platform monitored nearly 80,000 SKUs across leading U.S. retailers like Amazon, Walmart, Target, Macy’s, Home Depot, Sephora, and more, revealing interesting patterns in how retailers and brands approached this year’s sale season.
Our Methodology
For this analysis, DataWeave monitored average discounts across leading U.S. retailers during two distinct periods:
Pre-Black Friday: Up to November 23, 2025 – capturing early holiday deals and baseline pricing
Additional Discounts During Black Friday Week: November 24 – December 1, 2025 – covering Thanksgiving week through Black Friday (November 28) and Cyber Monday (December 1)
Our sample encompassed the top-ranked products across subcategories on major retail sites. We also analyzed Share of Search data, which measures brand visibility by monitoring which brand names appear in the top 20 search results for critical keywords.
Black Friday 2025: The Big Picture
Here’s the snapshot of average discounts during the Pre-Black Friday period compared to Black Friday Week:
Key Insight: Pre-Black Friday discounts were significant across all categories. This suggests retailers front-loaded their promotions to capture early holiday shoppers, with additional discounts during Black Friday Week adding to the baseline discounts already in place.
Consumer Electronics
Consumer electronics remain one of the most anticipated categories during Black Friday and Cyber Monday. Notably, AI traffic to retail websites grew 805% year-over-year, with consumers using AI tools most frequently for video games, appliances, and electronics categories. Our analysis of 10,356 SKUs reveals how discounts varied across subcategories.
Subcategory Discount Analysis
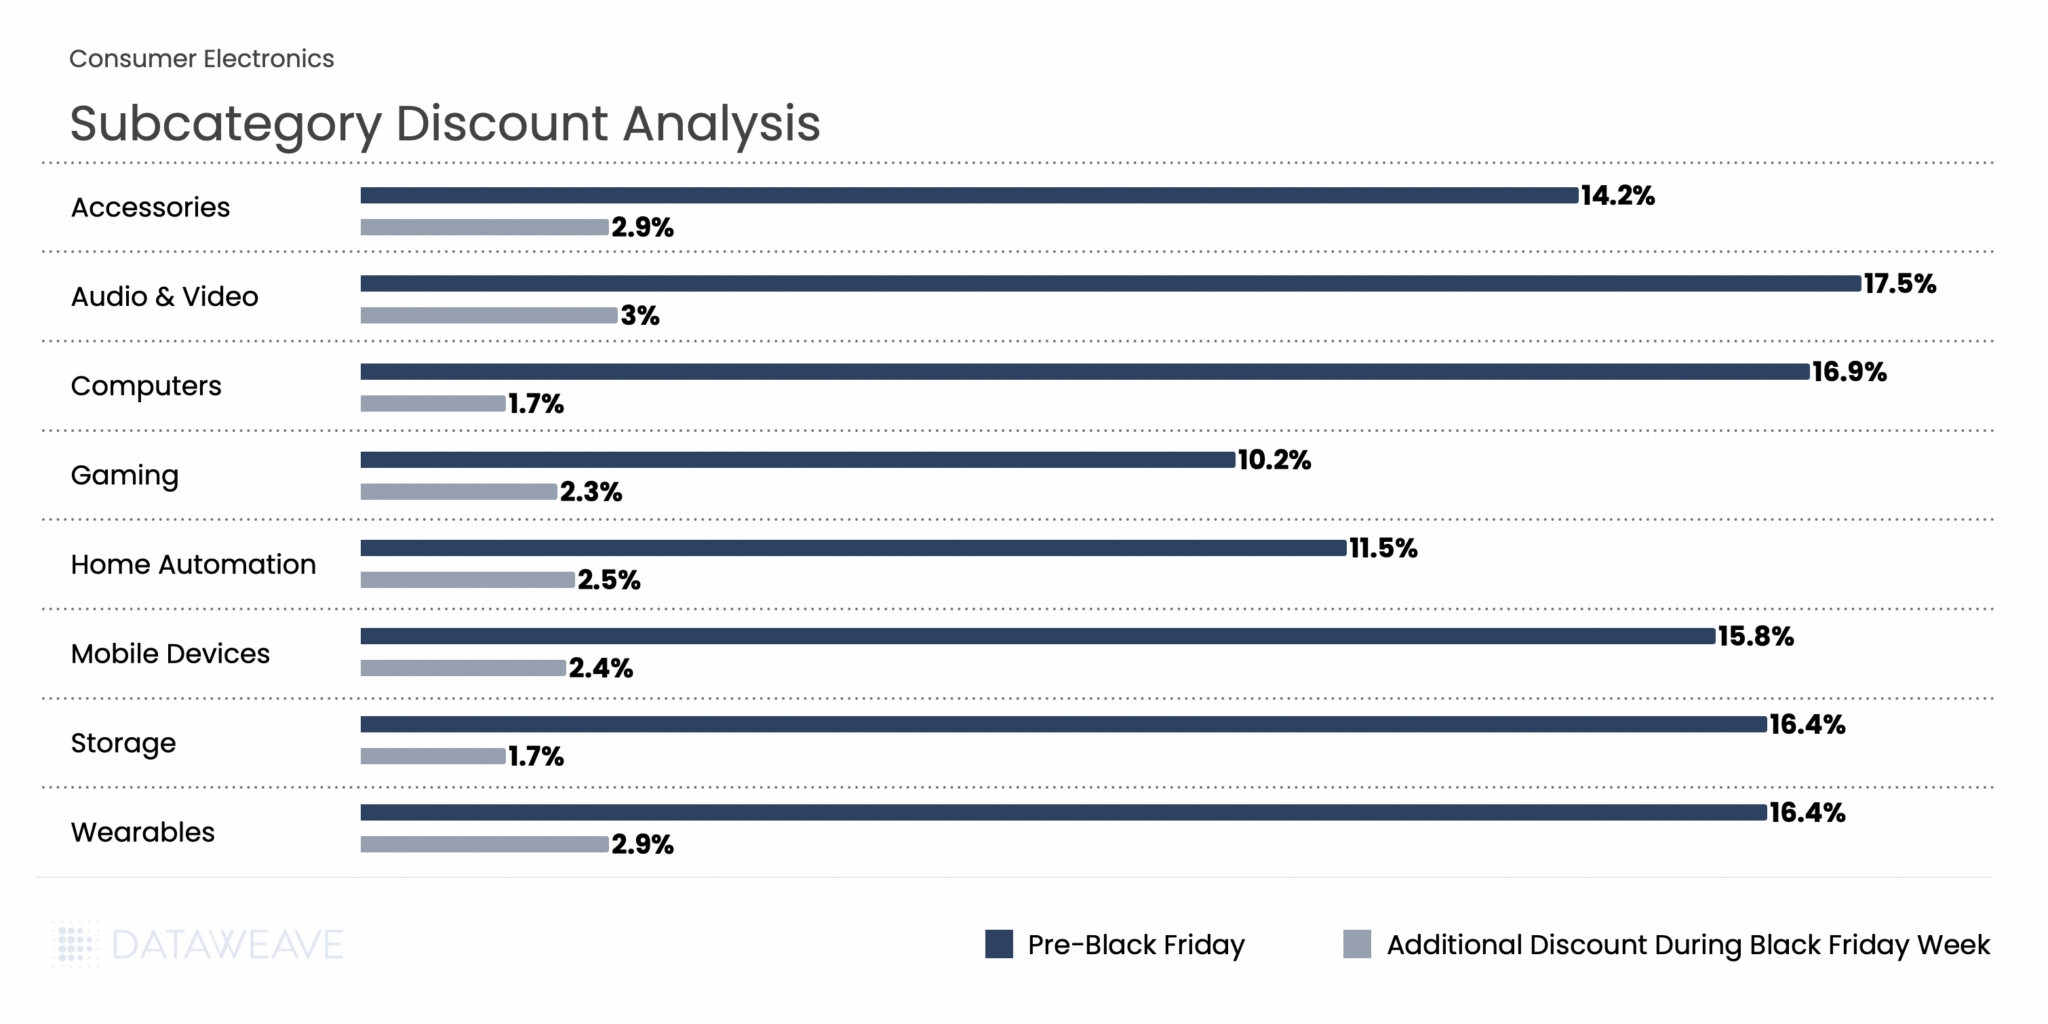
In Consumer Electronics, Pre-Black Friday discounts averaged 14.6% across subcategories, while Black Friday Week saw an additional 2.6% discount on average. Audio & Video products led the pre-sale discounting at 17.5%, indicating retailers were eager to move inventory early. During Black Friday Week, Audio & Video, Accessories, and Wearables saw the highest additional discounts (2.9-3 %), while Computers and Storage had already been heavily discounted pre-sale, leaving minimal room for further reductions during the main event.
Share of Search: Brand Visibility Trends
Our Share of Search analysis reveals significant shifts in brand visibility during Black Friday Week:
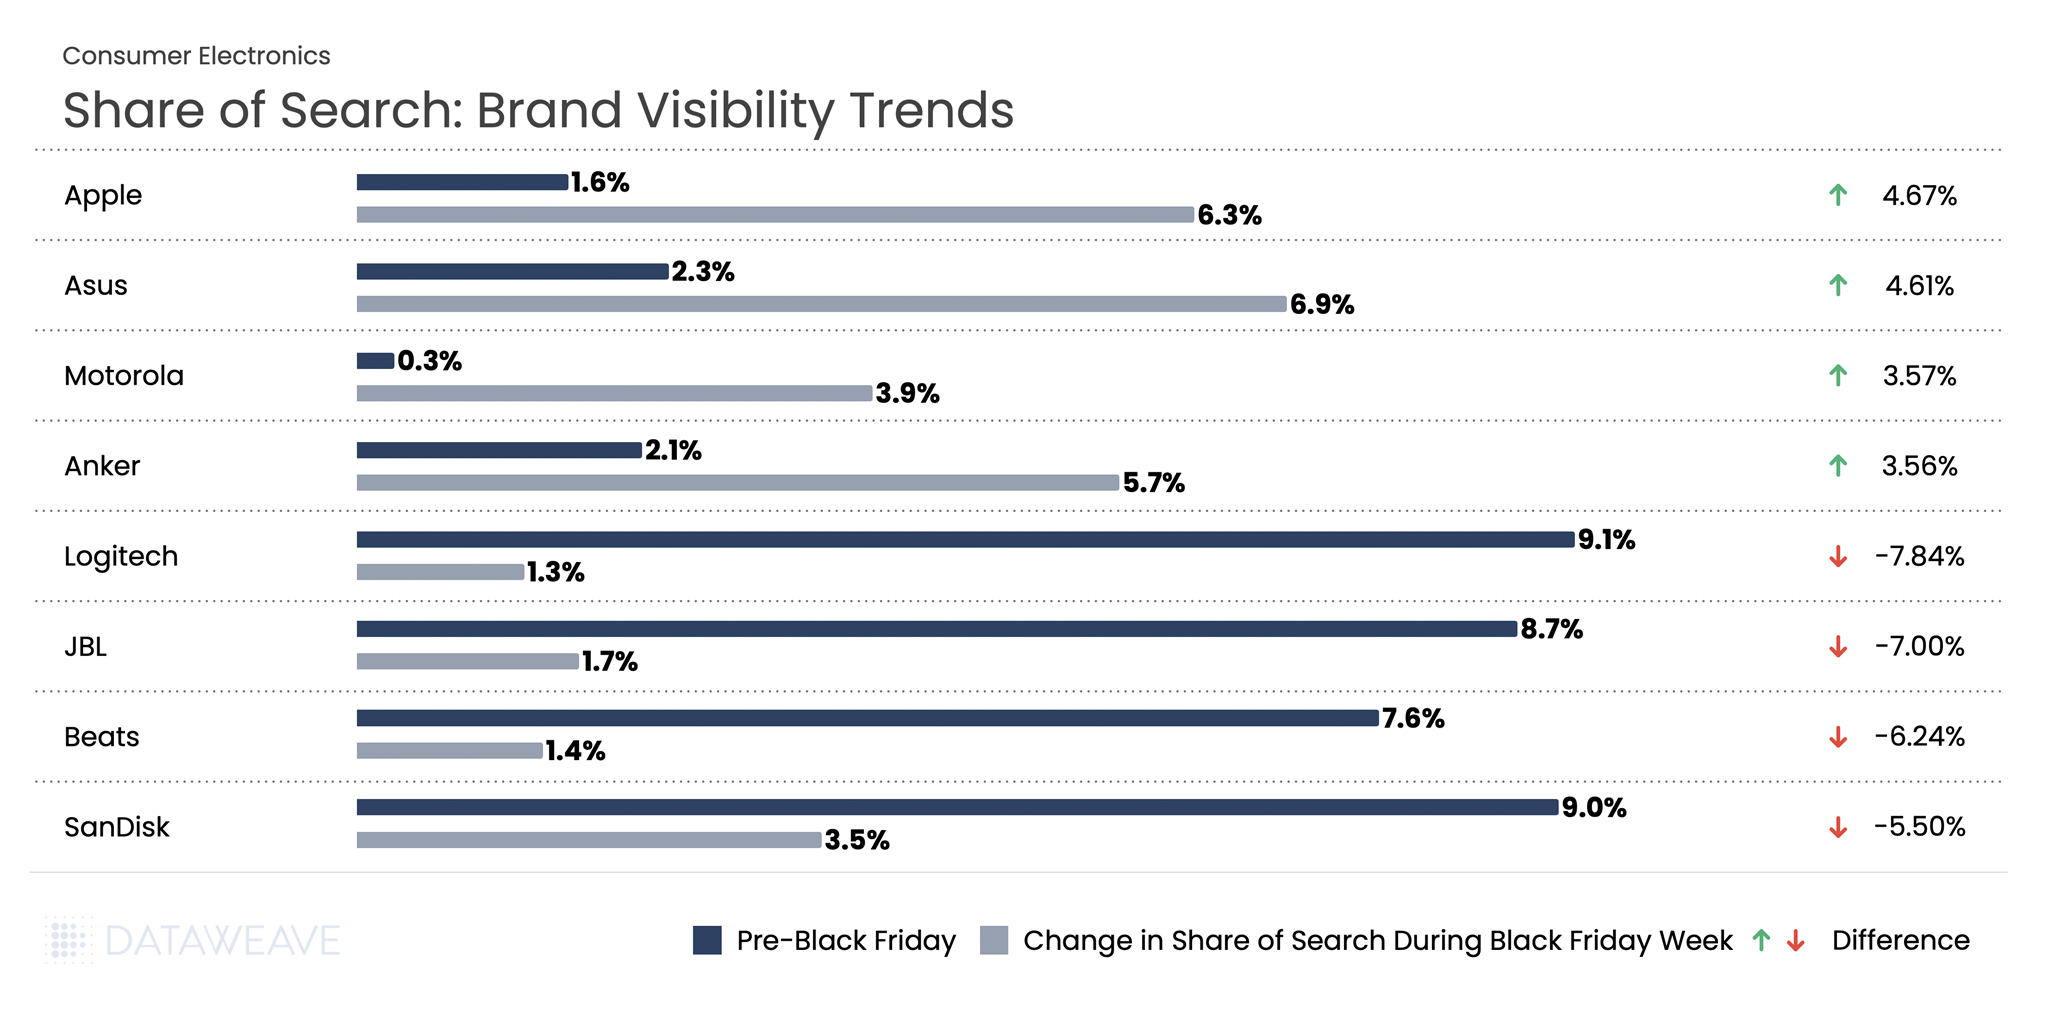
The Takeaway: Our analysis reveals significant shifts in brand visibility during Black Friday Week compared to the pre-sale period. Computing and mobile-focused brands like Apple and Asus gained substantial ground, while audio brands like Logitech, JBL, and Beats saw their visibility plummet. Apple’s Share of Search jumped from 1.58% to 6.2%, a gain of 4.6%, suggesting strong promotional activity or heightened consumer interest. Meanwhile, Logitech dropped nearly 8%, from 9.9% to just 1.2%.
Home & Furniture
The Home & Furniture category continues to be a consumer favorite during Black Friday. Our analysis of 12,610 SKUs shows how discounts were distributed across subcategories.
Subcategory Discount Analysis
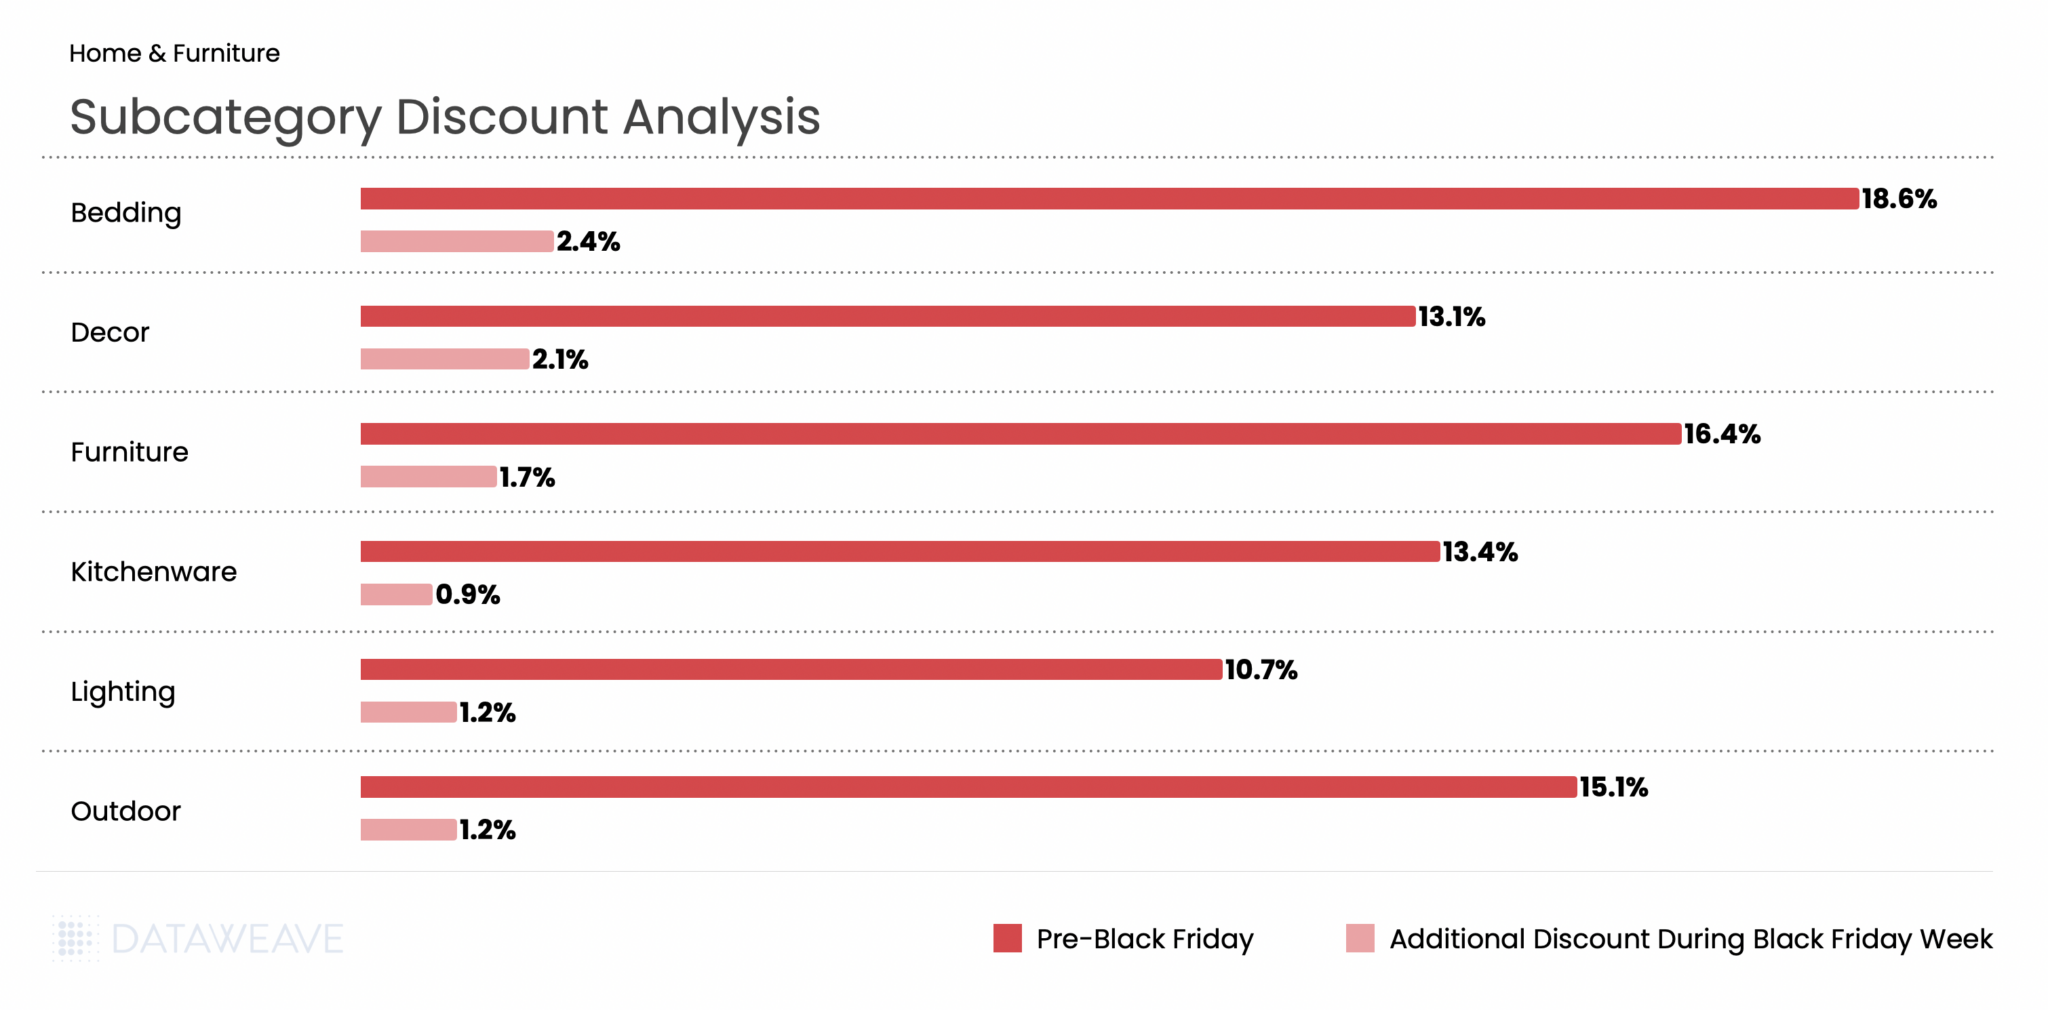
Home & Furniture saw Pre-Black Friday discounts averaging 13.9%, with Black Friday Week adding just 1.7% on average, the second-lowest additional discount among all categories. Bedding led pre-sale discounts at an impressive 18.6%, followed by Furniture at 16.4% and Outdoor at 15.1%. This suggests retailers aggressively promoted home goods early in the season to capture deal-seekers.
During Black Friday Week, Bedding maintained leadership with 2.4% additional discounts, while Kitchenware saw the smallest bump at just 0.9%, indicating early promotions had already captured most of the discount opportunity.
Share of Search: Brand Visibility Trends
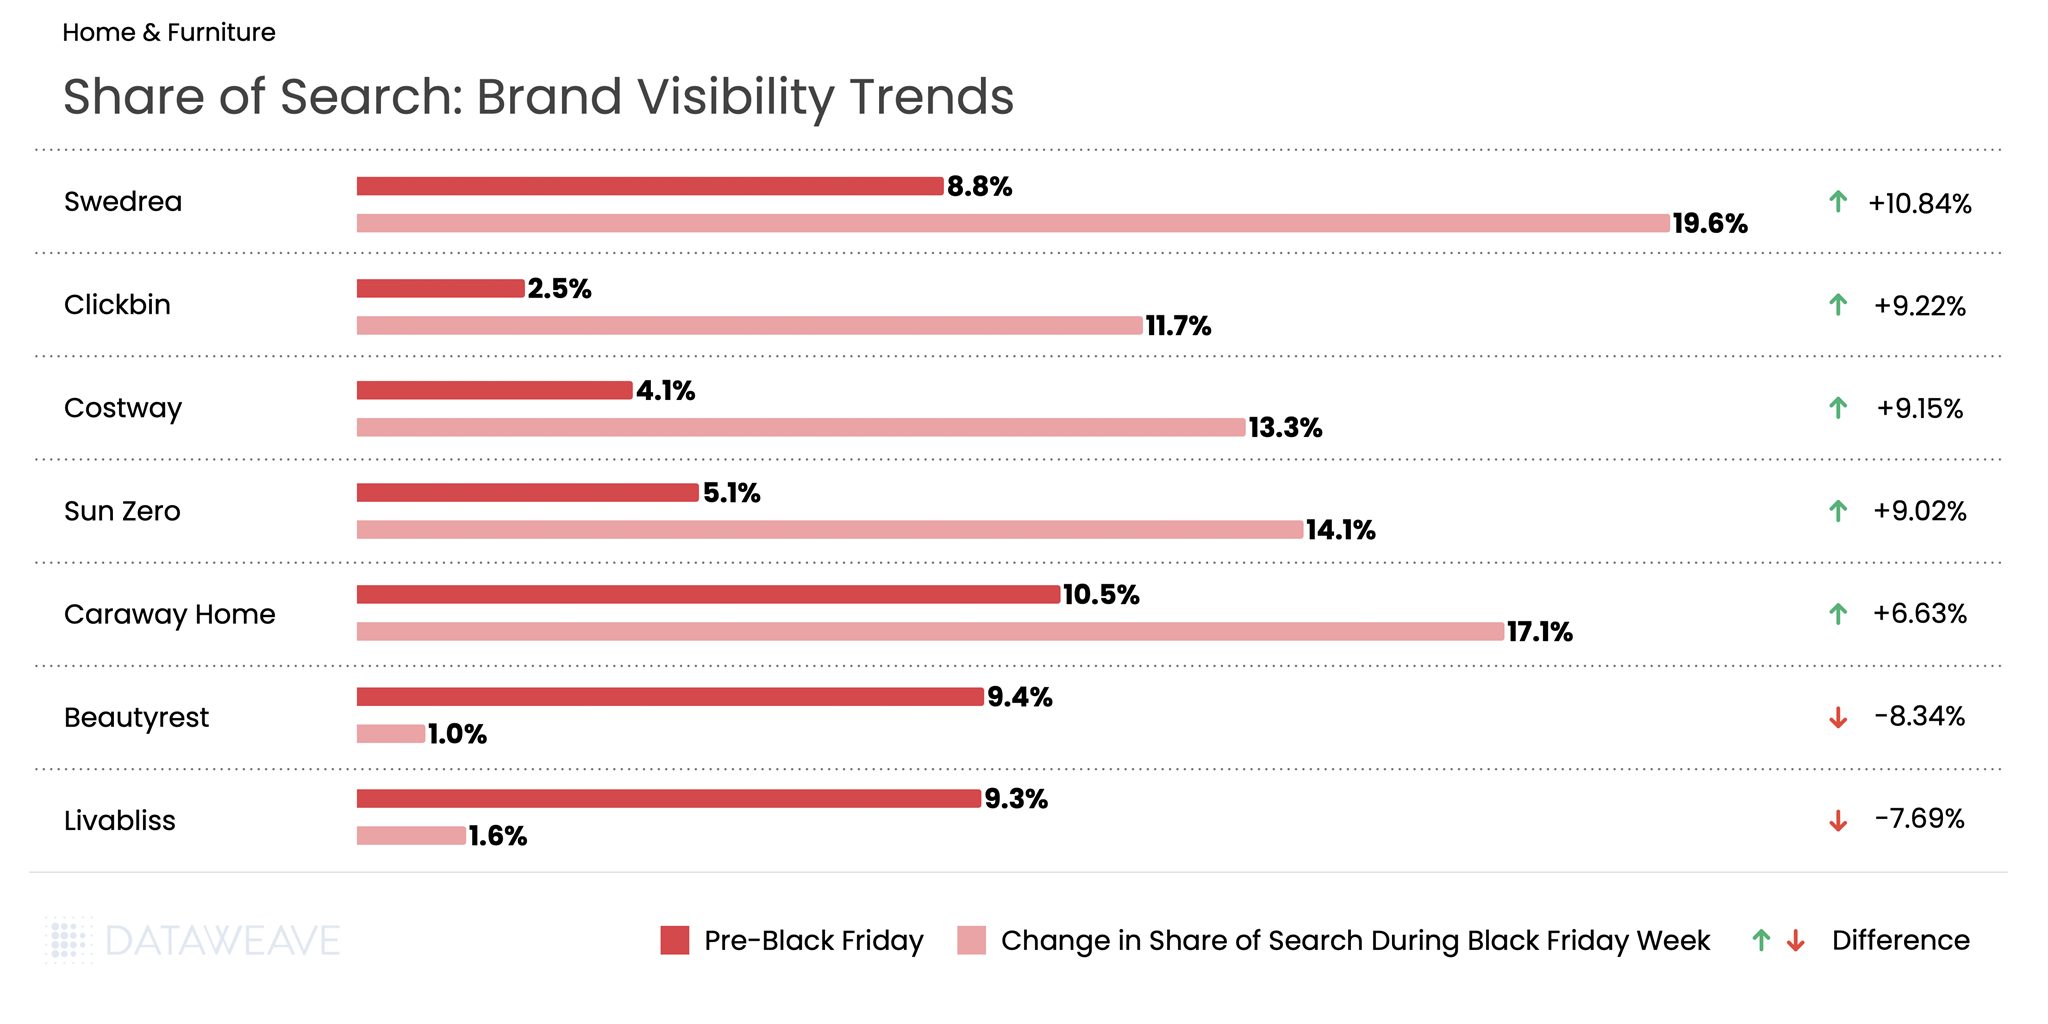
The Takeaway: The Home & Furniture category saw some of the most dramatic Share of Search swings in our entire analysis. Emerging and value-oriented brands dominated the gains, with Swedrea surging from 8.7% to 19.6%, a remarkable 10.8% increase. Similarly, Clickbin and Costway each gained over 9%. On the flip side, established premium brands like Beautyrest and Livabliss saw sharp visibility declines, dropping over 7-8%.
Health & Beauty
Health & Beauty has emerged as a growth engine during Black Friday. The beauty industry is projected to grow 5% annually through 2030 according to a McKinsey survey. Our analysis of 16,141 SKUs reveals subcategory-level insights.
Subcategory Discount Analysis
Notable finding: Health & Beauty presented a unique discounting pattern compared to other categories. Pre-Black Friday discounts averaged just 7.1%, the second-lowest among all categories. But Black Friday Week discounts were relatively strong at 4.8%. This indicates the Beauty category held back more discounts for the main event.
Notably, Hair Care was the only subcategory across our entire analysis where Black Friday Week discounts (6%) exceeded Pre-Black Friday discounts (4.6%), suggesting retailers strategically saved their best hair care promotions for the big weekend. Fragrance led pre-sale discounts at 13%, making it an attractive early shopping category.
Share of Search: Brand Visibility Trends
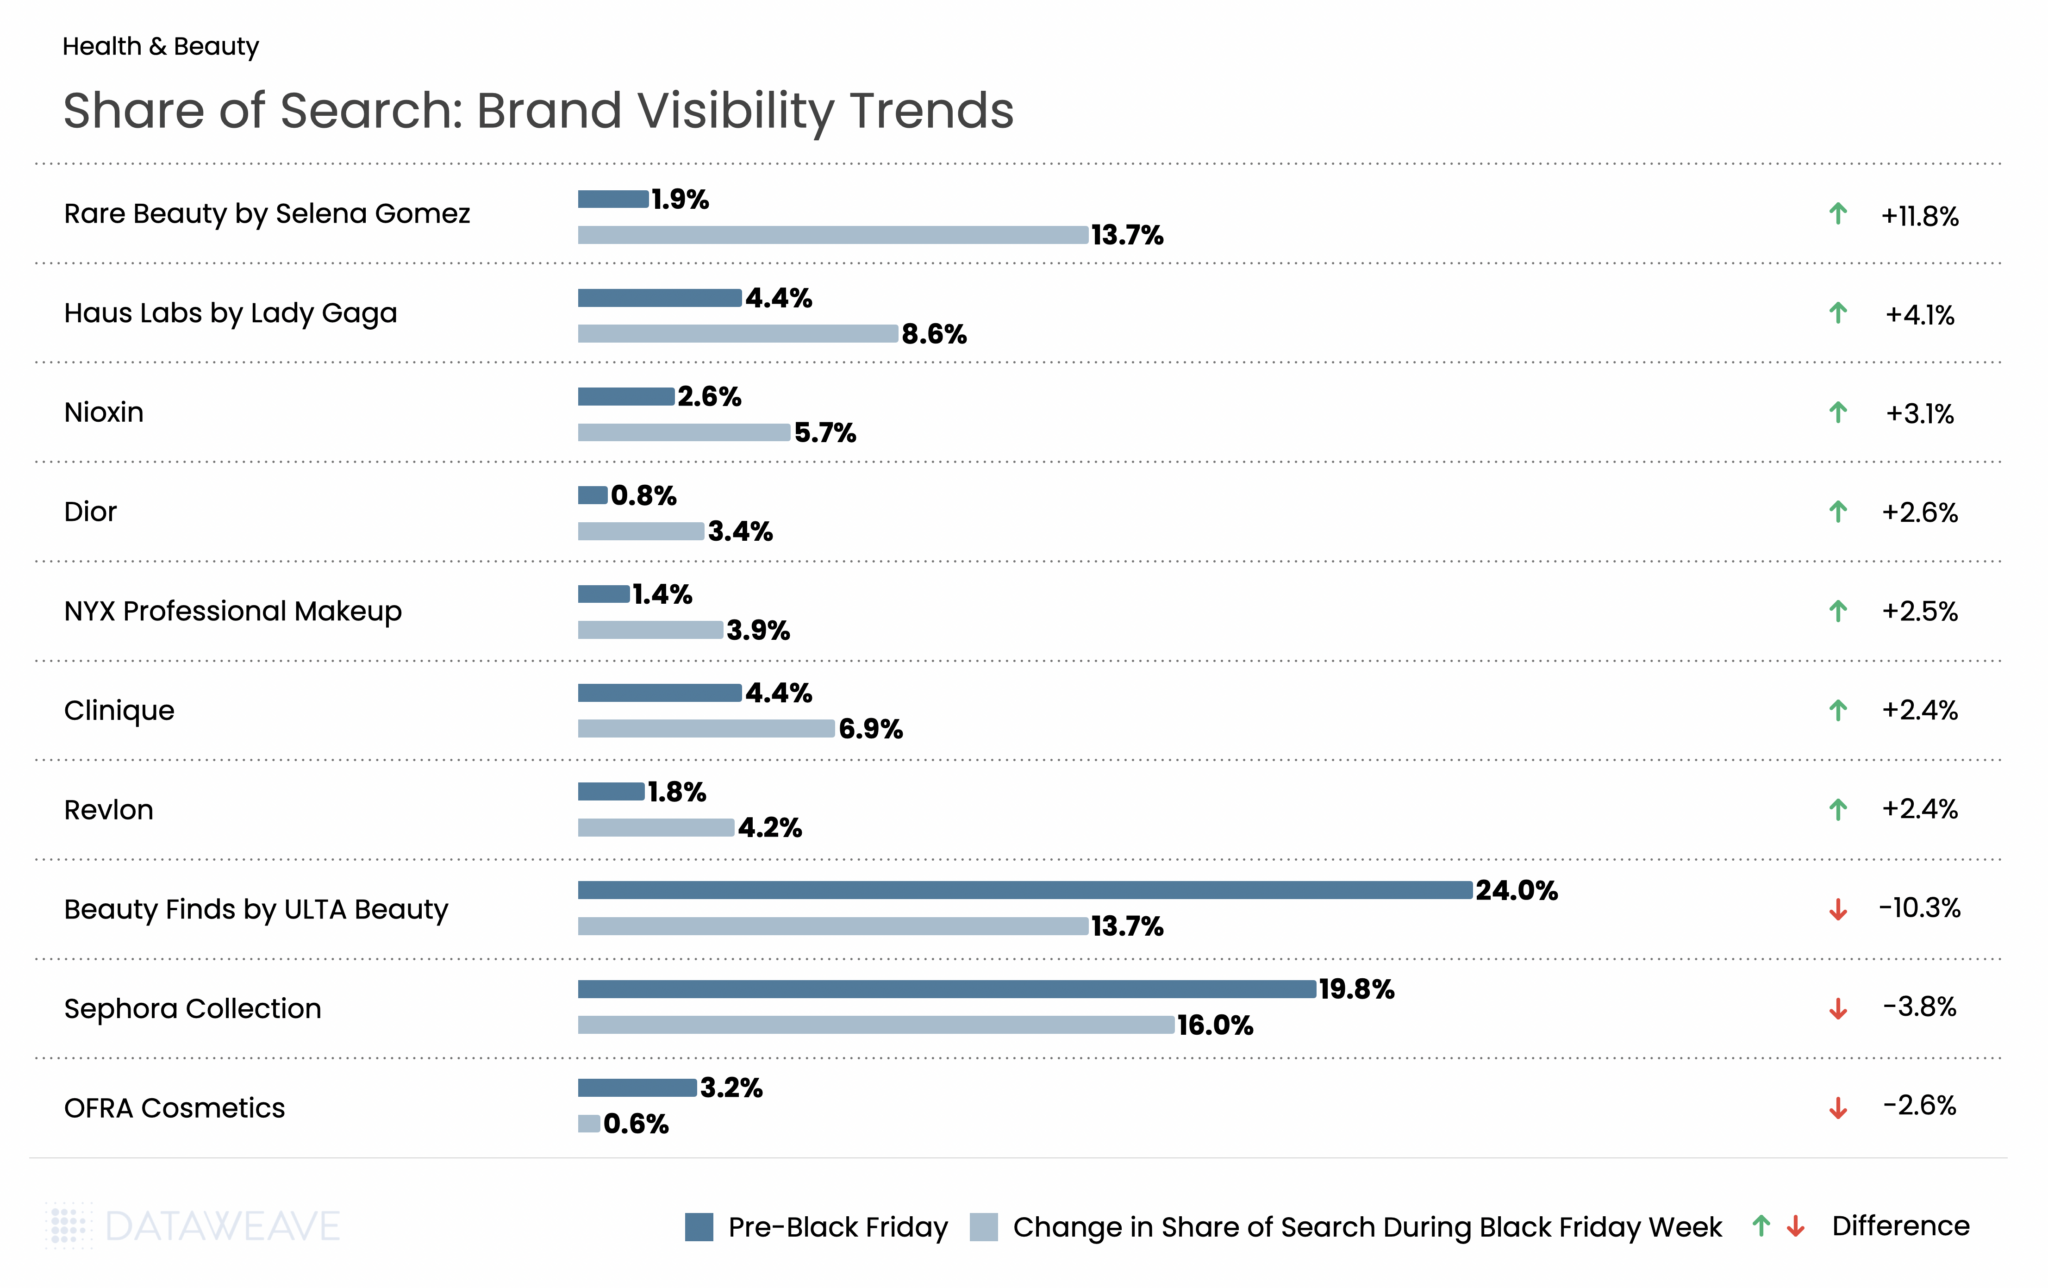
Health & Beauty saw some of the most dramatic Share of Search swings in our analysis, driven largely by celebrity-backed brands. Rare Beauty by Selena Gomez exploded from just 1.9% to 13.7%, a whopping 11.8% gain that made it the biggest winner across all categories. Haus Labs by Lady Gaga also surged (+4.1%), while prestige brands like Dior (+2.6%) and Clinique (+2.4%) gained ground.
The flip side? Retailer private labels took a hit: Beauty Finds by ULTA Beauty collapsed from 24% to 13.7% (-10.3%), and Sephora Collection dropped from 19.8% to 16.0% (-3.8%).
Key Takeaway: The Beauty category tells a compelling story about the power of celebrity brands during Black Friday. The Share of Search shifts appear to reflect how retailers and brands recalibrated their promotional focus for Black Friday. Celebrity-driven lines rose sharply in visibility, suggesting stronger placement, promotion, or search prioritization during the sale period. At the same time, private-label ranges from ULTA and Sephora lost ground, indicating a pivot away from house-brand visibility in favor of more spotlighted national and prestige brands throughout the event.
Grocery
While Grocery typically sees more modest discounts compared to discretionary categories, the sector remains a critical part of Thanksgiving weekend shopping. According to the National Retail Federation, grocery stores and supermarkets ranked as the third most popular shopping destination during Thanksgiving weekend, with 40% of consumers making purchases there. Our analysis of 18,823 SKUs shows how retailers approached promotions across essential and indulgent subcategories.
Subcategory Discount Analysis
Grocery had the lowest discounts across all categories, reflecting the already-thin margins in food retail. Pre-Black Friday discounts averaged just 5.2%, with Black Friday Week adding only 1.5%. Household Essentials and Beverages led pre-sale discounts at 6.9% and 6.7% respectively, and maintained their lead during Black Friday Week with 2.2% additional discounts each. Fresh categories like Meat & Seafood (1.4% pre-sale, 1% Black Friday Week) and Frozen Foods (3.3%, 1%) saw minimal promotional activity, consistent with perishable inventory constraints and tight margins.
Key Takeaway: Grocery discounting remains conservative, with shelf-stable and household items seeing the most promotional activity. The Beverages and Household Essentials subcategories, which have longer shelf life and higher margins, were the primary battleground for grocery promotions during BFCM 2025.
Share of Search: Brand Visibility Trends
The Grocery category saw some surprising Share of Search swings during Black Friday Week. Most notably, there was a dramatic divergence between beverage giants: Sprite surged from 1.7% to 6.8% (+5.1%), while Coca-Cola collapsed from 6% to just 0.1% (-5.9%). This stark contrast suggests vastly different promotional strategies or algorithmic visibility changes between the two brands. Private label 365 by Whole Foods Market continued its steady rise, gaining 3%, reflecting ongoing consumer interest in store brands as shoppers seek value.
The Sprite vs. Coca-Cola divergence is one of the most striking findings in our analysis. Additionally, brands like Amy’s (organic/natural foods) and McCormick (spices/seasonings) gained significant visibility.
Apparel
Apparel remains a Black Friday staple and performed strongly this year. Our analysis of 21,749 SKUs (the largest category in our study) reveals interesting patterns.
Subcategory Discount Analysis
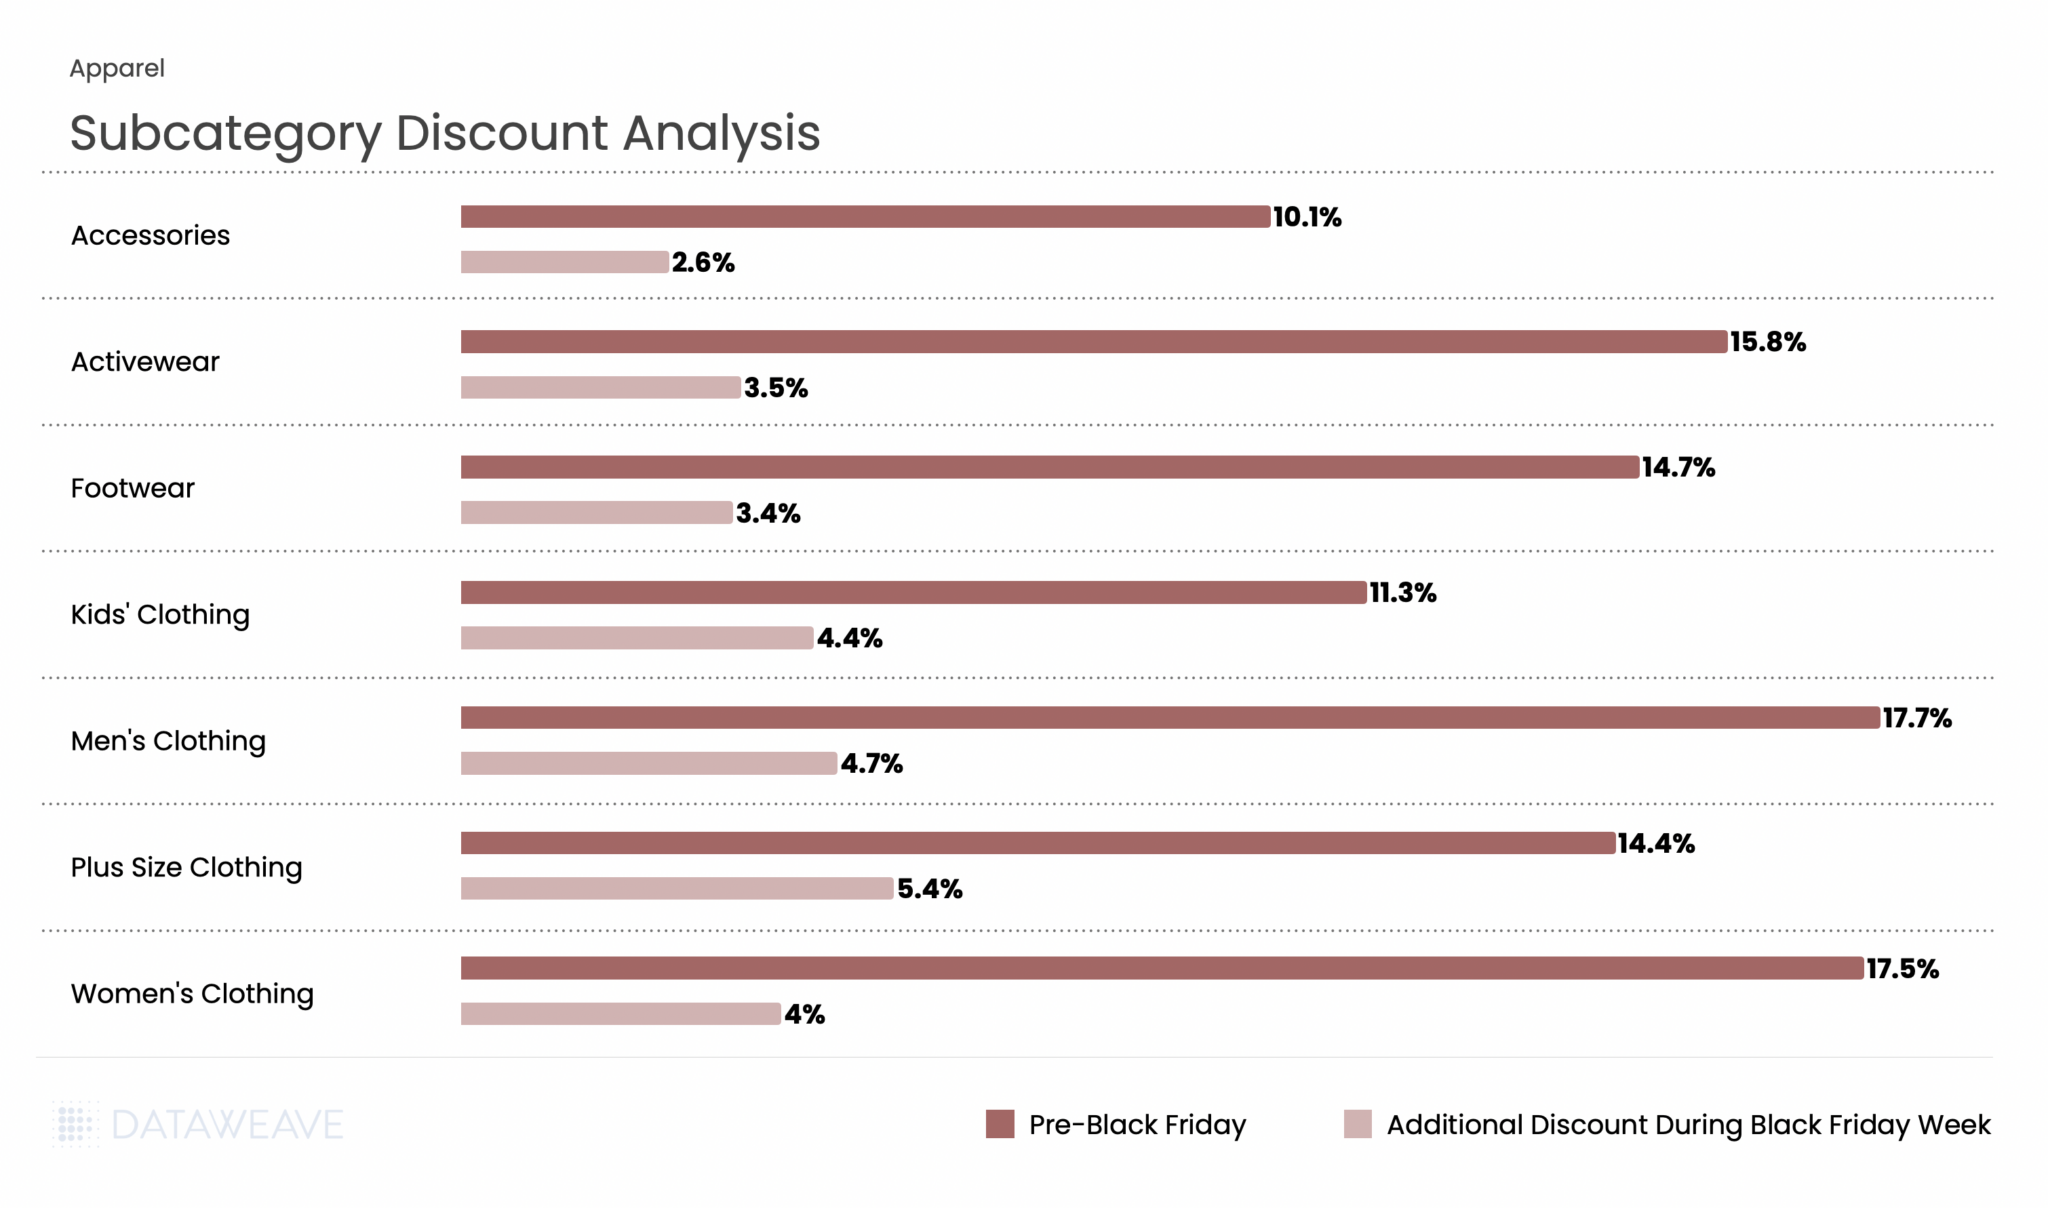
Apparel showed strong discounting activity throughout the BFCM period. Pre-Black Friday discounts averaged 13.8%, with Black Friday Week adding 3.8%, the highest additional discount among all five categories. Men’s Clothing and Women’s Clothing led pre-sale discounts at 17.7% and 17.5% respectively, reflecting aggressive early promotions on core apparel. Interestingly, Plus Size Clothing saw the highest Black Friday Week discount at 5.4%, suggesting retailers pushed harder during the main event to drive conversions in this segment. Kids’ Clothing also saw strong Black Friday Week discounts at 4.4%.
Share of Search: Brand Visibility Trends
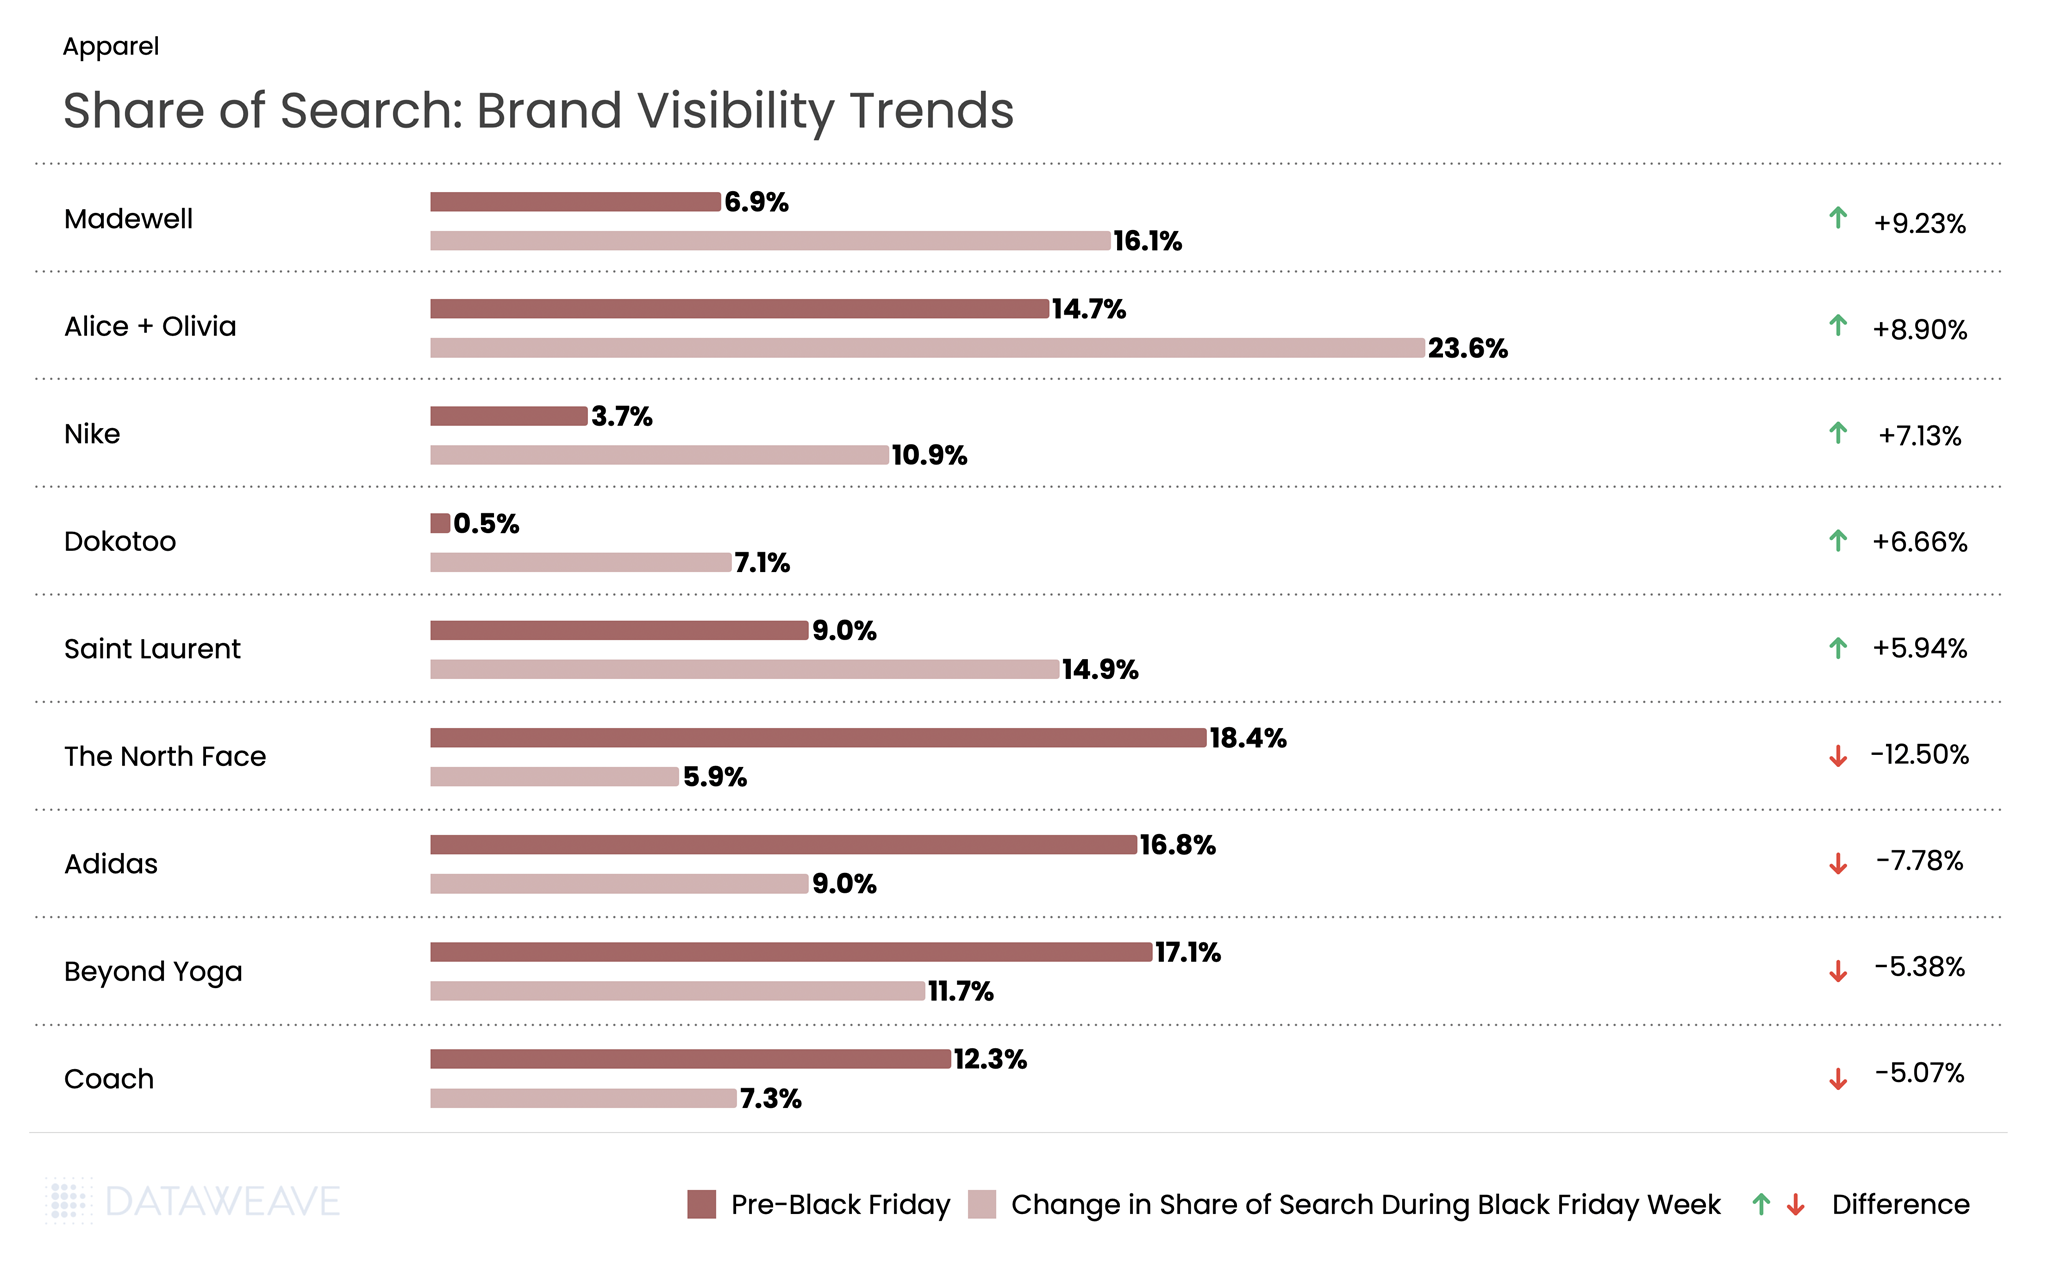
Apparel saw dramatic Share of Search movements during Black Friday Week. Fashion-forward brands dominated the gains: Madewell surged from 6.9% to 16.1% (+9.2%), while Alice + Olivia jumped from 14.7% to 23.6% (+8.9%). Nike also performed strongly with a 7.1% gain. Conversely, outdoor and athletic brands faced steep declines: The North Face dropped from 18.4% to 5.9%, a massive 12.5% decline, the largest in our entire analysis. Adidas fell 7.7%, Beyond Yoga declined 5.3%, and luxury brand Coach by 5%.
Key Takeaway: The data suggests fashion-forward and lifestyle brands (Madewell, Alice + Olivia, Saint Laurent) gained visibility at the expense of outdoor/athletic brands (The North Face, Adidas, Beyond Yoga). This could indicate that fashion brands invested more heavily in promotional visibility during the sale period.
Want to understand how DataWeave’s pricing intelligence platform can help your business make data-driven decisions during peak sales events? Contact us to learn more about competitive insights, price intelligence, assortment analytics, content analytics, and digital shelf analytics.
Follow our blog for more insights on retail pricing trends, brand visibility analysis, and data-driven commerce intelligence.
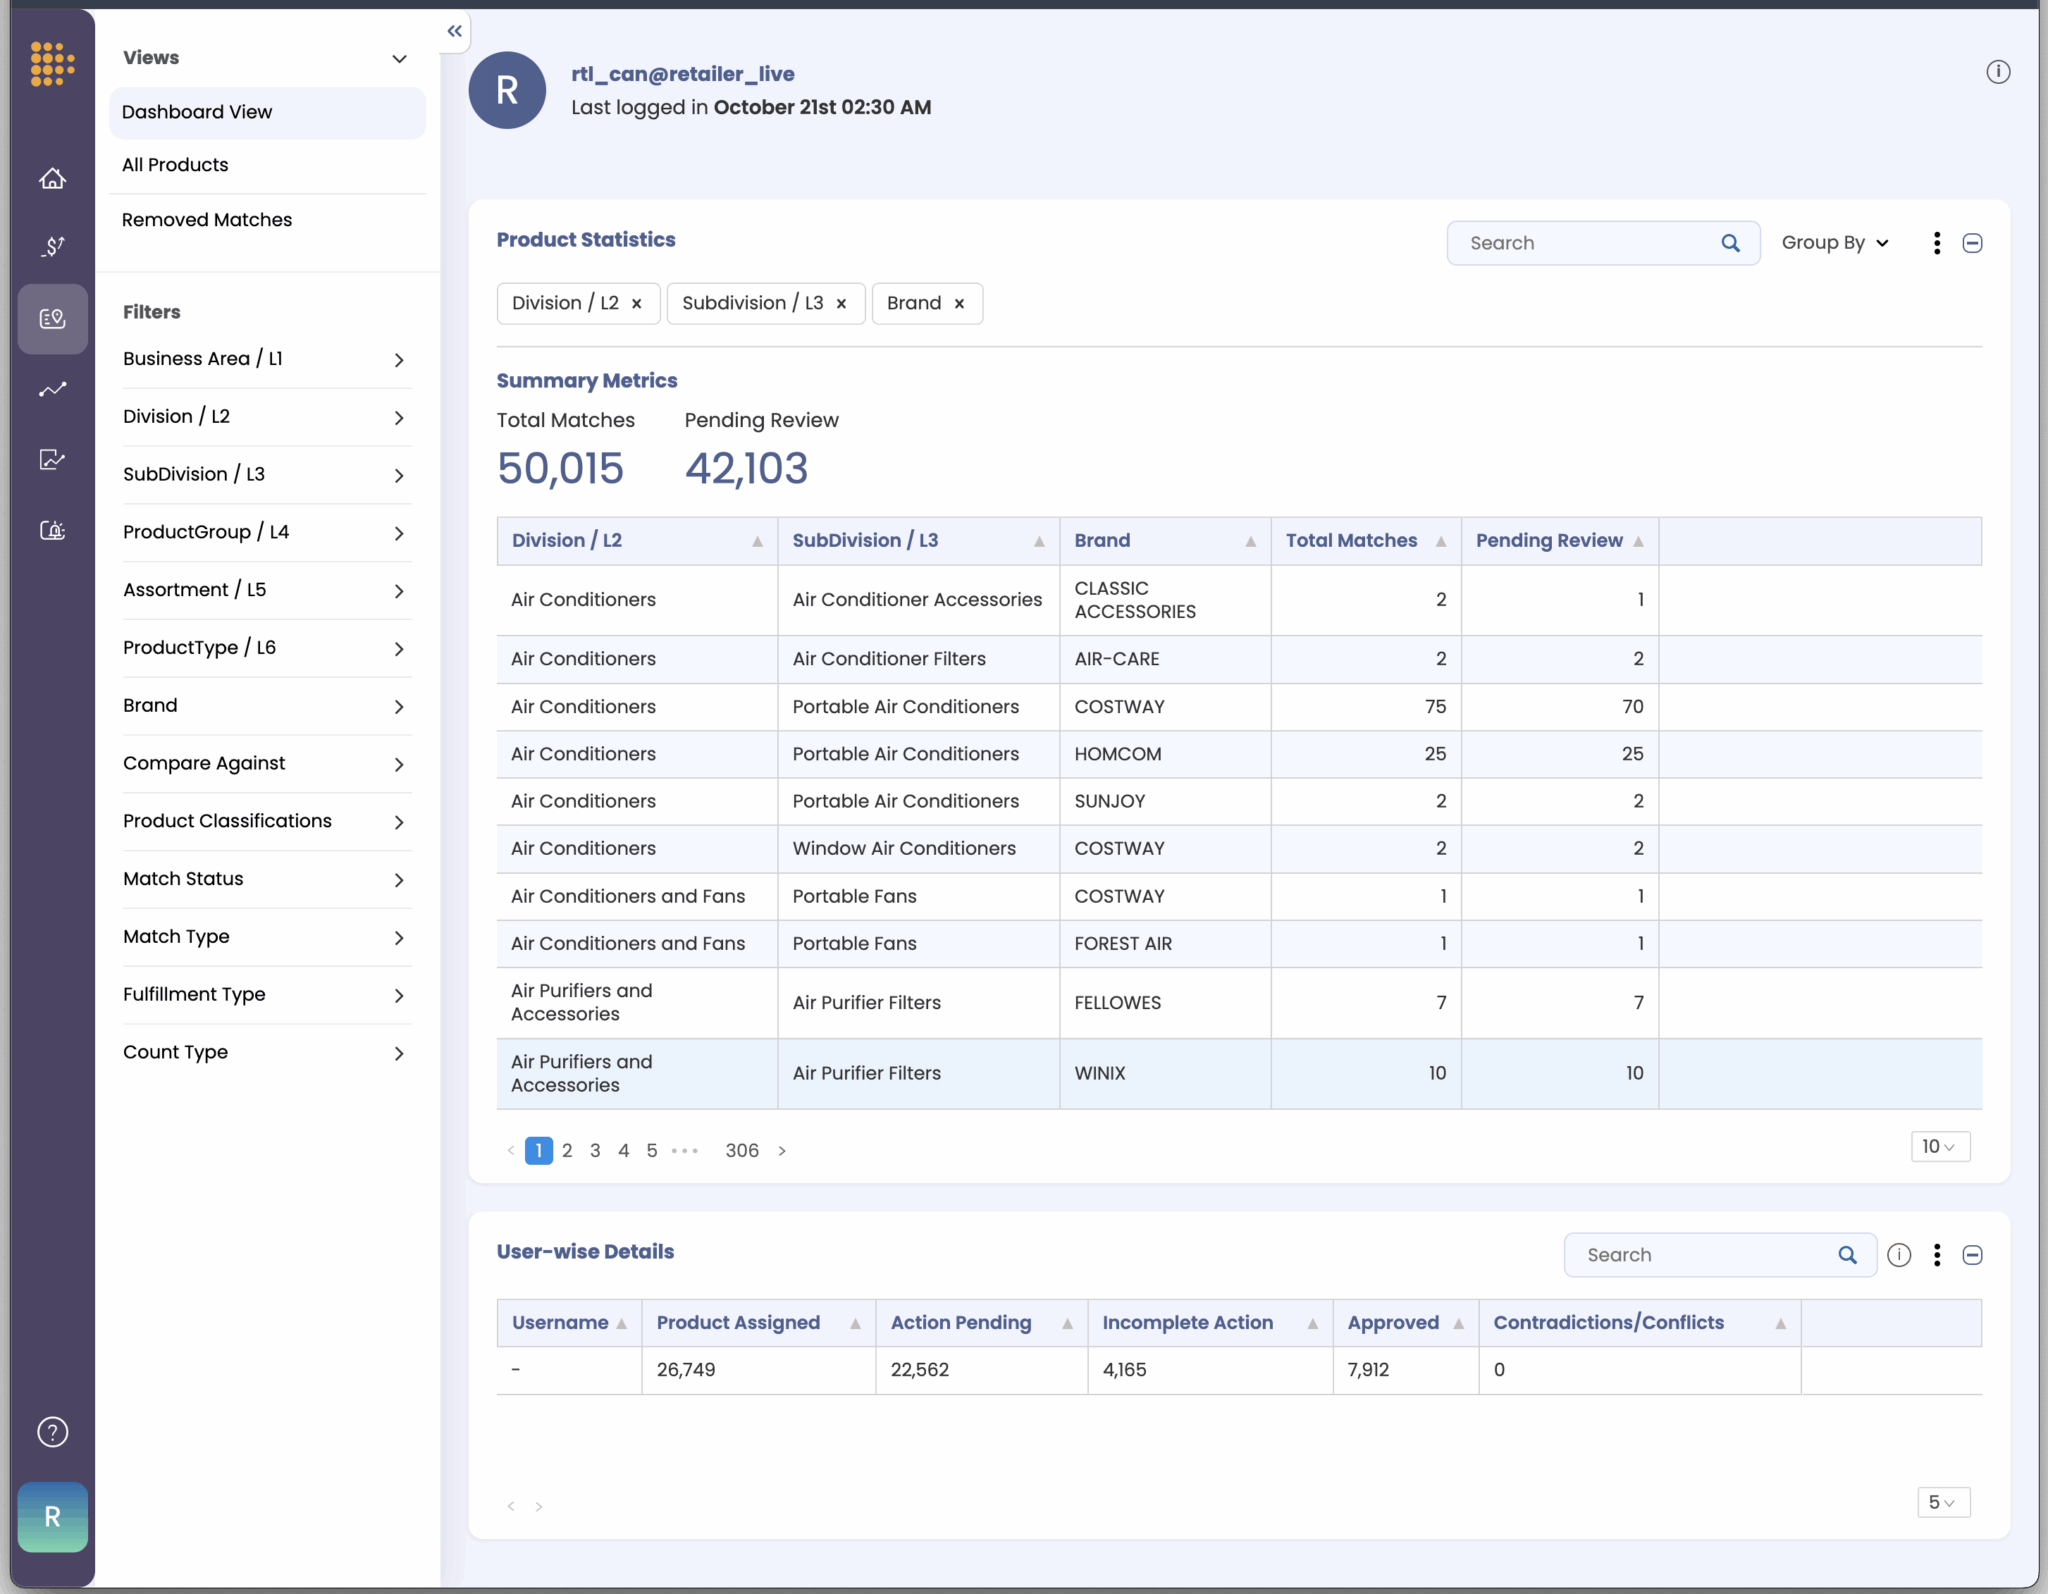
AI-powered product matching is the backbone of competitive pricing intelligence. Accurate matches help you compare prices correctly, identify meaningful assortment gaps, and optimize product content. Inaccurate matches distort every one of these insights. In some categories, a single mismatch can cause millions of dollars of lost revenue.
Retailers and brands know this problem well. Product catalogs are vast. Competitor assortments shift daily. Titles are inconsistent. Product codes are missing. Images vary by region or packaging. Basically, context matters, and AI alone often misses that context.
This is why a human-in-the-loop approach is essential. It allows product matches to be verified consistently, at scale, and with the context that only people can provide. Many retailers have also told us they want to take this a step further. They want the ability to control and define their own product matches.
Sometimes that is because they need to fix inevitable errors quickly. Other times, it is because their teams have deeper category knowledge and can make the right judgment calls when AI falls short.
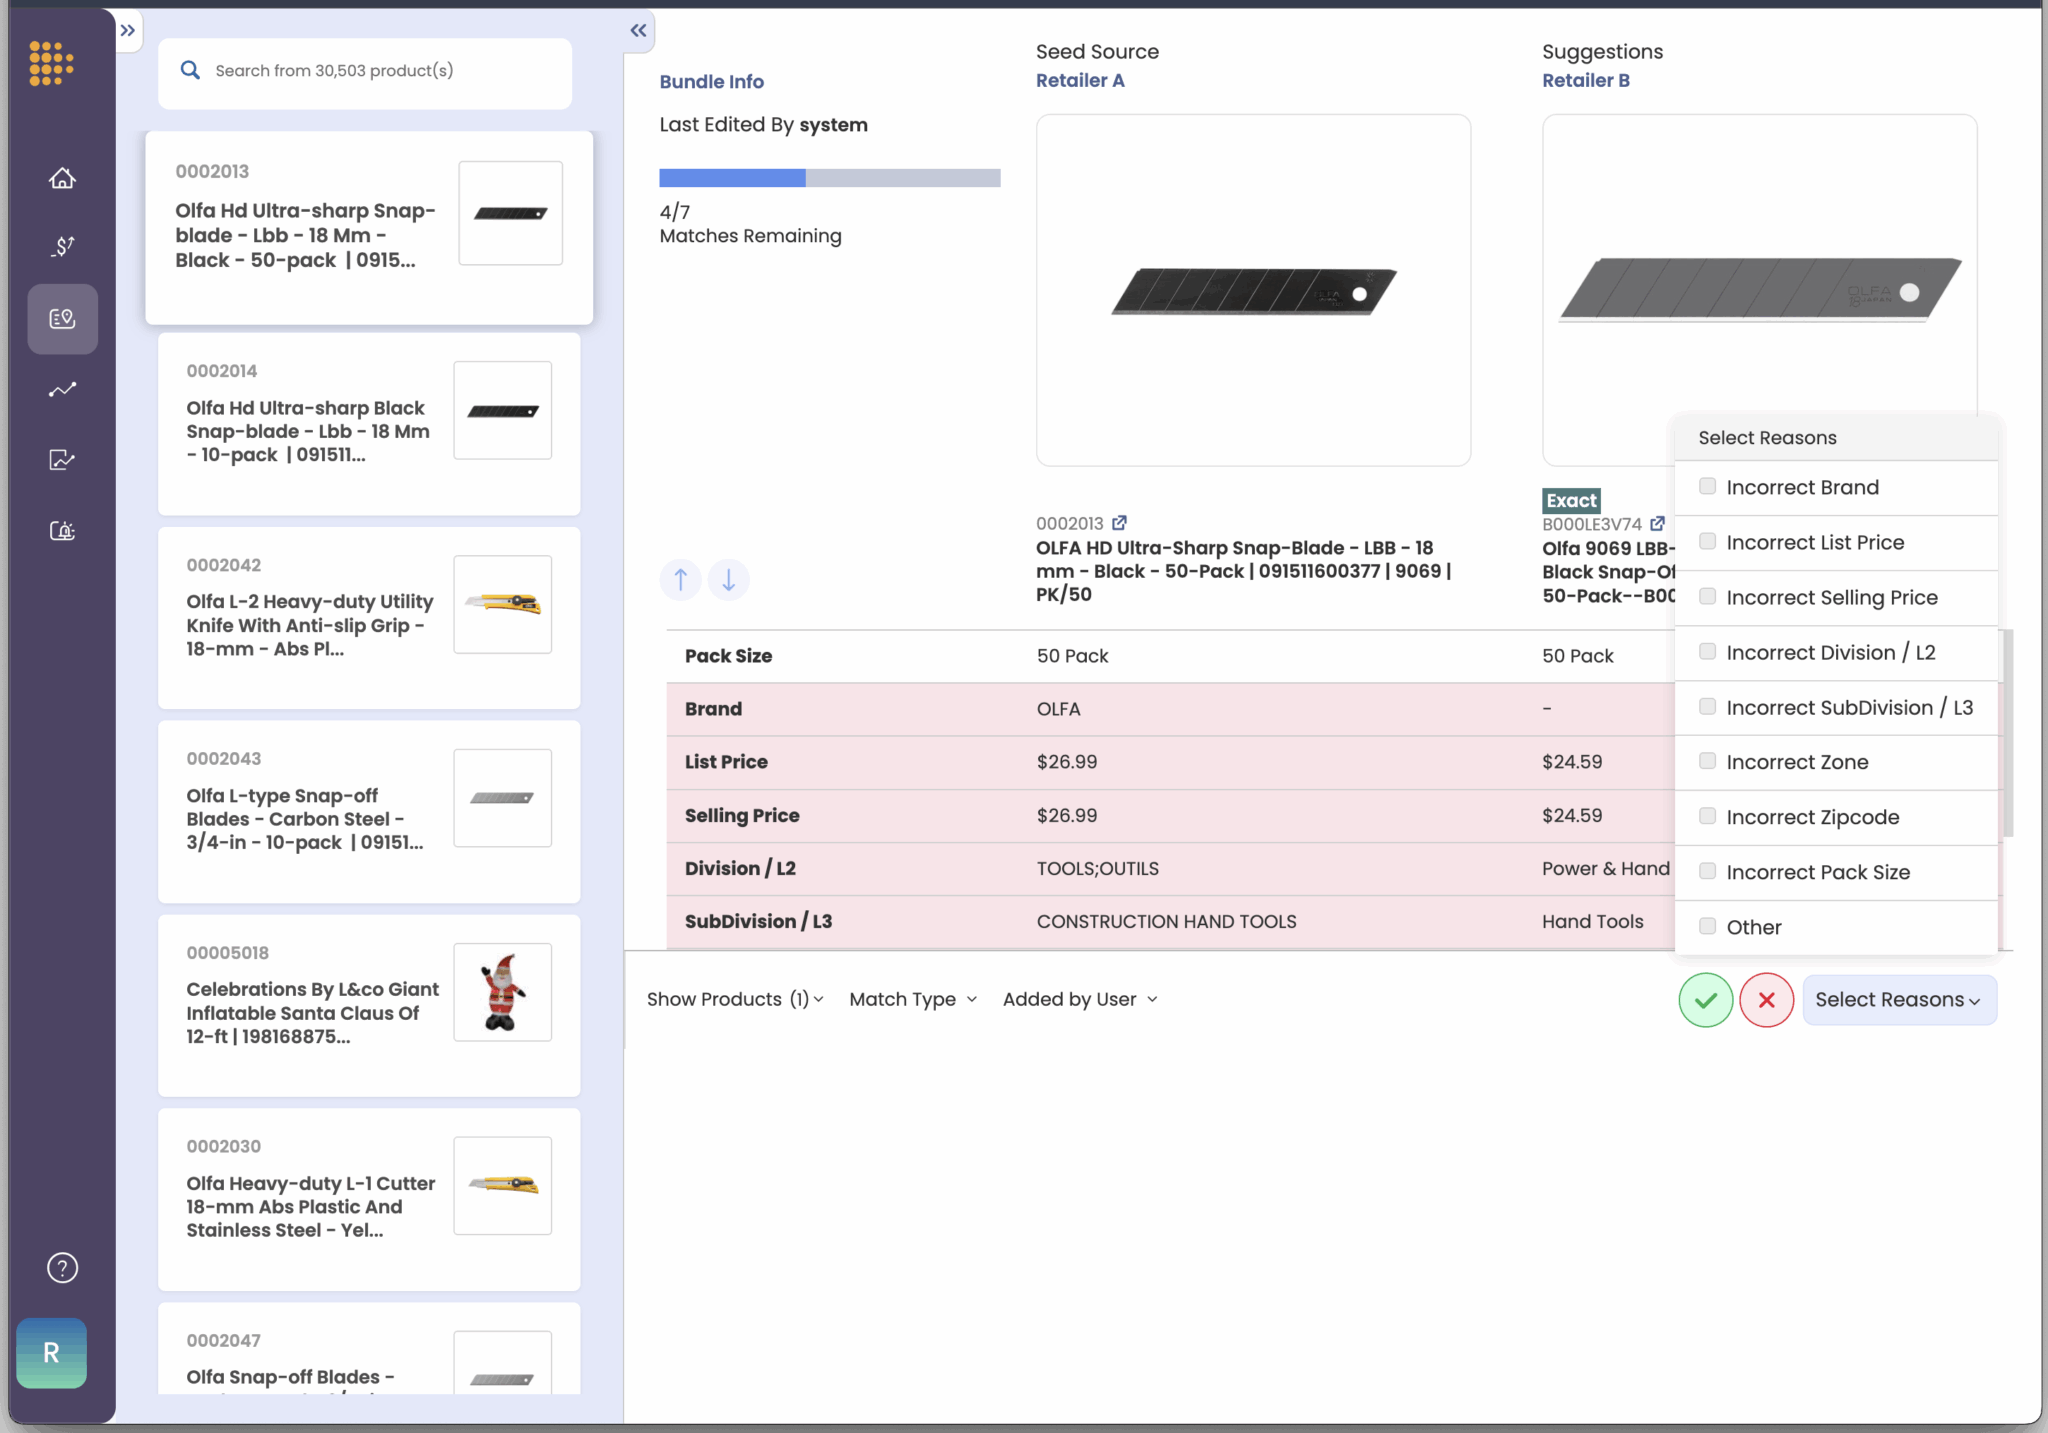
To make that possible,DataWeave introduced User-Led Match Management. It combines the scale of AI with the judgment of experts within retail organizations. The platform does not just suggest matches. It gives your teams the tools to approve, reject, or refine them. This ensures your competitive intelligence reflects both machine precision and your unique business logic.
Why AI Matching Alone Falls Short
AI has changed the speed and scale of product matching. Algorithms can process millions of SKUs quickly. They can detect similarities in text, images, and metadata. But in retail, the stakes are too high to rely on AI alone.
Here is where AI sometimes falls short:
Category complexity: Matching rules that work in electronics may fail in fashion or grocery. An electronics SKU may depend on a model number. A fashion SKU may depend on seasonality. A grocery SKU may depend on pack size or whether it is a private label.
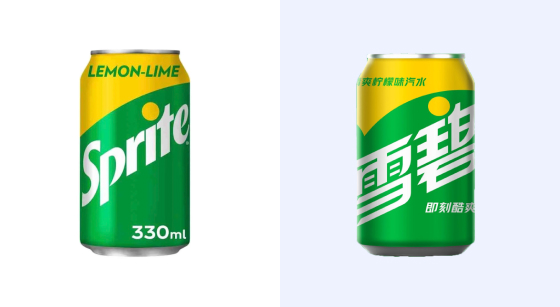
Data inconsistency: Titles vary. Images differ across regions. These gaps, when large, trip up algorithms.
Business context: Should a premium product ever be compared against a budget line? Should seasonal products match year-round items? AI may not know these boundaries.
Scale vs. accuracy: Automated systems optimize for coverage. That speed often limits accuracy for a small set of SKUs. Even a 1% error rate across millions of SKUs creates thousands of bad comparisons.
AI is critical for scale. But accuracy requires human input. DataWeave’s human-in-the-loop framework addresses this by allowing expert reviewers to validate and improve AI outputs. Our user-led match management takes this further by putting control directly into the hands of your business teams.
What DataWeave’s User-Led Match Management Delivers
With User-Led Match Management, your team is not a passive reviewer. They become active participants in shaping the accuracy of your competitive intelligence.
Your teams can:
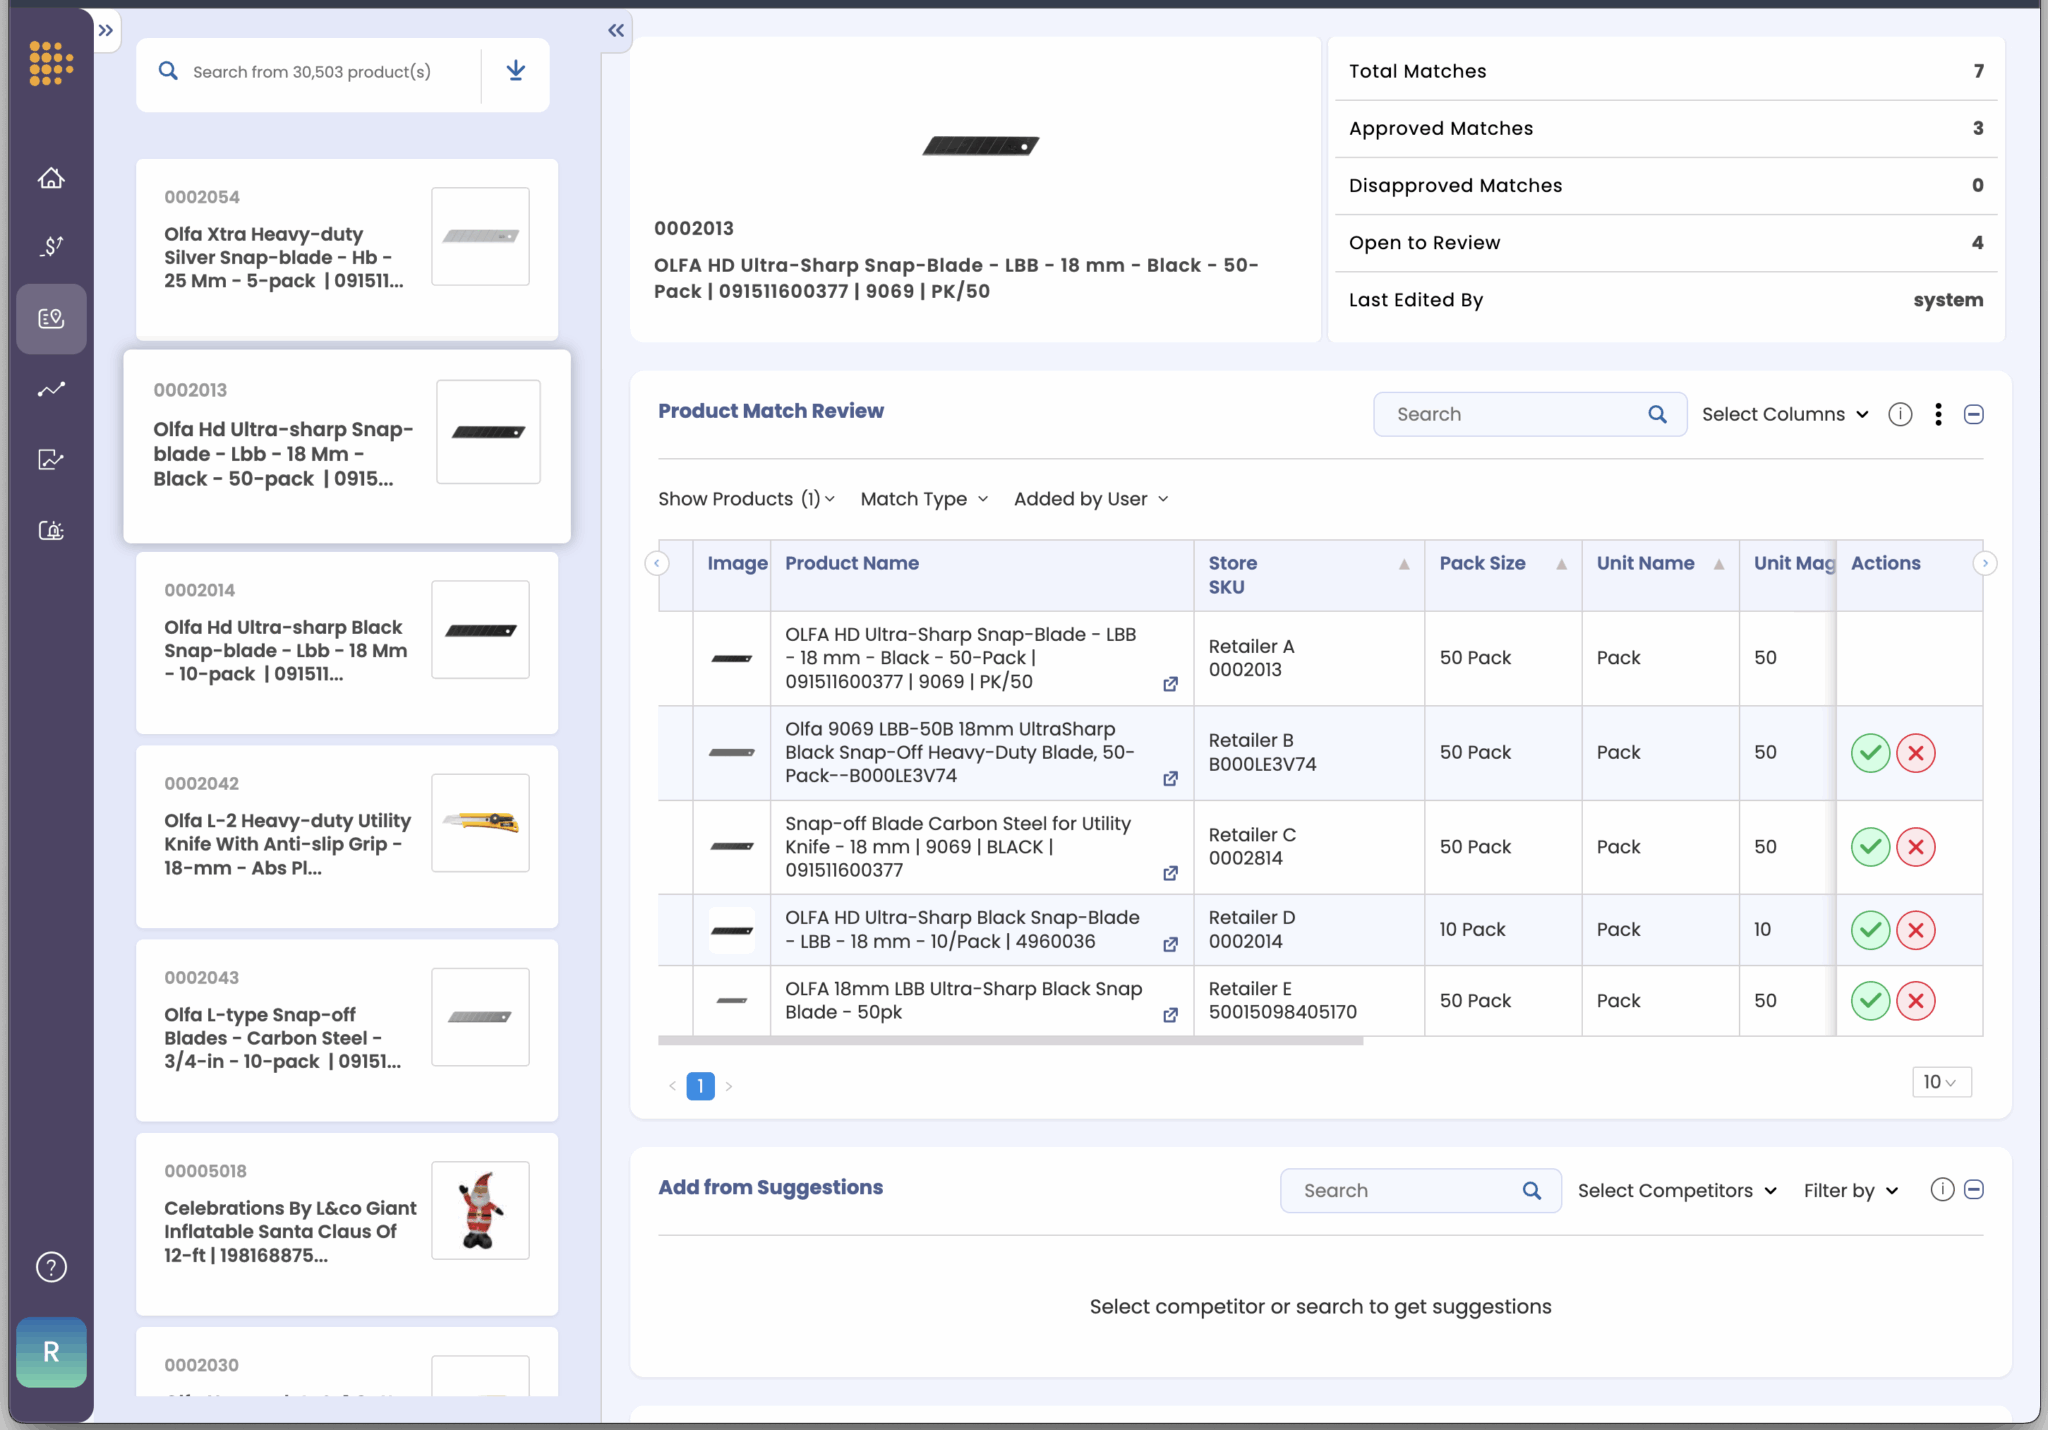
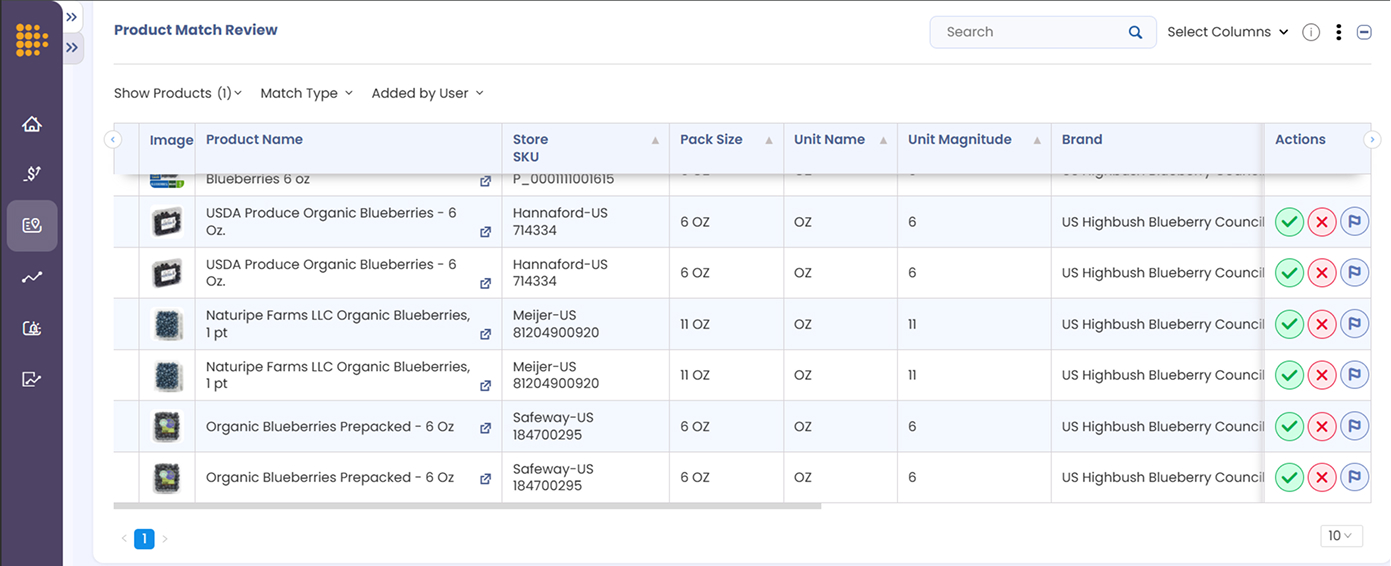
Approve, reject, or flag AI-suggested matches. Every suggestion comes with full visibility into why it was made. Your team can validate matches quickly, fix errors, and improve the dataset in real time.
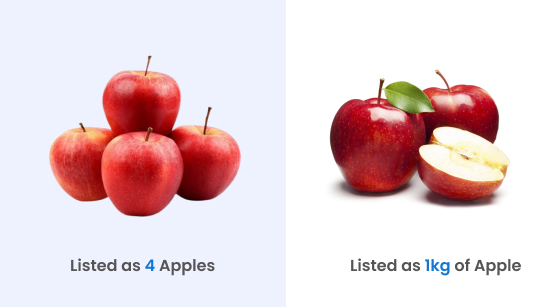
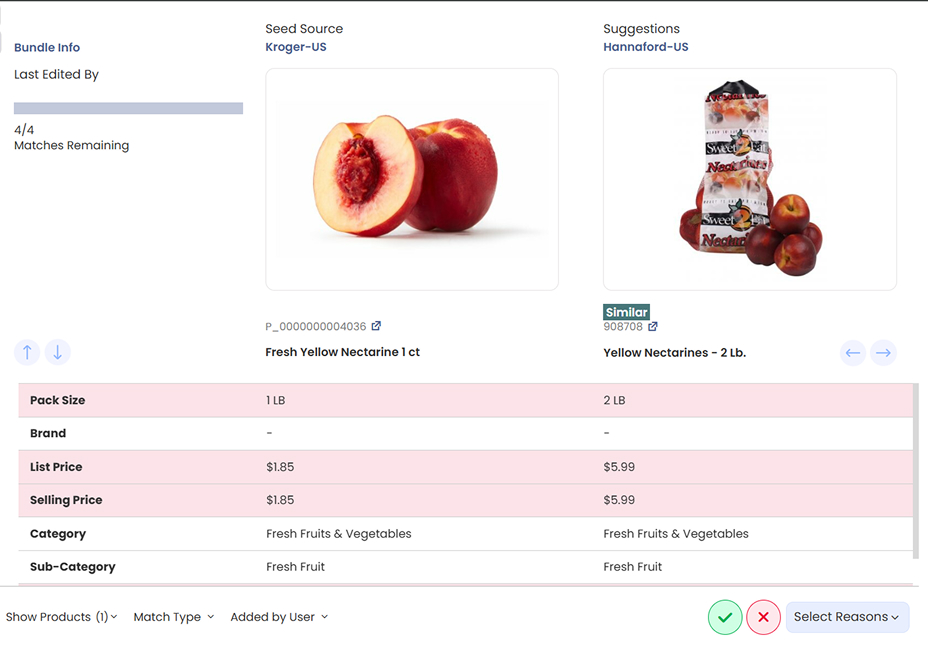
Define what “similar” means for your business. A retailer may want to compare multipacks against single packs. A brand may only care about comparing premium products to other premium products. With User-Led Match Management, your team sets tolerance levels that match your strategy.
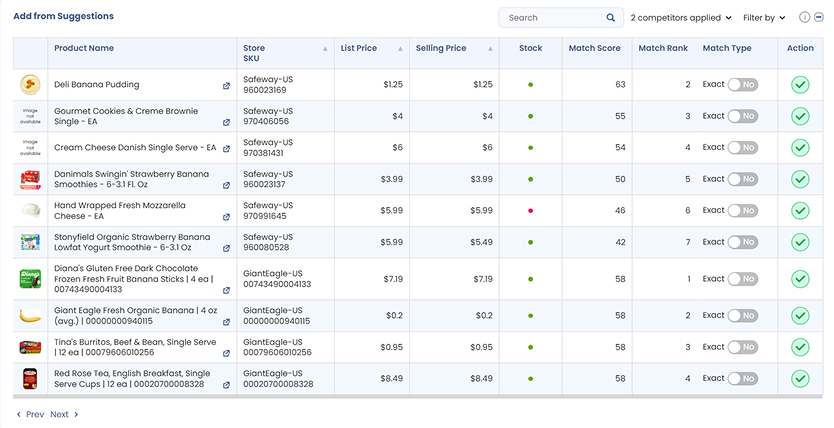
Manually add or refine matches. When AI misses edge cases, your team can add them. This ensures coverage is complete and reflects the true competitive landscape.
This approach creates a loop where AI, complemented by DataWeave’s human-in-the-loop framework does the heavy lifting, and your teams can fine-tune the results. The outcome is both scale and accuracy.
Key Features
DataWeave designed User-Led Match Management to be simple, intuitive, and scalable:
Expert-Led Decision Making forms the heart of the system. Rather than trusting AI suggestions blindly, teams gain full visibility into matching logic and can leverage their contextual knowledge of products, categories, and retailers. When the system suggests matching a premium product against a basic alternative, human experts can reject the match and flag it for different criteria. This expertise is particularly valuable for new product launches, seasonal items, or products with complex positioning strategies.
Business Logic Integration: Teams can define matching parameters that reflect their specific strategic needs. A premium brand might establish rules that prevent matches against budget alternatives, while a value retailer might specifically seek those comparisons. Category managers can create different matching criteria for different product lines, ensuring that seasonal items, limited editions, and promotional products are handled appropriately.
Transparent Decision Making: Every match decision creates an audit trail capturing who made the decision, when it occurred, and the reasoning behind it. This transparency is crucial for enterprise environments where pricing decisions need to be defensible and strategies need to be consistent across teams and time periods.
Scalable Validation: User-Led systems provide bulk operations for efficiency while maintaining oversight. Teams can upload thousands of matches for validation, use filtered views to focus on high-priority items, and leverage automated alerts for matches that fall outside established tolerance levels.
Each of these features reduces the friction between AI outputs and business-ready insights.
Technical Foundation
The AI foundation behind User-Led Match Management is built for precision and scale.
It uses multimodal AI that combines text, image, and metadata analysis to identify matches even when products are described or displayed differently across retailers.
Domain heuristics apply retail-specific logic, recognizing that “Large” means something different in apparel than in beverages, and that seasonal items require unique treatment.
Knowledge graphs link products across brands, categories, and regions to reveal true relationships even when surface attributes vary.
Through continuous learning, every human correction improves future AI suggestions, making the system smarter and more accurate over time.
With DataWeave, accurate and reliable product matching is the standard. Advanced algorithms and built-in quality checks deliver consistently high accuracy, reducing the risk of mismatched products and unreliable insights.
In the few cases where a match needs review, User-Led Match Management gives your team the ability to validate it quickly and easily. You get full visibility and control, while DataWeave ensures the integrity of the overall matching framework.
The outcome is true apples-to-apples price comparisons that protect margins, strengthen pricing strategies, and build trust in every decision.
Assortment Analytics
Gaps and overlaps only matter when matches are accurate. To understand your true competitive landscape, you need to eliminate false gaps and phantom overlaps that distort assortment insights.
DataWeave’s advanced Match Management ensures precise product alignment across retailers, categories, and regions, giving you a clear view of your position in the market. At the same time, user-led oversight adds transparent validation, allowing your teams to confirm or refine matches based on their category knowledge.
The result is a complete and trustworthy view of category coverage that reflects reality, not noise. It helps you identify real opportunities to expand assortments, close gaps, and respond quickly to market changes.
Content Optimization
Digital shelf audits only deliver value when the comparisons are accurate. DataWeave ensures that every product is benchmarked against its true competitors so that your insights reflect the real dynamics of your category. For example, a luxury serum is never compared to a basic moisturizer, and a premium electronic device is never matched with an entry-level model.
With user-led control, your teams have transparent oversight of every match. They can review, validate, or adjust comparisons to make sure each audit aligns with your business standards. The result is a more reliable and actionable view of your digital shelf performance, helping you fine-tune content, optimize visibility, and strengthen conversion across channels.
Trust and Accountability
Leadership teams need complete confidence in the data they use to make decisions. User-Led Match Management delivers that confidence by combining the scale of AI with the assurance of human validation. Every match decision is transparent and traceable, giving teams clear visibility into how and why a product was matched.
This approach builds trust across departments, from analysts to executives. It ensures that every pricing, assortment, and content decision is backed by data that is both accurate and accountable.
Your Market, Your Rules, Your Insights
Retailers and brands today need more than fast data. They need data they can trust, shape, and act on with confidence. User-Led Match Management gives them that control. It turns product matching from a static, automated process into a dynamic, collaborative workflow that adapts to how real teams operate.
Category managers can fine-tune match rules instead of waiting on system updates. Pricing teams can validate critical SKUs in minutes, not days. Digital shelf teams can ensure their audits reflect real competitors, not algorithmic guesses. Executives gain visibility into decisions they can stand behind, supported by transparent data trails and measurable accuracy.
In short, User-Led Match Management puts control back where it belongs – in your hands. It helps every team move faster, compete smarter, and make decisions powered by data they can truly believe in.
Amazon Prime Day 2025 generated a record-breaking $24.1 billion in US online sales during its extended four-day run (July 8–11, 2025). While the expanded format helped broaden participation, it also diluted the urgency and daily peaks that typically define Prime Day.
Beneath this record-setting performance lies a more complex reality. Persistent inflation, shifting consumer behavior, and rising pricing pressures created a retail environment very different from previous years, one where higher baseline prices often replaced the deep discounts shoppers expected.
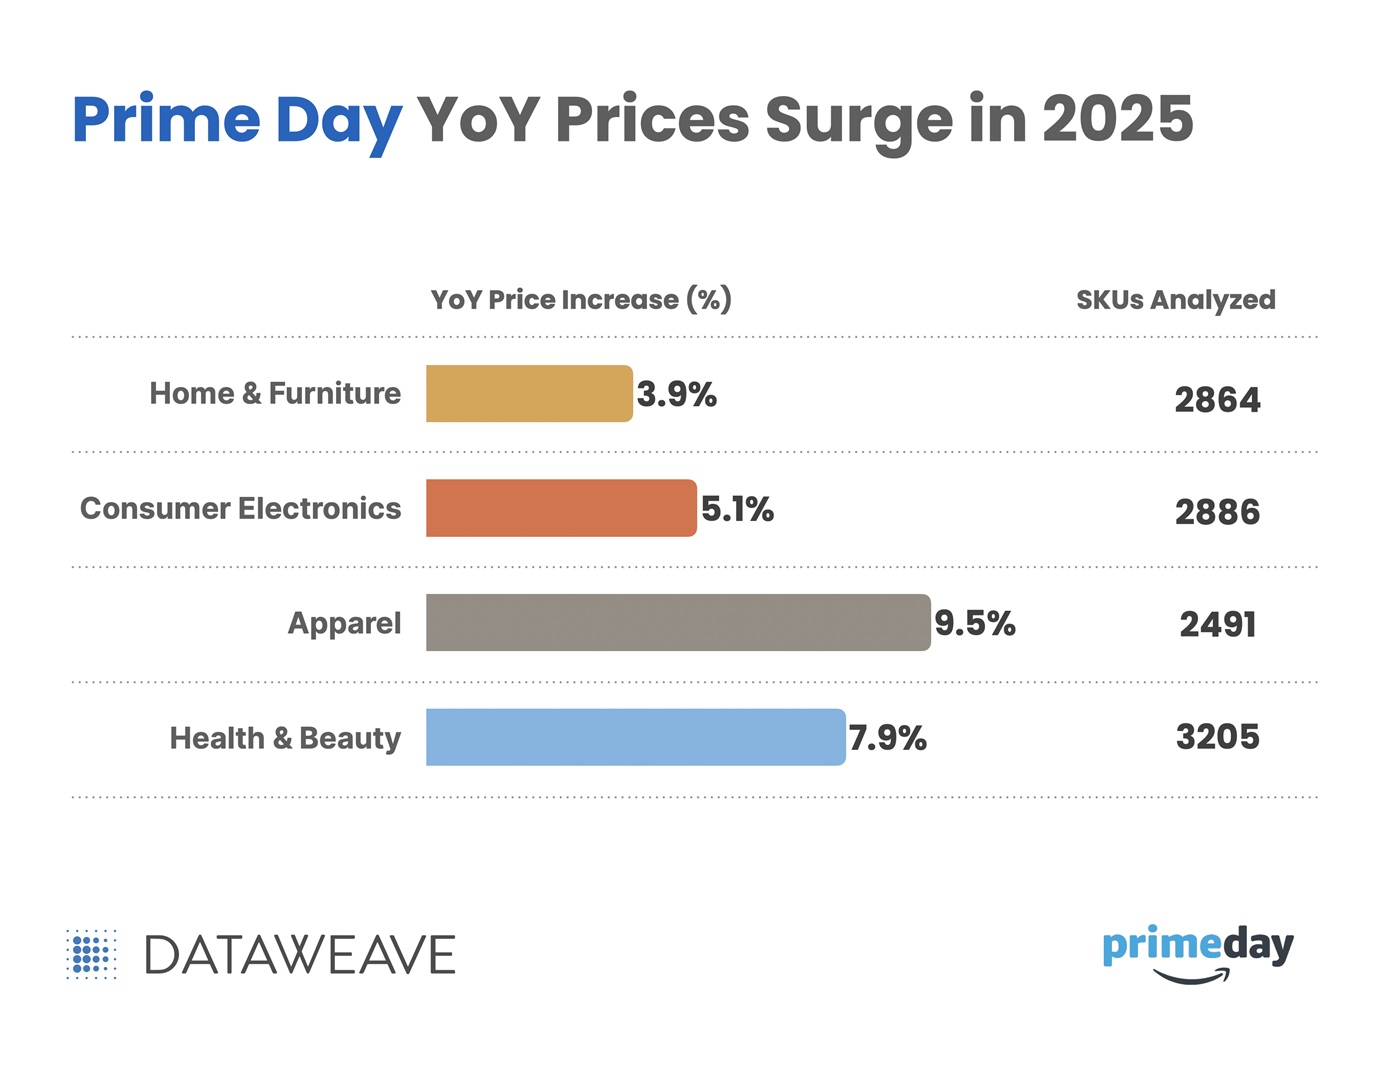
To understand these dynamics, DataWeave analyzed pricing and visibility trends across 11,495 products using our proprietary AI platform. The study focused on four major categories – Consumer Electronics, Apparel, Home & Furniture, and Health & Beauty – comparing identical SKUs from Prime Day 2024 and 2025, and tracking changes in both organic and sponsored share of search for leading brands.
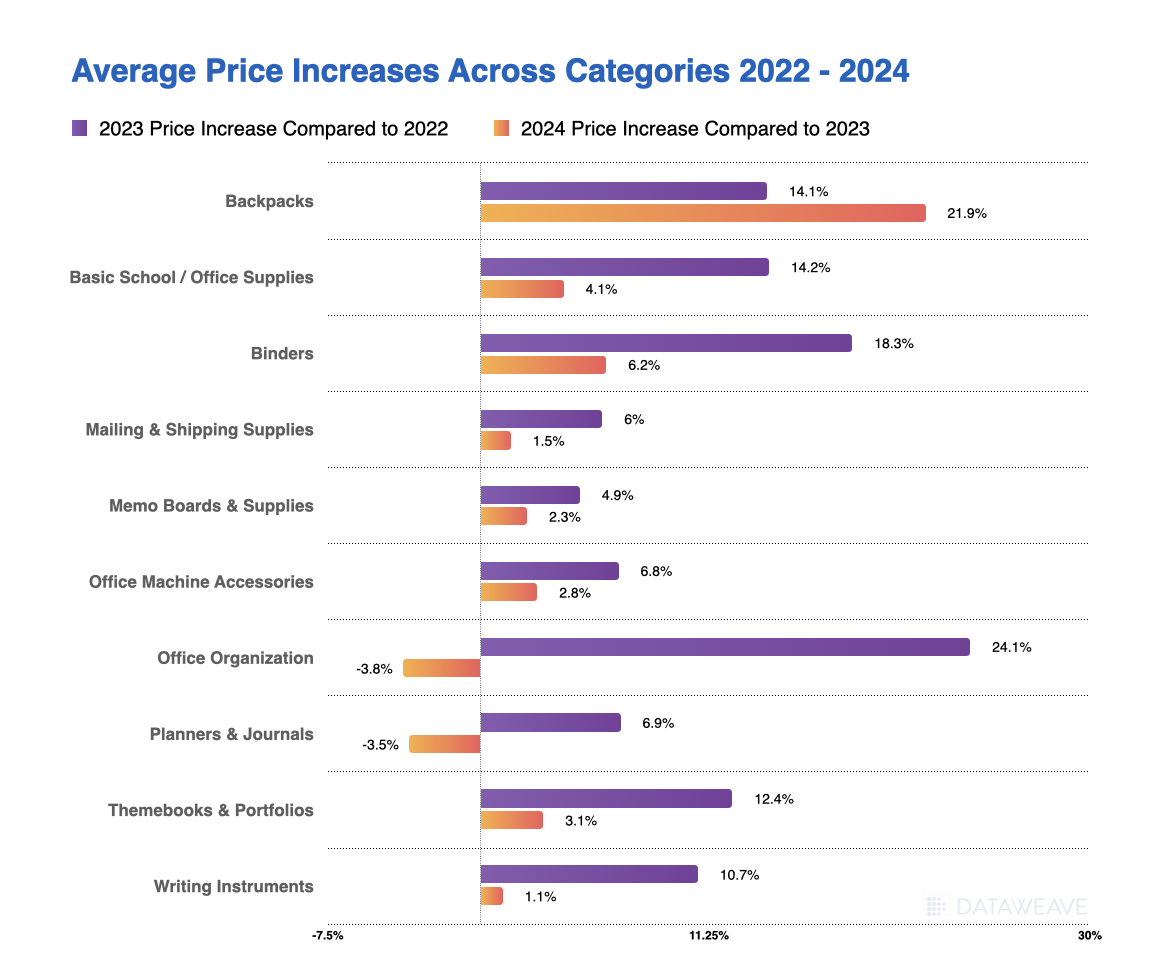
The results reveal clear year-over-year price increases: Apparel led with a 9.5% rise, followed by Health & Beauty (7.9%), Consumer Electronics (5.1%), and Home & Furniture (3.9%). In total, 47% of tracked products saw higher prices, indicating that this year’s record sales were achieved in an environment of elevated base pricing rather than deeper discounts.
Multiple converging forces shaped the retail landscape leading into Prime Day 2025, pushing baseline prices higher even before promotions began.
Supply Chain Pressures: Ongoing disruptions and elevated shipping and production costs continue to shape the cost structure across categories.
Trade Policy Factors: Recent tariff measures and trade regulations may be contributing to upward pricing trends in certain categories, particularly those with high import dependence such as electronics and home goods.
Labor and Operating Costs: Rising wages, transportation expenses, and general operating overhead are placing additional pressure on retailer margins and influencing pricing decisions.
Currency Fluctuations: Shifts in exchange rates continue to add variability to the cost of imported goods, especially in globally sourced categories like electronics and apparel.
These combined pressures created a pricing environment where brands had less room for deep discounting, shaping not just how products were priced, but also how aggressively they were promoted.
To better understand the impact, we compared Prime Day 2025 prices to those from Prime Day 2024 for the same SKUs across major categories. This year-over-year view highlights how elevated baseline prices, driven by the factors outlined above, shaped the shopping experience and promotional strategies.
Consumer Electronics
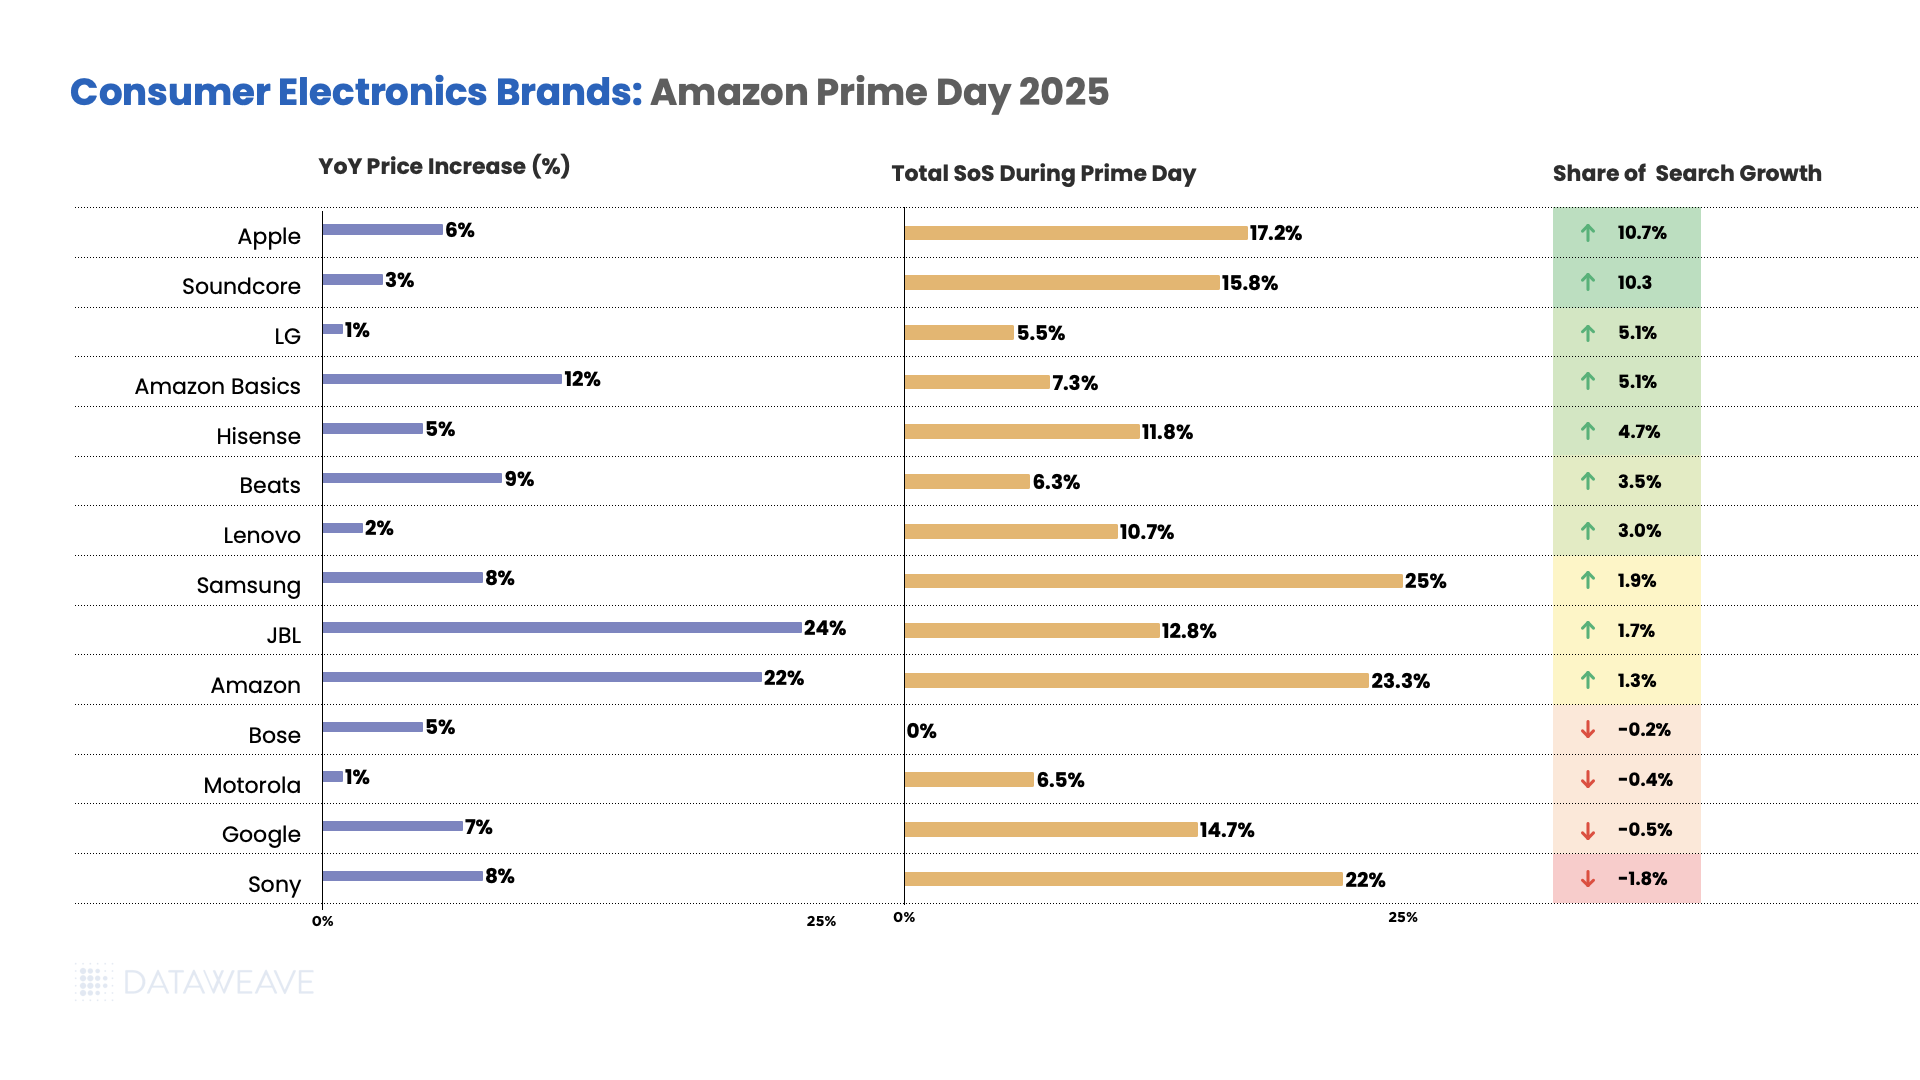
JBL prices increased 24% year-over-year, the highest among major electronics brands.
Amazon’s own brand saw prices increase by 22%.
Beats saw a significant 9% increase, while Sony and Samsung both experienced 8% price increases. Apple prices went up by 6%, and Google saw a 7% increase.
Meanwhile, other established brands like LG and Motorola maintained minimal increases at 1%, Lenovo at 2%, Soundcore at 3%, and Bose and Hisense both at 5%.
Apple dominated visibility gains, jumping to 17.2% share of search during Prime Day with a 10.7% growth, likely driven by promotional focus on premium devices. Soundcore also saw significant gains of 10.3%, reaching 15.8% share of search.
LG and Amazon Basics both achieved strong 5.1% growth. Hisense gained 4.7% share with 5% price increases. Samsung and Amazon maintained strong positions with modest gains of 1.9% and 1.3% respectively.
However, several brands lost ground, with Sony declining most significantly by 1.8% share despite its strong market position, followed by Google (-0.5%) and Motorola (-0.4%).
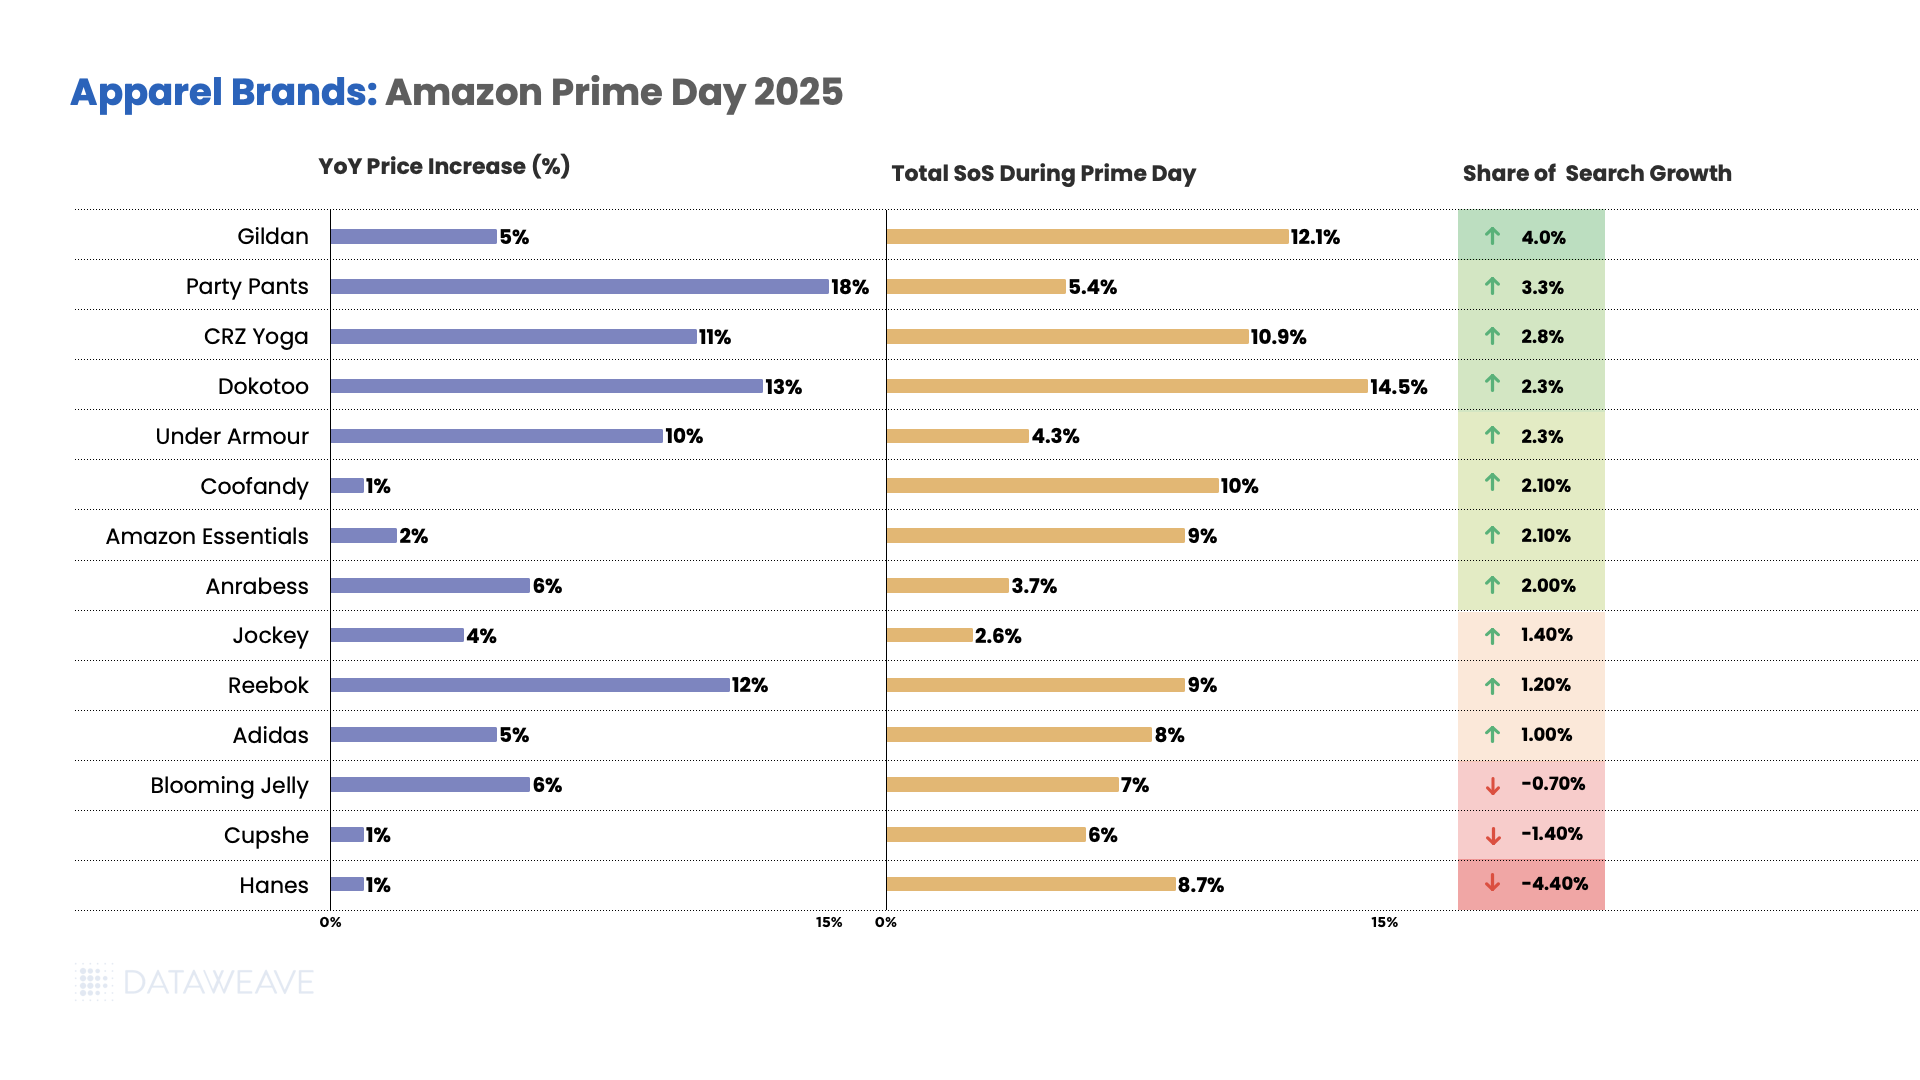
Apparel
Party Pants showed the highest price increases at 18% year-over-year, followed by casual wear brand Dokotoo at 13%.
Athleisure brand CRZ Yoga saw prices increasing by 11%, while Under Armour saw prices rise by 10%.
While Reebok experienced a significant 12% increase, Adidas saw 5% price increase.
Meanwhile, innerwear brands like Hanes and Cupshe saw minimal price increases at 1%, while Coofandy also saw minimal increases of 1%.
Amazon’s own Amazon Essentials maintained minimal price increases of 2%, and Jockey saw modest increases of 4%.
T-shirt brand Gildan led share of search gains with 4.0% growth along with a 5% price increase. Party Pants achieved 3.3% growth with 18% price increases, while CRZ Yoga gained 2.8% share and 11% price increases.
Amazon Essentials and Mens’ apparel brand Coofandy both improved share by 2.1%, with Amazon Essentials keeping price increases to just 2% and Coofandy at 1%. Under Armour gained 2.3% share with 10% price increase.
However, several brands lost ground, with Hanes declining significantly by 4.4% while keeping price increases to just 1%, followed by Cupshe (-1.4%) and Blooming Jelly (-0.7%).
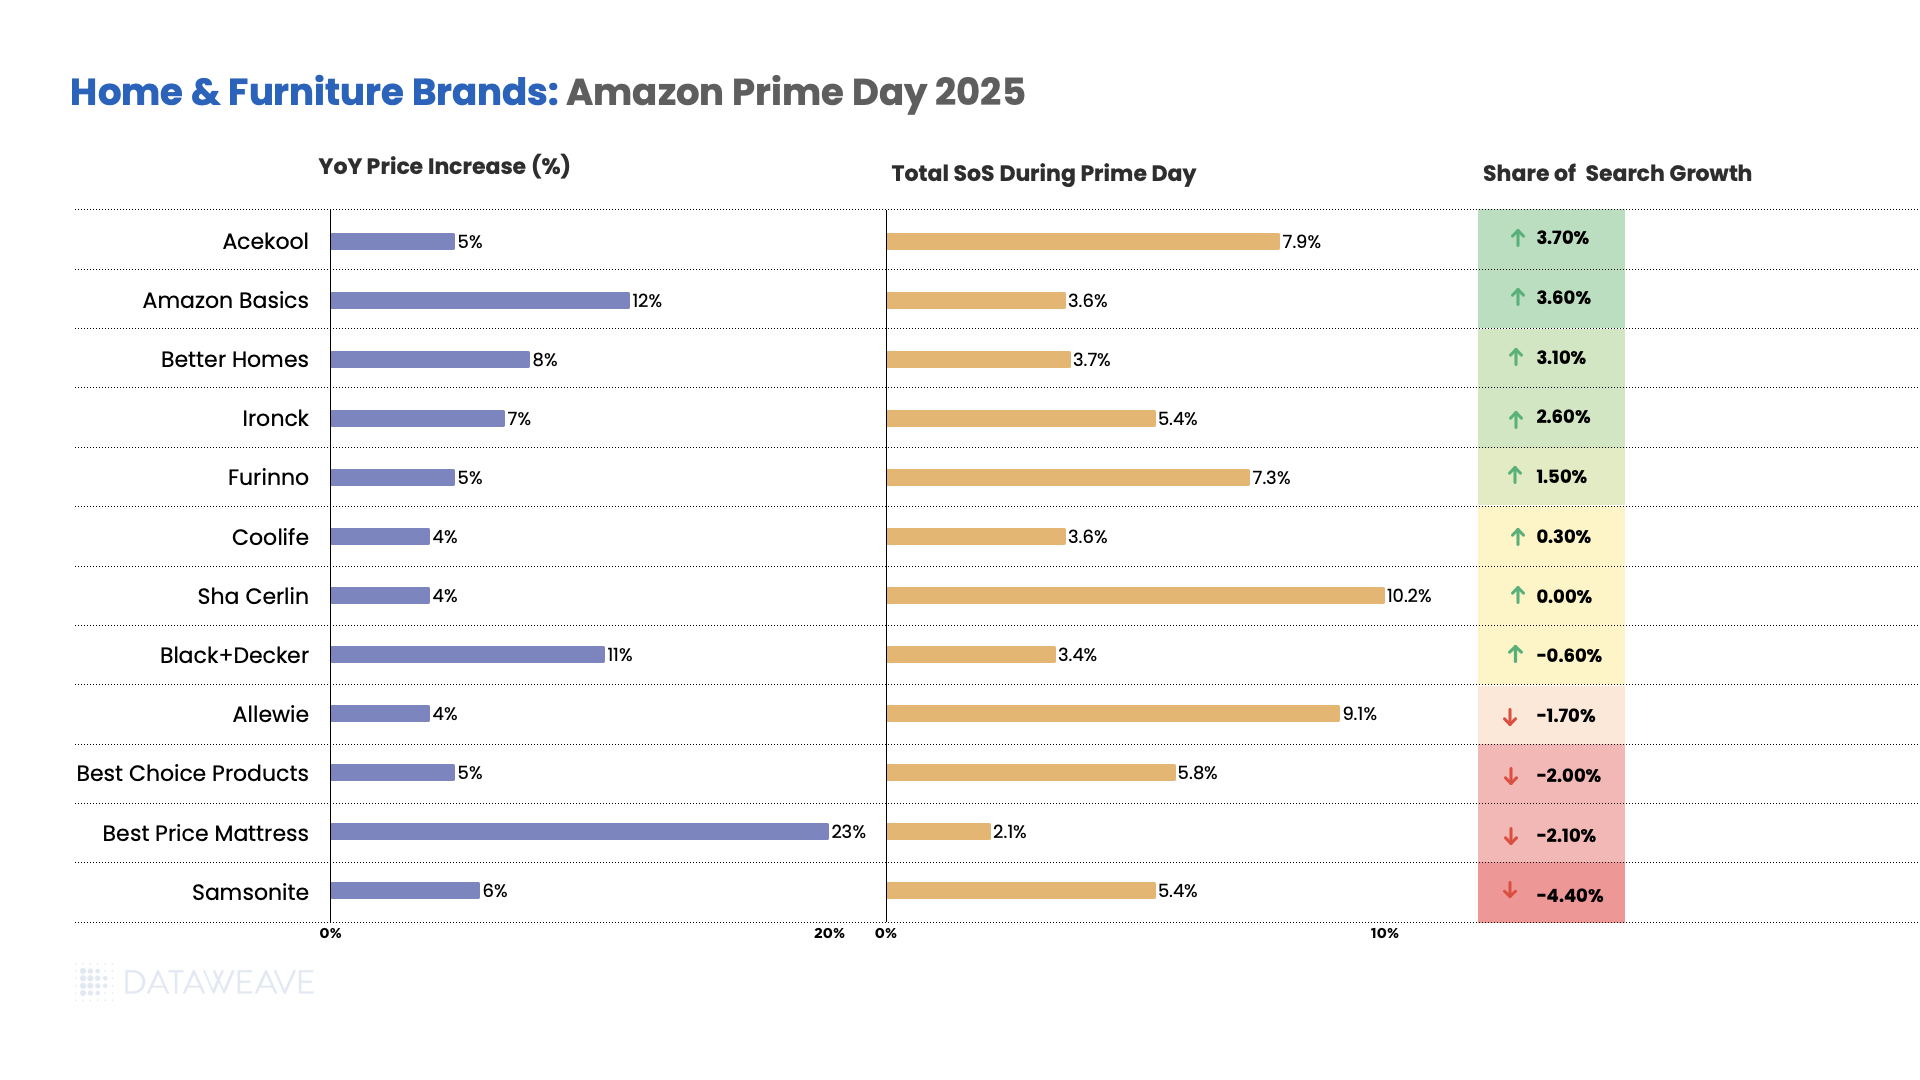
Home & Furniture
Mattress brand Best Price Mattress increased prices 23% year-over-year, the highest in the category.
Home Improvement and Appliances brand Black+Decker saw a pricing increase of 11%.
Better Homes saw an 8% increase, while most other brands saw price increases between 4-7%.
Appliance brand Acekool led visibility gains with 3.7% growth along with a 5% price increase. Amazon Basics improved significantly with a 3.6% share growth alongside its 12% price increases. Better Homes achieved 3.1% gains with 8% price increases.
Ironck gained 2.6% share with 7% price increases, and furniture brand Furinno improved by 1.5% with 5% price increases. However, several brands lost ground, with Samsonite declining most significantly by 4.4%, Best Price Mattress lost 2.1% share with its massive 23% price increase, and Allewie declined by 1.7% with 4% price increases.
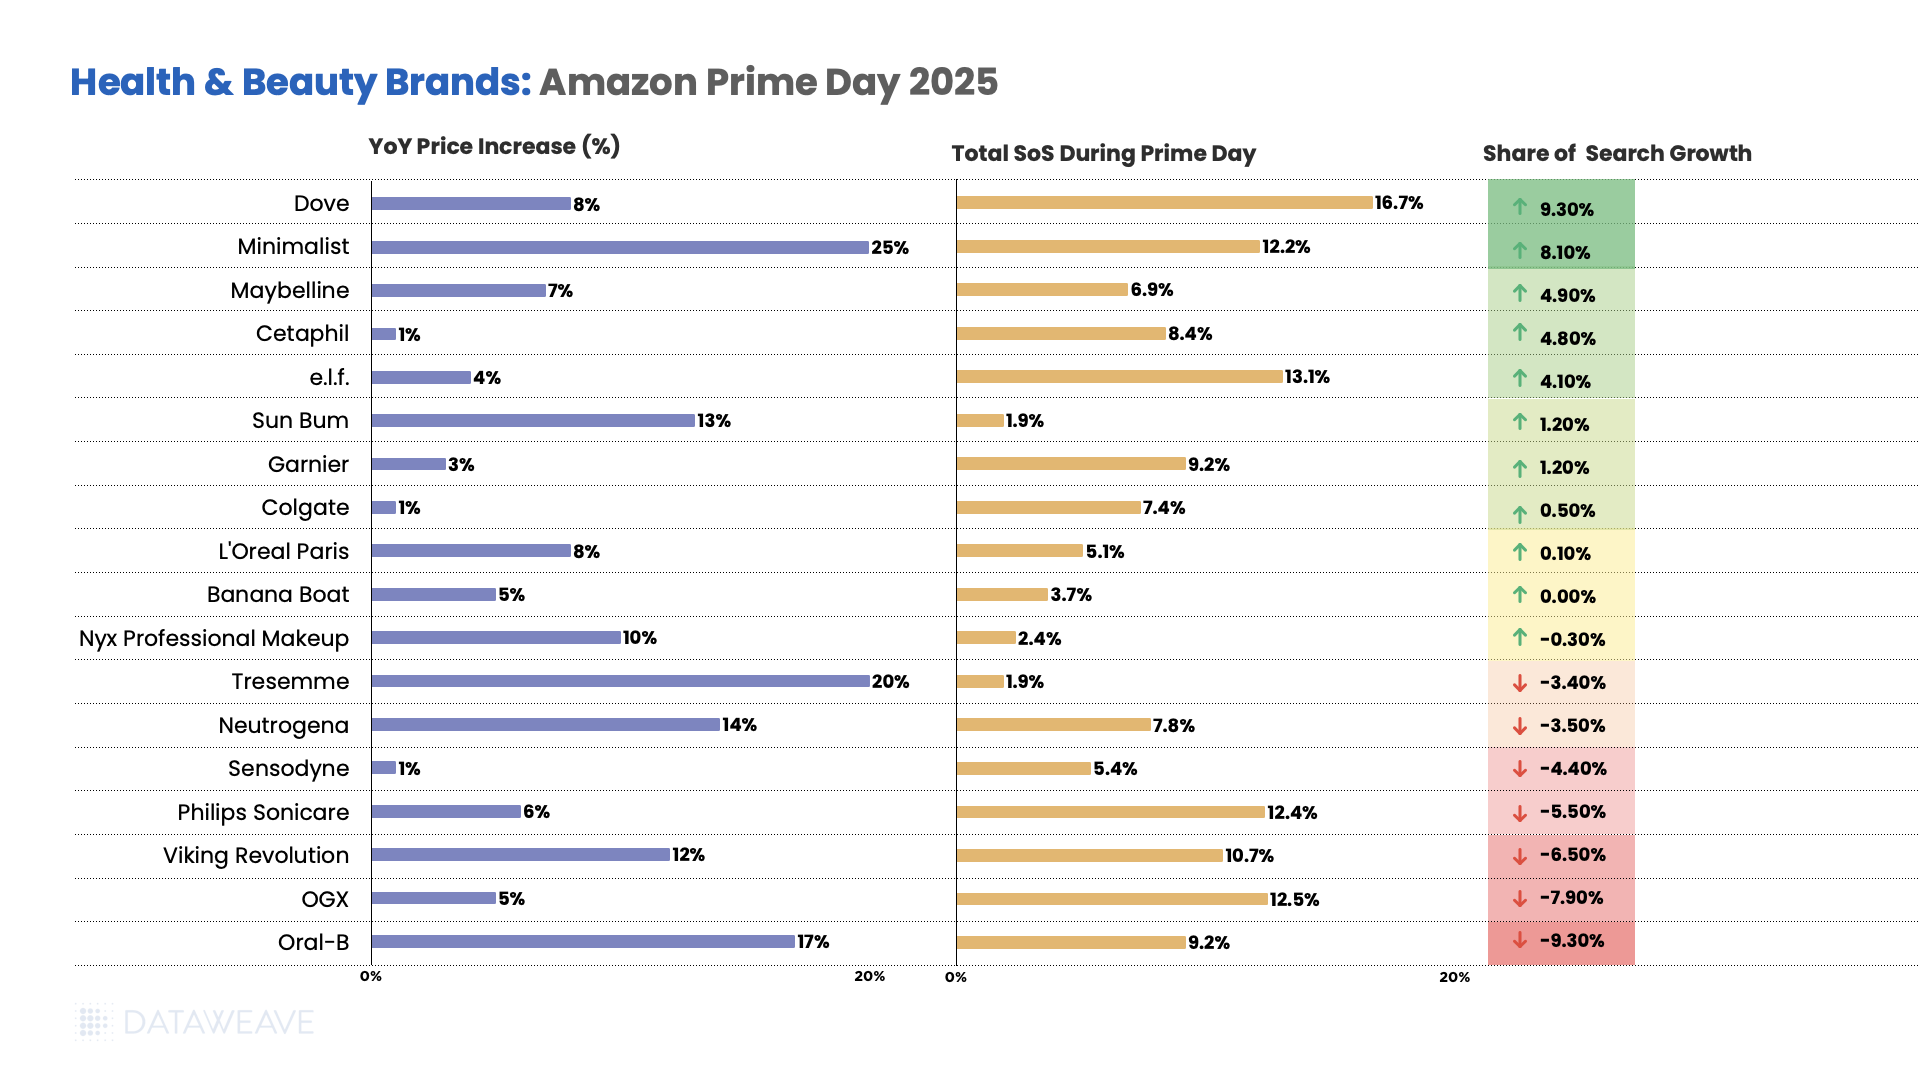
Minimalist saw prices increase 25% year-over-year, the highest in the category, followed by Tresemme at 20% and Oral-B at 17%.
Neutrogena increased pricing by 14%, while Sun Bum rose 13% and Viking Revolution 12%.
Nyx Professional Makeup saw price increases of 10%, Dove and L’Oréal Paris both at 8%, and Maybelline at 7%.
Value-positioned brands saw modest price increases, with Philips Sonicare (6%), OGX and Banana Boat (both 5%), e.l.f. (4%), and Garnier (3%).
Notably, Cetaphil, Colgate, and Sensodyne all kept increases to just 1%.
Dove led visibility gains with 9.3% growth along with 8% price increases. Minimalist achieved remarkable 8.1% growth even with the category’s highest 25% price increases, and Maybelline gained 4.9% share with 7% price increases.
Cetaphil improved by 4.8% with minimal 1% price increases, while e.l.f. gained 4.1% share with 4% price increases. However, several established brands lost share, with Oral-B declining most significantly by 9.3% along with 17% price increases, followed by OGX (-7.9%) with 5% price increases, Viking Revolution (-6.5%) with 12% increases, and Philips Sonicare (-5.5%) with 6% price increases.
In Conclusion
Prime Day 2025 underscores the shifting realities of retail, where persistent pricing pressures, evolving consumer behavior, and complex market forces are redefining how promotions are planned and executed. In this environment, success hinges on having the right intelligence at the right time, empowering brands to target promotions strategically, protect margins, and maintain visibility in a crowded marketplace.
As competition intensifies, the ability to anticipate trends and respond with precision will separate market leaders from the rest. At DataWeave, we equip retailers and brands with the insights needed to navigate these changes and make data-backed decisions that drive sustainable growth.
Stay connected to our blog for ongoing analysis of pricing, promotion, and visibility trends or reach out to us today to learn more.
Marketing analytics has evolved dramatically over the past decade, yet many brands still struggle to connect their marketing investments to real business outcomes. While traditional analytics platforms provide valuable historical insights, they often miss the critical external factors that drive consumer behavior in today’s fast-moving digital marketplace.
The challenge isn’t just about measuring what happened. It’s about understanding why it happened and predicting what comes next. This is where Digital Shelf Impact Modeling becomes essential for smarter marketing investments.
The Critical Data Gap In Marketing Analytics
Traditional marketing analytics expose brands to considerable risk, especially in the CPG and retail space. The fundamental challenge lies in their reliance on lagging indicators for essential metrics like historical sales and ad spend. Data inputs may be months or quarters old before they’re used for strategic decision-making.
That’s like making million-dollar marketing decisions while only looking in the rearview mirror when you need to watch the road ahead simultaneously.
Most marketing analytics tools also typically overlook external market factors that can dramatically impact performance. In today’s retail landscape, where market conditions change rapidly, being blind to real-time competitive dynamics creates significant vulnerability. Key external factors that traditional analytics fail to capture include:
In fact, opaque data integration and siloed insights remain substantial barriers to actionable intelligence from marketing analytics tools. Most critically, old school approaches often miss vital such variables influencing consumer behavior.
These blind spots must be addressed to unlock the full value of marketing analytics investments and make truly informed marketing decisions.
How Digital Shelf Impact Modeling Completes The Picture
This is where Digital Shelf Impact Modeling plays a complementary role. Brands leveraging digital shelf analytics gain insights into actual market dynamics that traditional analytics alone cannot provide. However, brands using digital shelf insights in isolation often struggle to quantify how digital shelf improvements directly impact revenue. Answering questions like “Did better product content drive sales, or was it the influencer campaign?” remains challenging.
Bridging these disconnected platforms requires intentional integration and a solution that can feed intensively cleaned and organized data into existing analytics frameworks. With the right data inputs, companies establish a powerful feedback loop for agile, data-driven decisions.
A comprehensive DSA solution like DataWeave provides granular, actionable data on critical external variables such as:
Daily or weekly competitor pricing movements and promotional activity
Product content standardization and optimization across retailers
Review sentiment trends and potential reputation issues
Share of search/shelf performance relative to competitors
When merged with established analytics capabilities, digital shelf impact modeling creates a complete picture that fills the blind spots holding marketing teams back from maximizing ROI.
The Digital Shelf Advantage in Retail Media
The popularity of retail media networks has further amplified the need for integrated digital shelf analytics approaches. These advertising platforms, operated by retailers, allow brands to display targeted ads to shoppers across digital properties based on first-party customer data and purchase insights.
The retail media revolution has transformed e-commerce pages into sophisticated search engines for product discovery. This evolution has been so impactful that retail media ad revenue surged 16.3% in 2023, reaching $43.7B in the U.S., with continued growth projected.
Major platforms like Walmart have expanded their retail media networks to capitalize on closed-loop attribution. Since retailers own the entire customer journey, they can track everything from ad impression to purchase on their e-commerce sites. This creates a significant advantage through accurate ROI measurement, unlike traditional advertising where attribution remains challenging.
How Digital Shelf Impact Modeling Enhances Retail Media Optimization
With retail media emerging as a top-performing sales channel, brands need sophisticated optimization strategies. Every brand wants to maximize visibility and performance across individual eCommerce sites, just as they optimize for Google or emerging AI platforms.
Integrating digital shelf analytics into marketing mix models enables brands to:
Allocate ad spend more intelligently using real-time competitive insights
Identify timely campaign activation opportunities in response to market changes
Monitor organic ranking trends to strategically time paid promotional activities
Measure true campaign impact on digital shelf performance metrics
For example, when a competitor launches an aggressive price drop in your category, Digital Shelf Impact Modeling provides immediate visibility into this change. This intelligence can trigger recommended campaign adjustments, such as increased sponsored ad bidding in affected categories. Traditional analytics alone cannot deliver this level of responsive optimization.
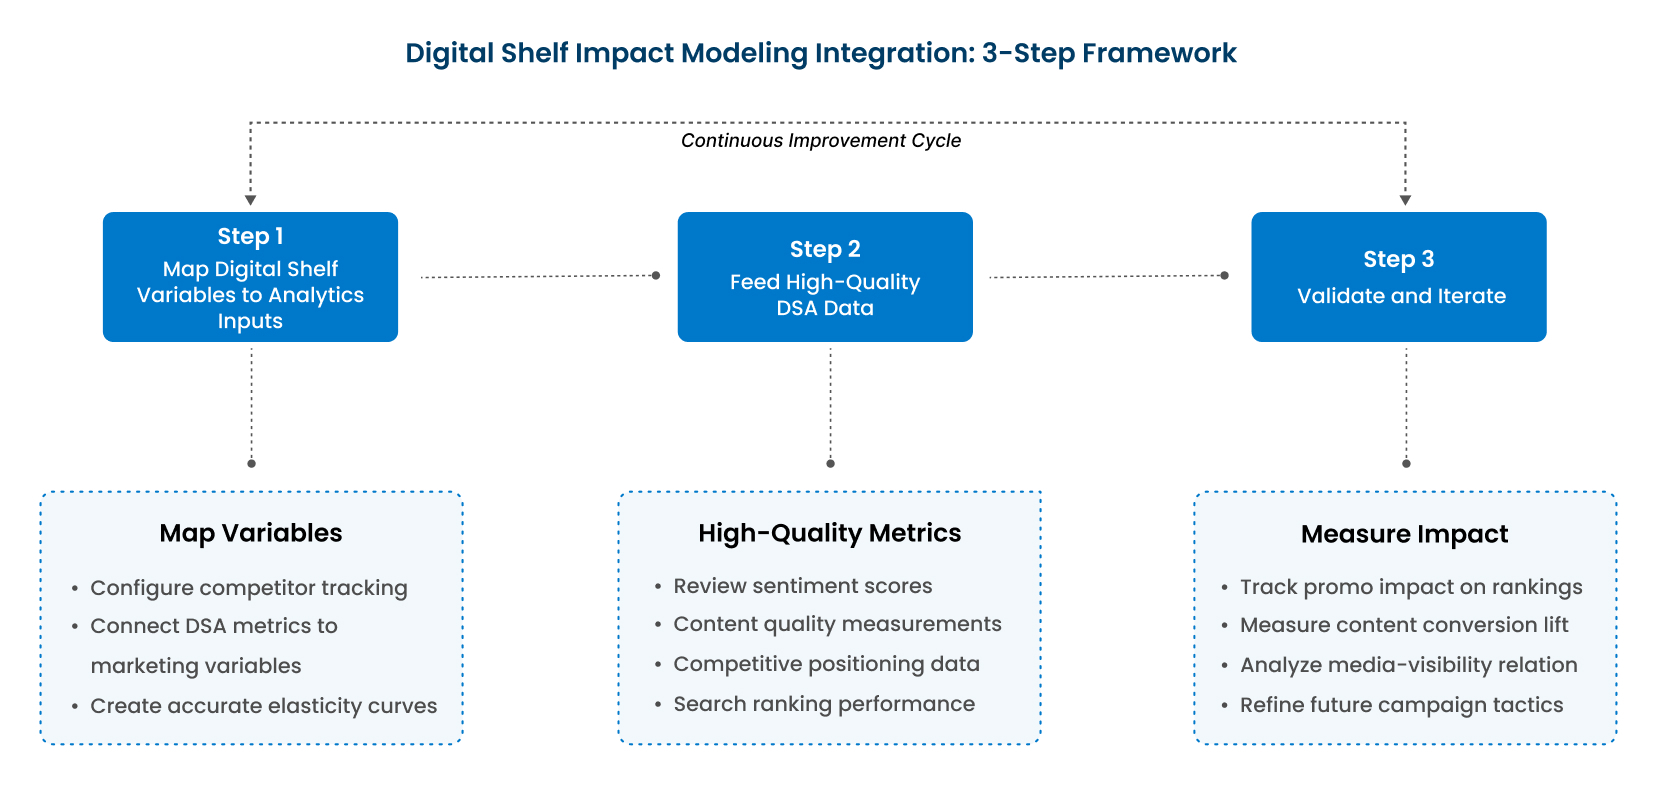
How to Integrate Digital Shelf Impact Modeling: A 3-Step Framework
Here’s how to integrate Digital Shelf Impact Modeling into your marketing strategy to start making better data-driven decisions for your brand.
Step 1: Map Digital Shelf Variables to Analytics Inputs
Begin by mapping specific digital shelf variables to your existing analytics inputs. Ensure that competitors are properly configured for monitoring in your digital shelf platform and that timely metrics like price changes and search ranking positions are linked with your marketing measurement systems.
This integration is crucial because traditional analytics rely exclusively on historical data for forecasting. Adding real-time inputs delivers several benefits:
More accurate elasticity curves reflecting current market conditions
Better understanding of root causes behind demand shifts
Prevention of misattributing sales changes to your marketing activities when external factors may be responsible
At DataWeave, our comprehensive coverage spans 500+ billion data points, 400,000 brands, and 1,500+ websites, ensuring brands never miss a competitor move and maintain complete visibility across the connected e-commerce landscape.
Step 2: Feed High-Quality Digital Shelf Data into Analytics Platforms
Next, integrate critical digital shelf metrics into your measurement framework:
Review and sentiment scores and trends
Content quality measurements
Competitive positioning data
Price gap analytics
Search ranking performance
DataWeave employs a rigorous data accuracy validation process to ensure teams work with the cleanest, most reliable data possible. Our sophisticated processing pipeline removes anomalies and standardizes information across retailers, providing the consistent, high-integrity data foundation that robust marketing mix modeling demands.
Step 3: Validate and Iterate
A powerful Digital Shelf Impact Modeling solution helps measure whether your marketing efforts achieved their intended impact on the digital shelf. Use your digital shelf platform to assess your campaigns’ actual effect on key performance indicators:
Do promo-driven sales lifts correlate with improved search rankings?
How do content improvements impact conversion rates?
What is the relationship between paid media and organic visibility?
It is no surprise to anyone that we are living through volatile times. Executives may be uncomfortable if they cannot provide their teams with strategic direction based on data or the tools they need to accelerate their workdays.
By integrating Digital Shelf Impact Modeling with existing analytics, companies gain early warning signals about market shifts, enabling smarter resource allocation during budget constraints. This integration helps organizations move from tactical execution to strategic direction by:
Providing cross-channel impact analysis to understand the full marketing ecosystem
Equipping category managers with tactical optimization tools that support broader strategic objectives
Identifying competitive threats before they impact sales
Forecasting potential ROI impacts across various spending scenarios
These capabilities help prevent wasted ad spend, missed opportunities, and lost sales.
Future-Proofing Your Marketing Strategy with Digital Shelf Impact Modeling
Several emerging trends highlight the growing importance of digital shelf-enhanced marketing analytics:
Trend 1: Navigating Economic Volatility – Brands can use Digital Shelf Impact Modeling to track how competitors adjust pricing in response to cost shocks like tariffs and inflation. This real-time intelligence directly improves demand forecasting accuracy.
Trend 2: AI-Powered Predictive Insights – Combining digital shelf trend detection (such as viral product reviews or sudden inventory fluctuations) with marketing performance metrics helps forecast demand spikes from otherwise unforeseen events.
Trend 3: Automated Optimization – Smart campaign activations and adjustments based on real-time digital shelf triggers drive efficiency. DataWeave’s vision includes an automated retail media intelligence layer that optimizes spend across channels based on integrated insights.
DataWeave’s Unique Advantage
At DataWeave, we’ve seen our digital shelf analytics customers significantly improve their organic search rankings because of better-sponsored ad campaigns. What makes DataWeave’s approach to Digital Shelf Impact Modeling uniquely powerful? Our platform is specifically designed to address the challenges of modern marketing measurement:
Superior data refresh rates ensure timely insights when they matter most
Unmatched marketplace coverage across more than 1,500 eCommerce sites globally
Advanced data normalization that standardizes metrics across disparate categories and retailers
API-first architecture enabling flexible data access and utilization
Conclusion – From Hindsight to Foresight
In the past, companies relied primarily on historical data for their marketing analytics. Today’s market leaders are incorporating Digital Shelf Impact Modeling to unlock superior insights, improve decision accuracy, and drive measurable ROI.
DataWeave serves as the essential bridge between traditional analytics systems and real-time, comprehensive market intelligence. When digital shelf analytics and marketing measurement work together, brands gain a complete picture: traditional analytics show precisely what happened, while Digital Shelf Impact Modeling explains why it happened. Together, they reveal what’s coming next.
Ready to transform your marketing analytics from hindsight to foresight? Contact us today to discover how our Digital Shelf Analytics can enhance your existing marketing investments and drive measurable business results.
Back in the day, pricing strategies were a lot easier. These days, not only do teams need to have robust standard price reporting workflows, but they also need to have the know-how and tools to gain and act on competitive intelligence. Retail leaders should prioritize automation and strategic thinking and ensure their teams have the tools, processes, and methodologies required to monitor the competition at scale and over the long term.
Retail leaders who recognize the distinction between standard reporting and competitive intelligence are more likely to gain team buy-in, especially when developing pricing strategies that drive results. You can’t be everywhere at once, but you can optimize pricing strategies to stay ahead of the competition.
This article has everything you need to know about the differences between standard reporting and competitive intelligence and how to use both to make your teams more effective than ever!
Understanding the Distinction
Standard price reporting is much like checking the weather to see if it’s stormy before grabbing a raincoat or sunhat. You need to do it to make essential, everyday choices, but it will not help you predict when the next storm is coming. Standard price reporting deals more with the short-term and immediate actions needed as opposed to long-term strategy.
Don’t get us wrong, standard price reporting is still an essential responsibility of a pricing team’s function—but there’s more to it. It is also lower-tech than a competitive intelligence strategy and can rely on route heuristics.
Think of it as data-in, data-out. It deals with pricing operations like:
Weekly price movements: Seeing which competitors, product categories, and individual items had pricing shifts in the short-term
Basic price indices: Outlining benchmarks to watch how your own, and your competitors’, products are trending in the market
Price competitiveness metrics: Setting thresholds that show whether your products are priced below, above, or equal to your competition for general trend reporting
Standard price reporting is fundamental for operational teams that manage price adjustments in the short term. It can also help teams remain agile and reactive to market condition changes.
It’s likely that your team already has standard reporting strategies or tools to help them with tactical execution. But are they harnessing competitive intelligence correctly with your help?
Characteristics of Competitive Intelligence
While standard price reporting is like checking the weather, competitive intelligence is like being a meteorologist who measures atmospheric changes, predicts storms, and scientifically analyzes weather patterns to keep everyone informed and in the know.
Competitive intelligence goes well beyond simply tracking price movements and benchmarking them against a single set of standards. Competitive intelligence helps steer teams in a strategic direction based on insights from the market. It can drive long-term business success and is one of your best tools to ‘steer the ship’ as a retail leader.
Here are some of the essential elements of competitive intelligence:
Strategic insights: Including but not limited to understanding your competitors’ pricing strategy, promotions, and product positioning
Market-wide patterns: Identifying trends based on geography, product category, or individual SKU across retailers to inform broader strategies
Long-term trends: Taking historical market and competitor data and combining it with real-time retail data to predict future price movements as shifts in consumer behavior to inform pricing strategies
The pricing team serves as a critical strategic partner to senior leadership, delivering the cross-functional insights and market analysis needed to inform C-suite decision-making. By equipping executives with a holistic view of the competitive landscape, pricing gaps, and emerging trends, the team empowers leadership to align pricing strategies with broader business objectives.
This partnership enables senior leaders to guide day-to-day pricing operations with confidence—ensuring tactical execution aligns with corporate goals, monitoring strategy effectiveness, and maintaining competitive agility. Through ongoing market intelligence and scenario modeling, the pricing function helps leadership proactively position the brand, capitalize on untapped opportunities, and future-proof revenue streams.
Different Audiences, Different Needs
As mentioned, there is a place for both standard price reporting and competitive intelligence. They have different roles to play, and different teams find them valuable. Since standard reporting mainly focuses on day-to-day shifts and being able to react to real-time changes, operational teams find it most useful.
On the other hand, competitive intelligence is a tool that leadership can use to shape overarching pricing strategies. The insights from competitive intelligence drive operational activities over months and quarters, whereas standard reporting drives actions daily.
To succeed in pricing, you need to rely on a combination of tactical standard reporting and competitive intelligence for long-term planning. With both, you can successfully navigate the ever-fluctuating retail market.
Price Reporting for Operational Teams
Your operational team is responsible for making pricing adjustments that directly impact sales volume. Automated data aggregation and AI-powered analytics can make this process faster and more accurate by eliminating the need for manual intervention.
Instead of spending hours identifying changes, standard reporting tools surface the most critical areas that need attention and recommend adjustments. This helps operational teams react fast to shifting market conditions.
Key functions of standard price reporting include:
Daily/weekly pricing decisions: Frequent price adjustments based on market trends will help your company remain competitive across entire product categories. With automated, real-time dashboards, your pricing team can monitor broad category-level pricing shifts and make necessary adjustments accordingly.
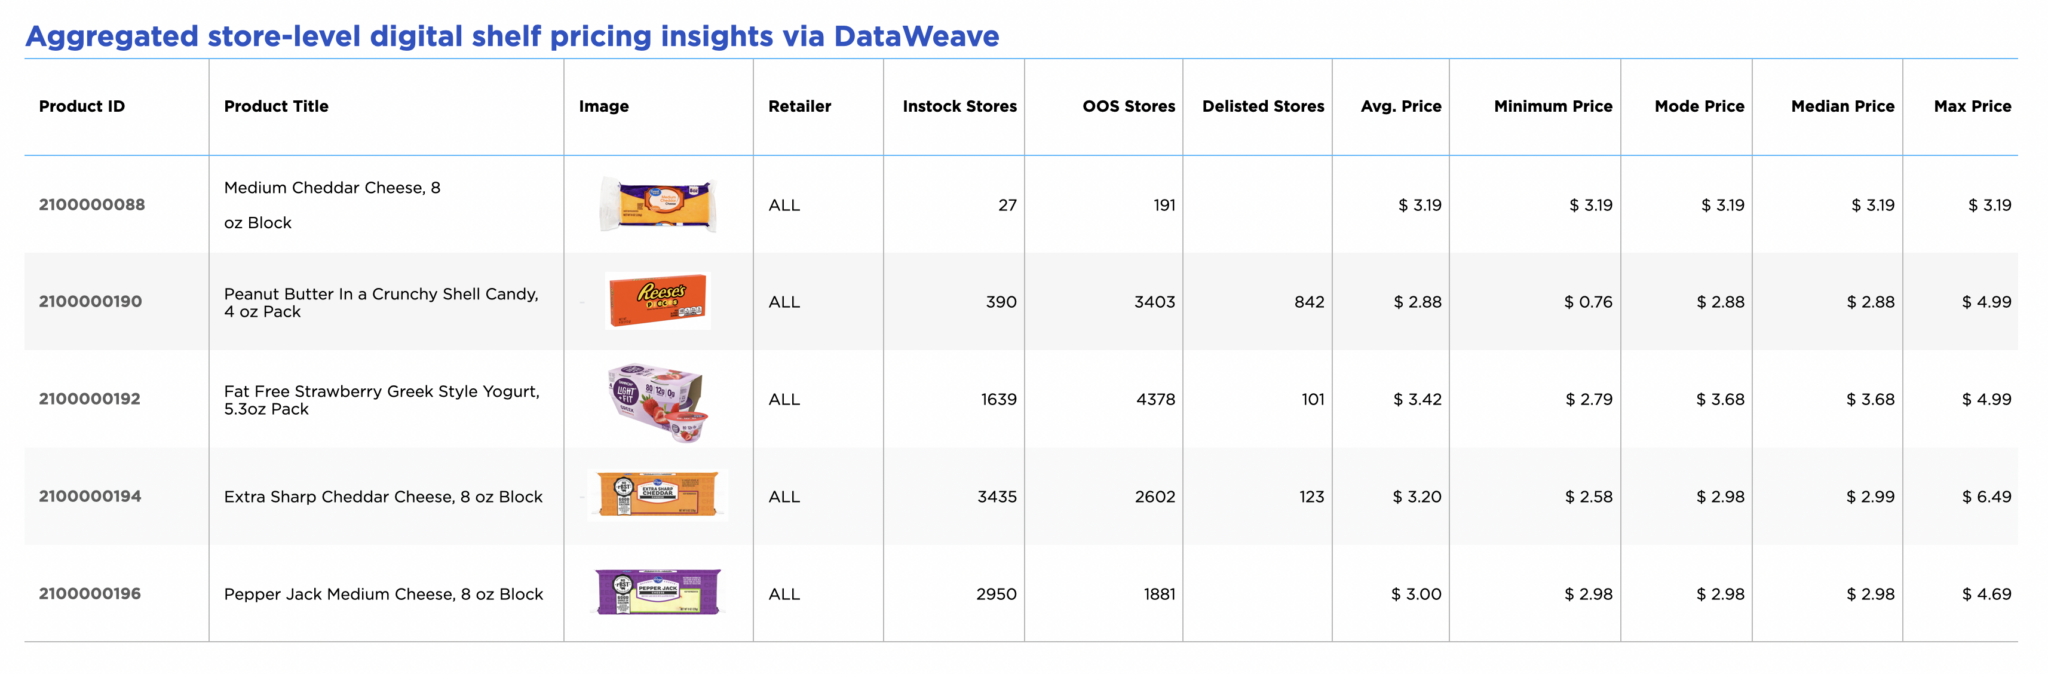
Individual SKU management: Not all pricing changes happen at the category level. Standard reporting also allows teams to view price and promotion changes on individual SKUs down to the zip code. It’s important to have targeted, granular insights when a change occurs even on a single SKU, especially because these individual changes are easy to miss. Advanced product matching algorithms can tie together exact products across retailers to monitor items conjointly. By incorporating similar product matching technologies beyond standard reporting, your teams can monitor individual price changes on comparable products.
Immediate action items: The best standard reporting tools alert pricing teams when there has been a change in competitor pricing and give them recommendations for what to change. If a competitor launches a flash sale or an aggressive discount program, your team should know as fast as possible which product to adjust. Without this functionality, teams can miss important changes or experience a delay in action that results in lost sales or customer perception.
Competitive Intelligence for Leadership
For Senior Retail Executives, Category Directors, and Pricing Strategy Leaders, pricing cannot only be about reacting to individual competitor price changes. Instead, you must proactively think about your market positioning and brand perception. Doing this without a complete competitive intelligence strategy can feel like throwing darts while blindfolded. Sometimes, you’ll hit the target, but mostly, you’ll miss or only come close. Competitive intelligence tools can help you hit that target every time. They leverage big data, artificial intelligence (AI), and predictive modeling to help you derive holistic insights to understand your current positioning relative to the current and future pricing landscape.
Core strategic functions of competitive intelligence include:
Strategic planning: Competitive intelligence tools can help you forecast competitor behavior, economic shifts, and category-specific patterns you’d otherwise overlook (ex, price drops before new releases, subscription or bundling trends, or seasonable price cycles). Instead of reacting to a change, your team can already have made changes or at least know what playbook to implement.
Market positioning: Geographic pricing intelligence built into competitive intelligence tools can help you understand variations across locations and optimize multiple channels simultaneously. This can be the foundation of regional pricing strategies that factor in local economies and consumer perception.
Long-term decision-making: You can use competitive intelligence technology to align your pricing strategy with upcoming seasonal trends isolated using historical data, predicted economic shifts, and changes in customer purchasing behavior. This aggregate view of the pricing landscape will help you step out of the weeds and make better company decisions.
From Data to Strategy – Transforming Basic Price Data
Shifting your focus from isolated, reactive data to broader market trends is the key to going from basic price reporting to real competitive intelligence. Never forget the importance of real-time data, but know it’s your responsibility as a leader to bring a broader viewpoint to operations.
Transforming from basic price data to competitive intelligence involves:
Harnessing the data
Pattern recognition: Your solution should help you identify repeat pricing behaviors and competitor strategies
Figuring out what to do with the data
Strategic implications: It should help you understand how your pricing changes will affect customer perception of your brand
Doing something with the insights from your data
Action planning: The solution should help you create proactive strategies that position you as a market leader, leaving your competition to try to keep up with you instead of vice versa
Leveraging Technology for Competitive Intelligence
Technology is at the heart of leveling up your standard price reporting game. If you want industry-leading competitive intelligence, you can leverage DataWeave’s comprehensive pricing intelligence solution with built-in competitive intelligence capabilities and features for your operational teams.
You can also uncover gaps and stay competitive in the dynamic world of eCommerce. It provides brands with the competitive intelligence they need to promptly adapt to market demand and competitors’ pricing. Stay ahead of market shifts by configuring your own alerts for price fluctuations on important SKUs, categories, or brands, all time-stamped and down to the zip.
And since our platform relies on human-backed AI technology, you can have complete confidence in your data’s accuracy at any scale. If you want to bring a new strategic mindset to your pricing team, consider adding competitive intelligence to your tech stack. If you want to learn more, connect with our team at DataWeave today.
The power to impose tariffs on foreign countries is one of the most impactful measures a government has at their disposal. The government can use this power for various reasons: to punish rivals, equalize trade, give domestic products a comparative advantage, or collect more funds for the federal government.
Whatever the reason, tariffs have real-world impacts on brands and retailers selling in a global economy. They effectively make products more expensive for some and comparatively cheaper for others. Since tariffs can be added or removed at the drop of a hat, retail executives, category managers, and pricing teams trying to keep up have their work cut out for them.
You’ve come to the right place if you’re wondering how to prepare for and respond to potential tariffs. The answer lies in technology that will make you flexible when you need to react to policy changes. Establishing workflows and processes embedded with pricing intelligence can help you stay competitive even when global politics intercepts your business.
Understanding Tariff Impact
Before diving into tariffs’ implications on pricing strategies, we need to understand how tariffs work and the current economic environment. Tariffs are a government’s tax on products a foreign country sells to domestic buyers. You might remember President Trump’s expanded tariff policy in September 2018. It placed a 10% tax on $200 billion worth of Chinese imports for three months before raising to a rate of 25% in January 2019. At that time, an American buyer would pay the original price of the goods plus the tax to the American government. Many additional tariffs and counter-tariffs by other countries were enacted during Trump’s first term in office, including the European Union, Canada, Mexico, Brazil, and Argentina, resulting in a trade war.
Announcements of when, where, and on what new tariffs will be imposed are unpredictable. The only predictable thing is that this type of market volatility is here to stay. Pricing teams should adjust their mindsets to assume that volatility may always be on the horizon. This is because tariffs have many cost implications. Besides the flat rate imposed by the government on a certain product, tariffs have historically raised the price of all goods.
In economic terms, tariffs create a multiplier effect. Consider a tariff placed on gasoline imported from Canada. This measure may encourage American drilling but will have immediate ripple effects throughout the economy. Everything that relies on ground transportation will increase in price, at least in the short term.
This means that a fashion brand that sources and manufactures its entire line domestically will incur more costs since transportation will be more expensive. If fashion companies act like most companies, they will pass that added tax burden on to the consumer through higher prices. The company will make this decision based on how sensitive its consumers are to price increases, i.e., the elasticity of demand. These interwoven relationships extend across industries and products, affecting most retailers somehow.
Of course, category exposure varies by industry and sector. Tariffs are known to impact specific industries more than others. For example, steel, electronics, and agriculture products are at risk of price fluctuations based on their reliance on imported components. These have high category exposure. Some industries reliant on domestic production with stable input costs are less prone to category exposure. These include domestic power grids, natural gas, real estate, and handmade goods. No matter which industry you’re in, however, expect some spill over.
Preparation Strategies
Forward-thinking leaders can help position their teams for success in the face of pricing volatility brought on by tariffs. The key is to enable teams to sense disruptions quickly and provide a way to take corrective action that doesn’t diminish sales. Here are three strategies you can implement ahead of time that will help keep you competitive during tariff disruption.
Cost Monitoring
Start by getting a firm handle on internal and external costs. Understand and analyze fluctuations in the cost of raw materials, production, and supply chain for your business to operate. Make sure that your products are priced with pre-defined logic so changes in price on one SKU don’t create confusion with another. For example, faux leather costs rise while genuine leather stays the same. In that case, a leather version of a product should be raised to reflect the price increase in the pleather variation, not to devalue the perception of luxury.
Next, you will want to understand historical pricing trends as well as pricing indexes across your categories. These insights can help your teams anticipate cost fluctuations before they even arise and mitigate the risk that economic shifts create, even unexpected tariffs.
Competition Tracking
Tracking your competition is likely already a strategy you have in mind. But how well are your teams executing this important task? If they’re trying to watch for market shifts and adjust pricing in real time without the help of technology, things are likely slipping through the cracks.
Competitive intelligence solutions help retailers discover all competitive SKUs across the e-commerce market, monitor for real-time pricing shifts, and take action to mitigate risk. You need an “always-on” competitive pricing strategy now so that the second a tariff is announced, you can see how it’s affecting your market. This way, you can maintain price competitiveness and avoid margin erosion when competitors’ pricing changes in response to a tariff or other market shift.
Consumer Impact Assessment
The multiplier effect is felt throughout the supply chain when tariffs are implemented. The effect can affect consumers in a number of ways and cause them to become spending averse in certain areas. Often, during times of economic hardship, grocery items remain relatively inelastic. This is because consumers continue to purchase essentials regardless of price changes. Conversely, the price of eating out or home delivery becomes more elastic since consumers cut back on dining expenses when costs rise across their shopping basket.
You need to establish clear visibility into the results of your pricing changes. The goal should be to monitor progress and measure the ROI on specific and broad pricing changes across your assortment. Conducting market share impact analysis will also help you determine if you are losing out on potential customers or whether a decline in sales is being felt across your competition. Impact analysis tools can help your company check actual deployed price changes in real time.
Response Framework
Once you’ve prepared your team with strategies and technologies to set them up for success, it’s time to think about what to do once a tariff is announced or implemented. Here are three real-time decision-making strategies you should consider before your feet are to the fire. Having these in your back pocket will help you avoid financial disruption.
Price Adjustment Strategies
Think about how you strategically adjust prices. These could include percentage increases, flat rate increases, or absorbed via other strategies like bundling. You should also determine a cost increase threshold that you’re willing to absorb before raising prices. Think about the importance of remaining price attractive to consumers and weigh the risk of increasing prices past consumers’ ability or willingness to pay.
Promotion Planning
Folding increased costs into value-added offerings for consumers can be a good way to retain customer sentiment and sales volume without negatively affecting profit margins. You can leverage discounts, promotions, or bundling options to sell more of an item to a customer at a lower per-unit cost.
What you don’t want to do is panic-adjust prices in response to tariffs of competitor moves. Instead, you can use a tool competitor intelligence solutions to watch if your competition is holding prices steady or adjusting. With full information about pricing at your disposal, you can make better decisions on your promotional strategy and not undercut yourself or lose customer loyalty.
Alternative Sourcing
Let’s face it: putting all your eggs in one basket is bad for business. Instead of relying solely on a single supplier for production, you should have a diverse set of suppliers ready and able to shift production when tariffs are announced. If a tariff impacts Chinese exports, having a backup supplier in Vietnam can prevent added costs entirely. You can also consider strategies like bulk pricing, set pricing, or shifting entirely to domestic suppliers.
Forward Buying
Proactively stockpile inventory by purchasing large quantities of at-risk products before tariffs take effect. This strategy locks in lower costs and ensures supply continuity during disruptions. However, balance this with careful demand forecasting to avoid overstocking, which ties up cash flow and incurs storage costs. Use historical sales data and tariff implementation timelines to optimize order volumes—this is especially effective for products with stable demand or long shelf lives.
Market Intelligence Requirements
Preparing your pricing teams and giving them a framework upon which to act when tariffs are announced doesn’t have to be complicated. You can get access to the right data on costs, competitors, and consumer behavior with DataWeave’s pricing intelligence capability.
We provide retailers with insights on pricing trends, category exposure, and competitor adjustments. Our AI-powered competitor intelligence solutions allow you to get timely alerts whenever a significant change happens. This can include changes to competitor pricing and category-level shifts that you’d otherwise react to when it’s too late.
These automated insights can also help you track historical pricing trends, elasticity, and margin impact to construct a clear response framework in an emergency. Additionally, our analytics capabilities can help you identify patterns to power pre-emptive pricing and promotional strategies.
Getting the right pricing intelligence strategy in place now can prevent disaster later. Think through your preparedness strategy and how you want your teams to respond in the event of a new tariff, and consider how much easier reacting accurately would be with all the data needed at your fingertips. Reach out to us to know more.
Do you remember when the movie Super Size Me came out? If you missed it, it was about the harmful effects of eating fast food too often. One aspect of the film that stands out is McDonald’s clever use of pricing to encourage consumers to buy bigger—and therefore more expensive—meals.
Hungry patrons could upgrade their meal to a Super Size version for only a few cents more. In doing so, McDonald’s was able to capitalize on perceived value, i.e., getting more product for an apparent lower total price for the volume. It encouraged restaurant-goers to spend a little more while feeling like they got a great deal. It was a smart use of strategic pricing.
There are hundreds of pricing relationship types like this one that pricing leaders need to be aware of and can use to their advantage when creating their team’s pricing strategy and workflows. You need to maintain profitable and logical price relationships across your entire product portfolio while keeping up with the competition. After all, the gimmick to Super Size would never have worked if the upgrade had been of less value than just buying another burger, for example.
In this article, we’ll examine more real-world examples of pricing challenges so you can consider the best ways to manage complex price relationships. We’ll examine things like package sizes, brands, and product lines and how they’re intertwined in systematic price relationship management. Read on to learn how to prevent margin erosion, improve customer perception of your brand, and keep your pricing consistent and competitive.
The Price Relationship Challenge
Pricing is one of the most challenging aspects of managing a retail brand. This is especially true if you are dealing with a large assortment of products, including private label items, the same products of differing sizes, and hundreds, or even thousands, of competing products to link. Inconsistencies in your price relationship management can confuse customers, erode trust, and harm your bottom line.
Let’s take a look at a few common pitfalls in portfolio pricing that you might run into in real life to better understand the impact on customer perception, trust, and sales.
Private Label vs. Premium Product Pricing
Let’s consider a nuanced scenario where price relationships between a retailer’s private label and premium branded products create an unexpected customer perception. Imagine you’re in a supermarket, comparing prices on peanut butter. You’ve always opted for the store’s private-label brand, “Best Choice,” because it’s typically the more affordable option. Here’s what you find:
Best Choice (Private Label) 16 oz – $3.50
Jif (National Brand) 16 oz – $3.25
At first glance, this pricing feels off—shouldn’t the private label be the cheaper option? If a customer has been conditioned to expect savings with private-label products, seeing a national brand undercut that price could make them pause. This kind of pricing misalignment can erode trust in private-label value and even push customers toward the national brand. When price relationships don’t follow consumer expectations, they create friction in the shopping experience and may lead to lost sales for the retailer’s own brand.
Value Size Relationships
A strong value-size relationship ensures that customers receive logical pricing as they move between different sizes of the same product. When this relationship is misaligned, customers may feel confused or misled, which can lead to lost sales and eroded trust.
Let’s look at a real-world example using a well-known branded product—salad dressing. Imagine you’re shopping for Hidden Valley Ranch (HVR) dressing and see the following pricing on the shelf:
HVR 16 oz – $3.99
HVR 24 oz – $6.49
HVR 36 oz – $8.99
At first glance, you might assume that buying a larger size offers better value. However, a quick calculation shows that the price per ounce actually increases with size:
16 oz = $0.25 per ounce
24 oz = $0.27 per ounce
36 oz = $0.25 per ounce
Customers expecting a discount for buying in bulk may feel misled or frustrated when they realize the mid-size option (24 oz) is actually the most expensive per ounce. This mispricing could drive shoppers to purchase the smallest size instead of the intended larger, more profitable unit—or worse, lead them to a competitor with clearer pricing structures.
Retailers must maintain logical price progression by ensuring that price per unit decreases as the product size increases. This not only improves customer trust but also encourages higher-volume purchases, driving profitability while maintaining a fair value perception.
Price Link Relationships
A well-structured price link relationship ensures customers can easily compare similar offerings of the same product and size. When the pricing across different versions or variations of the same item isn’t clear or consistent, it can confuse customers and damage trust, ultimately leading to missed sales and a negative brand perception.
Let’s break this down with an example of a popular product—coffee. Imagine you’re shopping for a bag of Starbucks coffee and you see the following pricing on the shelf:
Starbucks Classic Coffee, 12 oz – $7.99
Starbucks Coffee, Mocha, 12 oz – $9.99
Starbucks Ground Coffee, Pumpkin Spice, 12 oz – $12.99
At first glance, the product is the same size (12 oz) across all options, but the prices vary significantly. One might assume that the price difference is due to differences in quality or features, but what if there’s no clear indication of why the different flavors are priced higher than the standard?
After investigating, you may realize that the only differences are related to different variants—like “Mocha” or “Pumpkin Spice” rather than any significant changes in the product’s core attributes. When customers realize they’re paying a premium for just different flavors, without any tangible difference in product quality, it can lead to feelings of confusion and frustration.
Retailers must ensure that price links between similar offerings are justifiable by clearly communicating what differentiates each product. This avoids the perception that customers are being charged extra for little added value, building trust and encouraging repeat purchases. By maintaining transparent price link relationships, businesses can foster customer loyalty, increase sales, and drive better overall satisfaction.
What is the Foundational Process to Tackle the Price Relationship Challenge?
Now that we’ve reviewed several challenges brands face when pricing their products, what can be done about them?
If you’re a pricing leader, you must create a robust pricing strategy that considers customer expectations, competitive data, sizing, and the overall value progressions of your product assortment. These are the three foundational steps to solve your price relationship challenges.
First, you need to group products together accurately.
Second, you need to establish price management rules around the group of related items.
Third, you should set in place a process to review your assortment each week to see if anything is out of tolerance.
This process is difficult, if not impossible, to manage manually. To effectively set up and execute these steps, you’ll need the help of an advanced pricing intelligence system.
Implementation Strategy
Want to know how to roll out a price relationship management strategy? Follow this implementation strategy for a practical way to get started.
Set up price relationship rules: Determine which of your products go together, such as same products with different sizes or color options. Assign different product assortment groups and determine tolerances for scaling prices based on volume or unit counts.
Monitoring and maintenance: Establish rules to alert the appropriate party when something is out of tolerance or a price change has been discovered with a competitive product.
Exception management: Only spend time actioning the exceptions instead of pouring through clean data each week, looking for discrepancies. This will save your team time and help address the most significant opportunities first.
Change management considerations: Think about the current processes you have in place. How will this affect the individuals on your team who have managed pricing operations? Establish a methodology for rolling this new strategy and technology out over select product assortments or brands one at a time to build trust with internal players.
DataWeave offers features specifically built to help pricing teams manage pricing strategies. These applications can help you optimize profit margins and improve your overall market positioning for long-term success. A concerted effort to create brand hierarchies within your own product assortment from the get-go, followed by routine monitoring and real-time updates, can make all the difference in your pricing efforts.
Within DataWeave, you can create price links between your products (value sizing) and those of the competition. These will alert you to exceptions when discrepancies are discovered outside your established tolerance levels. If a linked set of your products in different sizes shows inconsistent pricing based on scaled volumes, your team can quickly know how to make changes. If a competitor’s price drops significantly, you can react to that change before you lose sales.
DataWeave even offers AI-driven similar product matching capabilities, which can help you manage pricing for private label products by finding and analyzing similar products across the market.
Black Friday and Cyber Monday are major retail events in Canada, with 43% and 29% of the population making purchases during these sales respectively, according to a YouGov report. Consumer electronics continue to lead the Canadian retail market during these events, with 55% of surveyed shoppers choosing to buy tech products on Black Friday. Household appliances come in second, with 25% of shoppers opting for these items, while 18% prefer to shop for furniture deals.
These statistics highlight the importance of delivering value during the Thanksgiving sales week. Retailers must cater to shoppers’ expectations with competitive pricing, attractive deals, and a seamless shopping experience. So, what unique offerings did Canadian retailers present to shoppers this season?
To understand the pricing and discount dynamics during BFCM 2024 in Canada, DataWeave analyzed discounts across leading consumer electronics and home & furniture retailers. Using our AI-powered pricing intelligence platform, we analyzed 37,108 SKUs across these categories for major retailers including Amazon, Walmart, Best Buy, Home Depot, and Canadian Tire from the 10th to 29th November. We focused on the top 500 products ranked for each search keyword on each retail site, using targeted terms aligned with categories like “sofa” and “wearables”.
In the following insights, the Absolute Discount represents the reduction of the selling price compared to the Manufacturer’s Suggested Retail Price (MSRP). The Additional Discount reflects how much lower the selling price is during Black Friday compared to its price a week before the sale. This metric reveals the actual or effective value of the sale event, beyond the standard discounts typically offered.
Consumer electronics saw robust participation from major retailers, with Amazon, Best Buy, and Walmart leading the charge. Here’s how they stacked up in terms of discounts:
Best Buy emerged as the frontrunner in absolute discounts at 31.2%, while Amazon impressed with a notable 19.7% additional discount, indicating a strong Black Friday-specific markdown strategy.
Walmart offered steady competition, particularly in audio and video products, which reached an average absolute discount of 37.2%. However, it’s average additional discount was only 3.1%, indicating muted BFCM-specific price reductions in this category.
Subcategory Insights
Diving deeper into consumer electronics subcategories, we observed varied discounting strategies.
Audio & Video stood out as the most discounted subcategory, with Walmart leading at 37.2%.
In Wearables, Walmart again took the top spot with 36.4%, while Amazon offered higher additional discounts (22.4%).
Discounting for computers and gaming was less aggressive, highlighting strategic pricing to maintain profitability in these high-demand segments.
Brand Performance
Brand-level data highlighted how key players used Black Friday to drive visibility and sales.
Dell led in average absolute discounts (36.7%) followed by Samsung at 36.68%
Audio brand JBL offered significant absolute discounts at 35.9%.
Apple and Lenovo offered comparatively fewer discounts but maintained strong visibility, as seen in their increase in the Share of Search during the sale period.
MSI (laptop brand) and Bose (audio and earphone brand) experienced significant increases in visibility, with Share of Search increases of 5% and 3.6%, respectively.
Notably, HP faced a decline (-3.2%) in the Share of Search, suggesting missed opportunities to align promotions with consumer interest.
Home & Furniture
Retailers in Focus
The home and furniture category saw competitive discounting, with Walmart, Canadian Tire, and Home Depot vying for consumer attention.
Walmart took the lead with the highest absolute discounts at 36.8%. The retailer’s additional discounts were more conservative at 3.6%. This is similar to their discount levels in Consumer Electronics.
Canadian Tire offered stiff competition, providing 31.6% absolute discounts and 25% additional discounts.
Home Depot matched its absolute and additional discounts, maintaining consistency at 24.1%.
Subcategory Insights
Home and furniture subcategories revealed targeted discount strategies.
Bedding emerged as the most discounted subcategory at Walmart (50.6%) and Canadian Tire (35.3%).
Kitchenware saw competitive pricing, with Walmart leading at 42.9%, followed by Canadian Tire at 33.9%.
Canadian Tire focused on lighting, offering the highest absolute discounts in this subcategory (38.2%)
Brand Performance
Brand-level analysis revealed stark contrasts in discounting approaches.
Furniture brands Homcom led in absolute discounts (36.4%), while South Shore stood out with the highest additional discounts (30.2%).
Value-oriented brands like furnishings brand Mainstays and mattress and bedding brand Zinus offered more modest discounts, focusing on consistent affordability.
Zinus (mattresses and sofa brand) experienced a significant 7.9% increase in the Share of Search, driven by aggressive promotions.
Home furnishings brands like Costway and Safavieh faced declines, reflecting the importance of aligning promotional strategies with consumer expectations.
Insights for Retailers and Brands
This Black Friday, Canadian retailers effectively balanced deep discounts with category-specific strategies to maximize sales. However, the fluctuating Share of Search highlights the critical need for brands to align promotions with consumer interest.
For brands and retailers looking to stay ahead of the competition, DataWeave’s pricing intelligence platform offers unparalleled insights to refine discounting strategies and boost visibility. Contact us to learn how we can help you stay competitive in this dynamic retail landscape.
Americans spent a whopping total of $10.8 billion online this Black Friday. As Thanksgiving Week 2024 wraps up, one thing is clear: the consumer electronics category continues to dominate seasonal shopping trends. Fueled by a blend of enticing deals and high consumer demand, the sector delivered competitive discounts across subcategories like wearables, gaming, and mobile devices.
At DataWeave, we analyzed discounting trends in the U.S. consumer electronics market during this year’s sales events. Using our AI-powered pricing intelligence platform, we tracked pricing and promotions for 22383 SKUs across Amazon, Walmart, Target, and Best Buy from November 10 to 29. We focused on the top 500 products ranked for each search keyword on each retail site, using targeted terms aligned with categories like “gaming” and “apple.” Here’s what we uncovered.
Retailers Battle It Out with Competitive Discounts
Discount trends reveal clear leaders in terms of markdowns:
Walmart offered the deepest average absolute discounts at 36.9%.
Amazon and Target followed closely, highlighting a diverse range of deals designed to appeal to budget-conscious shoppers
Best Buy, the specialist consumer electronics retailer, offers the lowest discounts this Black Friday at 26.2%.
Note: The Absolute Discount represents the reduction of the selling price compared to the Manufacturer’s Suggested Retail Price (MSRP). The Additional Discount reflects how much lower the selling price is during Black Friday compared to its price a week before the sale. This metric reveals the actual or effective value of the sale event, beyond the standard discounts typically offered.
Subcategory Spotlight: Where the Best Deals Happened
From audio & video to wearables, each retailer carved out competitive advantages across subcategories.
Both Amazon and Walmart offered high discounts in audio & video and wearables, but Walmart led, with discounts up to 46.3%.
Best Buy, meanwhile, offered high absolute discounts on Mobile Devices(34%) and Storage (31%), followed by high discounts on wearables and Audio & Video.
Amazon maintained a balanced approach, excelling in audio & video and mobile devices.
Brand-Level Insights: HP and Samsung Dominate
The biggest winners this year were brands that strategically leveraged Black Friday discounts to boost visibility and sales:
HP took the top spot with average discounts of 36.9%, followed by Samsung at 31.4%.
Despite its premium reputation, Apple offered an average discount of 29.3%, signaling a shift in strategy to attract deal hunters.
Share of Search: Shifting Consumer Attention
Search trends reveal how discounts shaped brand visibility:
Microsoft saw the largest spike in share of search (+8.6%), thanks to aggressive pricing on gaming consoles and accessories.
Marshall and Amazon also saw significant gains in visibility.
Surprisingly, HP experienced a sharp decline (-9.8%), indicating missed opportunities despite steep discounts.
In the previous analysis, we focused on the top 500 products within each subcategory for each retailer, showcasing the discount strategies for their highlighted or featured items. However, to identify which retailer offered the lowest or highest prices for the same set of products, it’s necessary to match items across retailers. For this, we analyzed a separate dataset of 340 matched products across retailers to compare their pricing during Black Friday. This approach provides a clearer picture of price leadership and competitiveness across categories.
Here are the key takeaways from this analysis.
Category-Level Highlights
Amazon leads with the highest average discount (41.35%), offering the most value to consumers. It is followed by Target (39.37%) and Walmart (36.15%).
Best Buy, the specialist consumer electronics retailer, ranks last with an average discount of 31.53%, emphasizing a less aggressive pricing strategy compared to competitors.
Subcategory Highlights
Wearables: Amazon offers the steepest discounts (55.40%), followed by Best Buy (50.60%) and Walmart (45.75%).
Mobile Devices: Amazon also leads (37.94%), with Walmart (29.30%) in second place and Target trailing at 19.48%.
Gaming: Target takes the lead (37.47%), with Amazon and Best Buy offering similar discounts around 30%.
Computers: Target again emerges as the leader (39.18%), narrowly surpassing Walmart (36.13%).
Brand Highlights
Apple: Amazon dominates with 53.06%, closely followed by Walmart (50.55%), while Target and Best Buy hover around 43%.
Nintendo: Target edges out Amazon (37.62% vs. 36.54%), with Best Buy (33.21%) and Walmart (25.92%) trailing.
Beats by Dr. Dre: Amazon leads (46.07%), with Target (37.14%) as the runner-up. Best Buy and Walmart offer comparatively modest discounts around 25%.
Bose: Walmart emerges as the value leader (23.90%), surpassing Target (16.09%) and Best Buy (15.29%).
Cricut: Amazon sets a high benchmark (54.13%), with Target far behind (36.43%) for this viral portable printer brand. Best Buy (12.32%) and Walmart (10.79%) offer significantly lower discounts.
What This Means for Retailers and Brands
Retailers looking to stay competitive should focus on strategic discounting and enhanced brand visibility. Brands must align with consumer expectations by:
Leveraging platforms like DataWeave to analyze discount trends.
Optimizing pricing and assortment strategies for seasonal demand.
For more insights into consumer electronics pricing, contact DataWeave to discover how our AI-powered solutions can drive success in today’s fast-paced market. Stay tuned for more category-specific analyses in the coming weeks!
As the holiday shopping season kicked off, savvy shoppers embraced the spirit of the season, drawn by enticing deals. The apparel category is forecasted as the second highest earning category (Source: Statista), expected to generate revenues up to $43.9 billion, closely following consumer electronics. To understand the pricing strategies of top retailers amidst the sale season, DataWeave analyzed the pricing trends for the Apparel category this Black Friday.
We leveraged our AI-powered data platform to analyze the discounting across key retailers. Our analysis focused on the Apparel category, examining how Amazon, Walmart, Target, Saks Fifth Avenue, Nordstrom, Bloomingdales, Neiman Marcus and Macy’s differentiated themselves through their discounts.
For this analysis, we tracked the average discounts of apparel products among leading US retailers during the Thanksgiving weekend sale, including Black Friday. Our sample was chosen to encompass the top 500 ranked products in each product subcategory across during the sale.
Subcategories reported on: Footwear, Kid’s Clothing, Men’s Clothing, Women’s Clothing, Activewear, Plus Size Clothing, Accessories
Timeline of analysis: 10 to 29 November 2024
We focused on the top 500 products ranked for each search keyword on each retail site, using targeted terms aligned with categories like “athleisure” and “plus size clothing”. Our methodology distinguished between standard discounts and Black Friday-specific ‘additional discounts’ or price reductions during the sale compared to the week before, to reveal true consumer value.
Key Findings
This year’s fashion discounts were unprecedented. Let’s take a look.
Retailer Level Insights
Nordstrom leads with the highest average absolute discount at 59%, followed by Saks Fifth Avenue at 35.5% and Bloomingdale’s at 41.5%. Macy’s shows the lowest average discount at 24.1%, while Amazon has an average discount of 30.4%.
Amazon ranks lower in both average absolute and additional discounts compared to competitors, indicating a more conservative discounting strategy.
Subcategory Analysis
Kids’ Clothing saw the deep discounts (up to 55% at Nordstrom), reflecting growing pressure on family budgets and heightened competition to attract budget-conscious parents.
Plus-Size Clothing emerged as a major focus, with Nordstrom leading at 53.22% average absolute discounts, signaling that retailers are increasingly prioritizing size inclusivity and appealing to a broader consumer base.
Footwear experienced robust discounting, particularly at Bloomingdale’s with 37% average absolute discounts, showing a competitive approach to attract customers looking for seasonal footwear deals.
Activewear displayed substantial discounts, with Walmart offering up to 41% on average, aligning with the trend of consumers looking for practical and comfortable attire during the winter season.
Brand Level Insights
Apparel brands, meanwhile, also offer telling insights.
Top Discounting Brands: Aqua leads with an average absolute discount of 44.58%, followed by Boss at 42.33% and Burberry at 37.84%.
Lowest Discounts: Athletic Works shows the lowest average absolute discount at 31.23%, with a minimal additional discount of 3.73%.
Competitive Advantage: Brands like Ralph Lauren and Boss show strong discounts, indicating aggressive marketing during the sale.
Share of Search Insights
Top Gainers: Adidas and Nike each saw an increase of 1.20% in their share of search during Black Friday/Cyber Monday, highlighting their strong brand presence and consumer interest.
Top Losers: Reebok experienced a sharp decline, losing 2.60% in its share of search, while Levi’s also dropped by 0.60%.
Search Trends: The data suggests a strong consumer preference for activewear brands like Nike and Adidas and a decline in interest for traditional apparel brands like Levi’s.
Who Offered Most Value This Black Friday
In the previous analysis, we focused on the top 500 products within each subcategory for each retailer, showcasing the discount strategies for their highlighted or featured items. However, to identify which retailer offered the lowest or highest prices for the same set of products, it’s necessary to match items across retailers. For this, we analyzed a separate dataset of 418 matched products across Apparel specific retailers to compare their pricing during Black Friday. This approach provides a clearer picture of price leadership and competitiveness across categories.
Here are the key takeaways from this analysis.
Category-Level Analysis
At the overall category level, Macy’s emerged as the lowest-priced retailer, offering the highest average discount of 28.72%, followed closely by Nordstrom (26.06%). The steep decline in average discounts from Saks Fifth Avenue (14.42%) and Neiman Marcus (7.93%) highlights a clear gap in discounting strategies.
Macy’s and Nordstrom are aggressively competitive on pricing in the overall apparel category, likely capturing consumer attention with substantial discounts.
Saks Fifth Avenue and Neiman Marcus may rely more on brand perception and luxury positioning rather than heavy discounting.
Subcategory-Level Analysis
Neiman Marcus tops the ranking with an impressive 60.85% average discount, outperforming Macy’s (52.86%) and Nordstrom (43.04%) for Men’s Clothing. We see a similar trend with Neiman Marcus offering more value across Women’s Clothing as well, compared to other retailers.
The competition in footwear was intense, with Neiman Marcus narrowly securing the top spot at 31.03%, slightly ahead of Saks Fifth Avenue (30.28%) and Macy’s (30.07%).
Saks Fifth Avenue led by a significant margin in the Activewear category, offering 39.89% average discounts, indicating a strong push in this growing segment.
Macy’s followed at 32.16% in Activewear, while Neiman Marcus and Nordstrom had comparatively lower discounts of 26.40% and 19.52%, respectively.
Brand-Level Analysis
Kate Spade New York: Neiman Marcus leads with the highest discount of 55.23%, reflecting strong price leadership in premium fashion, closely followed by Saks Fifth Avenue at 51.66%.
Coach: Neiman Marcus dominates with a significant 75.85% discount, showcasing an aggressive promotional strategy for this luxury brand.
Spanx: While Neiman Marcus leads with 28.22%, discounts across other retailers like Saks Fifth Avenue, Macy’s, and Nordstrom are clustered within a competitive range of 17–19%.
Montblanc: Macy’s takes the lead with 20.32%, signaling its competitiveness even in high-end accessories, with Saks Fifth Avenue and Nordstrom closely behind.
Ugg: Saks Fifth Avenue leads with 31.42%, focusing on maintaining price leadership for this popular brand, while other retailers remain competitive with discounts around 25–30%.
What’s Next
To win over price-conscious shoppers, retailers need to stay competitive and consistently offer the lowest prices.
For a deeper dive into the world of competitive pricing intelligence and to explore how our solutions can benefit apparel retailers and brands, reach out to us today!
Stay tuned to our blog for more insights on different categories this Black Friday and Cyber Monday.
As shoppers flocked online and to stores during Black Friday and Cyber Monday, the grocery category stood out as a key battleground for retailers. With inflation affecting consumer spending, discounted groceries have become a critical driver for both shopper savings and retailer competitiveness.
In fact, according to the NRF, one of the top shopping destinations during Thanksgiving weekend were department stores (42%), online (42%),and grocery stores and supermarkets (40%). Clearly, consumers are looking to stock up in bulk on their groceries to maximize their savings.
To understand the pricing dynamics in the grocery category, DataWeave analyzed grocery discounts across leading grocers, uncovering significant trends that shaped consumer choices during this holiday shopping period.
Our research encompassed retailers like Amazon, Target, and Walmart, examining their discounting strategies across subcategories, alongside trends in share of search for leading CPG companies.
Key Grocery Market Stats for Black Friday-Cyber Monday 2024
Retailer Discounts: Walmart offered the highest average absolute discount at 27.6%, followed by Amazon at 20.4% and Target at 14.0%
Subcategory Insights: Beverages Category at Walmart saw the deepest discounts, with an average of 33.4%
Top Gaining Brands: Cesar experienced the largest increase in share of search during the sales period (+3.89%)
This blog will dive deeper into grocery discount trends and brand-level strategies, offering insights for retailers looking to stay competitive in the grocery sector.
Our Methodology
For this analysis, we tracked the average discounts offered by major U.S. grocery retailers during the Thanksgiving weekend, including Black Friday and Cyber Monday. We focused on key subcategories within the grocery segment, capturing trends in discounting strategies.
In the following insights, the Absolute Discount represents the reduction of the selling price compared to the Manufacturer’s Suggested Retail Price (MSRP). The Additional Discount reflects how much lower the selling price is during Black Friday compared to its price a week before the sale. This metric reveals the actual or effective value of the sale event, beyond the standard discounts typically offered.
Key Findings
Retailer-Level Insights
Walmart emerged as the leader in grocery discounting, offering the highest average absolute (27.6%) and additional (18%) discounts.
Amazon adopted a mid-tier discounting strategy, with average absolute discounts of 20.4%.
Target, while more conservative, maintained competitiveness in select subcategories like baby products.
Subcategory Insights
Pantry Essentials saw Walmart leading with an average discount of 31.2%, appealing to budget-conscious consumers stocking up for the holidays.
Fresh Produce showed consistent discounting across retailers, with Amazon slightly ahead at 27%.
Beverages stood out for significant discounting at Walmart, with an impressive 33.4% average discount.
Brand-Level Insights
Lay’s led in absolute discounts (37.52%) and additional discounts (26.23%) showcasing aggressive pricing in the snacks subcategory.
Good & Gather maintained its competitive edge with strong discounts, appealing to price-conscious consumers seeking value.
Brands like Blue Buffalo (pet food brand) offered significant absolute discounts, but with a low additional discount of just 2%, the overall impact of the sale event on effective value was limited.
Share of Search Insights
Cesar (dog food brand), Tide (laundry staple) and Doritos saw significant gains in share of search, reflecting successful promotional strategies.
Brands like Pampers (baby diapers brand), Healthy Choice, (frozen foods brand) and Pedigree (pet food brand) experienced a decline, indicating less effective engagement during the sale period.
Who offered the lowest prices?
In the previous analysis, we focused on the top 500 products within each subcategory for each retailer, showcasing the discount strategies for their highlighted or featured items. However, to identify which retailer offered the lowest or highest prices for the same set of products, it’s necessary to match items across retailers. For this, we analyzed a separate dataset of 1433 matched products across retailers to compare their pricing during Black Friday. This approach provides a clearer picture of price leadership and competitiveness across categories.
Here are the key takeaways from this analysis.
Category-Level Analysis
Walmart is the lowest priced retailer overall for the grocery category, with an impressive average discount of 44.60%. This significant discount advantage makes Walmart a leading option for value-seeking consumers.
Target follows with strong discounts of 36.73%, indicating solid pricing in comparison but less aggressive than Walmart.
Interestingly, Amazon was the most expensive in Grocery, with an average discount of only 6.3%.
Subcategory-Level Analysis
Walmart leads in various subcategories such as Pet Products (21.12%), Dairy & Eggs (13.79%), Household Essentials (13.05%), Frozen Foods (15.07%), and Meat & Seafood (17.60%), showcasing its extensive value across the board.
Target excels in Beverages (14.58%) and Baby Products (15.00%) with competitive discounts, standing out in these specific subcategories.
Kroger provides notable value in Pantry Essentials (20.04%) and Fresh Produce (15.85%), although its overall average discount is lower than Walmart’s.
Amazon consistently ranks lower in terms of average discounts across most subcategories, highlighting it as less competitive for consumers seeking the lowest prices.
Brand-Level Analysis
Walmart also holds the top position for several key brands like Cheetos (14.92%) and Dannon (8.81%), making it the best option for consumers looking for budget-friendly choices across popular brands.
Target takes the lead for brands like Betty Crocker (25.20%) and Chobani (11.37%), showing that it can offer value for specific products.
Kroger maintains strong discounts for brands such as Delmonte (9.19%), but it does not outpace Walmart in the overall grocery brand comparison.
Amazon generally lags behind in average discounts for most brands, with Dannon (1.12%) and Chobani (2.43%) showing significantly lower discounts.
Walmart is the lowest priced retailer in the grocery category and provides substantial value across a wide range of subcategories and popular brands. This ties in with Walmart’s ELDP pricing strategy. The retailer leads in overall average discounts and maintains its position as the go-to for price-conscious consumers. Target offers strong value in certain subcategories and brands but falls short of Walmart’s broad value based pricing advantages.
What’s Next
For grocery retailers, competitive pricing and targeted promotions are critical to driving sales during key shopping events. As consumers continue to prioritize value, staying ahead in the discounting game can significantly impact market share.
For detailed insights into grocery discounting strategies and to explore how DataWeave’s solutions can help retailers optimize their pricing, contact us today!
Stay tuned to our blog for further analyses of other categories during Black Friday and Cyber Monday.
The Home & Furniture category continues to thrive, propelled by consumer interest in creating personalized and functional living spaces. In 2023, the U.S. furniture and home furnishings market was valued at approximately $641.7 billion in 2023 and is estimated to grow at a CAGR of 5.1% from 2024 to 2032. Black Friday and Cyber Monday play a crucial role in fueling this growth, offering consumers a mix of premium and affordable options across subcategories.
To better understand market trends and discount strategies this Black Friday, at DataWeave we tracked over 18,149 SKUs across major home & furniture retailers, including Amazon, Walmart, Target, Best Buy, Home Depot, and Overstock, from November 10 to 29, 2024. Using our AI-powered pricing intelligence platform, we focused on the top 500 products in subcategories like kitchenware, furniture, decor, lighting, outdoor items, and bedding.
In our analysis, the Absolute Discount represents the reduction of the selling price compared to the Manufacturer’s Suggested Retail Price (MSRP). The Additional Discount reflects how much lower the selling price is during Black Friday compared to its price a week before the Black Friday sale. This metric reveals the actual or effective value of the sale event, beyond the standard discounts typically offered.
Also check out our insights on discounts and pricing for the health & beauty category this Black Friday.
Retailer Performance: Who Led the Discount Race?
Retailers showed varying discount strategies for Home & Furniture products. Walmart emerged as the leader in absolute discounts (37.5%) while Amazon offered the highest additional discount of 14%. Best Buy maintained competitive pricing across all subcategories, while Overstock and Home Depot offered relatively modest discounts.
Subcategories in Focus
Breaking down the discounts by subcategory provides deeper insights into consumer priorities and retailer strategies:
Kitchenware saw strong competition, with Walmart (30.40% absolute discounts) and Amazon (29% absolute discounts) dominating.
Lighting became a discount hotspot, with Walmart offering up to 45.8% in absolute discounts and 25.3% additional markdowns.
Furniture remained a core focus for Target, delivering an impressive 34% average absolute discount.
Bedding stood out at Walmart, where discounts peaked at 49.6%.
Brand Spotlight: Who Stood Out?
Among top-performing brands, furniture brand Costway offered the highest discounts, with an average of 48.4%. Meanwhile, Adesso (lighting solutions), Mainstays and Safavieh (both home furnishings brands) balanced discounts and premium appeal.
Search Visibility: The Winners and Losers
Share of search dynamics revealed significant shifts in brand visibility during Black Friday:
Furniture brand Costway (+1.2%) and home improvement player Black+Decker (+1.5%) gained visibility.
On the flip side, premium brands like Safavieh known for rugs and home furnishings (-16.8%) and furniture brand Burrow ( -1.7%) saw declines.
Who Offers the Lowest Prices?
In the previous analysis, we focused on the top 500 products within each subcategory for each retailer, showcasing the discount strategies for their highlighted or featured items. However, to identify which retailer offered the lowest or highest prices for the same set of products, it’s necessary to match items across retailers. For this, we analyzed a separate dataset of 735 matched products across Home & Furniture specific retailers to compare their pricing during Black Friday. This approach provides a clearer picture of price leadership and competitiveness across categories.
Here are the key takeaways from this analysis.
Category-Level Highlights
Amazon emerges as the lowest-priced retailer across Home & Furniture categories, with the highest average discount of 27.50%, closely followed by Walmart (26.09%).
Overstock and Wayfair trail with average discounts of 22.93% and 20.71%, respectively, while Home Depot offers the least aggressive pricing at 18.14%. This is notable, as all 3 players are known specialists in the category.
Subcategory Highlights
Amazon stands out as the leader in multiple subcategories, including Appliances, Furniture, Decor, and Outdoor, offering competitive average discounts of around 26-29%.
Overstock leads in Bedding and Kitchenware, with strong average discounts of 24.26% and 20.72%, respectively.
Wayfair is notable for Lighting, with an average discount of 19.95%, and is also competitive in Outdoor and Furniture categories.
Walmart consistently ranks high in several subcategories like Appliances and Bedding, providing solid discounts of around 22-23%.
What’s Next
For home & furniture retailers, driving maximum value during mega sale events like Black Friday involves offering bundles and sets to meet customer demands and trend expectations. Gaining insights into competitor discounts and pricing can help furniture retailers get an edge amid this environment.
Want to know how DataWeave’s intelligence platform can empower your business during peak sales events? Contact us to discover more about competitive insights, price intelligence, and data-driven decision-making. Stay tuned to our blog to see more coverage on Black Friday 2024.
The U.S. health and beauty retail sector shows remarkable resilience amid economic uncertainties, with the skincare market projected to hit $21.83 billion in 2024. Black Friday data reinforces this trend, with health and beauty products seeing a 14.6% surge in web traffic compared to last year.
At DataWeave, we conducted an in-depth analysis of Black Friday discounting trends in the U.S. health and beauty sector. DataWeave’s AI-powered pricing intelligence platform was used to monitor pricing and discounts across Sephora, Ulta Beauty, Walmart, Target, and Amazon during Black Friday 2024. The study covered 19985 SKUs from November 10-29. We focused on the top 500 products ranked for each search keyword on each retail site, using targeted terms aligned with categories like “skincare” and “fragrance”.
The results? Beauty leads across categories in discount depth this year, with some retailers offering significant markdowns.
The Beauty Boom: More Than Just Looking Good
If there’s one thing the pandemic taught us, it’s that self-care isn’t just a luxury – it’s a necessity. This Black Friday proved that beauty has become an indispensable part of consumers’ lives, with retailers offering unprecedented discounts and crafting strategic promotions to capture the growing demand.
The Absolute Discount represents the reduction of the selling price compared to the Manufacturer’s Suggested Retail Price (MSRP). The Additional Discount reflects how much lower the selling price is during Black Friday compared to its price a week before the sale. This metric reveals the actual or effective value of the sale event, beyond the standard discounts typically offered.
Ulta Beauty led with 45% average discounts, followed by Sephora at 38.1% and Walmart at 35.2%. In terms of additional Black Friday discounts, Ulta maintained dominance at 35%, with Sephora following at 28%.
Hair care emerged as the standout category, with Ulta Beauty offering up to 56% discounts, reflecting sustained demand for at-home beauty routines. Skincare saw fierce competition, with Sephora emphasizing premium discounts (37%) while Walmart focused on value pricing (32.5%).
Fragrance and Makeup attracted consumers with targeted promotions from Walmart and Ulta Beauty, signaling strong demand for gifting items.
Major beauty brands echoed the sentiment. Premium skincare brand Clinique leads with 50.6% average discounts. Meanwhile, drugstore staples like Revlon (29.1%) and Maybelline (24.4%) balanced accessibility and affordability, driving mass-market appeal. Popular beauty and makeup brand L’Oreal Paris also offered a modest 22.8% average discount, reinforcing its position as a value-oriented brand.
The more interesting story? The massive shift in brand visibility, as our share of search rankings denote:
Shampoo and hair care brand Tresemmé saw an unexpected 5.5% jump in the share of search results
Beauty brand Herbal Essences gained 5.1% in share of search well
Declines in share of search were noted for brands like L’Oreal Paris (-1.8%) and Pantene (-0.6%), indicating missed opportunities in promotional visibility.
Insight: What’s driving this beauty boom? TikTok and social media continue to fuel beauty purchases, with viral products driving significant search and sales spikes. Plus, the “skinification” of hair care has turned basic shampoo shopping into a full-blown beauty ritual.
Who Offered the Lowest Prices?
In the previous analysis, we focused on the top 500 products within each subcategory for each retailer, showcasing the discount strategies for their highlighted or featured items. However, to identify which retailer offered the lowest or highest prices for the same set of products, it’s necessary to match items across retailers. For this, we analyzed a separate dataset of 1133 matched products across Health & Beauty specific retailers to compare their pricing during Black Friday. This approach provides a clearer picture of price leadership and competitiveness across categories.
Here are the key takeaways from this analysis.
Bloomingdale’s emerges as the overall leader, offering the highest average discount of 14.87%, closely followed by Bluemercury (12.41%).
Ulta Beauty ranks third (10.94%), demonstrating competitiveness across key subcategories, while Sephora trails with the lowest average discount (7.33%), reflecting a more premium positioning.
Ulta Beauty leads in Hair Care with the highest discount (22.62%), while Bluemercury dominates in Skin Care (13.81%), Makeup (22.98%), and Fragrance (10.6%).
Sephora consistently offers the lowest discounts across all subcategories, reflecting their premium positioning.
Bluemercury offers the lowest prices for luxury brands like Kiehl (27.02%) and Laura Mercier (34.87%), with Bloomingdale’s closely trailing.
Bloomingdale’s leads for Bumble and Bumble (13.59%) and Hourglass (23.41%), showcasing strong promotional efforts.
Sephora maintains a more restrained discount strategy, with notable leadership only for Estée Lauder (7.18%).
Ulta Beauty shines in offering the steepest discount for Briogeo (33.26%), emphasizing competitiveness in key brands.
What’s Next for Holiday Discounting?
For retailers, the message is clear: traditional holiday playbooks need a serious update. For shoppers, it means unprecedented opportunities to score deals in categories that traditionally held firm on pricing.
Want to stay ahead of retail trends and optimize your holiday shopping strategy? DataWeave’s commerce intelligence platform helps brands and retailers strategically navigate these shifts. Contact us to learn more about how we can help you make data-driven decisions in this rapidly evolving retail landscape.
Stay tuned to our blog for forthcoming analyses on pricing and discounting trends across a spectrum of shopping categories, as we continue to unravel the intricacies of consumer behavior and market dynamics.
Today, the first name that comes to anybody’s mind when they hear about online shopping is Amazon. In the US alone, Amazon accounted for over 37.6 percent of total online retail sales in 2023 with the second place Walmart not even managing to win double-digit numbers on the same scale.
With such a phenomenal market share, it is not surprising that any retail brand would want to have their products listed on Amazon for sale. However, as enticing as the potential exposure could be, the overwhelming presence of brands selling similar products on Amazon is so huge that getting fair visibility for your products may require some heavy-lifting support.
Will the Same SEO You Use for Google Work with Amazon?
Unfortunately, no, as Google and Amazon have different objectives when it comes to search rankings on their respective customer platforms. Google makes the lion’s share of its revenue from search advertising, whereas Amazon makes money when customers buy products listed on its platform by sellers.
Relying on traditional search engine optimization (SEO) techniques may not get the desired results as they are more optimized for search engines like Google. Amazon embraces its unique DNA when it comes to product display rankings on its search option.
How Does SEO Work in Amazon?
Over the years, Amazon amassed data about shopping experiences that billions of customers globally had on its platform. With this data, they developed their custom search algorithm named A9. Contrary to the gazillion objectives that Google has for its intelligent search algorithms, Amazon has tasked A9 with just a simple straightforward target—when a customer keys in a search query, provide the best choice of products that they will most probably purchase, as search results.
A9 works to fulfill the mission of guiding shoppers to the right product without worrying about semantics, context, intent, mind mapping, etc. of the search query in contrast to what Google does. As with Google search, Amazon does have paid advertising and sponsored results options such as Amazon PPC, Headline ads, etc. but their SEO algorithms are aware of how to support and boost search rankings of genuine products and brands that have taken an effort to follow best practices in Amazon SEO as well as have a great offering with attractive prices.
As additional knowledge, Amazon also has clear guidelines on what it prioritizes for search rankings. Known in the SEO world as Amazon ranking signals, these are core factors that influence how a product is ranked for search queries. Some of the top Amazon ranking signals that carry heavy influence on search rankings include on-page signals, off-page signals, sales rank, best sellers rank, etc.
What Brands Need to Strategize to Master the Amazon SEO Algorithms
From a broad perspective, we can classify the actions brands need to take in this regard in 3 core stages:
Pre-Optimization
This deals with getting first-hand knowledge about both customers who are likely to purchase your product and the competitors who are vying for sales from these very same customers. Filtering your target customer or audience is essential to ensure that you get the most ROI from marketing initiatives and that sales cycles are accelerated. For example, if your product is a premium scented candle, there is no point in wasting advertising dollars trying to win attention from customers who are not likely to ever spend on luxury home décor items.
Knowing how your competitors are performing on Amazon search, the keywords, and SEO strategies they have adapted is critical to ensure that you stay one step ahead.
Product Listing Page Optimization
This includes strategies that a brand can adopt so that its product description page gets the much-needed content optimizations to sync with Amazon’s A9 algorithm. It has a mix of keyword-integrated content, relevant images, descriptions in easy-to-understand language, localized content flavors to resonate with target buyers, etc. For example, a kitchen tool like a grater might be used for different kinds of food preparation techniques in different regions of the same country.
The brand must ensure that the description adequately localizes the linguistic or usage preference representation of the target audience. If the grater is used for grating coconut shells to extract the fibrous pulp in the Midlands and for grating ginger skin in the Far East, both use cases should be part of the product description if the target customers are from both regions.
Sales Optimization
This deals with options that have more sales strategies integrated into their core. For example, blogs on popular websites with the Amazon purchase link embedded in the content, collaboration with social media influencers, paid advertising on Amazon itself as well as on search engines, video ads, banner and display ads, etc.
The key intent here is to drive organic and inorganic traffic to the Amazon product listing page and ultimately win sales.
How Can Your Products Rank High in Amazon Search Results? Top 10 Tactics
Now that you have a clear understanding of the strategies that help in mastering Amazon’s ranking algorithms, here are some great tips to help achieve higher search rankings for your products on Amazon search:
1. Target Relevant Keywords
You need to figure out the best keywords that match what customers put as queries into the Amazon search bar. Your brand needs to clearly understand customer behavior when they arrive on Amazon to search for a product or category of products. The best place to begin looking for the same would be on competitor pages on Amazon. The keywords that helped them rank well on Amazon can help you as well. Manually investigating such a large pool of competitors is nearly impossible but with the right tools, you can easily embrace capabilities to know which keywords can help you in mimicking the success of your competitors.
2. Focus on Product Titles
Every single part of the content in your brand’s Amazon storefront or product page needs dedicated focus. Beginning with the product titles, effort needs to be made to ensure that they include the brand name, key product category or features, and other relevant keyword information.
In other words, product titles must be optimized for searchability. This searchability for product titles needs to be optimized for both mobile and desktop screens.
3. Create Product Descriptions that Resonate with the Audience
For product descriptions on your Amazon webpage, you need to figure out the optimal quality levels needed for the intended audience. Effective content can help achieve better search ranking visibility and convince the incoming traffic of shoppers to make a purchase. It is important to periodically review and modify your page content to suit the interests of visitors from both web and mobile devices.
Leveraging solutions like DataWeave can help with regular content audits to ensure you are putting out the best product content that will delight shoppers and deliver on sales conversion targets.
4. Use High-Quality Media Assets like Images and Videos
Promoting your product doesn’t have to be restricted to just textual content in Amazon product description sections. You can use other multimedia assets of high quality. These include images, videos, brochure images, etc. Every content asset must aim to educate shoppers on why your product should be their number one choice. For example, look at this detailed product description for the viral K-Beauty product COSRX Mucin Essence.
Moreover, images can help attract more attention span from visitors, thereby increasing the probability of purchases.
5. Strengthen the Backend Keywords As Well
Amazon also supports hidden backend keywords that sellers add to their product listings. They help add more relevance to products similar to meta descriptions and titles in traditional SEO for search engines like Google. A typical backend keyword may comprise synonyms, misspelled keywords, textual variations, etc. However, knowing how to pick the right ones is crucial. By analyzing your keyword rankings against competitors and higher-ranking product results in search, the platform can help you consistently optimize your content backend to help grow visibility.
6. Focus on Reviews and Ratings
Reviews and ratings on product pages are key insights that help customers with their purchasing decisions. So, it is natural for brands to keep a close eye on how their products are faring in this regard. Reviews and ratings are a direct indication of the trustworthiness of your product. When previous buyers rate you high and leave favorable reviews on your product, it will directly promote trust and help you secure a better rapport with new customers.
This upfront advantage can help boost sales conversions better. Leveraging solutions like DataWeave can help you understand the sentiments that customers have for your products by intelligently analyzing reviews and ratings.
7. Implement Competitive Pricing Strategies
The goal of most customers when shopping online is to get their desired product at the most affordable prices. The eCommerce price wars every year are growing in scale today and getting your product pricing right is crucial for sales. However, there is a need to gain comprehensive insights into how your competitors are pricing their offerings and how the market responds to specific price ranges. Solutions like DataWeave help your brand access specific insights into pricing. By analyzing competitor pricing, you can create a winning price model that is sustainable for your brand and favorable for target customers.
8. Track Share of Search
Content and other SEO activities will help improve your search rankings on Amazon. However, it is equally important to know how well your products are performing periodically against your competitors for the same set of specific keyword searches. You need to understand the share of search that your products are achieving to formulate improvement strategies. DataWeave’s Digital Shelf Analytics solution provides share of search insights helping you uncover deep knowledge on your discoverability on Amazon (and other marketplaces) for your vital search keywords.
9. Ensure Stock Availability
To achieve better ranking results, brands need to ensure that the relevant products matching the search keywords are available for quick delivery at the desired ZIP codes where users are more likely to search and order them. Out-of-stock items seldom show up high on search results. Certain products, especially if they’re popular, can get stocked out frequently in certain locations. Keeping a close eye on your stock availability across the map can help minimize these scenarios.
10. Optimize Your Brand Presence
While optimizing content and other key areas within the Amazon webpage for your product is critical, there are other avenues to help boost search rankings. One such option includes registering in the Amazon Brand Registry, which provides more beneficial features like protection against counterfeits and ensuring that your brand page is optimized according to Amazon storefront standards.
The Bottom Line
Winning the top spot in Amazon search ranking is crucial for brands that aim to capitalize on online sales revenue to grow their business. Knowing your workaround for Amazon’s proprietary SEO frameworks and algorithms is the first step to succeeding. The key element of success is your ability to gain granular insights into the areas we covered in this blog post such as competitor prices, sentiments of customers, market preferences, and content optimization requirements.
This is where DataWeave’s Digital Shelf Analytics solution becomes the biggest asset for your eCommerce business. Contact us to explore how we can empower your business to build the most visible and discoverable Amazon storefront that guarantees higher search rankings and ultimately increased sales. Talk to us for a demo today.
Brands are investing millions of dollars in digital retail media to make their products stand out amid unrelenting competition.
The ad spend on digital retail media worldwide was estimated at USD 114.4 billion in 2022, and the current projections indicate that it will grow to USD 176 billion by 2028. This amounts to a 54% increase in just six years.
The current surge in digital retail media advertising has led brands to find an effective way to monitor the efficacy of their ad spend. While Share of Search has long been used to measure brand visibility effectively, the metrics often missed tracking ads on retail sites.
DataWeave’s Share of Media solution helps solve this problem.
What is the Share of Media?
At DataWeave, Share of Media is a metric used to measure a brand’s presence in sponsored listings and banner ads on eCommerce platforms. It captures how often a brand appears in paid promotions compared to competitors, offering insights into advertising visibility and effectiveness.
These days most marketplaces seamlessly blend banner ads and sponsored listings into organic search results. Let’s take a closer look.
Banner Advertising
Banner advertising strategically places creative banners across websites—often at the top, bottom, or sides. Some eCommerce platforms also integrate these banners into product search listings.
What makes banner ads so special is the unique ability to allow marketers to use various types of media in a single ad, such as images, auto-play videos, and animations. Brands can also present curated collections of products. This flexibility provides marketers with creative opportunities to differentiate from competitors, capture customer interest, and encourage conversions.
Sponsored Listings
Sponsored listings are paid placements within search engine results or eCommerce platforms. They are usually marked as ‘sponsored’ or ‘ad,’ and they often appear at the top of search results and alongside organic product listing results.
Unlike organic search results, sponsored listings are prioritized based on the advertiser’s bid amount and relevance to users’ search queries.
Sponsored listings offer a strategic advantage by enabling businesses to connect directly with consumers who are actively searching for their products. This targeted approach ensures that marketing efforts are focused on individuals with high intent of making a purchase, maximizing the potential return on investment.
The Power of Banner Ads and Sponsored Listings
Banner ads and sponsored listings are great choices for boosting customer engagement and product sales. Here are four key advantages they offer:
Enhanced Visibility: Digital retail media strategically places your brand where it will stand out—outshining competitors and grabbing the attention of high-purchase-intent consumers.
Precision in Reach: These ads target specific keywords or categories, allowing for highly focused advertising based on demographics and search intent.
Minimal Conversion Friction: Smooth transitions from ads to a brand’s native store or product listing on the marketplace keep conversion friction to a minimum.
Brand Awareness and Recall: Consistent exposure to your brand through banner ads and sponsored product listings can leave lasting impressions and build brand recognition.
The bottom line is that it’s increasingly important for brands to monitor their Share of Media.
How to Monitor Your Brand’s Share of Media
DataWeave’s Digital Shelf Analytics (DSA) platform extends beyond the traditional Share of Search metrics and provides robust support for monitoring the Share of Media.
DataWeave monitors the Share of Media in two ways: keywords and product categories. Users can view Share of Media insights through aggregated views, trend charts, and detailed tables. The views are designed to show brand visibility and the overall competitive landscape. For example, the screenshot below, taken from DataWeave’s dashboard, showcases the Share of Media across keywords, categories, and retailers.
Share of Media by Keyword
The Share of Media metric captures a brand’s advertising presence within search listings for a designated keyword. This provides a comprehensive view of a brand’s visibility and promotional efforts across retail platforms, helping brands validate and gauge the effectiveness of their ad spend.
For example, the screenshot below shows the trend of manufacturer’s Share of Media by keyword—‘baby food.’
Share of Media by Category
The Share of Media metric measures the presence of brands’ banner ads and sponsored listings across product categories on retail sites. This helps brands see which product categories require more investment, making it easier for them to spend their ad budget wisely.
The screenshot below illustrates manufacturers’ Share of Media by category across retailers.
Share of Media: An Essential Ecommerce Metric
As retail media continues to evolve, our analytics must follow—after all, knowledge is a competitive advantage. In the dynamic world of eCommerce, where competition is fierce and consumer attention is scarce, understanding your share of media is crucial.
Analyzing the Share of Media can give brands a competitive edge. By regularly monitoring and analyzing this metric, you can make data-driven decisions to improve your brand’s visibility, attract more customers, and ultimately drive sales growth. With a deeper understanding of their target audience and market dynamics, brands can refine promotional efforts to drive more effective results and optimize return on ad spend (ROAS).
For more information on how Digital Shelf Analytics can enhance your brand’s digital shelf presence, request a demo or contact us at contact@dataweave.com.
As summer winds down, families across the US have been gearing up for the annual back-to-school shopping season. The back-to-school season has always been a significant event in the retail calendar, but its importance has grown in recent years. With inflation still impacting many households, parents and guardians are more discerning than ever about their purchases, seeking the best value for their money.
The National Retail Federation has forecasted that this season could see one of the highest levels of spending in recent years, reaching up to $86.6 billion. As shoppers eagerly stock up on back-to-school and back-to-college essentials, it’s crucial for retailers and brands to refine their pricing strategies in order to capture a larger share of the market.
To understand how retailers are responding to the back-to-school rush this season, our proprietary analysis delves into pricing trends, discount strategies, and brand visibility across major US retailers, including Amazon, Walmart, Kroger, and Target. By examining 1000 exactly matching products in popular back-to-school categories, our analysis provides valuable insights into the pricing strategies adopted by leading retailers and brands this year.
Price Changes: A Tale of Moderation
The most notable trend in our analysis is the much smaller annual price increases this year, in contrast to last year’s sharp price hikes. This shift is a reaction to growing consumer frustration about rising prices. After enduring persistent inflation and steep price growth, which peaked last year, consumers have become increasingly frustrated. As a result, retailers have had to scale back and implement more moderate price increases this year.
Kroger led the pack with the highest price increases, showing a 5.3% increase this year, which follows a staggering 19.9% rise last year. Walmart’s dramatic price increase of 14.9% is now followed by a muted 3.1% hike. Amazon and Target demonstrated a similar pattern of slowing price hikes, with increases of 2.3% and 2.7% respectively in the latest period. This trend indicates that retailers are still adjusting to increased costs but are also mindful of maintaining customer loyalty in a competitive market.
When examining specific product categories, we observe diverse pricing trends. Electronics and apparel saw the largest price increases between 2022 and 2023, likely due to supply chain disruptions and volatile demand. However, the pace of these increases slowed in 2024, indicating a gradual return to more stable market conditions. Notably, backpacks remain an outlier, with prices continuing to rise sharply by 22%.
Interestingly, some categories, such as office organization and planners, experienced a price decline in 2024. This could signal an oversupply or shifting consumer preferences, presenting potential opportunities for both retailers and shoppers.
Brand Visibility: The Search for Prominence
In the digital age, a brand’s visibility in online searches can significantly impact its success during the back-to-school season. Our analysis of the share of search across major retailers provides valuable insights into brand prominence and marketing effectiveness.
Sharpie and Crayola emerged as the strongest performers overall, with particularly high visibility on Target. This suggests strong consumer recognition and demand for these traditional school supply brands. BIC showed strength on Amazon and Target but lagged on Kroger, while Pilot maintained a more balanced presence across most retailers.
The variation in brand visibility across retailers also hints at potential partnerships or targeted marketing strategies. For instance, Sharpie’s notably high visibility on Target (5.16% share of search) could indicate a specific partnership.
Talk to us to get more insights on the most prominent brands broken down by specific product categories.
Navigating the 2024 Back-to-School Landscape
As we look ahead to the 2024 back-to-school shopping season, several key takeaways emerge for retailers and brands:
Price sensitivity remains high, but the rate of increase is moderating. Retailers should carefully balance the need to cover costs with maintaining competitive pricing.
Strategic discounting can be a powerful tool, especially for lesser-known brands looking to gain market share. However, established brands would need to rely more on quality, visibility, and brand loyalty.
Online visibility is crucial. Brands should invest in strong SEO and retail media strategies, tailored to different retail platforms.
Category-specific strategies are essential. What works for backpacks may not work for writing instruments, so a nuanced approach is key.
Retailers and brands should be prepared for potential shifts in consumer behavior, such as increased demand for value-priced items or changes in category preferences.
By staying attuned to these trends and remaining flexible in their strategies, businesses can position themselves for success in the competitive back-to-school retail landscape of 2024. As always, the key lies in understanding and responding to consumer needs while maintaining a keen eye on market dynamics.
Stay tuned to our blog to know more about how retailers can stay aware of changing pricing trends. Reach out to us today to learn more.
Our world is increasingly going online. We work online, socialize online, and shop online every day. As a consumer brand, you need to ensure complete awareness of your brand’s online presence across eCommerce platforms, search engines, and media.
Only by deeply understanding the customer journey can you ensure that your product is reaching your ideal customers and maximizing your brand’s market share. You need data to intrinsically understand your customer journey and make changes where you’re lacking.
As the old adage goes: ‘You can’t manage what you don’t measure.’
You need digital shelf metrics to measure and start benchmarking your buyer’s journey. To find several of these types of key performance indicators (KPIs), you need a digital shelf analytics solution. These platforms allow you to track various metrics along the path to purchase from the awareness stage to the post-purchase phase across the entire internet, helping to inform online and offline sales strategies.
Digital shelf analytics will help you gain insights into how your brand is doing versus the competition, which areas are lagging behind in historical performance, and what activities are driving sales. There are innumerable ways in which you can leverage these valuable insights. But how do you know which KPIs to start tracking with your digital shelf analytics solution?
Here, we’ve summarized the top metric types your peers report, track and base their decisions on.
With these KPIs in hand, consumer brands like yours can ensure that their products are consistently visible and appealing to their target audience across online marketplaces, ultimately enhancing conversion rates, market share, and profitability.
Read this guide to learn more about the top digital shelf metrics consumer brands are tracking and how to use them in your own strategy.
1. Share of Search
Share of Search (SoS) is a KPI in digital shelf analytics that measures how frequently a consumer brand’s products appear in search results on eCommerce platforms relative to the competition for specific keywords. A good digital shelf analytics solution will be able to show this metric across all the top marketplaces and retailers, such as Amazon and Walmart, but also more niche marketplaces for industry-specific selling.
This metric provides brands with a quantifiable way to measure how frequently their products are being “served up” to customers on online marketplaces. Essentially, it measures visibility and discoverability.
With Share of Search on DataWeave, you can slice and dice your data in innumerable ways. These are a few important views you can see:
Aggregated SoS
Organic and Sponsored SoS scores
SoS scores across brands, retailers, keywords, cities
Historical SoS score trends
Once you have benchmarked your SoS and category presence relative to your competition, you need to start interpreting the data. Here are some questions you can ask yourself to help interpret your findings:
Which of my key categories have the lowest SoS score?
Which products feature low on search results because they are out of stock?
Are my competitors’ products faring better due to sponsored searches?
Is my SoS low due to poor content quality?
With insights in hand, you will know which actions to take to drive the biggest impact. For example, you could increase sponsored search results or improve organic reach by optimizing product pages.
Understanding your SoS is essential to maximizing the awareness phase of your customer journey. It will help you improve your brand visibility and increase product conversions through better search and category presence.
2. Share of Media
Share of Media (SoM) is a KPI that is just as impactful, if not more so, than the SoS metric. However, only a limited number of brands track it or use it to drive strategic action. This makes it a perfect opportunity for brands looking to get an edge on the competition.
But what is SoM in digital shelf analytics? Essentially, it’s a way of measuring retail media advertising activities like brand-sponsored banners, listings, videos, ads, and promotions that sometimes blend into search results. The main types of retail media advertising exist in two categories: banner advertising and sponsored listings.
Banner advertising involves strategically placing designed banners within websites and search listings. These banners raise brand awareness and drive traffic to online storefronts.
Sponsored listings are paid placements within search results on search engines or eCommerce platforms. They are prioritized based on the total bid amount and the product’s relevance. These paid listings are marked with “sponsored” or “ad.”
These listings serve to enhance your brand’s overall visibility, help you gain more precise reach, increase conversions, and drive better brand awareness and recall with your customers.
These efforts aren’t free, however, so measuring their effectiveness is critical not only to gain all the listed benefits but to also not waste your valuable marketing budget. The SoM KPI can help a consumer brand answer questions like:
Where are the opportunities to increase paid ads?
Which categories could benefit from a promotional boost or a strategic and streamlined allocation of ad spend?
Which of my competitors have active banners and what is their share of media by keyword?
How has my ad spend trended historically in comparison to my competitor?
DataWeave’s digital shelf analytics (DSA) is among the first providers to offer Share of Media KPI tracking and analysis. This is because it requires advanced, multi-modal AI to gather, view, and aggregate listings that encompass text, images, and video. With Share of Media tracking facilitated by DataWeave, consumer brands can track and analyze the effectiveness of their own promotional investments as well as those of their competitors.
3. Content Quality
The content quality metric measures how well your product content adheres to the retailer’s specific guidelines, which are in place to steer traffic and sales on their sites.
With the help of a DSA platform’s AI and ML capabilities, you can measure different elements of your product detail pages (PDPs), such as titles, descriptions, images, videos, and even customer reviews. You need to know which elements are missing, where they are missing, and which ones are negatively affecting sales so you can take corrective action.
Did you know that the average cart abandonment rate is 69.99%? The quality of your content can significantly impact this number. Ensuring that your content is high-quality will help influence product discoverability, customer engagement, and conversion rates. It will also help position you ahead of the competition. If your content quality is poor, you may find yourself with lower search rankings, a higher return rate, and more abandoned carts.
Here are some questions you can answer with the help of the content quality digital shelf metric:
Is my product content at a retail site exactly what was syndicated?
Are there any retailer initiated changes to my product content?
Are my product content updates reflected on the retailer platforms?
How well does my product content comply with the retailer guidelines?
How do I optimize my product content for enhanced discoverability and conversion?
DataWeave’s content quality digital shelf analysis helps consumer brands ensure that product content on eCommerce platforms is high-quality and benchmark their product listings against the competition. It does this through a combination of AI-driven quality analysis and by presenting brands with actionable recommendations. These optimized suggestions are based on the top-performing products so you can focus your valuable time on the areas that will drive the biggest impact.
4. Pricing & Promotions
Your customers can easily shop around to find the best price for the product you’re selling. If your competitor is selling it cheaper, you’ll lose that sale.
That’s why it’s essential to understand the pricing and promotional landscape for each of your products and categories. This can be a challenge, especially if it’s a common product or comes in multiple pack sizes or variants.
It’s equally important to track pricing and promotions even at individual, physical stores. Doing so will allow you to remain competitive and responsive to local market dynamics by tailoring your pricing strategies based on regional competition. You don’t want your products to be overpriced (lost sales) or underpriced (lost profit) in specific markets.
Harmonizing insights when operating an omnichannel consumer brand is extremely difficult without the aid of a digital shelf analytics solution. Insights need to be aggregated between desktop sites, mobile sites, and mobile applications, as well as from physical storefronts.
Questions you can answer with the help of the pricing & promotions digital shelf metric include:
How do my product prices and promotions compare to my competitors?
How consistent is my product pricing across retail websites?
How does my product pricing vary across regions, ZIPs, and stores?
How do price changes influence my sales numbers?
Are there regional differences in pricing and promotion effectiveness?
DataWeave’s digital shelf analytics platform stands out with its sophisticated location-aware capabilities, which enable the aggregation and analysis of localized pricing and promotions. The platform defines locations based on a range of identifiers, such as latitudes and longitudes, regions, states, ZIP codes, or specific store numbers.
The platform can also extract promotional information, such as credit card-based or volume-based promotions. You can see variances across retailers, split by price groups, brands, and competitors. DataWeave specializes in enabling brands to conduct in-depth analyses across a wide array of attributes so you can answer just about any pricing or promotional question you have.
5. Availability
The availability KPI in digital shelf analytics measures the in-stock and availability rates for a brand’s products across eCommerce and physical locations. Similar to the pricing and promotions metric, it relies heavily on location awareness, down to individual stores. Measuring both online availability and offline in-stock rates will help you understand the big picture and take more informed replenishment action.
When you start leveraging the availability KPI with the help of digital shelf analytics, you can improve inventory management, boost product discoverability, increase the frequency with which your online product listings convert, and generally drive more sales. This KPI is essential for ensuring your customers can always find and buy the products they want.
With the availability KPI, you can start answering questions like:
What is my overall in-stock rate?
Which of my products frequently go out of stock?
How does product availability vary across different regions and stores?
What is the impact of availability on my conversion rates?
Are there any seasonal trends in product availability that I need to address?
How quickly are we resolving stockout issues across different locations?
What are my biggest opportunities to reduce stockouts?
DataWeave enables consumer brands to track their product availability metric through automated data collection from various eCommerce platforms in conjunction with physical in-stock rates. The platform provides granular, store-level insights so you can understand regional stock variations and optimize inventory distribution. By tracking historical availability data, you can identify seasonal patterns and predict future demand to pre-empt stockout issues. All of this can be configured with automatic notifications to alert you when there has been a stockout event or when a low stock threshold has been passed, facilitating timely replenishment.
6. Ratings & Reviews
The final KPI in our guide is the ratings & reviews digital shelf metric. Consumers rely heavily on genuine feedback from their peers and refer to star ratings, posted comments, and uploaded pictures to inform their buying decisions. This KPI analyzes the impact of customer feedback and reviews on your products’ performance across eCommerce platforms so you can measure overall brand perception and isolate areas of opportunity.
This metric does something other digital shelf metrics don’t; it can inform your product strategy. It can help you identify repeat complaints that your product team can address with the manufacturer or use for the design of future products.
Some questions you can answer with this powerful KPI include:
What is the overall customer sentiment towards my products based on ratings and reviews?
Which product features are frequently mentioned positively or negatively by customers?
How do my product ratings and reviews compare to those of my competitors?
Are there common issues or complaints that need to be addressed to improve customer satisfaction?
Which products have the highest and lowest ratings, and why?
With DataWeave’s digital ratings and reviews feature, you can keep a pulse on customer sentiment to take short-term action as well as decide long-term strategy. You can leverage reviews to influence product perception, refine products, and enhance overall customer satisfaction.
DataWeave’s Digital Shelf Metrics
Each one of these metrics is interconnected and collectively influences a brand’s success. For instance, improving content quality and earning higher ratings can significantly enhance your product’s visibility in search results, thereby boosting the Share of Search digital shelf metric. By focusing on a comprehensive approach that integrates these metrics, brands can ensure their products are consistently visible, competitively priced, well-reviewed, and readily available.
DataWeave gives consumer brands the means to execute a holistic digital shelf strategy. From a single portal, track and improve digital shelf metrics like Share of Search, Share of Media, Pricing and promotions, Availability, and Ratings and Reviews.
Our solutions help audit and optimize the most critical KPIs that drive sales and market share for brands so you can stay competitive in a dynamic digital landscape and foster long-term customer satisfaction.