Black Friday 2025 solidified its position as a major retail event in the German market. German consumers demonstrated an average Black Friday budget of €317, the highest among select European countries.
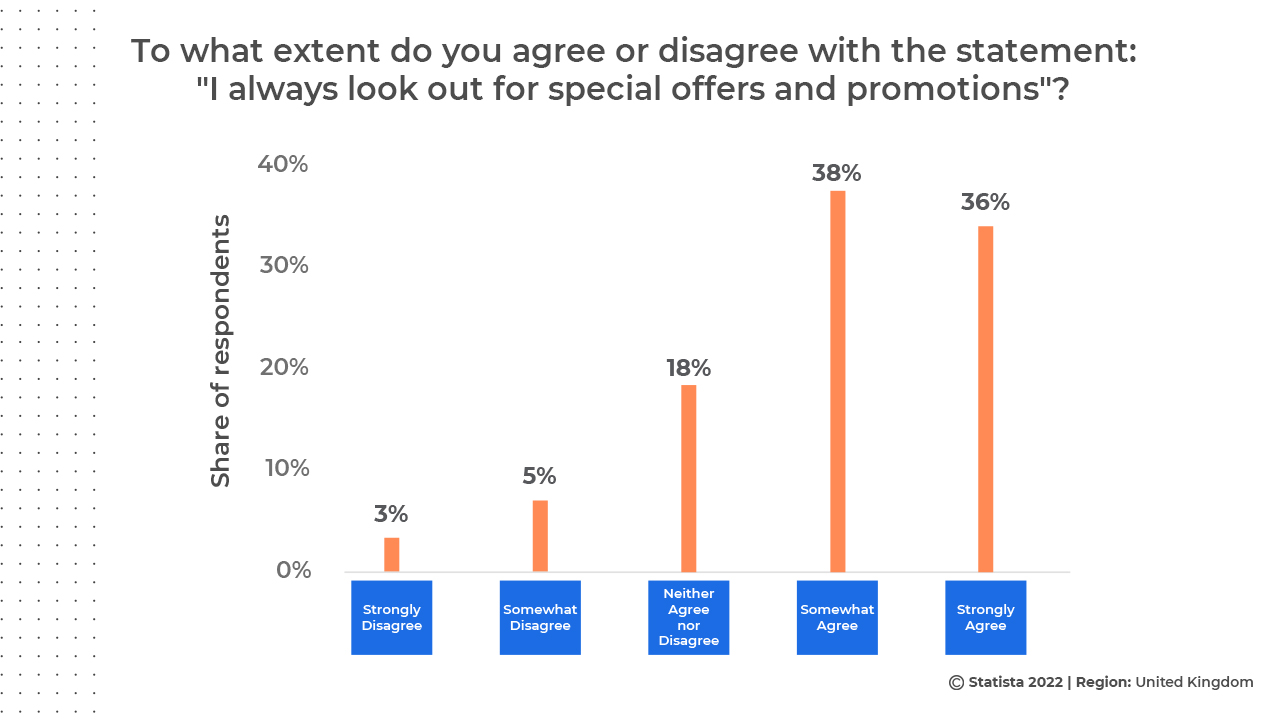
The German market, however, exhibited unique consumer behavior patterns during Black Friday 2025. Rather than meticulous planning, 59% of German shoppers allowed deals to inspire their purchases, compared to just 32% who shopped with predetermined lists and budgets. This spontaneous yet budget-conscious approach distinguishes German consumers from other markets, where FOMO-driven purchasing tends to dominate.
Against this backdrop of rational deal-seeking and regional diversity, how did retailers and brands perform across key categories this Black Friday?
At DataWeave, we conducted a comprehensive analysis of Black Friday 2025 discounting trends across five major categories in the German market: Consumer Electronics, Home & Furniture, Health & Beauty, Grocery, and Apparel. Our AI-powered pricing intelligence platform monitored over 16,000+ SKUs across leading German retailers like Amazon, Aldi, Douglas, Nutritienda, Carethy, Bofrost, and more, revealing fascinating patterns in how retailers and brands approached this year’s sale season.
Our Methodology
For this analysis, DataWeave monitored average discounts across leading German retailers during two distinct periods:
- Pre-Black Friday: November 6 – November 23, 2025 – capturing early holiday deals and baseline pricing
- Additional Discounts During Black Friday Week: November 24 – December 1, 2025 – covering Thanksgiving week through Black Friday (November 28) and Cyber Monday (December 1)
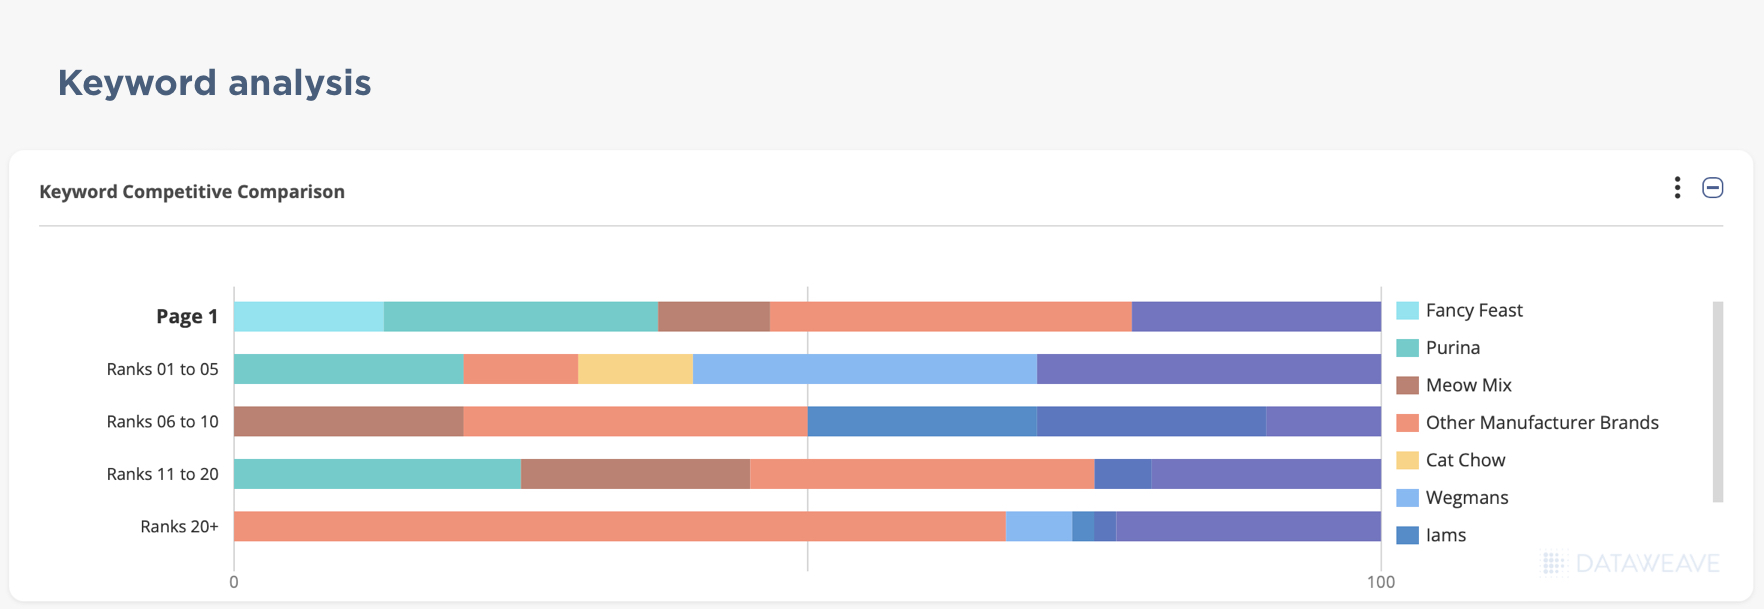
Our sample encompassed the top-ranked products across subcategories on major retail sites. We also analyzed Share of Search data, which measures brand visibility by monitoring which brand names appear in the top 20 search results for critical keywords.
Black Friday 2025 Germany: The Big Picture
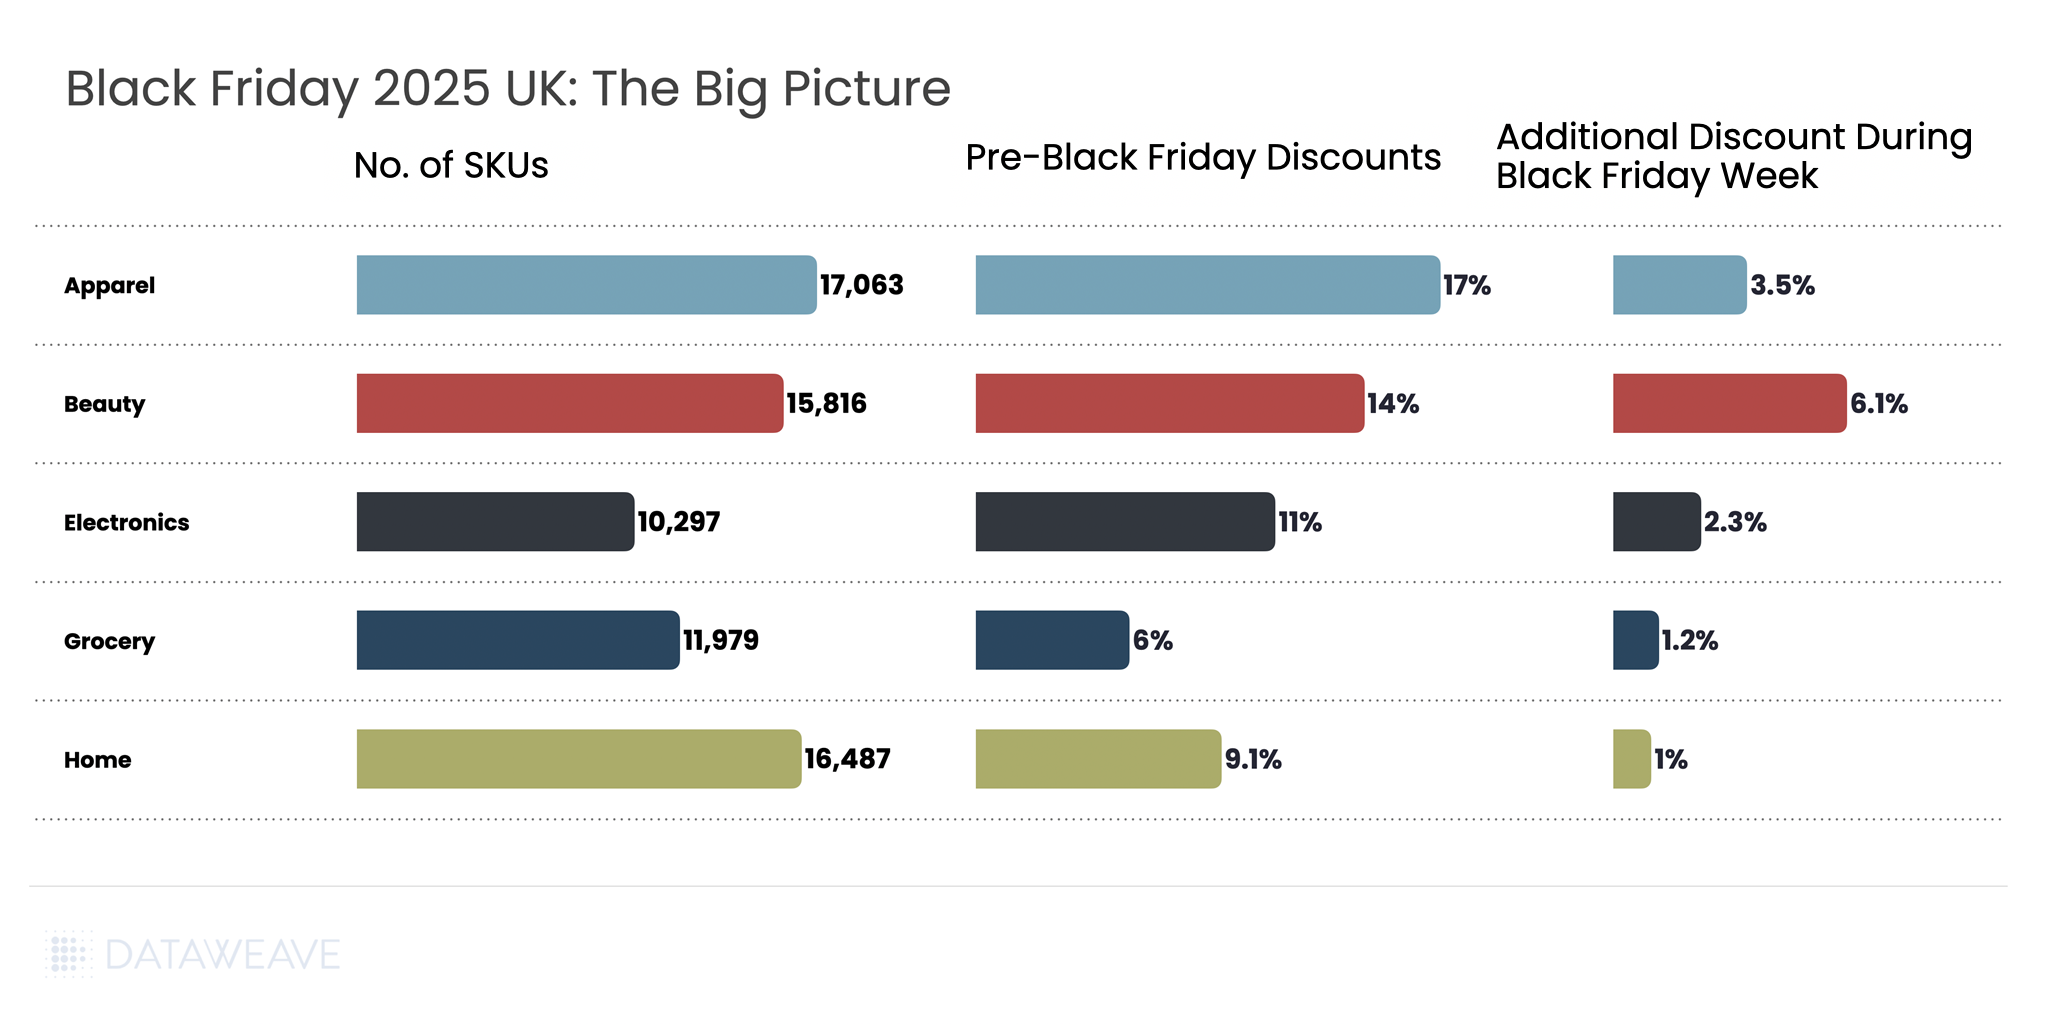
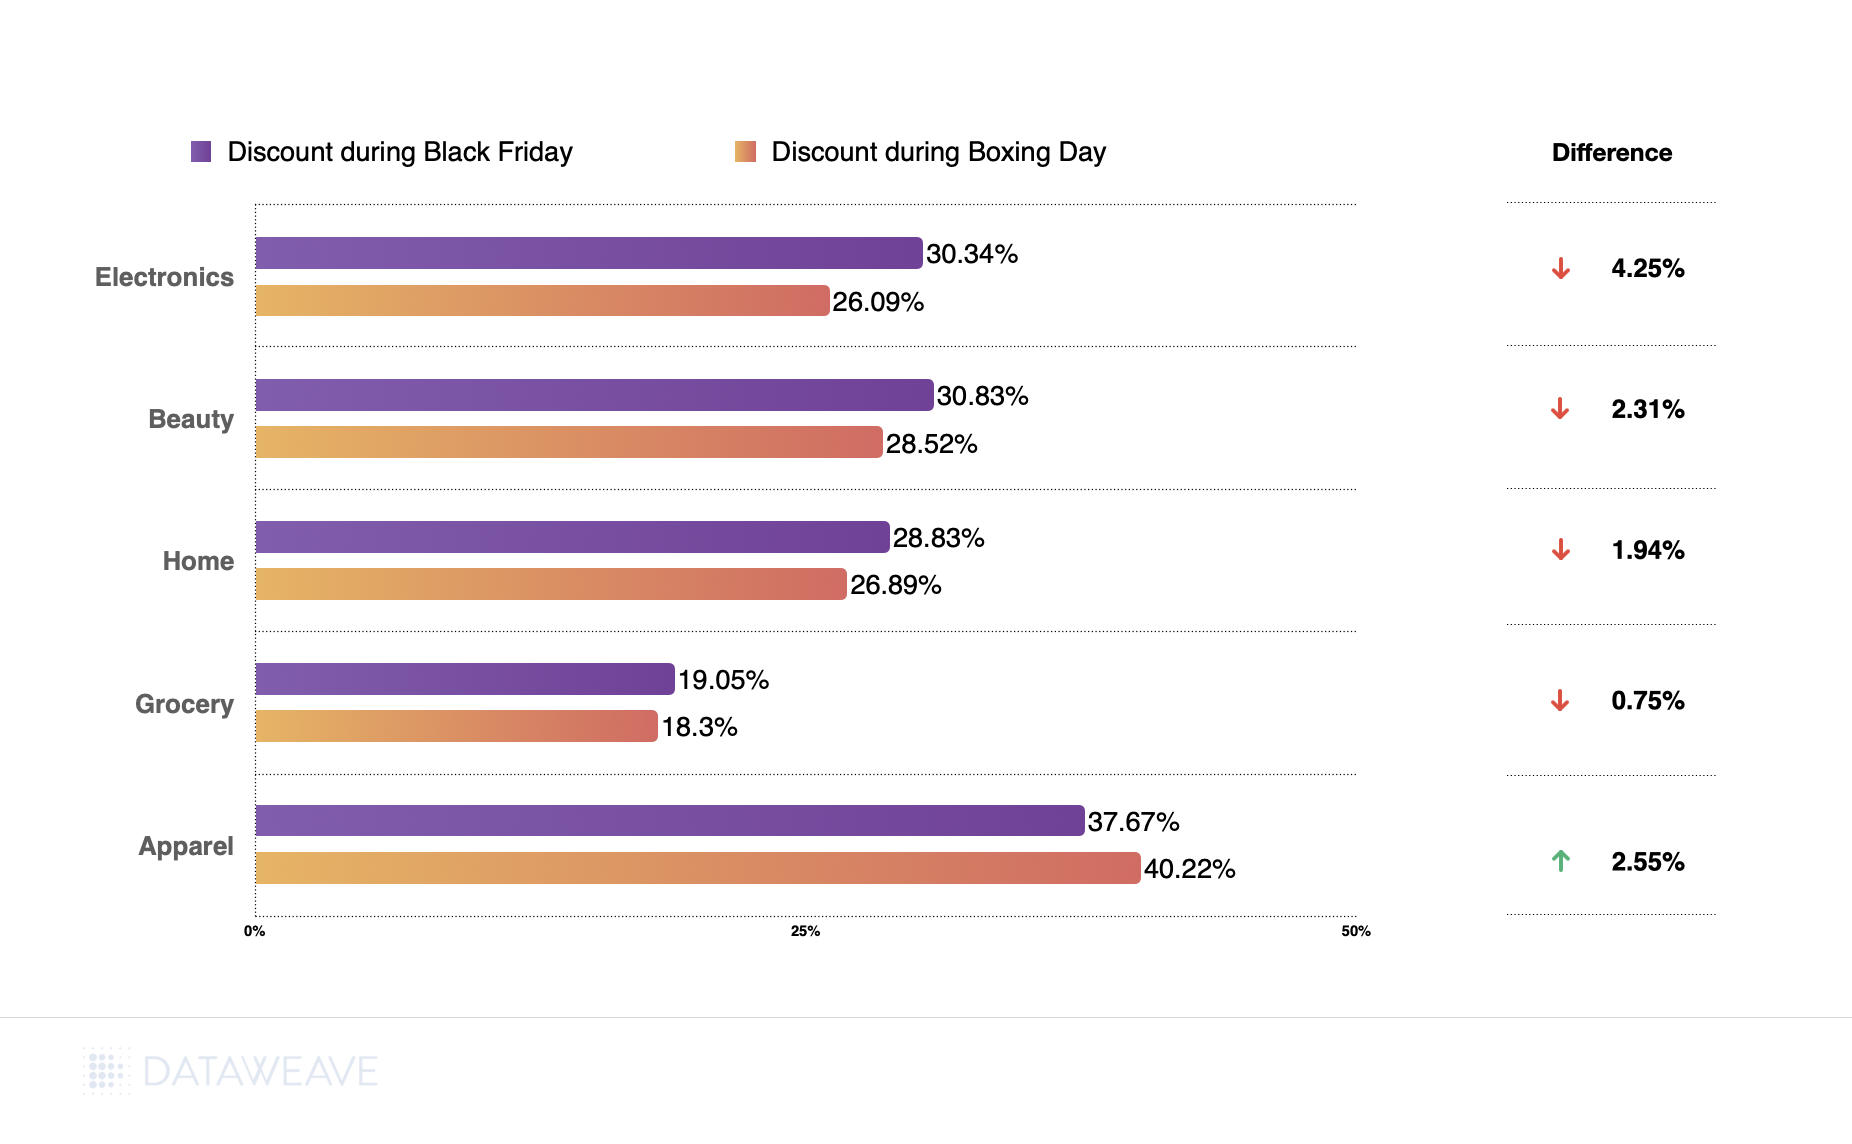
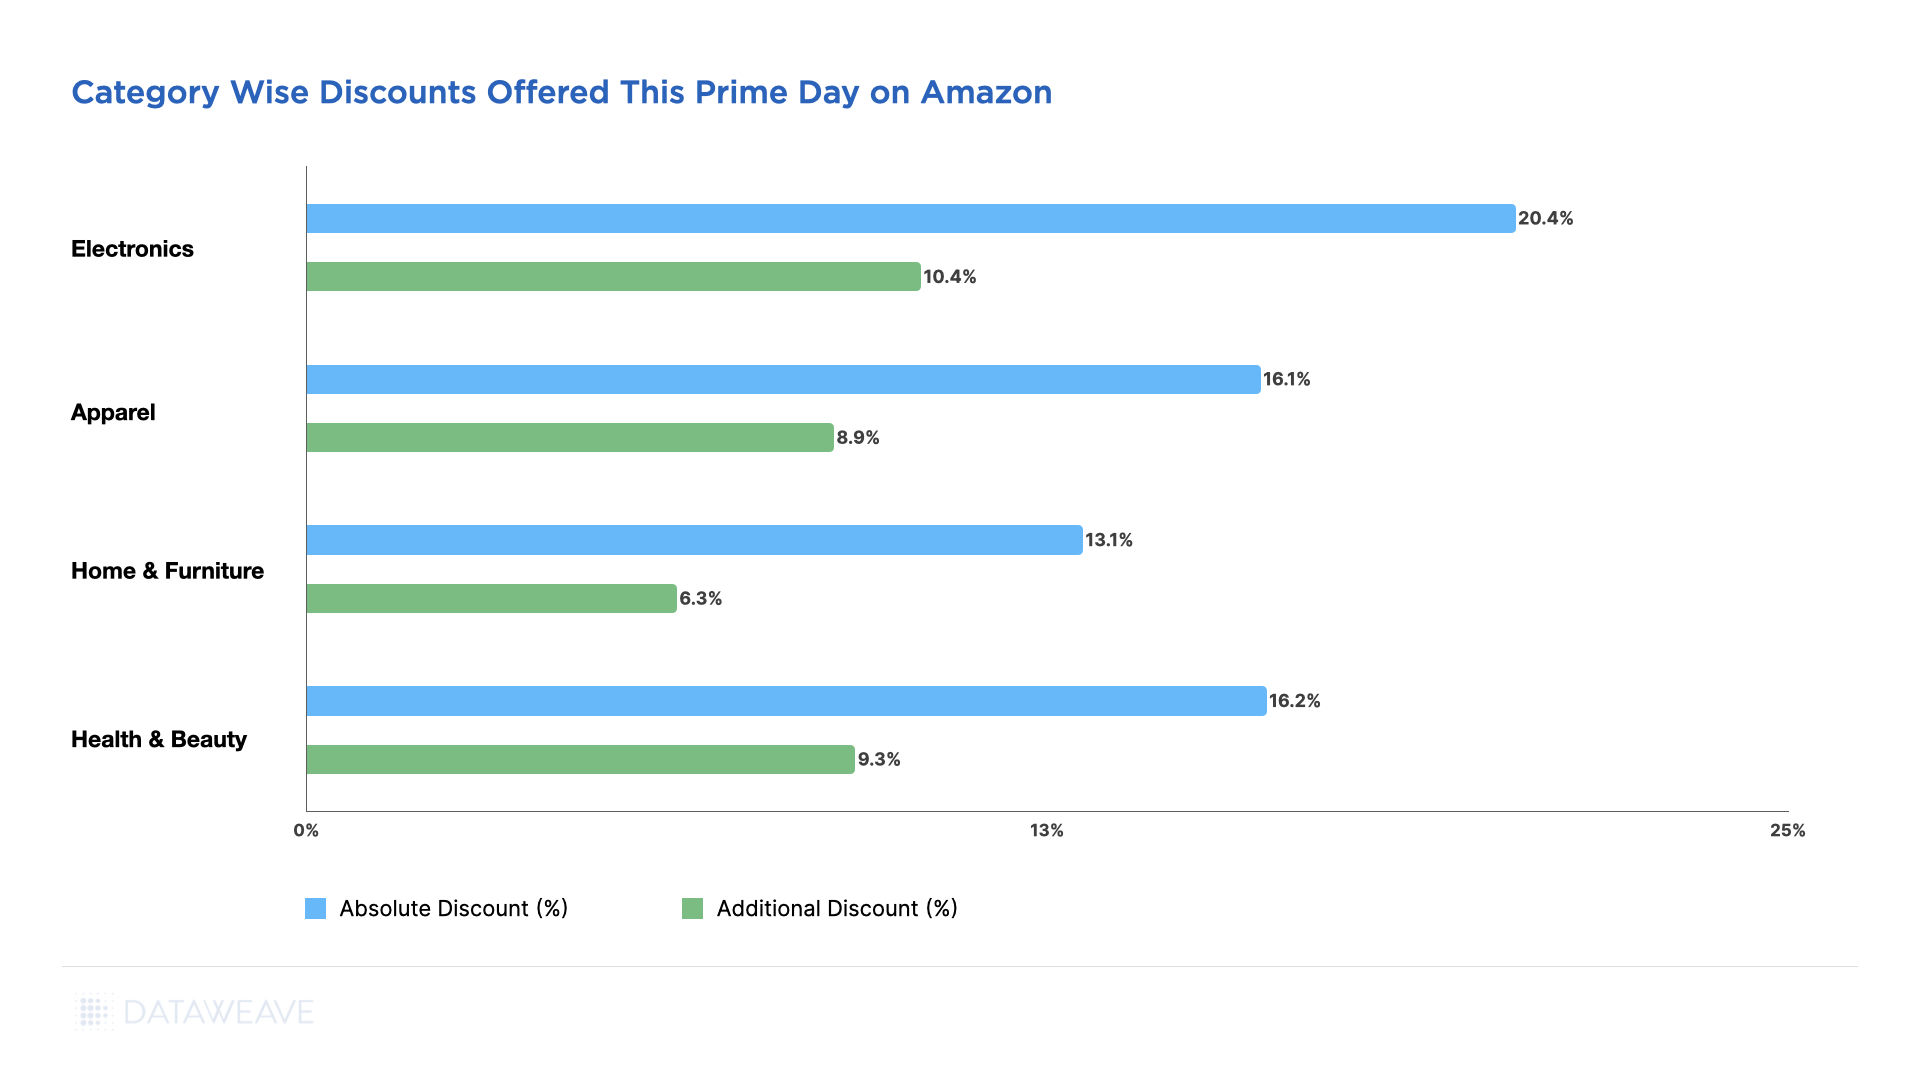
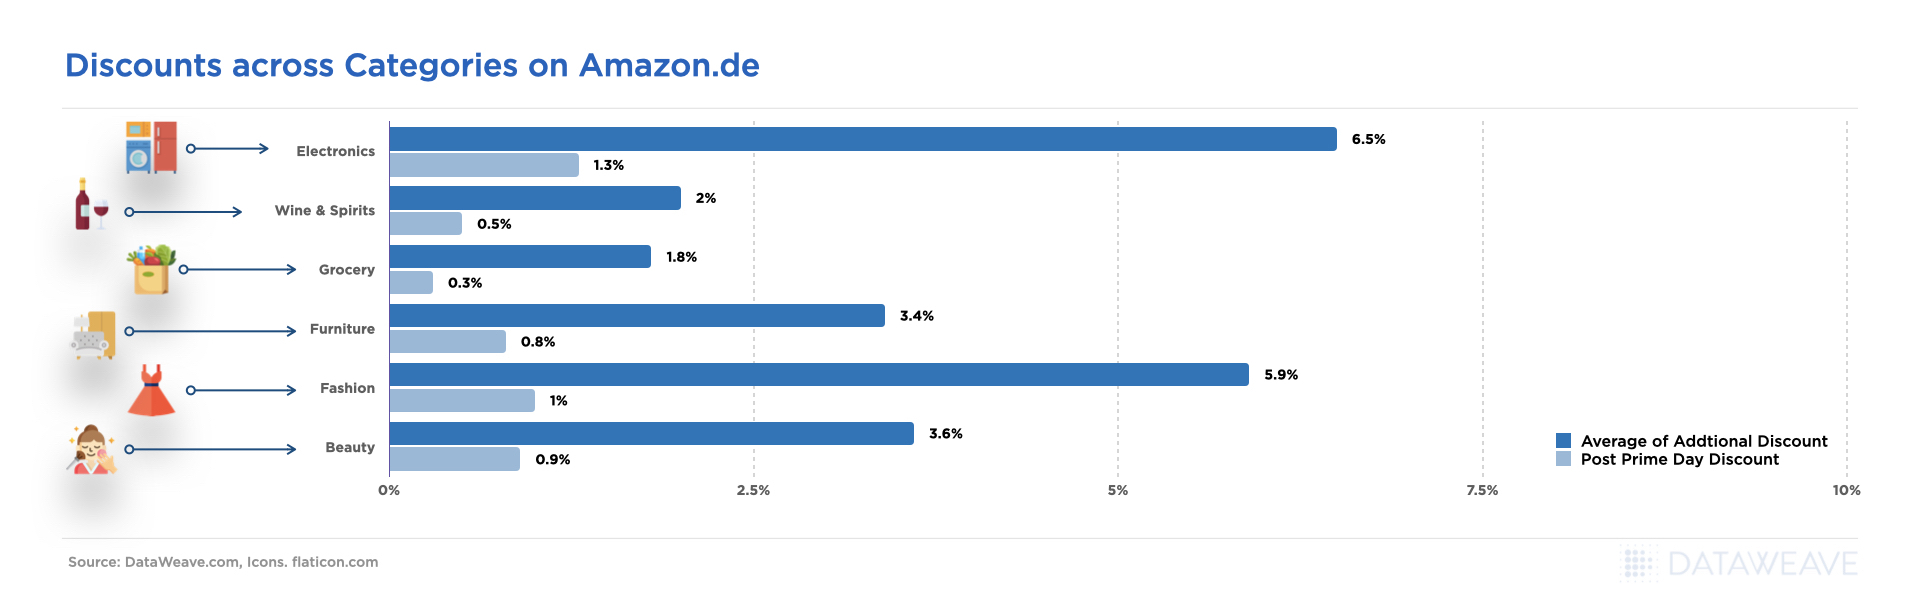
Our analysis covered 16,653 SKUs across five major categories. Here’s the snapshot of average discounts during the Pre-Black Friday period compared to Black Friday Week:
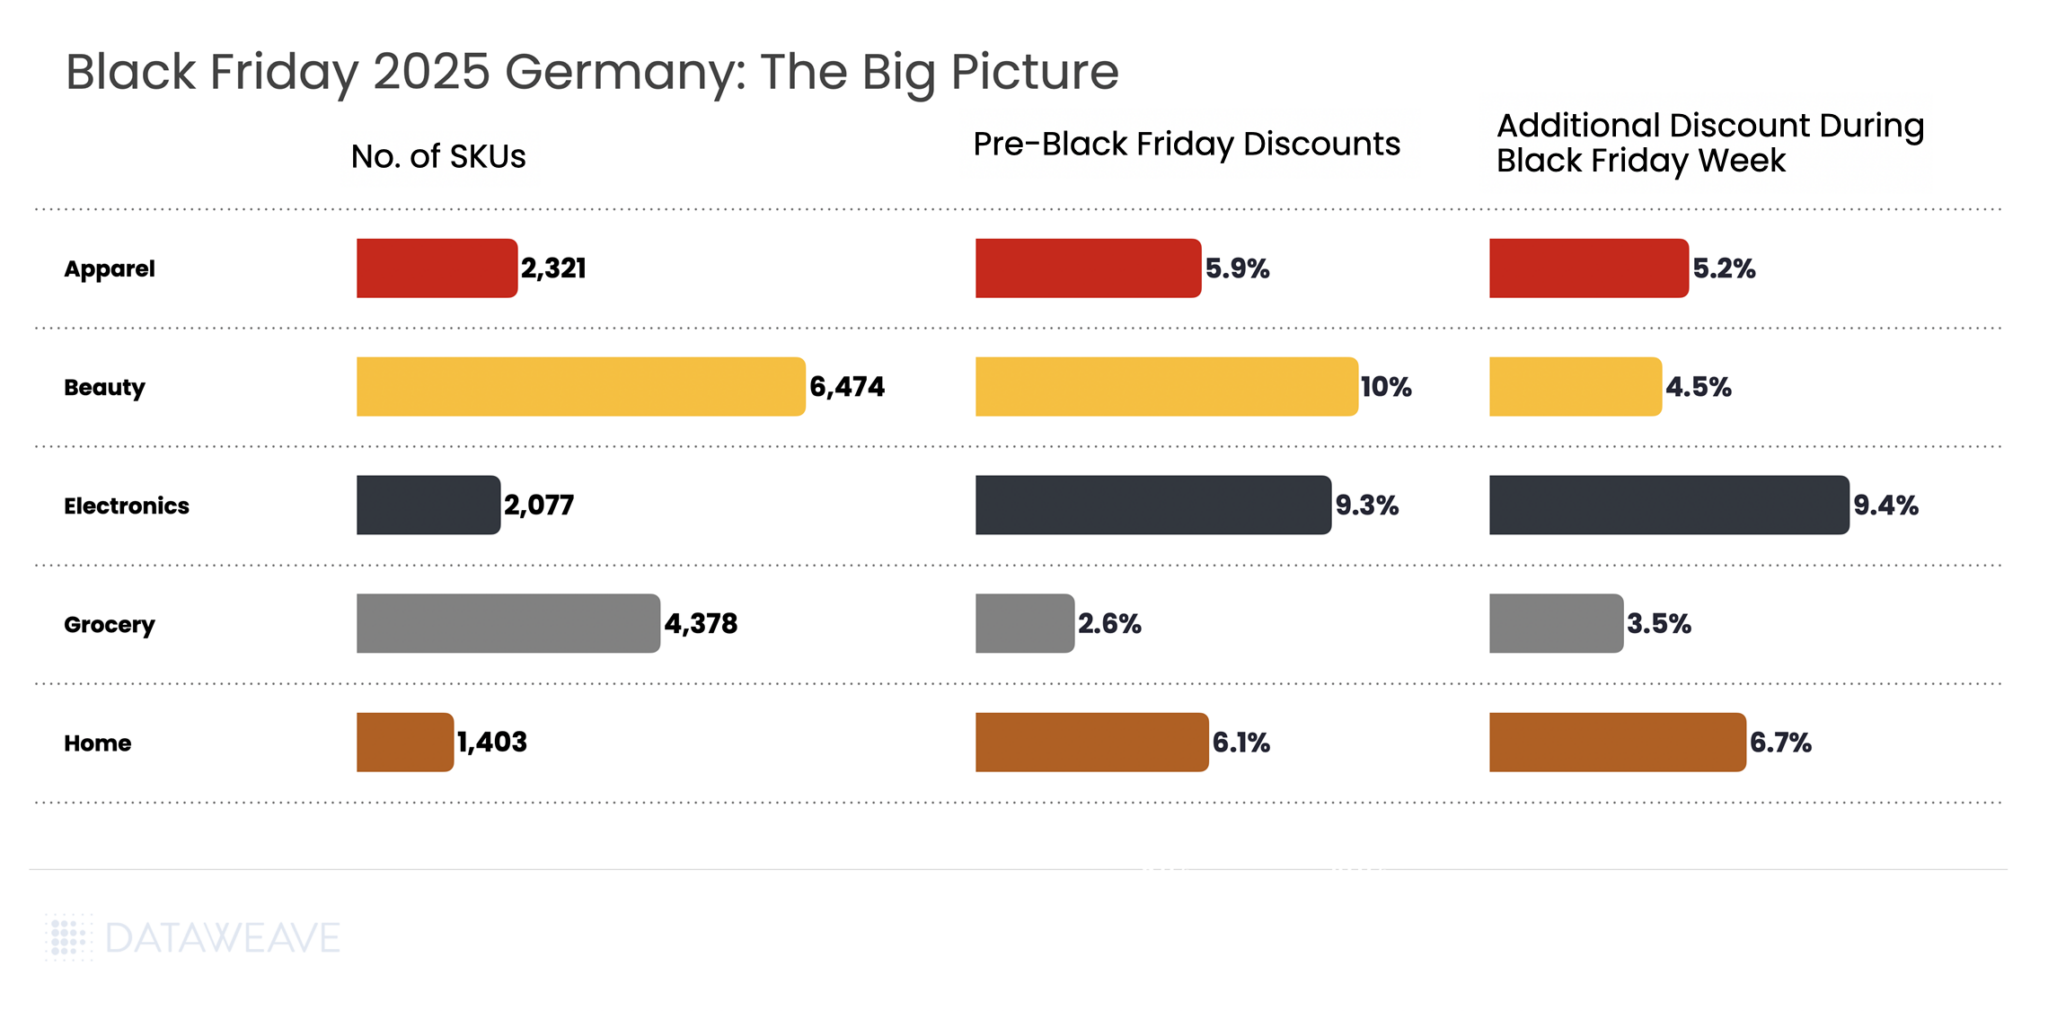
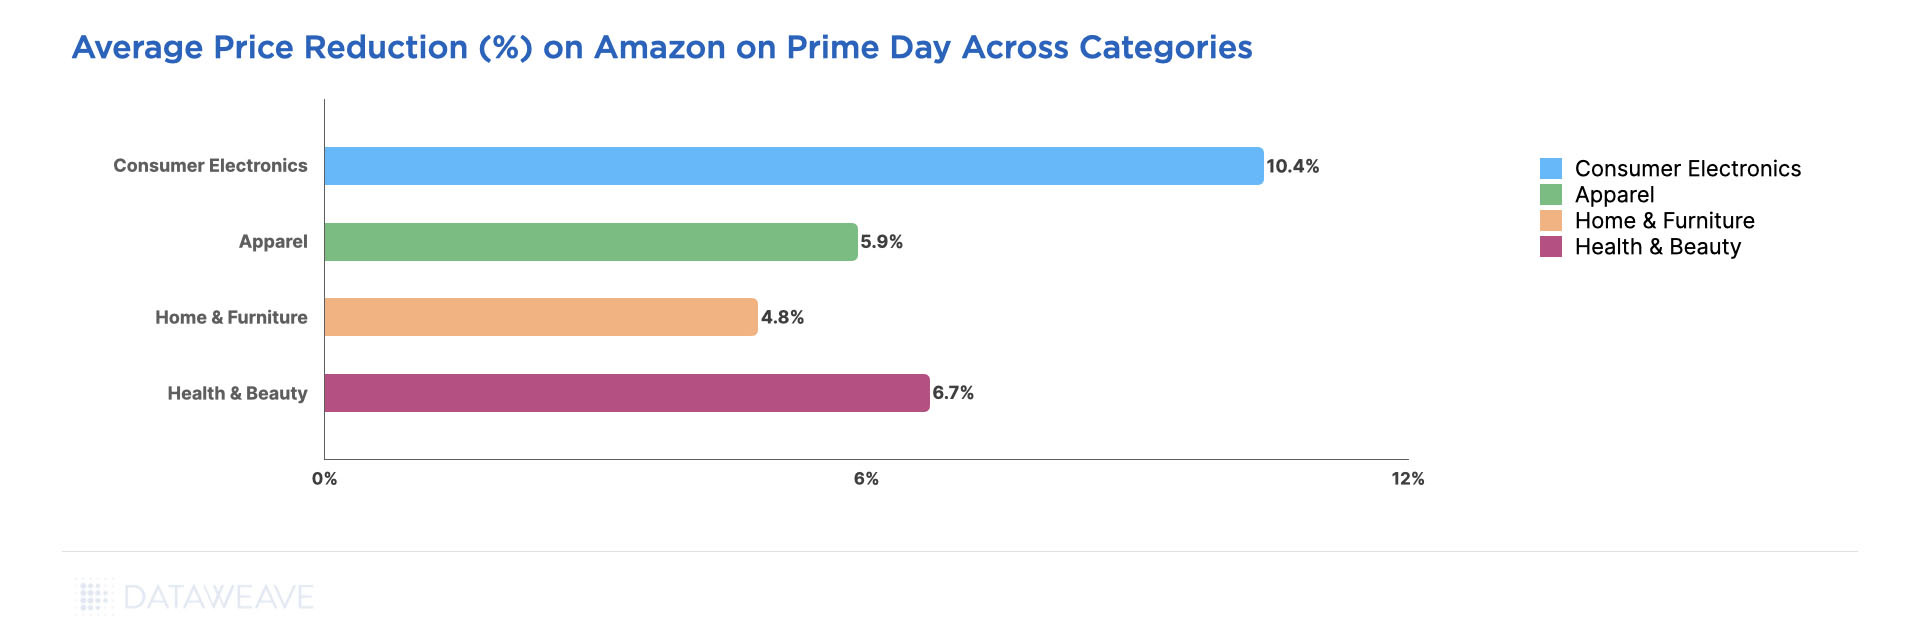
Key Insight: The German market presented a notably different discounting pattern compared to other markets. Pre-Black Friday discounts averaged 7% across all categories, with Black Friday Week adding 5.1% on average. Unlike the UK and US markets where retailers front-loaded promotions heavily, German retailers took a more balanced approach, with several categories actually seeing higher discounts during the main Black Friday Week.
Beauty led pre-sale discounts at 10%, followed by Electronics at 9.3%. Consumer electronics stood out with the highest Black Friday Week discounts at 9.4%, slightly exceeding even the pre-sale period at 9.3%.
Shopping Behavior Patterns: The relatively modest discount levels reflect the rational, value-oriented approach of German consumers. With the majority of shoppers setting budgets between €100-€299 and prioritizing wish fulfillment over impulse purchases, German retailers focused on strategic discounting rather than aggressive margin erosion.
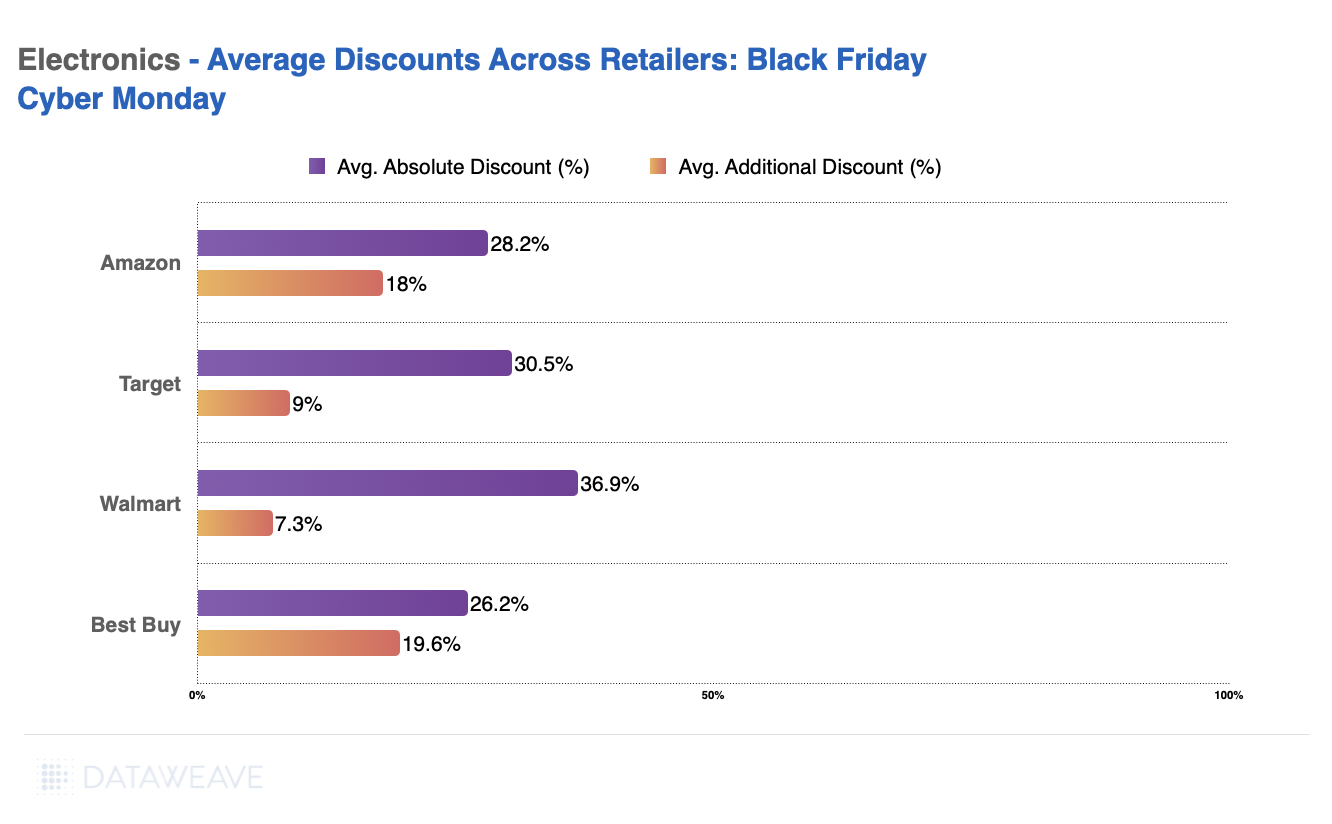
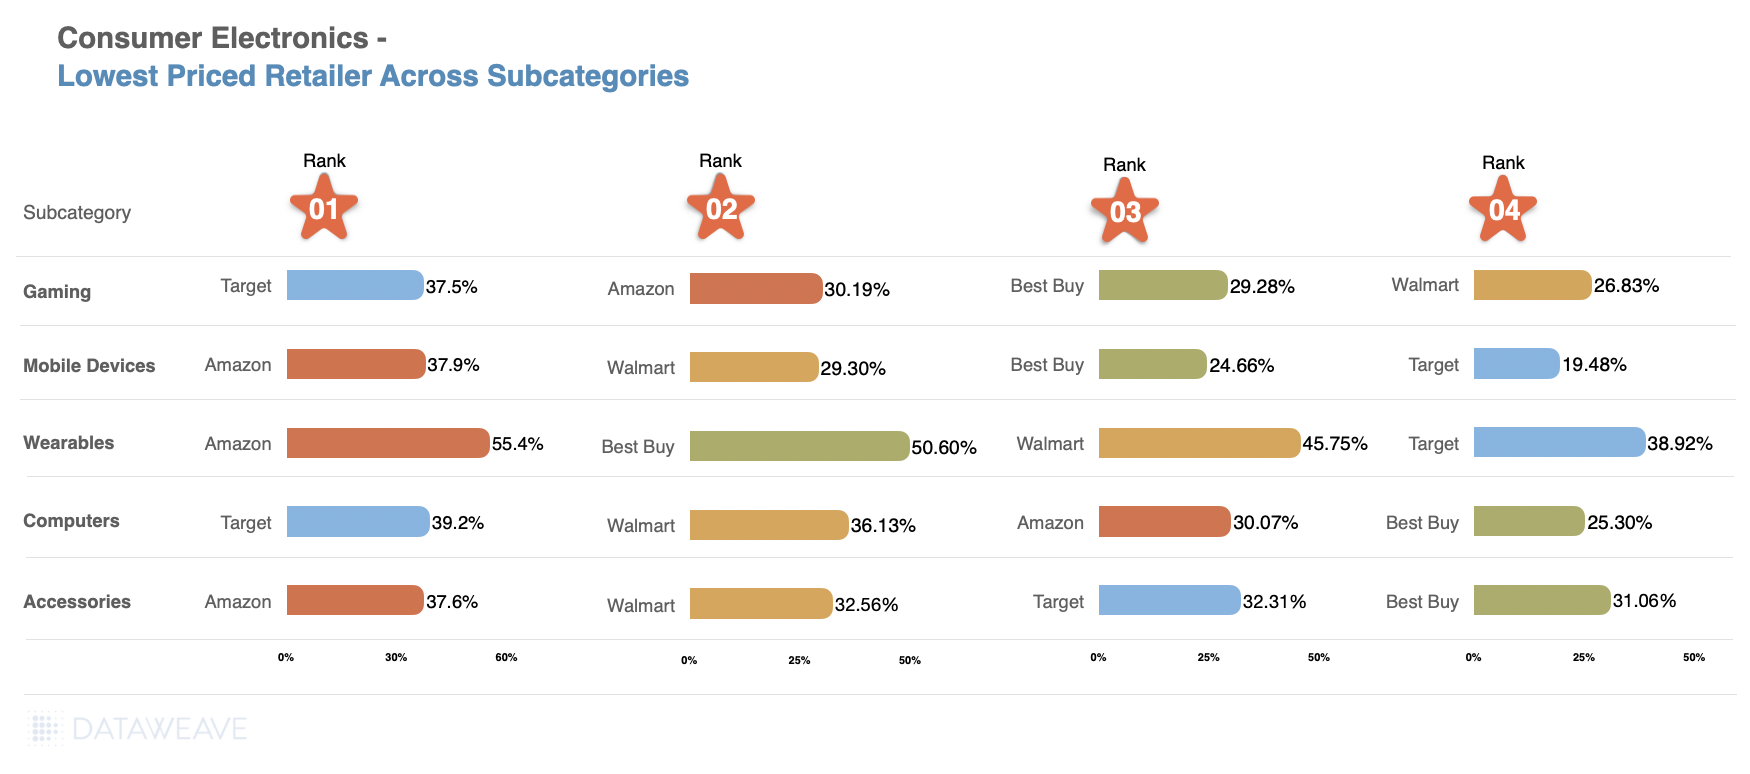
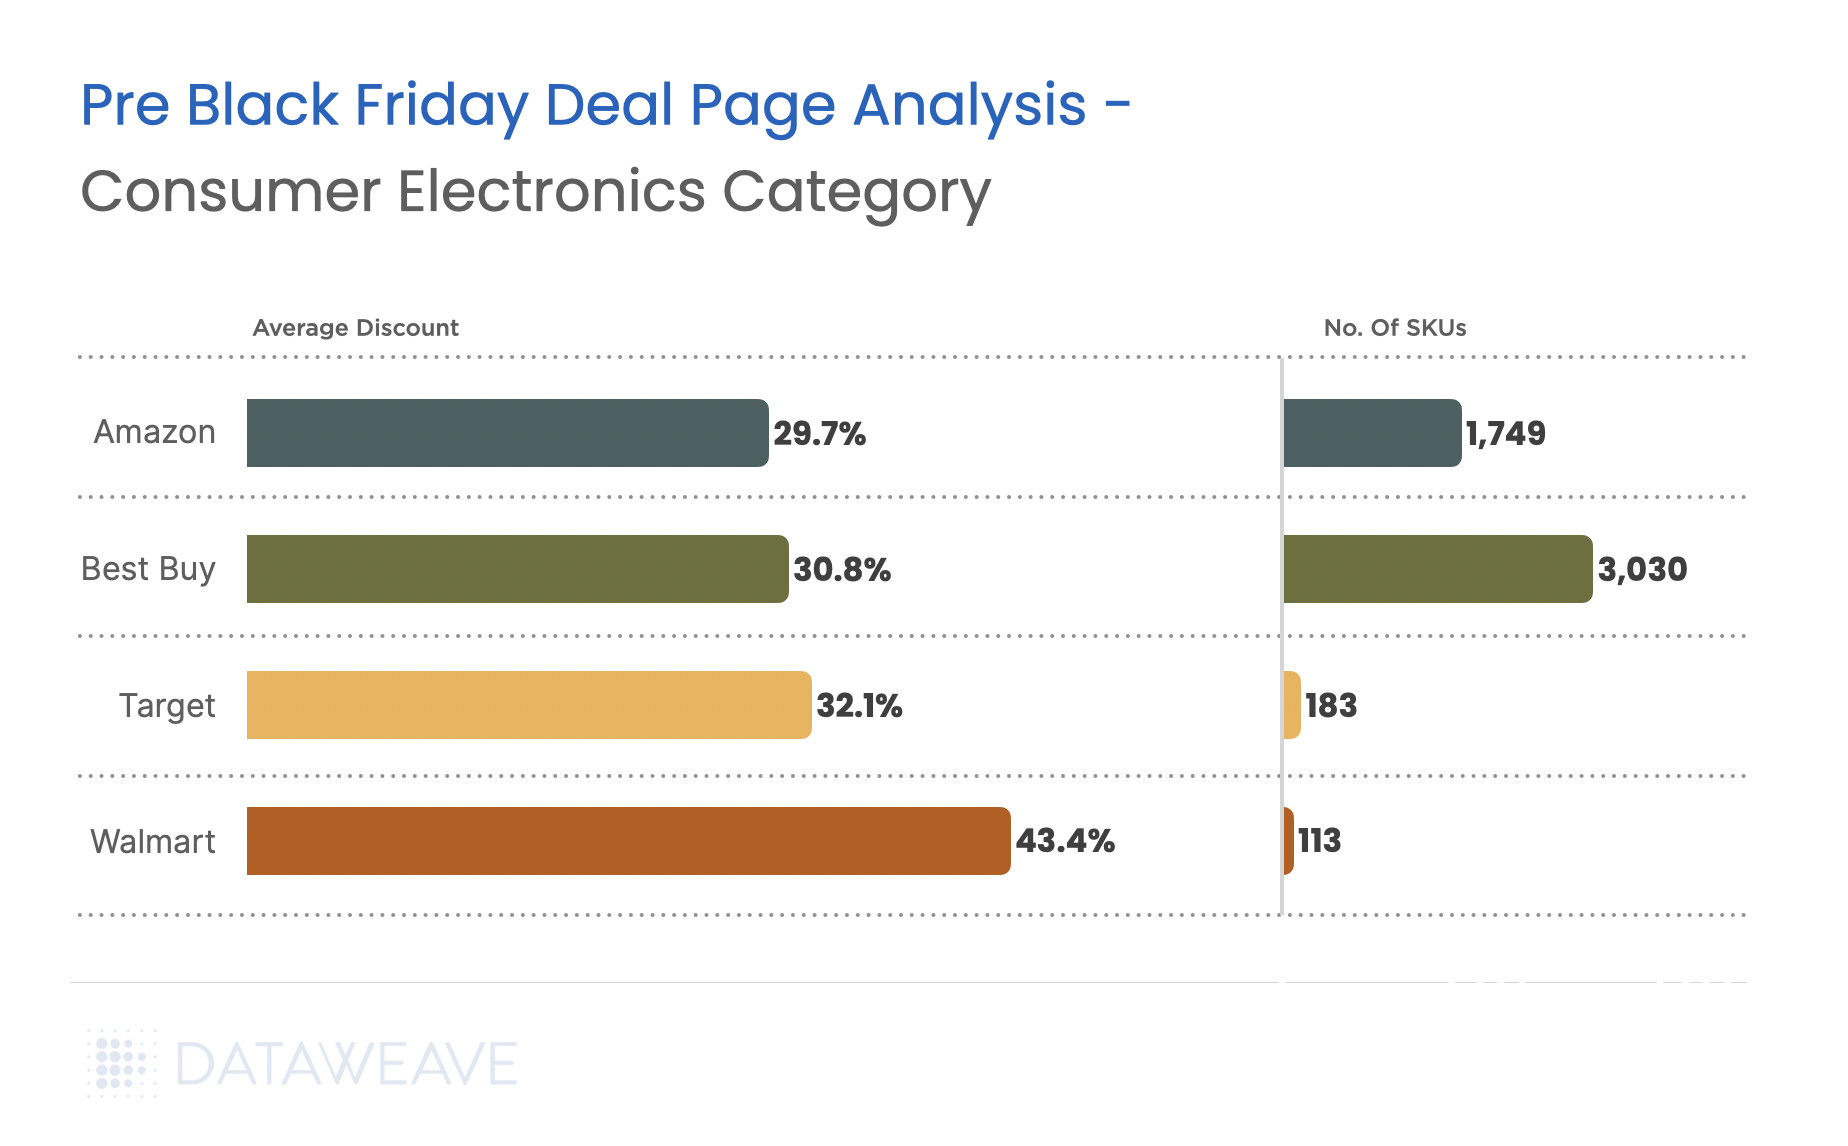
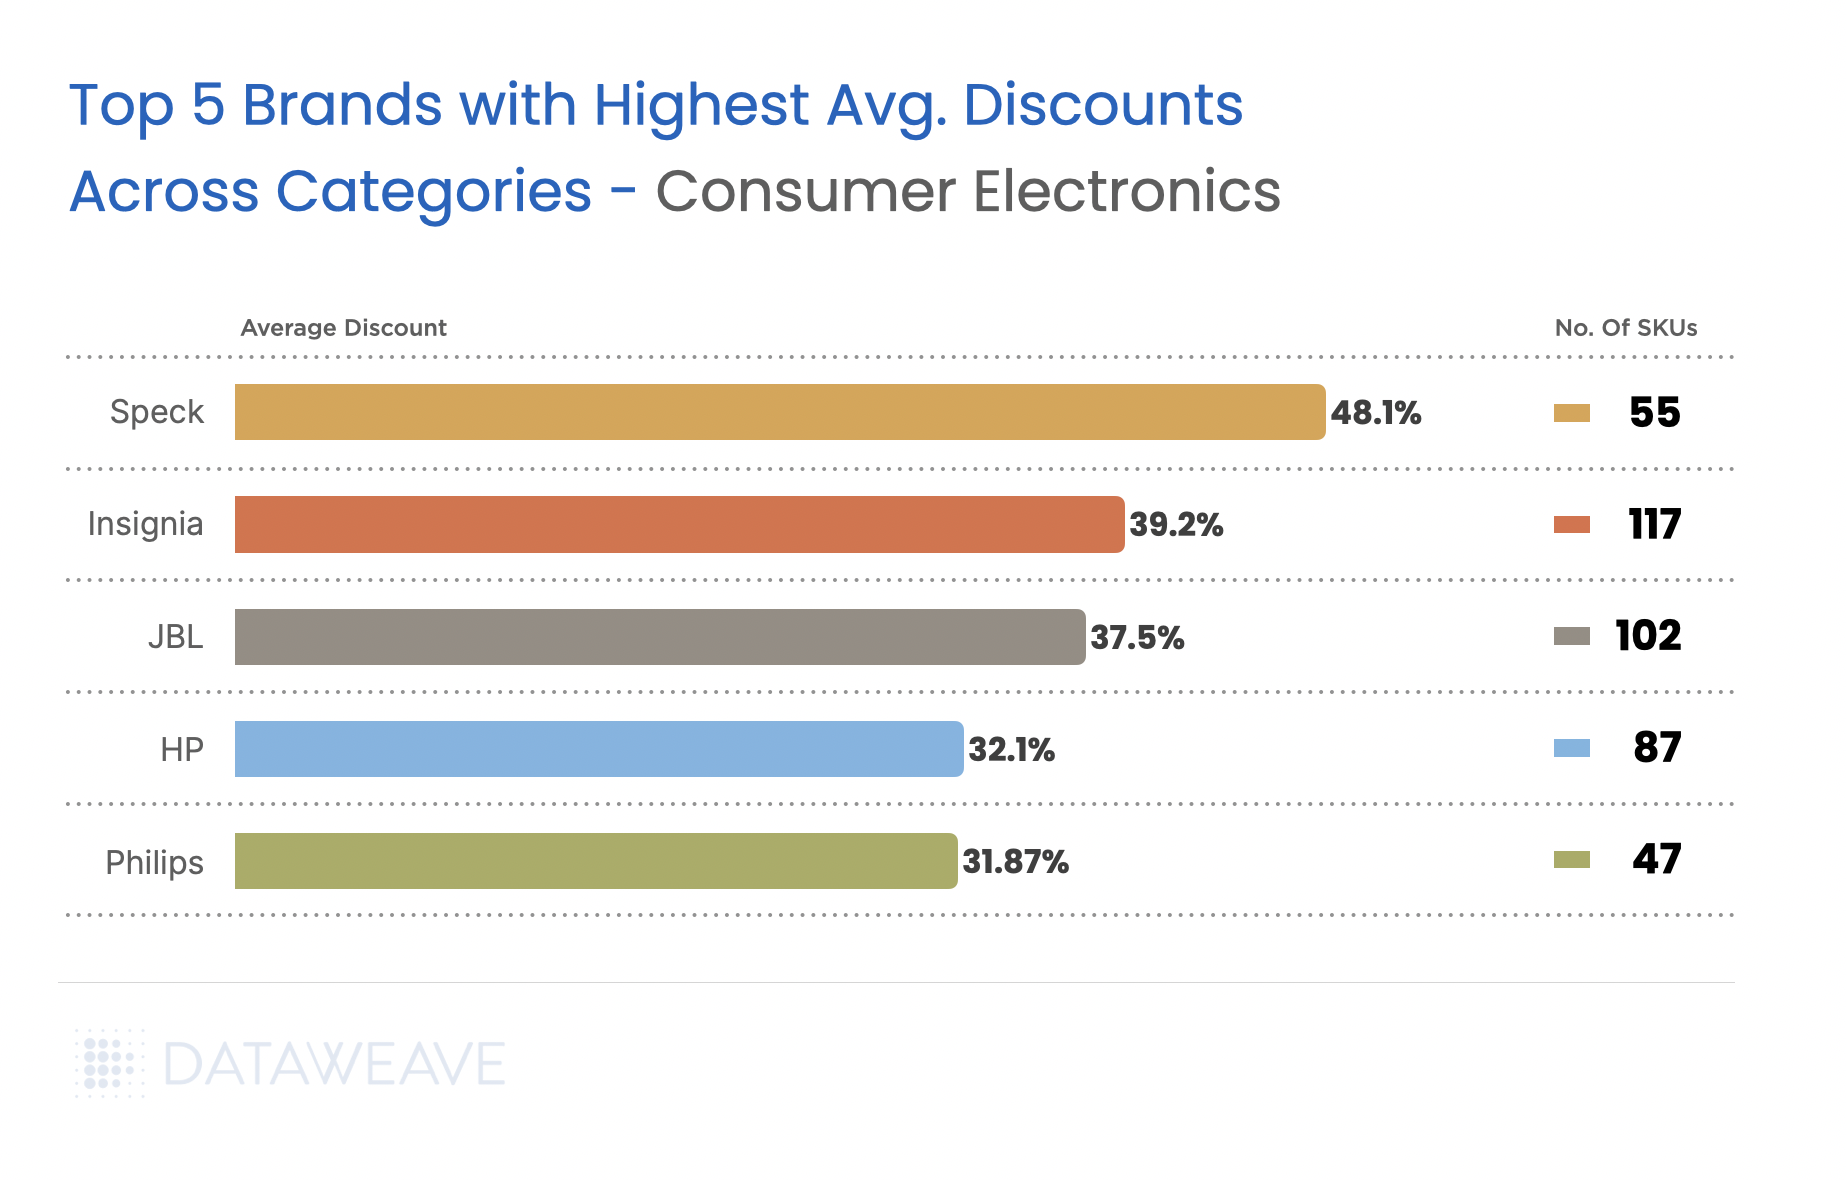
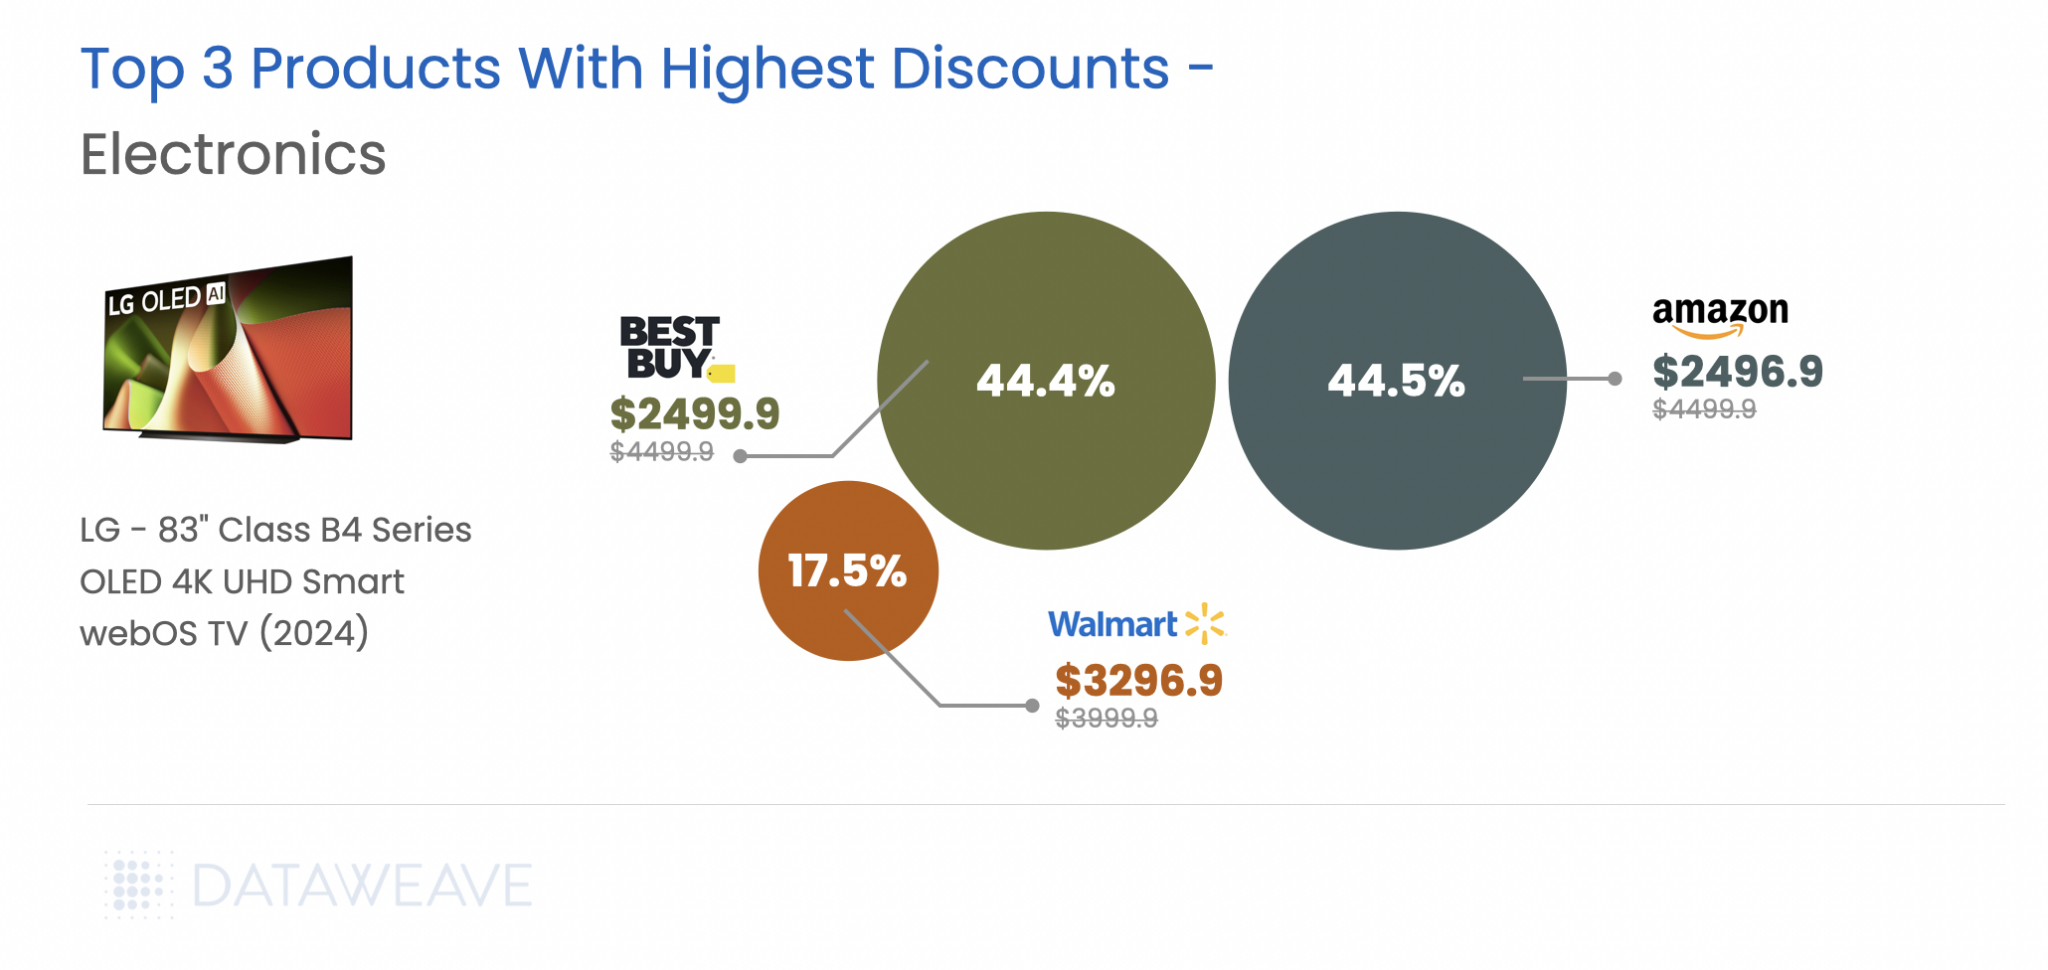
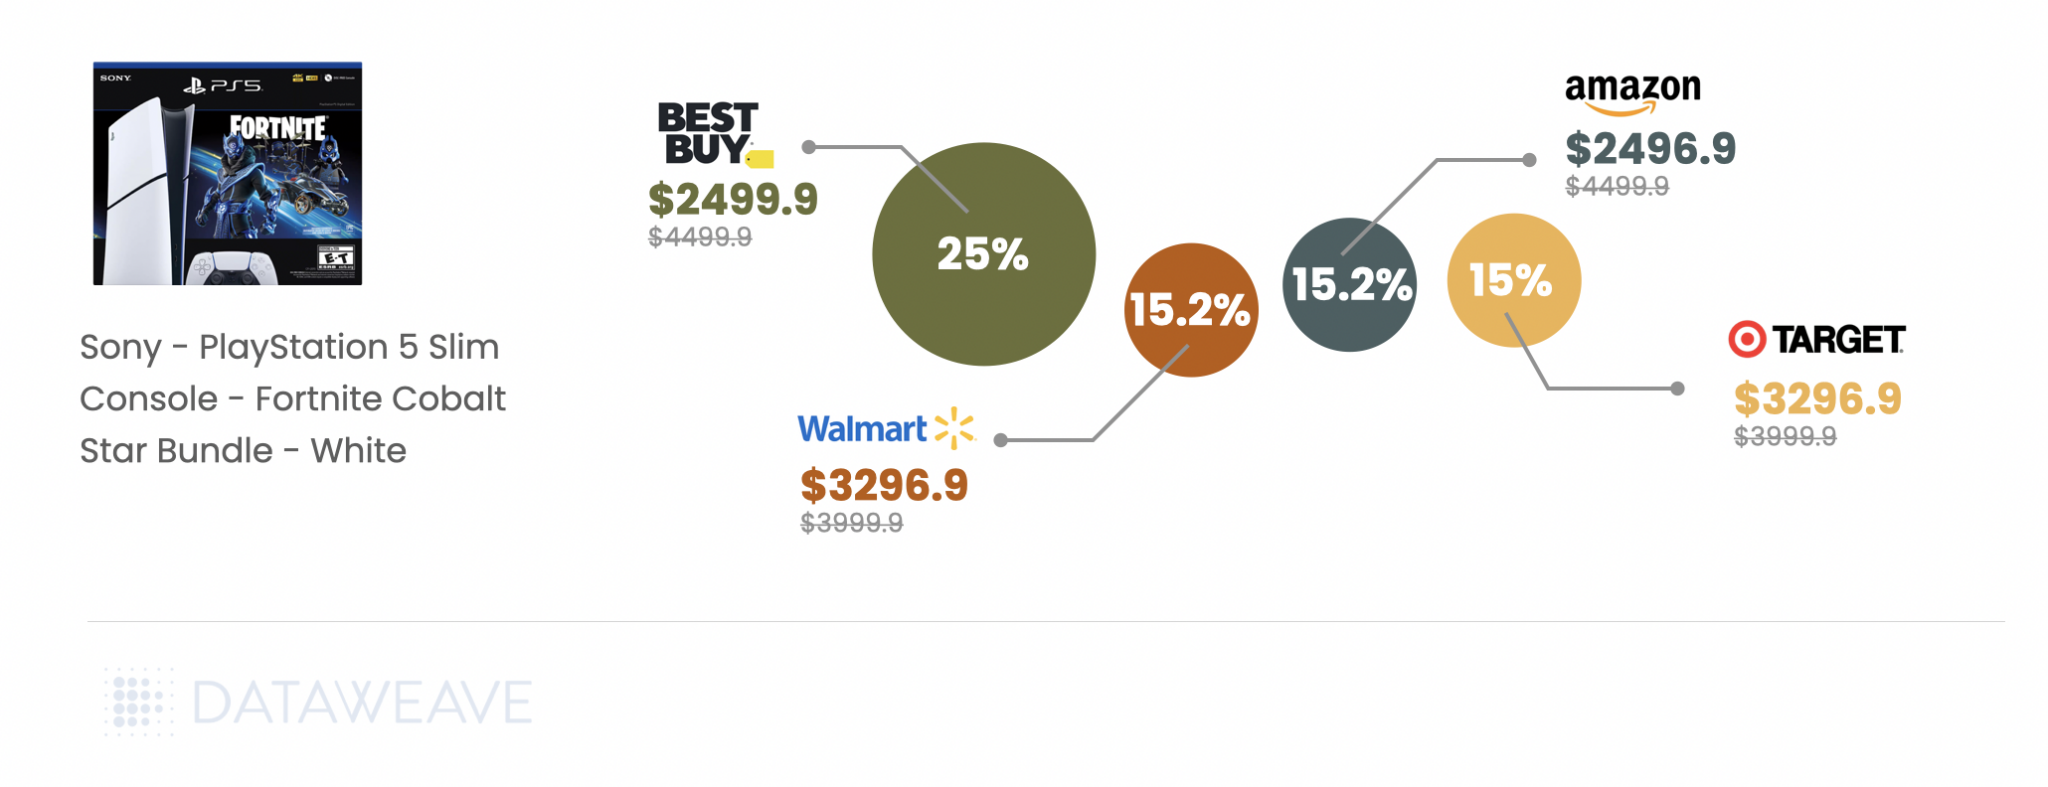
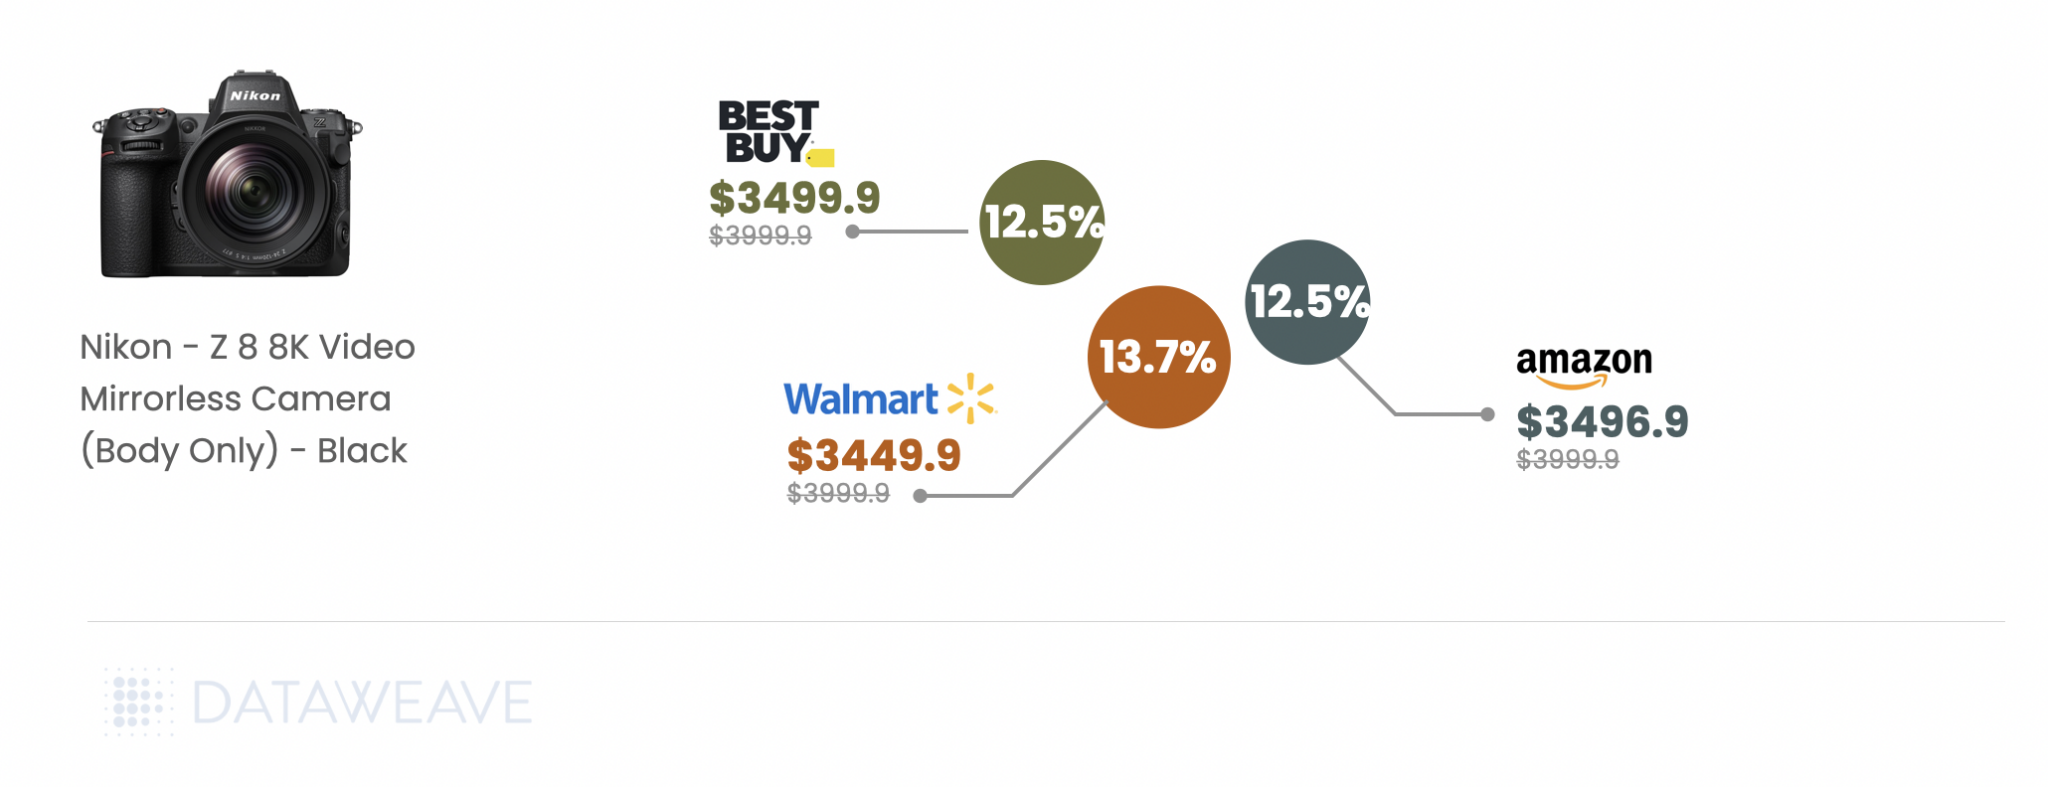
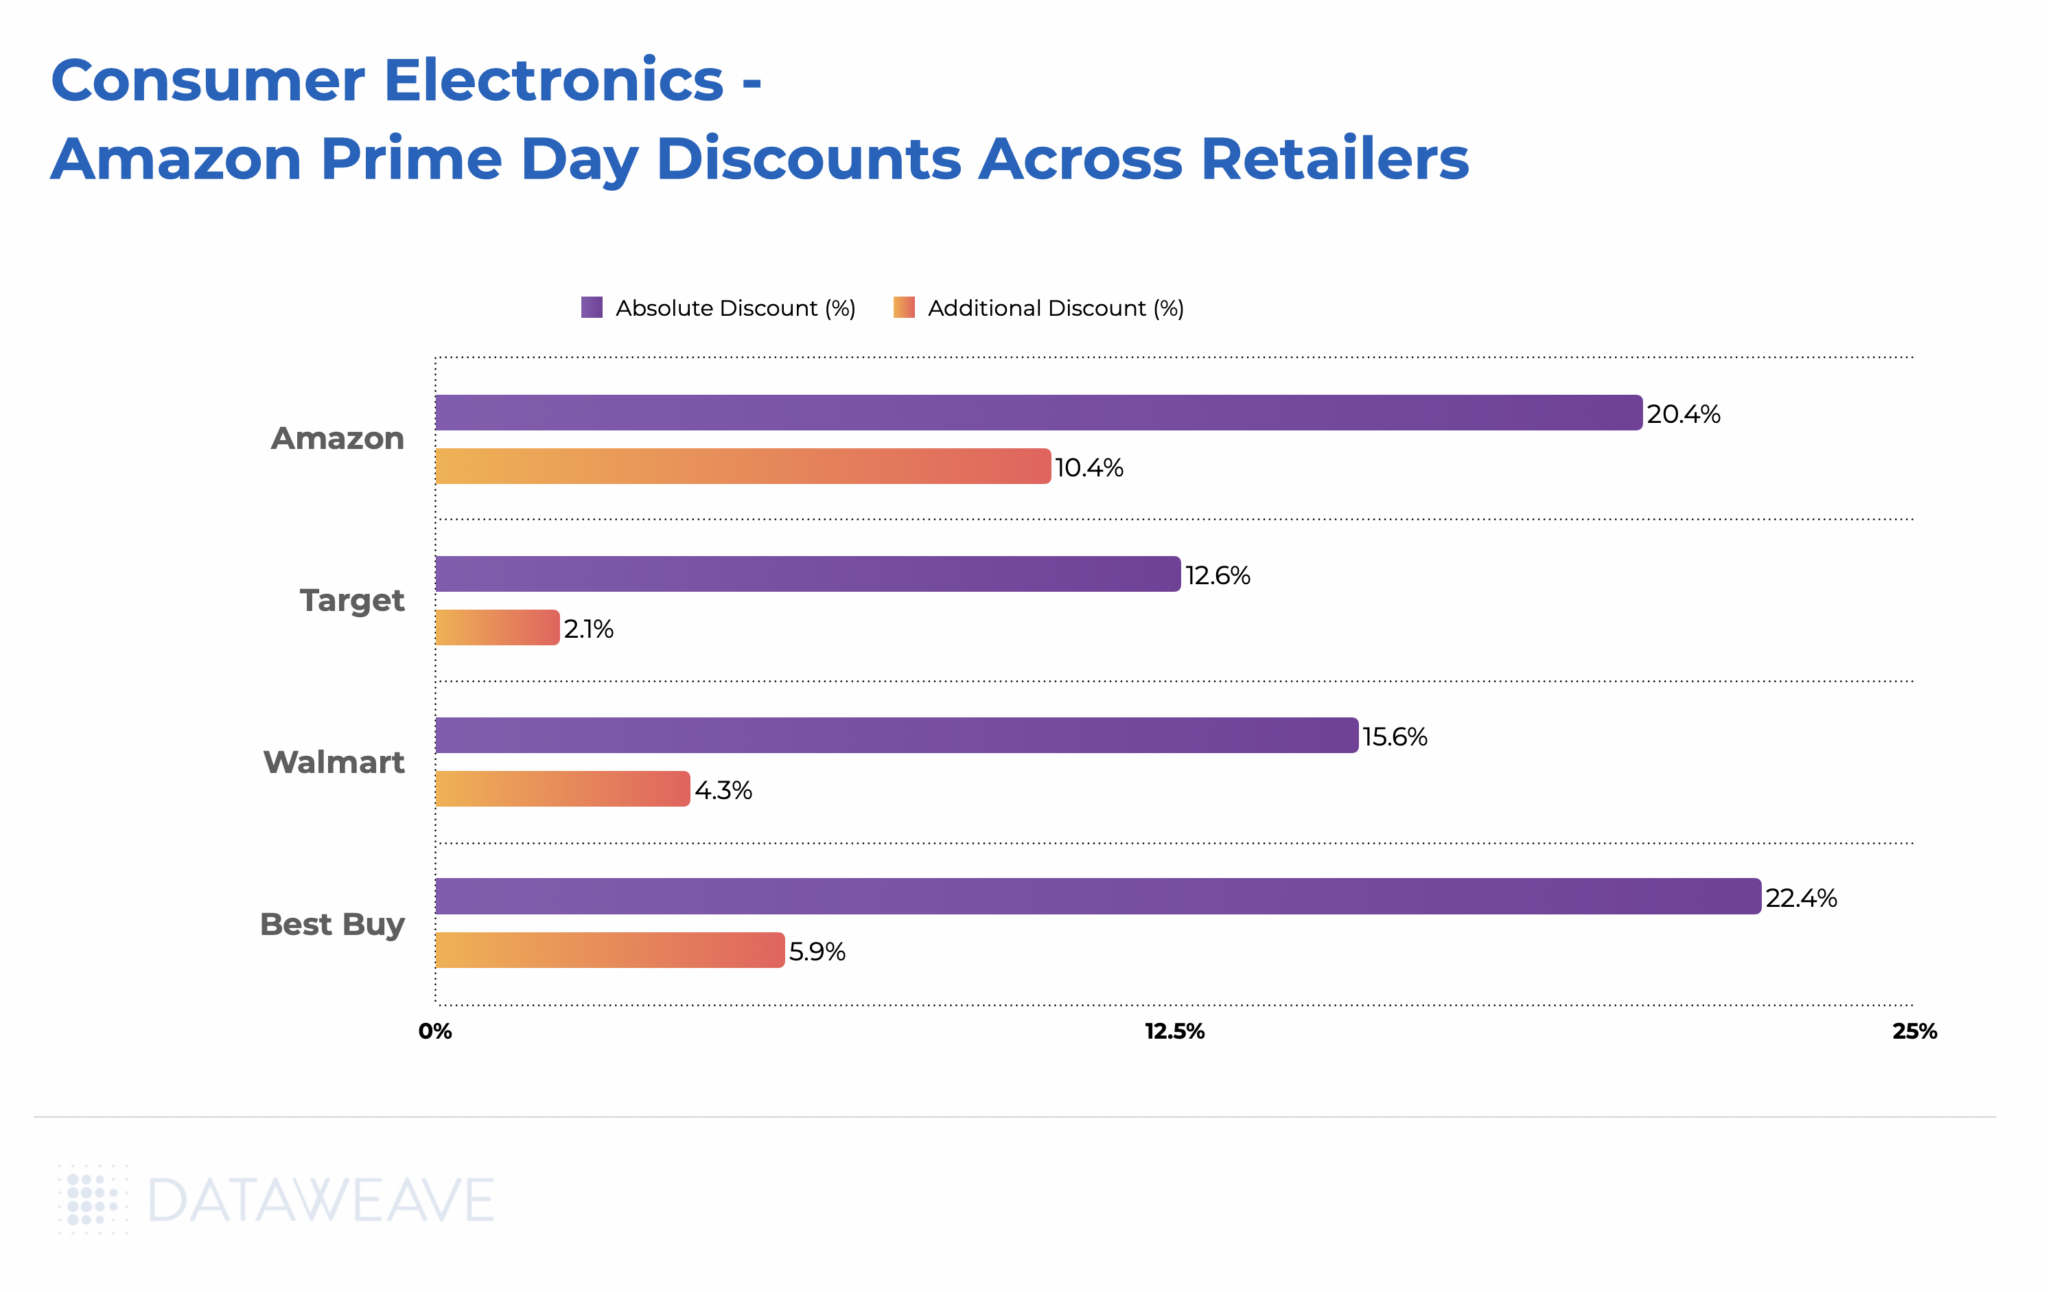
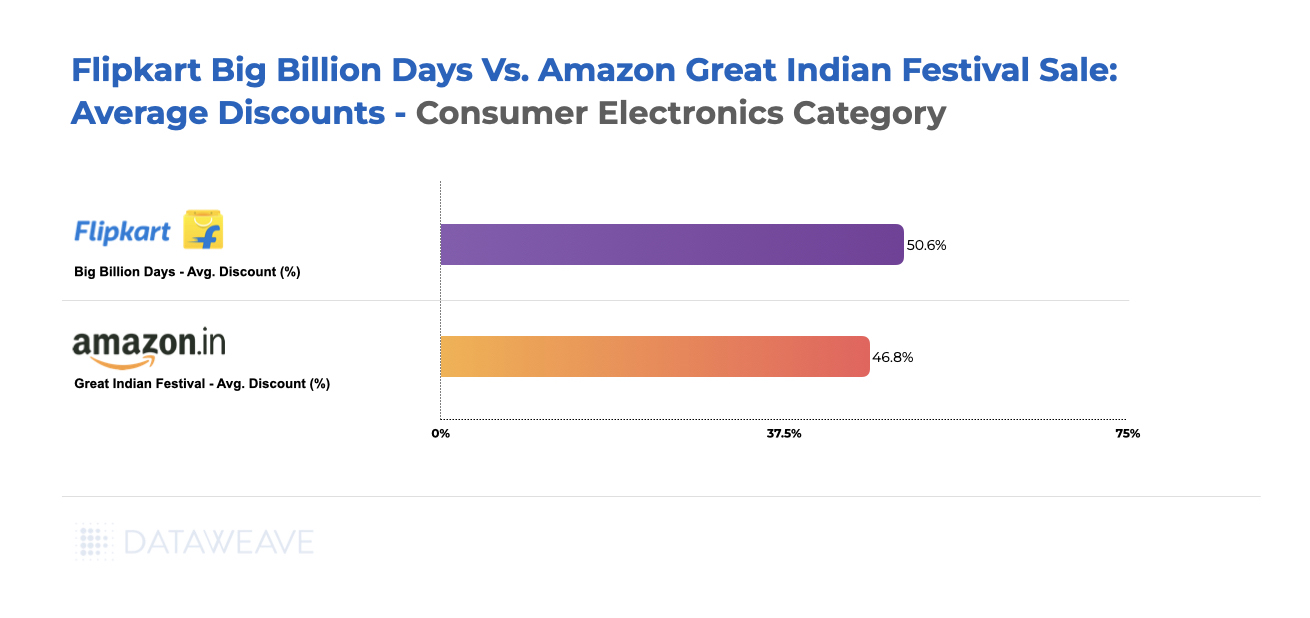
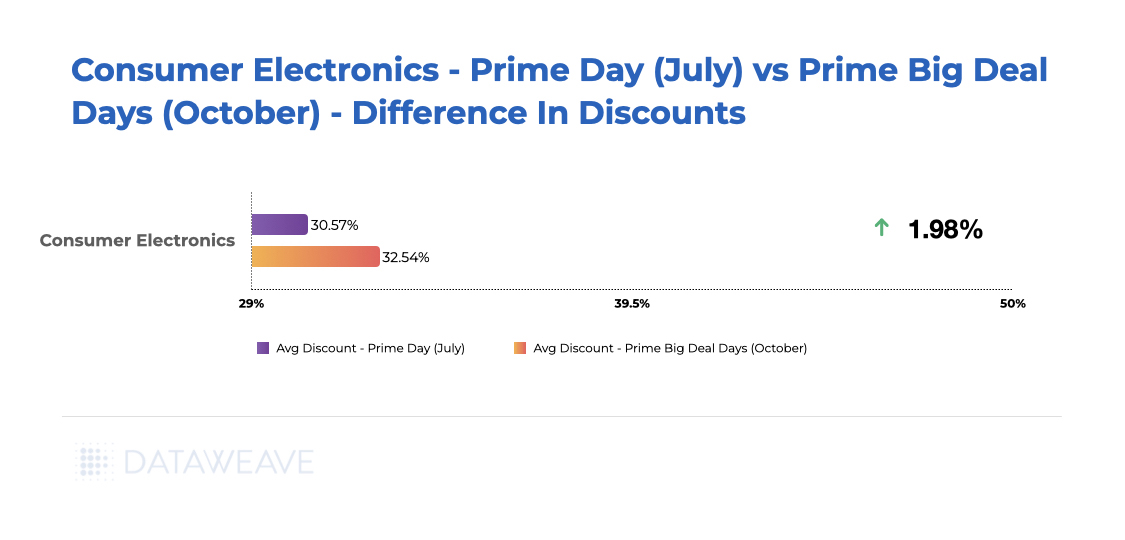
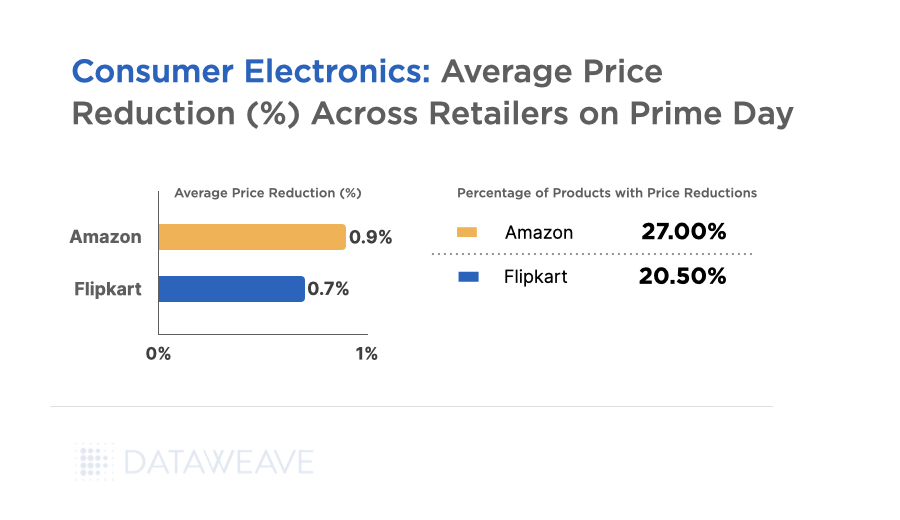
Consumer Electronics
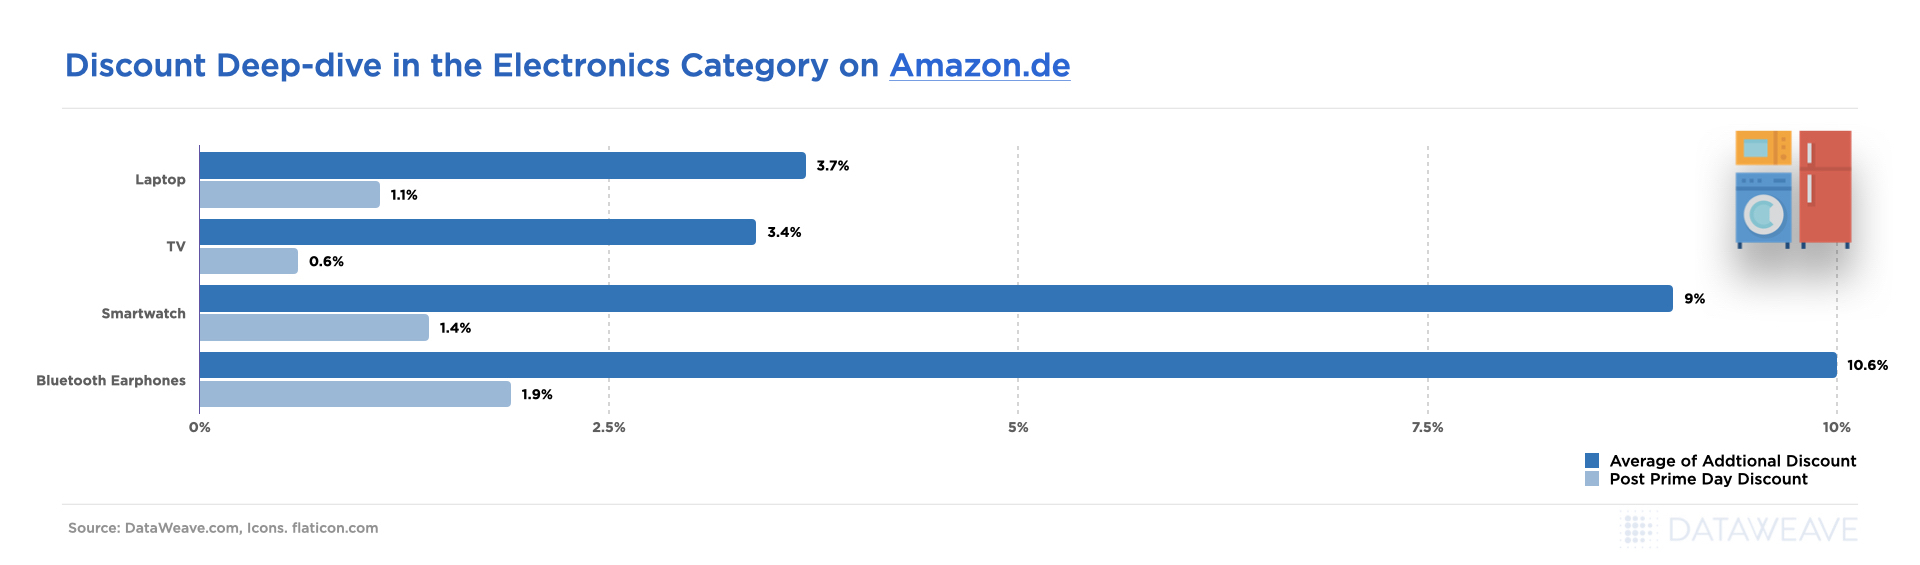
Consumer electronics dominated German Black Friday interest, with 77% of German shoppers most interested in electronics deals, making it the most anticipated category during the sales period. Our analysis of 2,077 SKUs reveals how discounts varied across subcategories and which brands dominated search visibility in this highly competitive category.
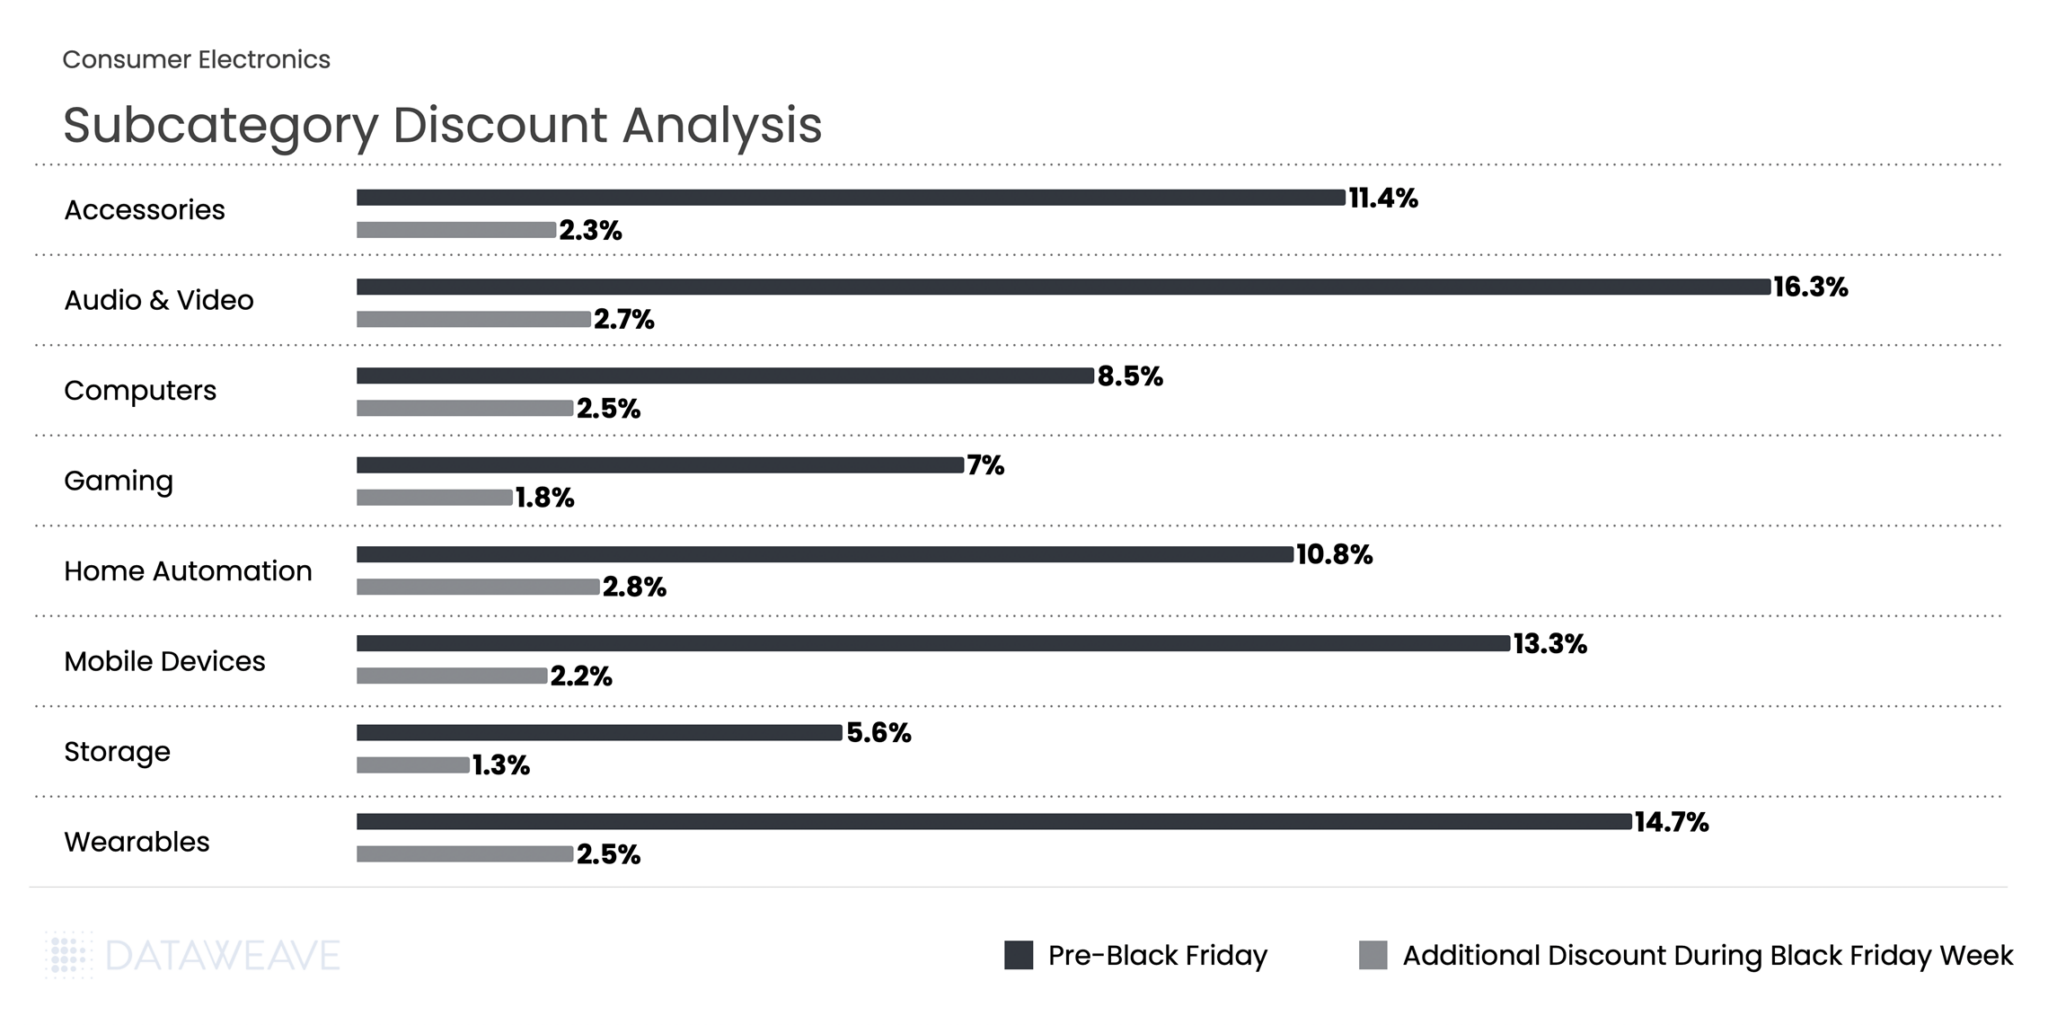
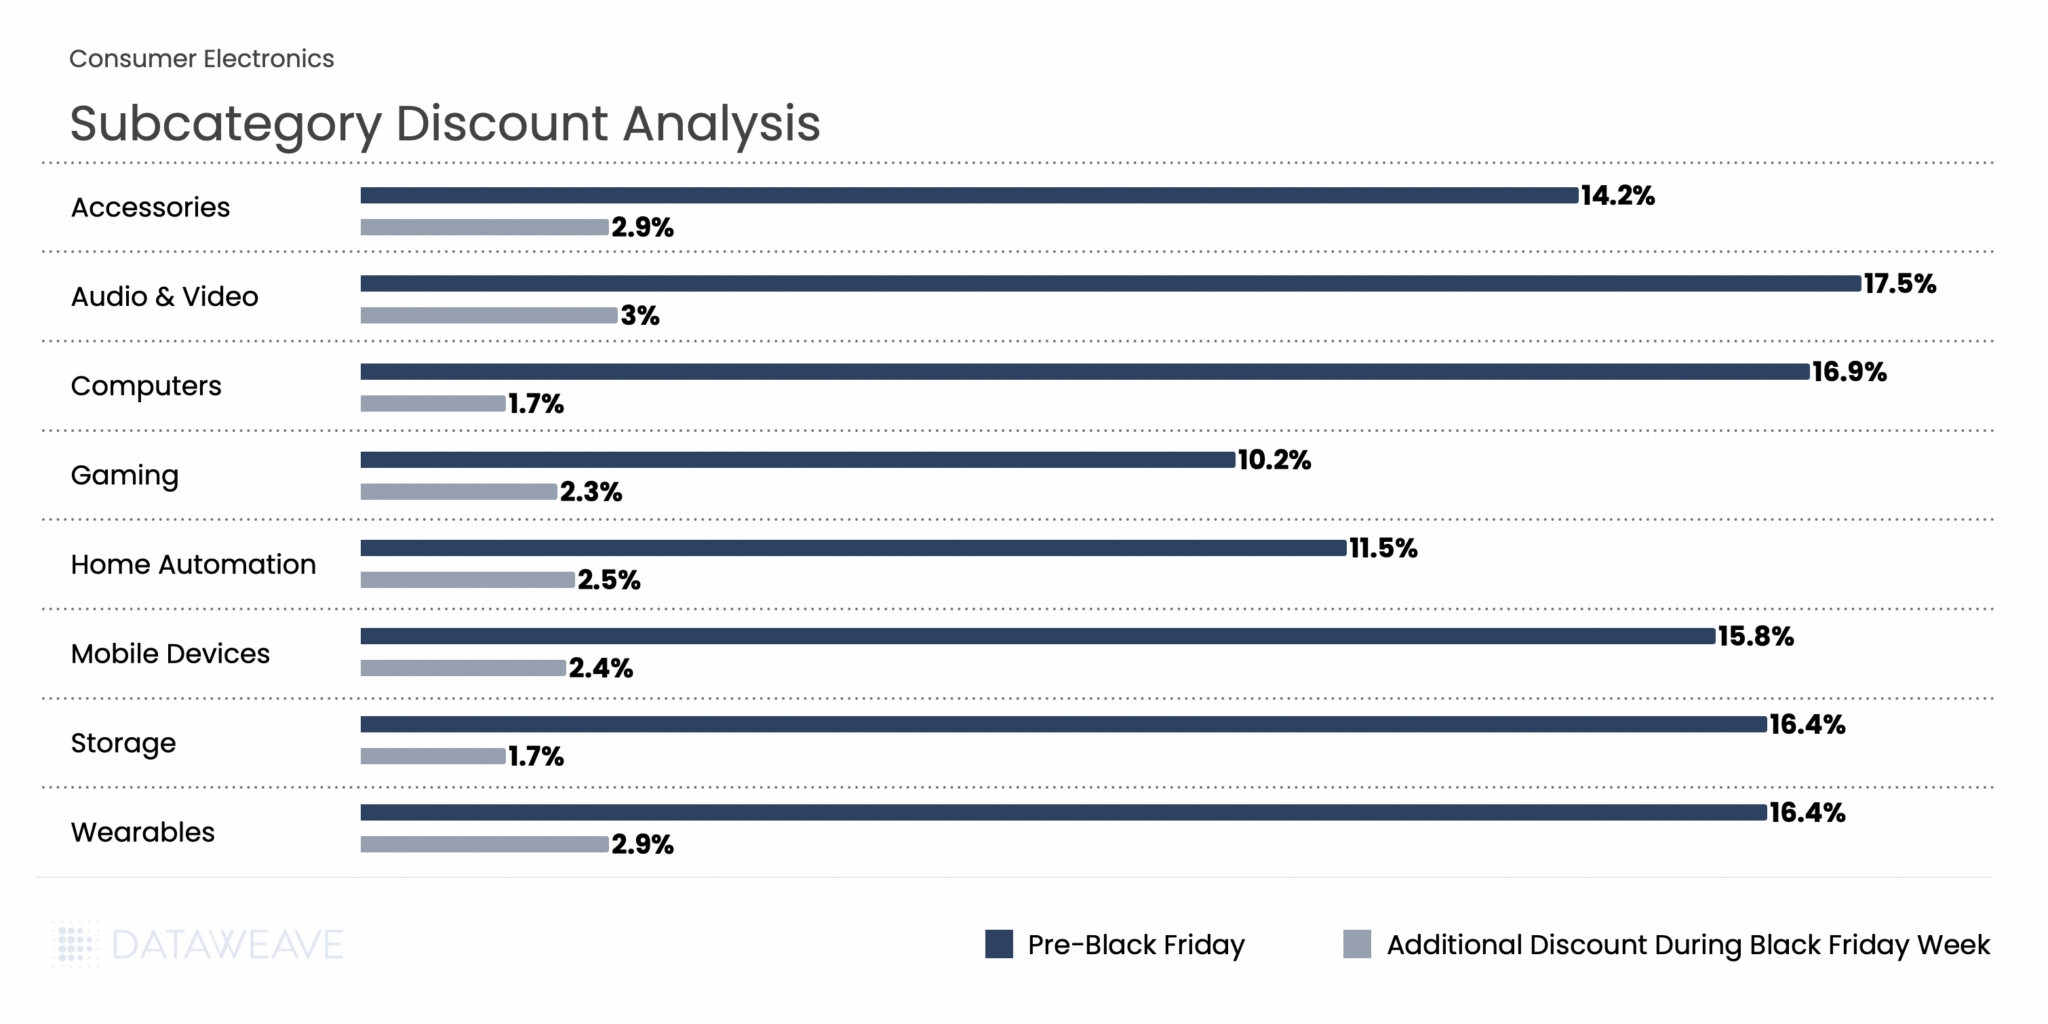
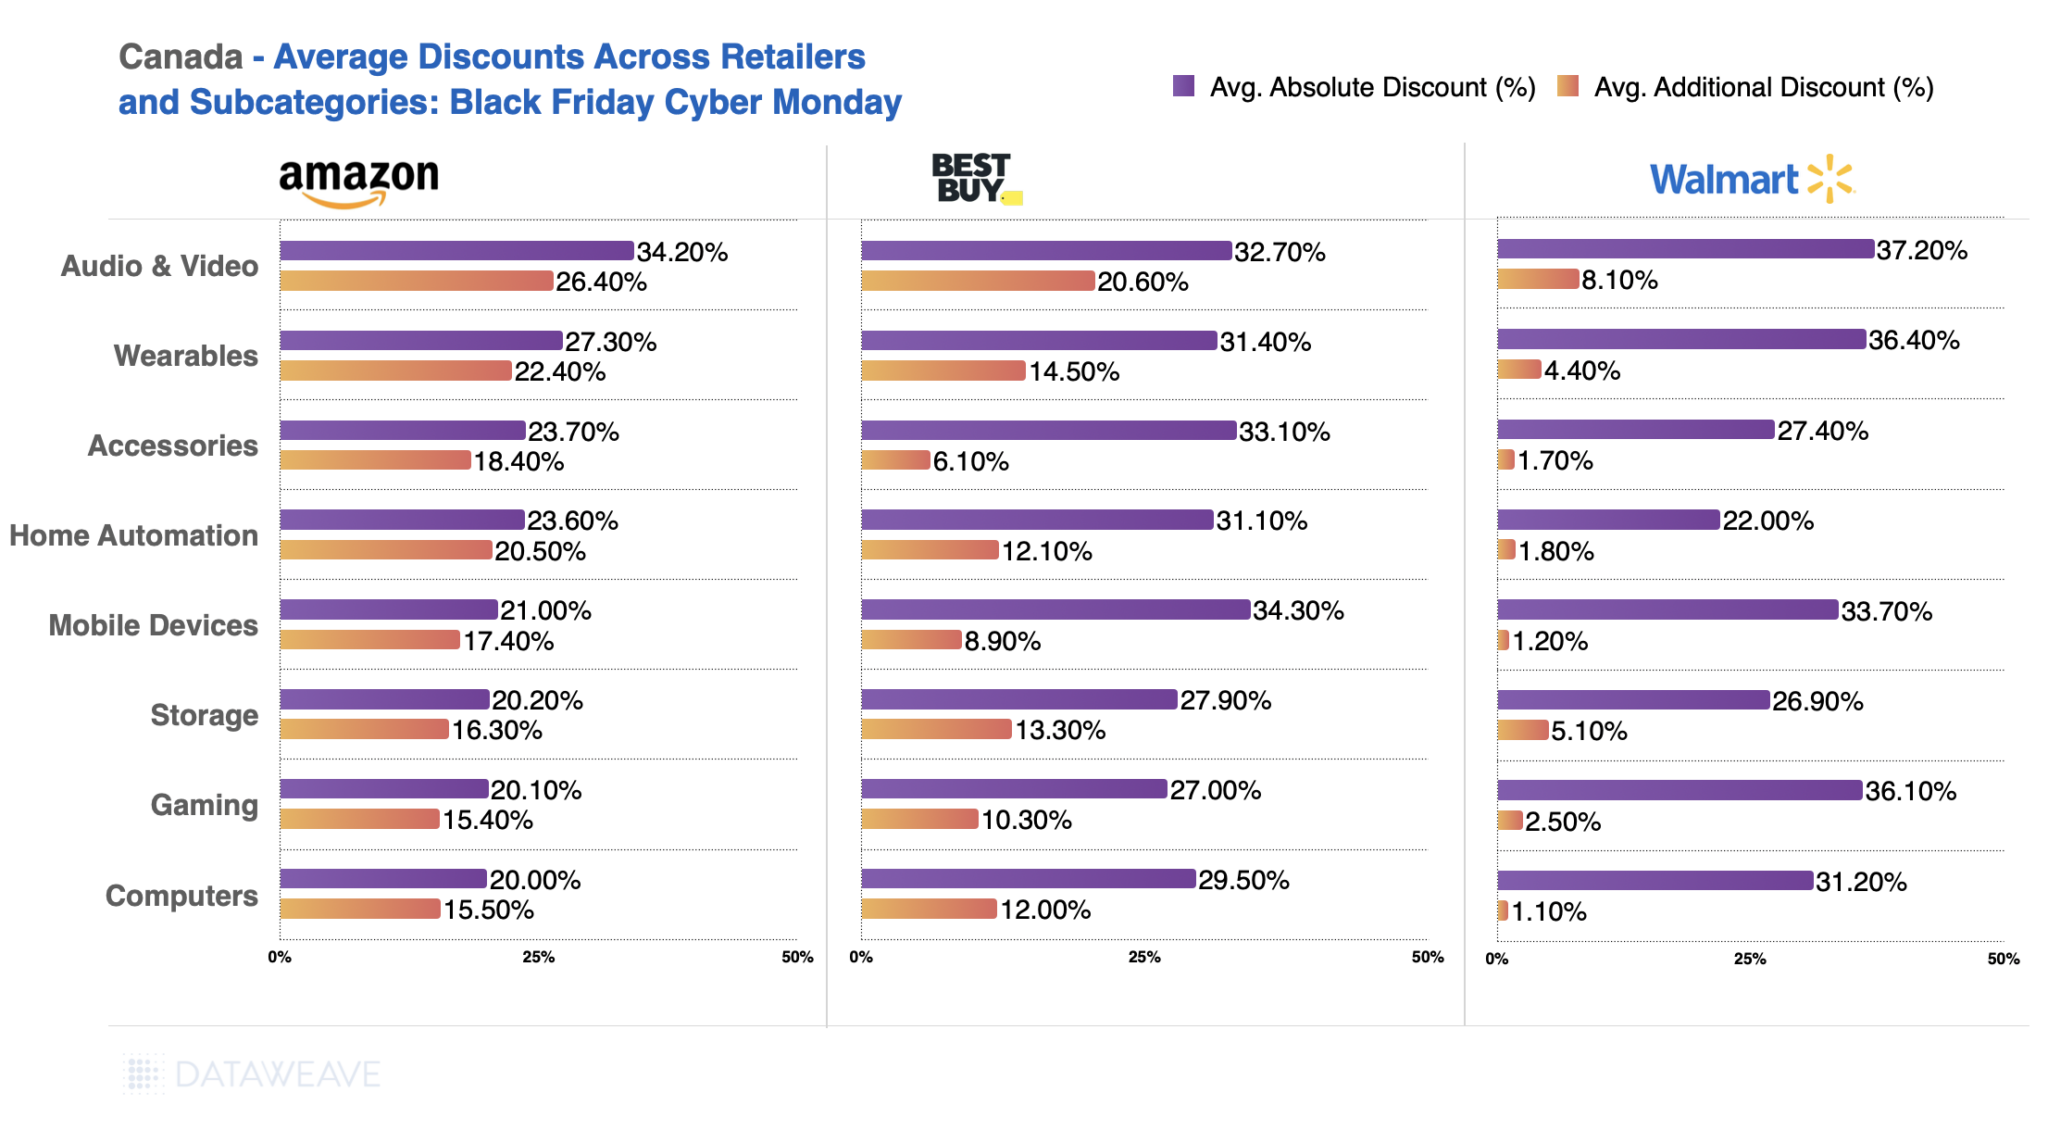
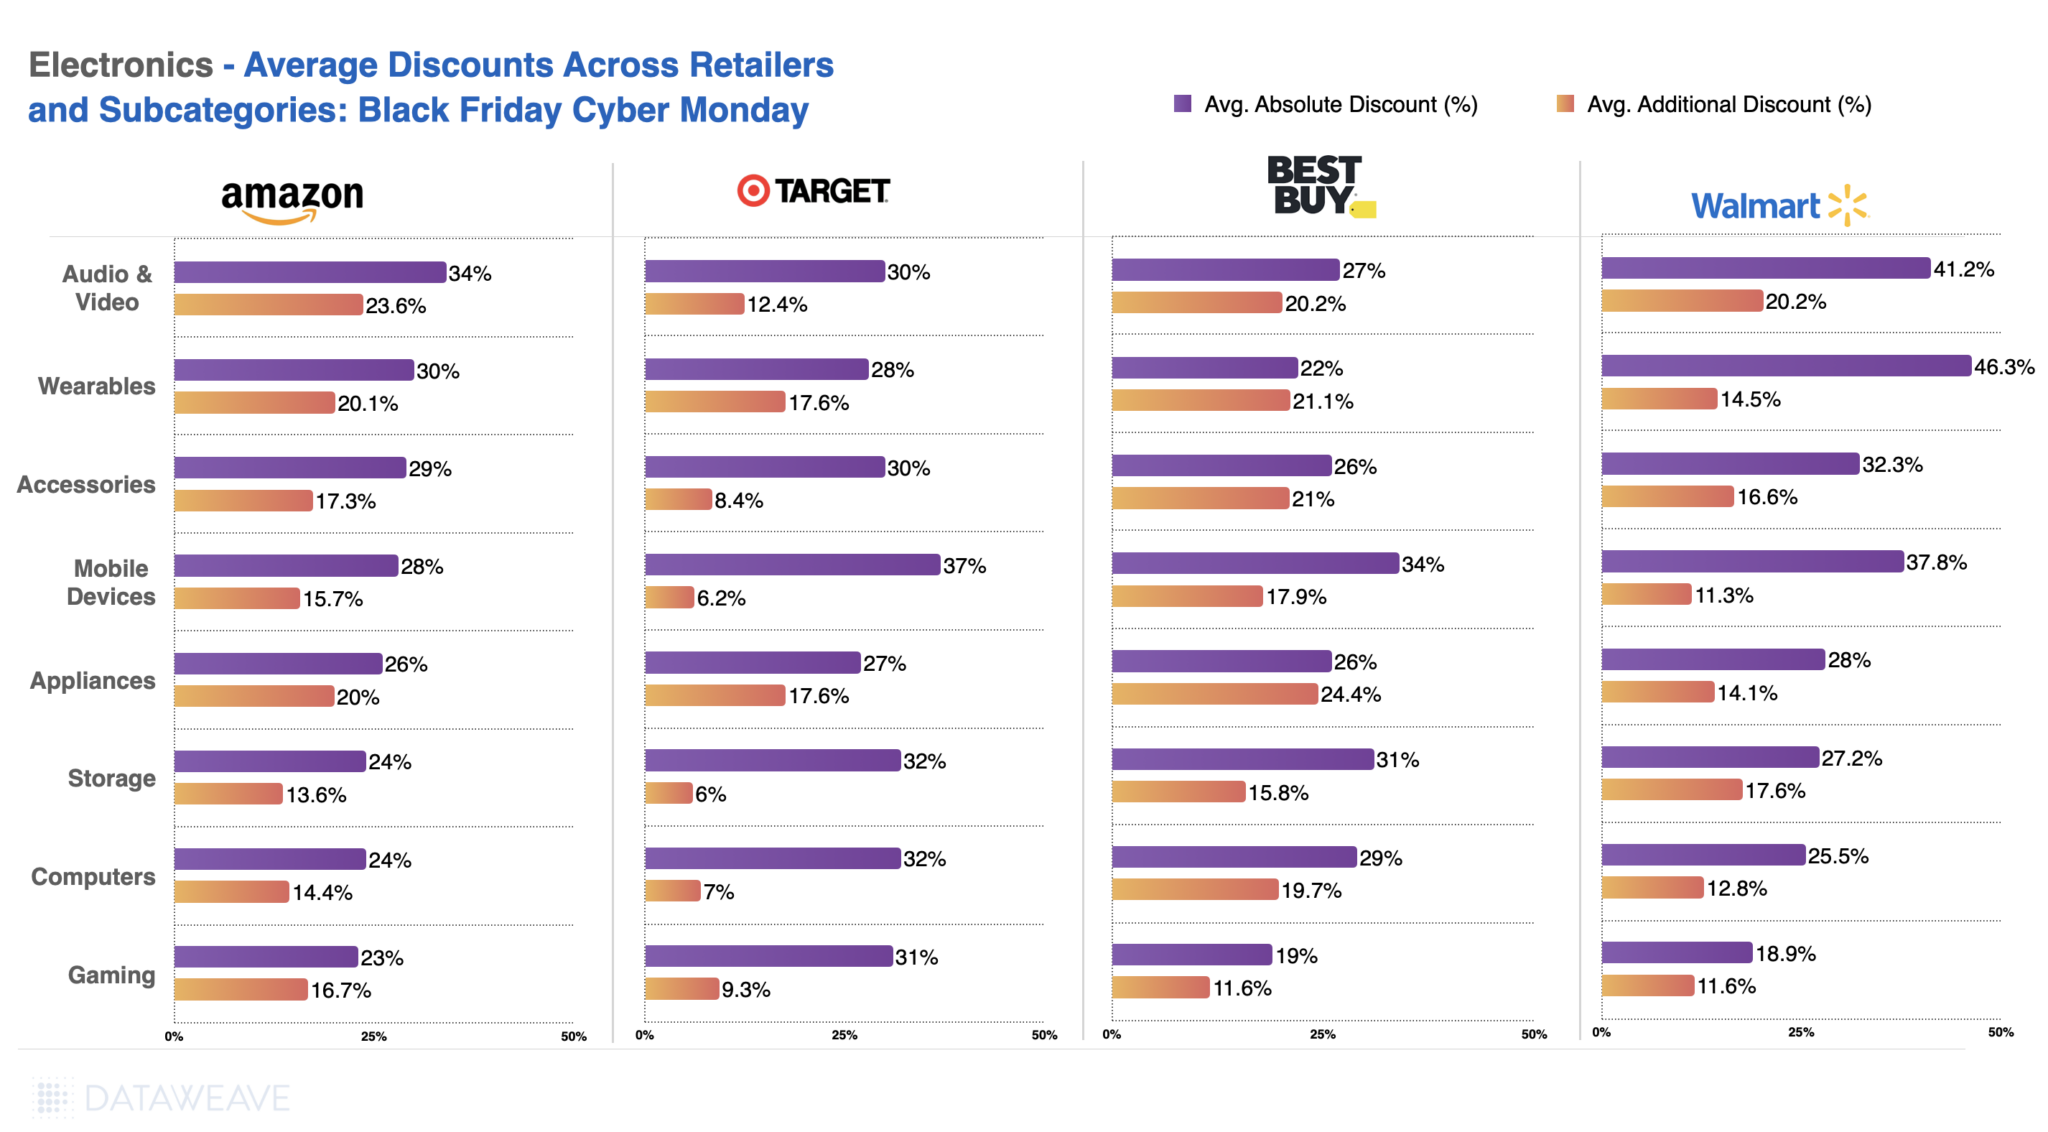
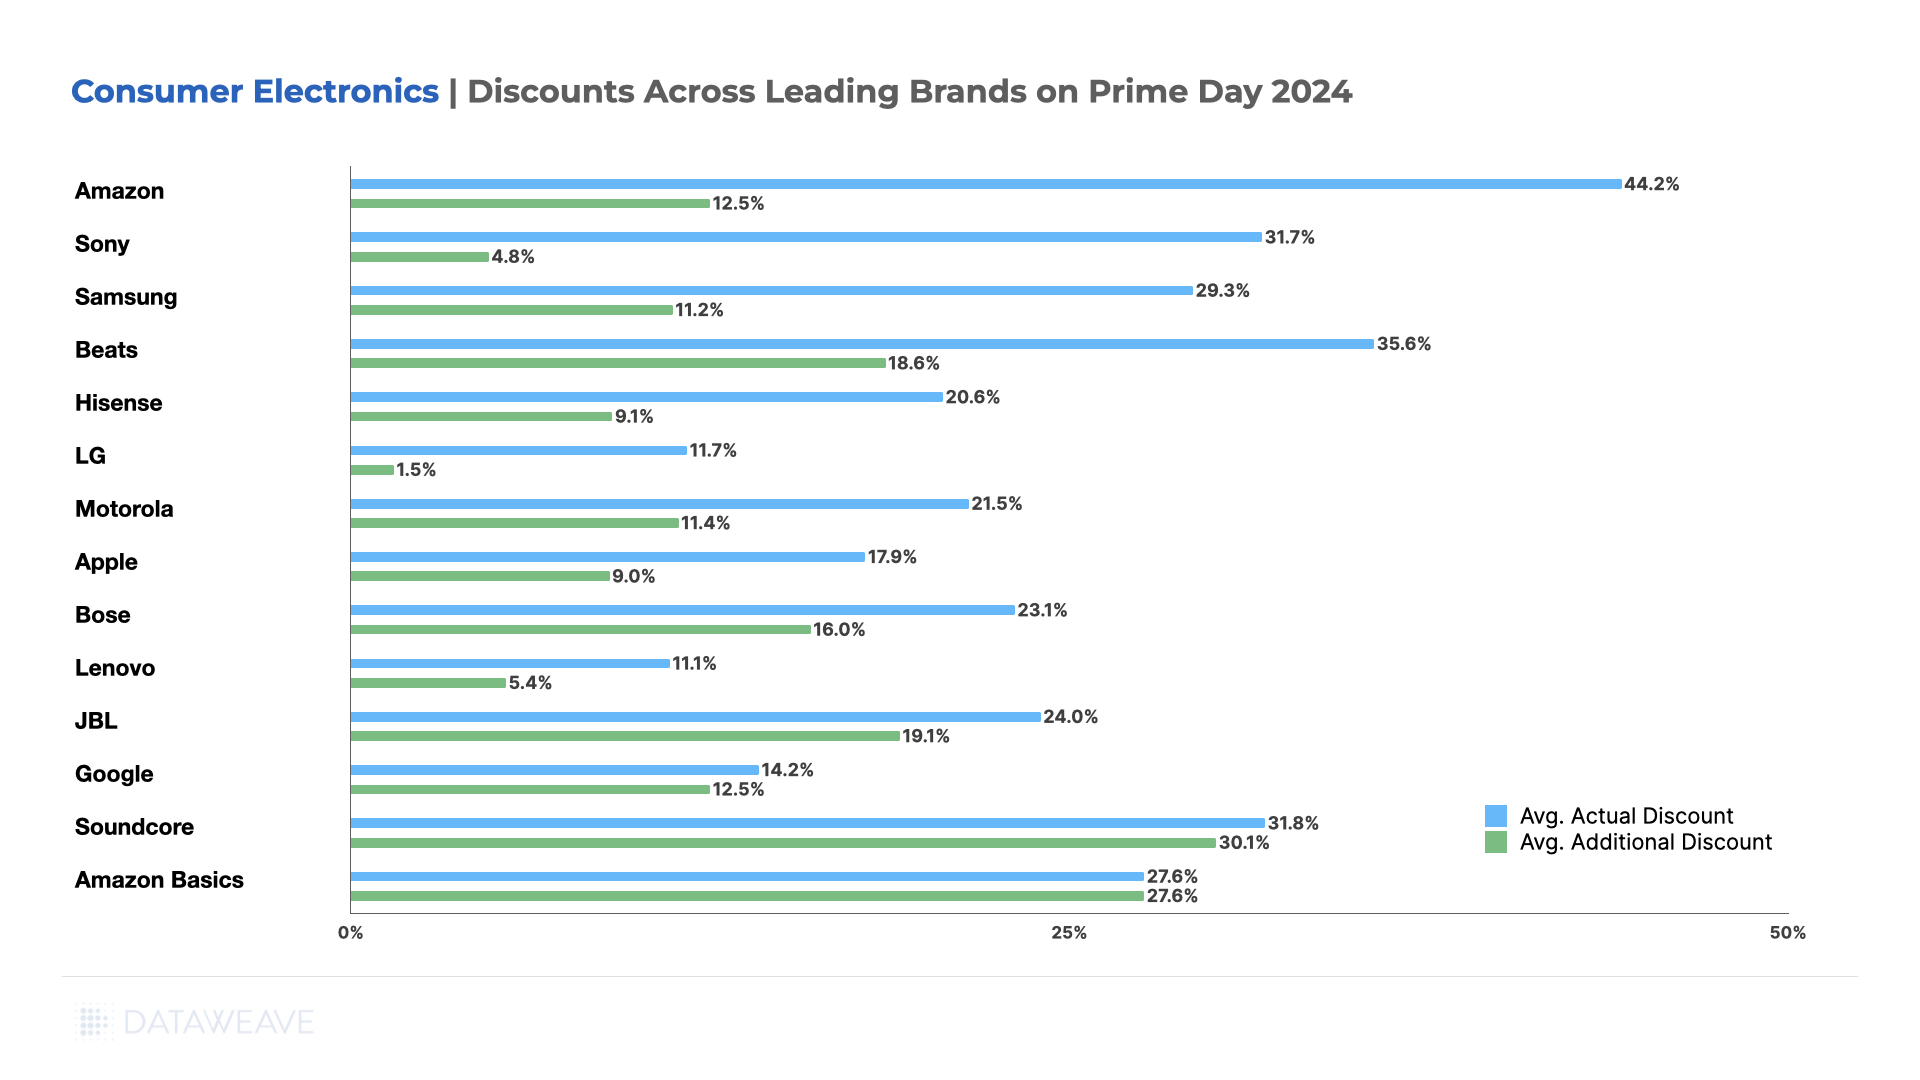
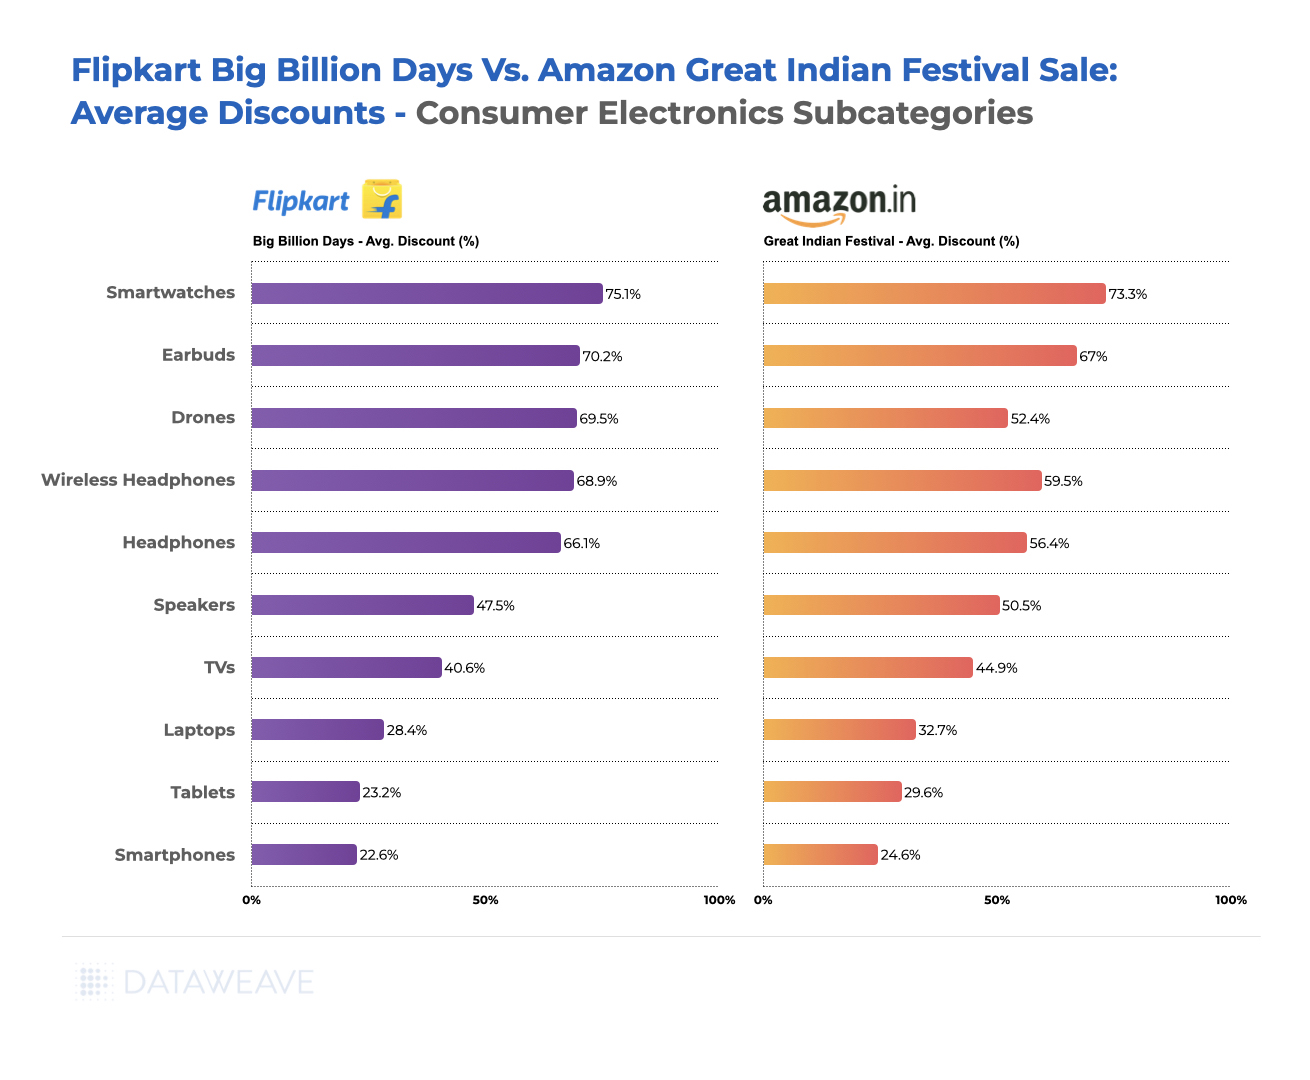
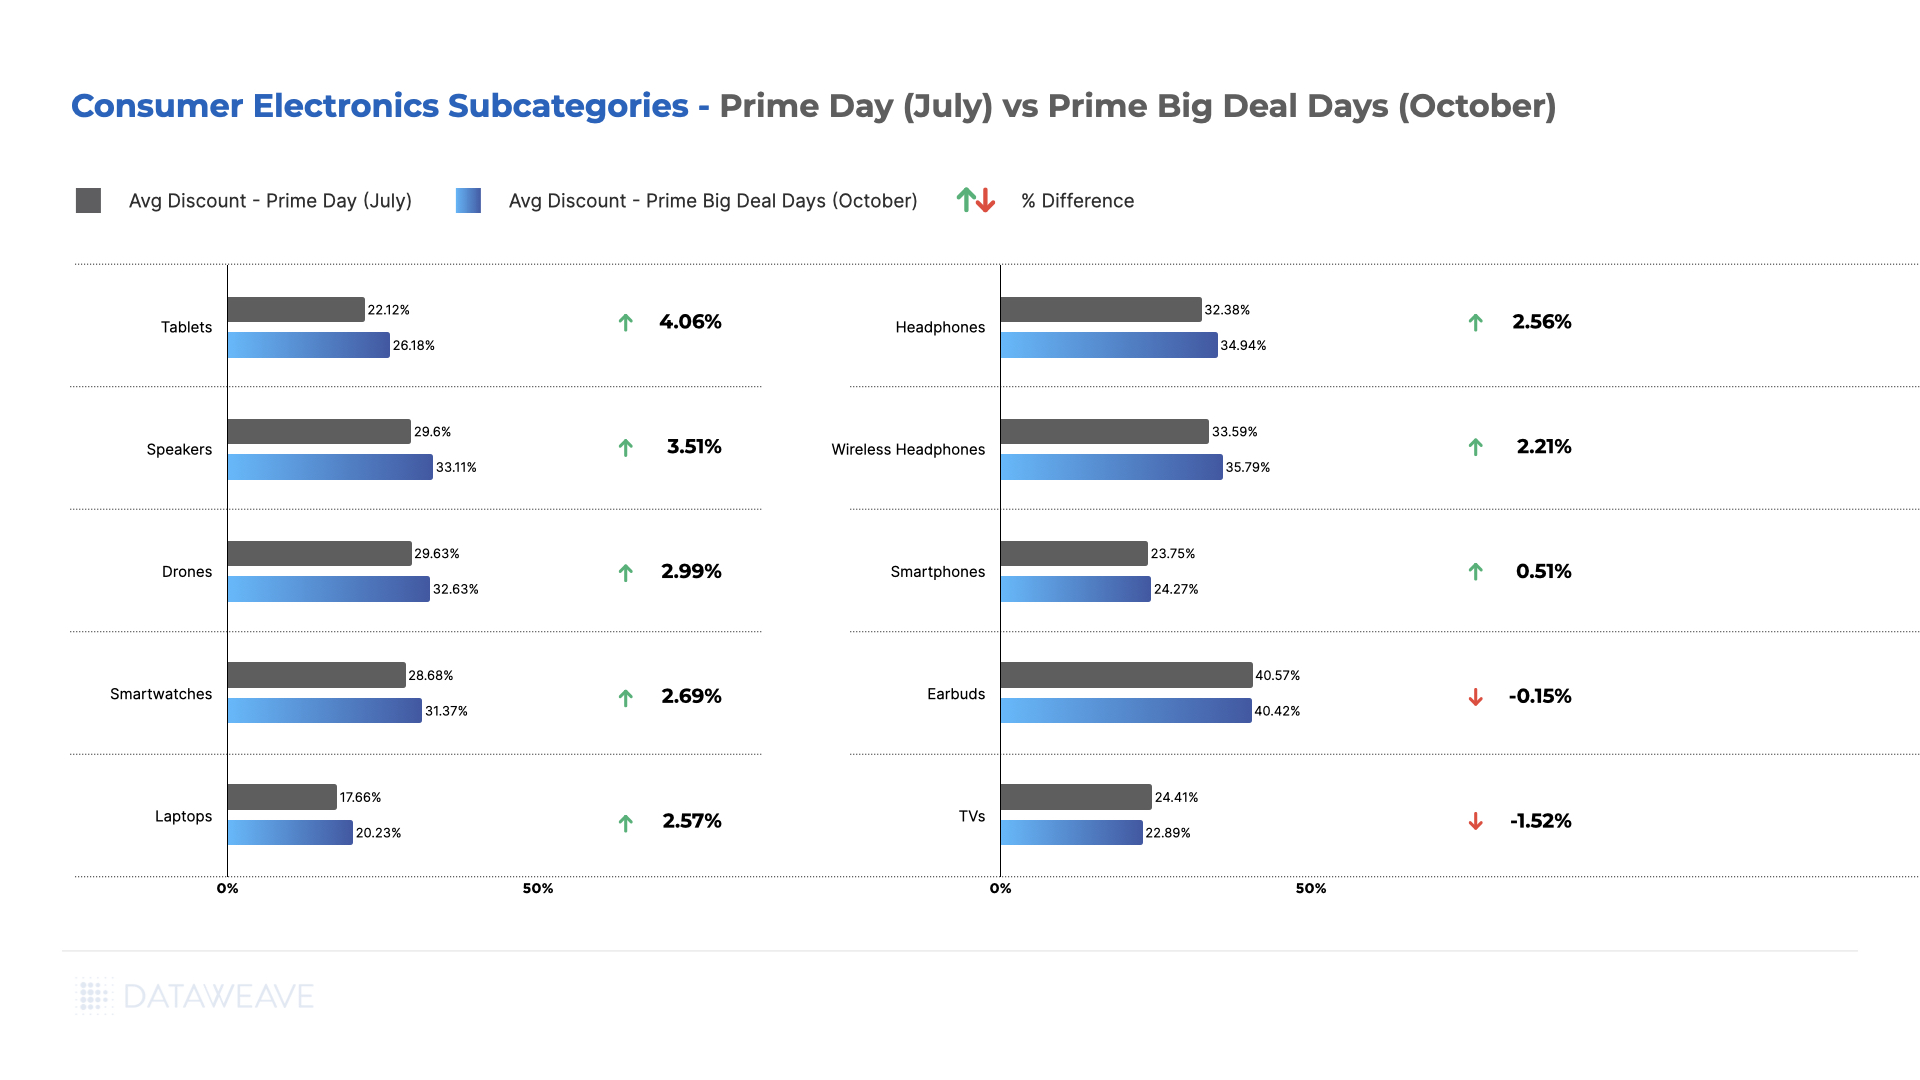
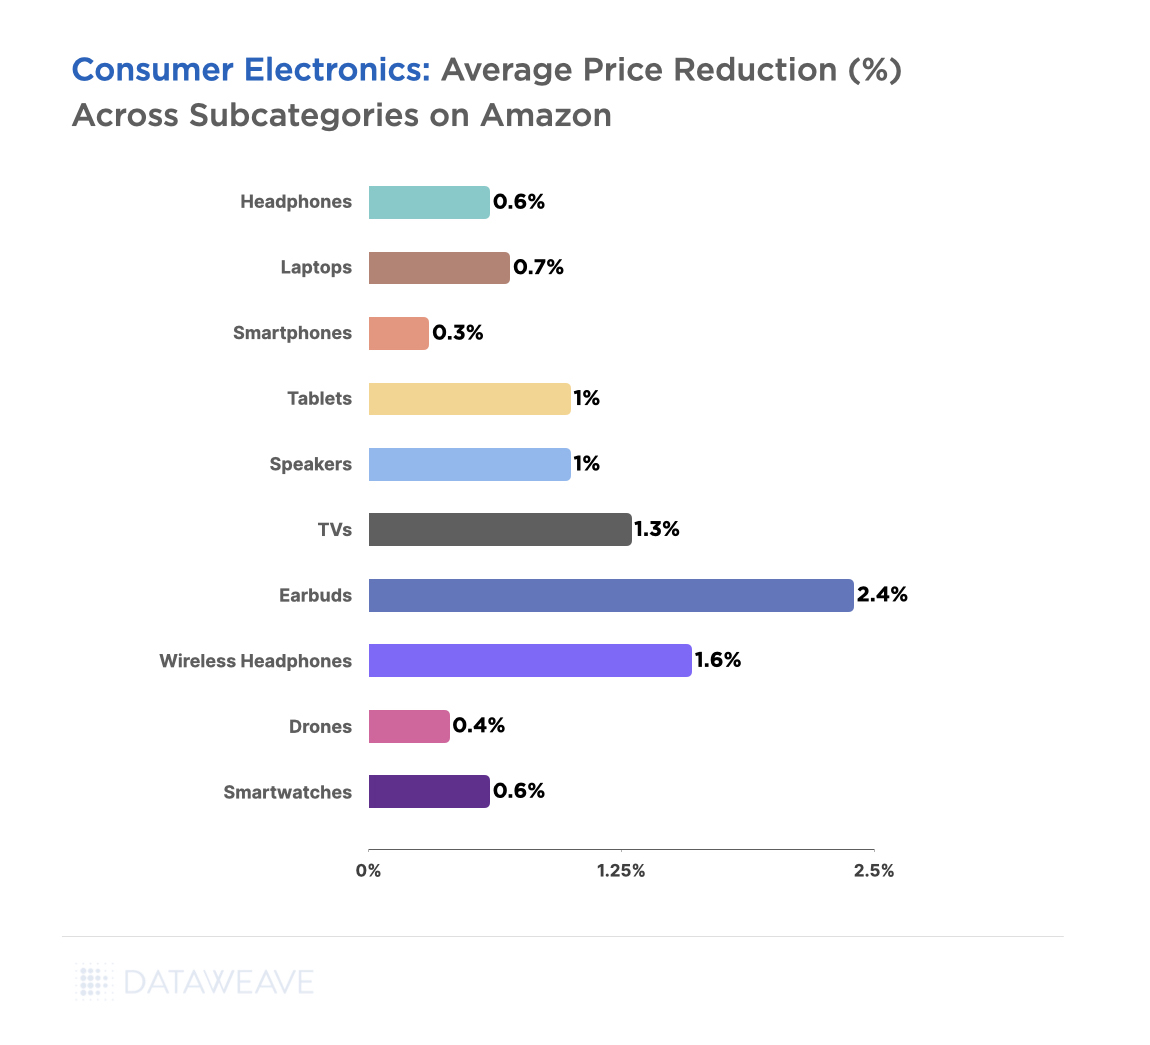
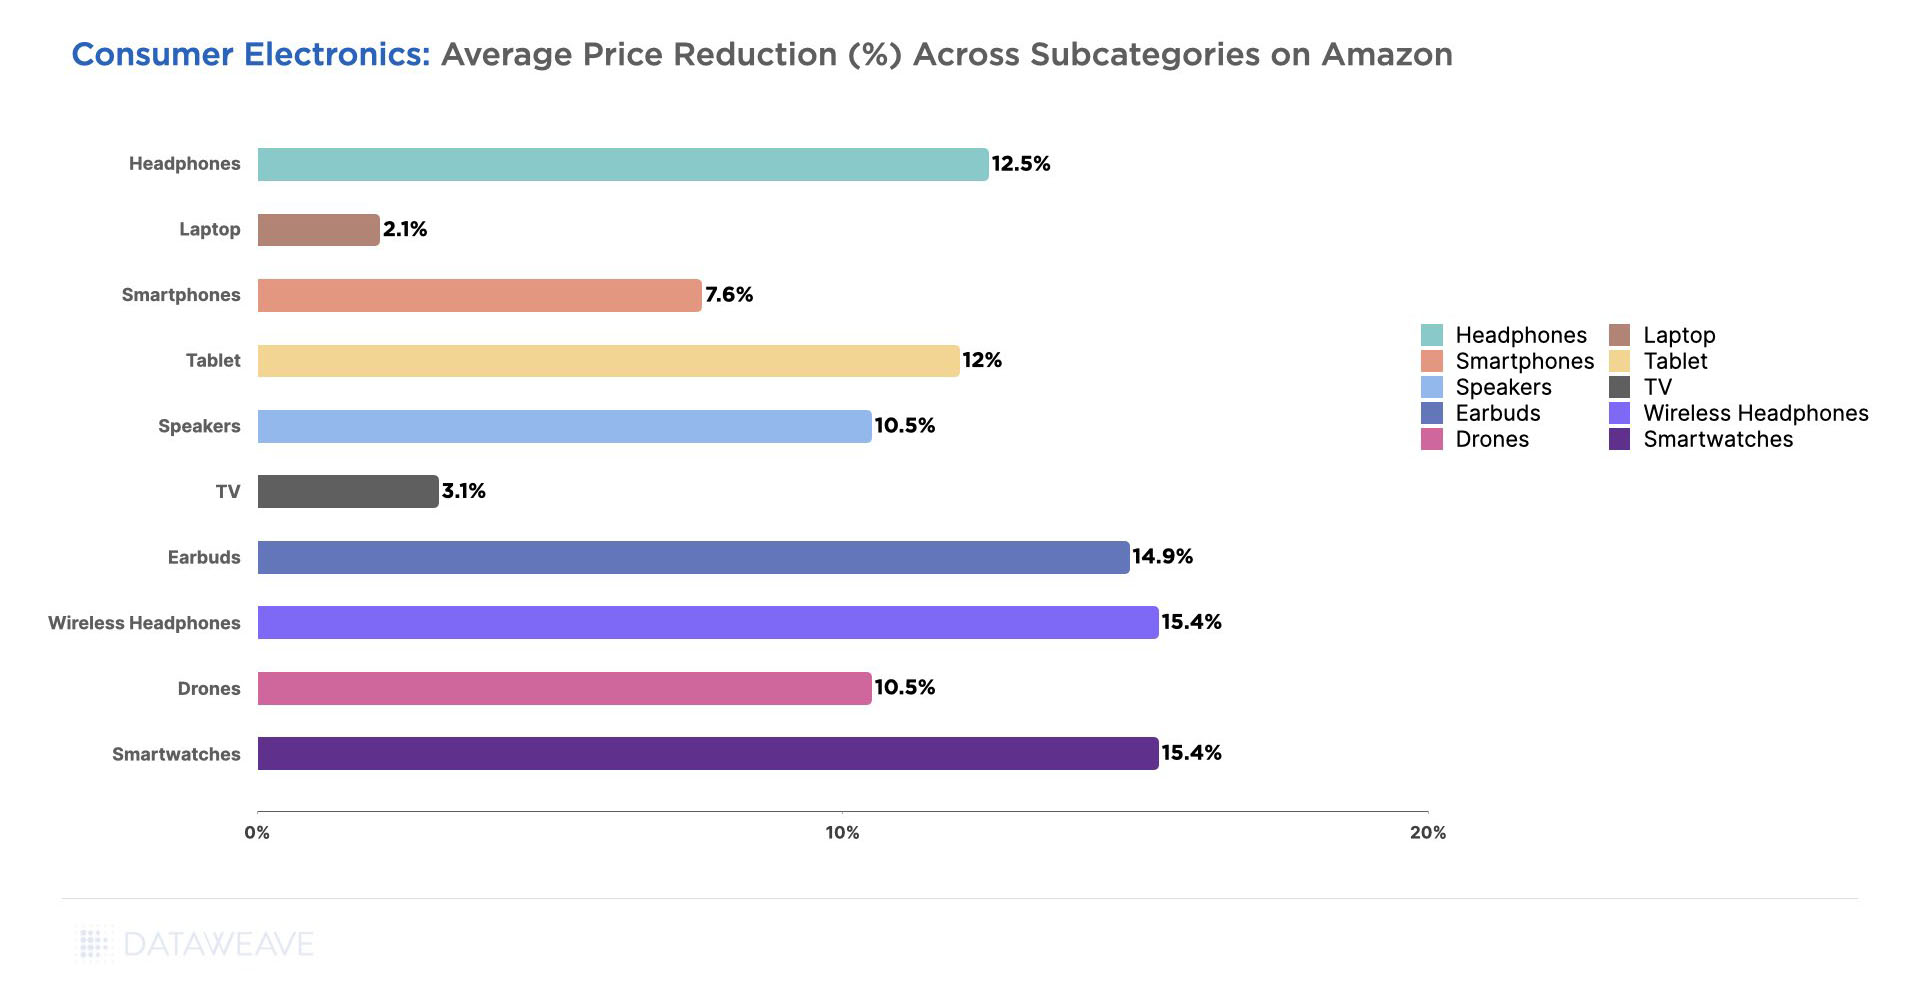
Subcategory Discount Analysis
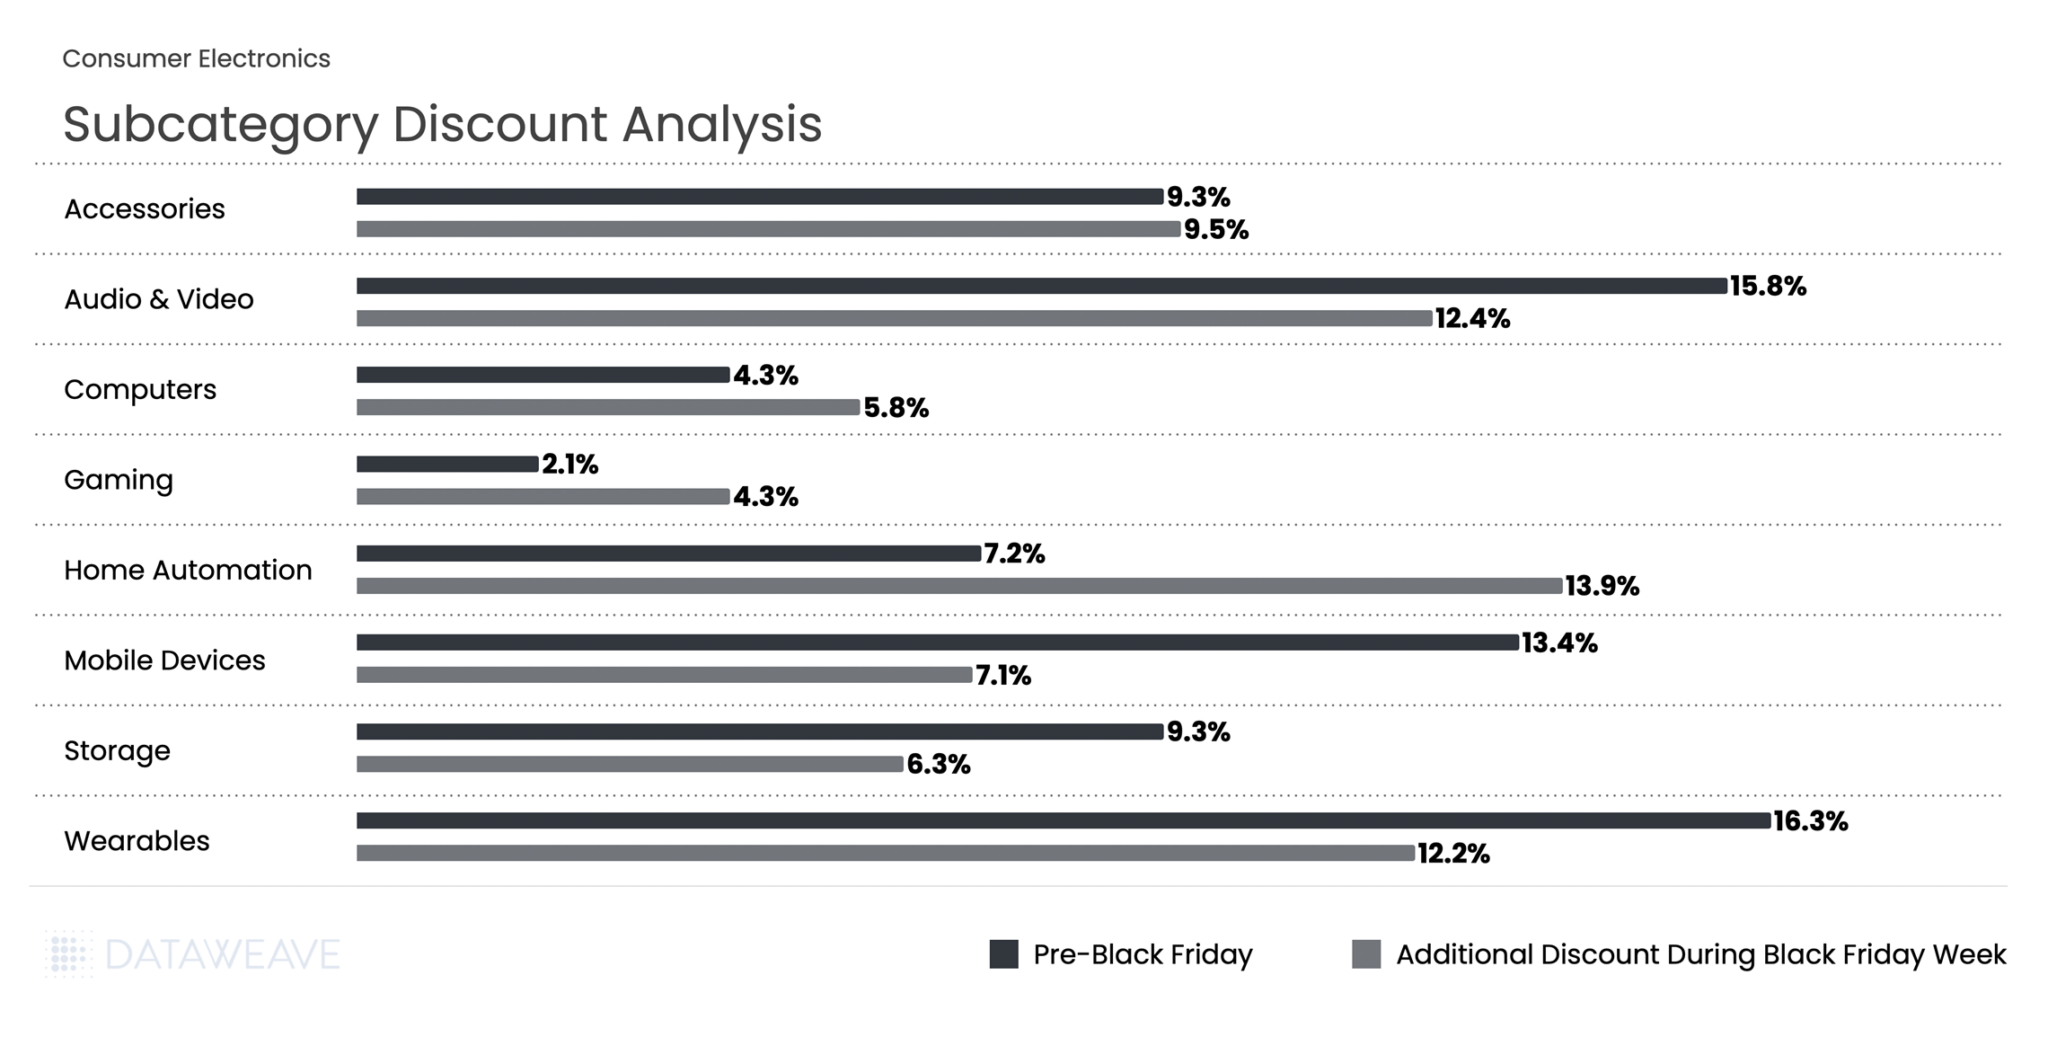
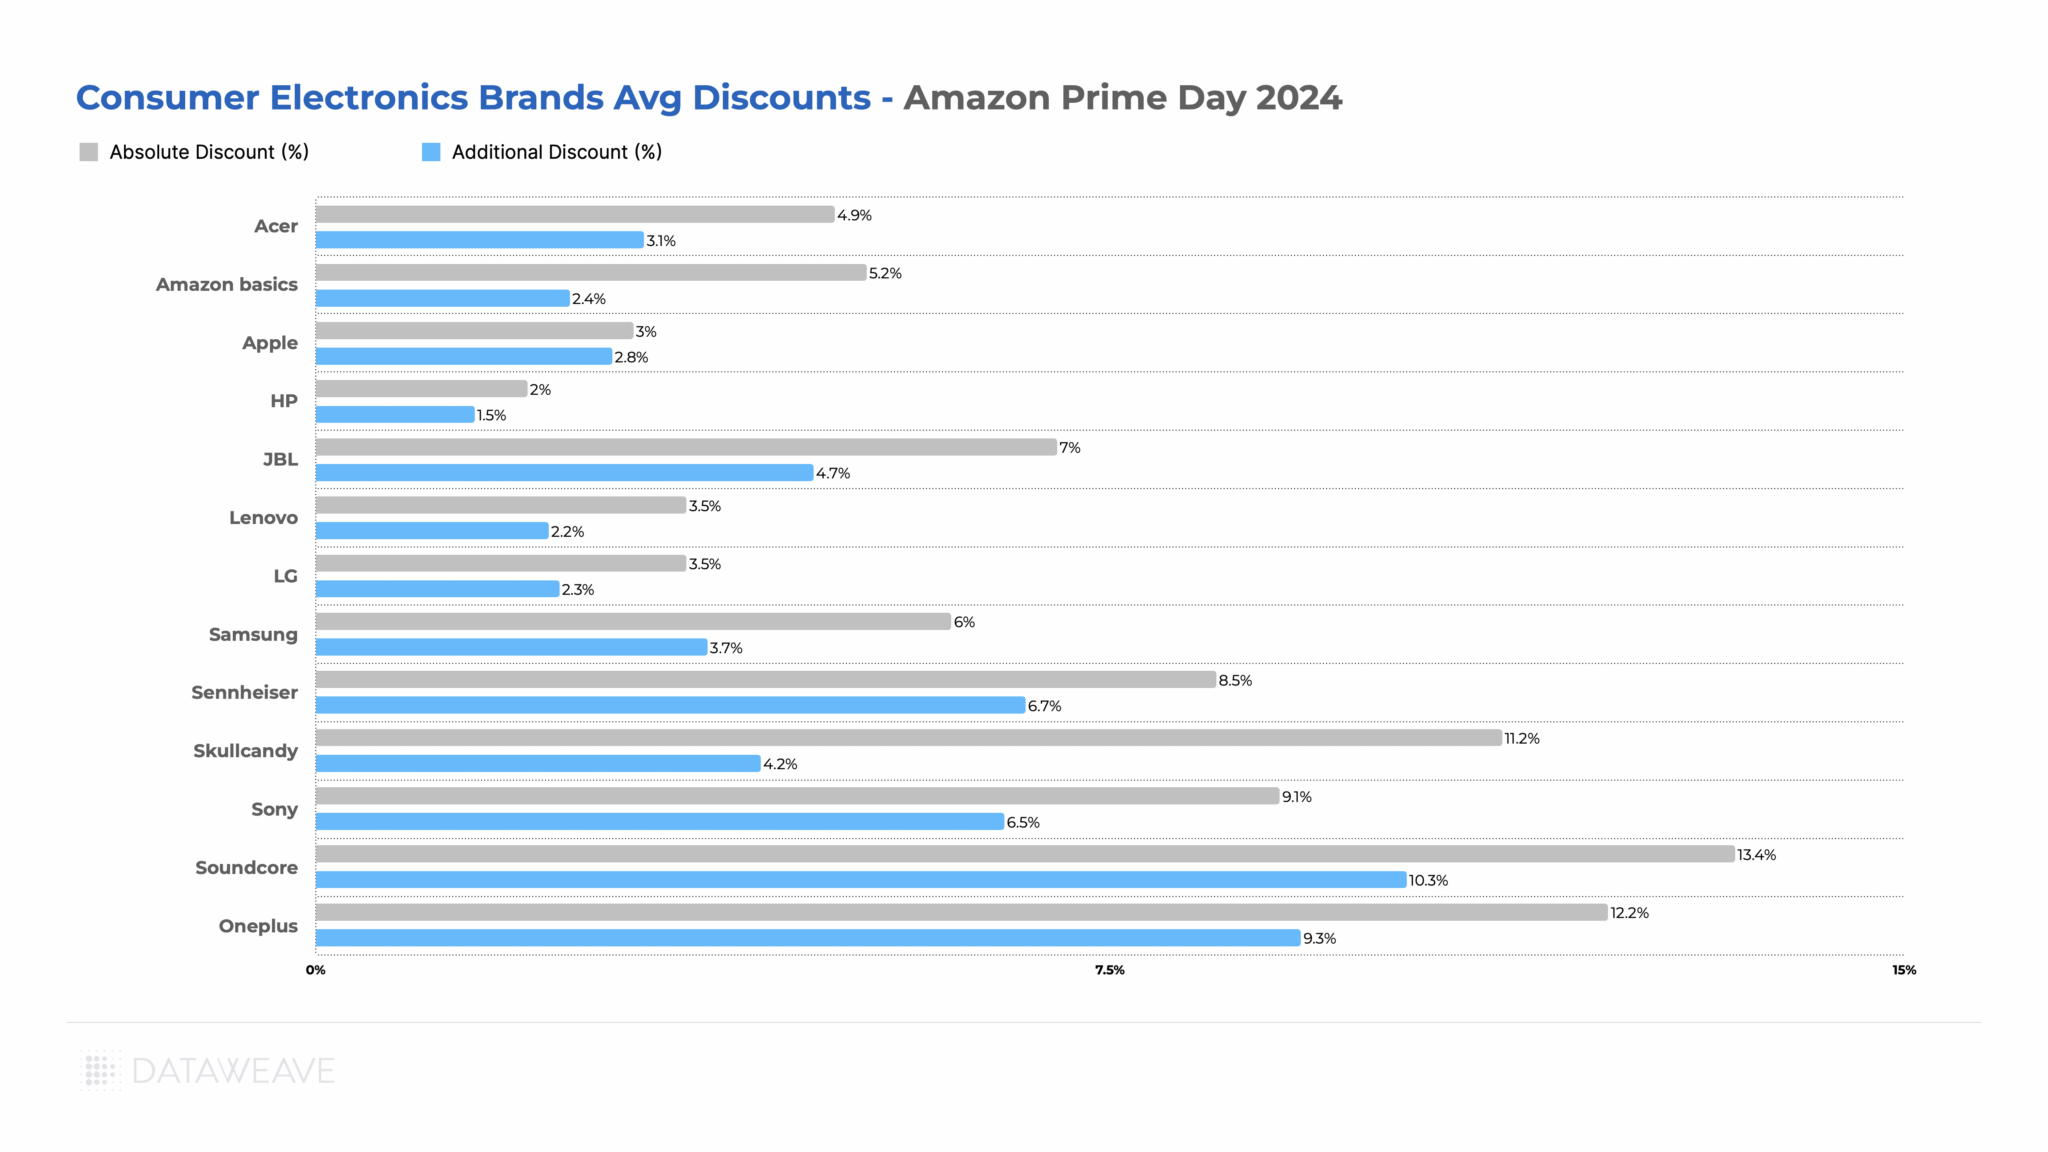
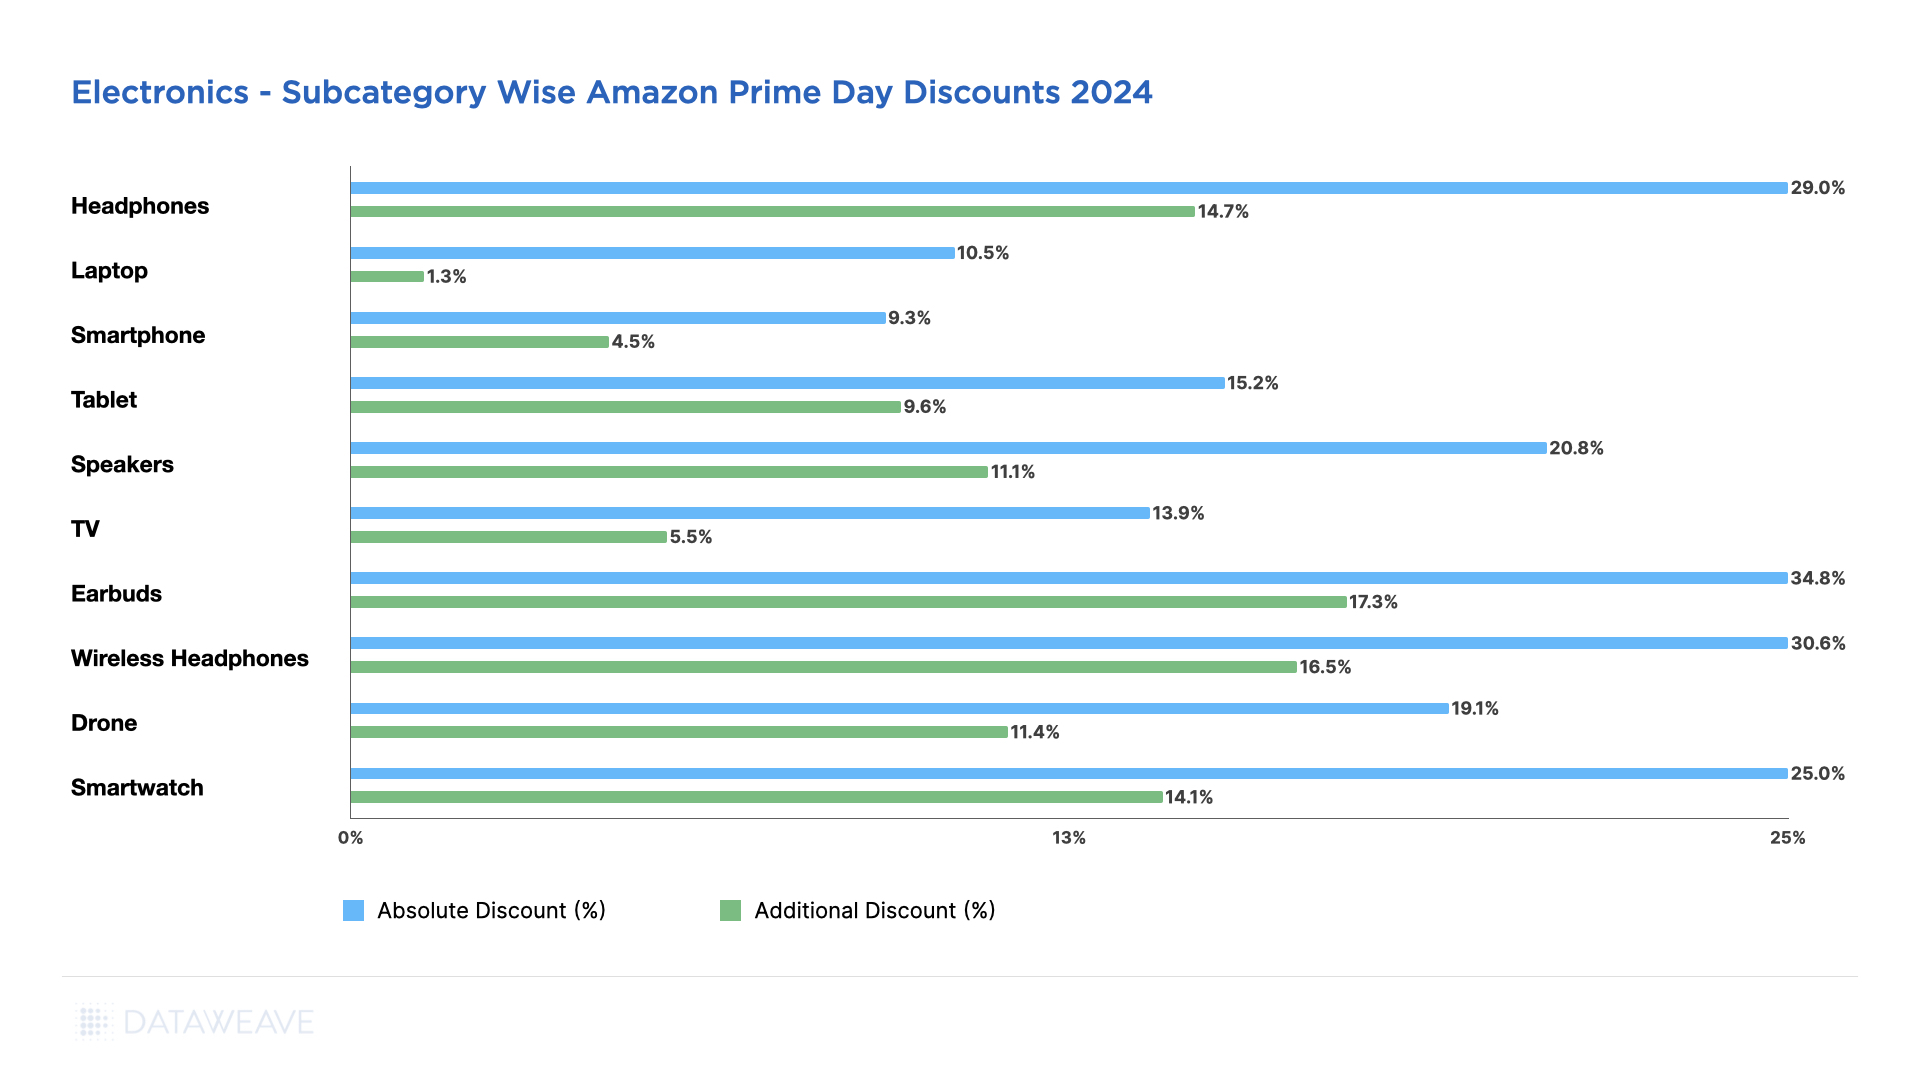
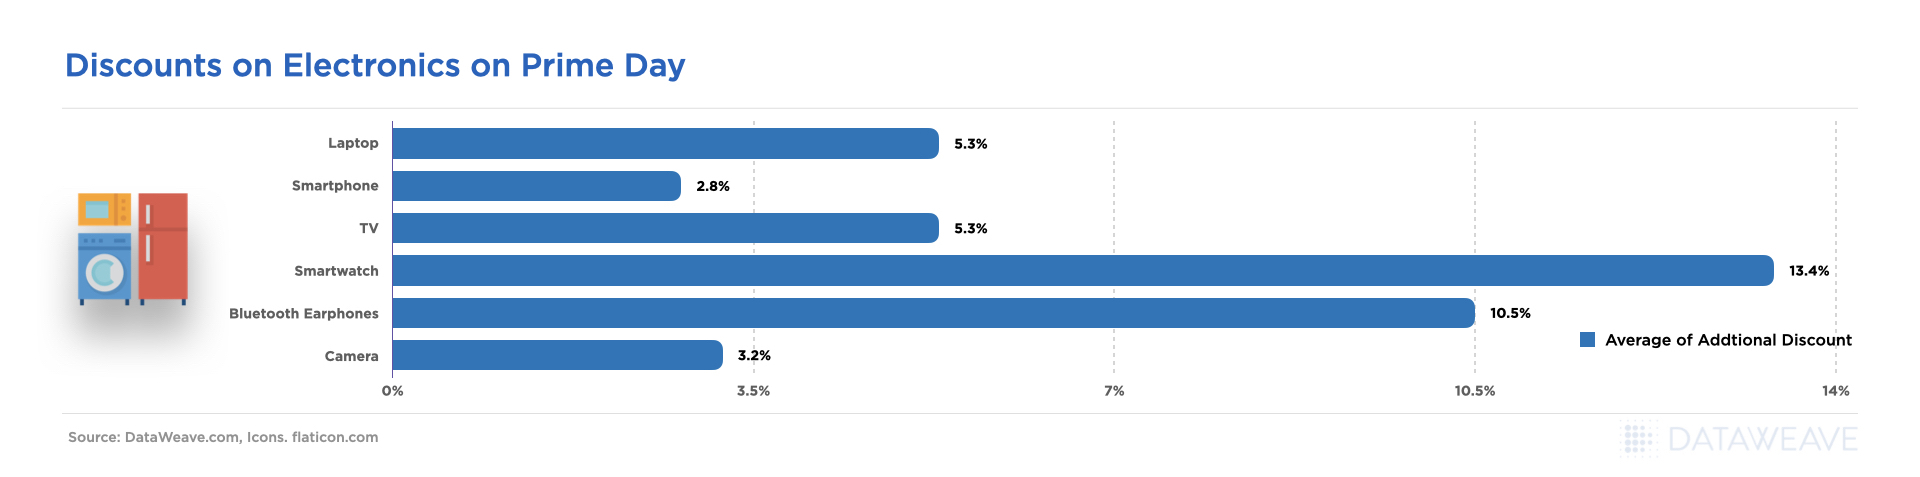
This was one of the few categories where Black Friday Week discounts matched or exceeded pre-sale levels. Wearables led pre-sale discounting at 16.3%, followed closely by Audio & Video at 15.8%. During Black Friday Week, these categories saw additional discounts of 12.2% and 12.4% respectively.
The standout performer was Home Automation, which nearly doubled its additional discount from 7.2% to 13.9% during Black Friday Week. Mobile Devices saw additional discounts dropping from 13.4% pre-sale to 7.1% during Black Friday Week. Meanwhile Gaming doubled additional discounting from 2.1% to 4.3%.
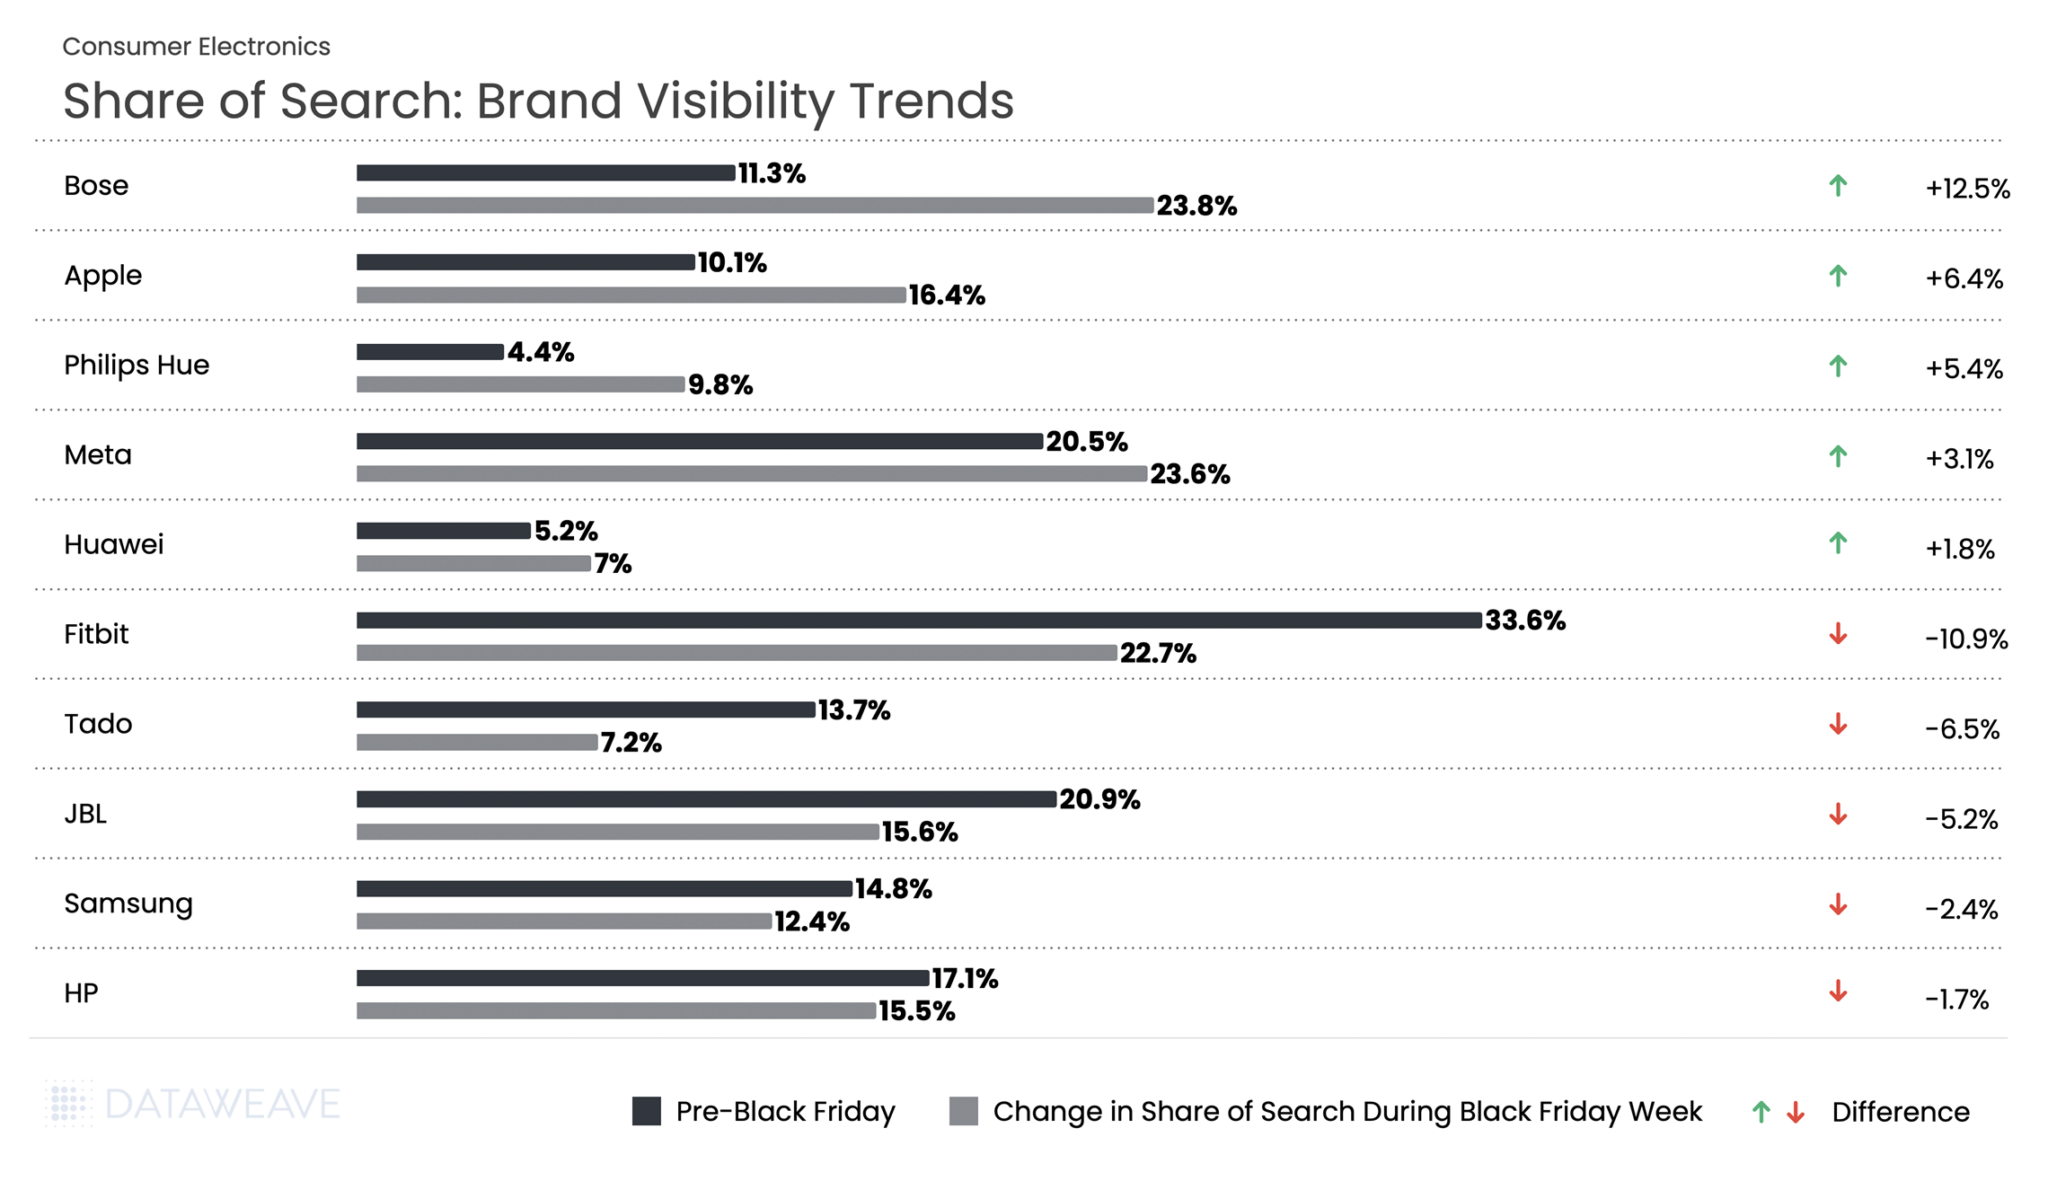
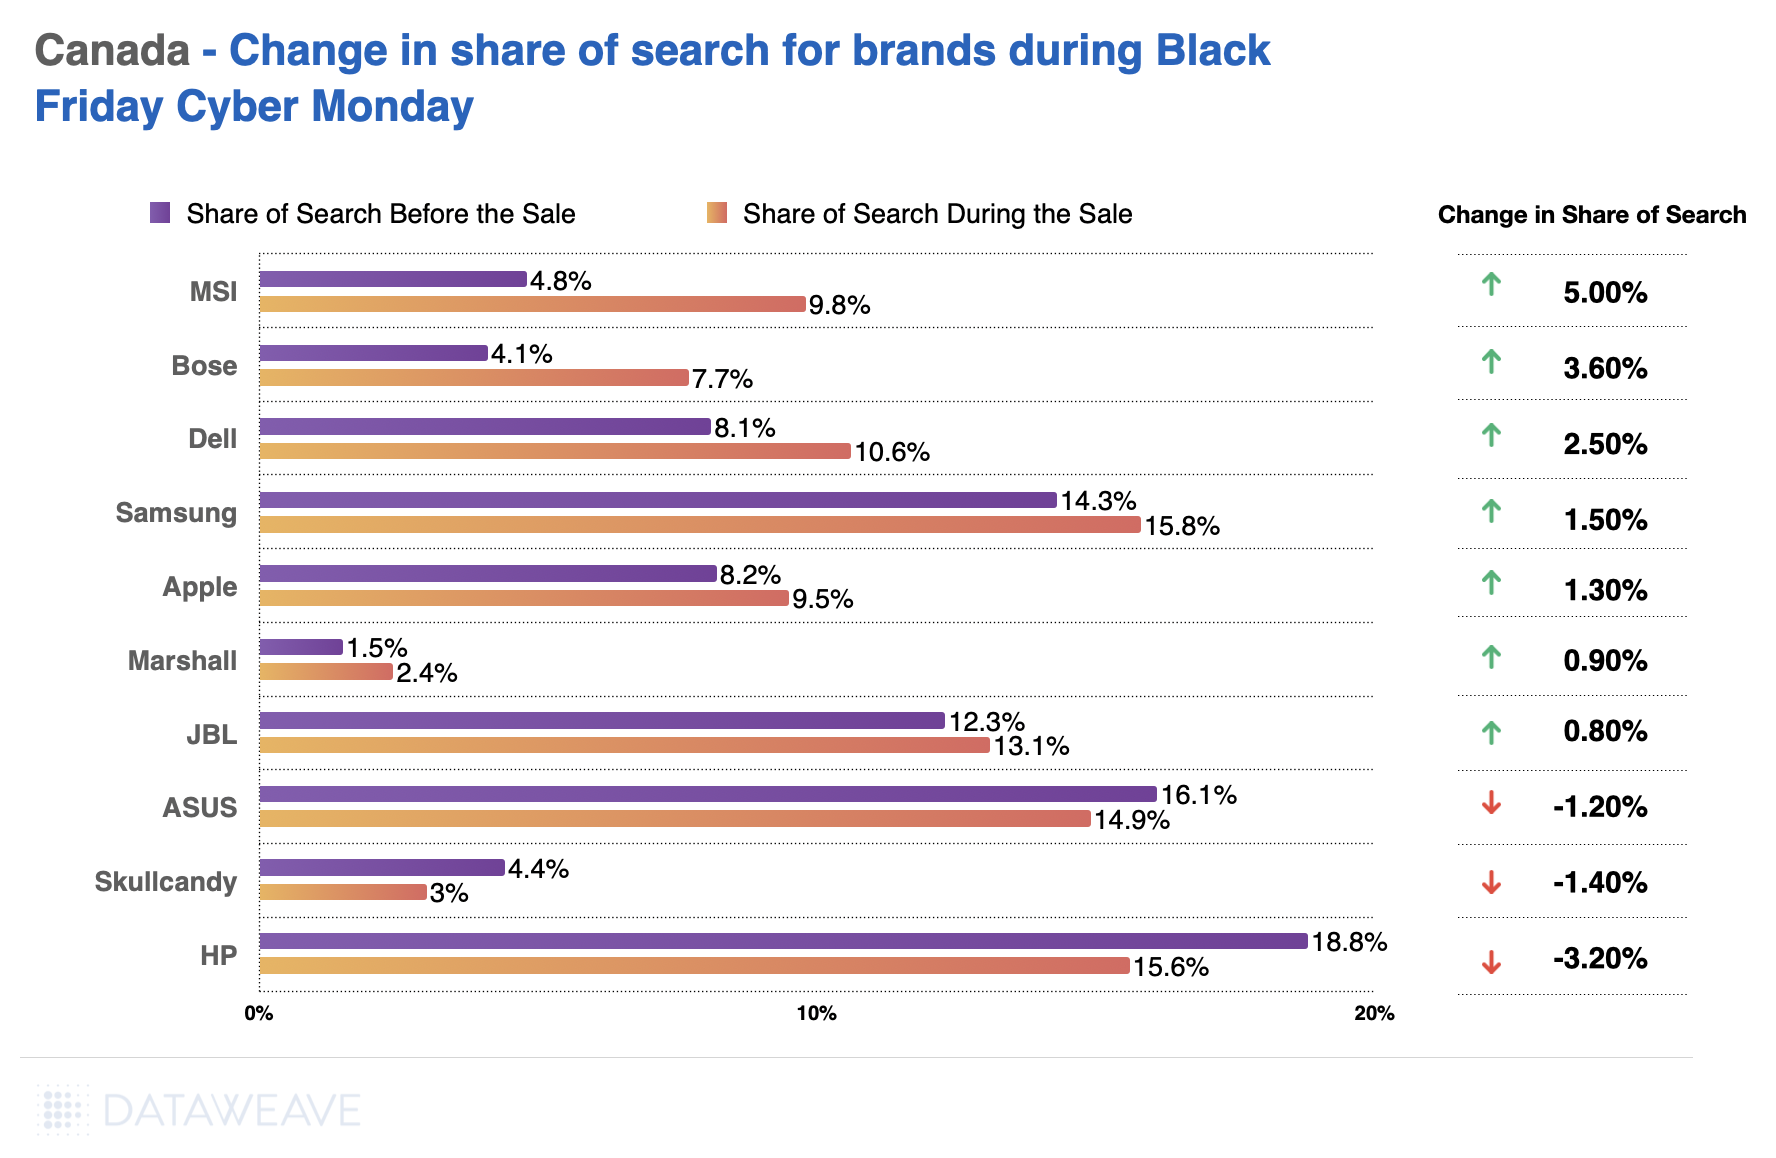
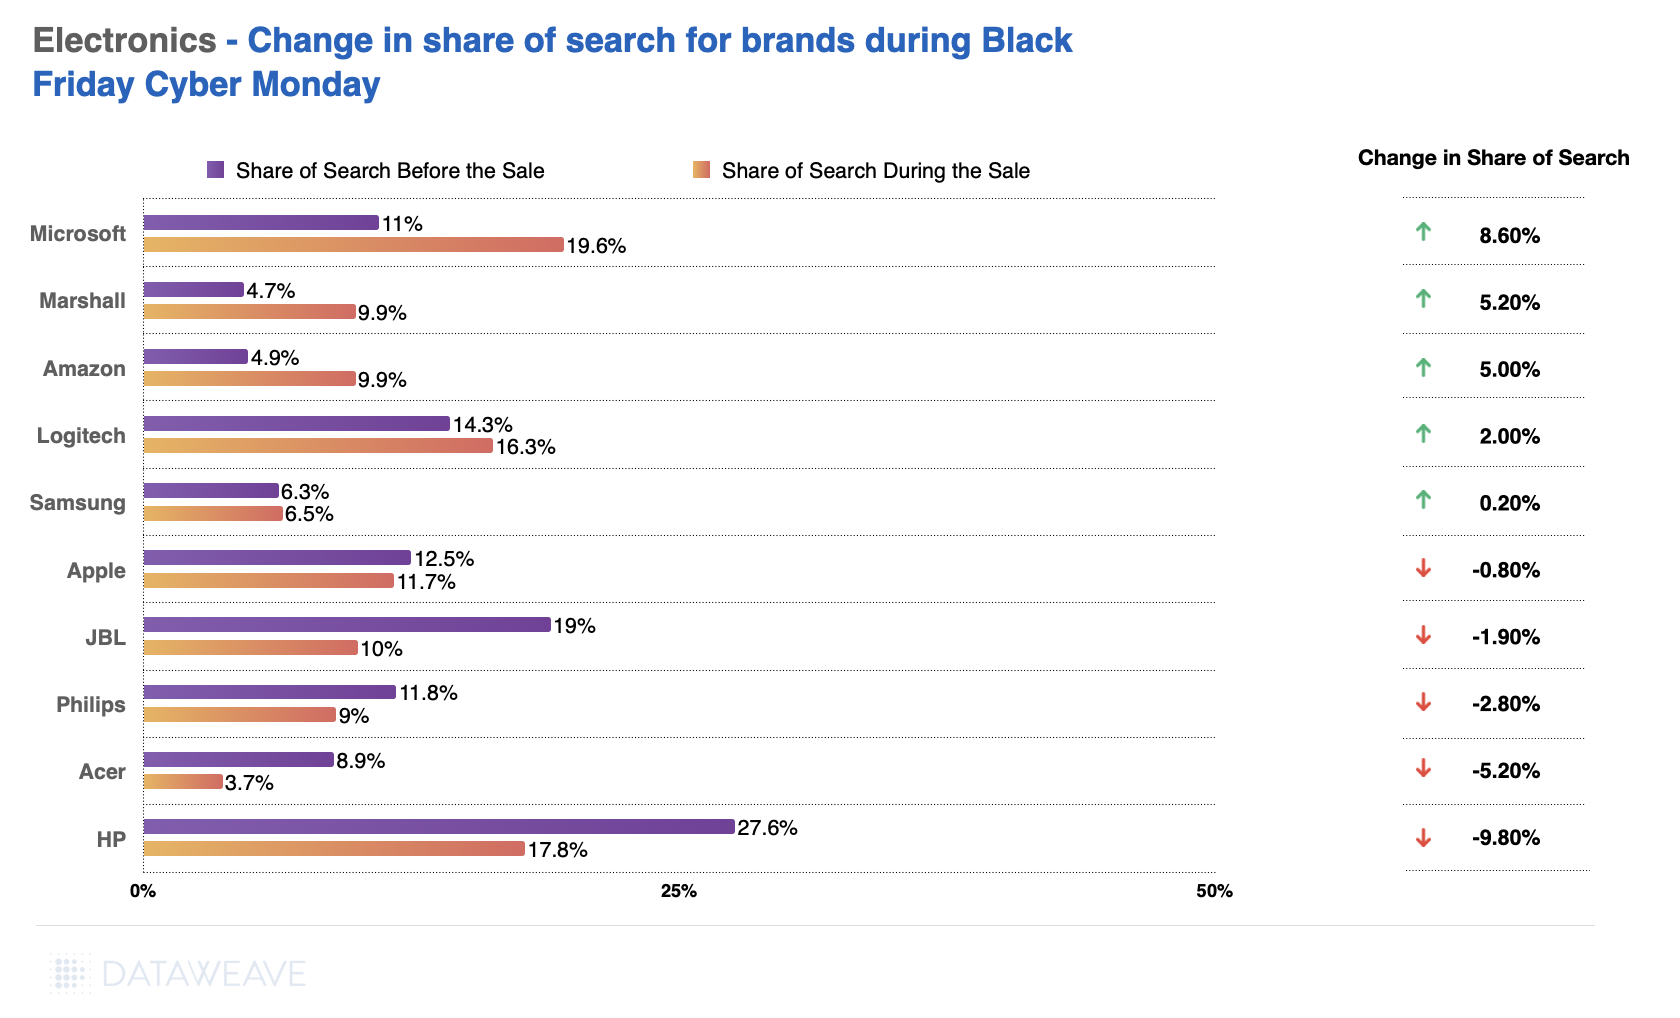
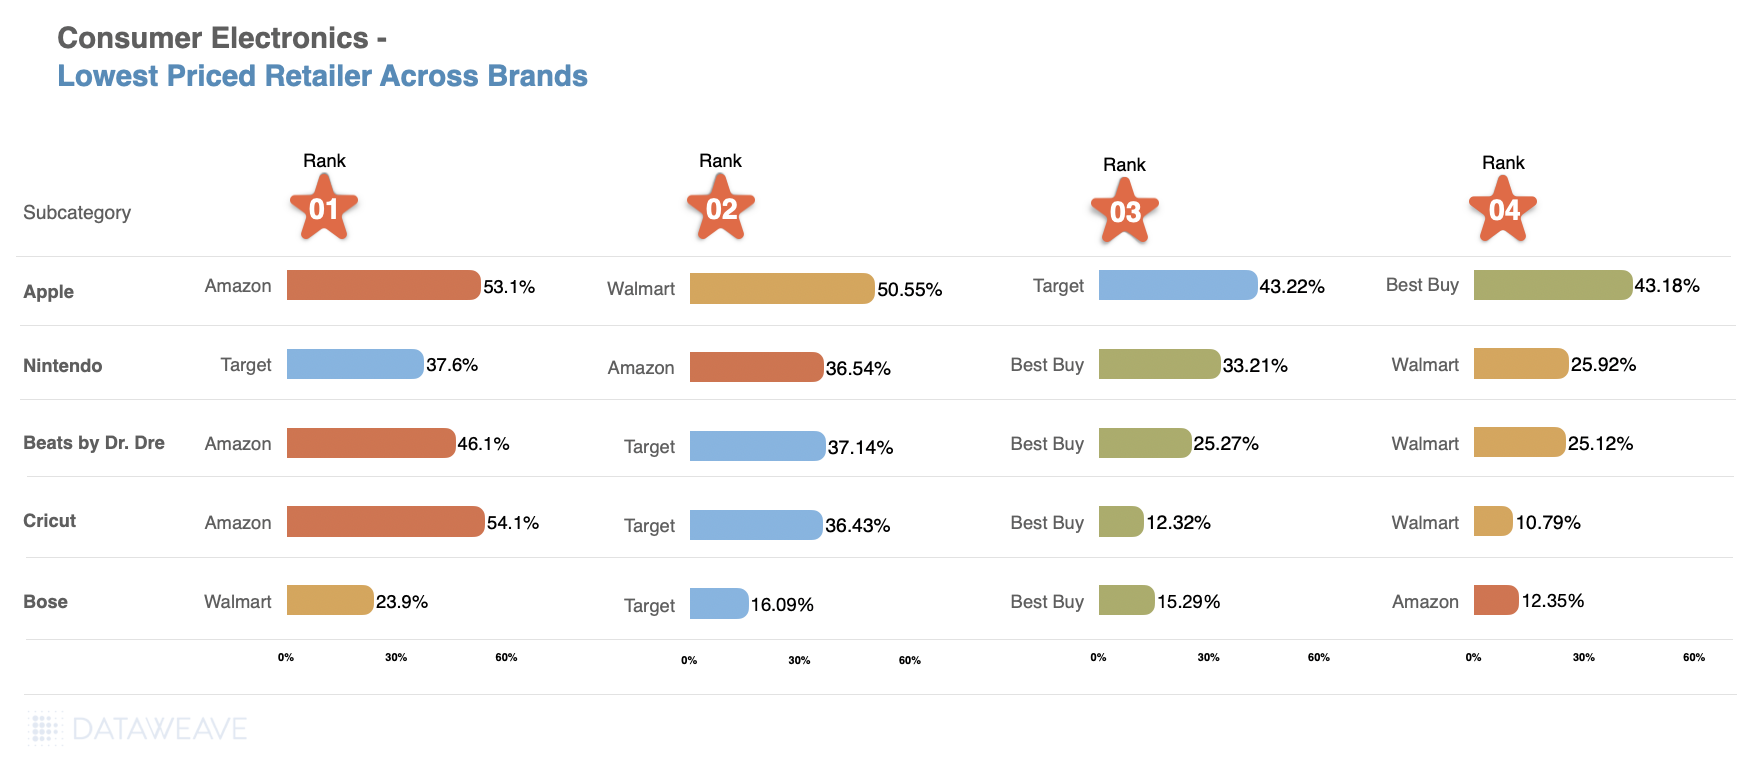
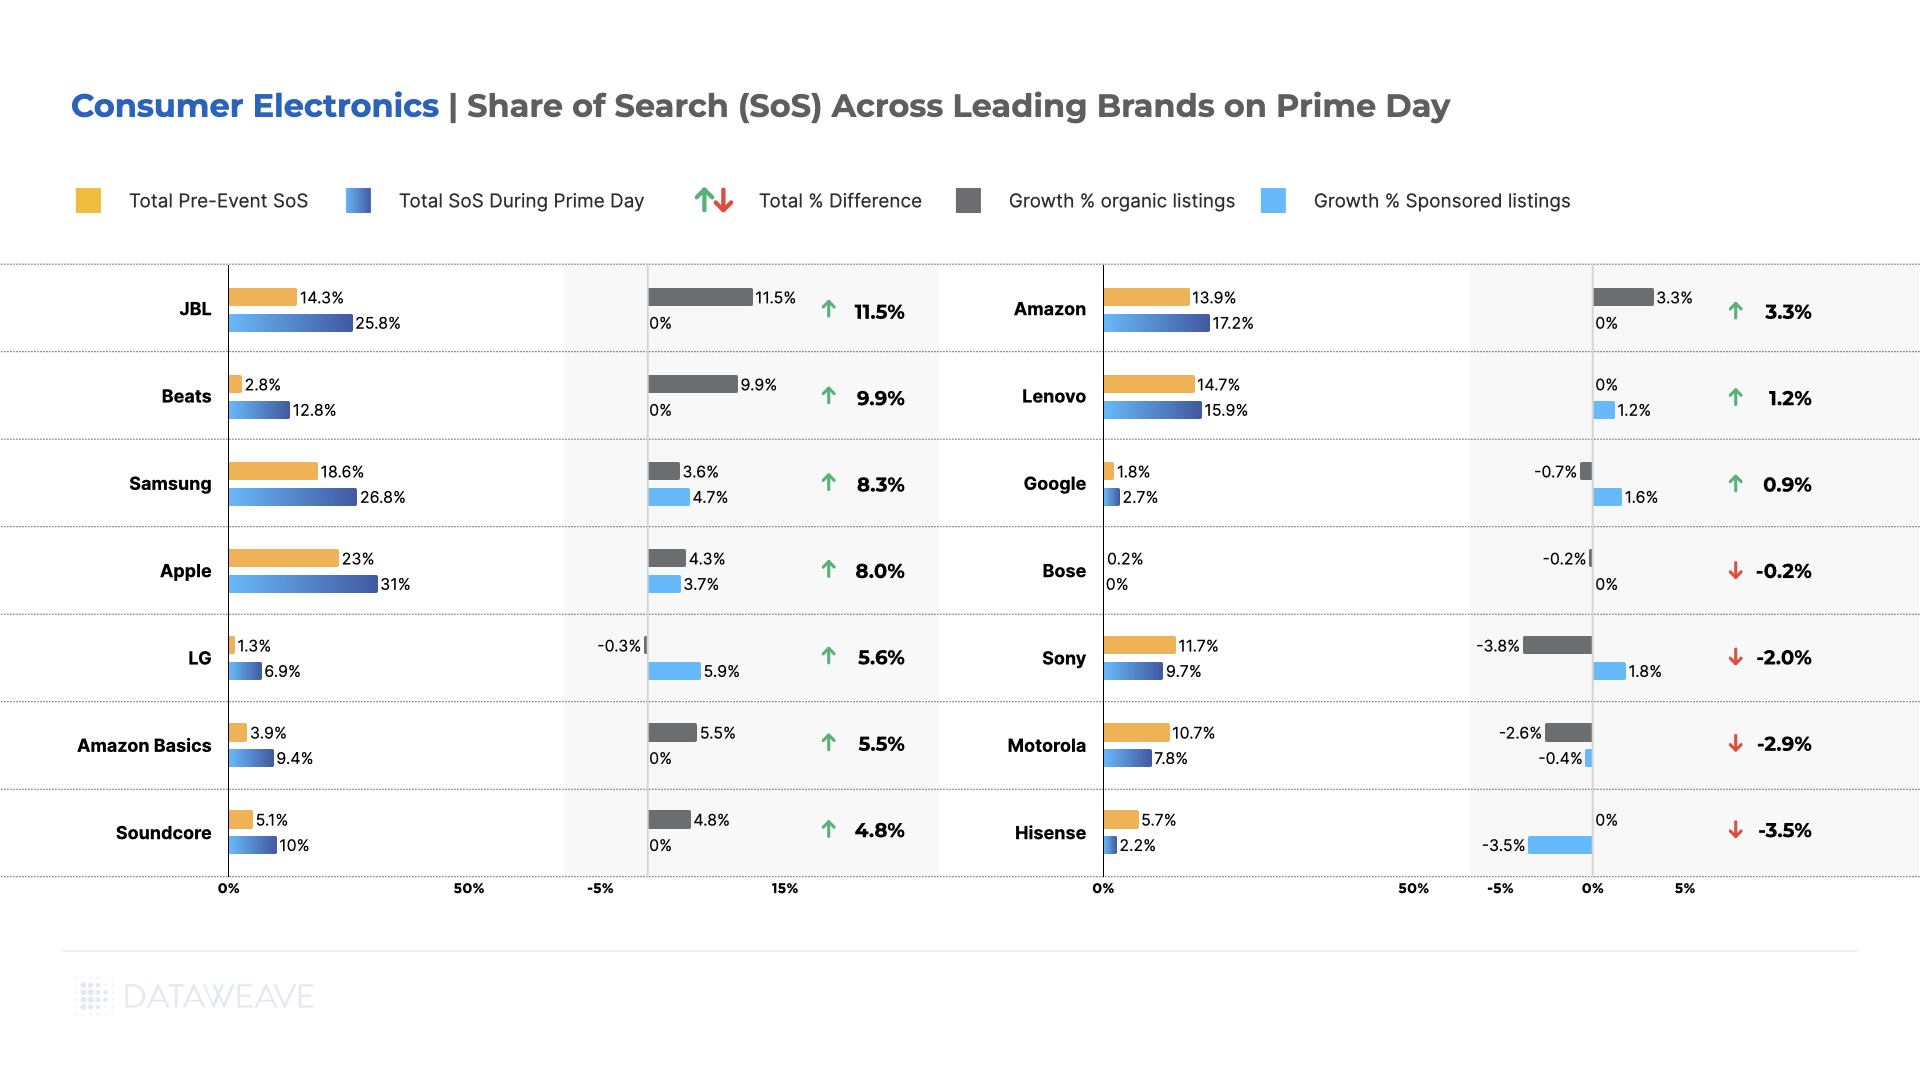
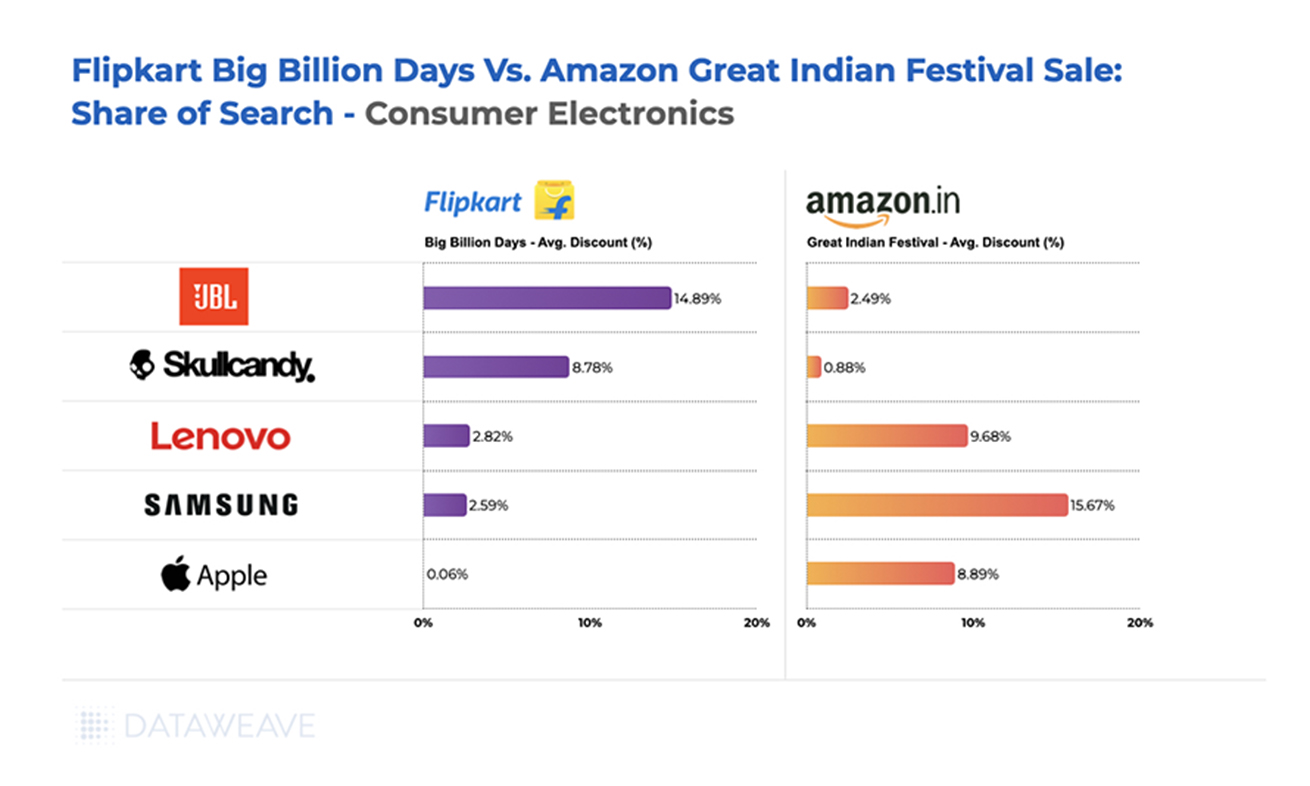
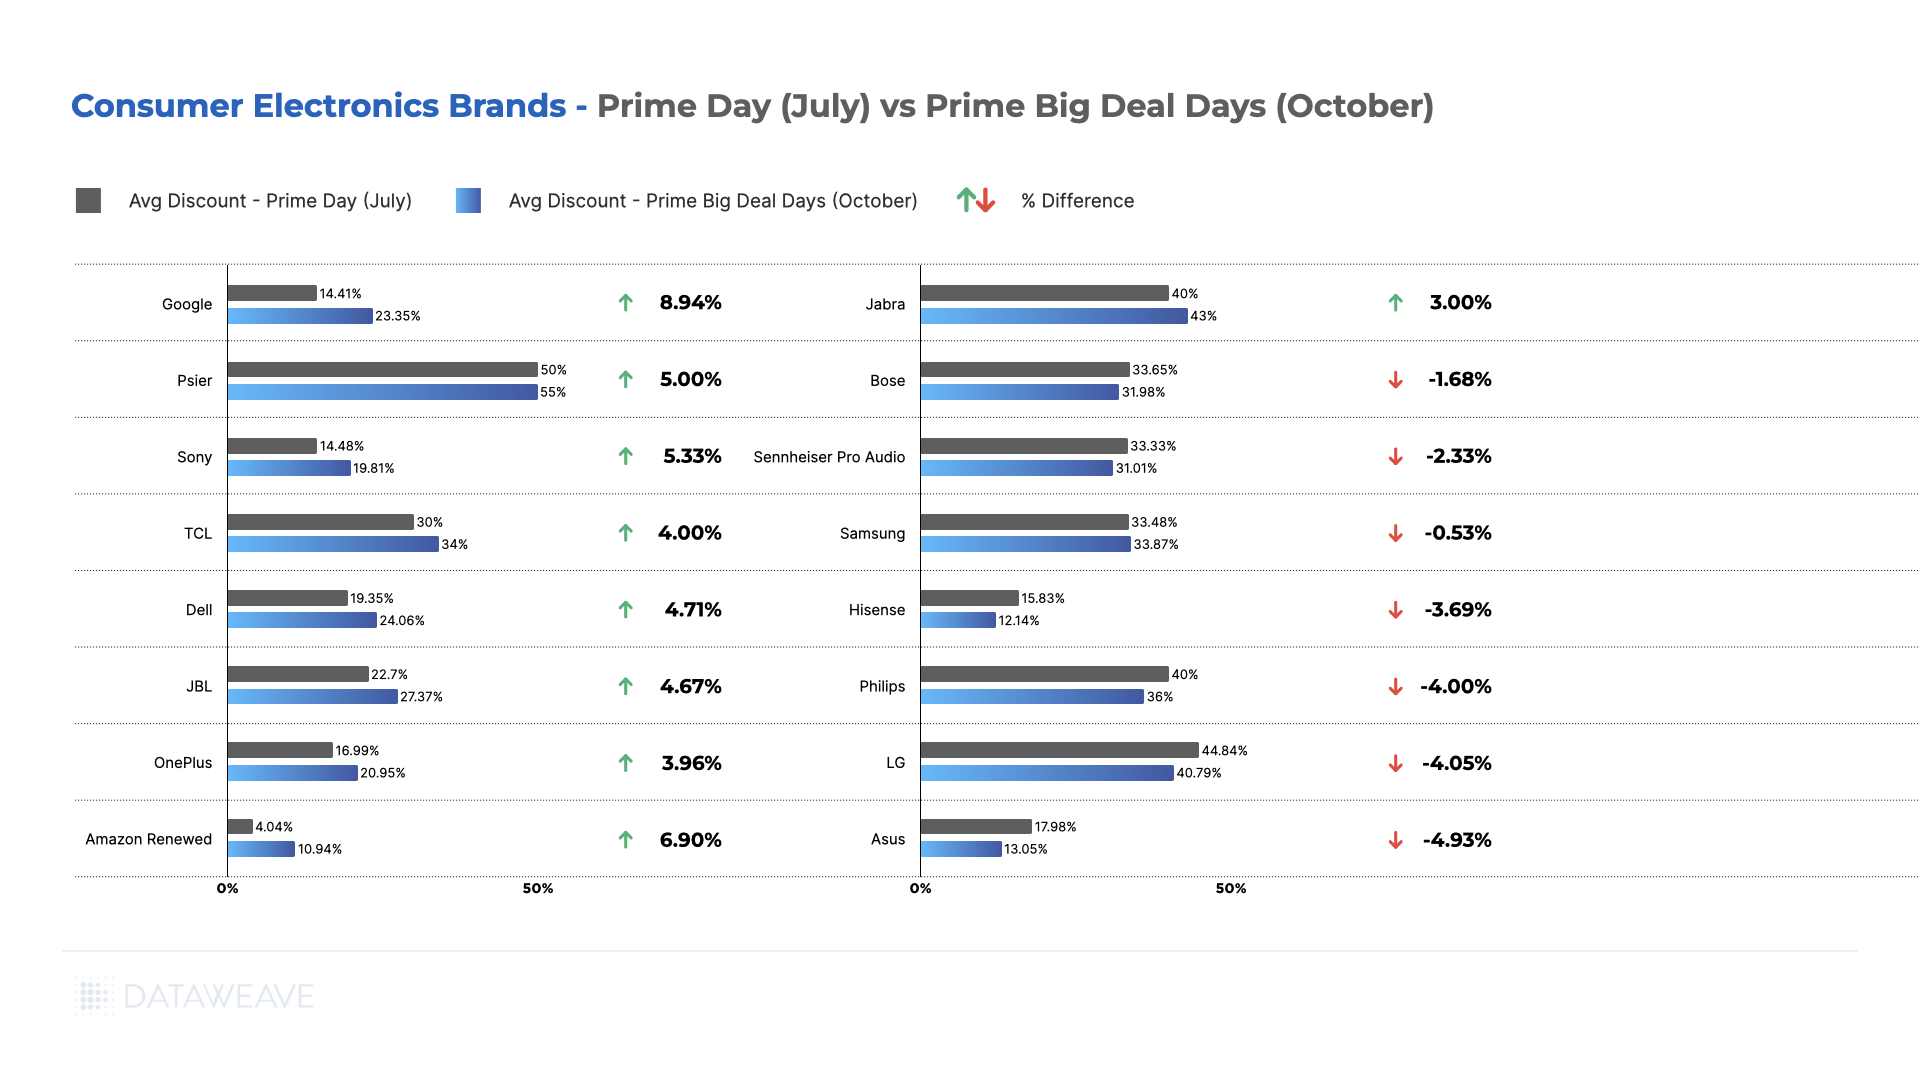
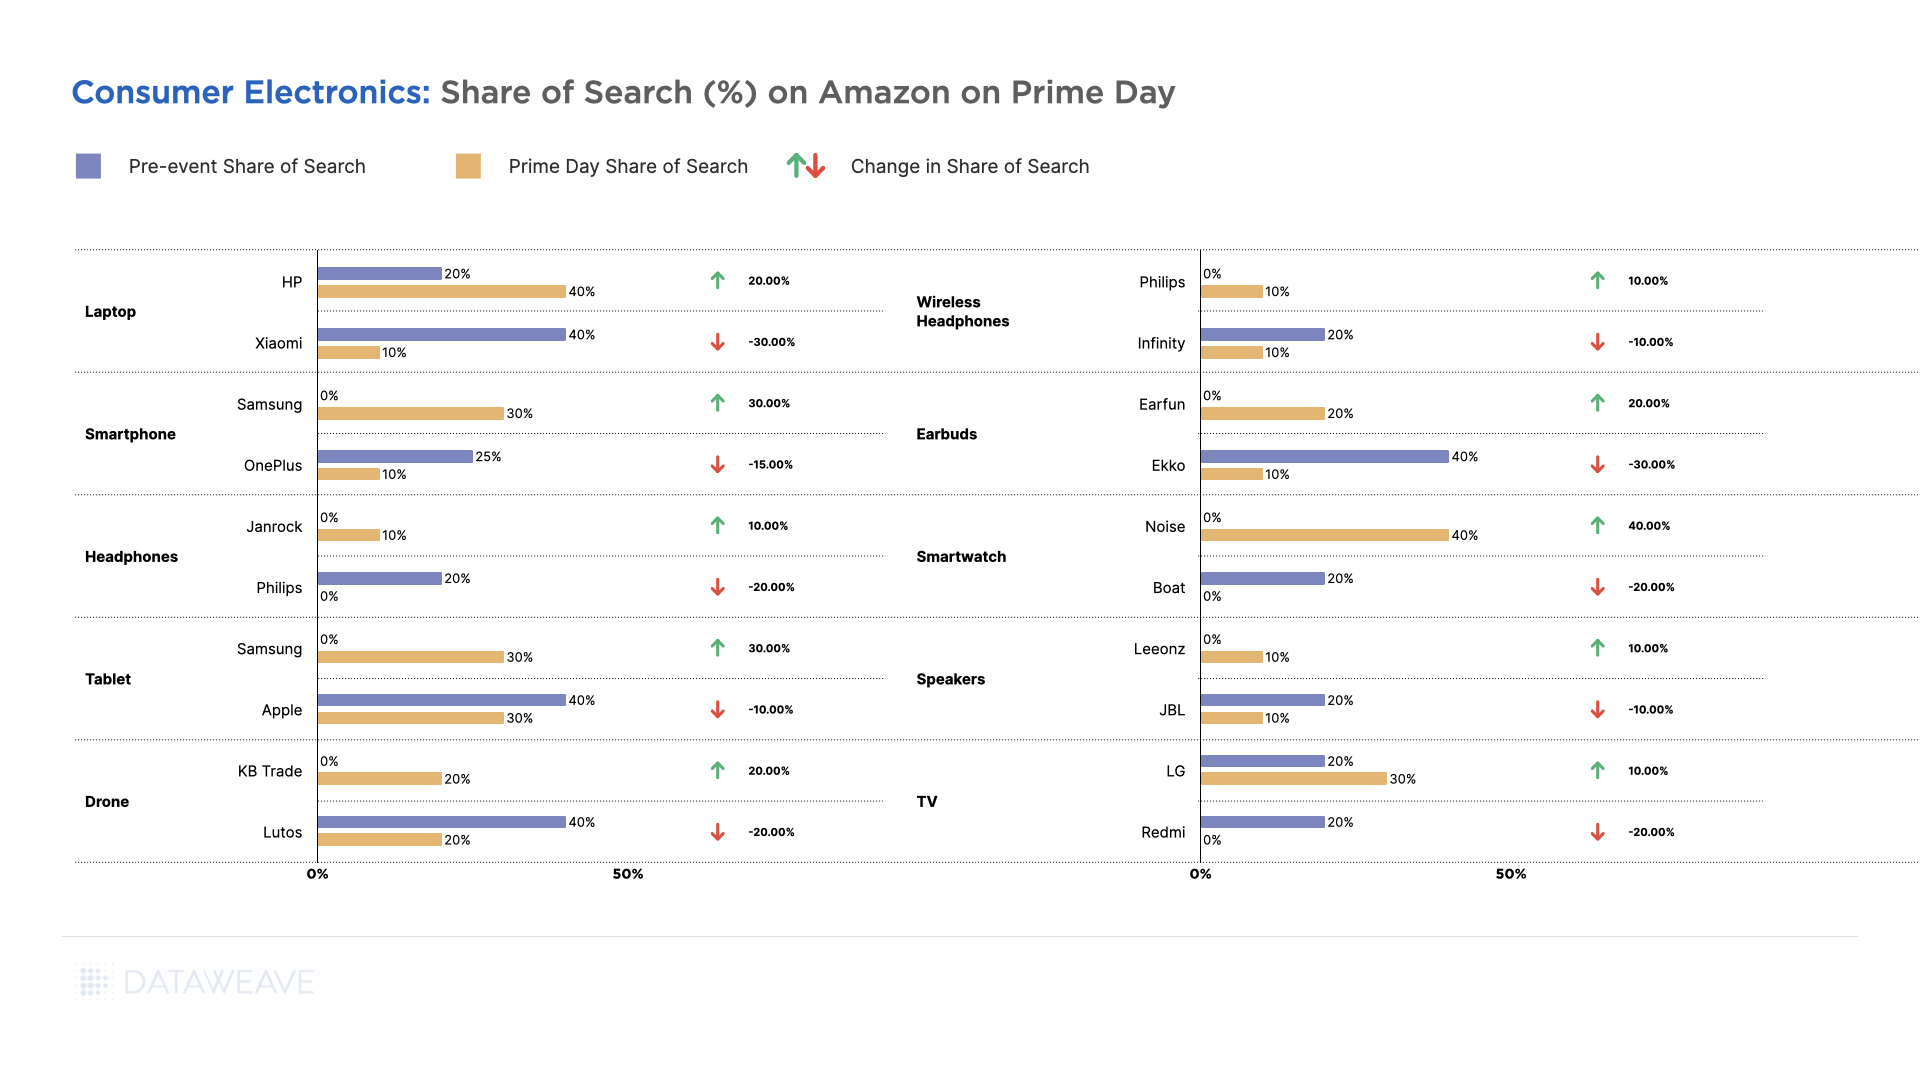
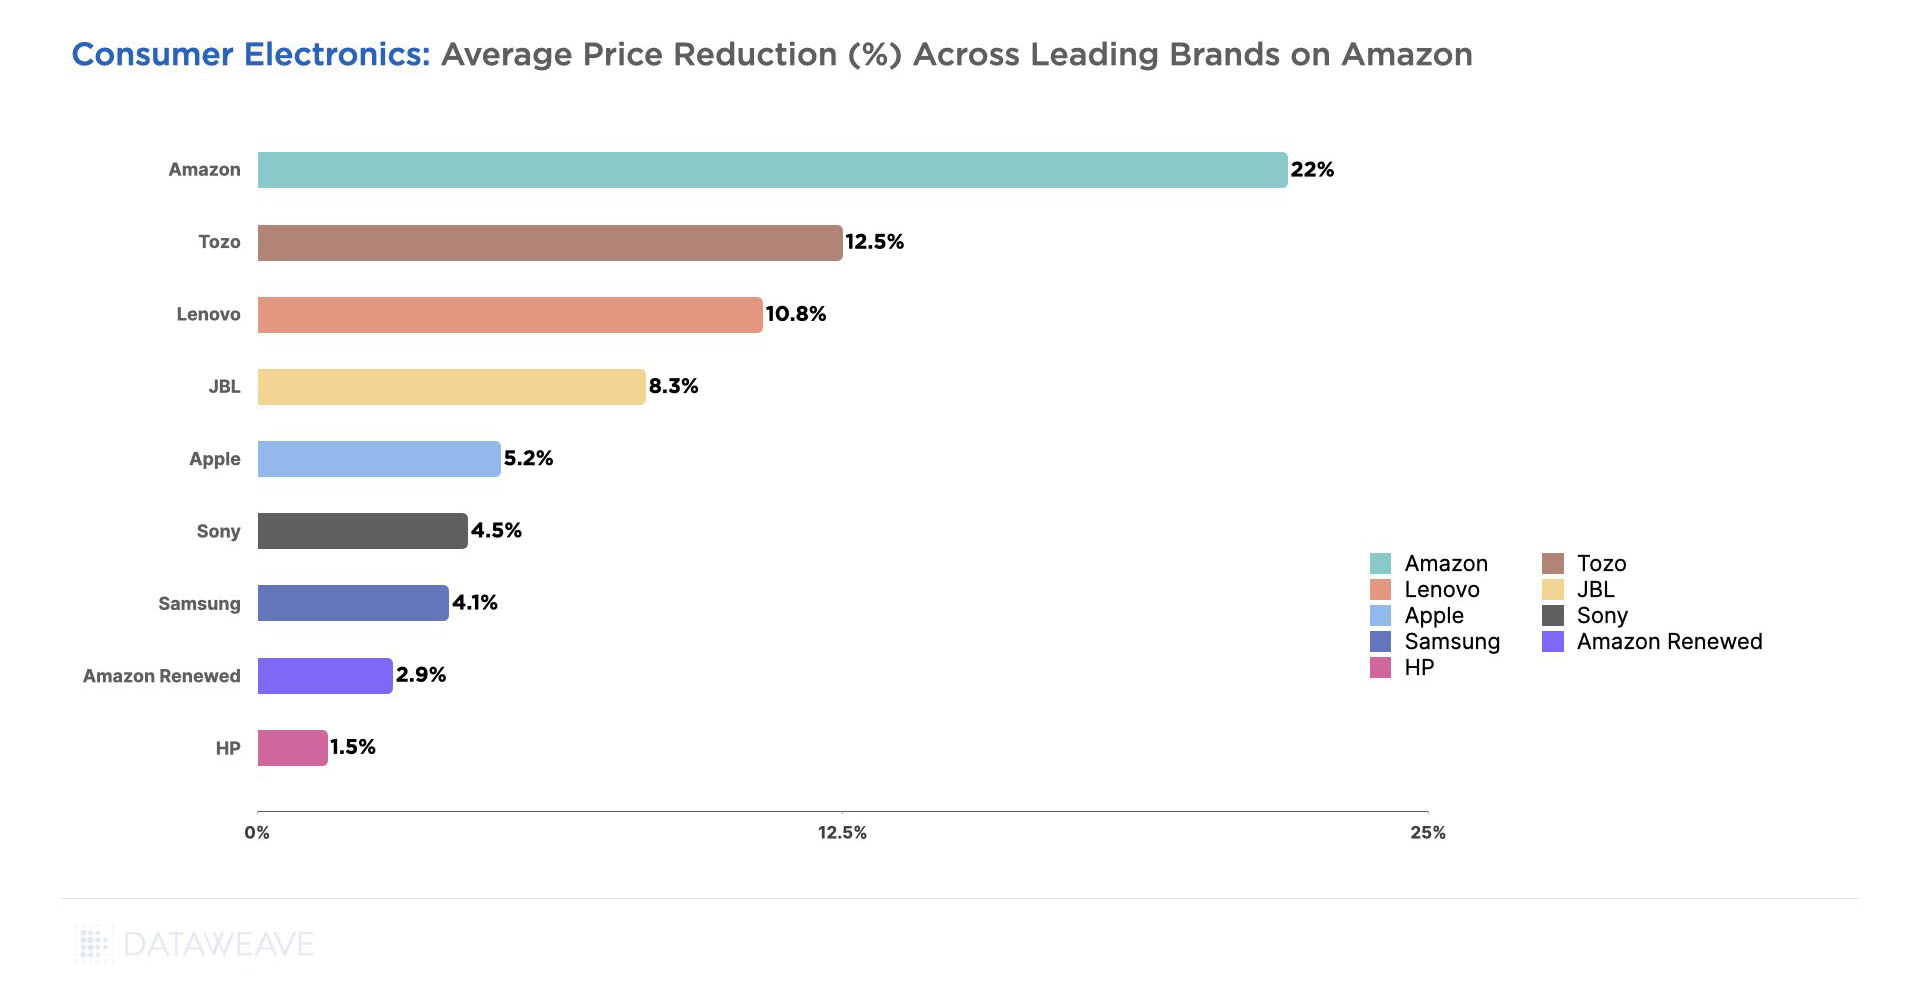
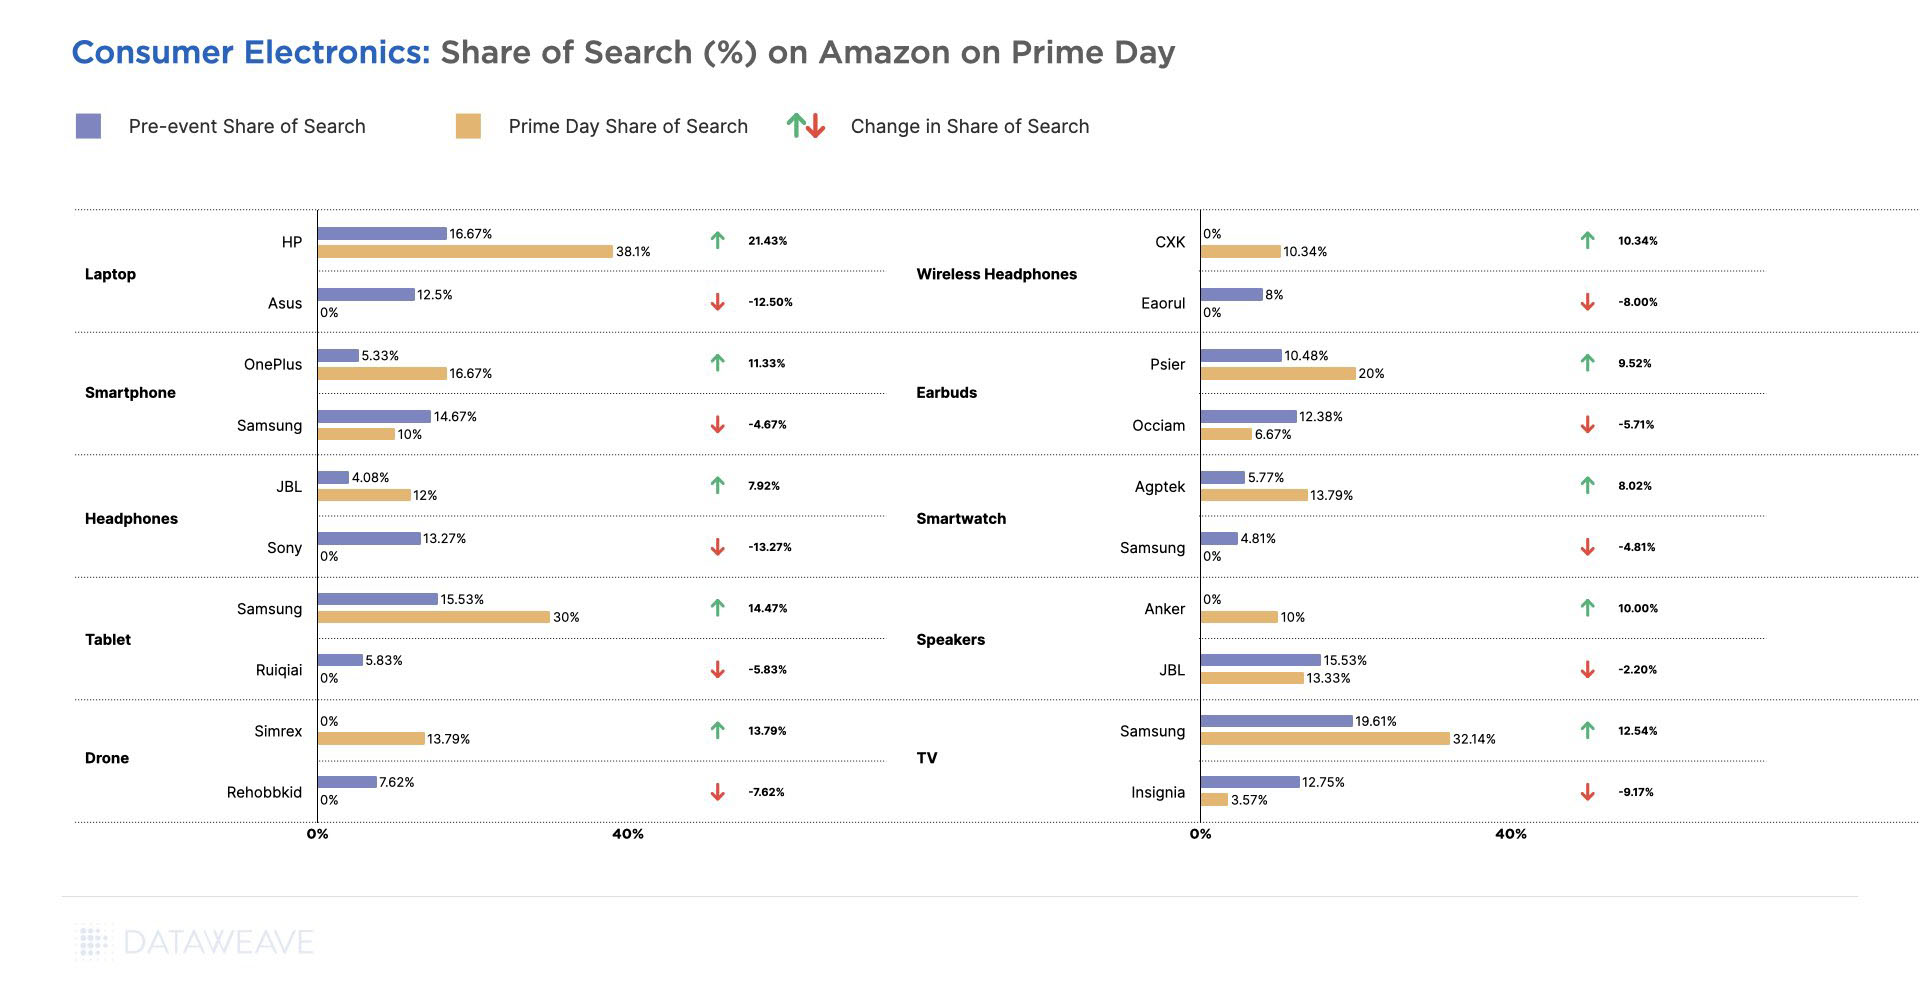
Share of Search: Brand Visibility Trends
Our Share of Search analysis reveals significant shifts in brand visibility during Black Friday Week:
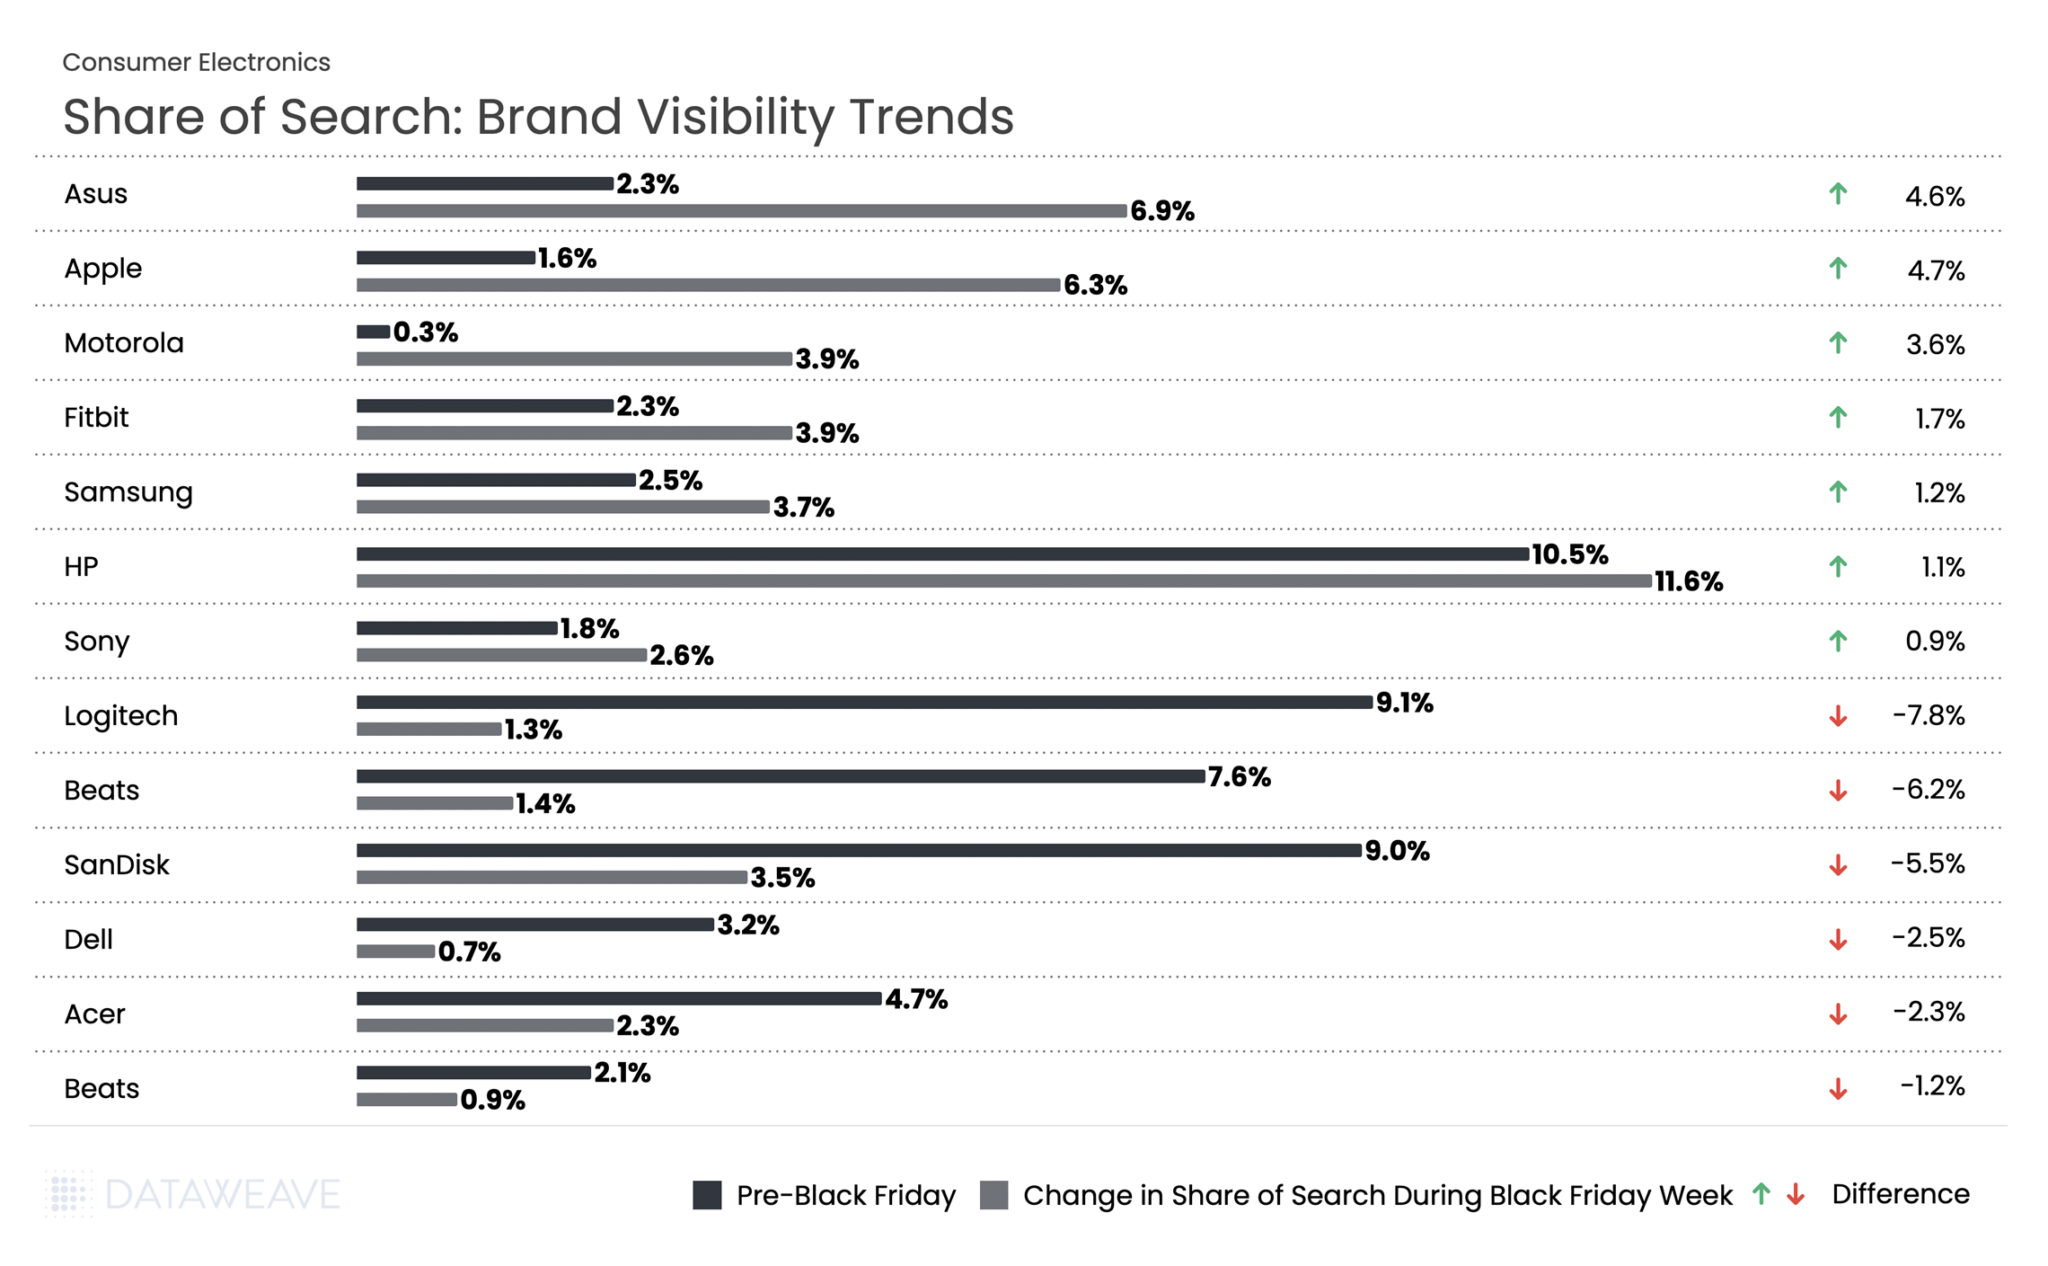
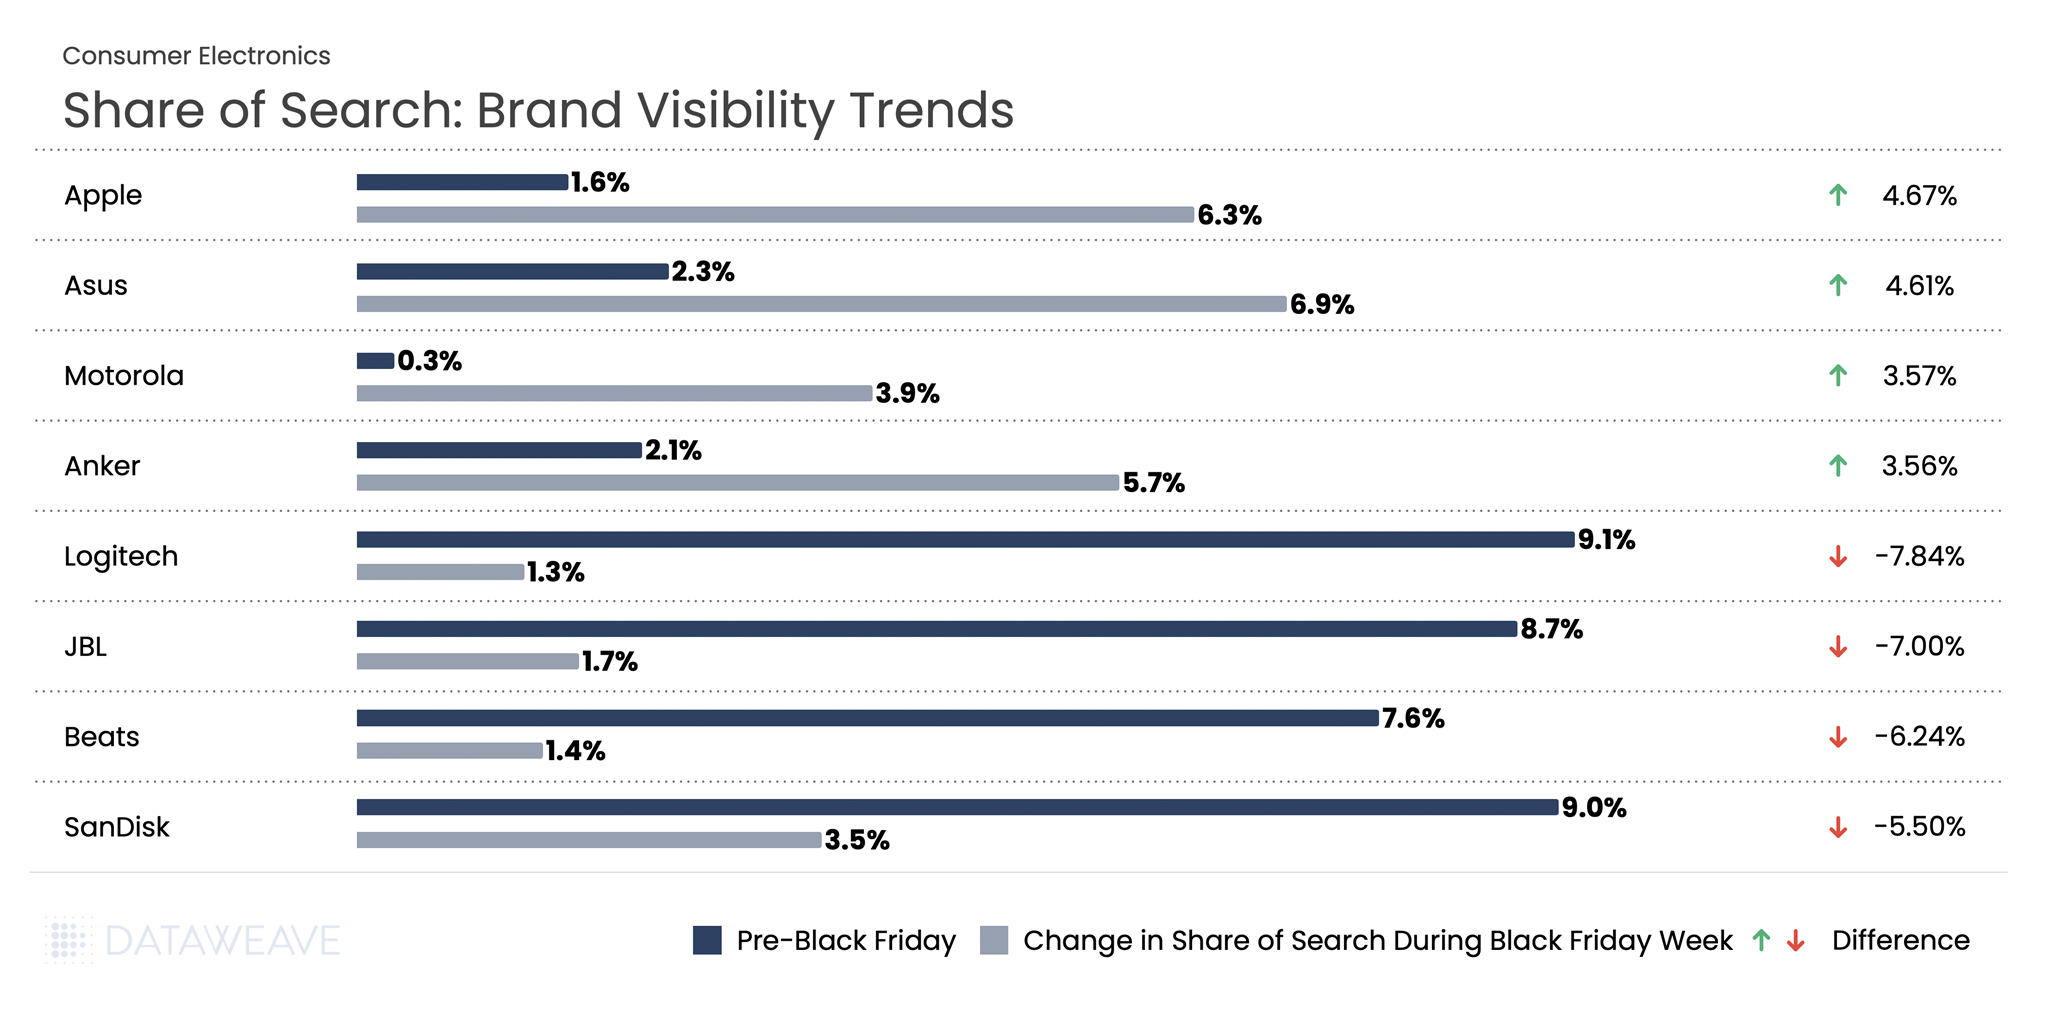
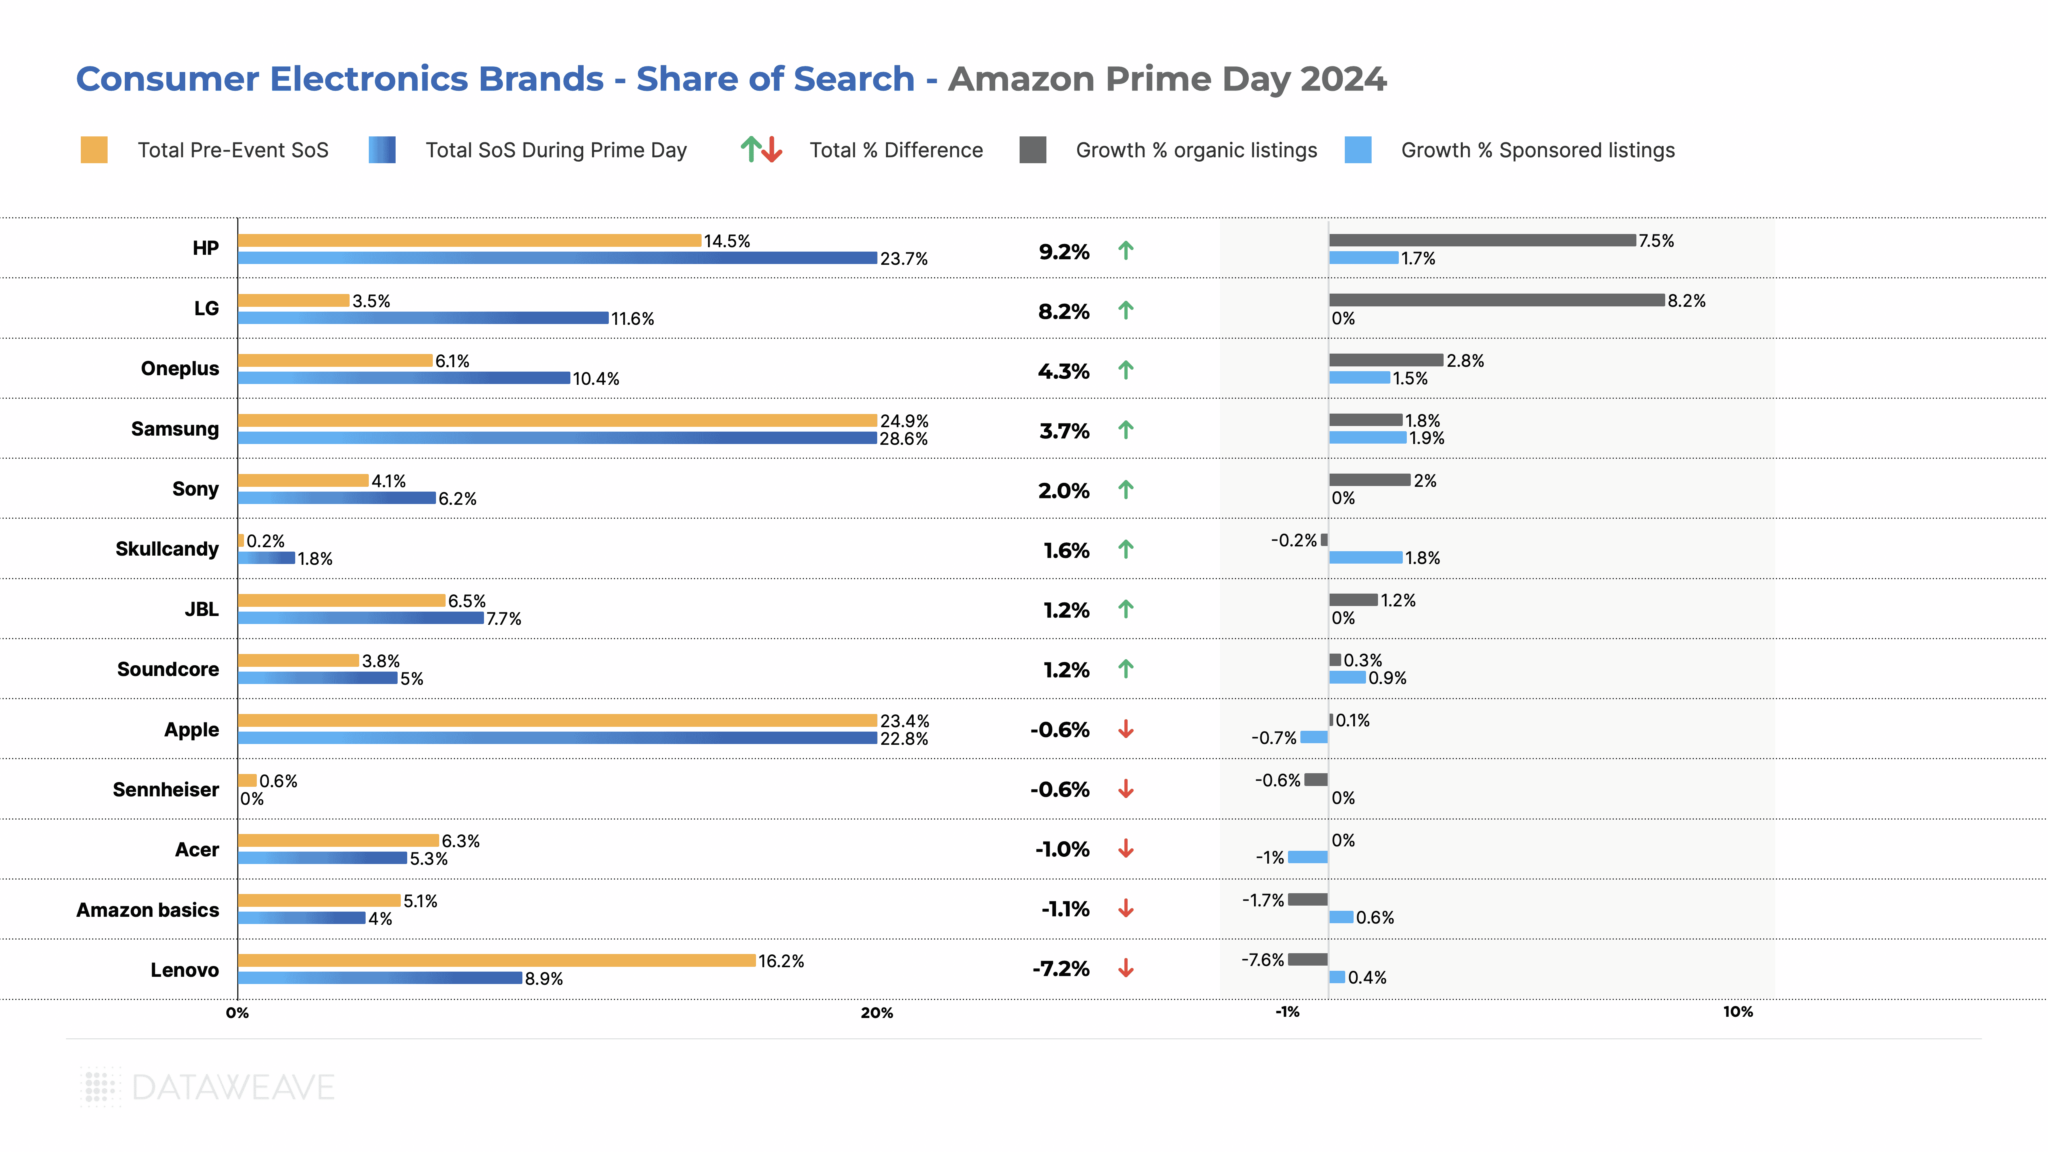
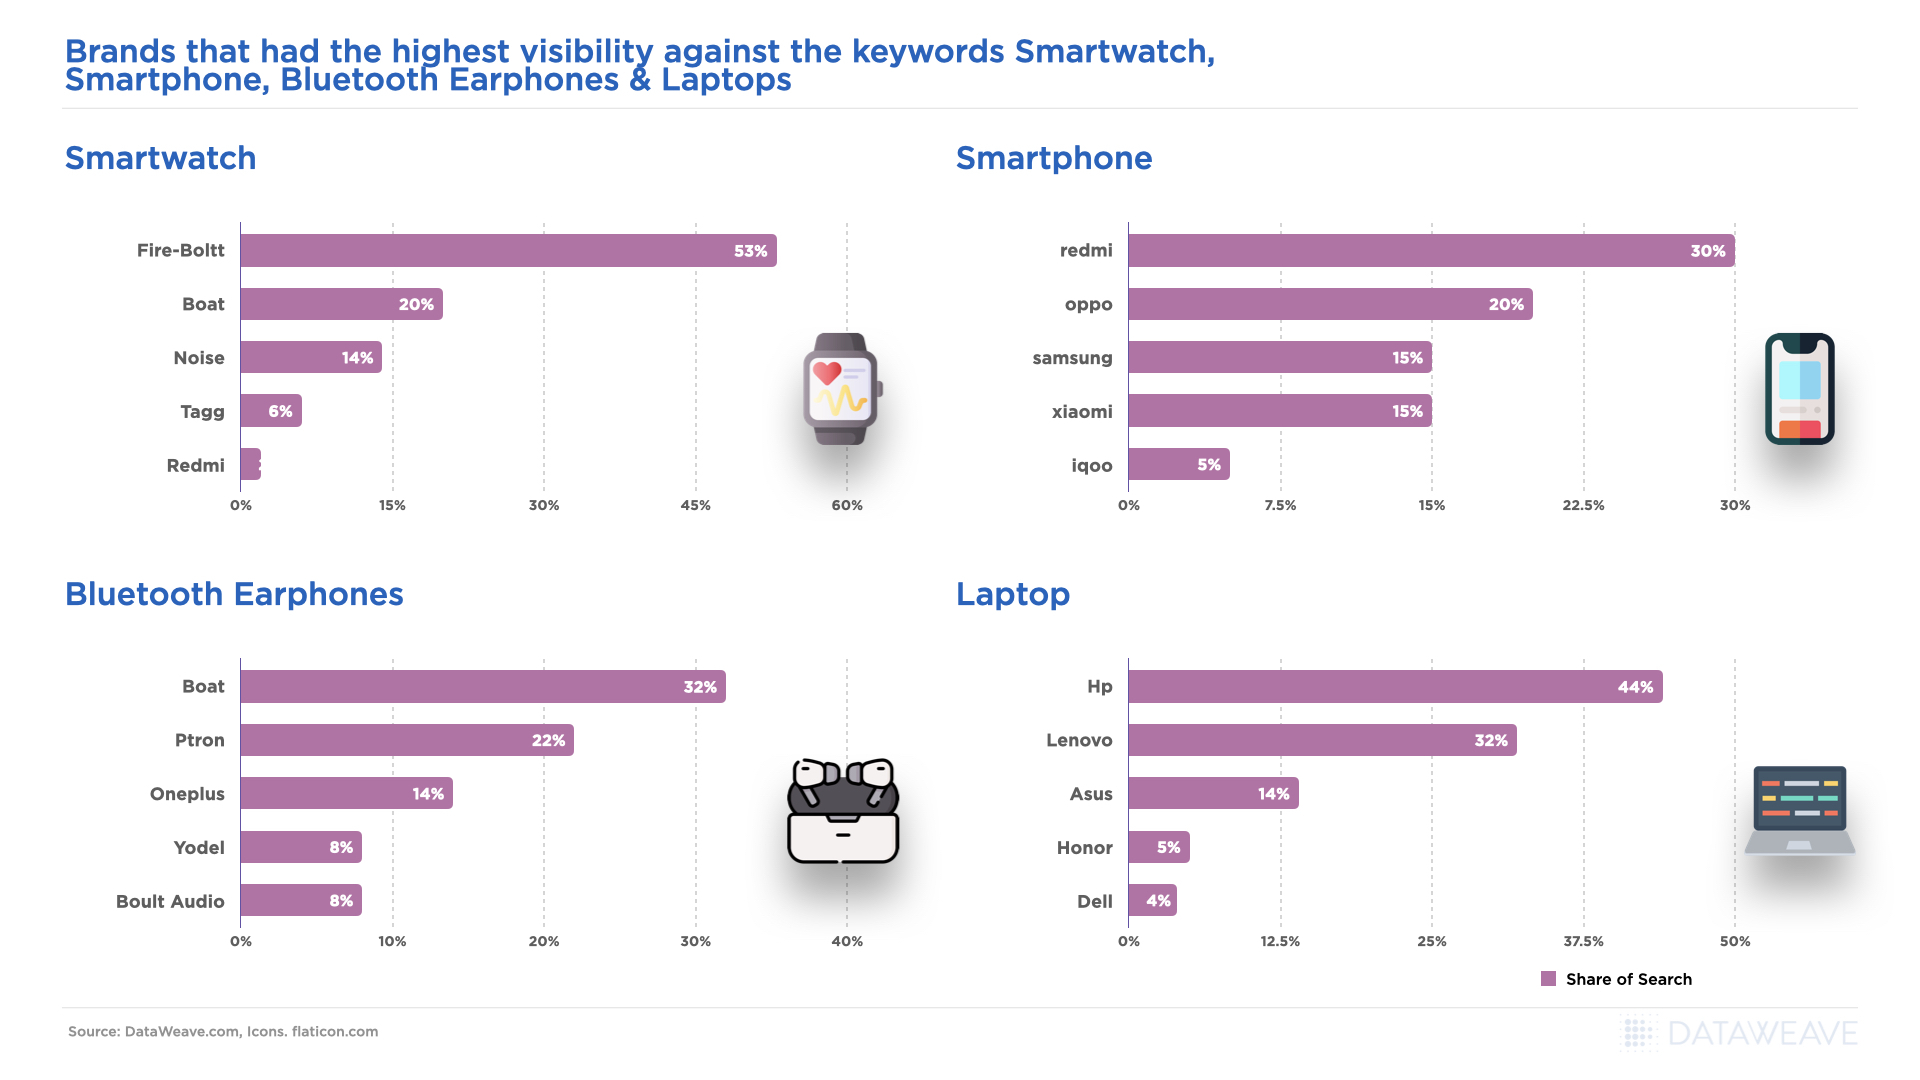
HP saw the highest share of search across Black Friday at 10.5% pre event and 11.6% during the event. Apple led with a 4.7% increase in visibility, jumping from 1.6% to 6.3%. Asus followed at 4.6%. Motorola surged 3.6 %, while wearables brand Fitbit gained 1.7%.
In stark contrast, Logitech dropped by 7.8 %, Beats fell 6.2 %, and SanDisk declined 5.5 %. Computer manufacturers Dell and Acer also struggled, falling 2.5 and 2.3 % respectively.
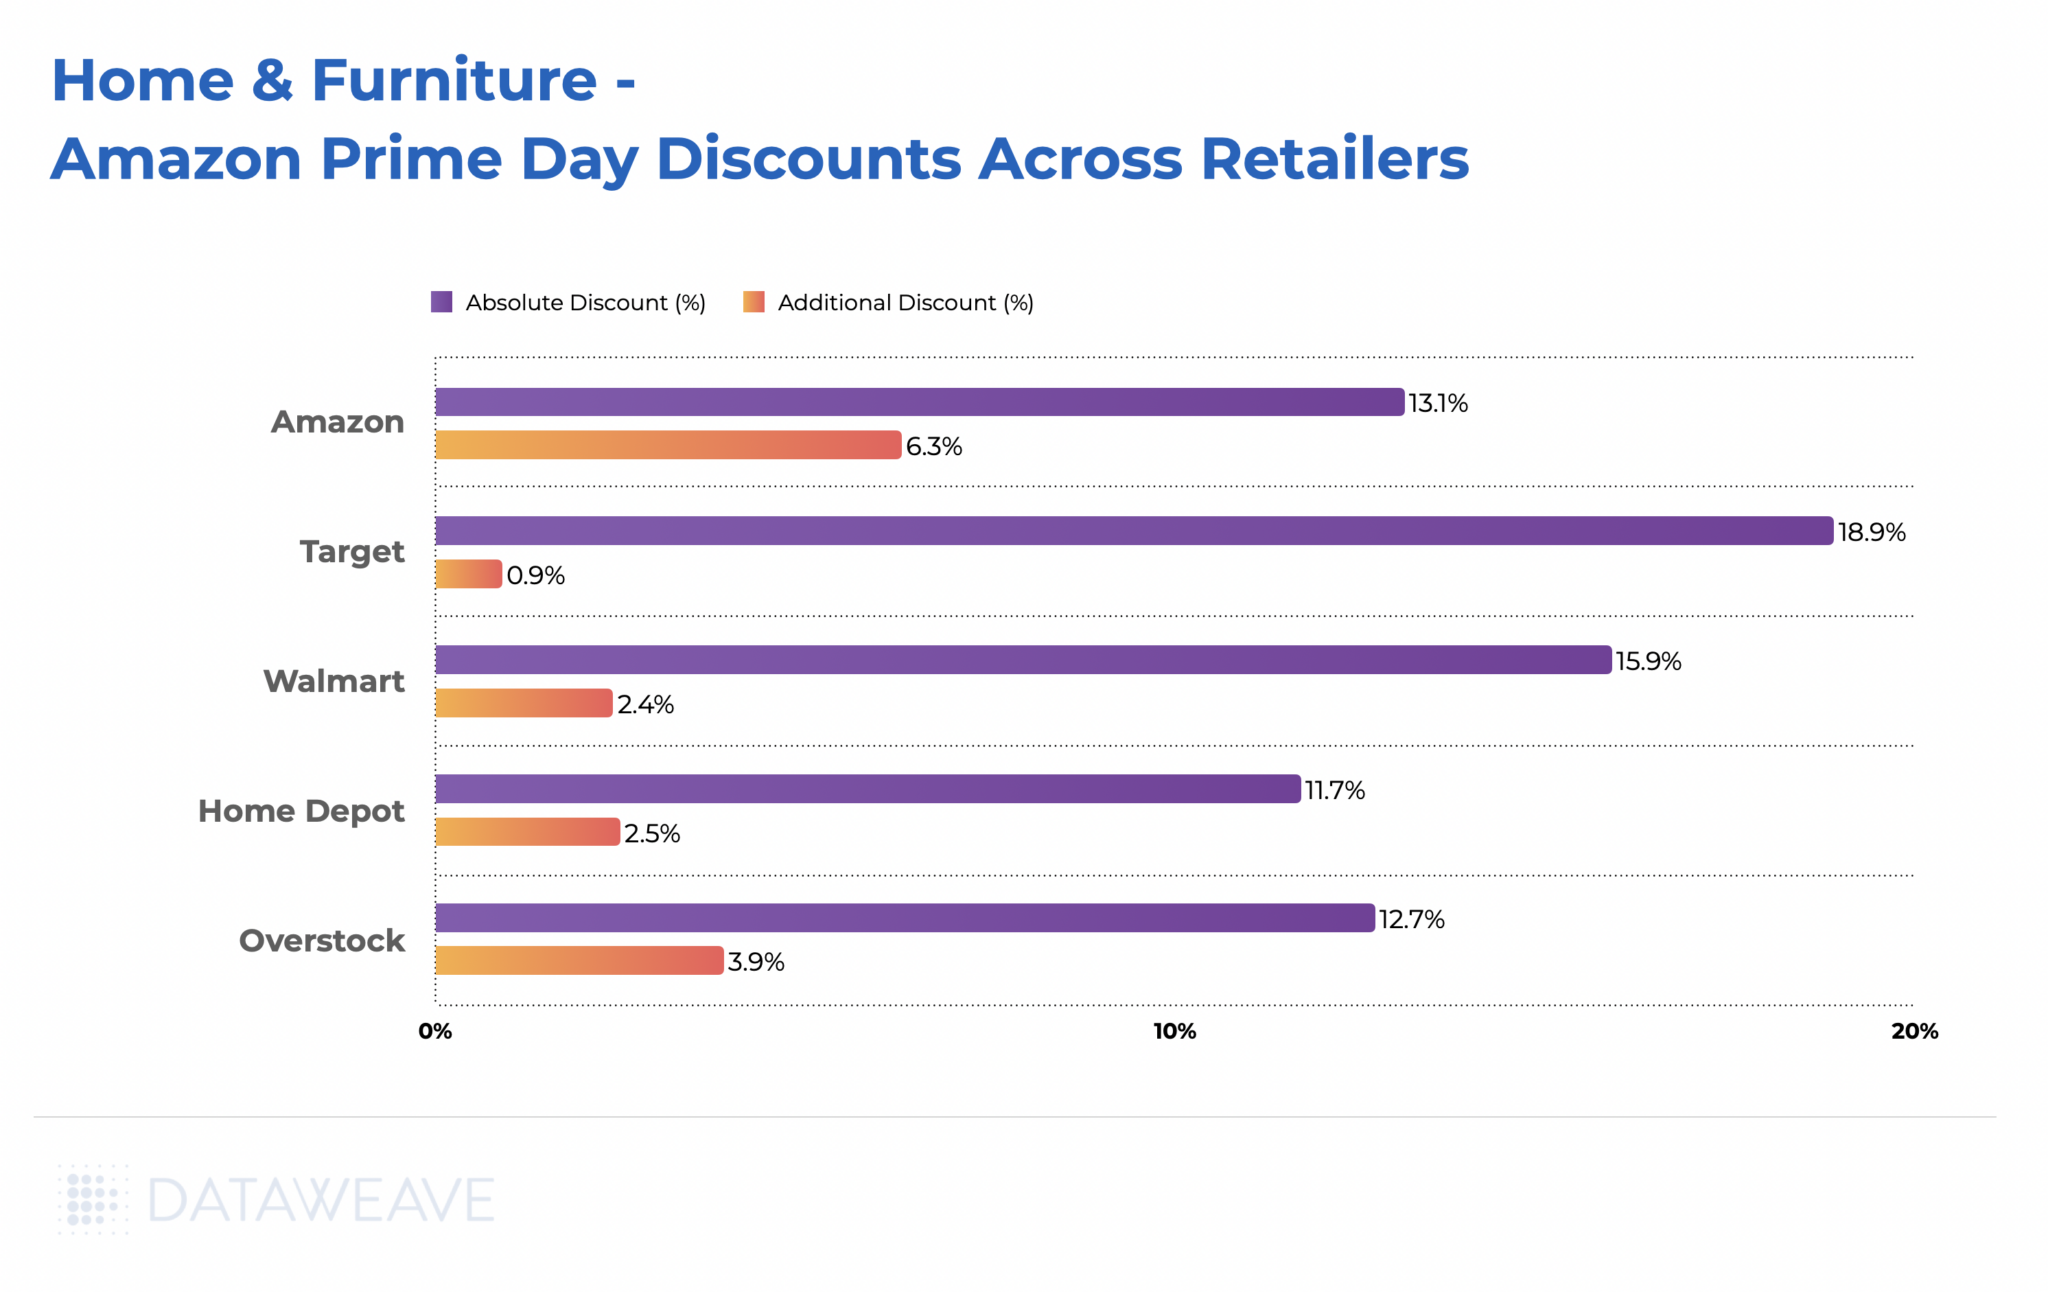
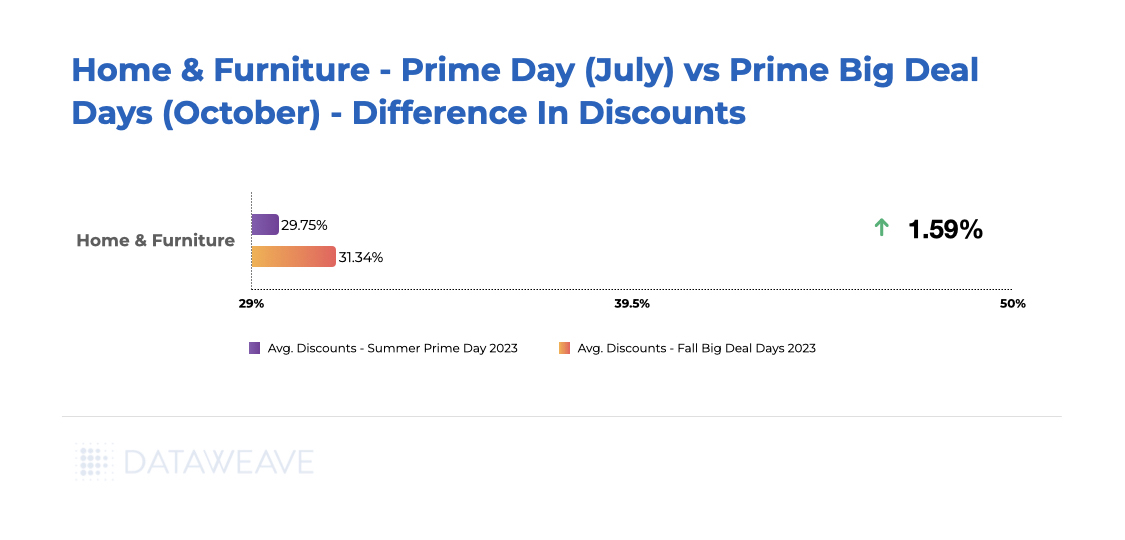
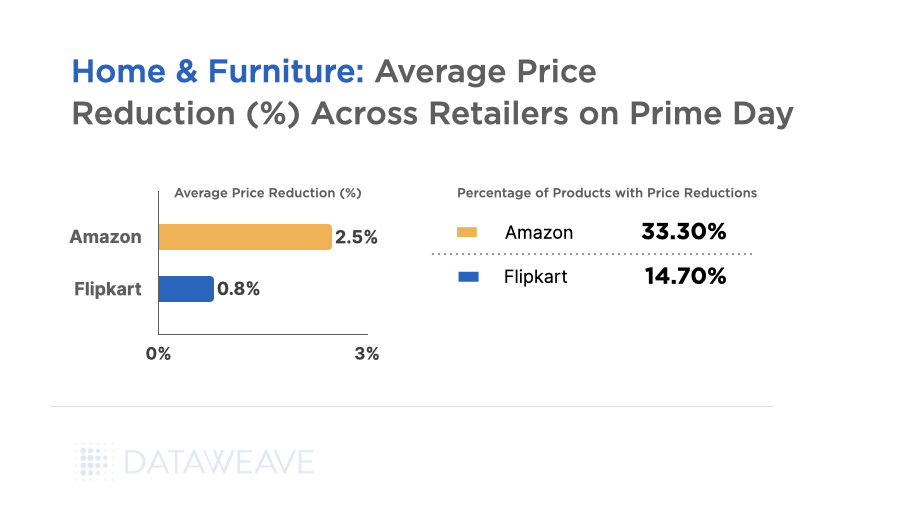
Home & Furniture
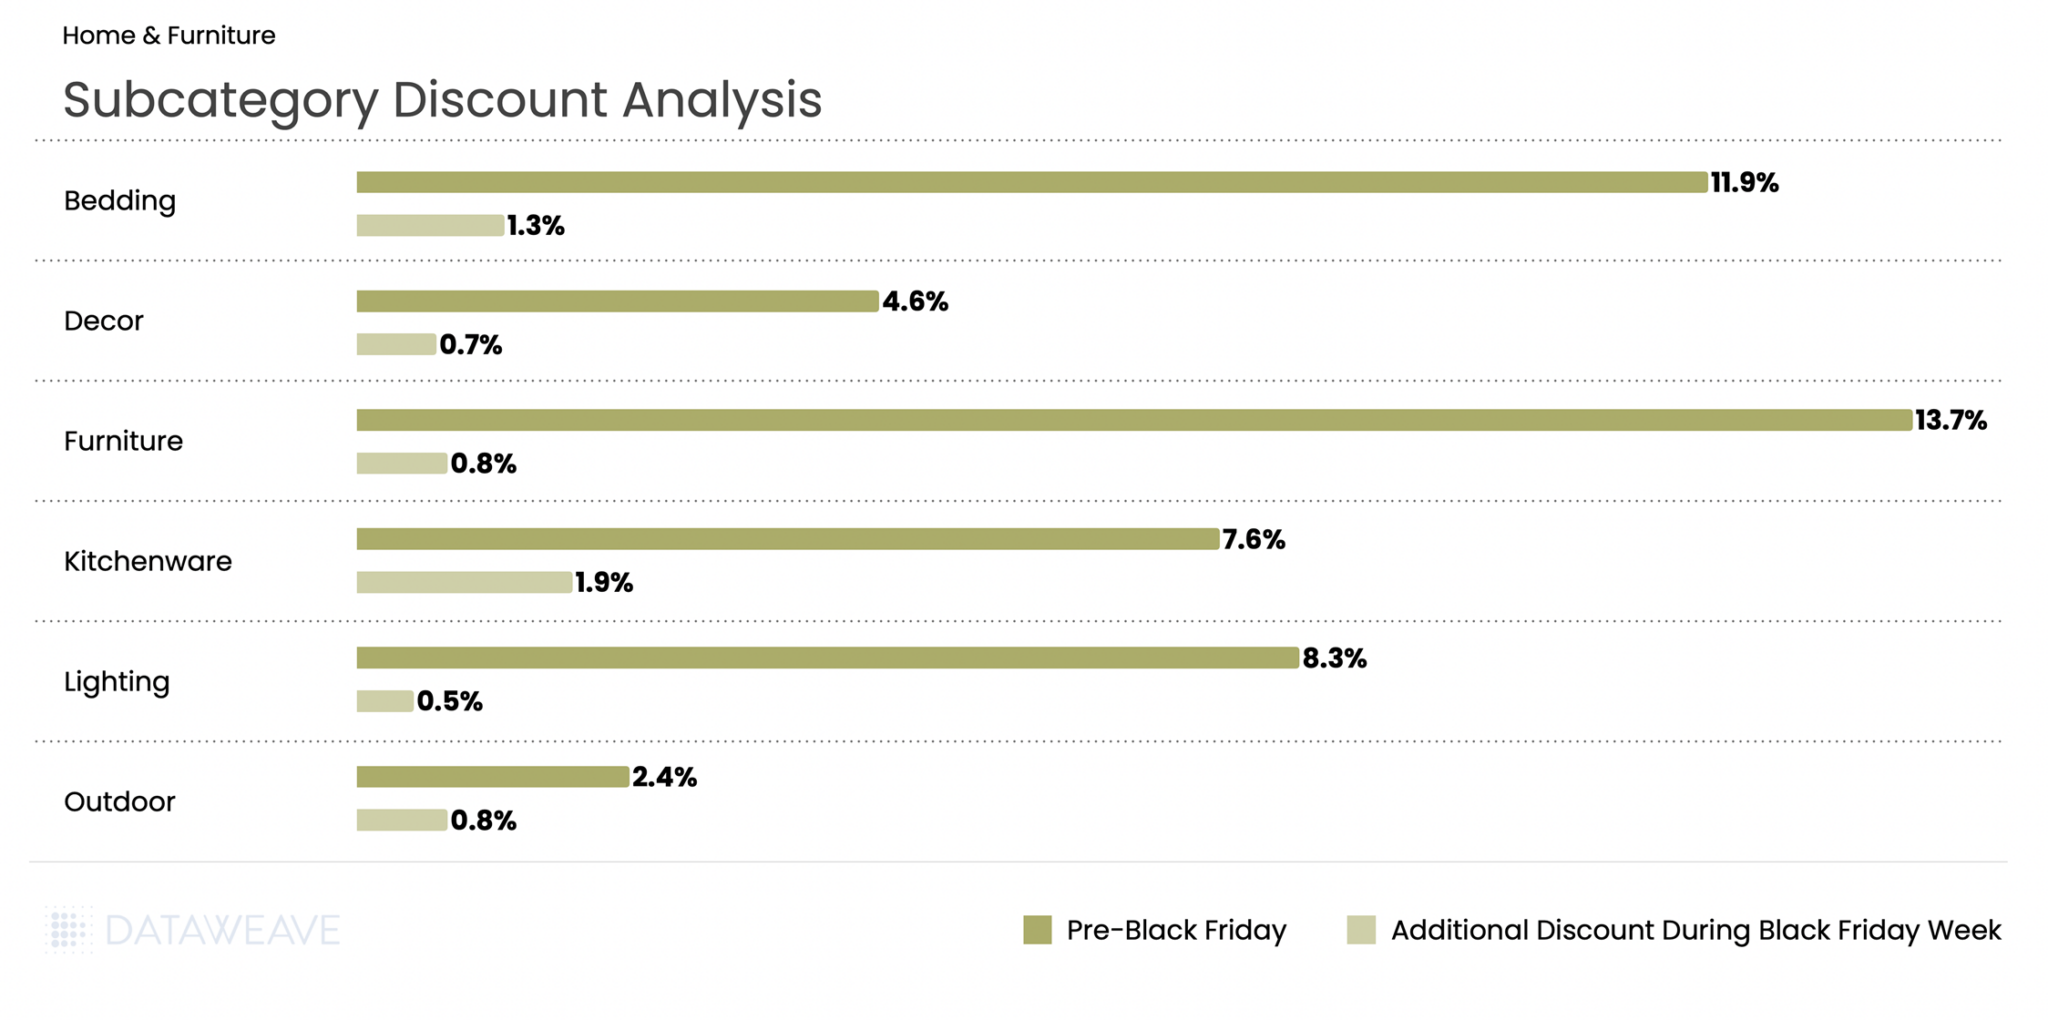
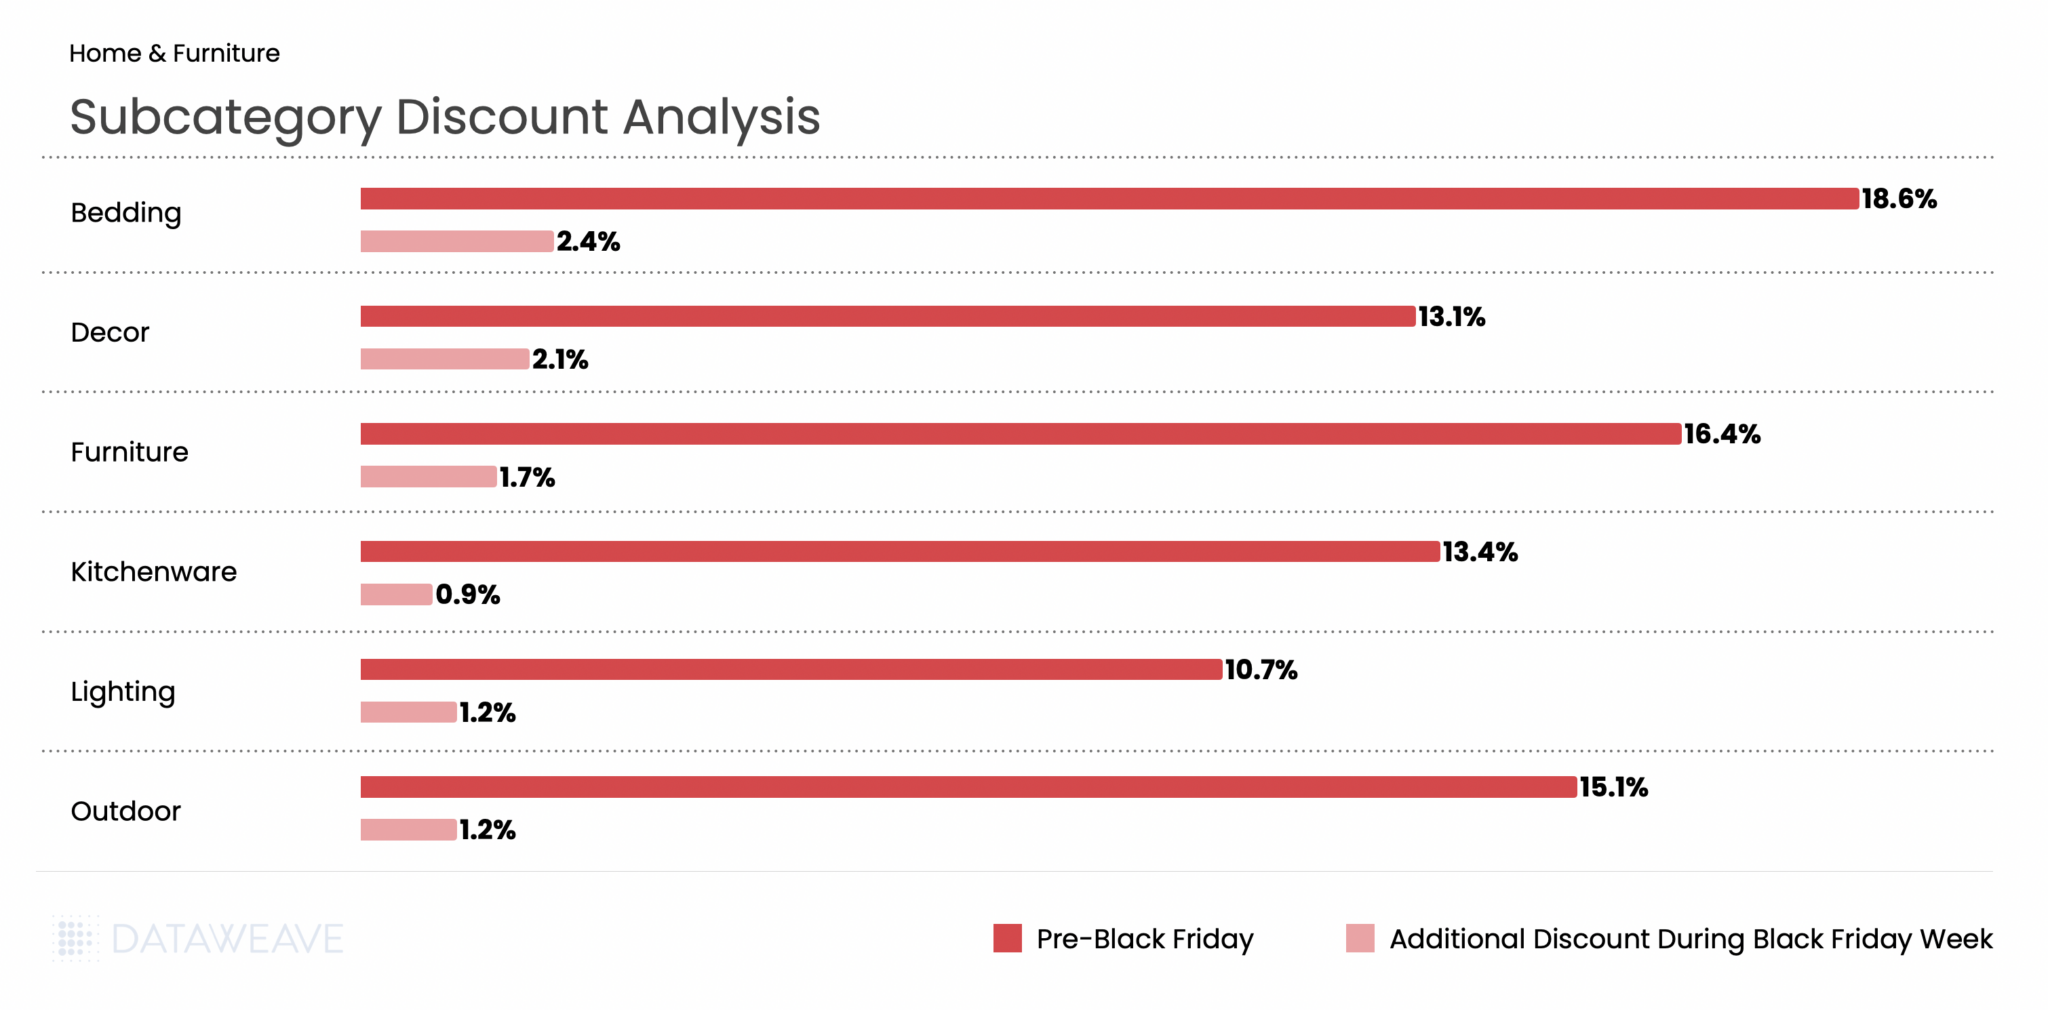
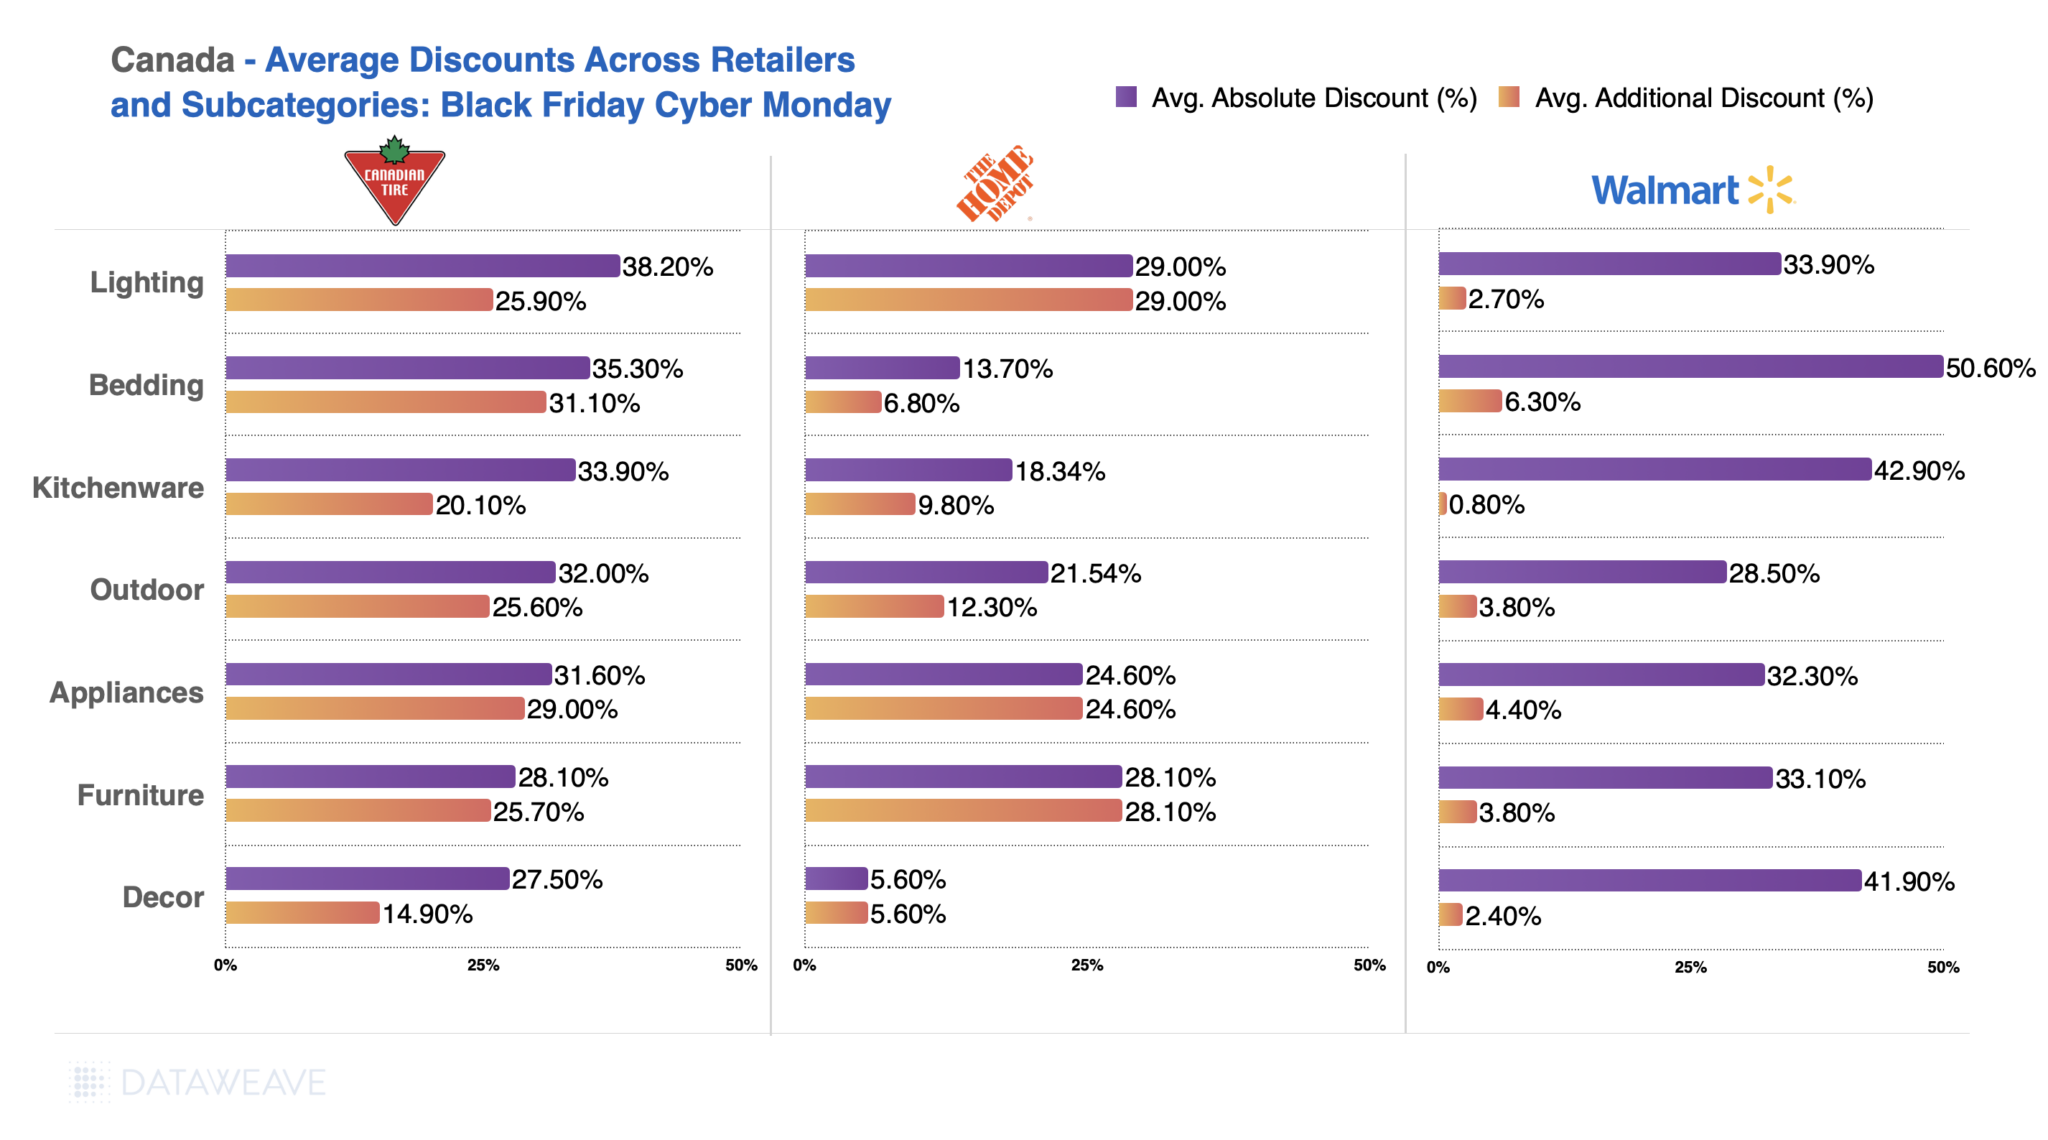
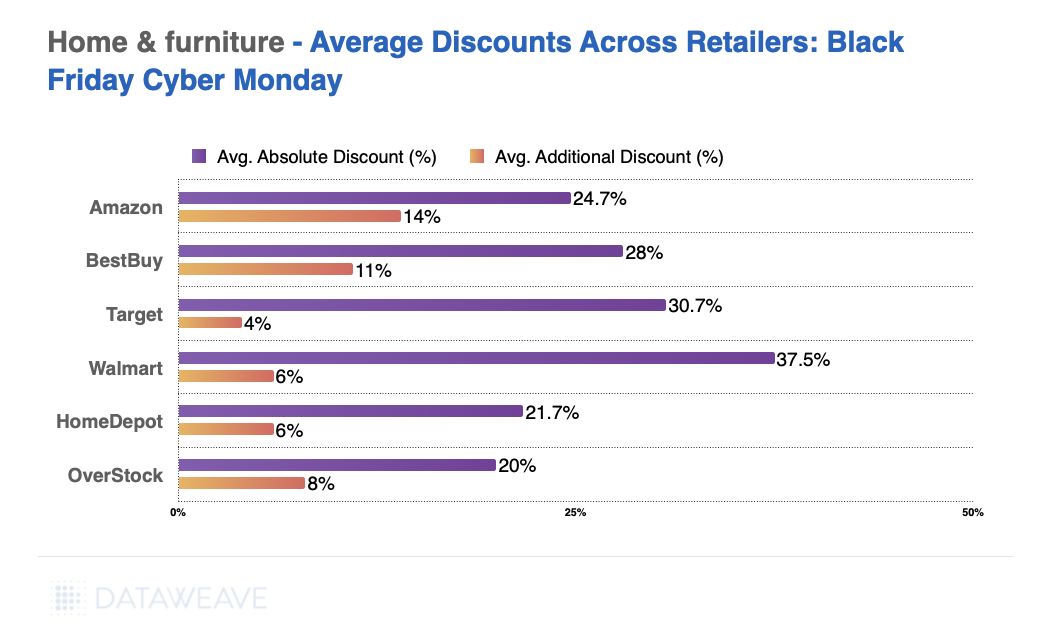
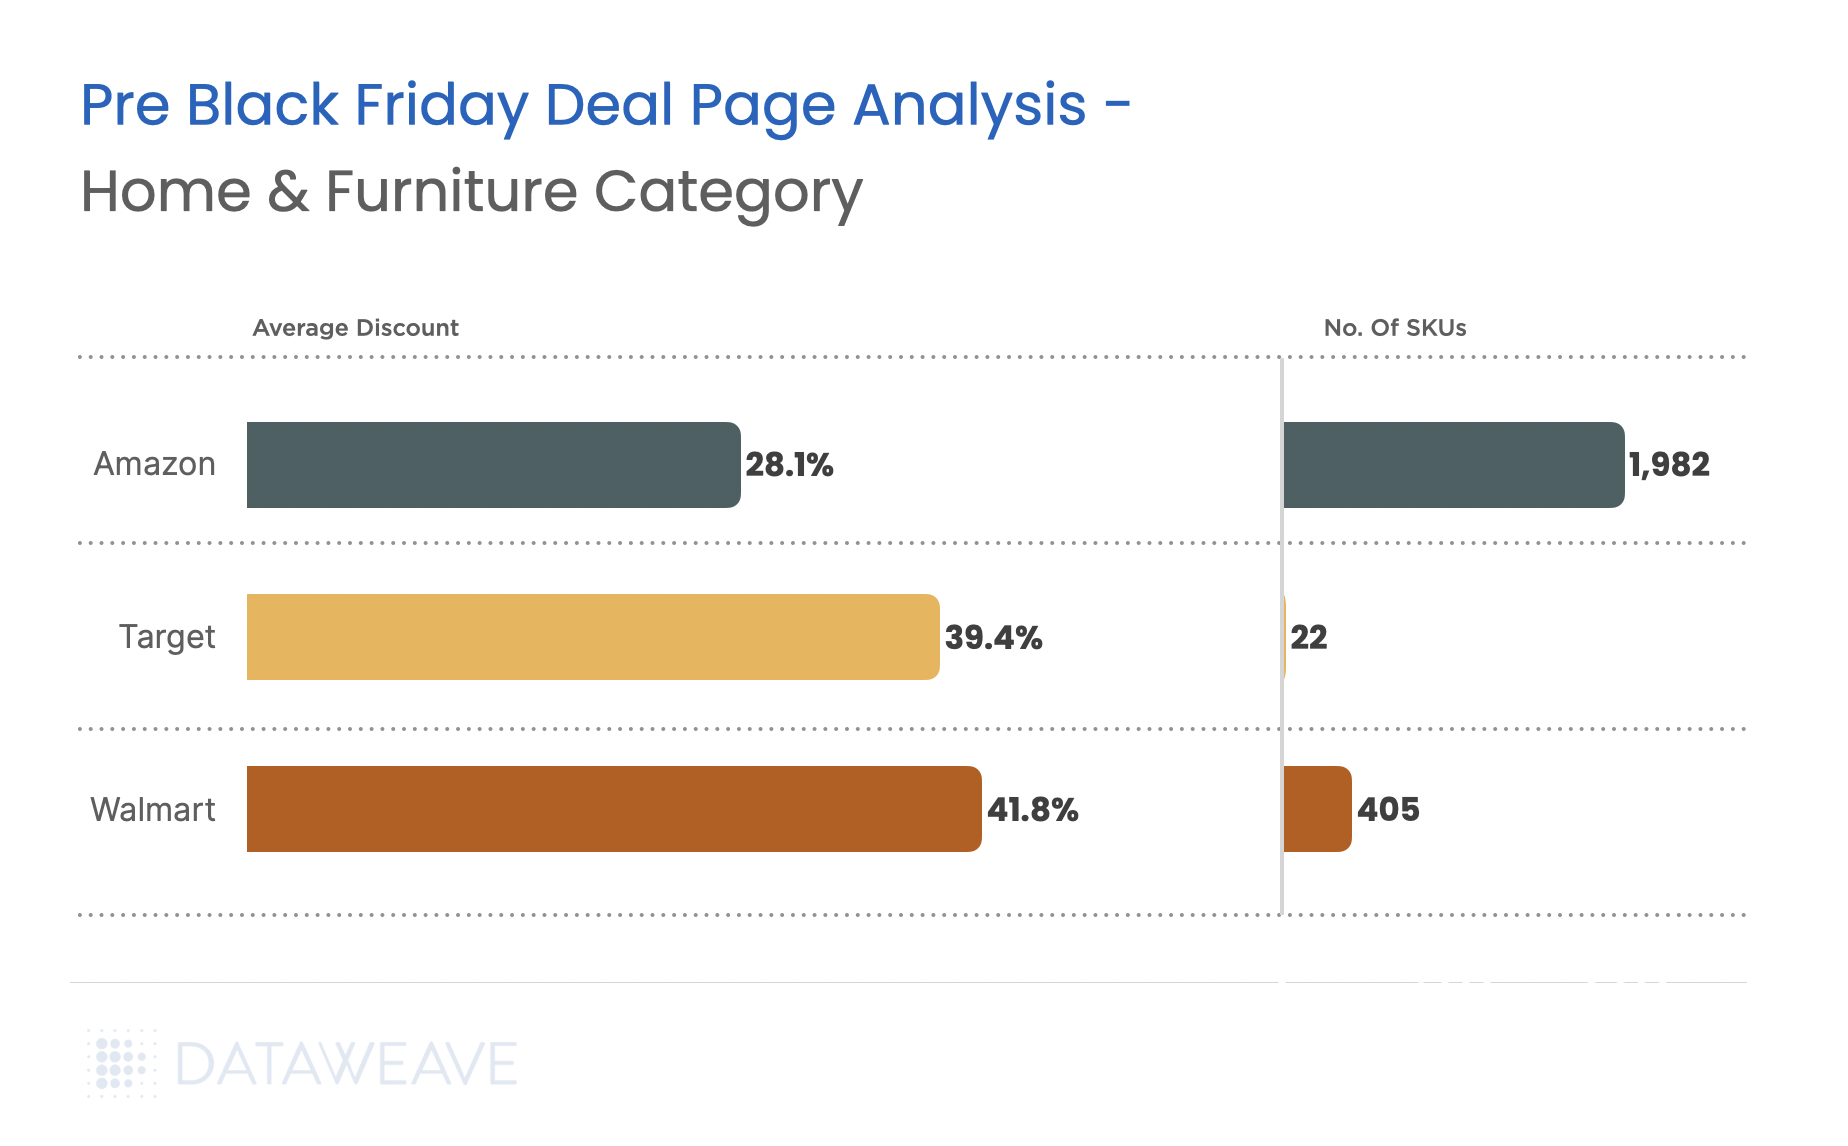
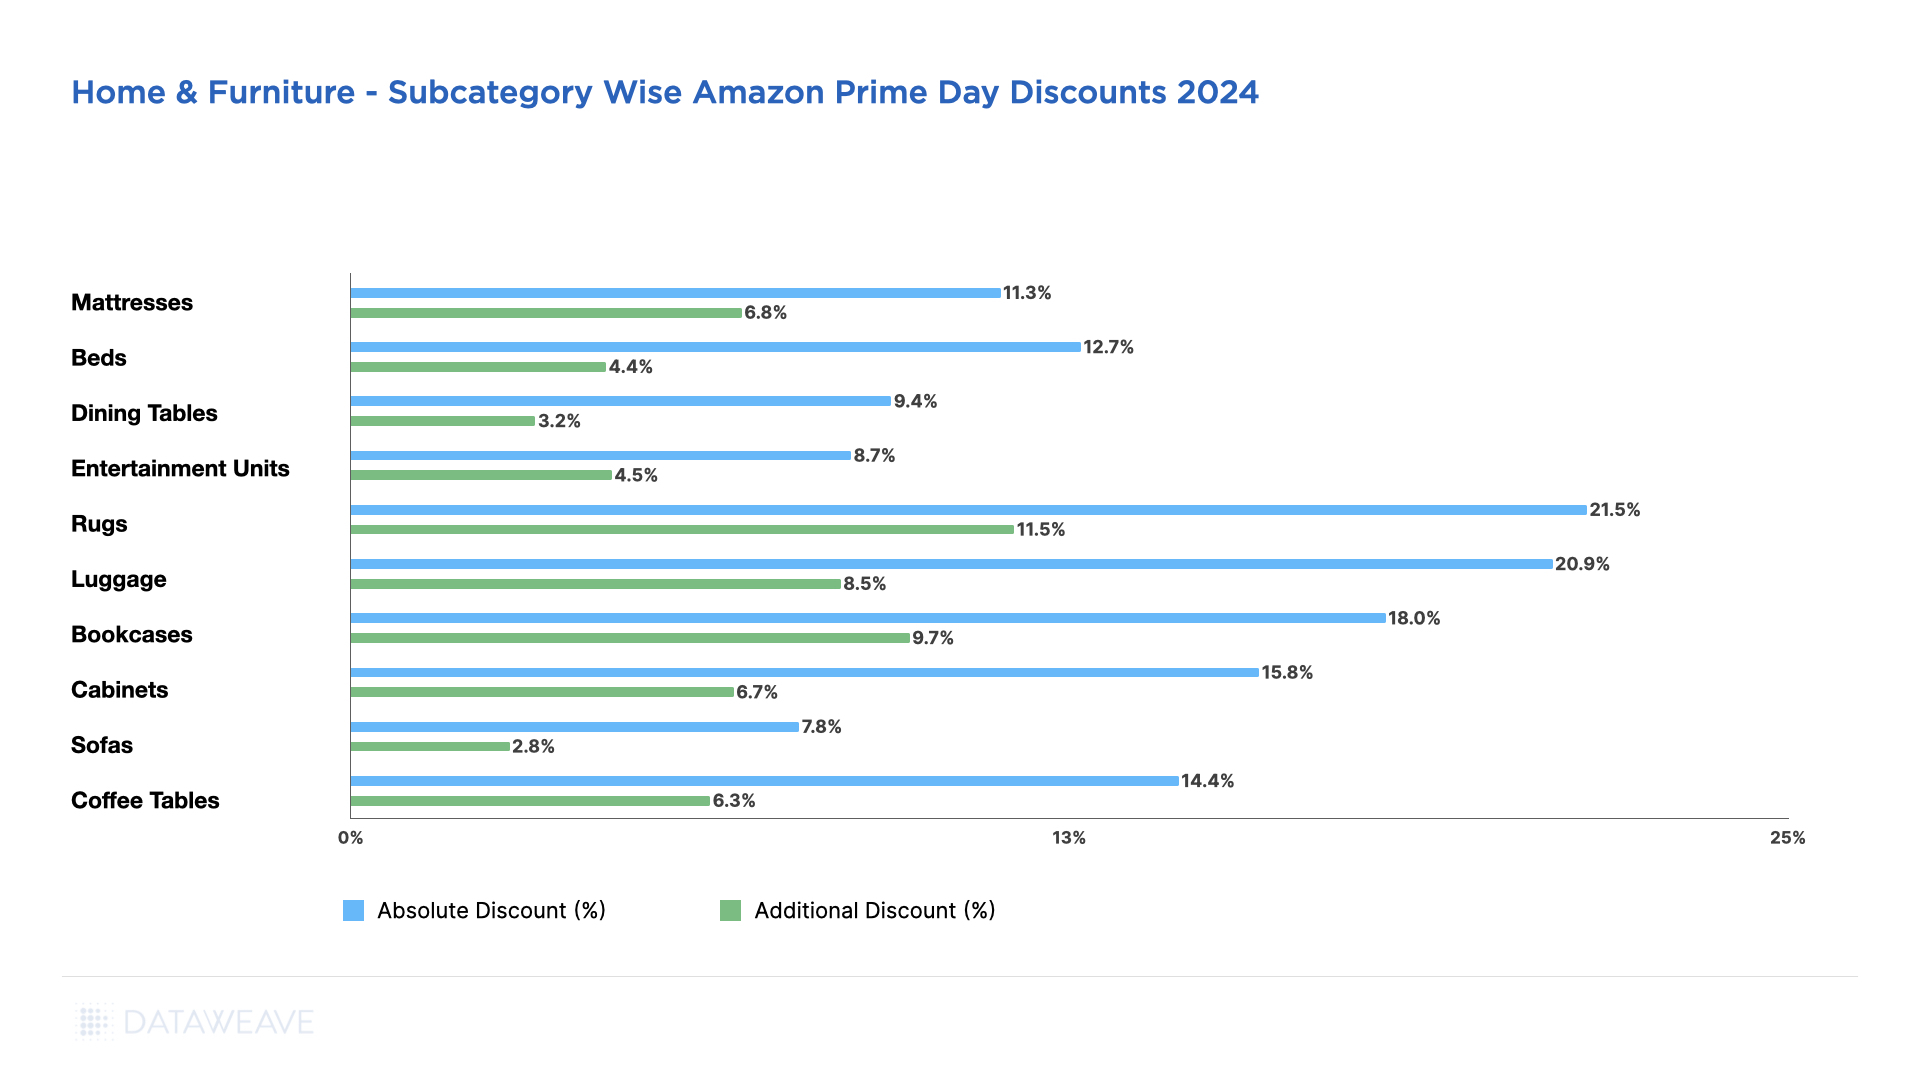
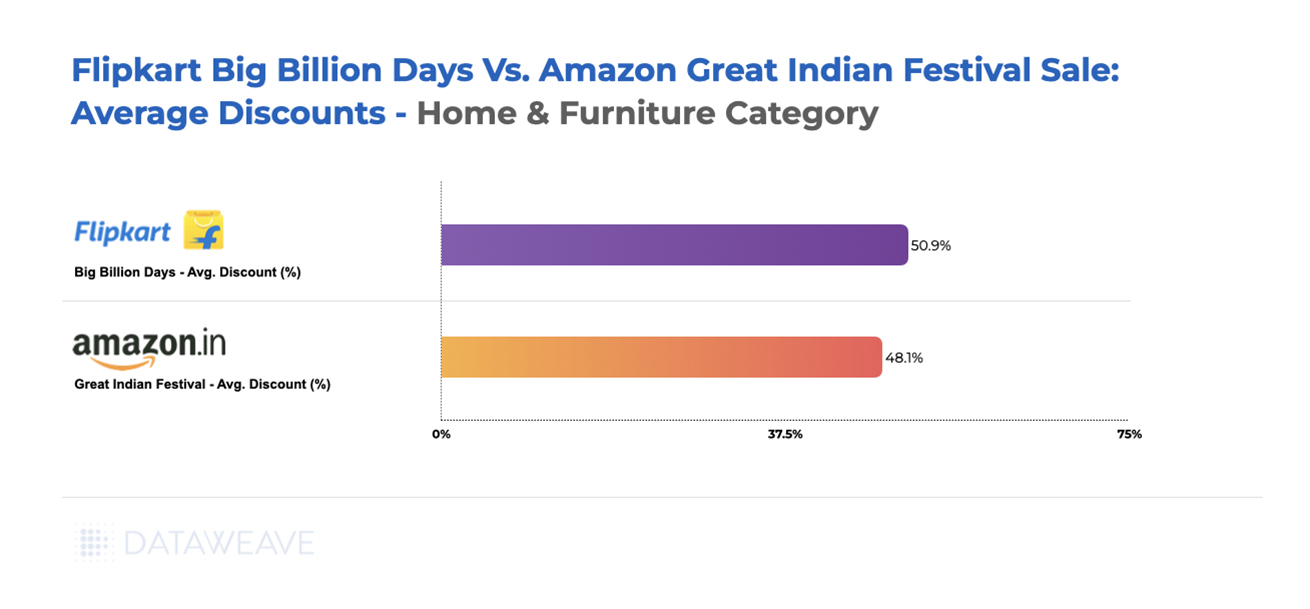
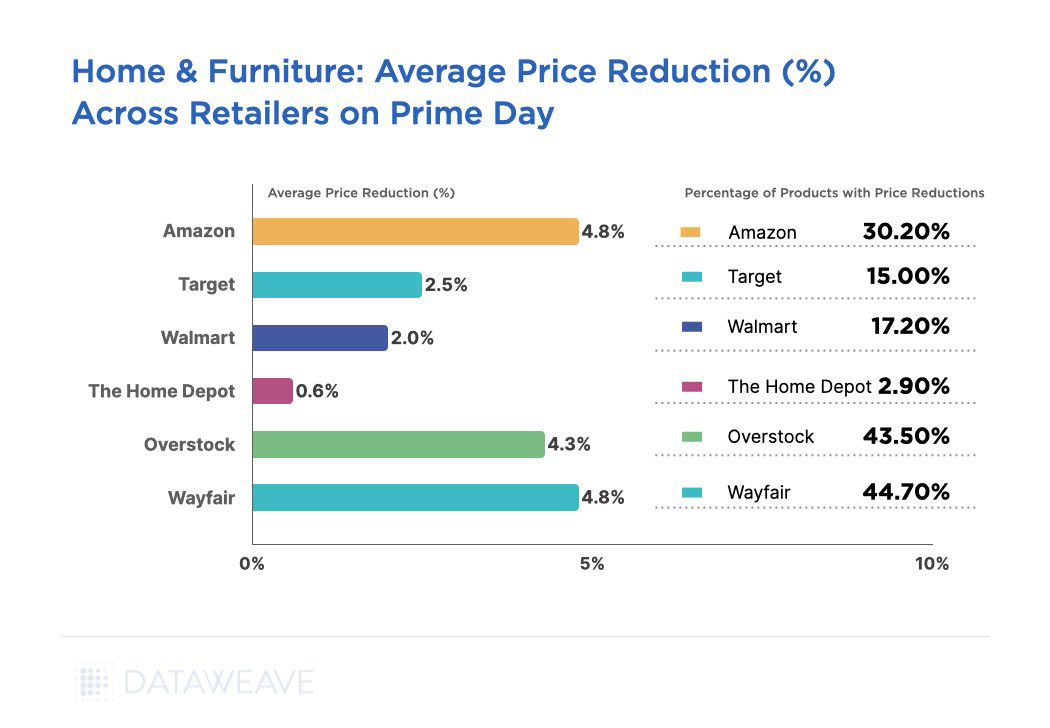
The Home & Furniture category in Germany showed unique discounting behavior compared to other markets, with additional Black Friday Week discounts (6.7%) actually exceeding Pre-Black Friday levels (6.1%). Our analysis of 1,403 SKUs shows how discounts were distributed across subcategories.
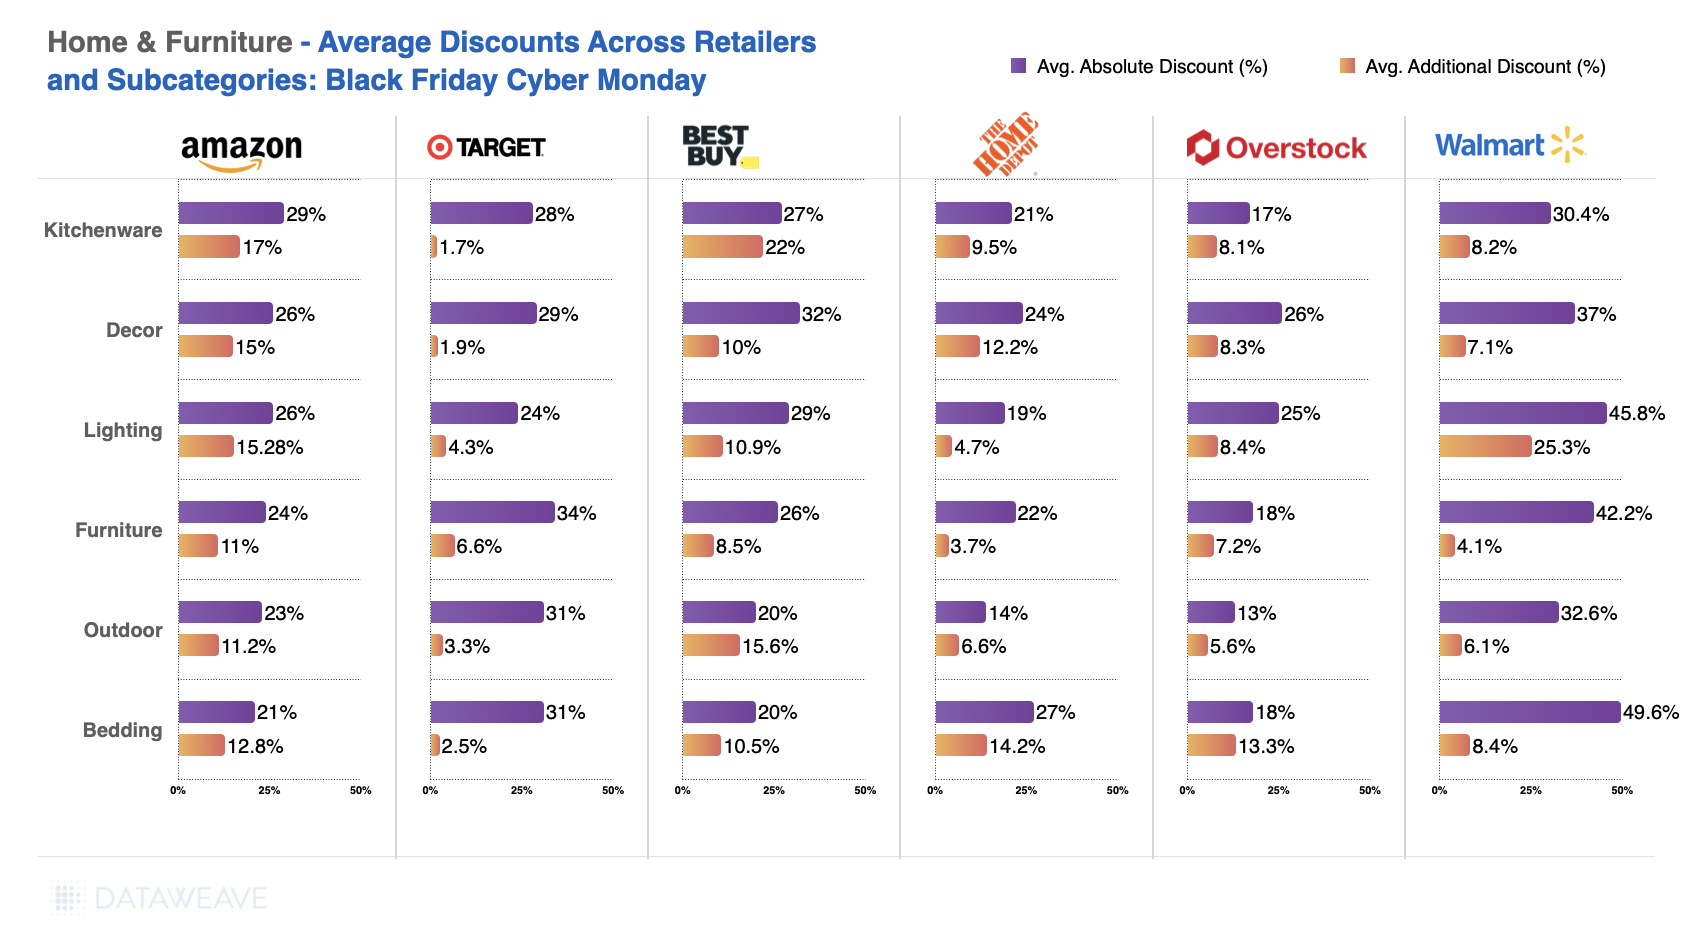
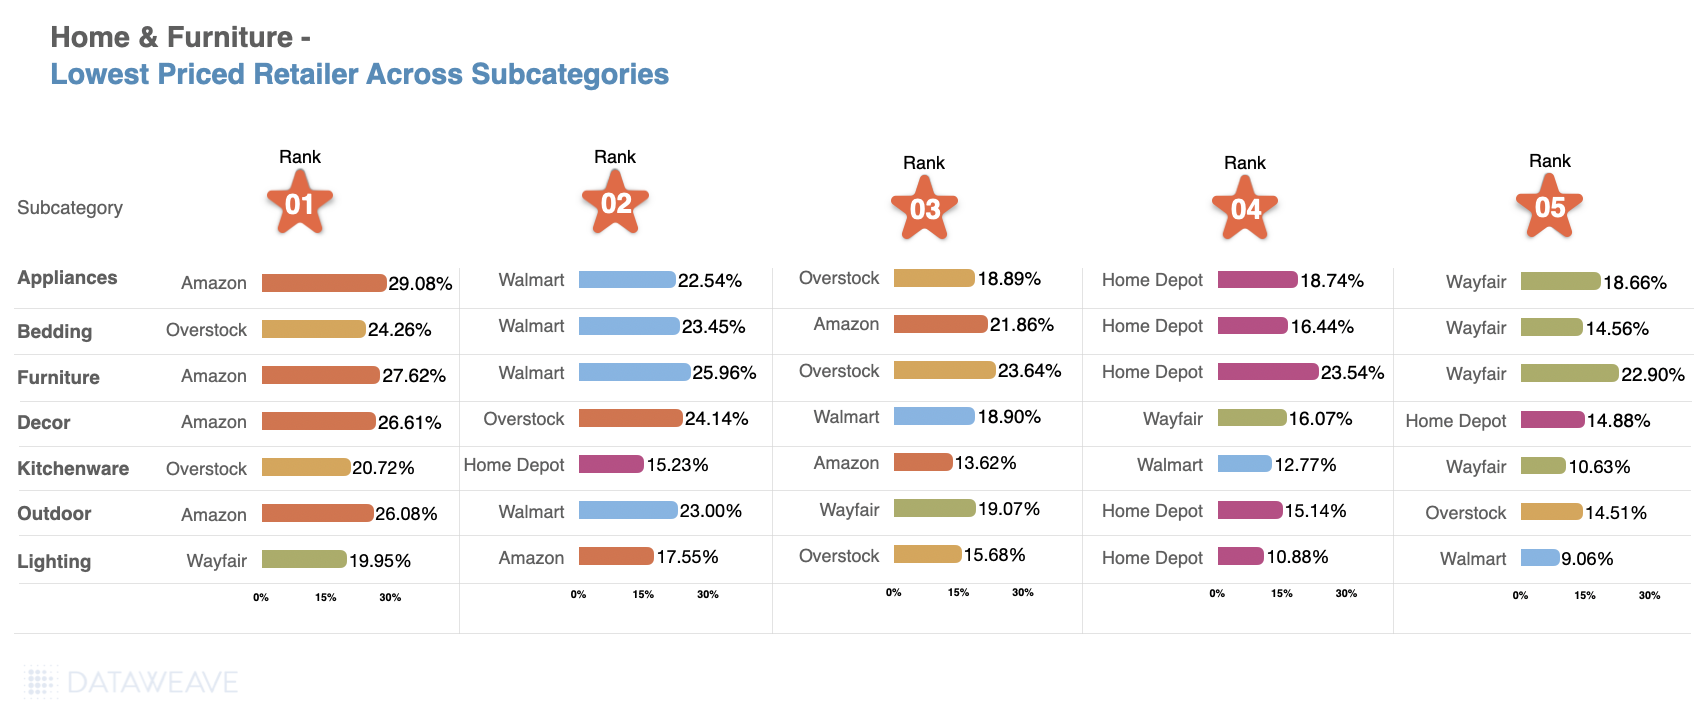
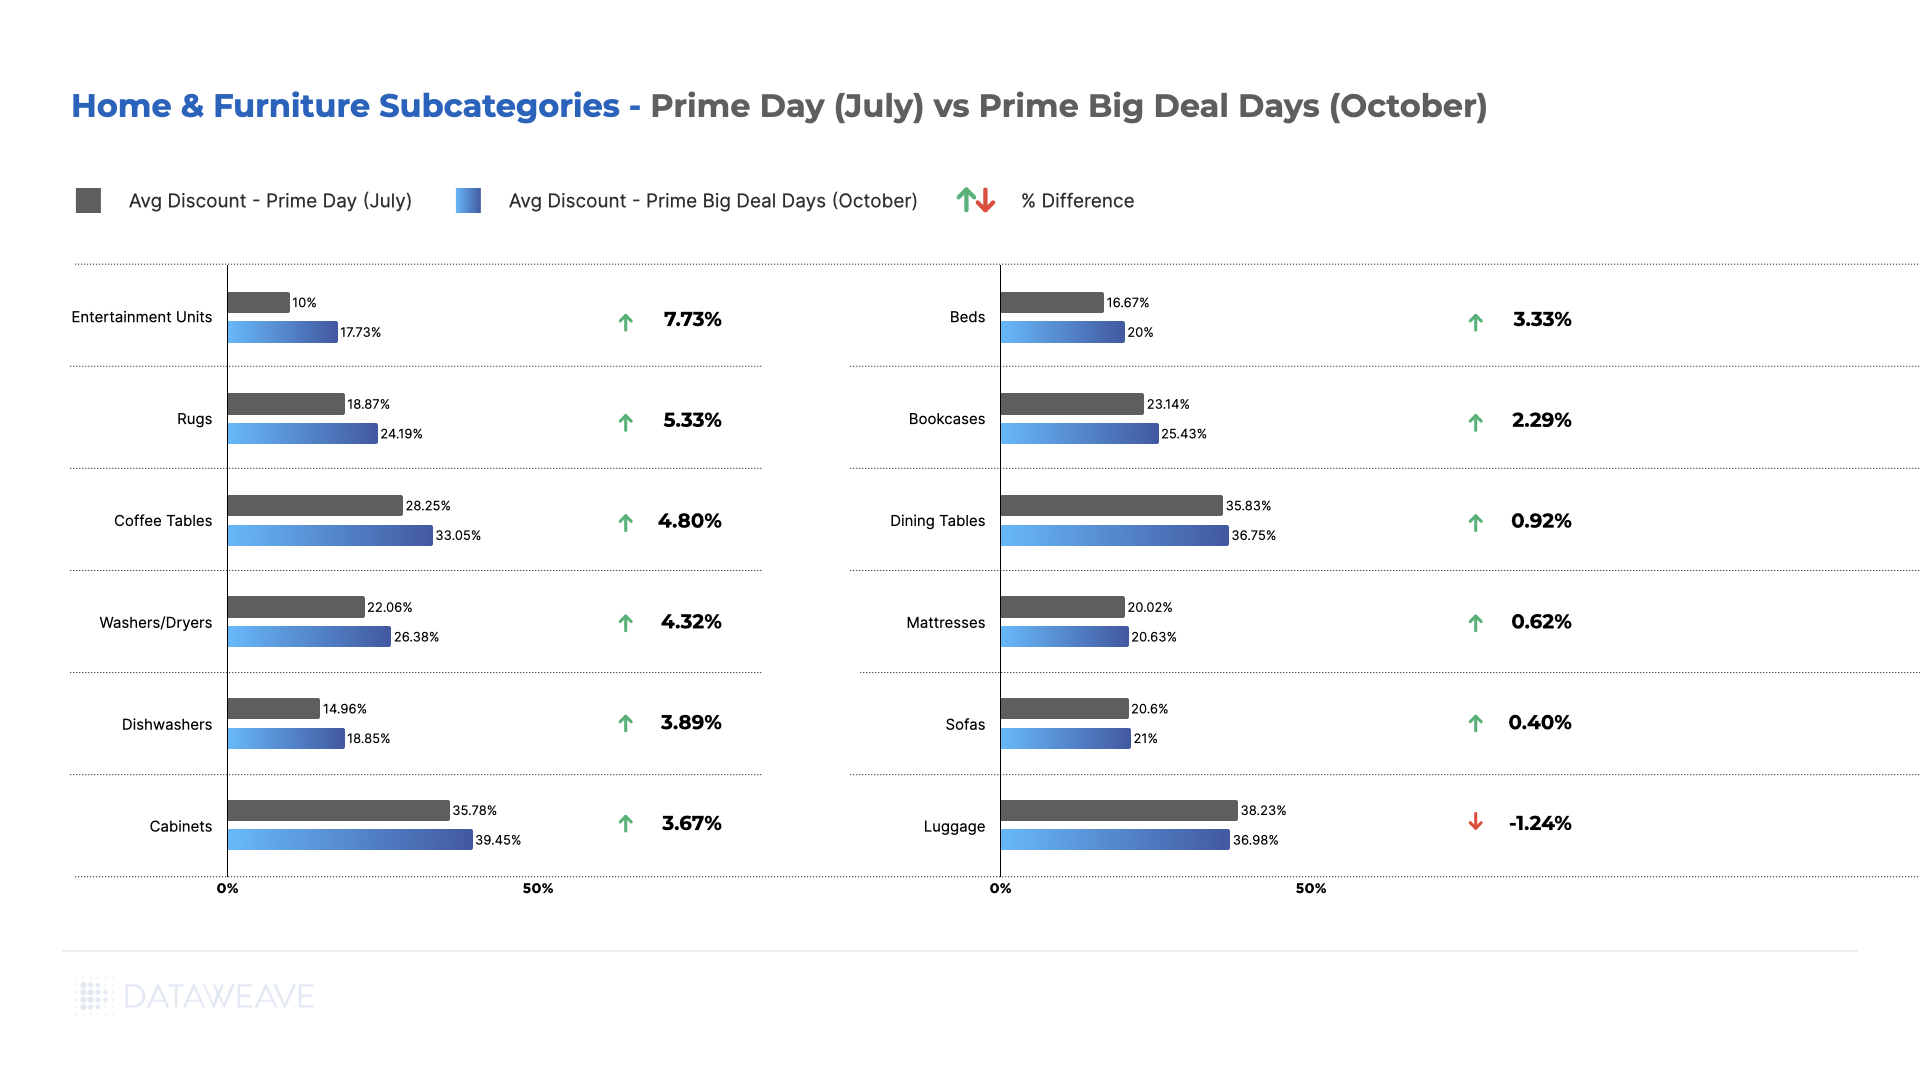
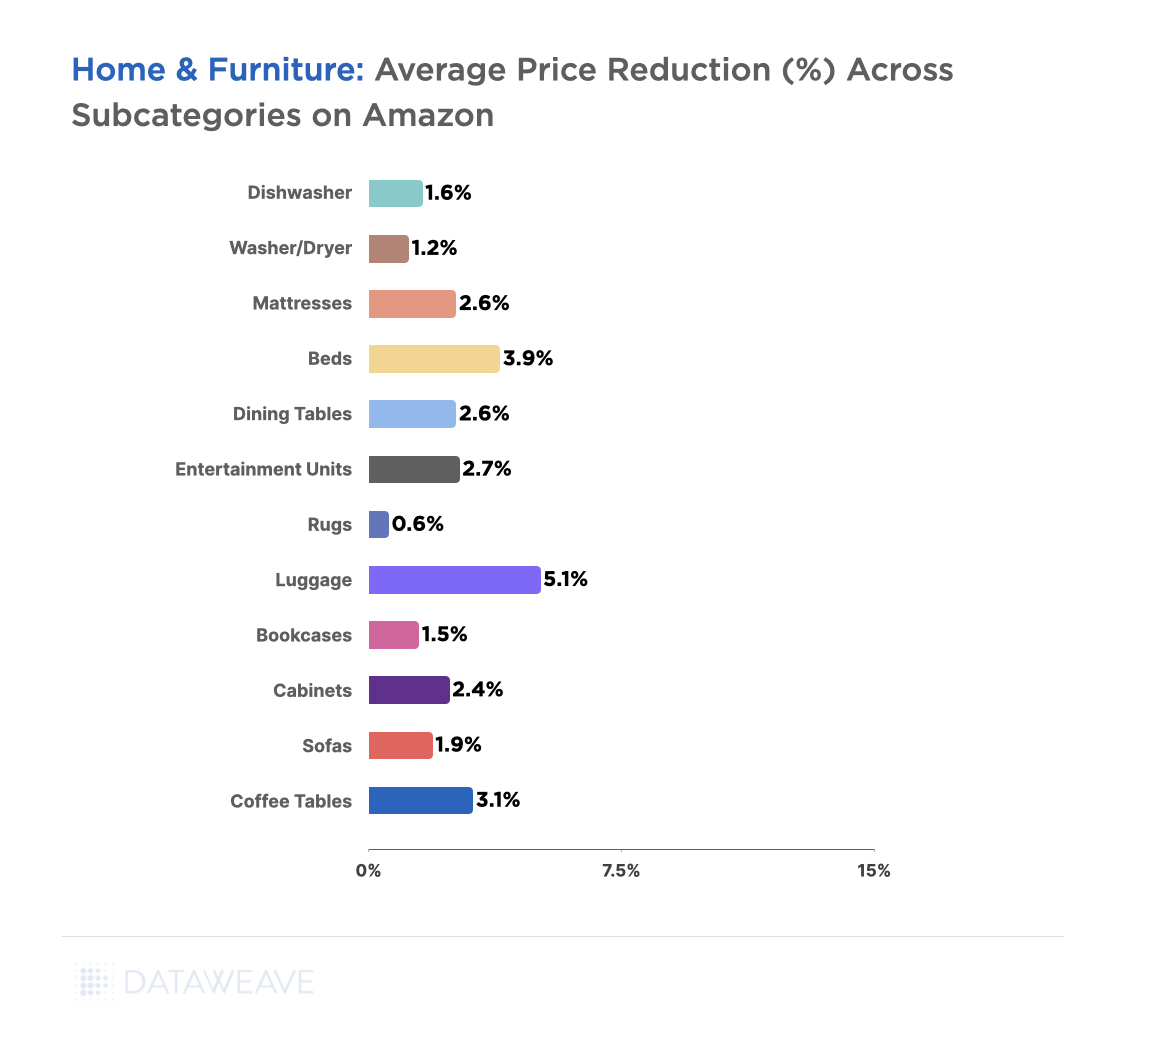
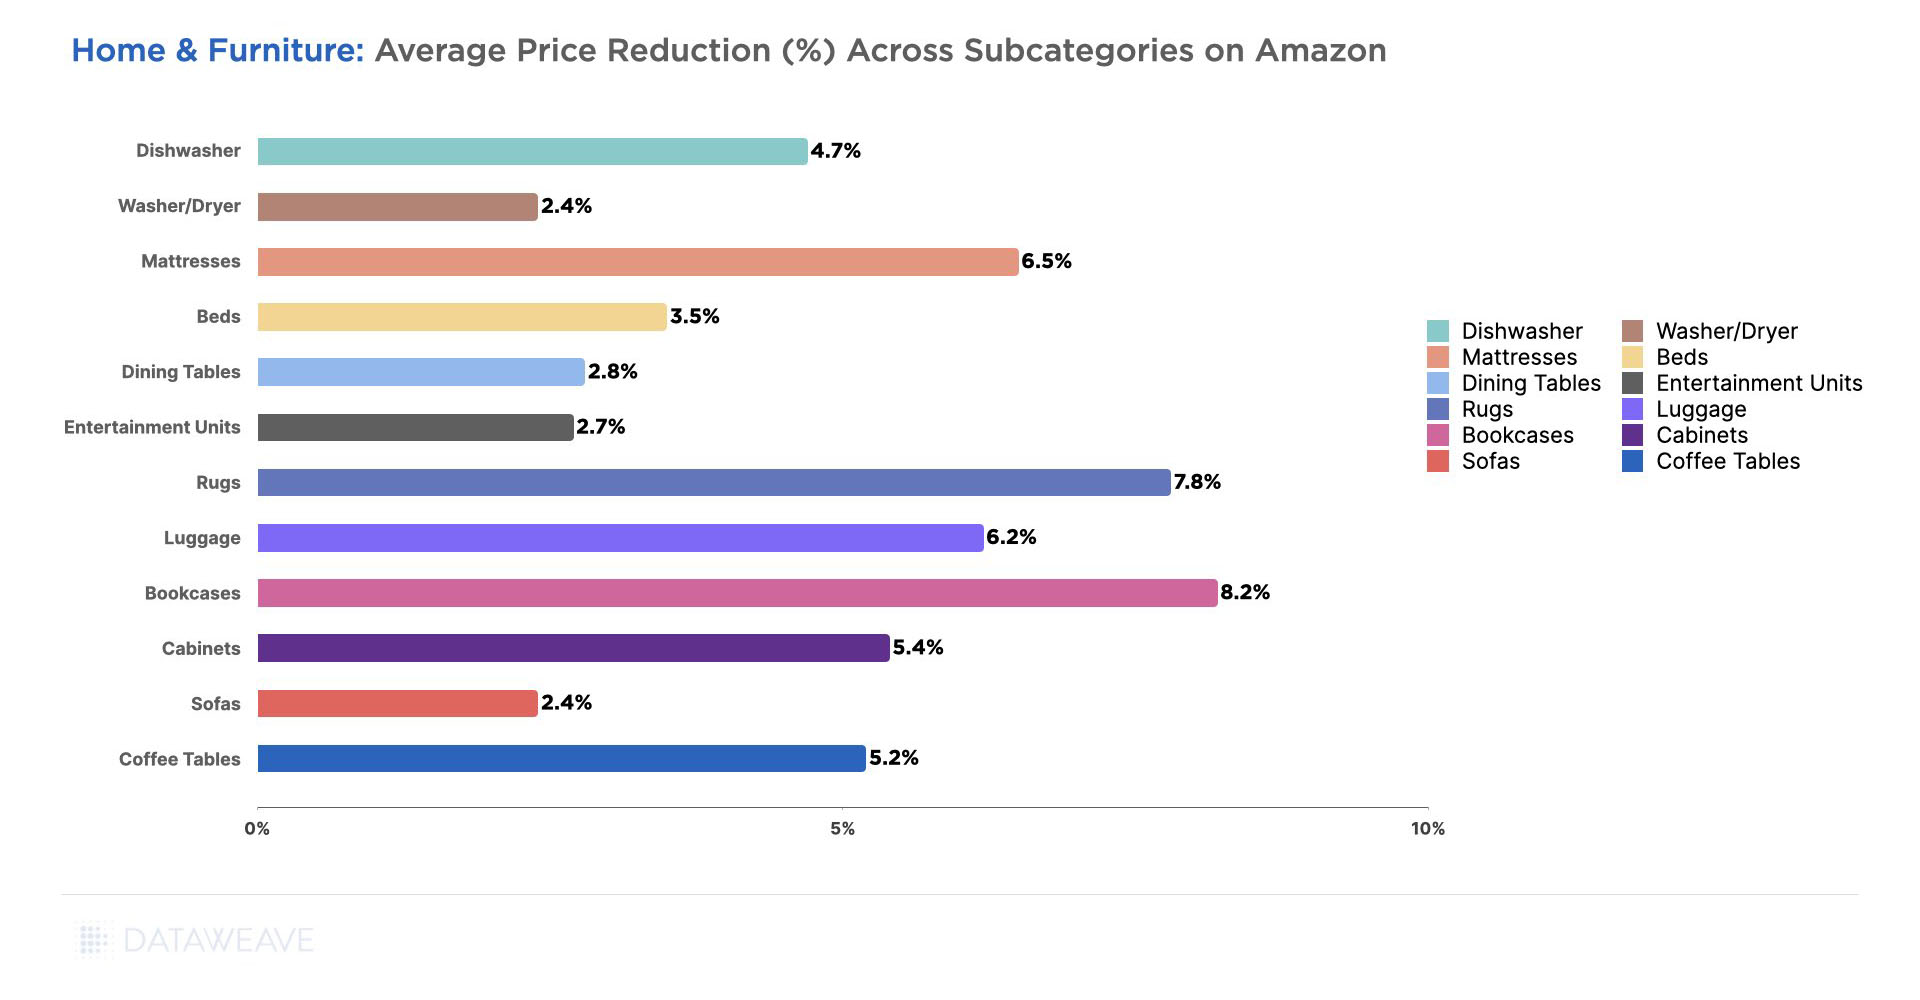
Subcategory Discount Analysis

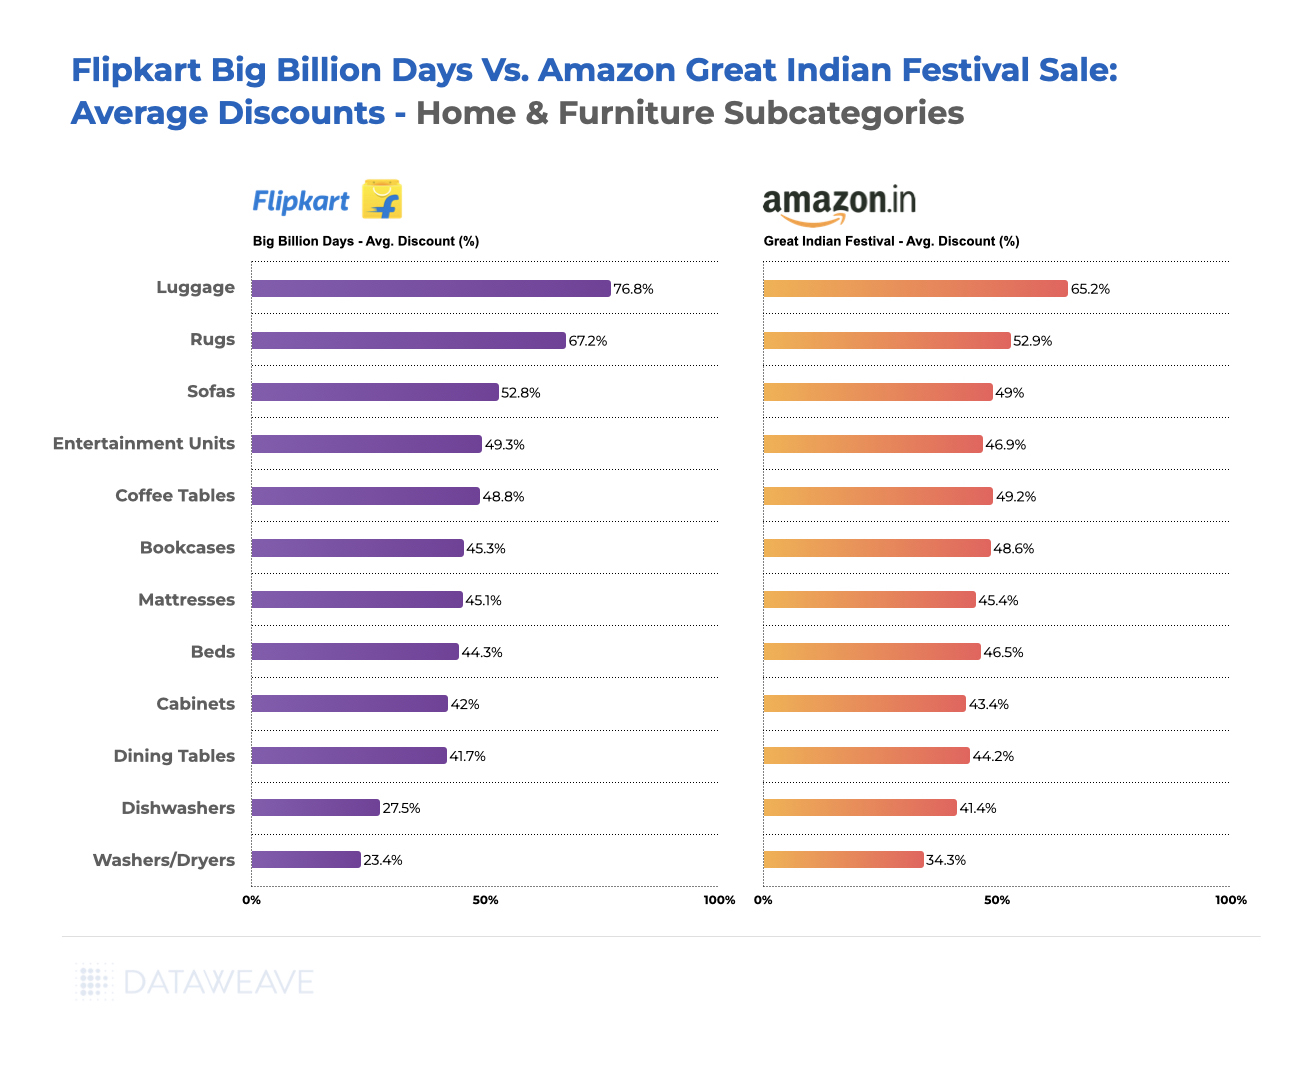
Kitchenware led pre-sale discounts at 8.7%. Decor surged from 5% to 7.5%, lighting jumped from 5% to 6.9%, and bedding more than doubled from 3.2% to 6.6%. These substantial increases suggest strategic timing to capture consumer attention during peak shopping days.
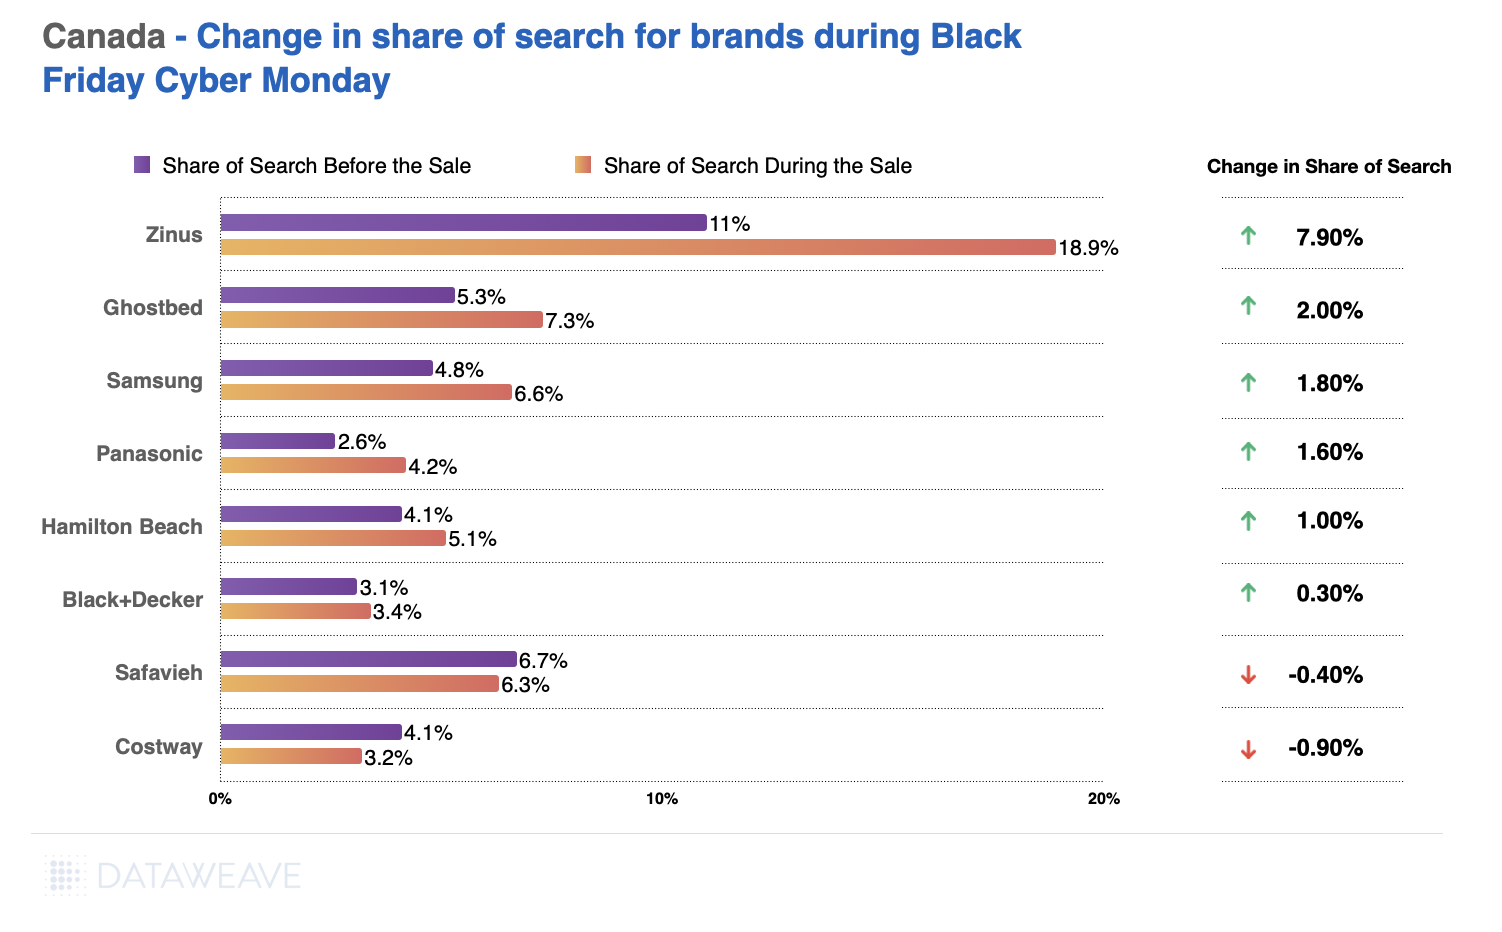
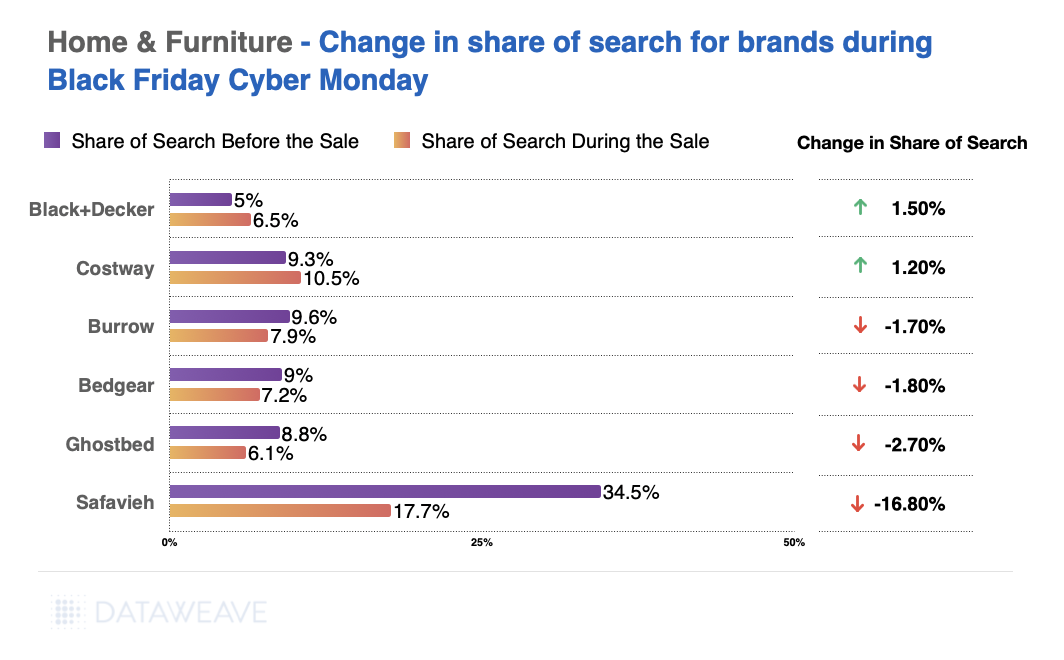
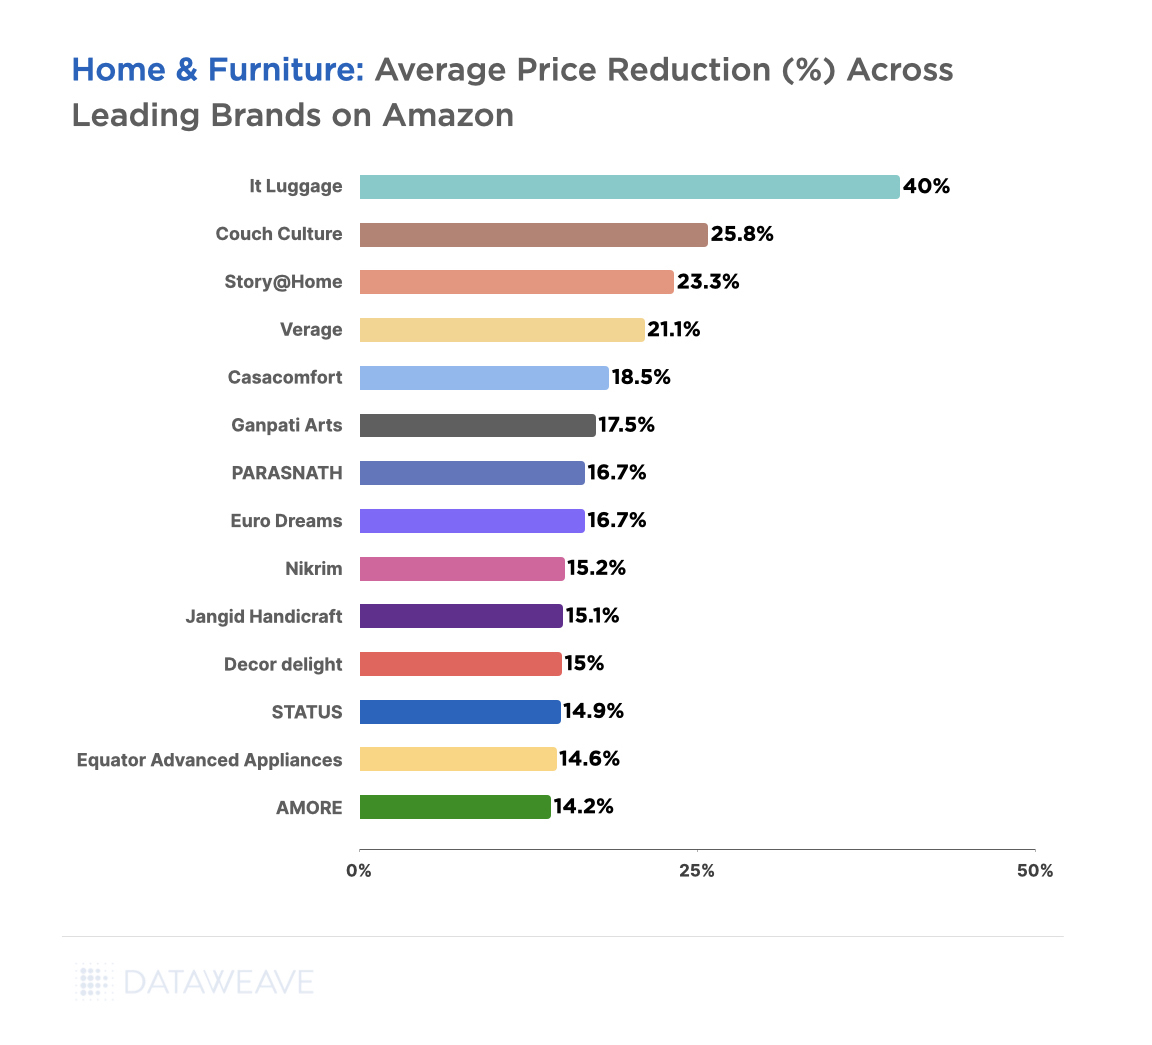
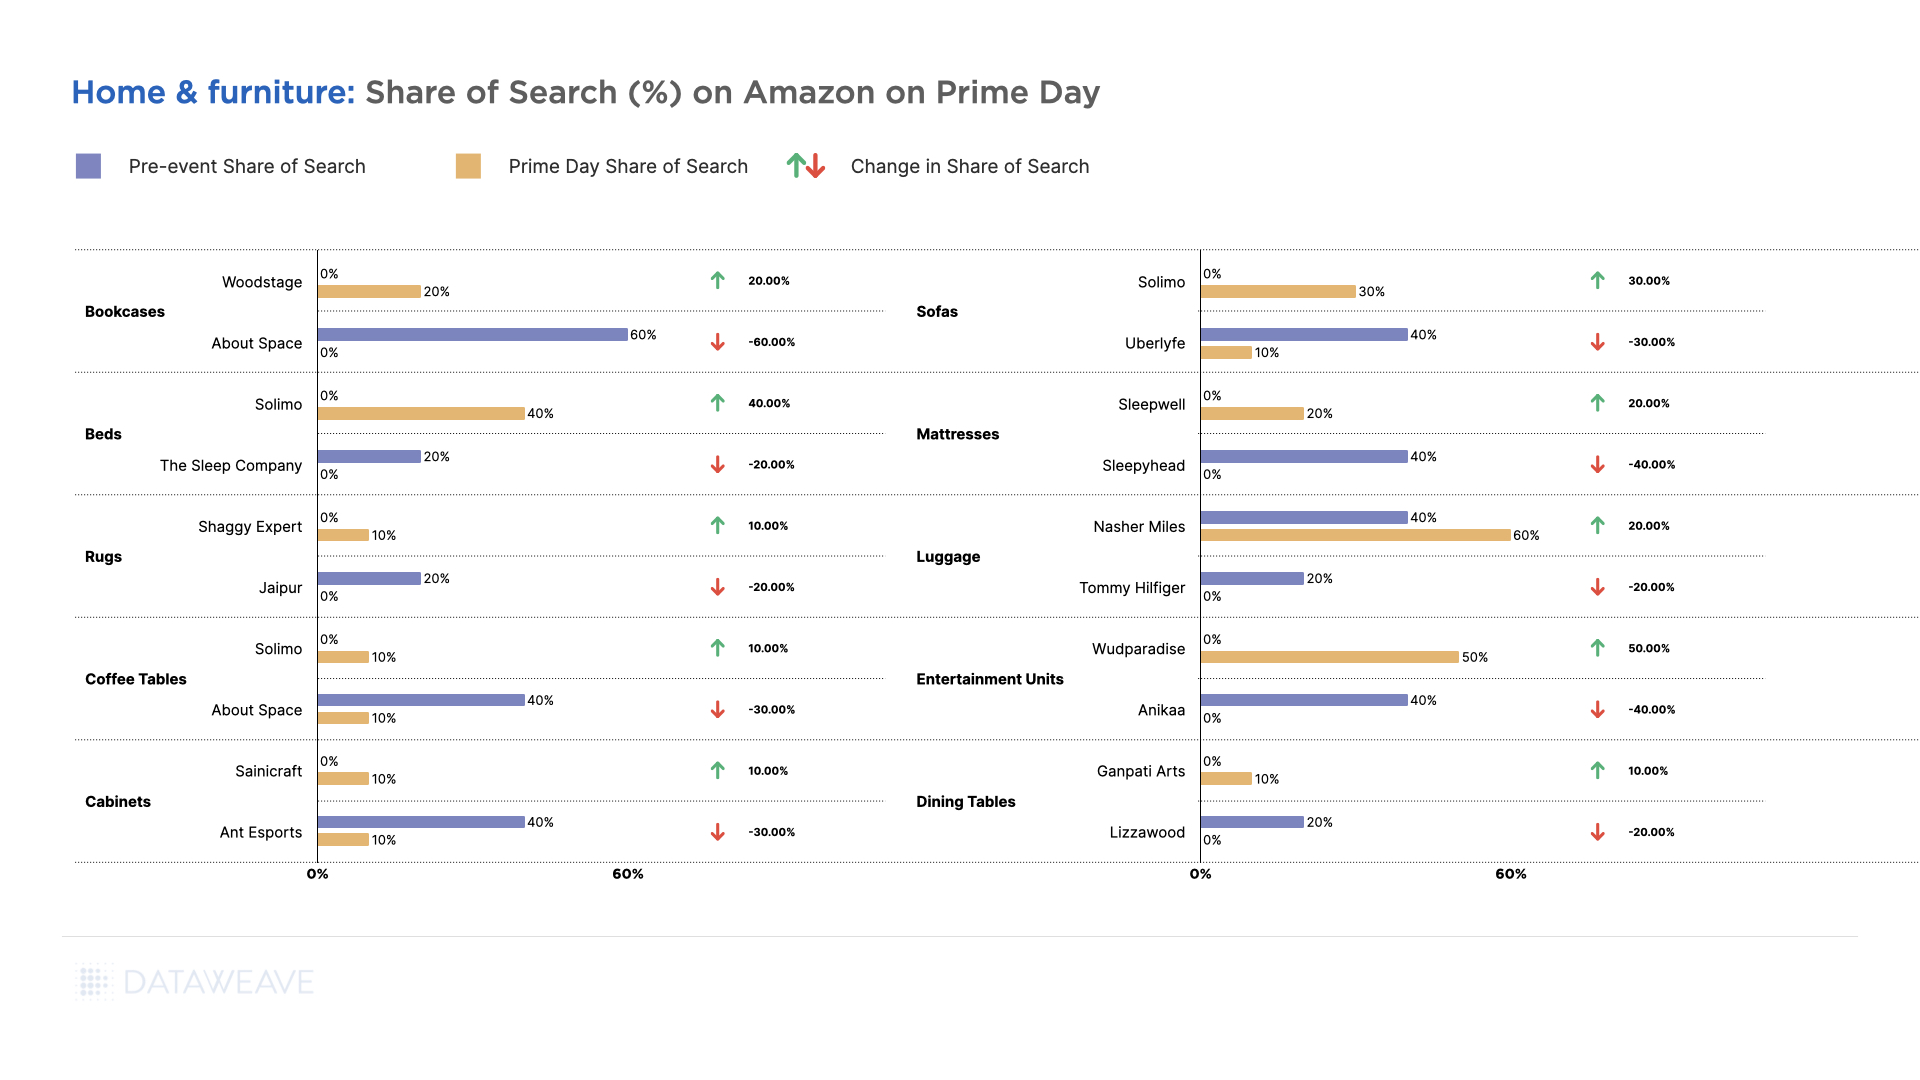
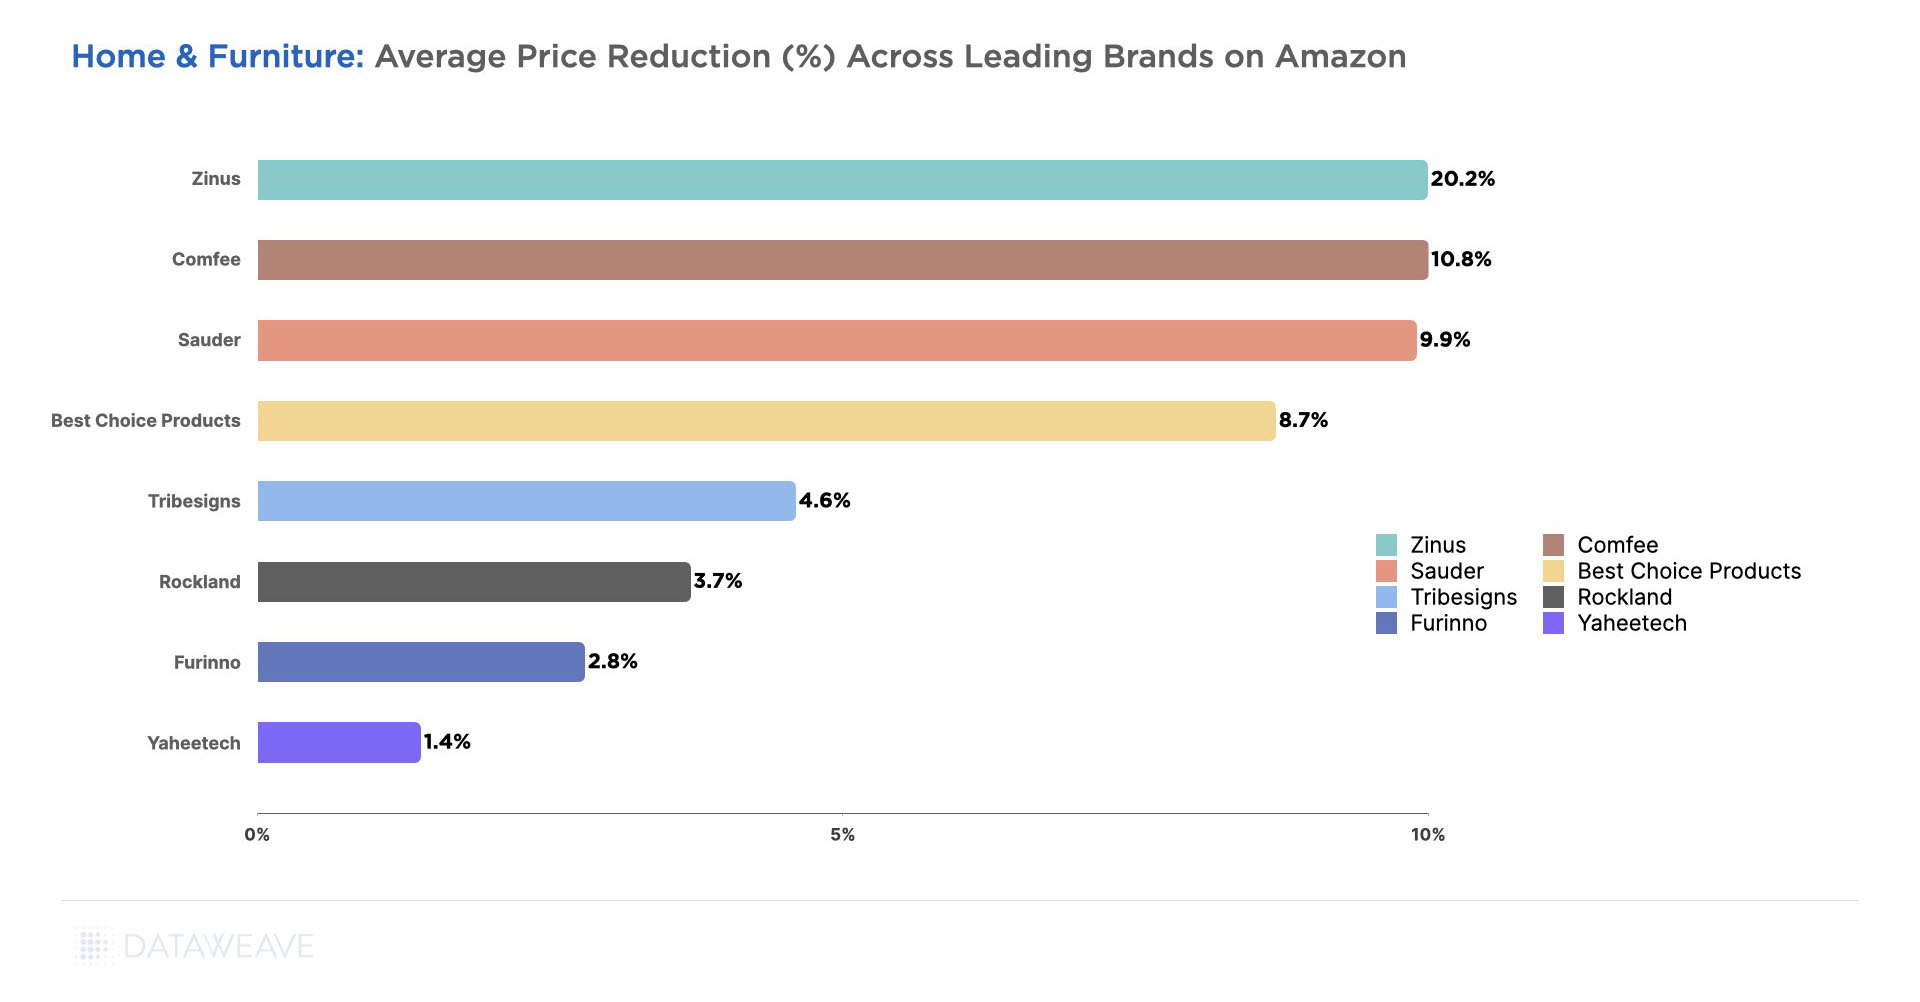
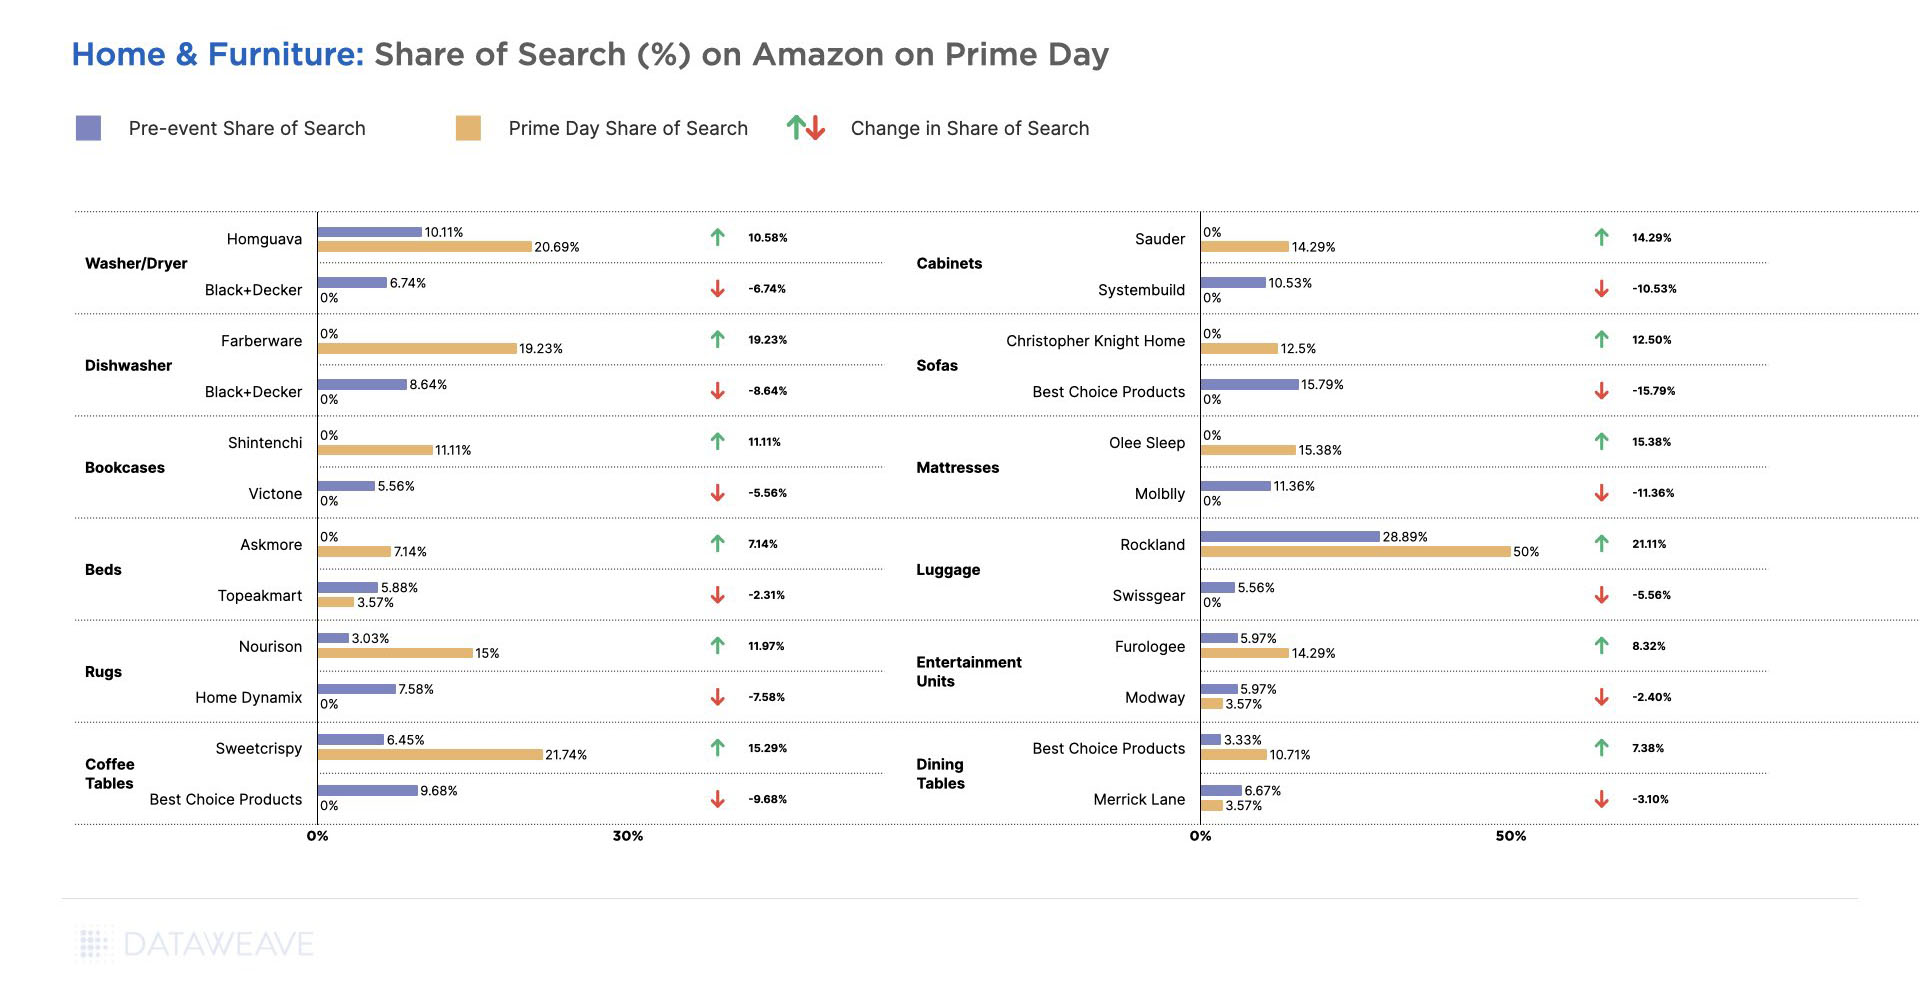
Share of Search: Brand Visibility Trends
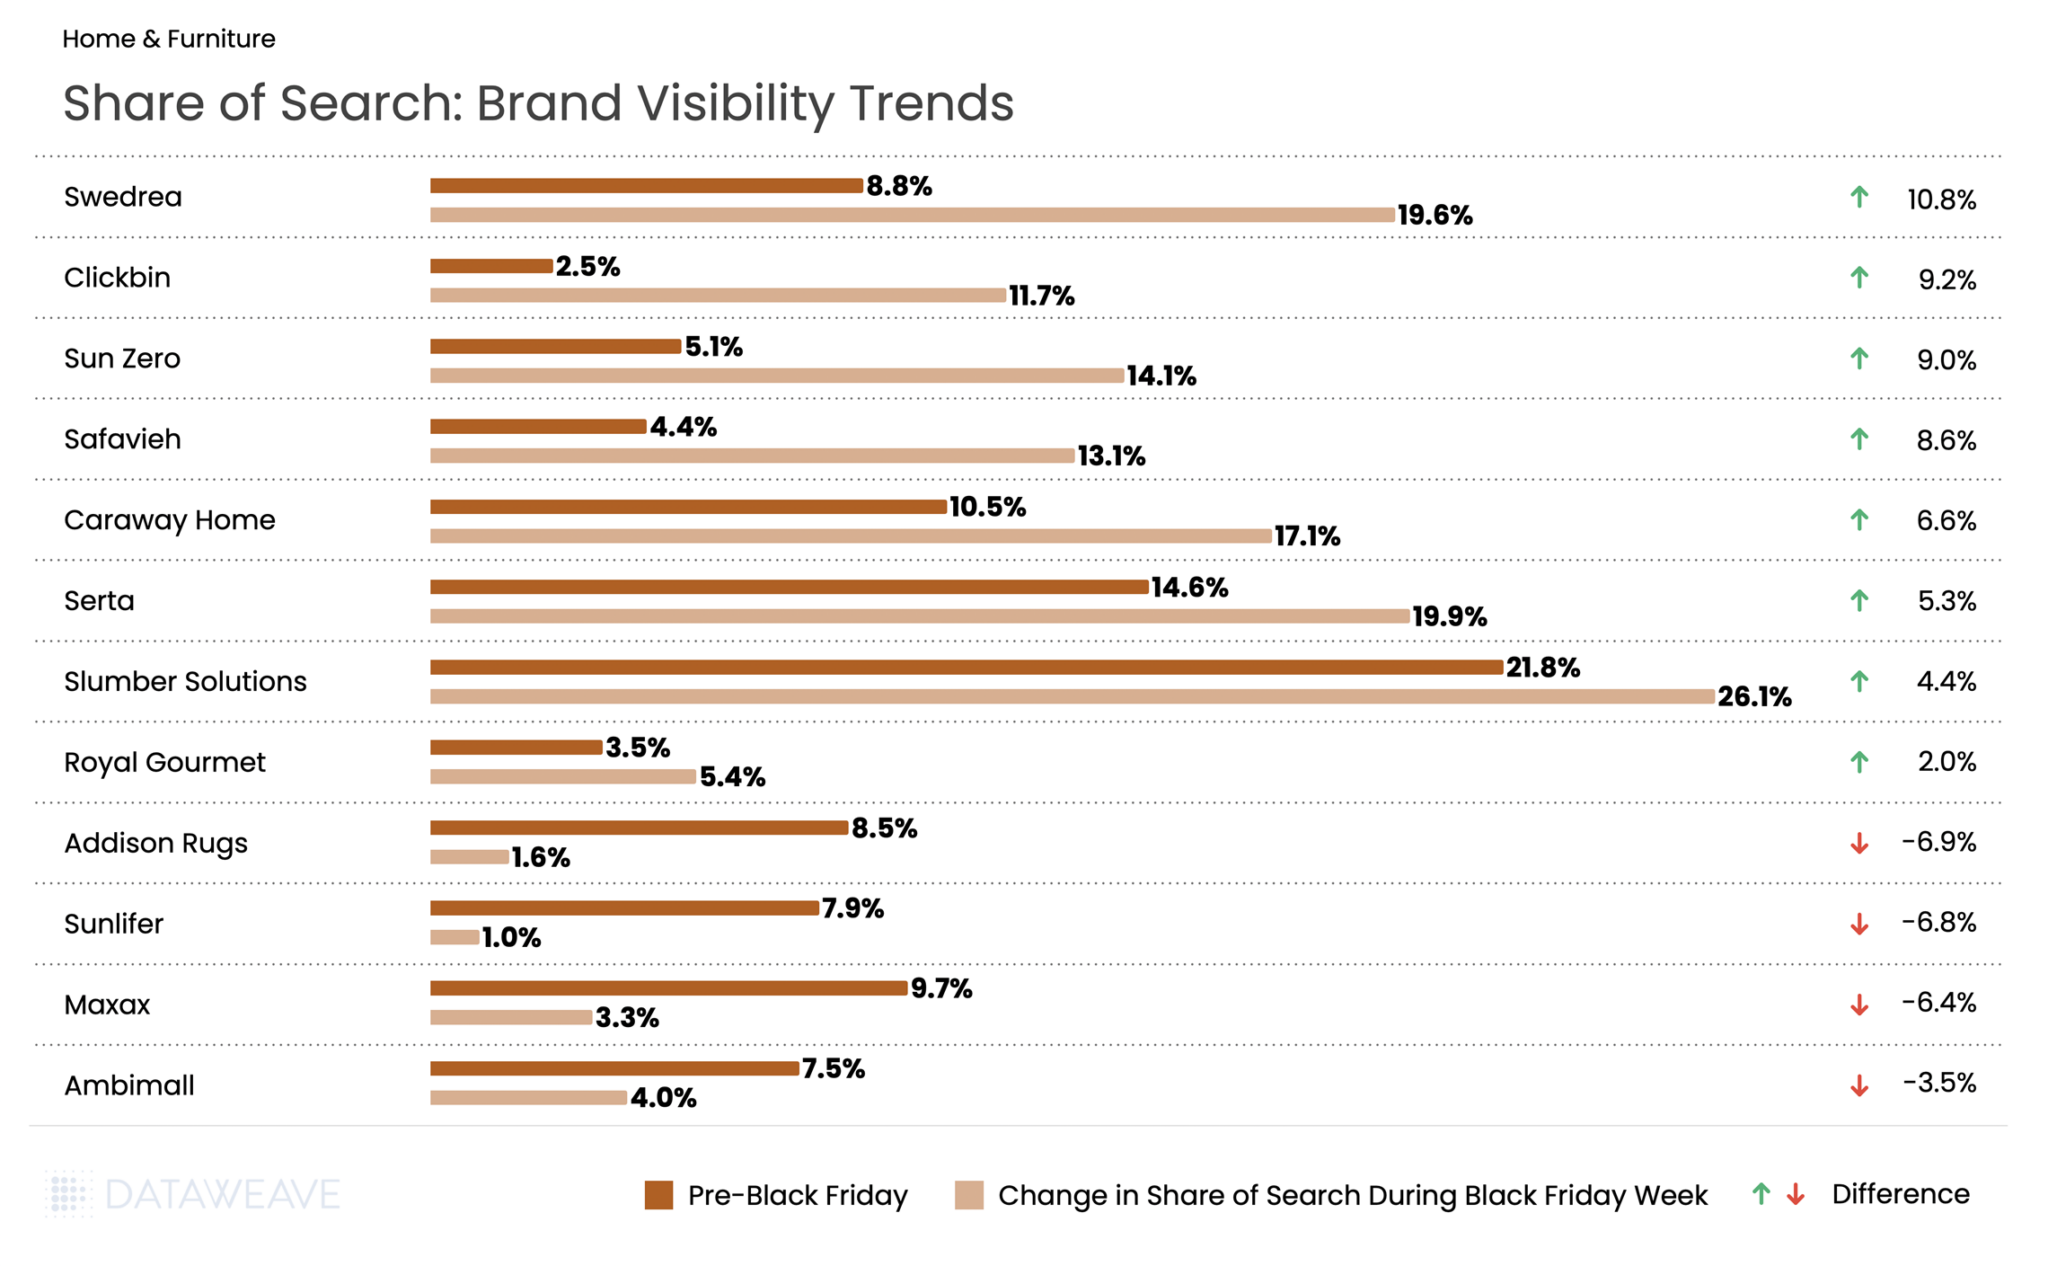
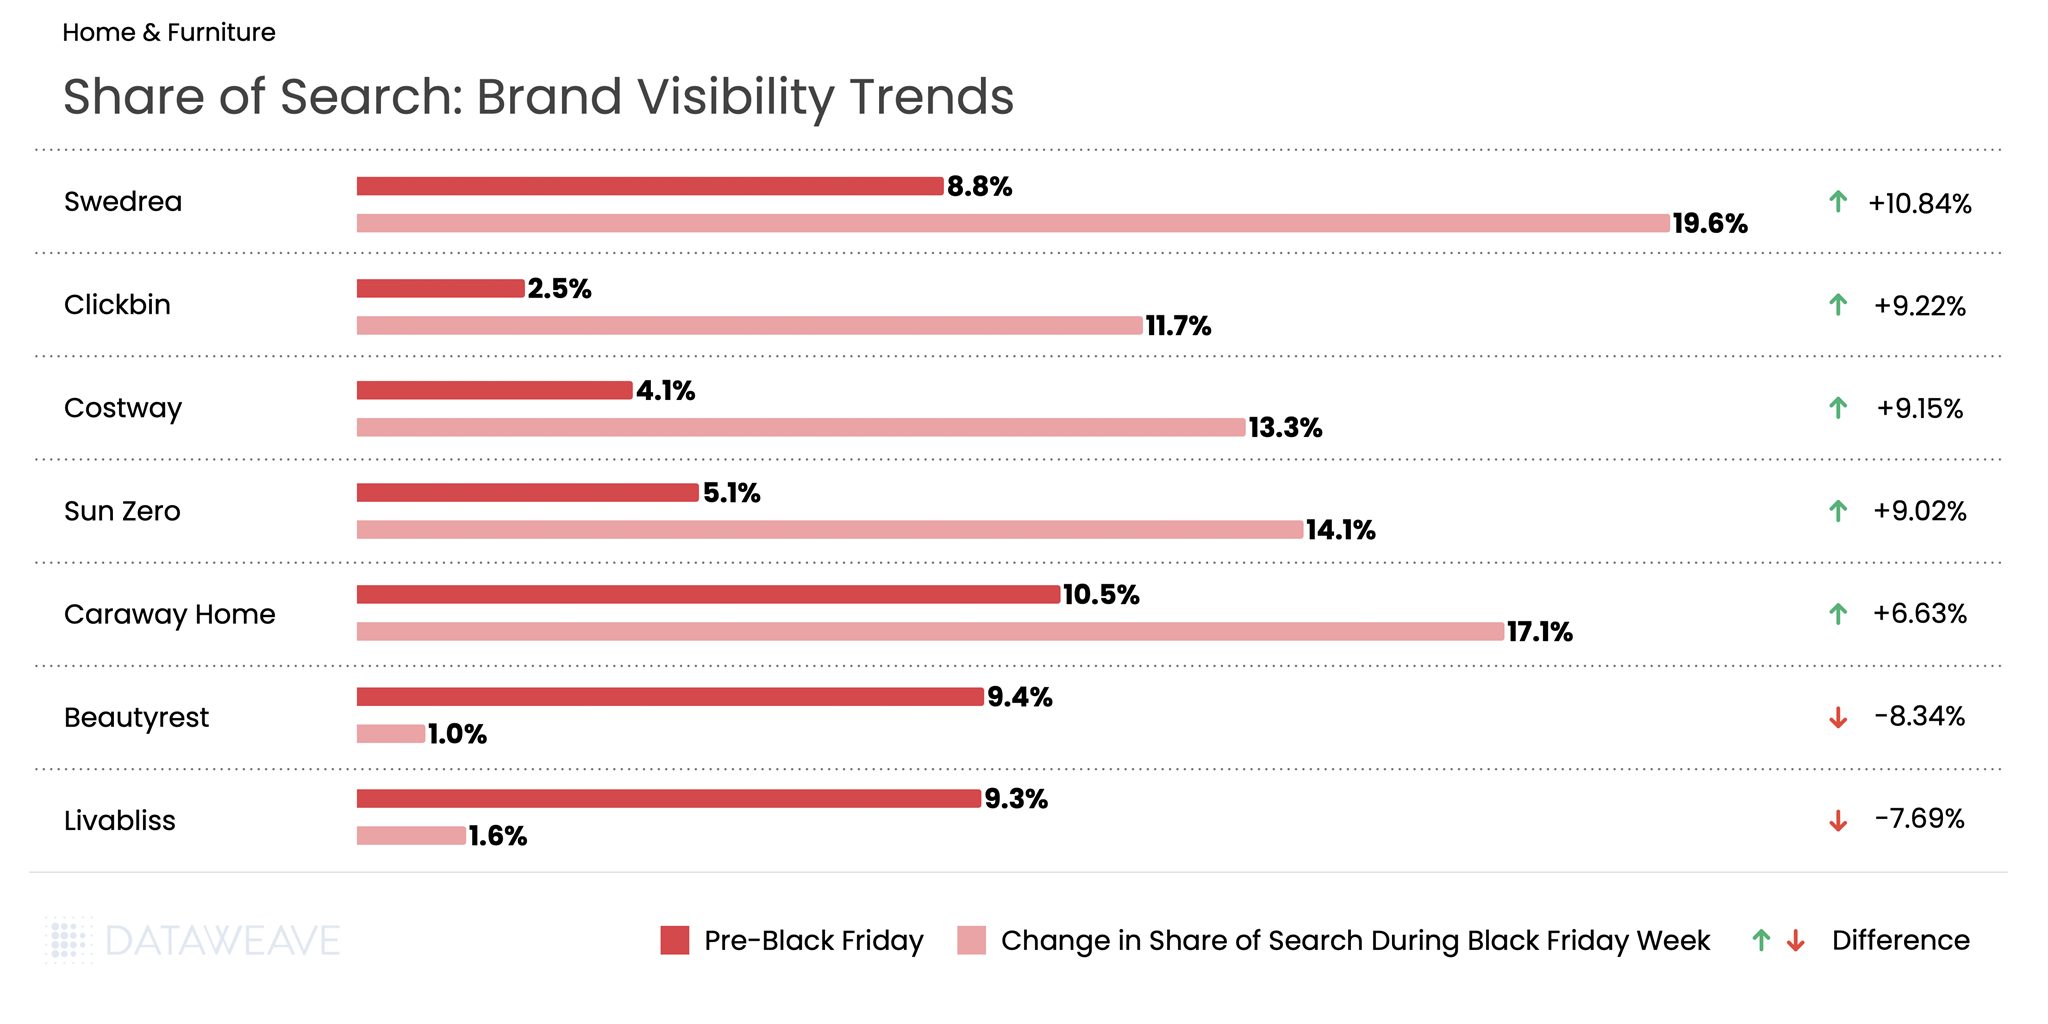
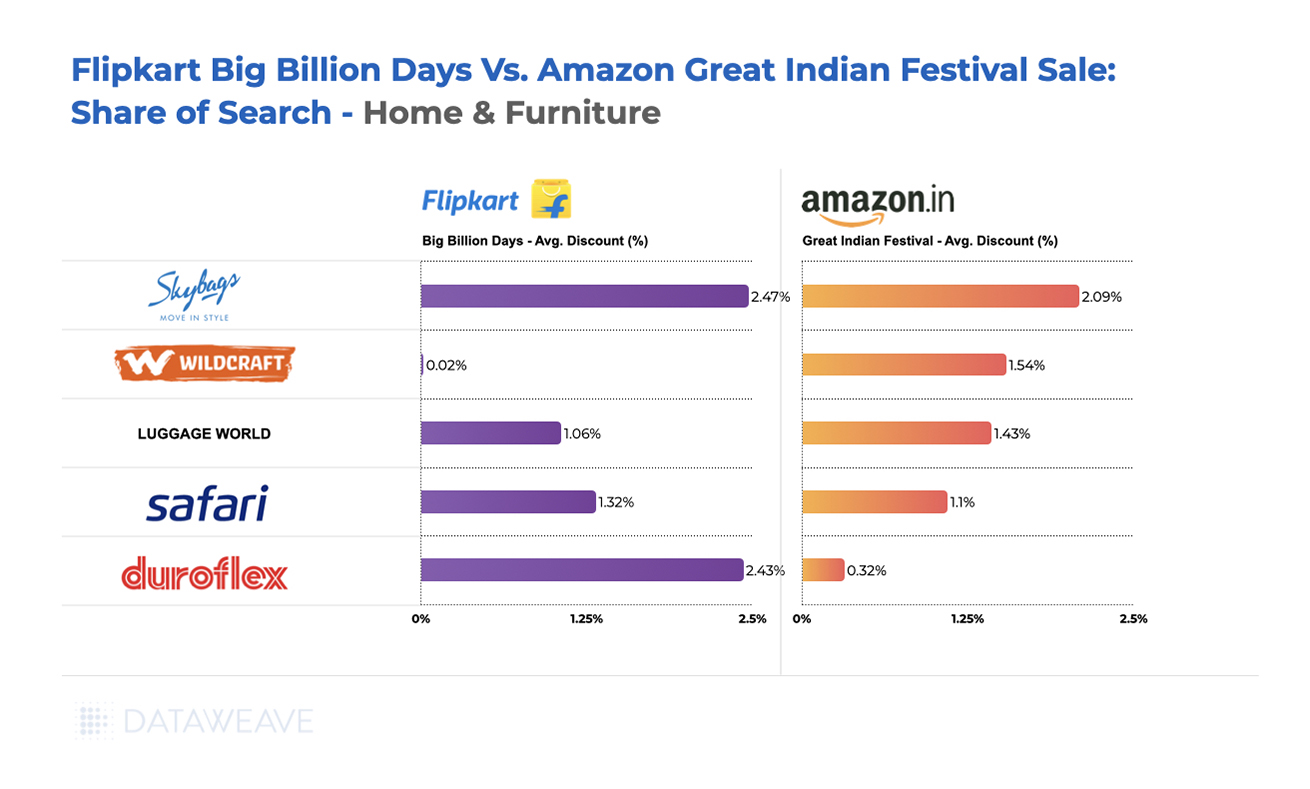
Mattress brand Slumber Solutions saw the highest share of search at 21.8% pre event and 26.1% during Black Friday week. Meanwhile, another mattress brand Swedrea led all brands with a remarkable 10.8% surge in visibility, jumping from 8.8% to 19.6%. Budget-friendly furniture brand Clickbin gained 9.2%, while window treatment brand Sun Zero increased 9% and home textiles brand Safavieh surged 8.6%.
Premium and established brands also performed well: Caraway Home (cookware) rose 6.6%, mattress brand Serta gained 5.3%, and Slumber Solutions added 4.4%. Royal Gourmet, specializing in outdoor cooking equipment, gained 2.0%.
However, several mid-tier brands faced steep declines. Addison Rugs dropped 6.9% from 8.5% to just 1.6%, while Sunlifer fell 6.8 % and Maxax declined 6.4 %.
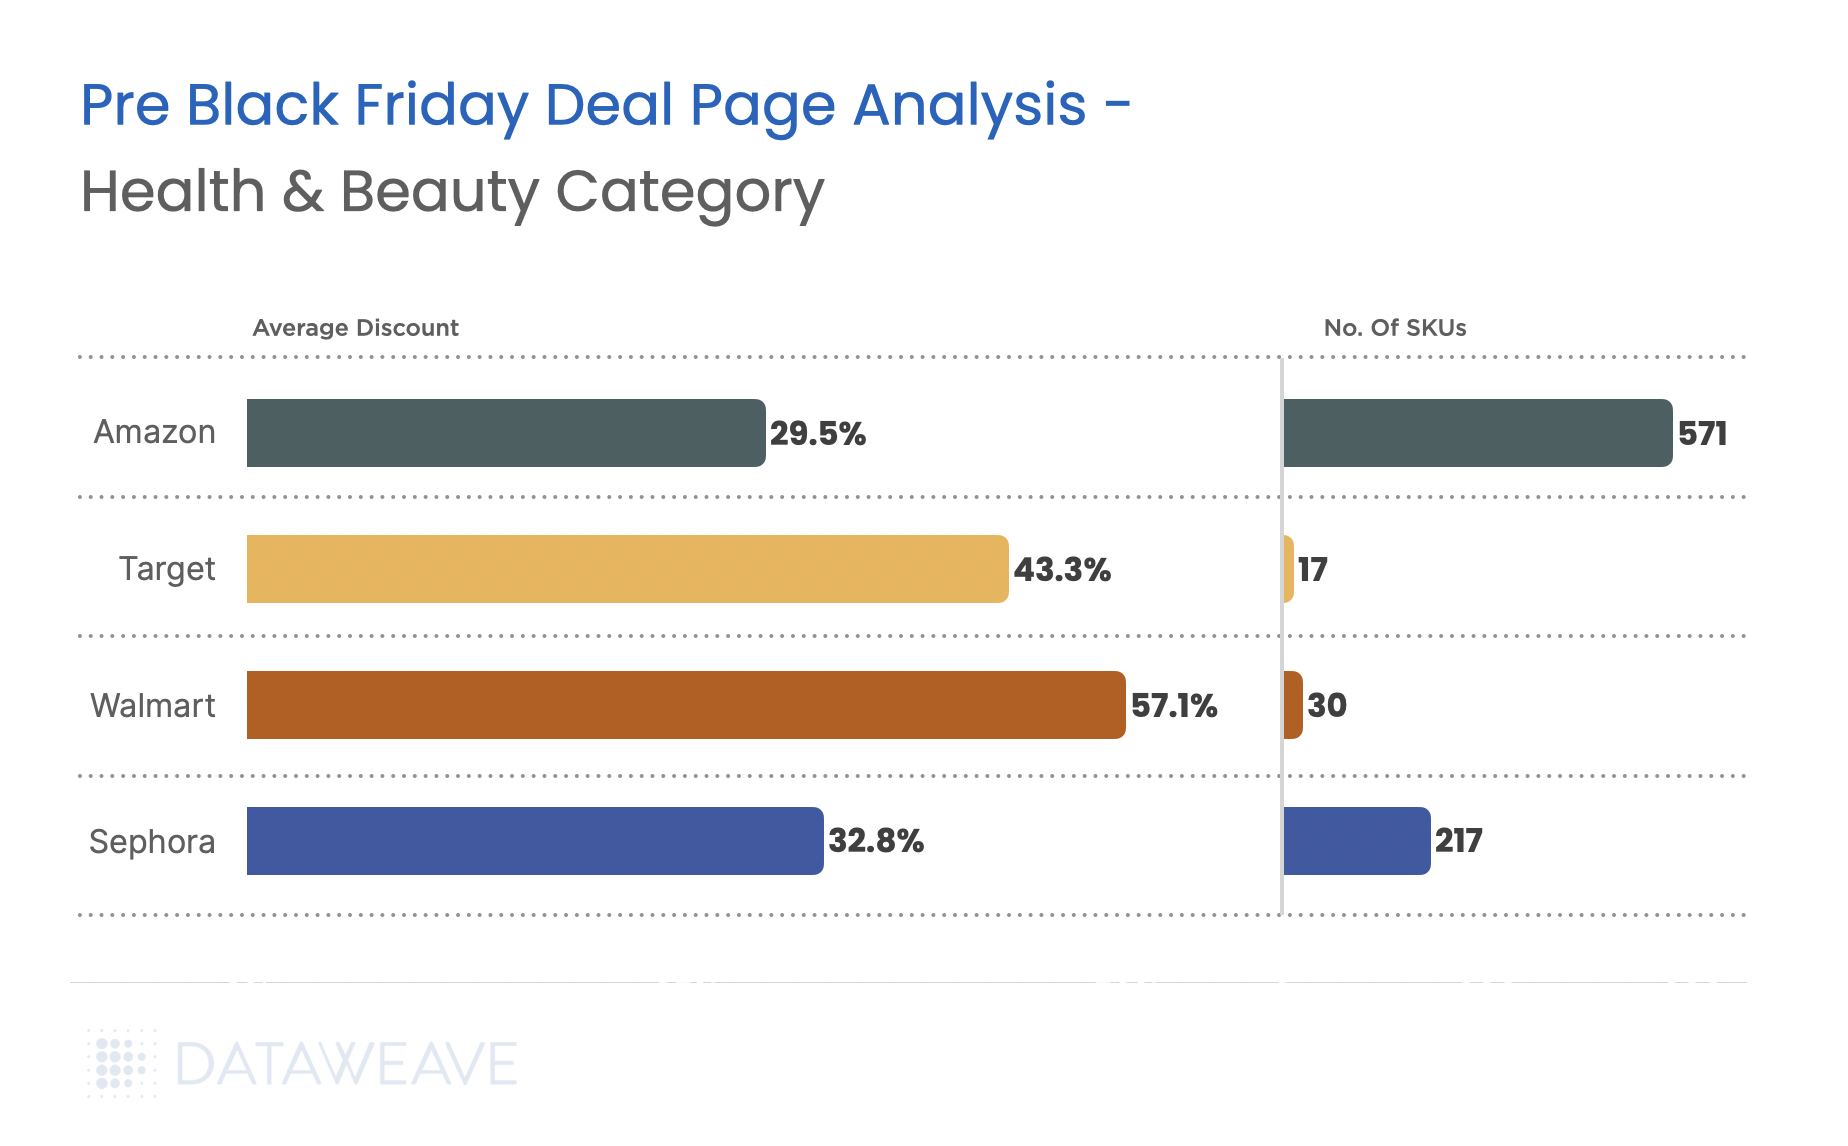
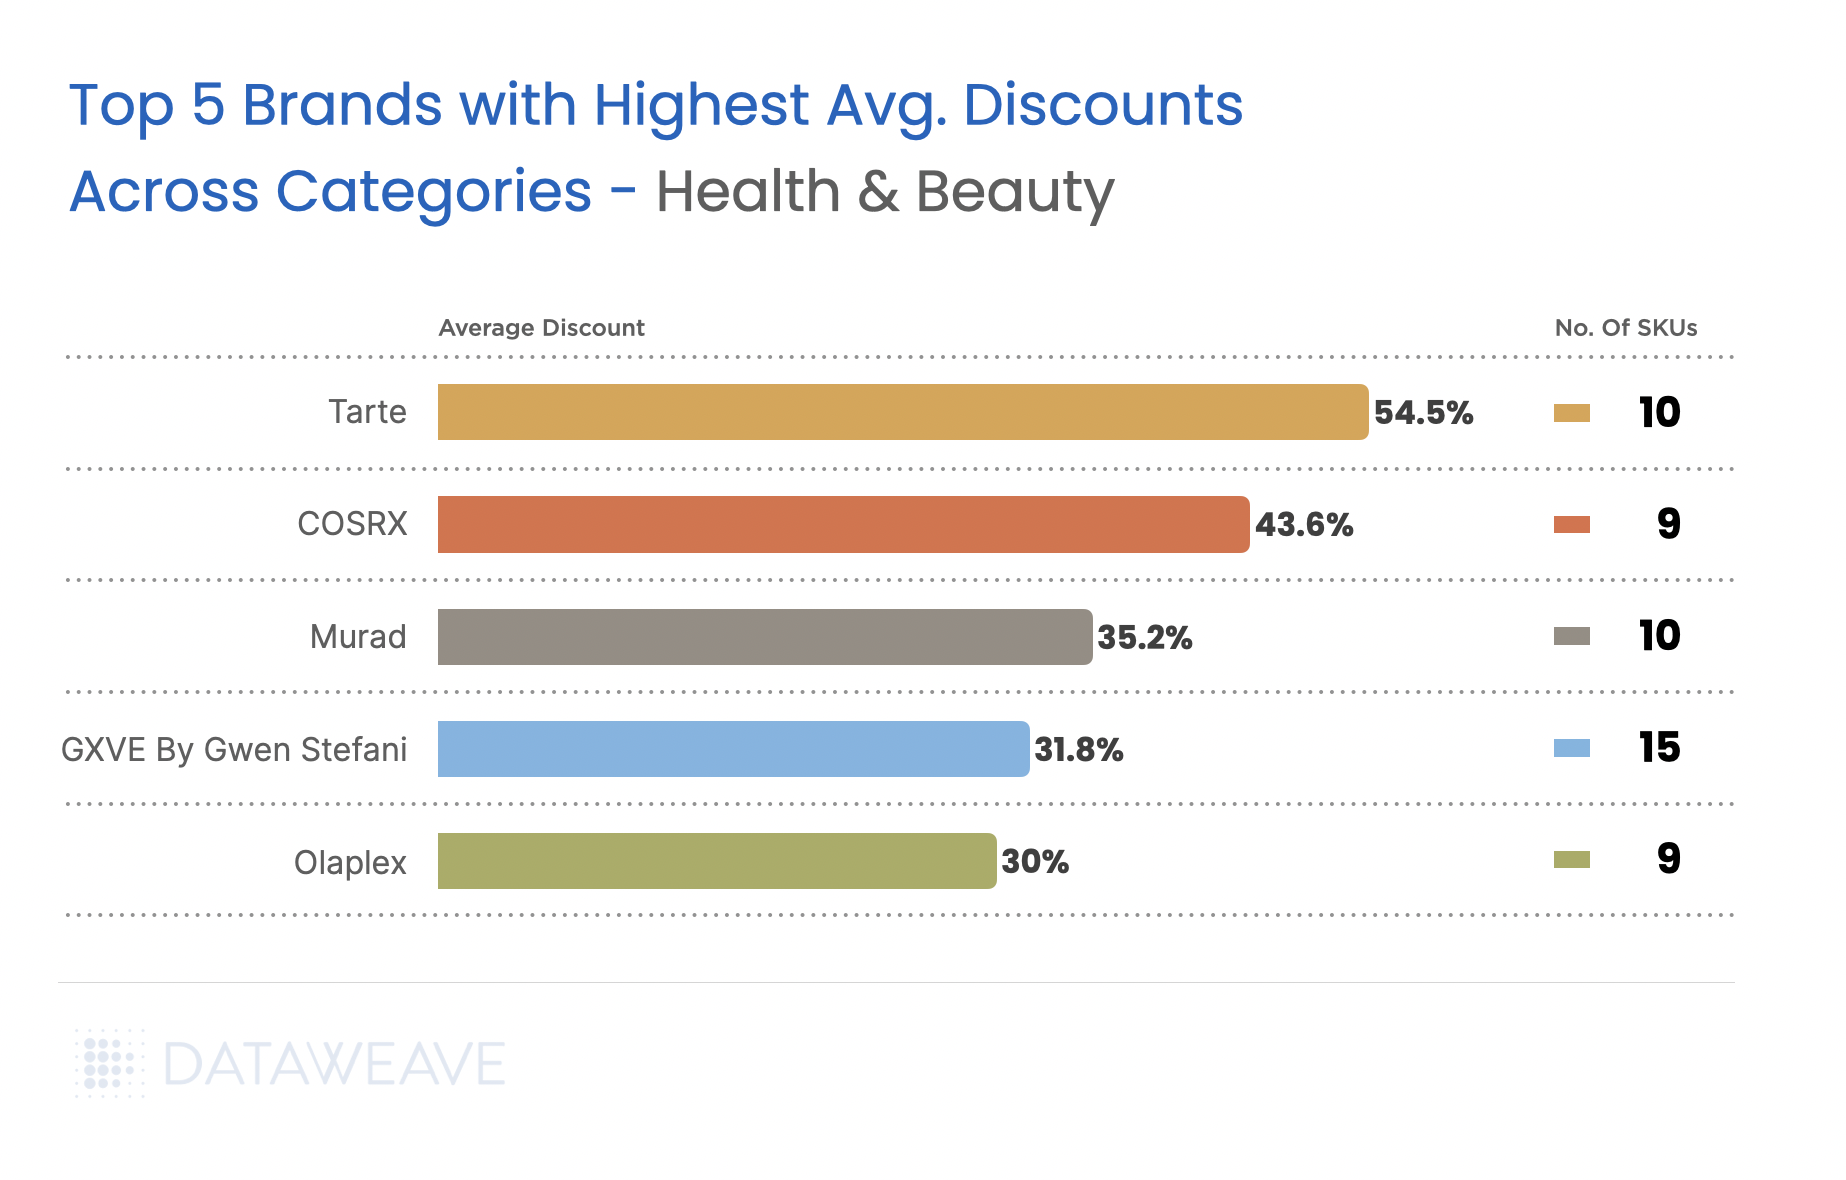
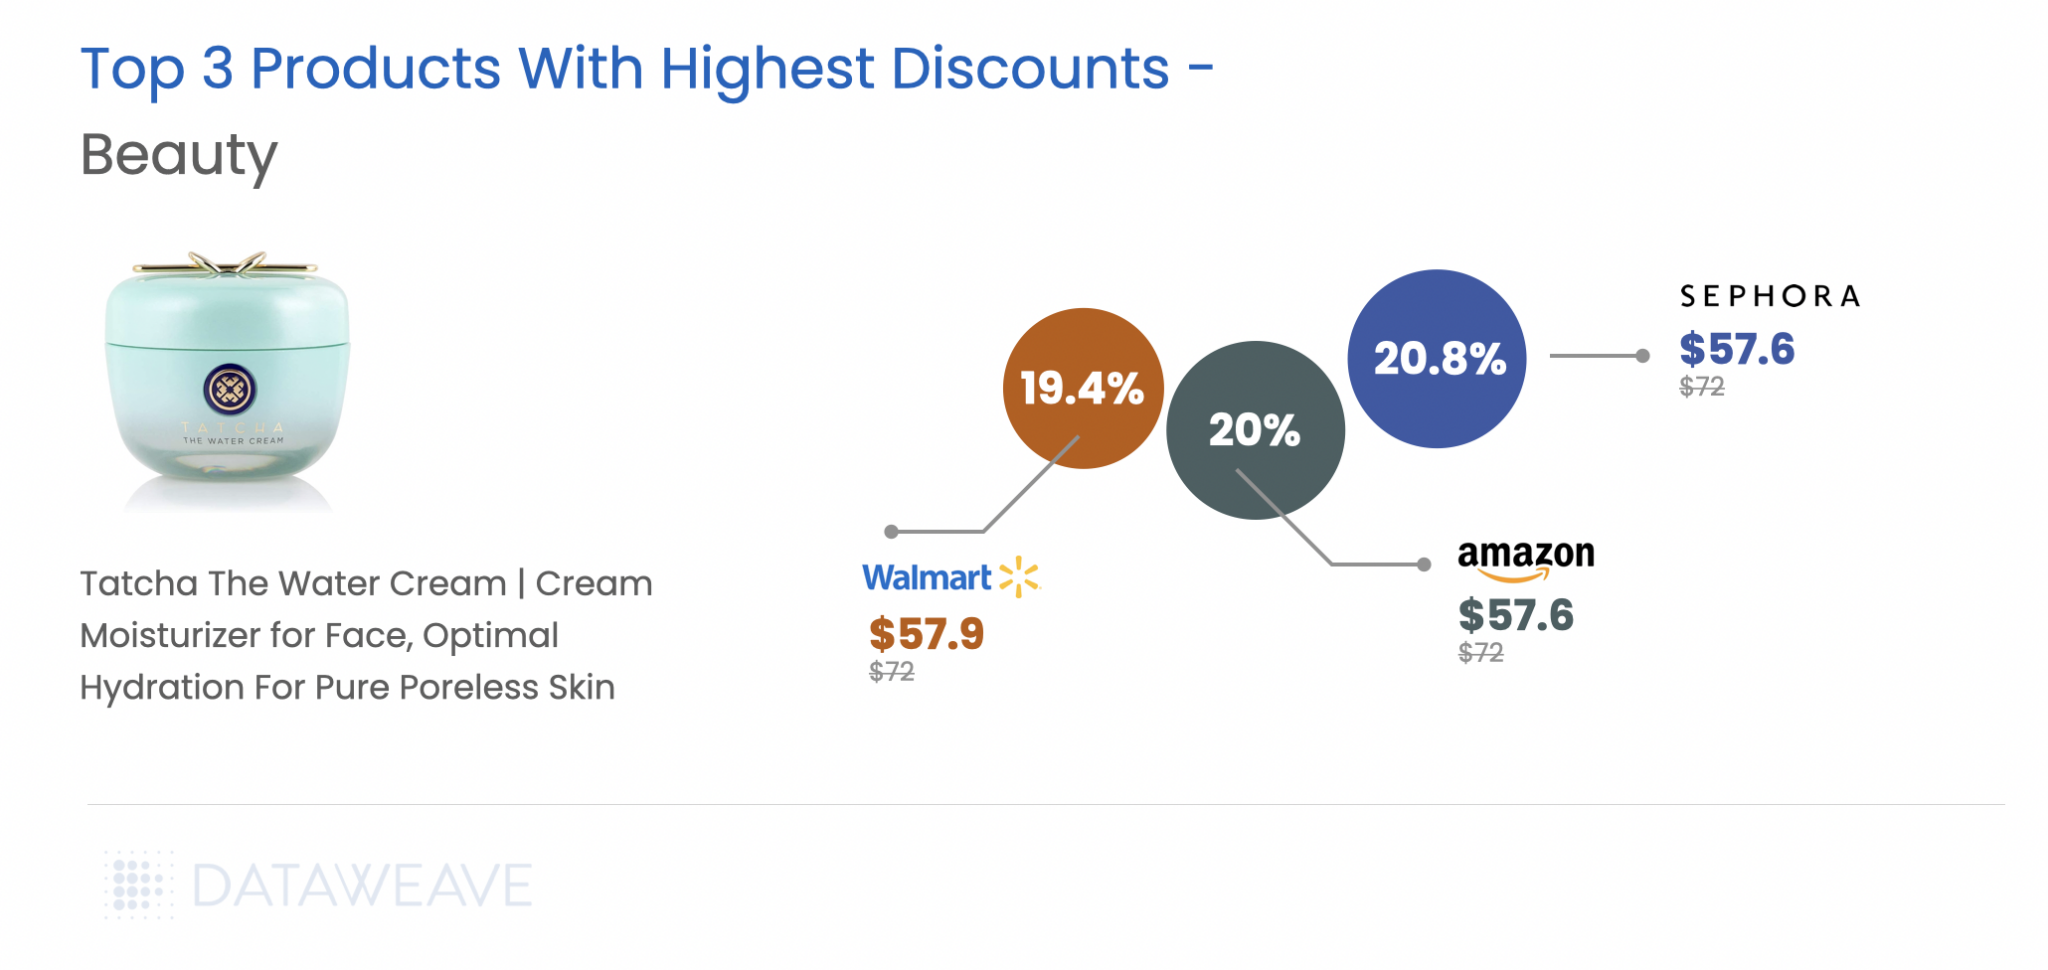
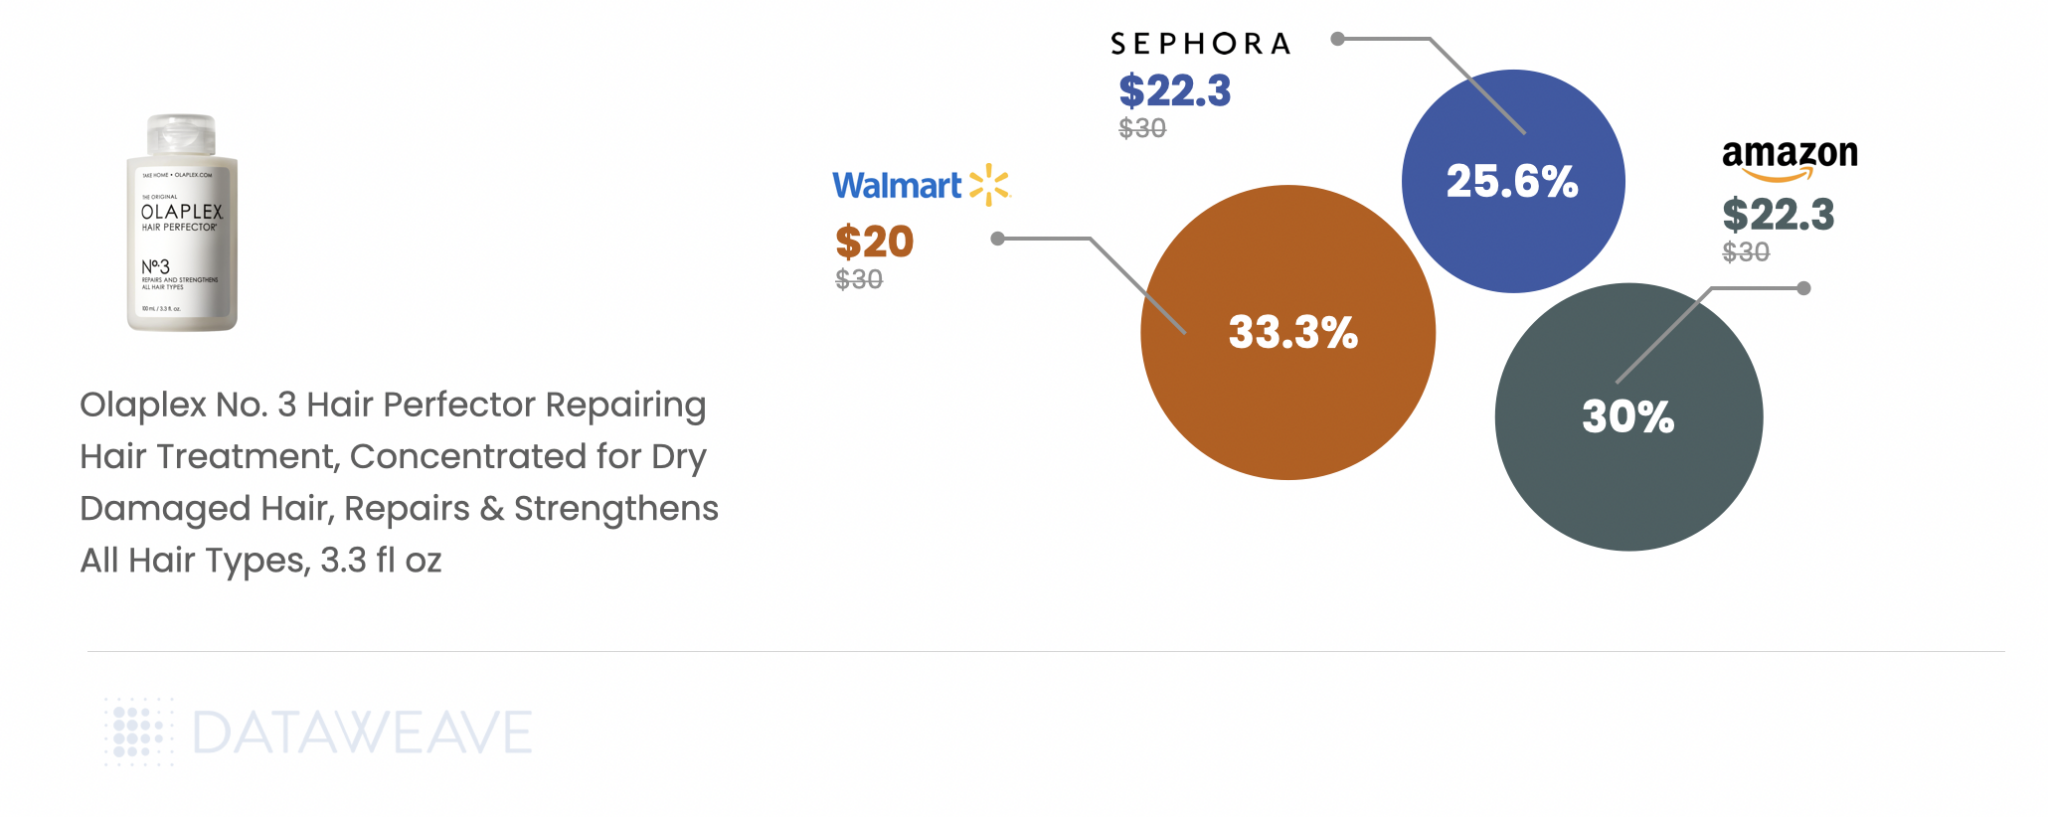
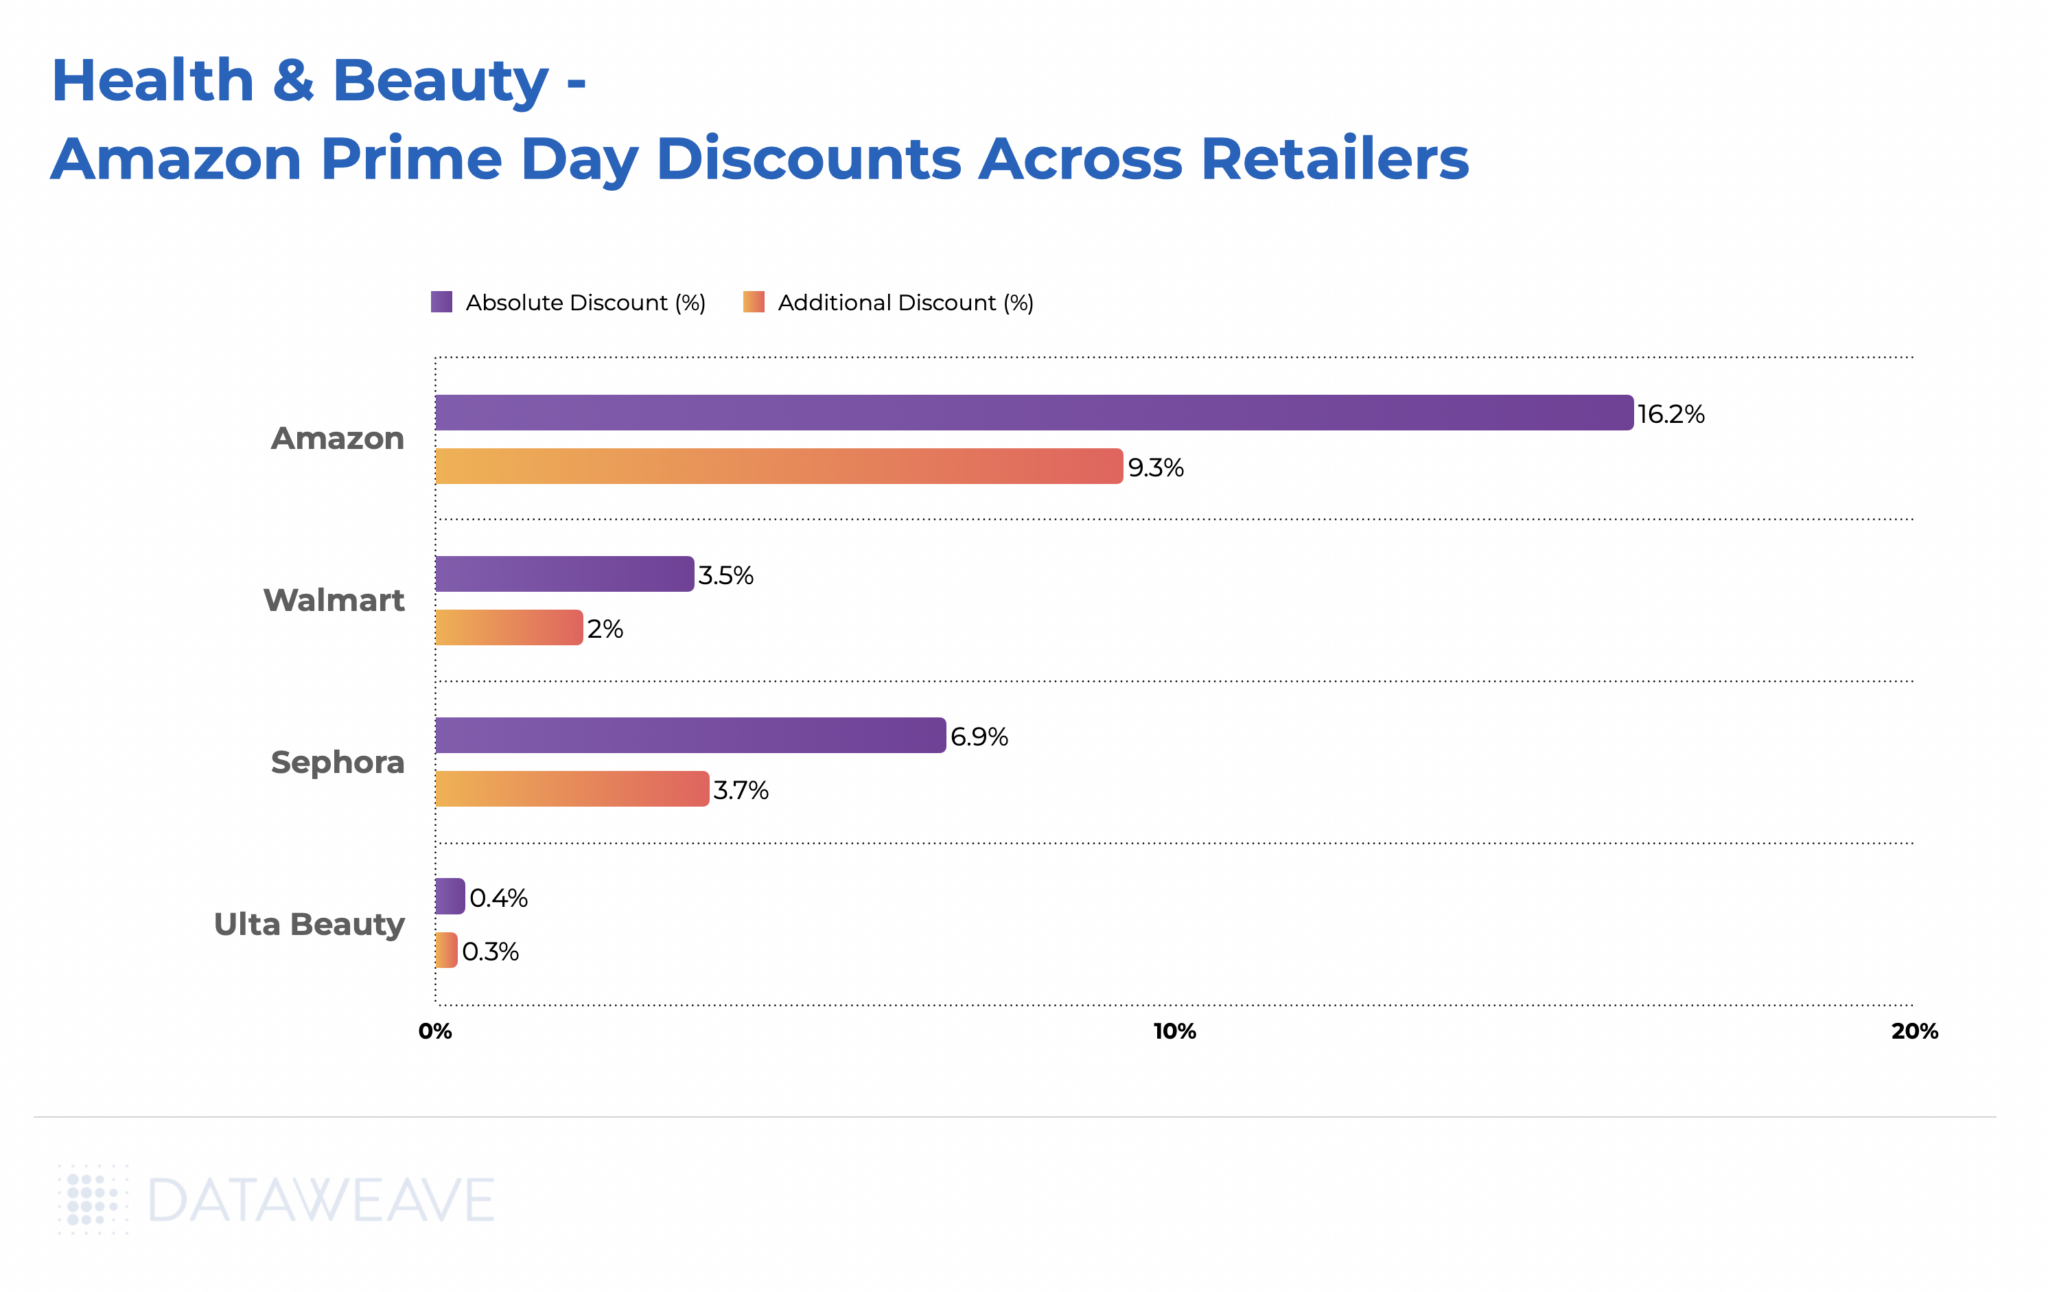
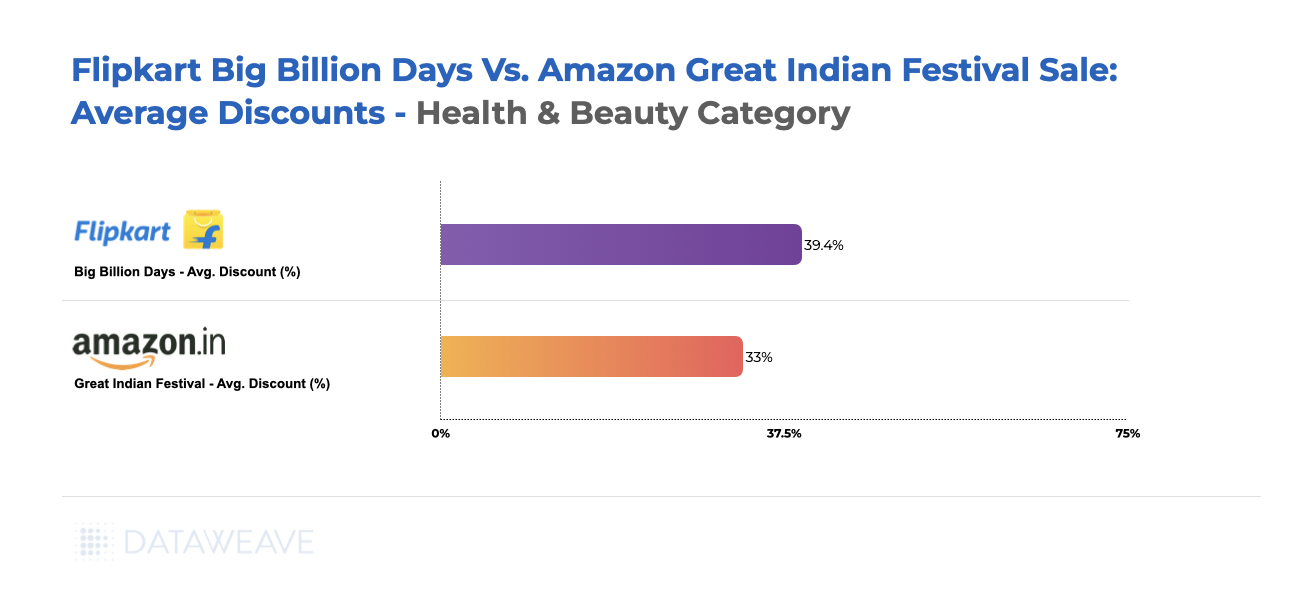
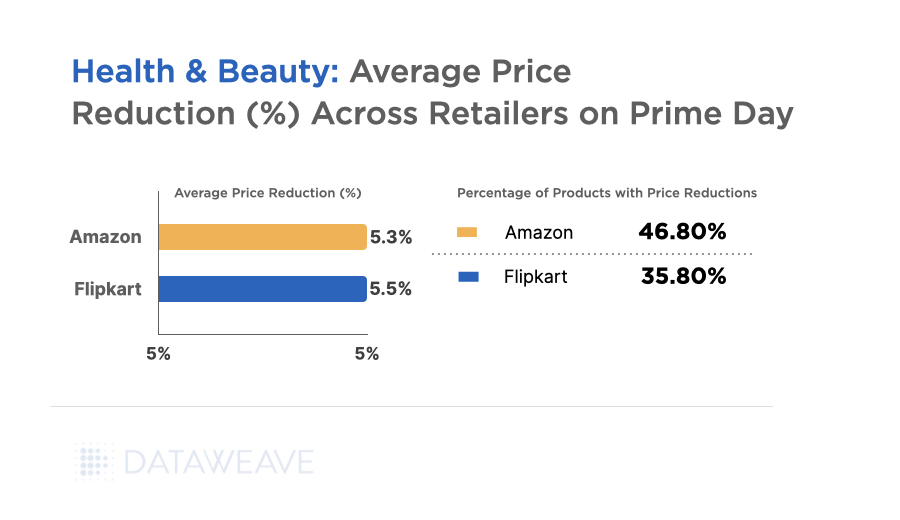
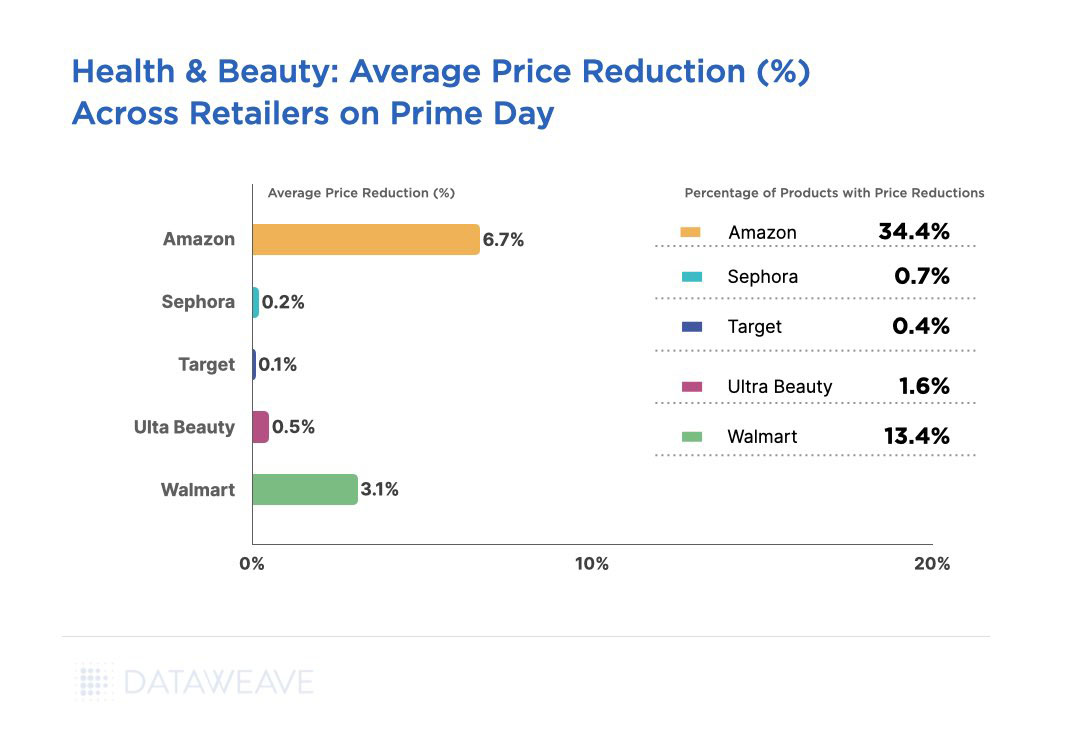
Health & Beauty
Our analysis of 6,474 SKUs reveals subcategory-level insights and dramatic brand visibility shifts that highlight the evolving German beauty landscape.
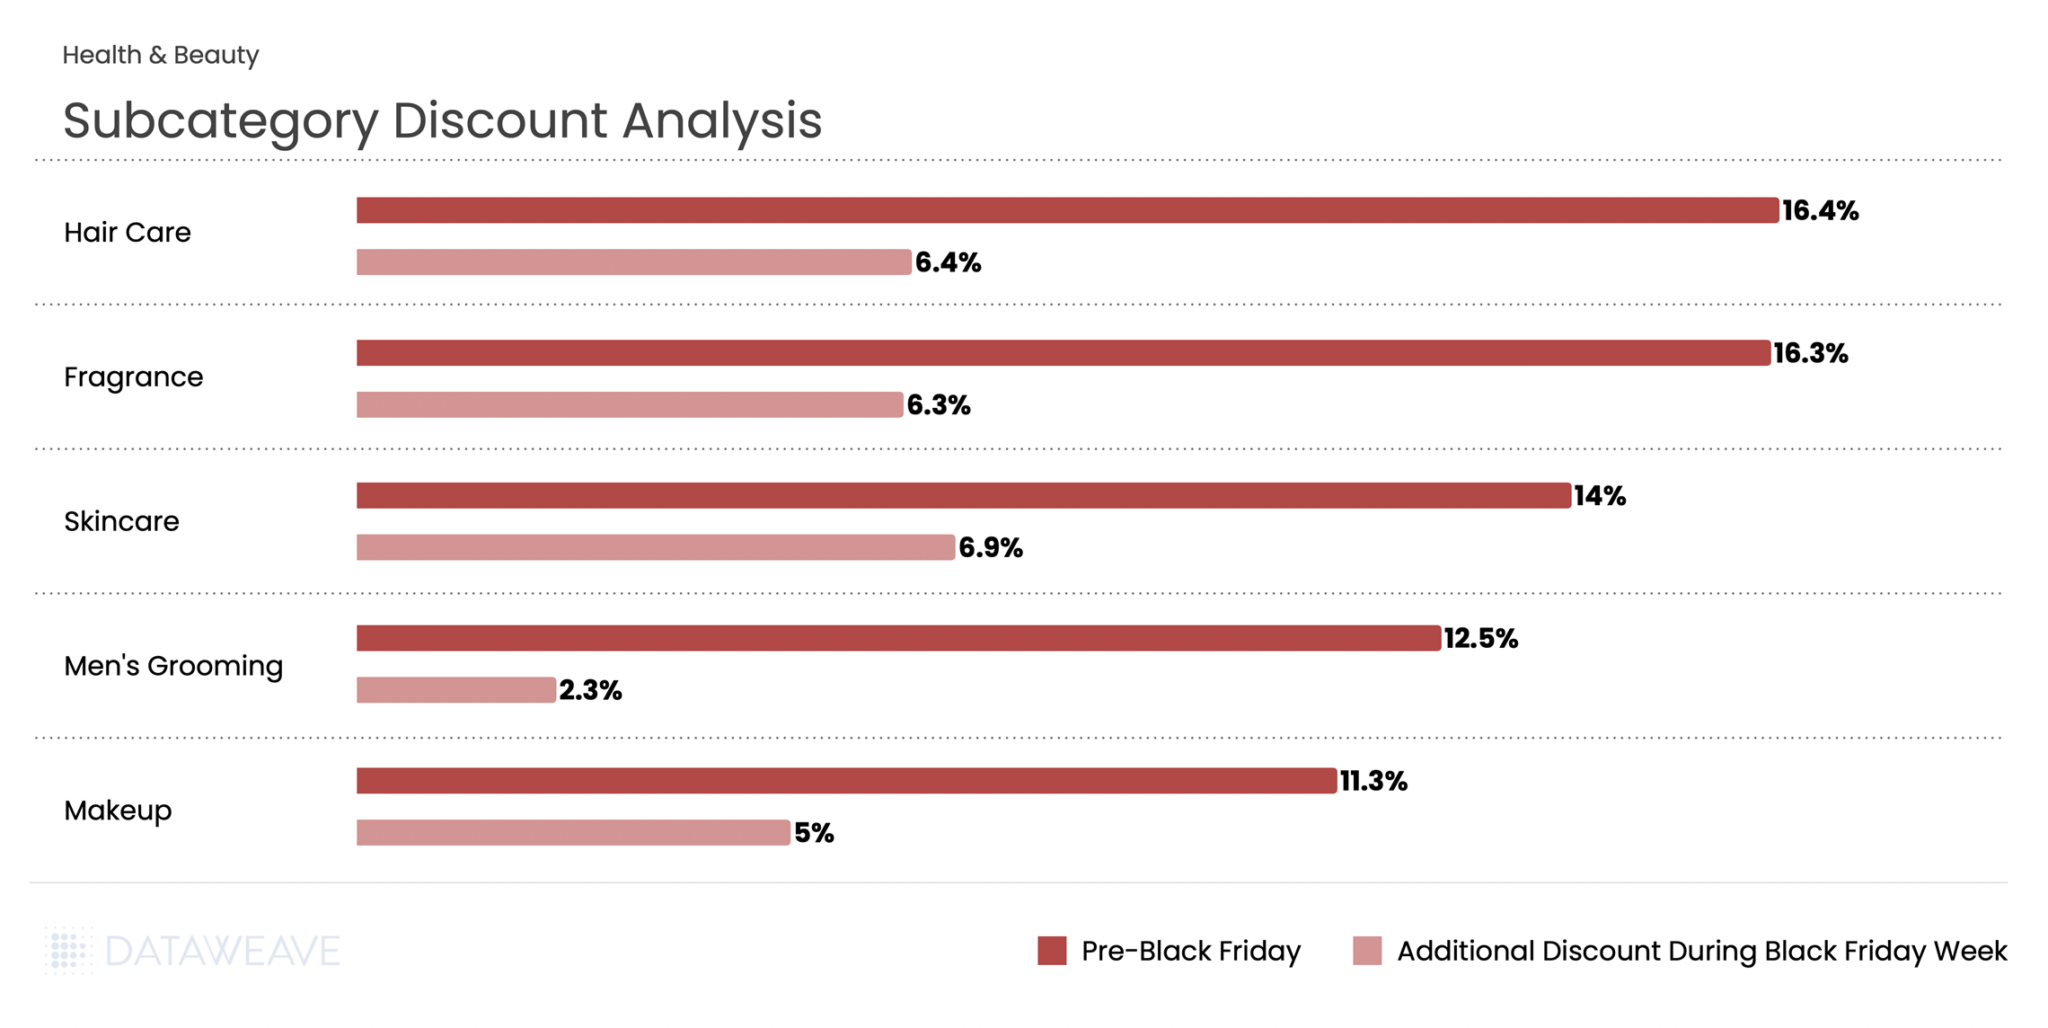
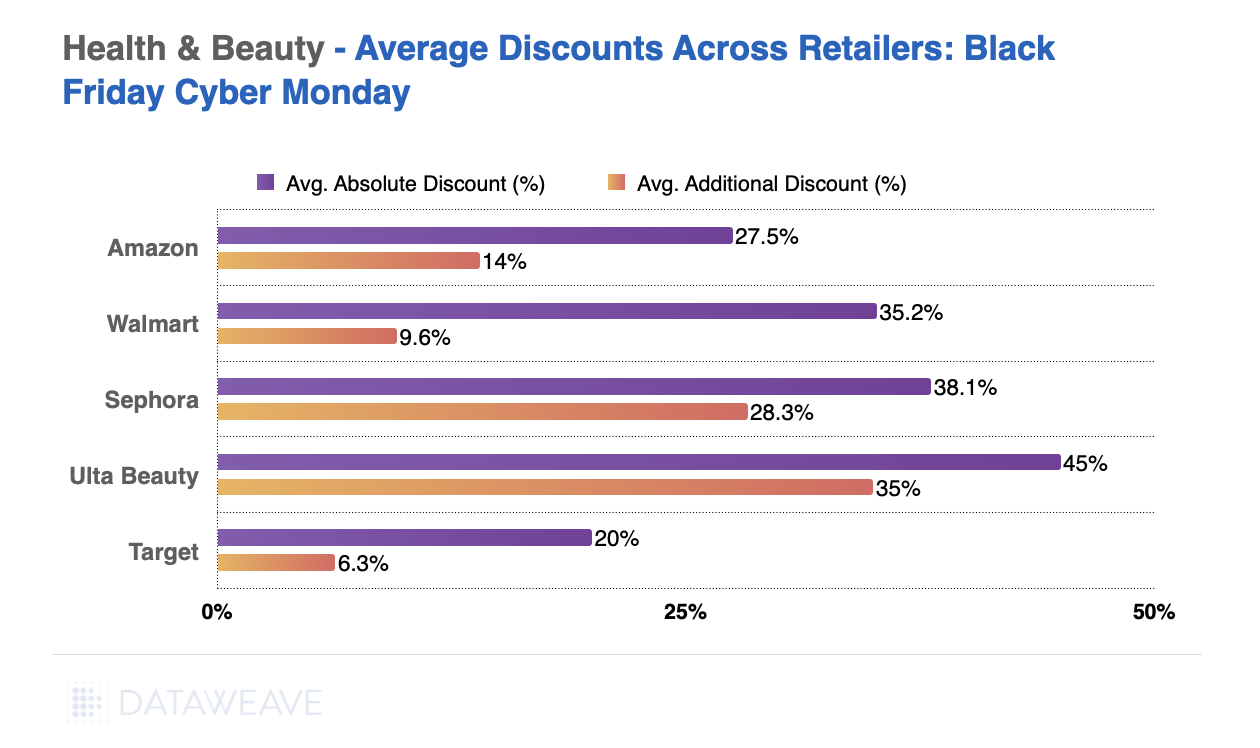
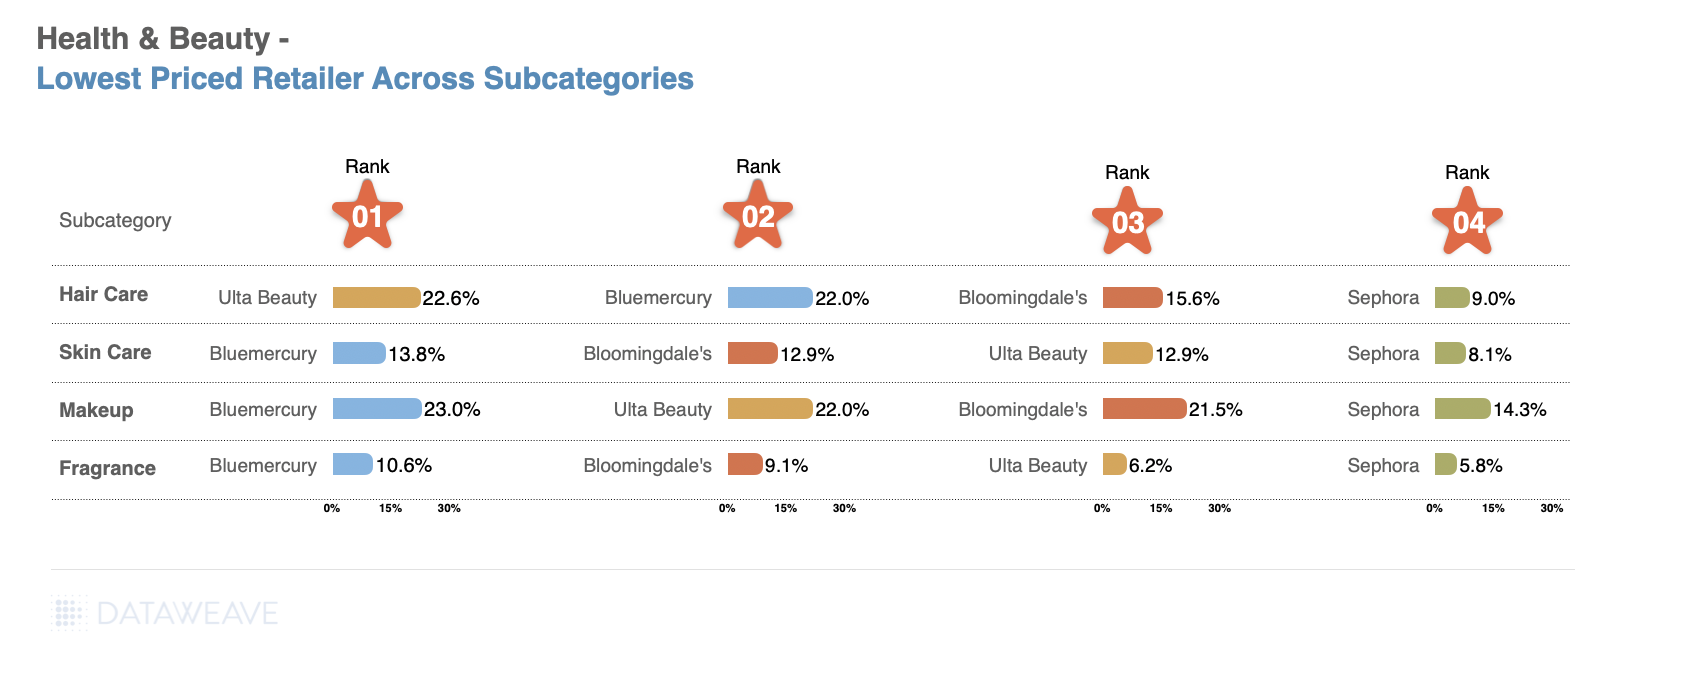
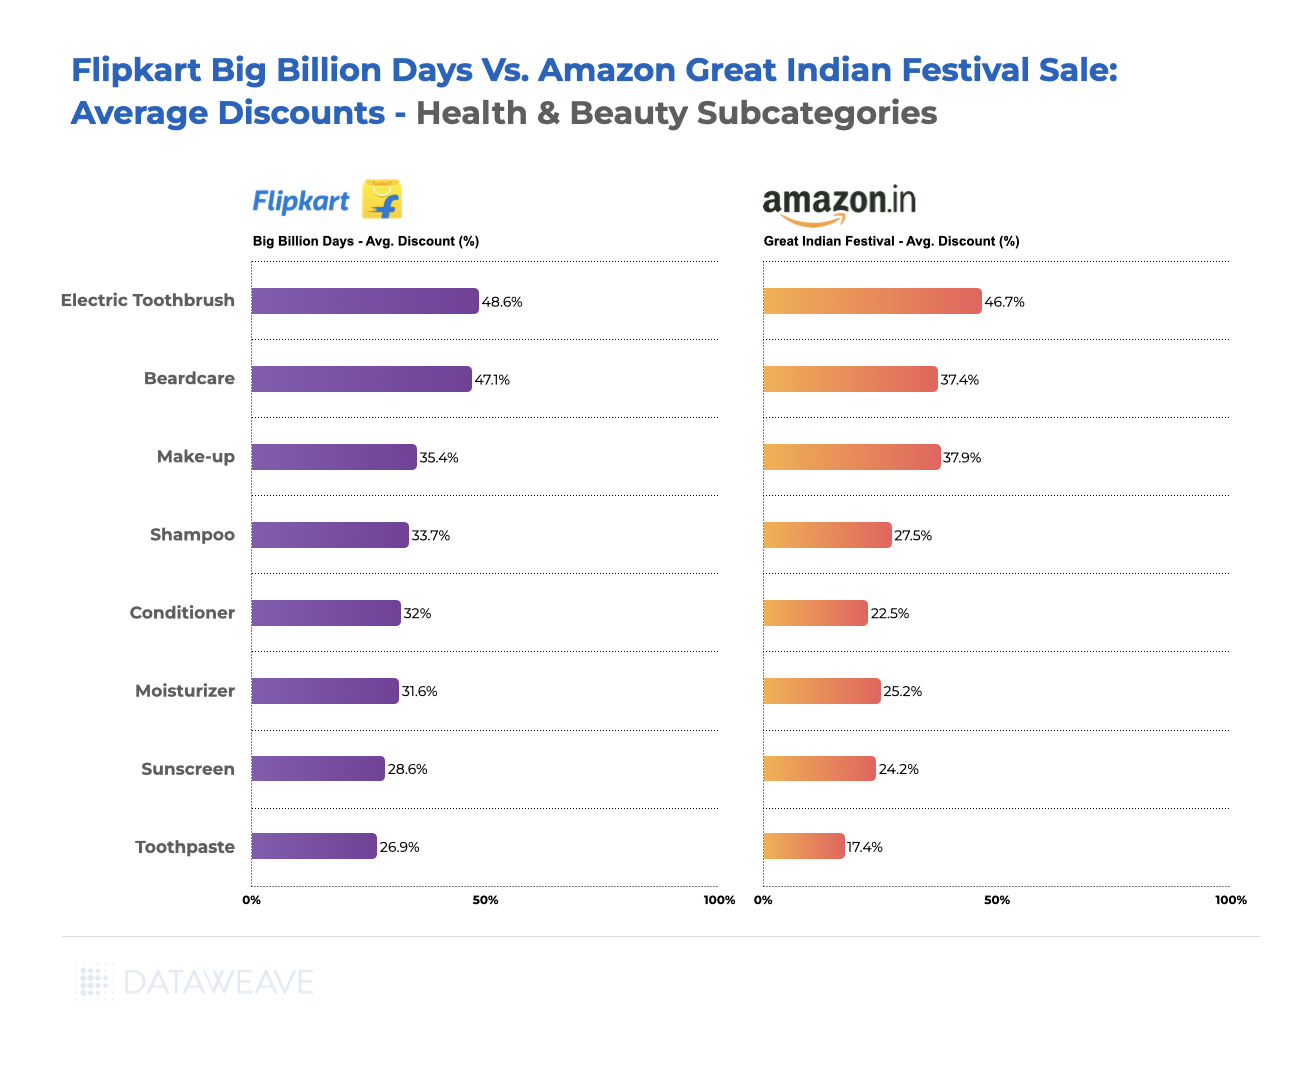
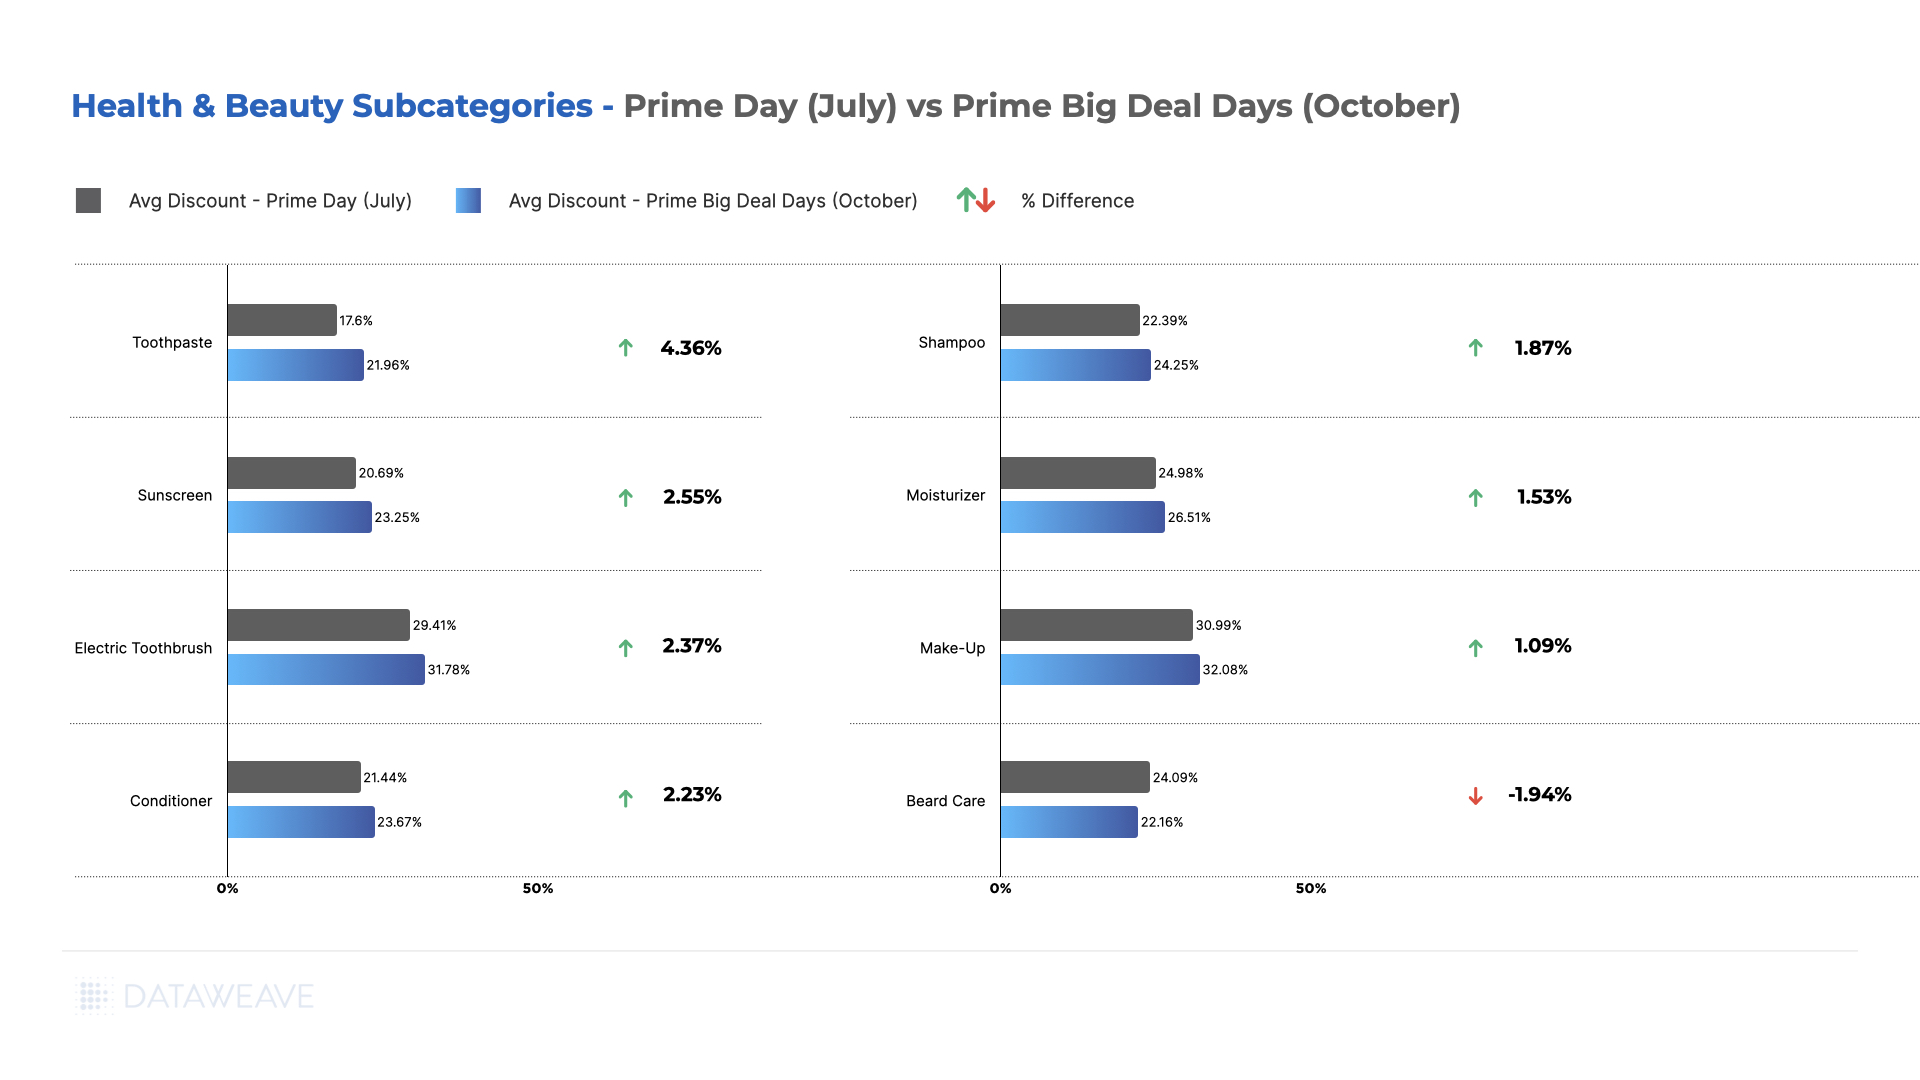
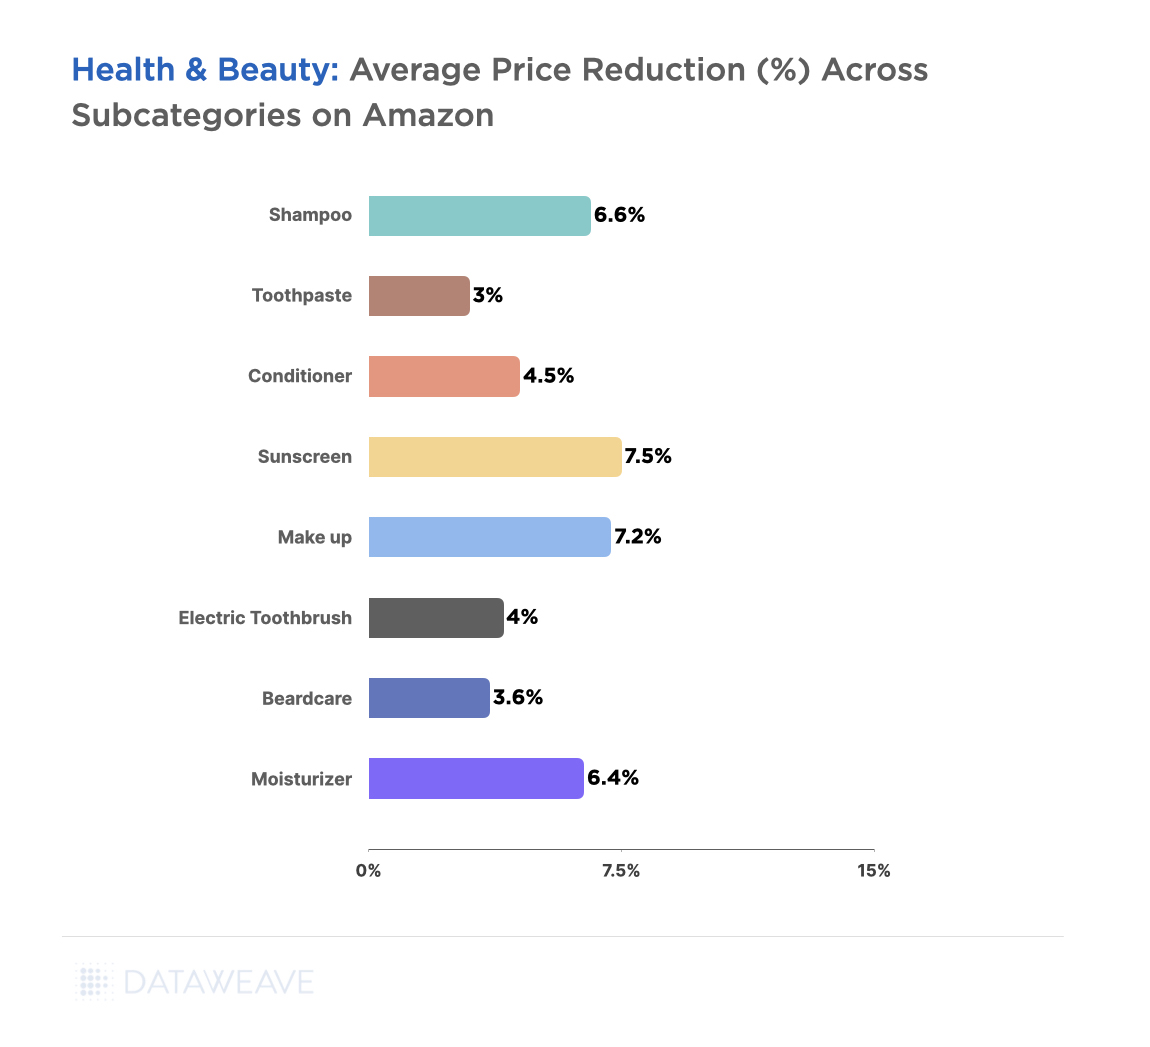
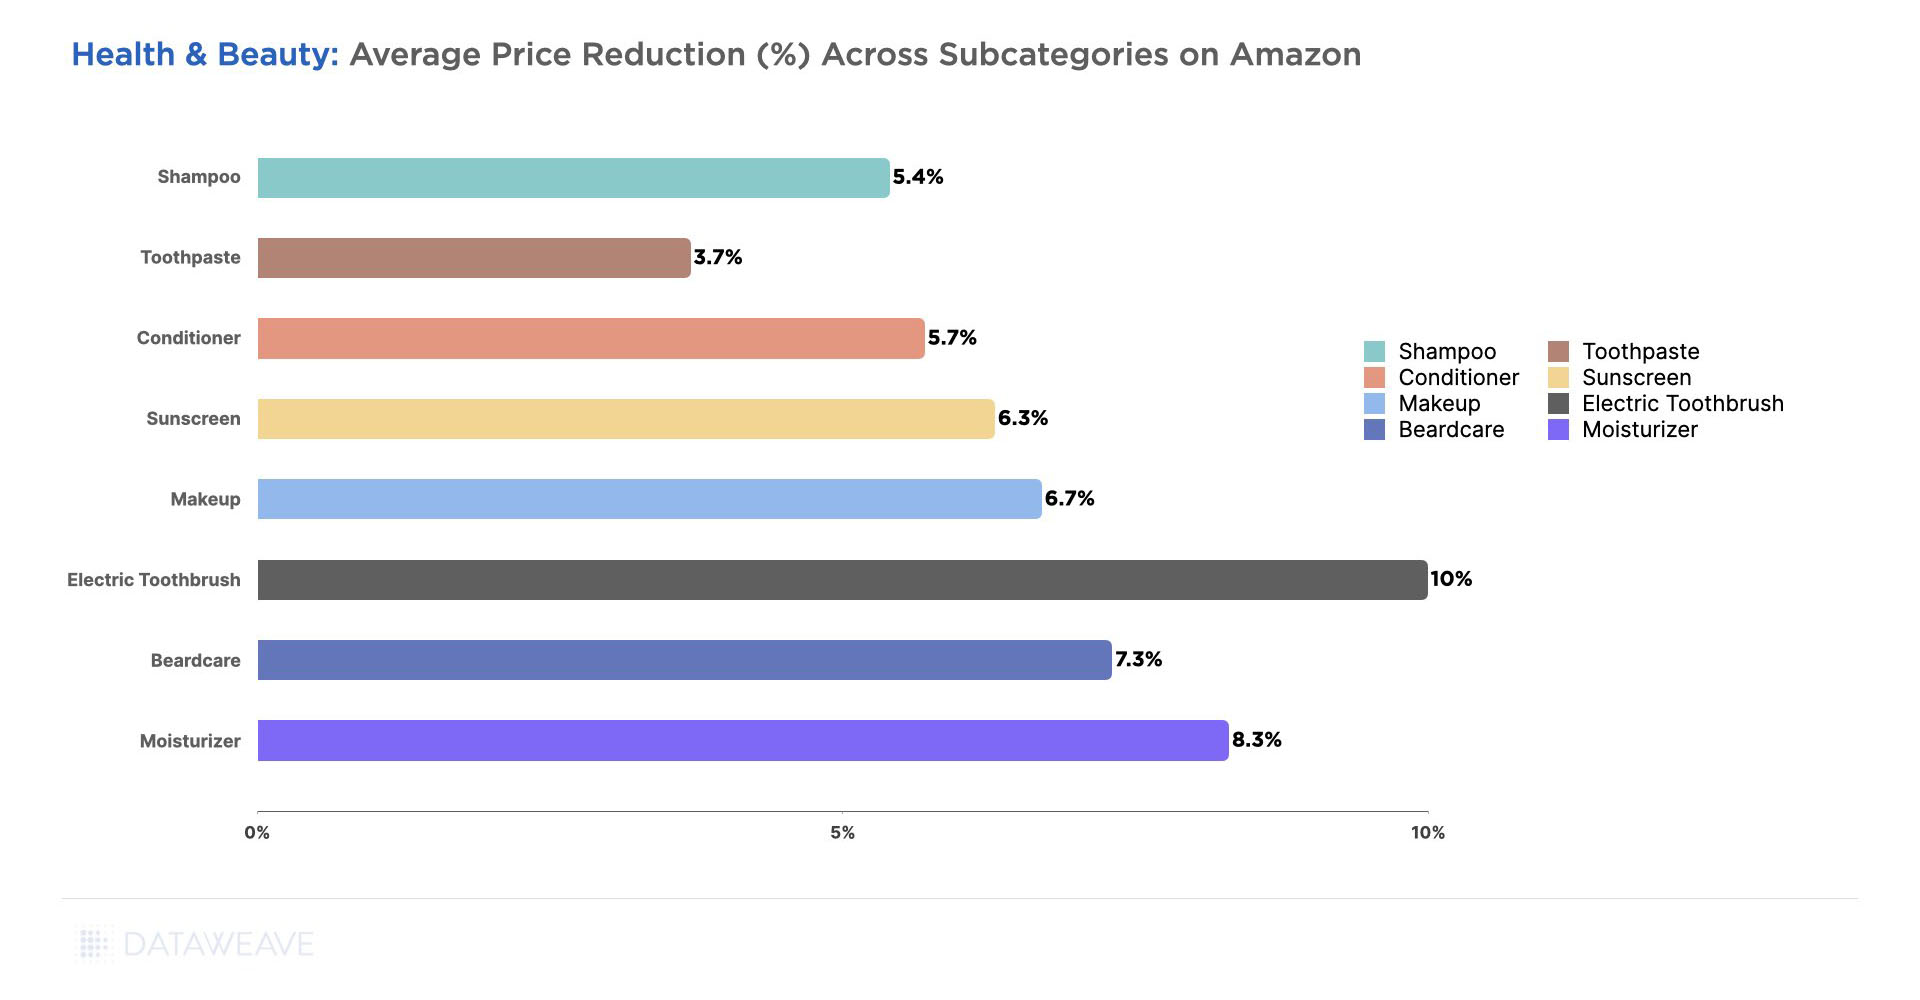
Subcategory Discount Analysis
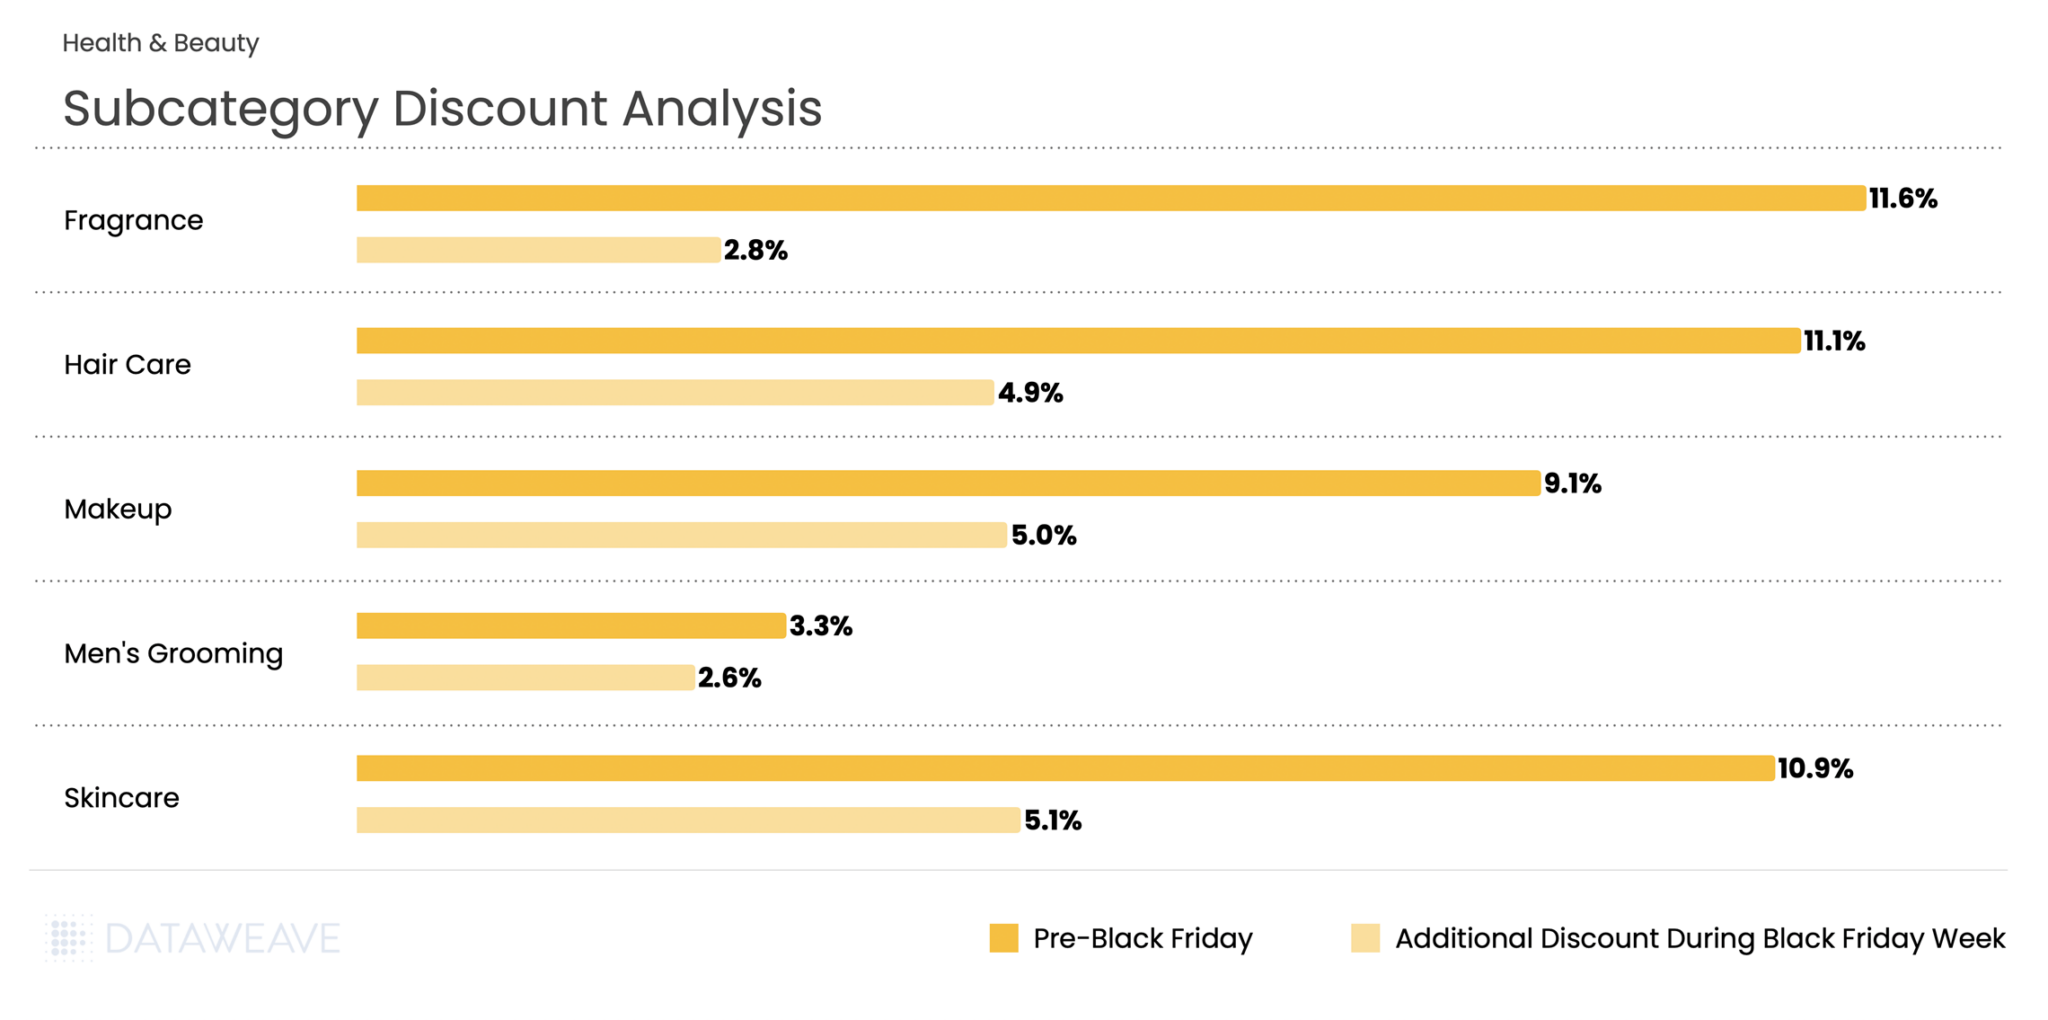
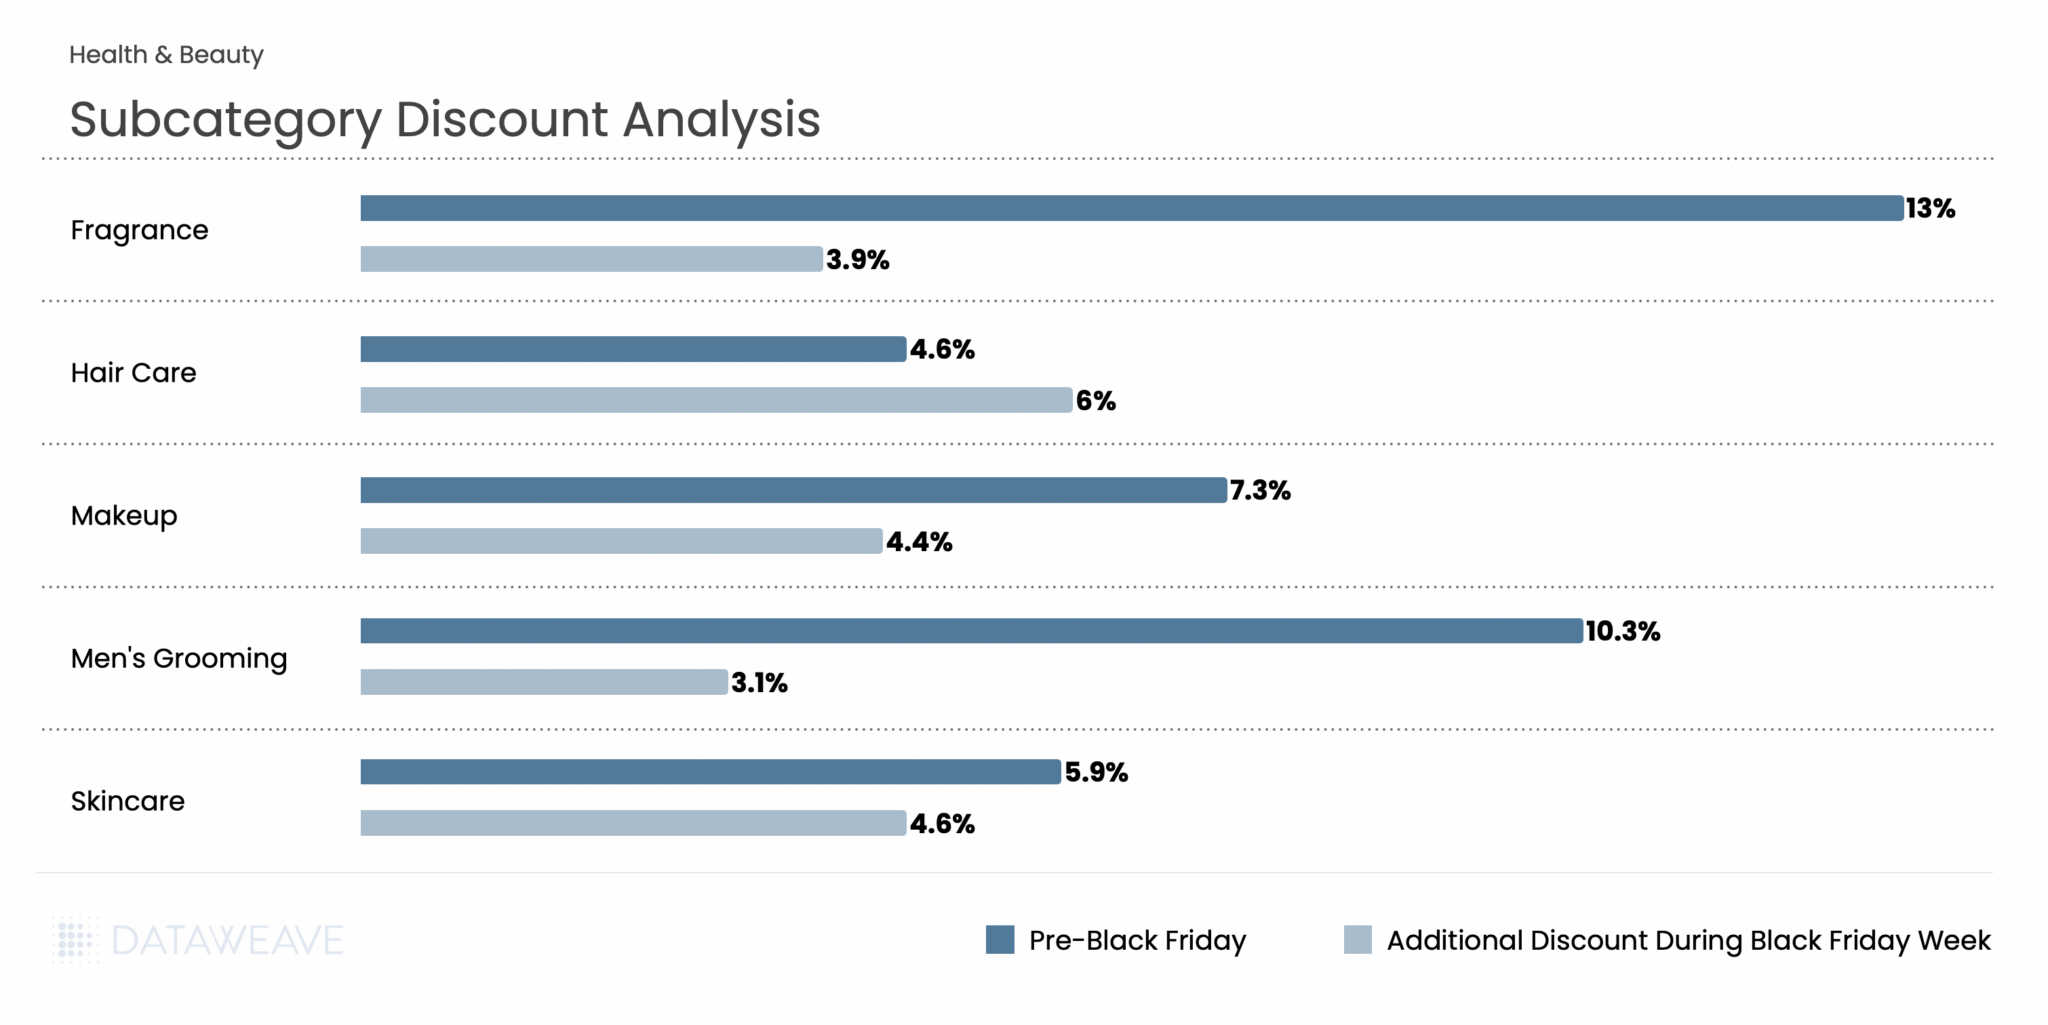
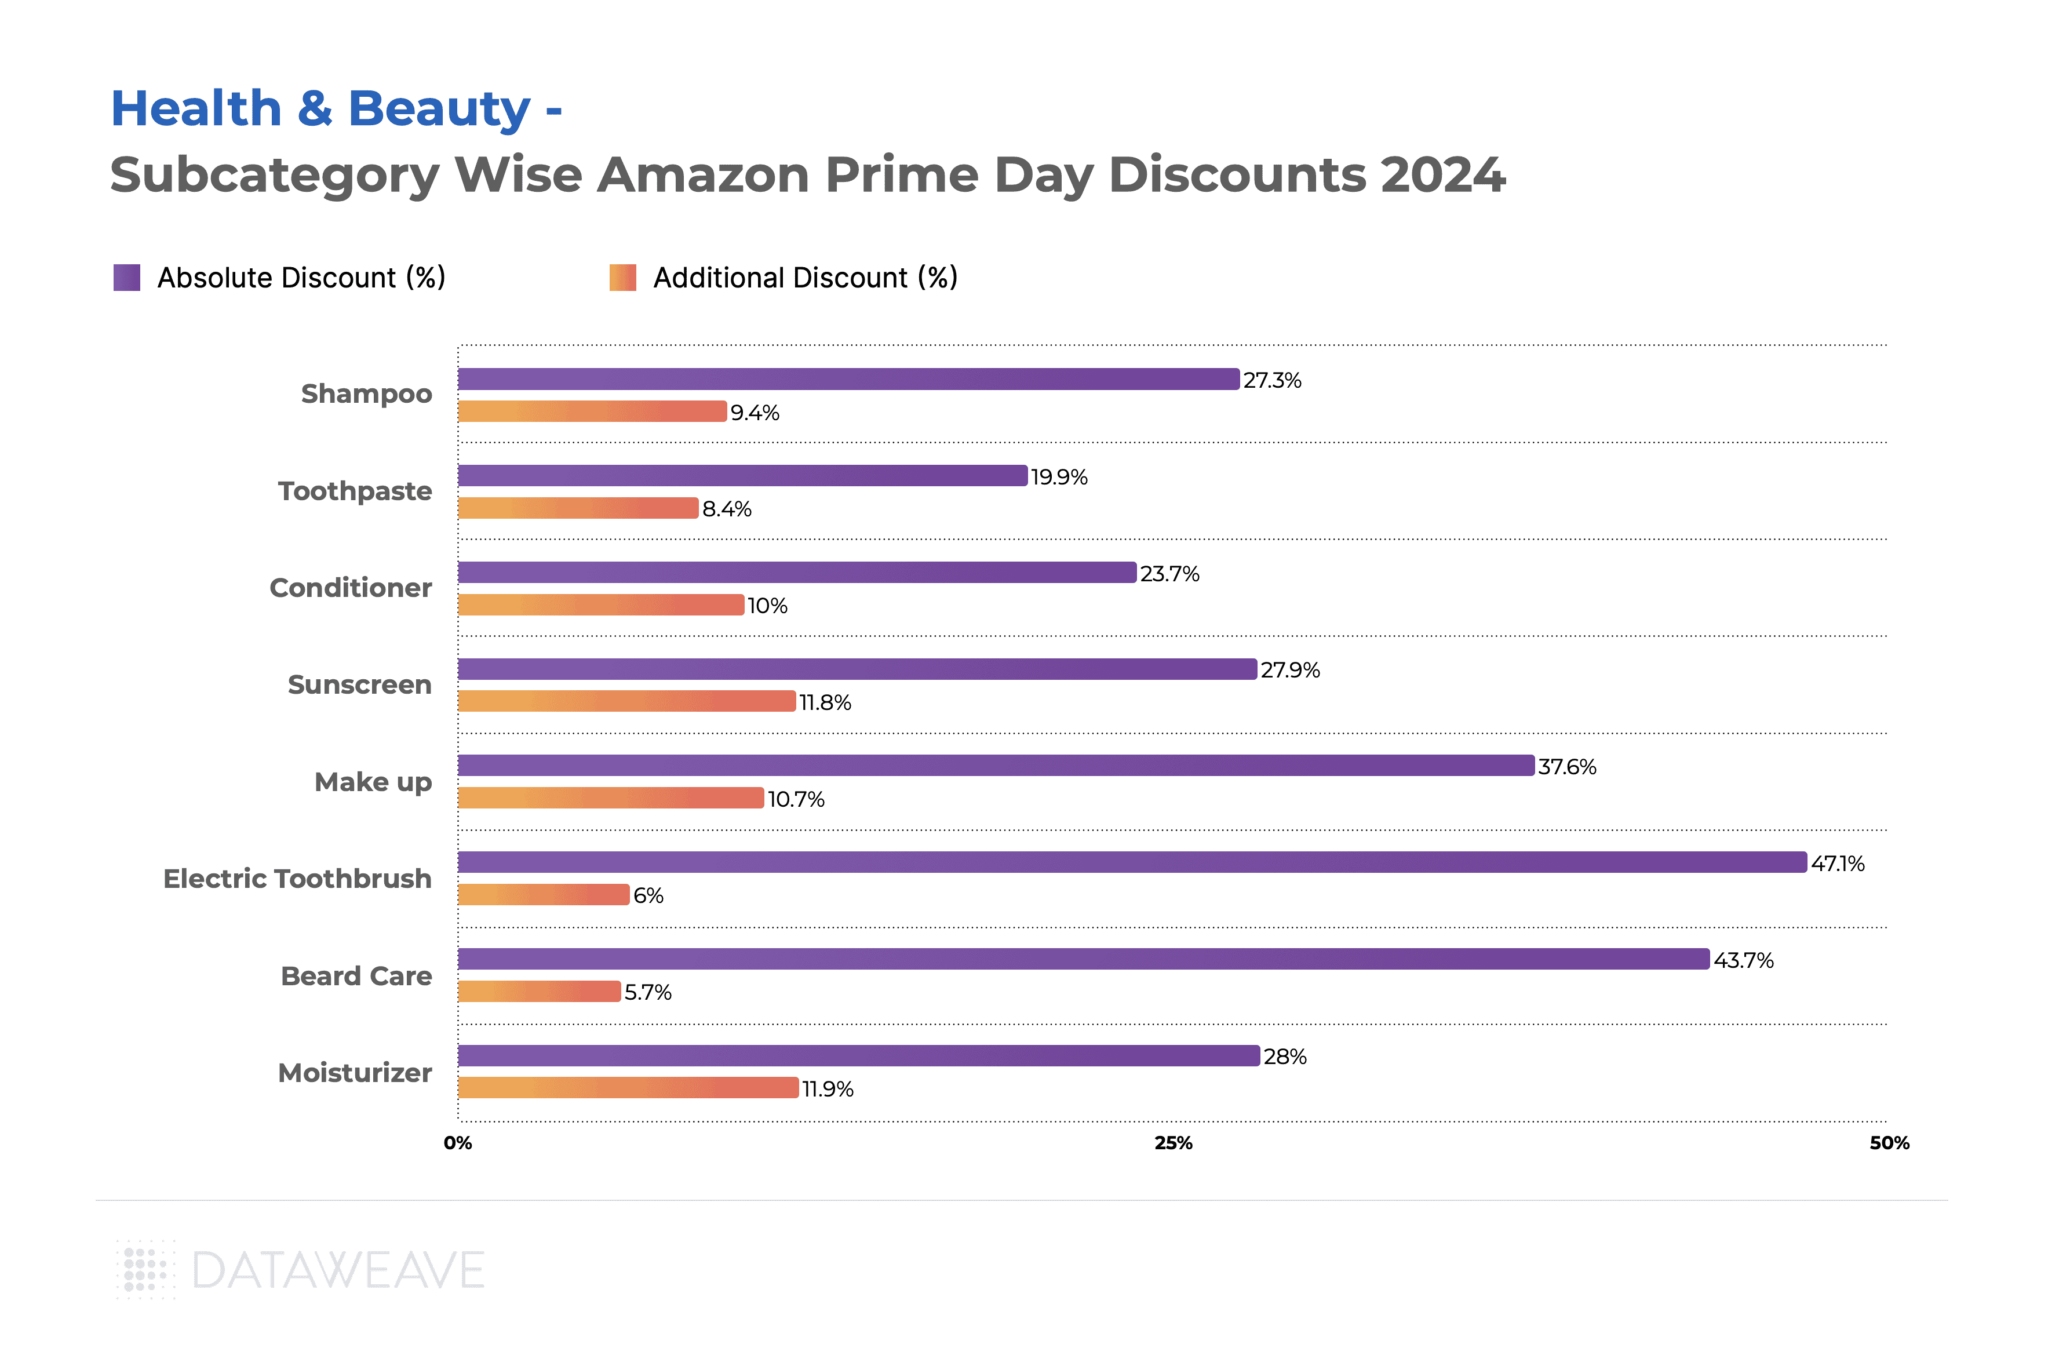
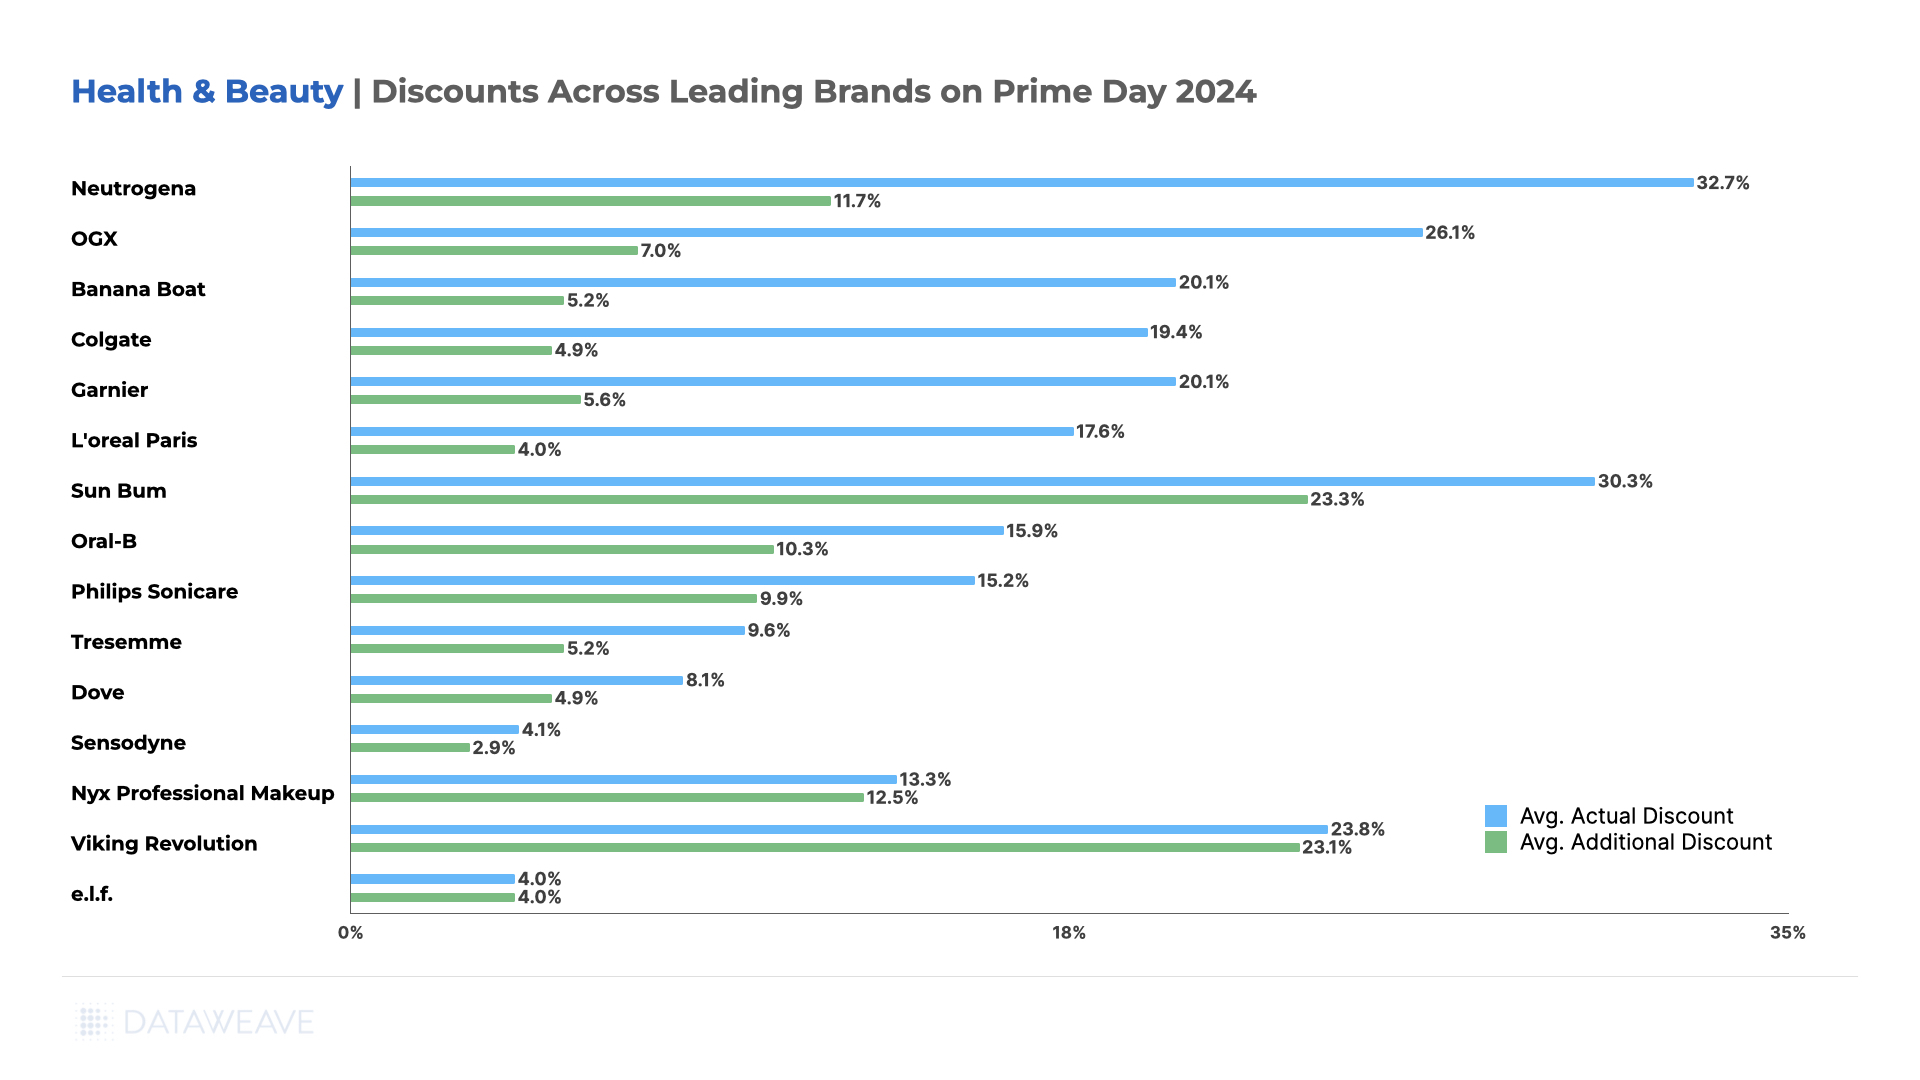
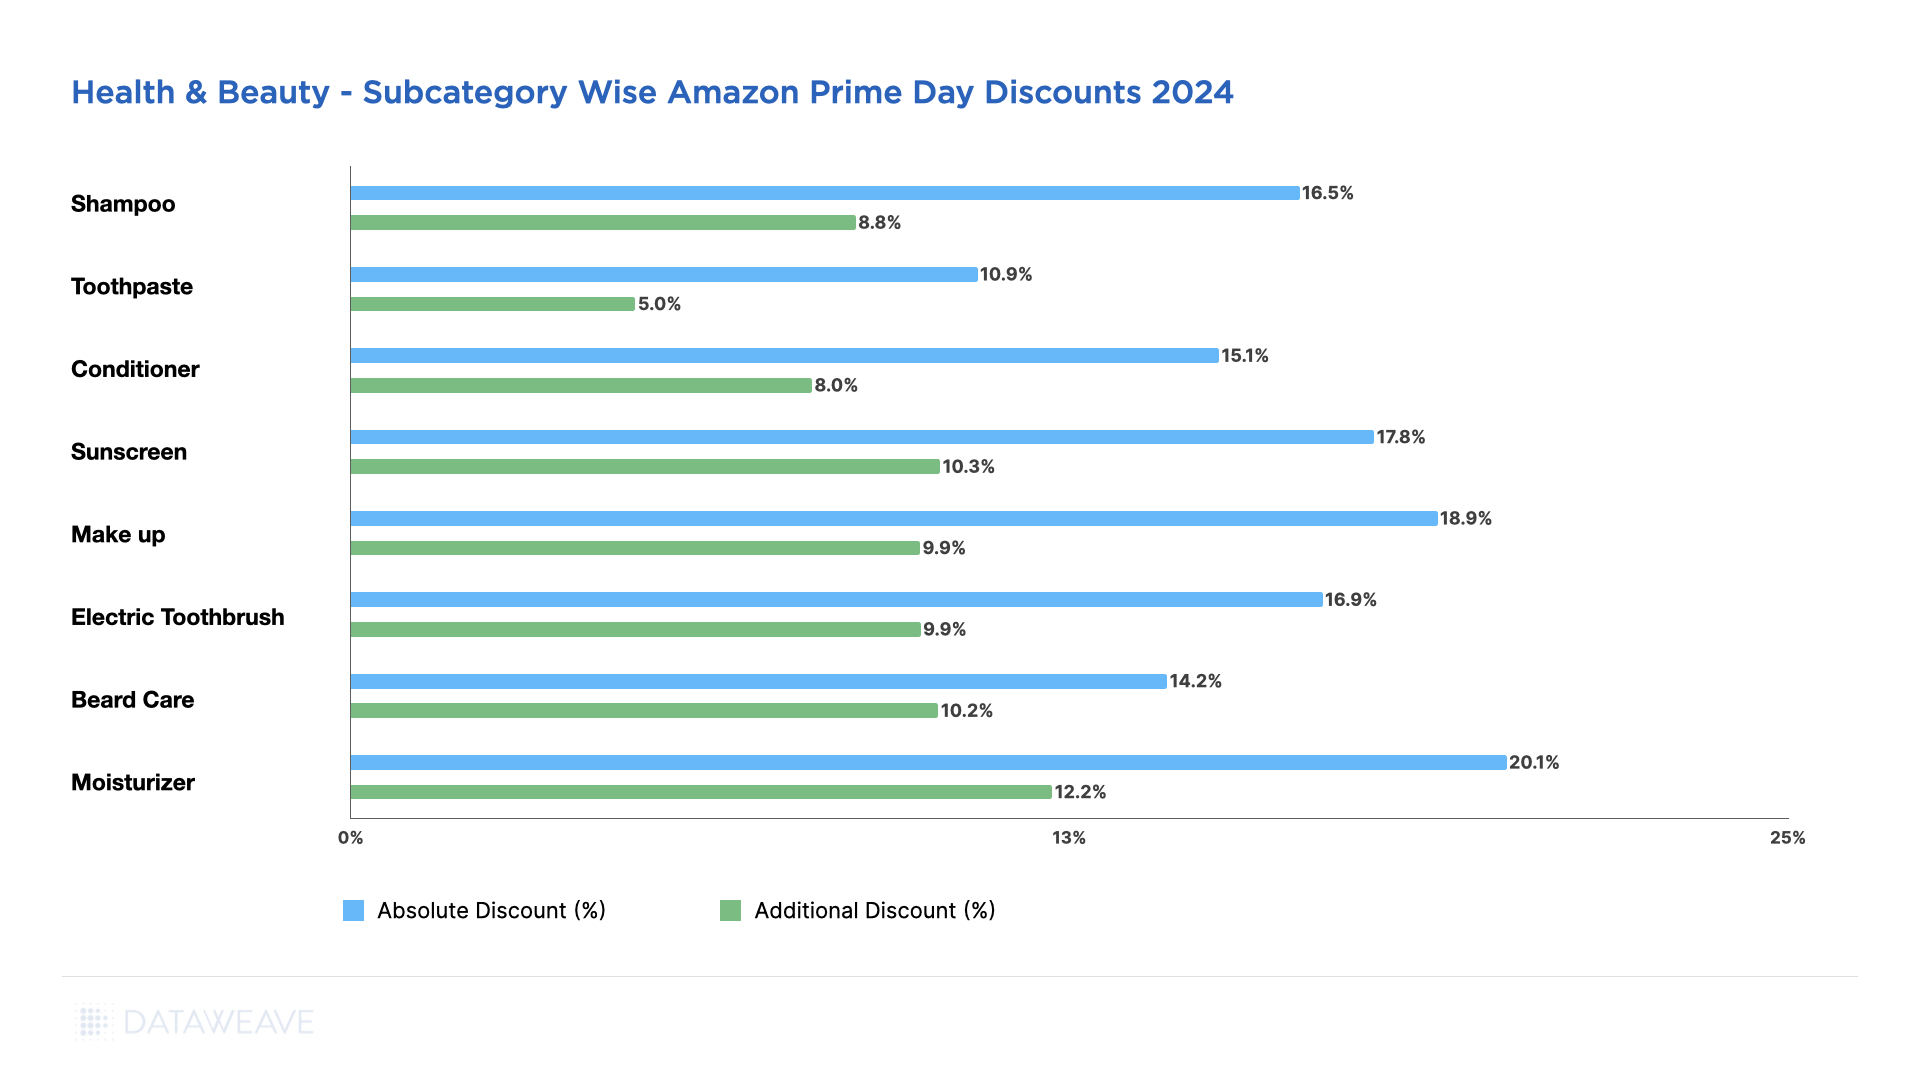
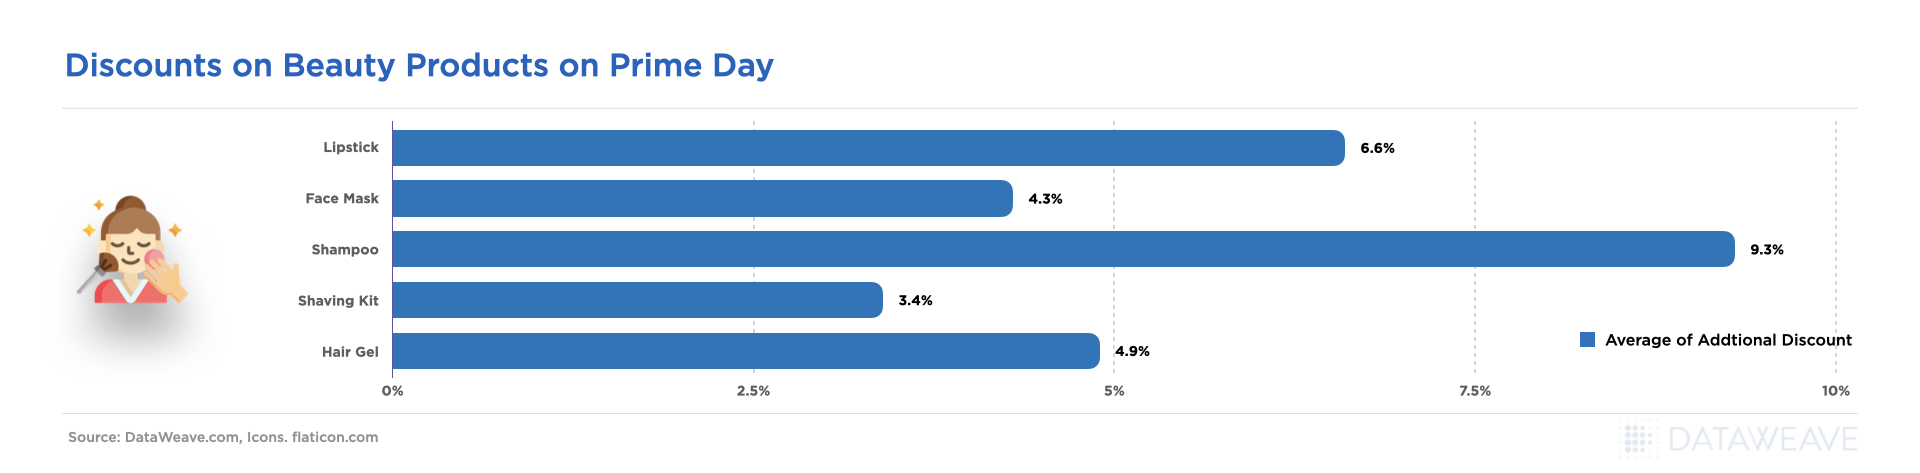
Pre-Black Friday discounts averaged 10%, with Black Friday Week adding 4.5% on average. Fragrance led pre-sale discounting at 11.6%, positioning perfumes and colognes as attractive early holiday purchases. However, Fragrance saw the smallest Black Friday Week addition at just 2.8%.
Hair Care and Skincare both showed strong performance across both periods, with Hair Care at 11.1% pre-sale and 4.9% during Black Friday Week, while Skincare registered 10.9% and 5.1% respectively. Skincare’s 5.1% Black Friday Week discount was the highest in the category.
Men’s Grooming stood apart with notably lower discounts at 3.3% pre-sale and 2.6% during Black Friday Week, suggesting either tighter margins in this subcategory or strategic positioning at different price points.
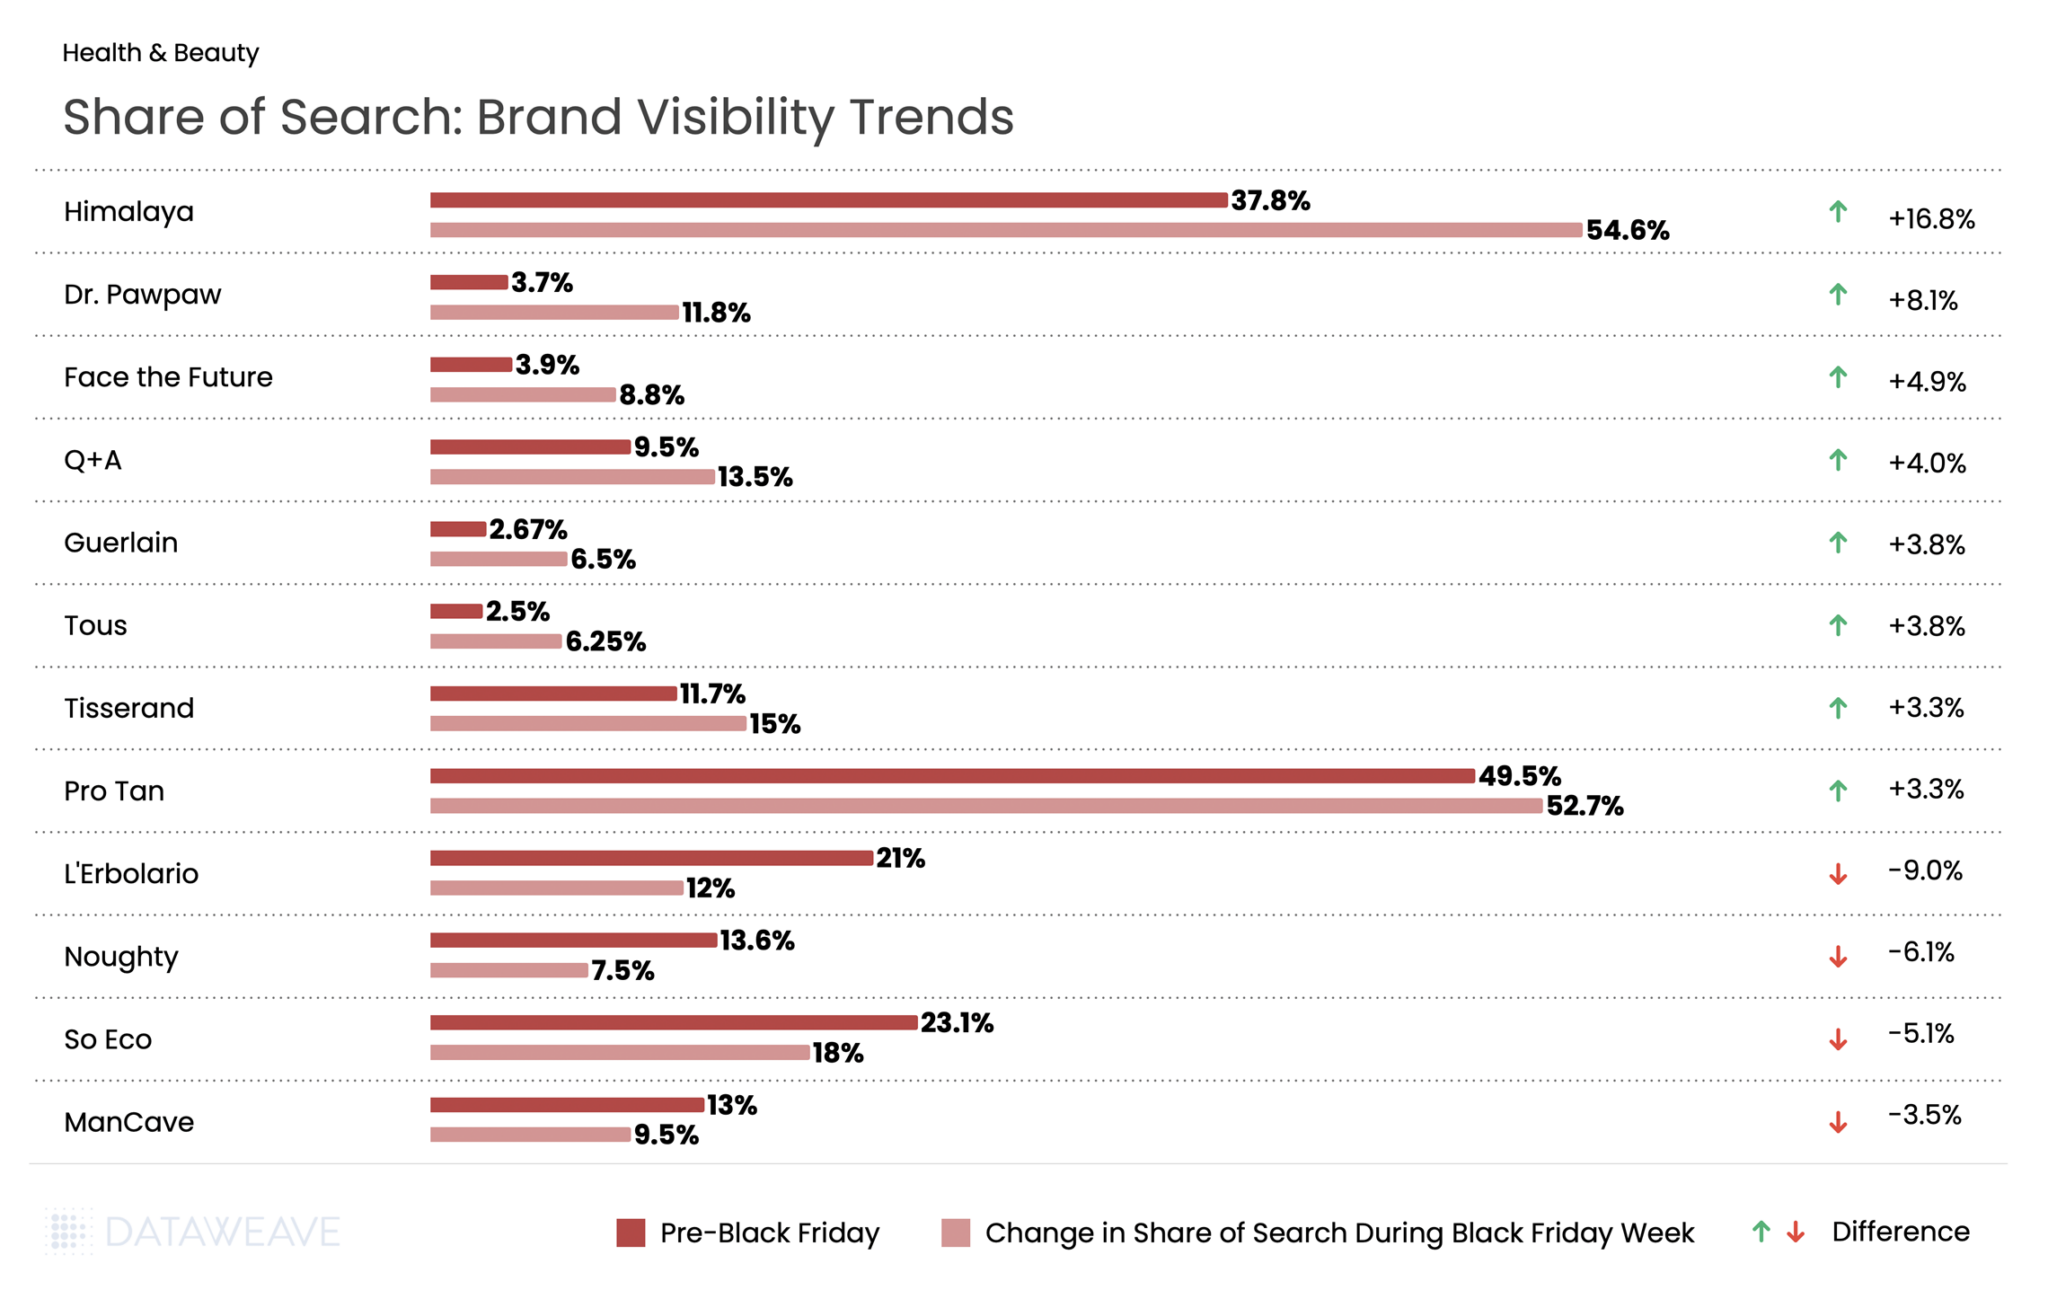
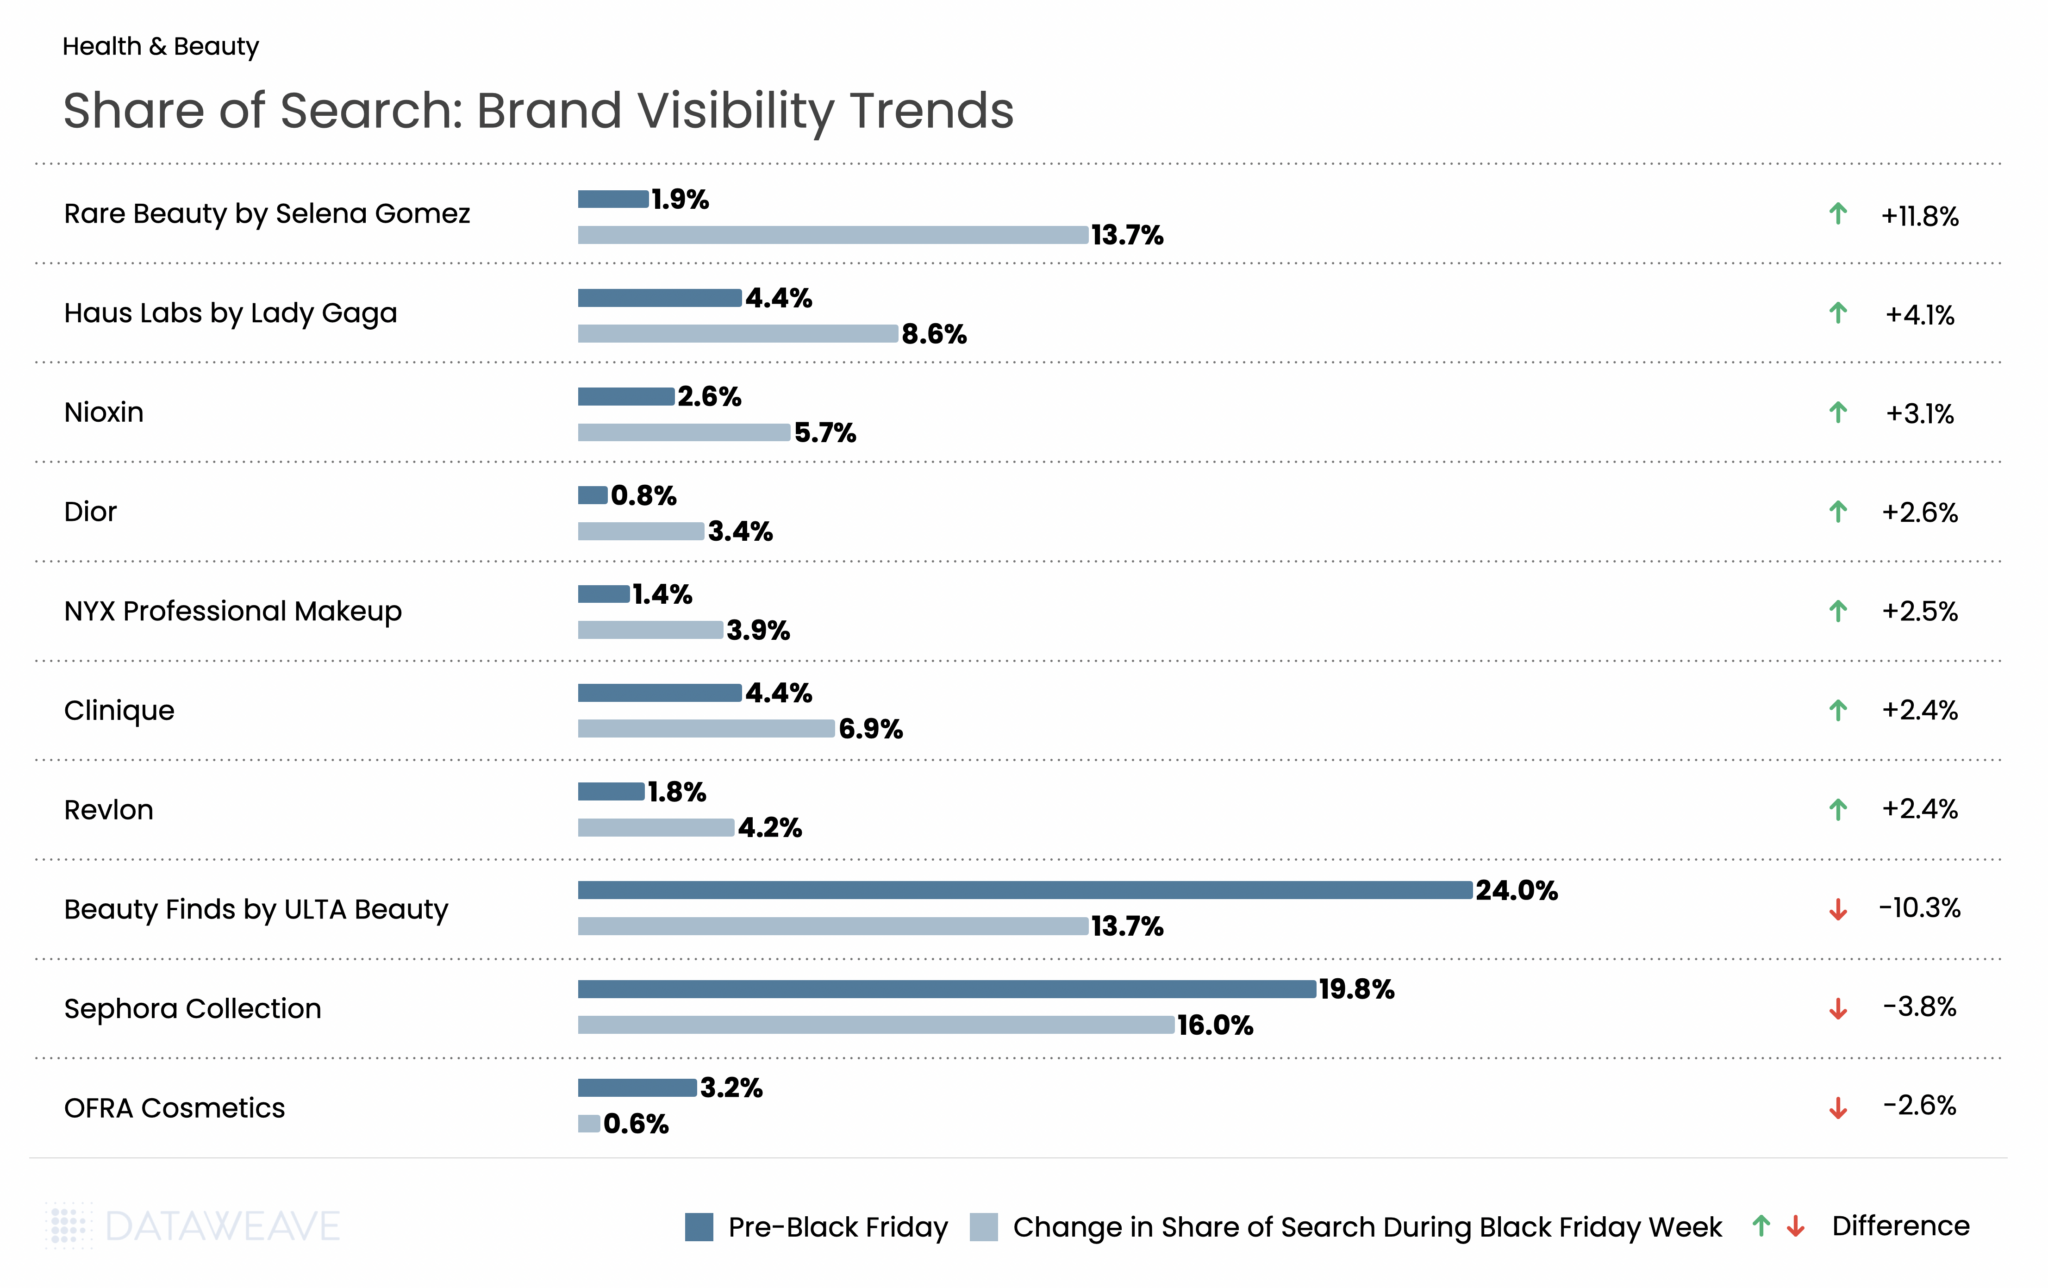
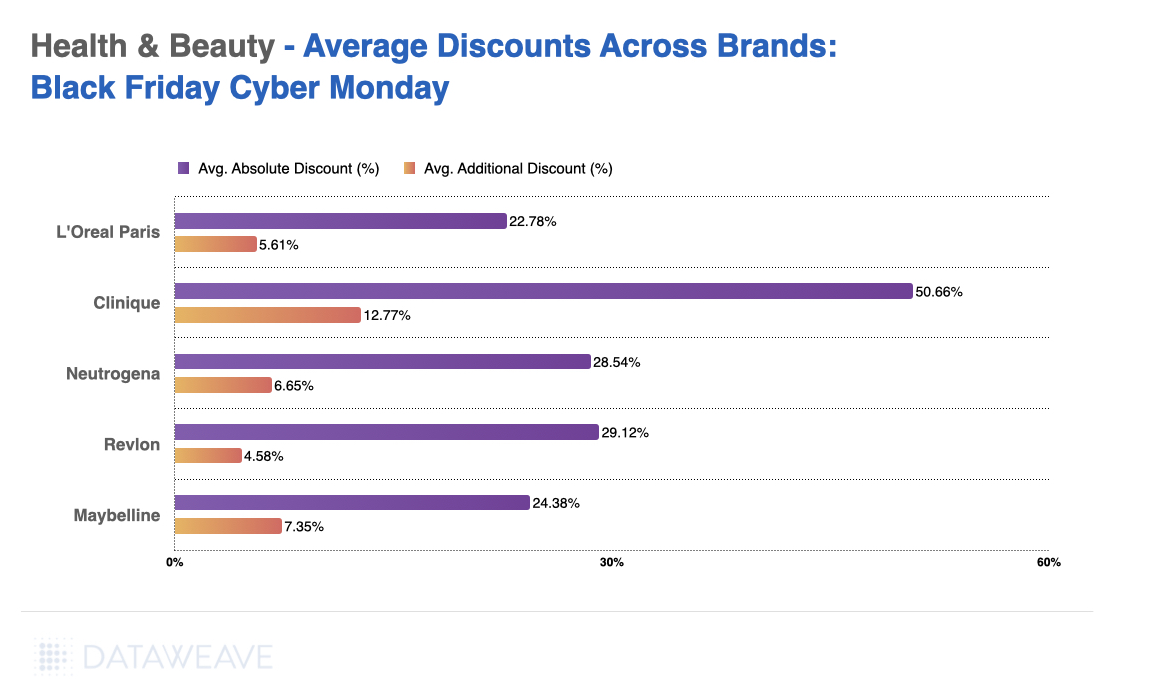
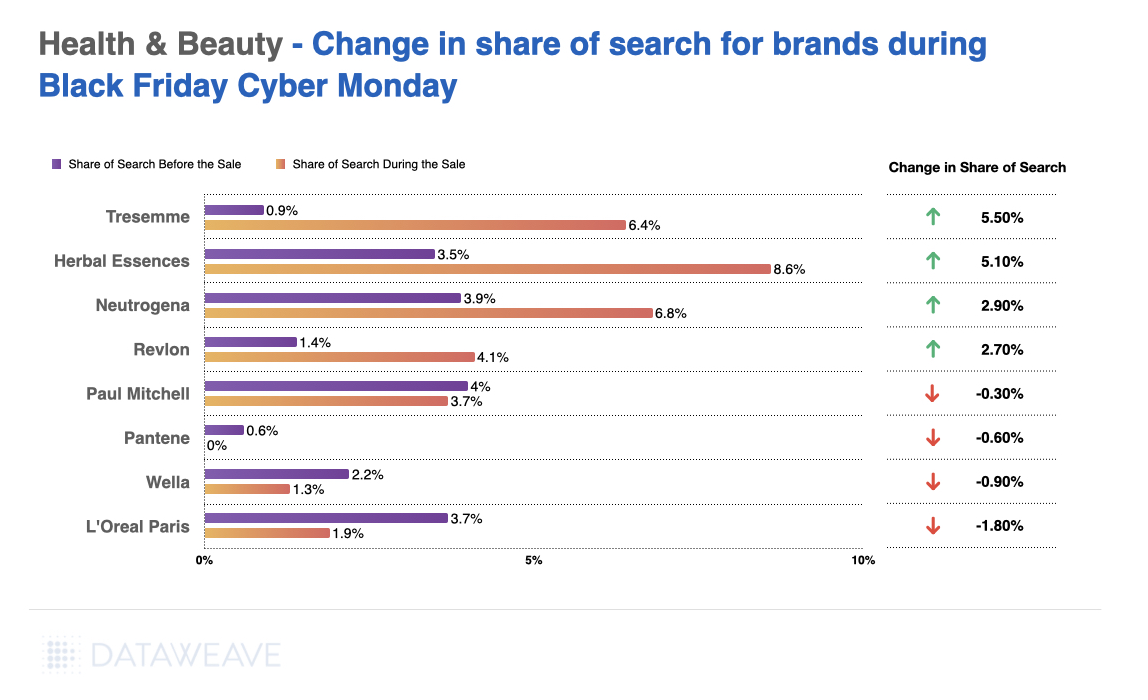
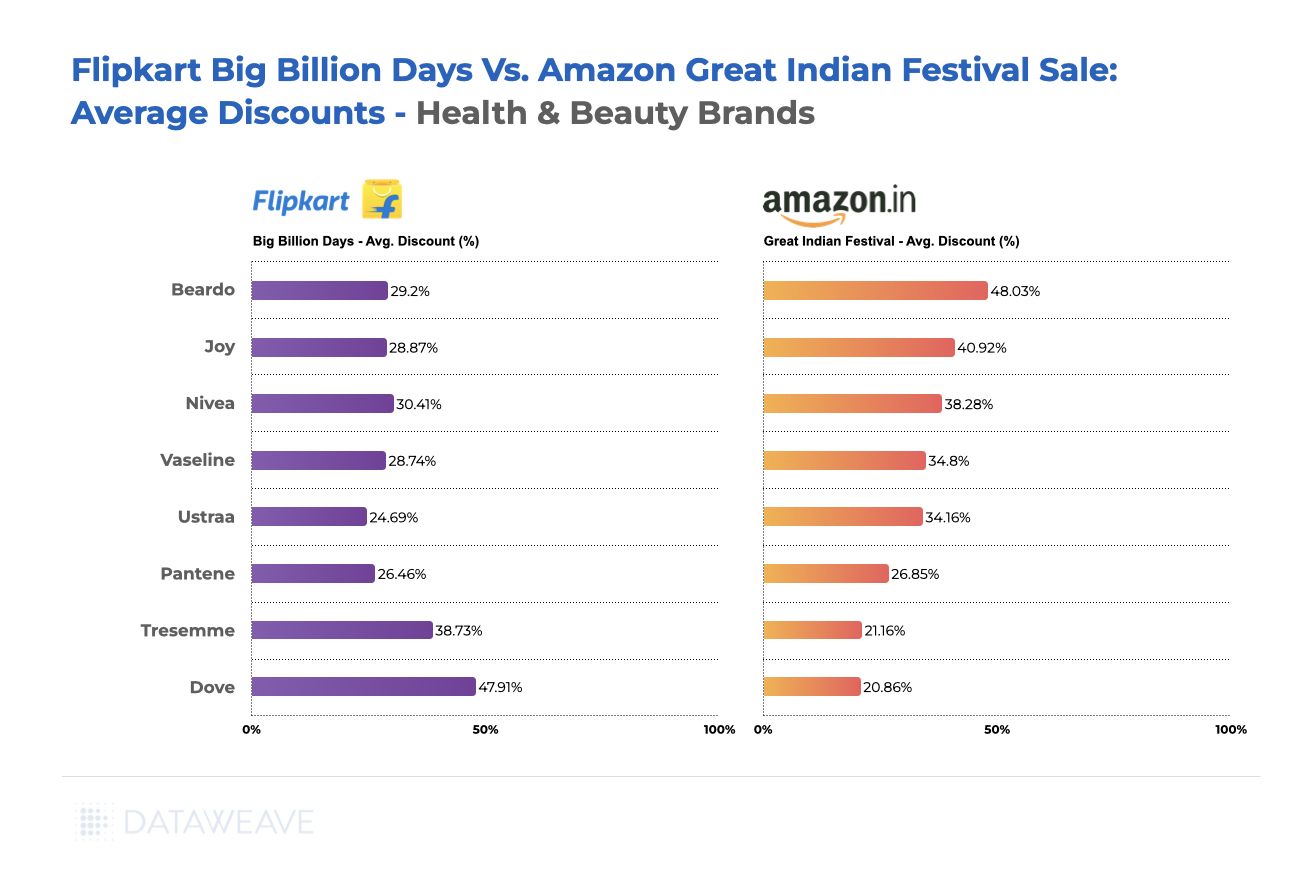
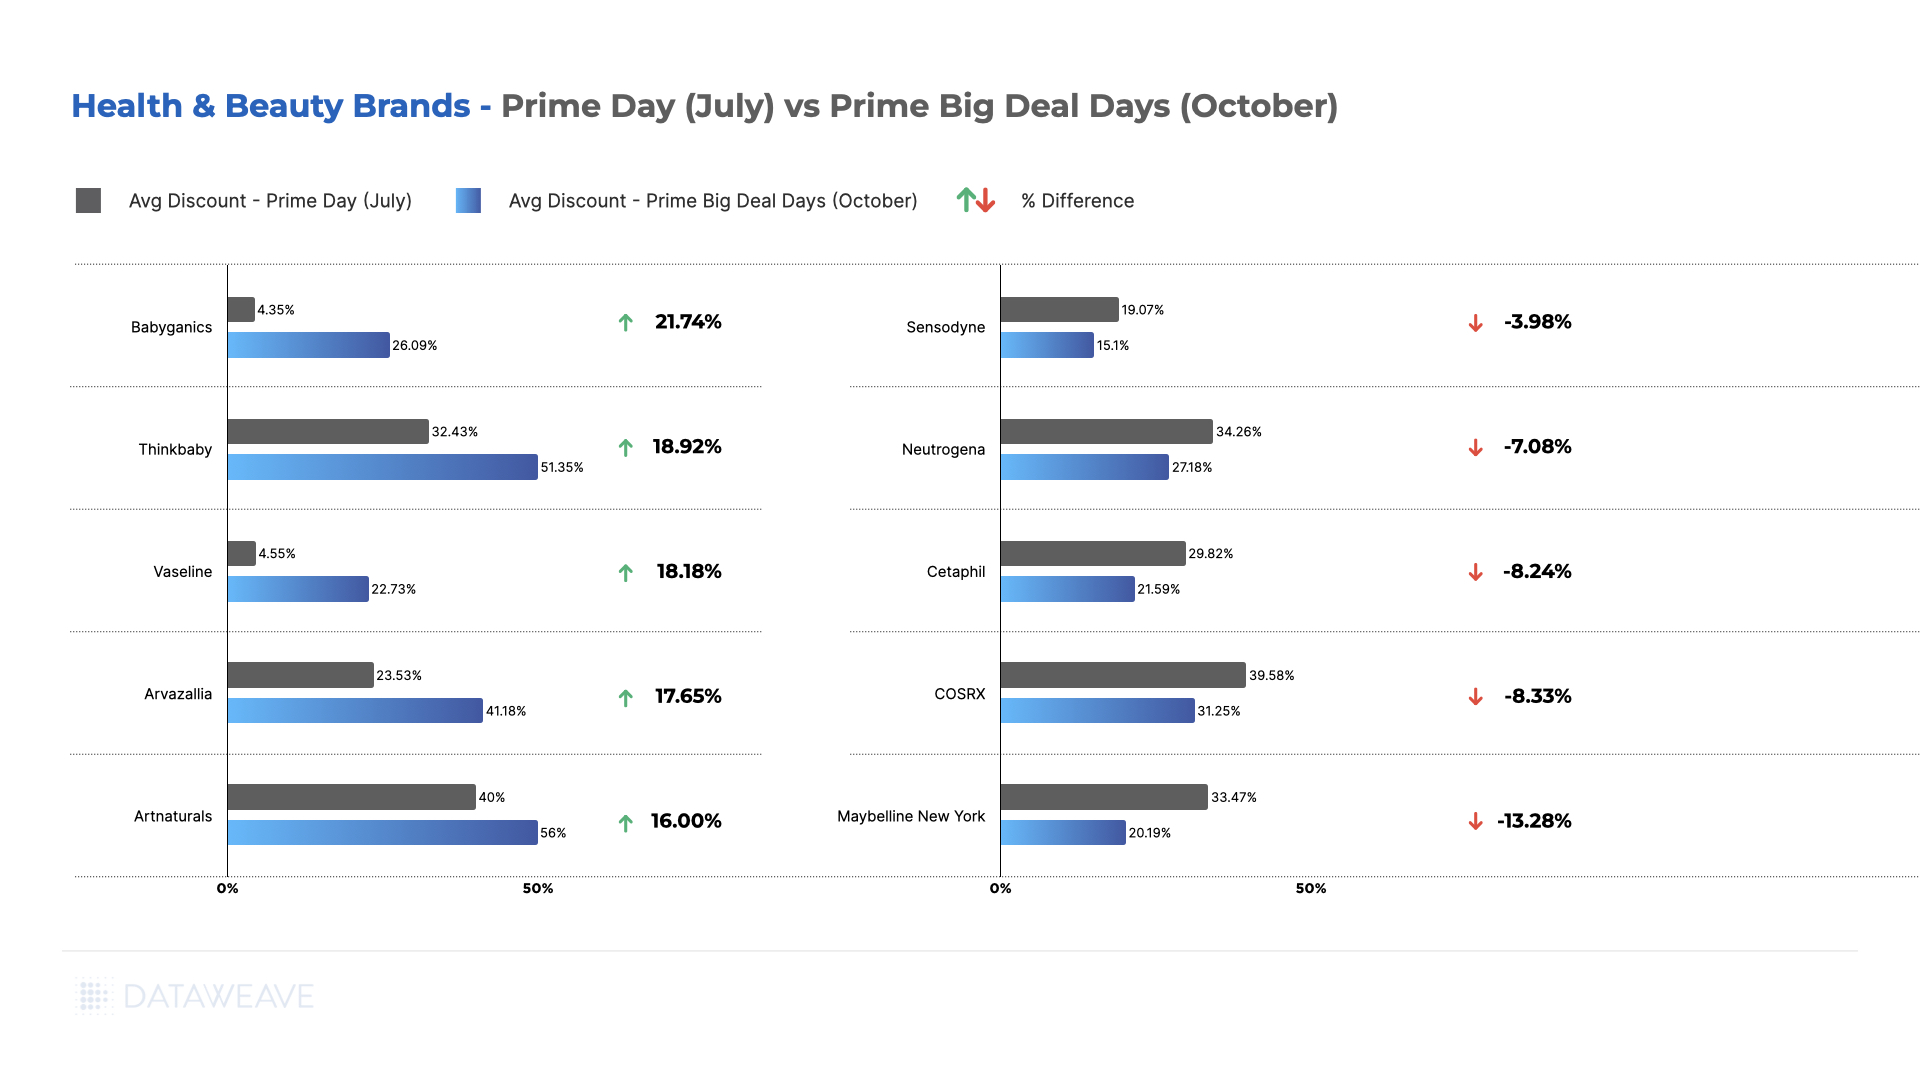
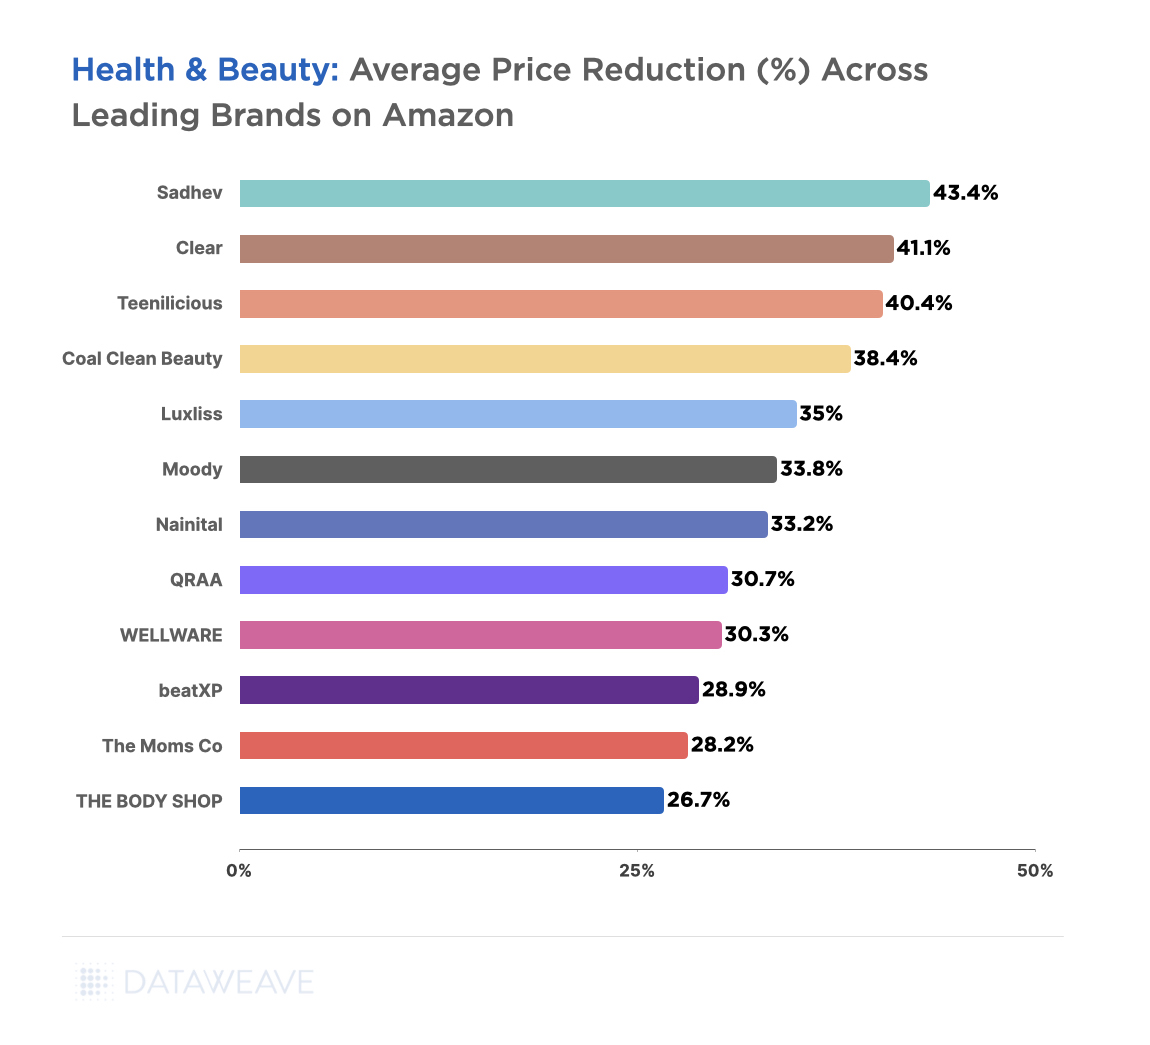
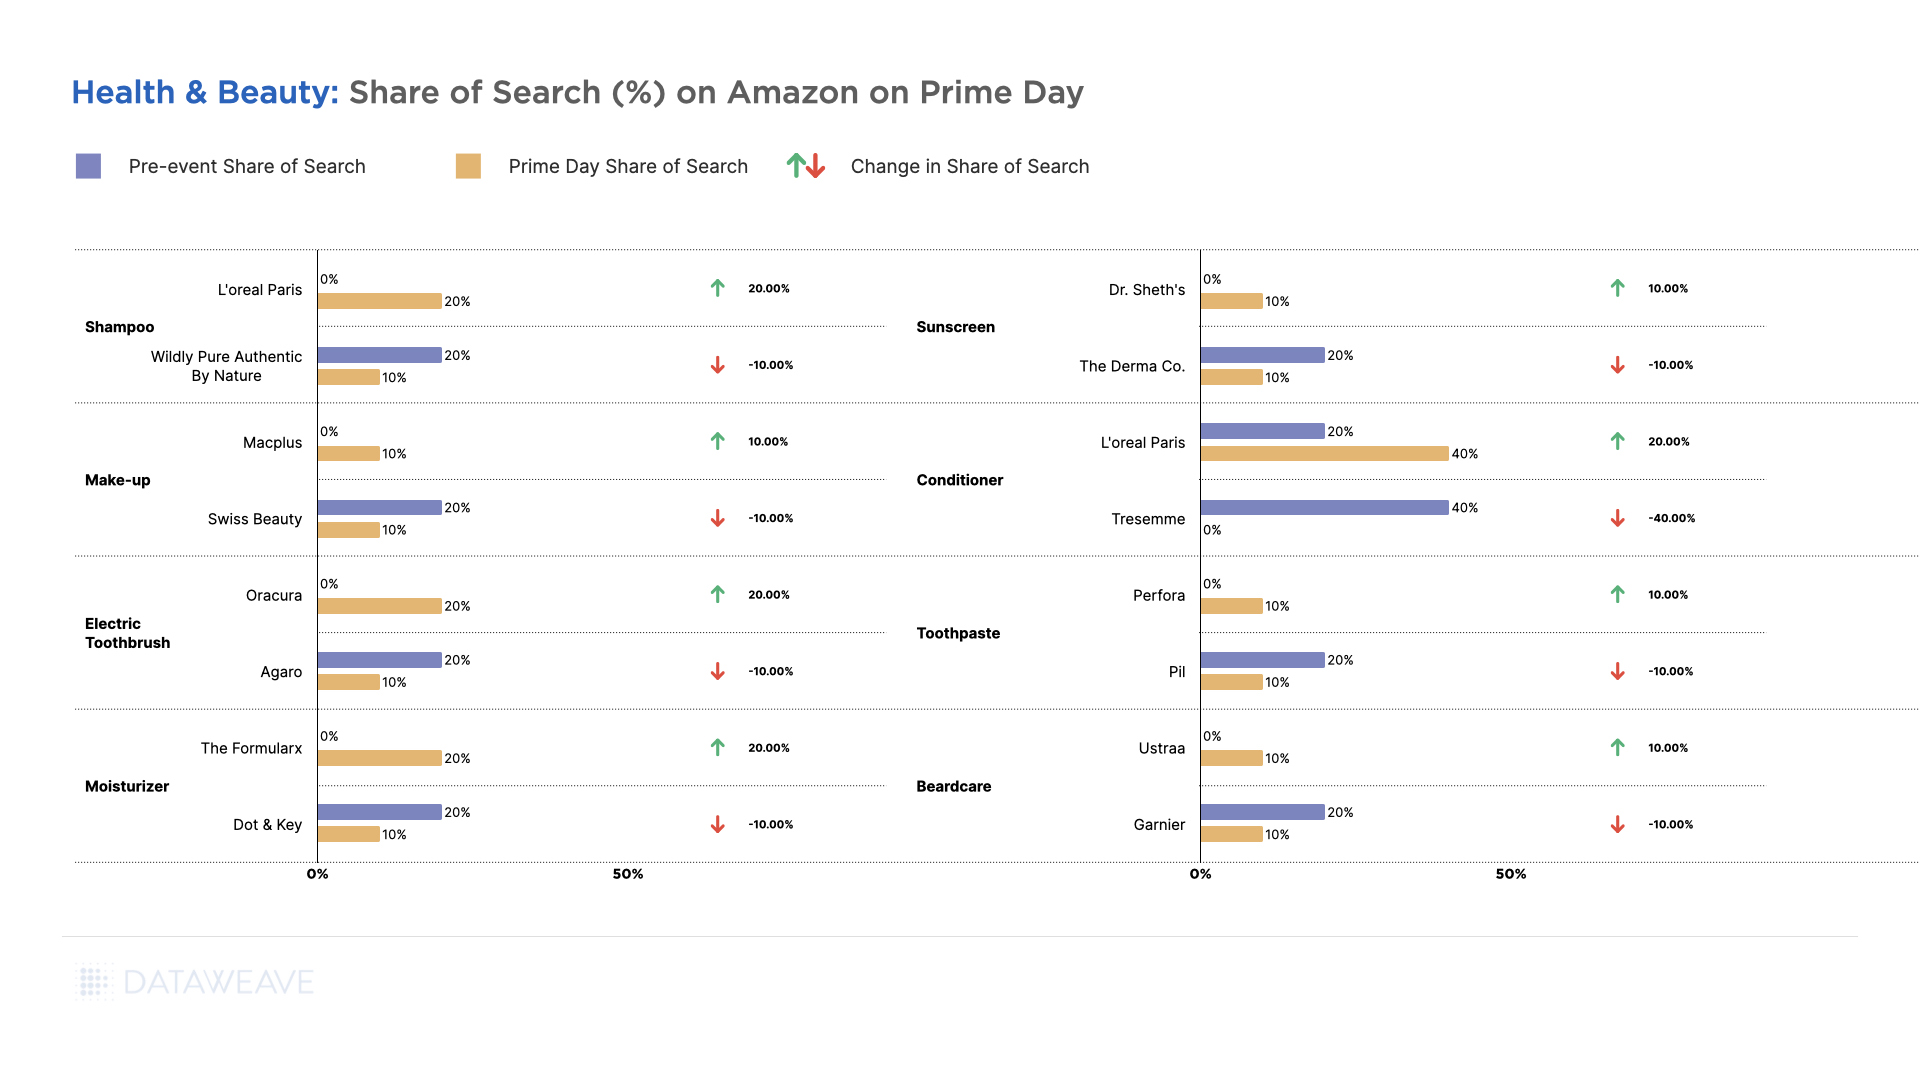
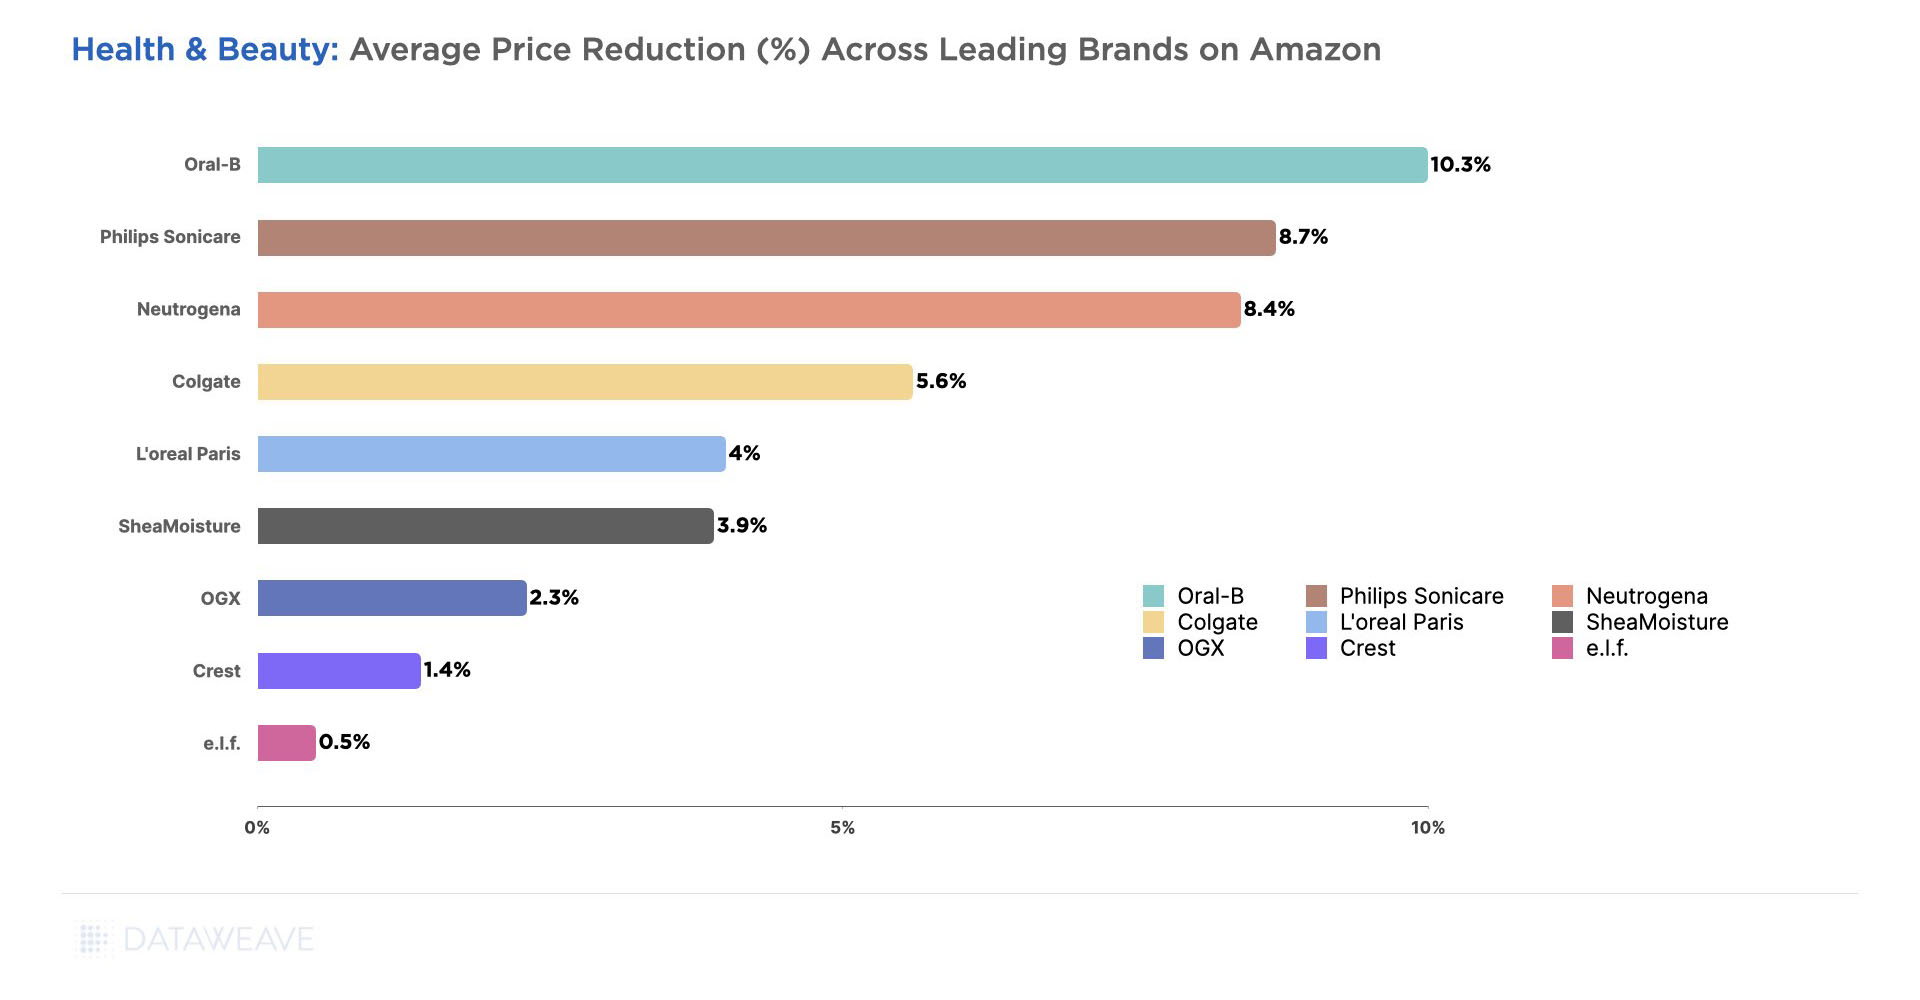
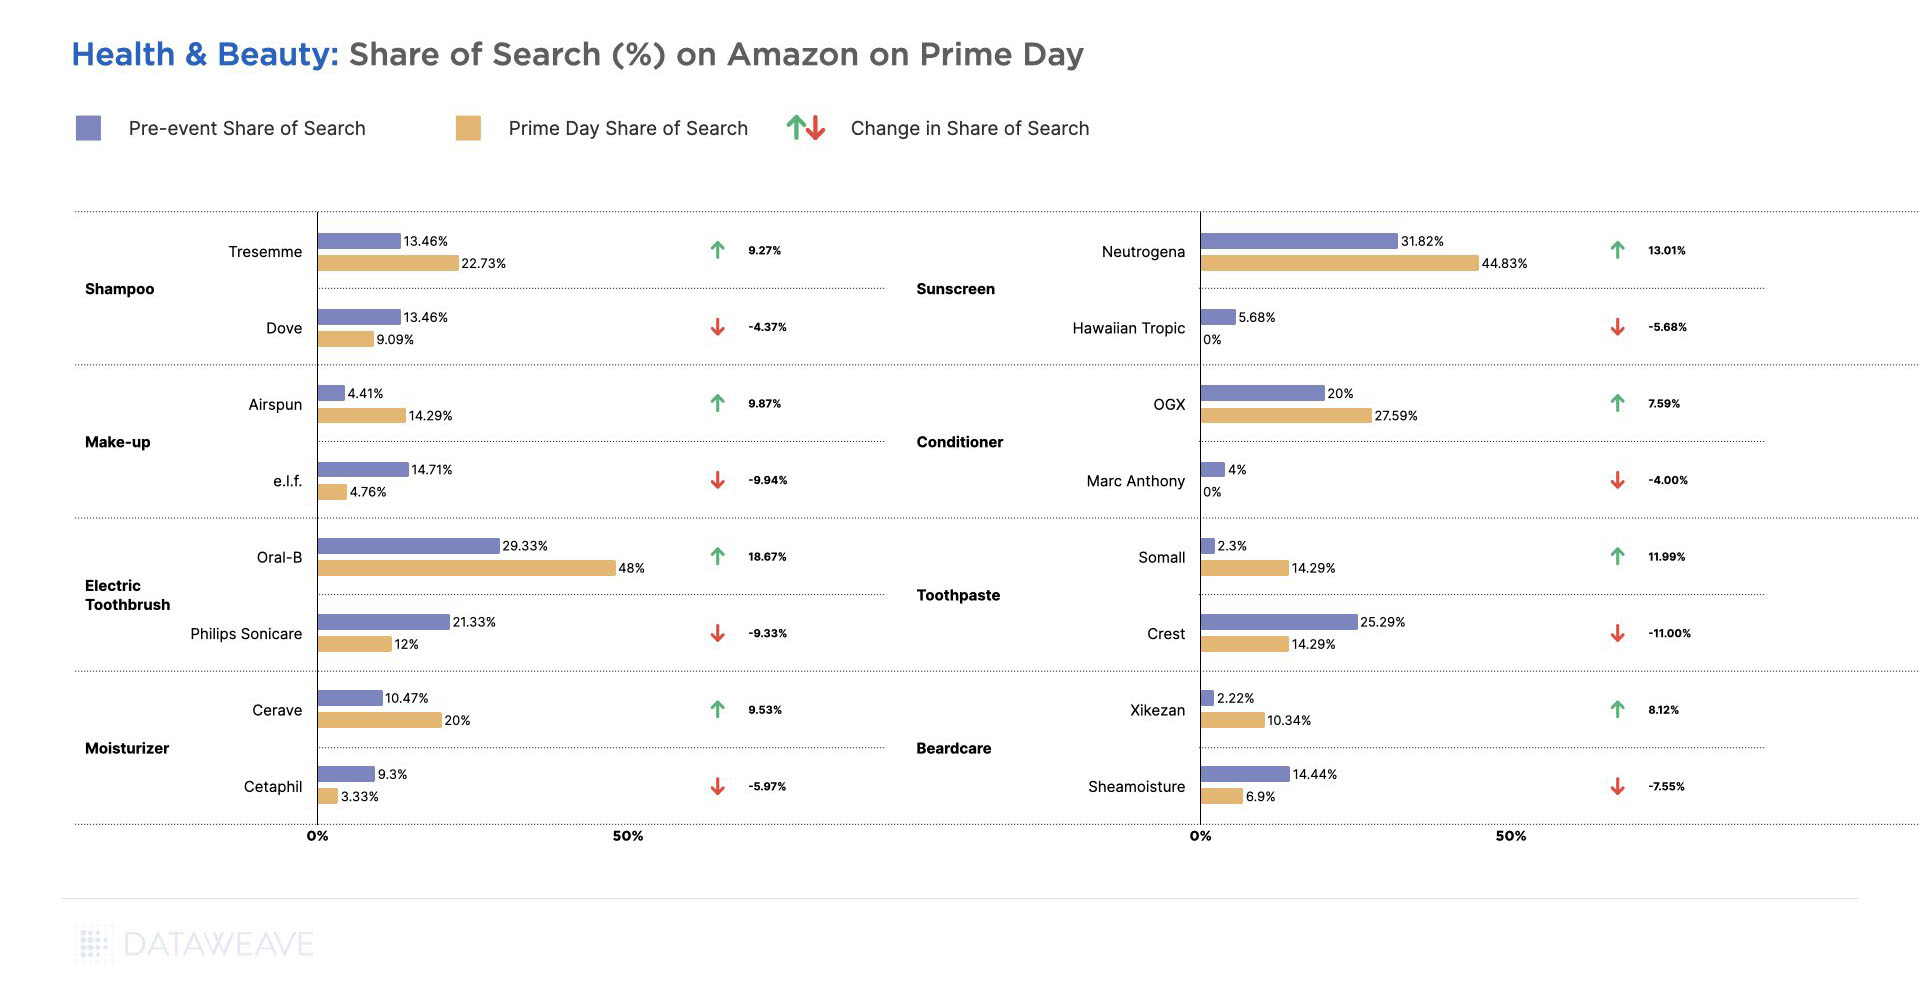
Share of Search: Brand Visibility Trends
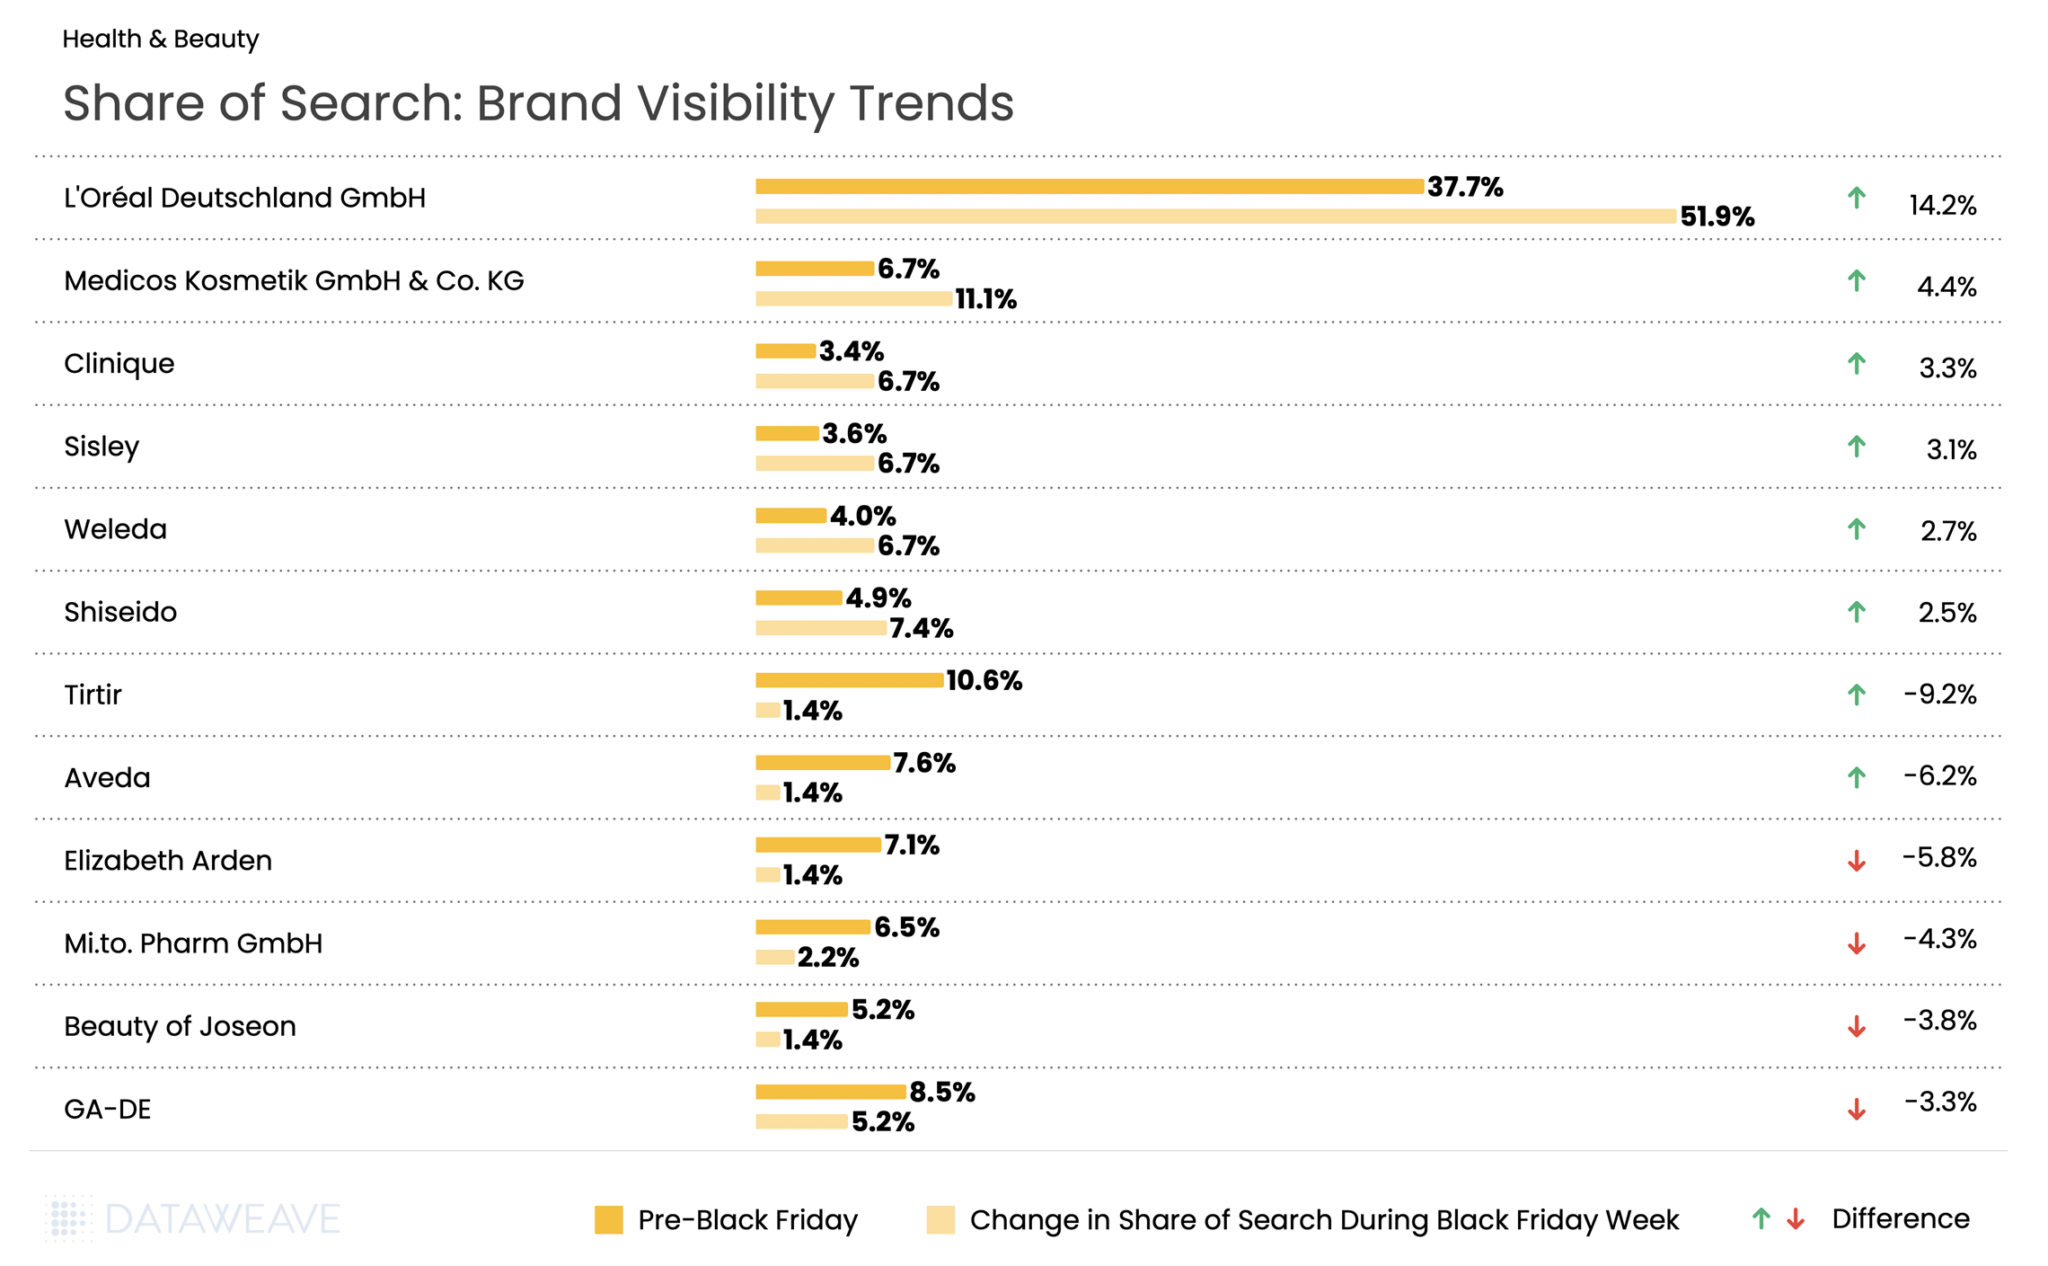
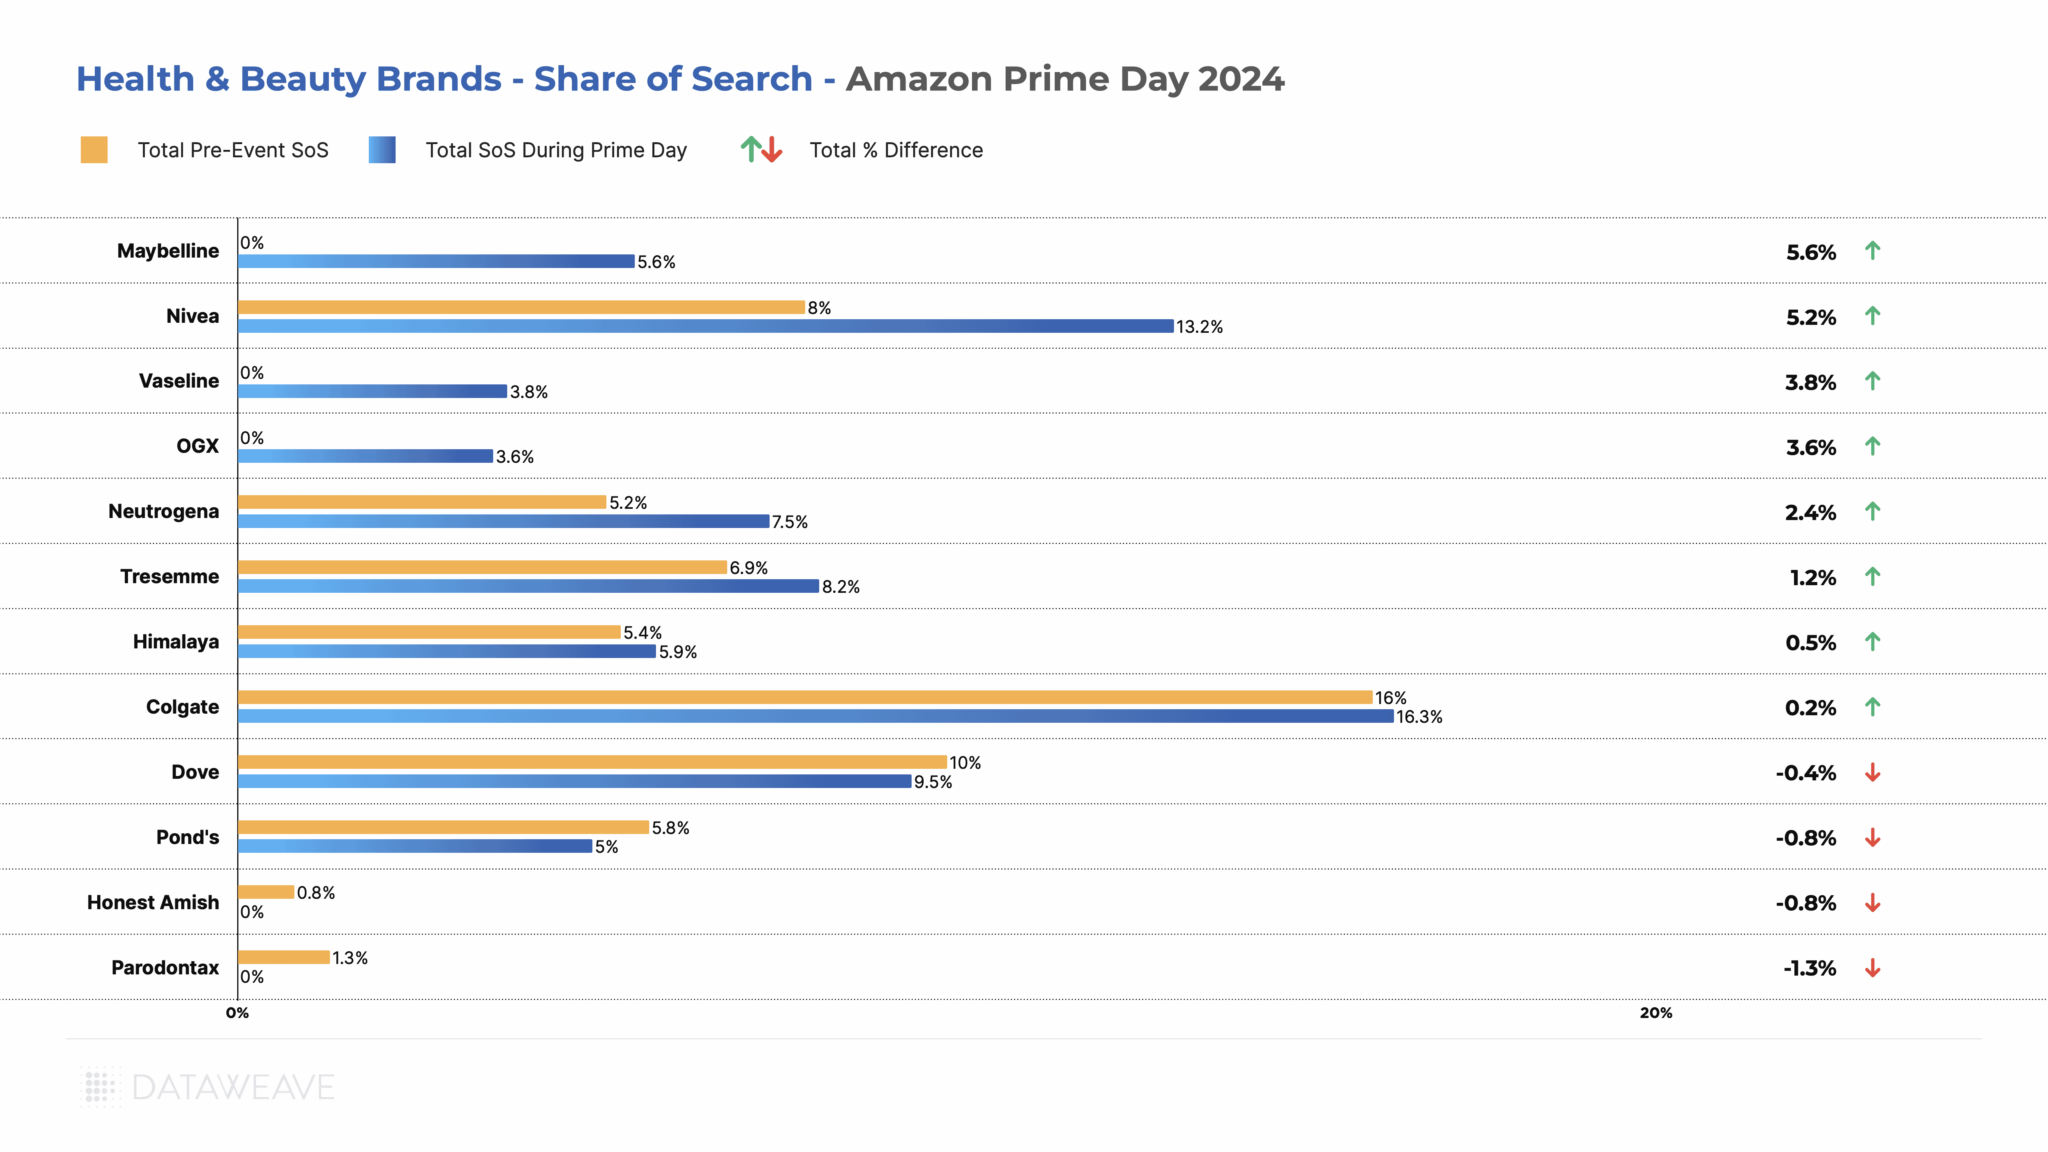
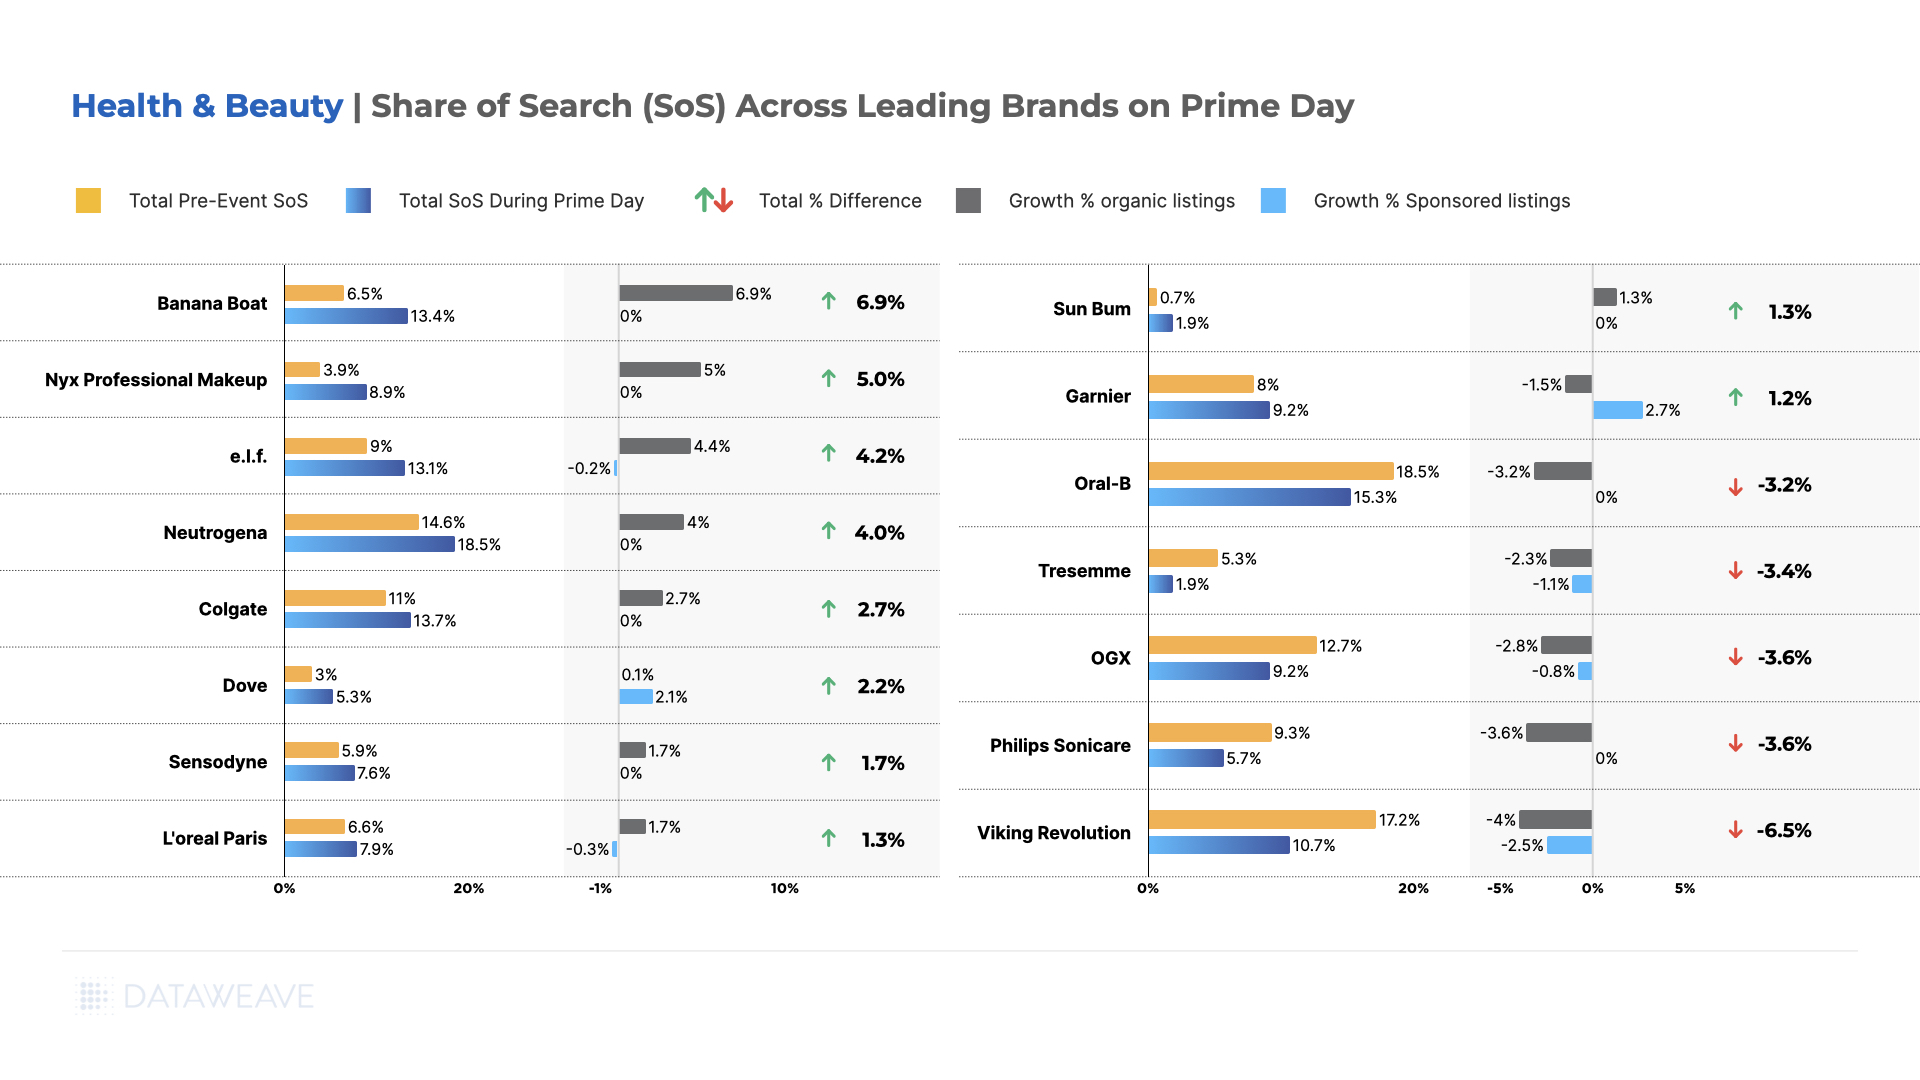
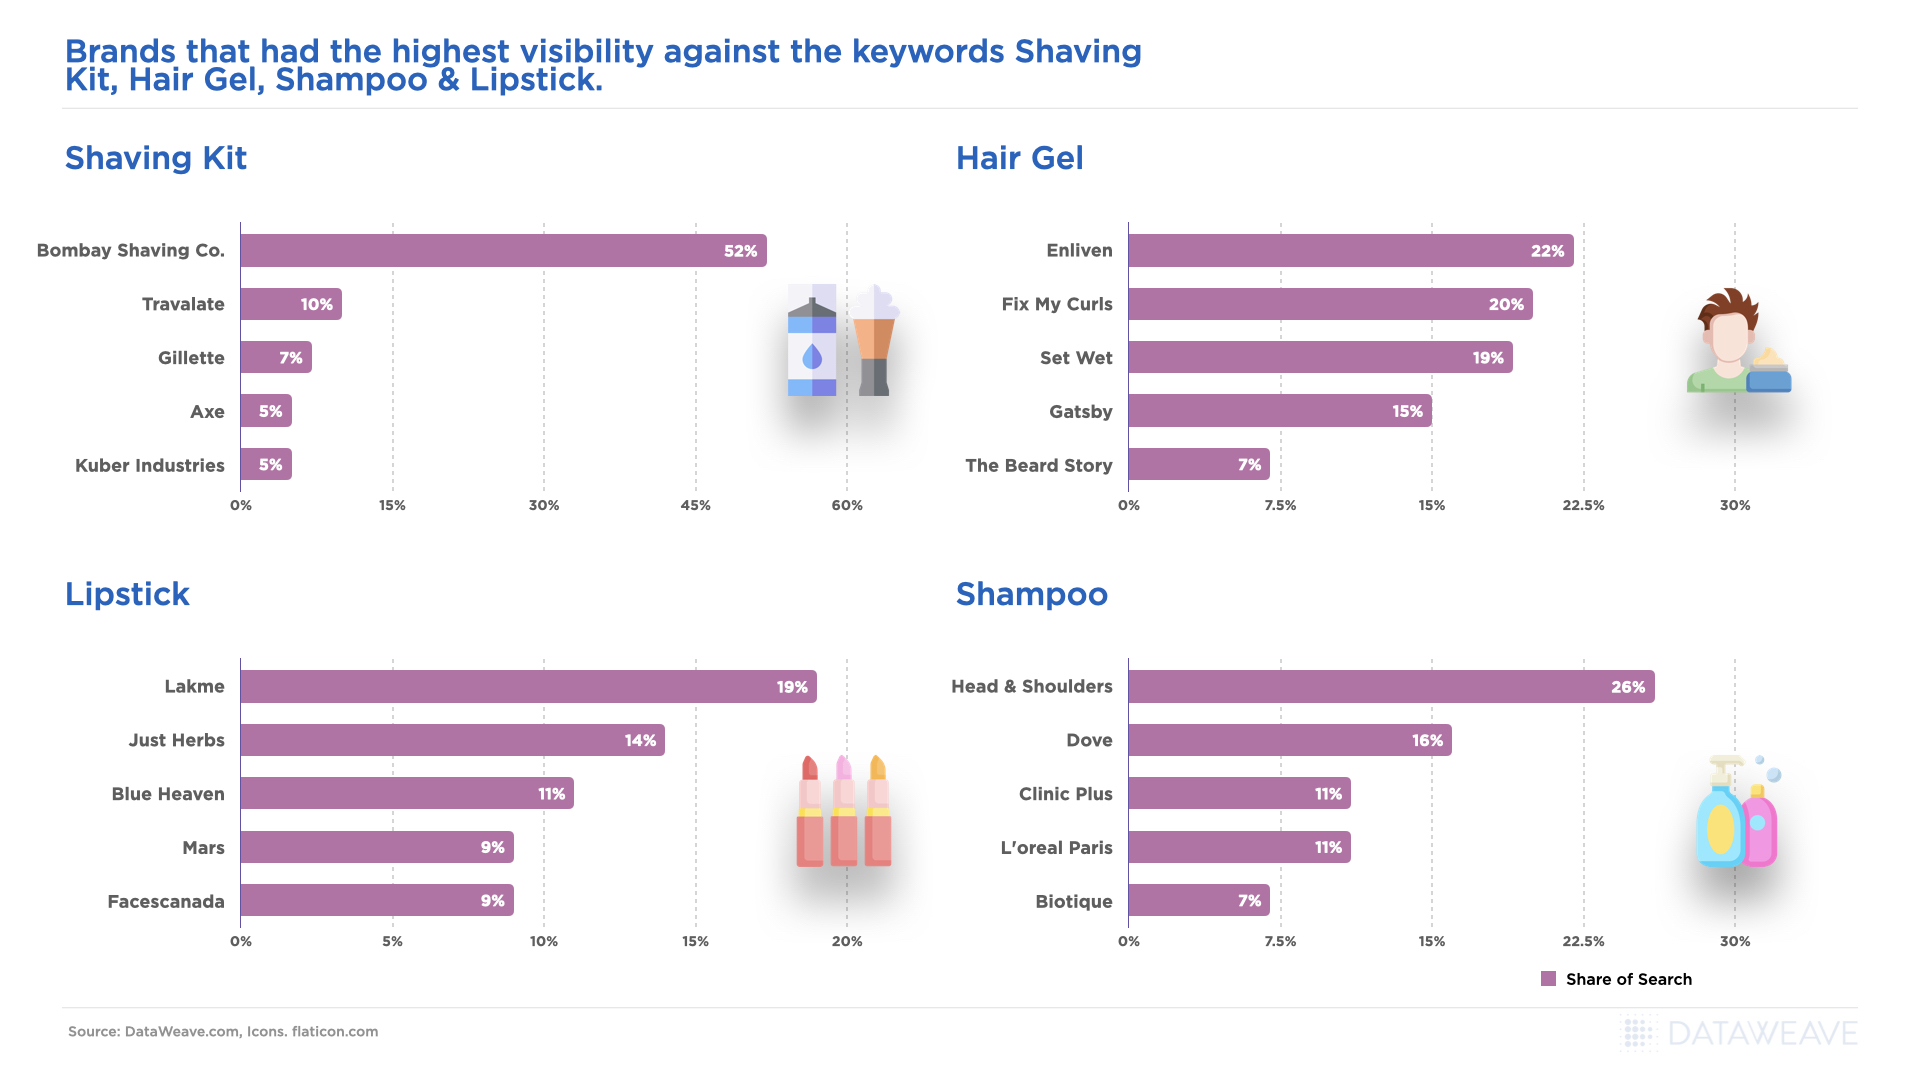
L’Oréal Deutschland GmbH emerged as the most visible brand, surging from 37.7% to 51.9%, (+14.2). German pharmaceutical cosmetics company Medicos Kosmetik GmbH & Co. KG gained 4.4 %. Clinique gained 3.3 %, and French luxury brand Sisley added 3.1 %, German natural cosmetics brand Weleda rose 2.7 %, and Japanese prestige brand Shiseido gained 2.5 %.
The flip side? K-beauty brands and some international names faced significant challenges. Viral make-up brand Tirtir experienced the steepest decline visibility, dropping by 9.2 %. Aveda fell 6.2 %, Elizabeth Arden dropped 5.8 %, and Beauty of Joseon declined 3.8 %. German pharmacy brand Mi.to. Pharm GmbH lost 4.3 %, while Israeli makeup brand GA-DE fell 3.3 %.
The data reveals a clear German preference for European beauty heritage, pharmaceutical-grade cosmetics, and established prestige brands during Black Friday, rather than trendy K-beauty products or mid-tier international brands.
Grocery
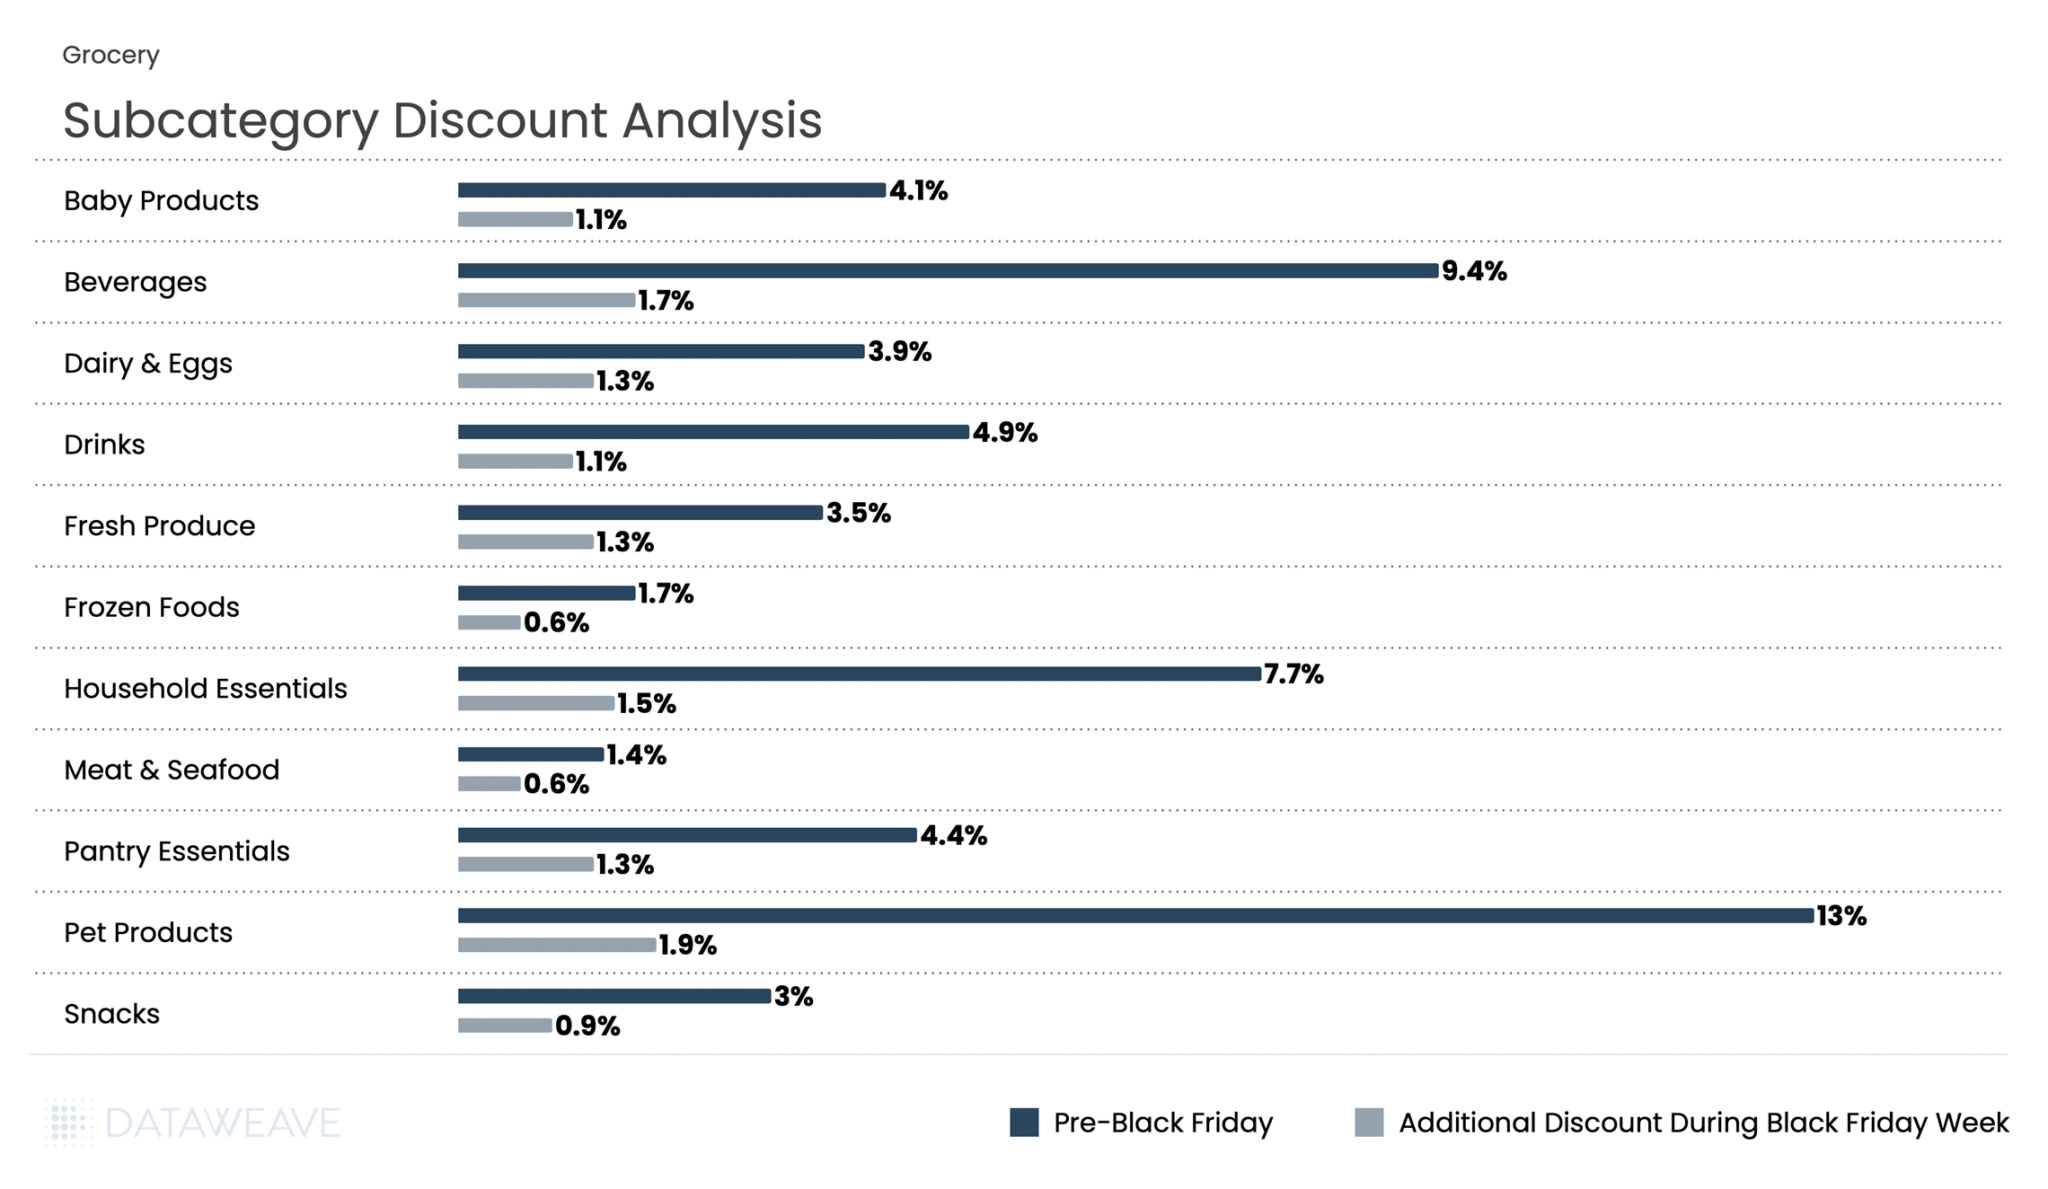
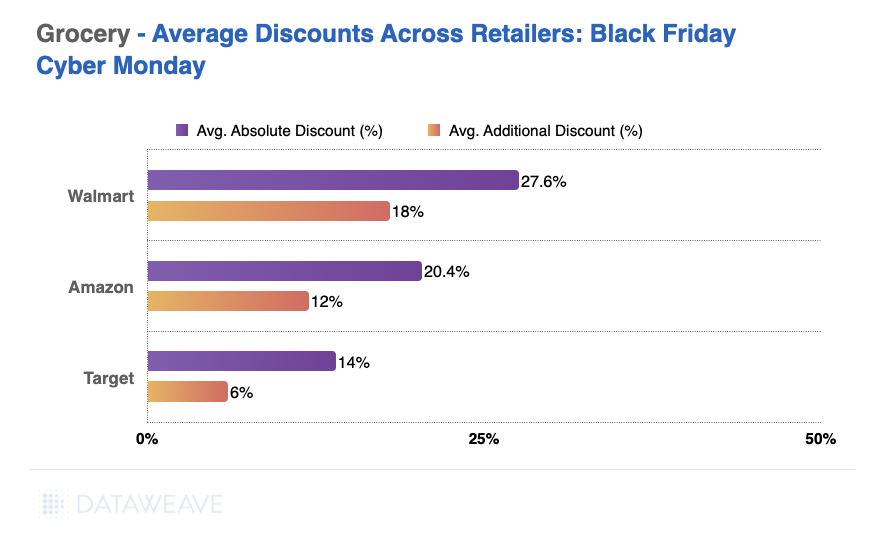
While Grocery typically sees more modest discounts compared to discretionary categories, the German market showed interesting patterns with Black Friday Week discounts (3.5%) actually exceeding Pre-Black Friday levels (2.6%). Our analysis of 4,378 SKUs shows how German retailers approached promotions across essential and indulgent subcategories.
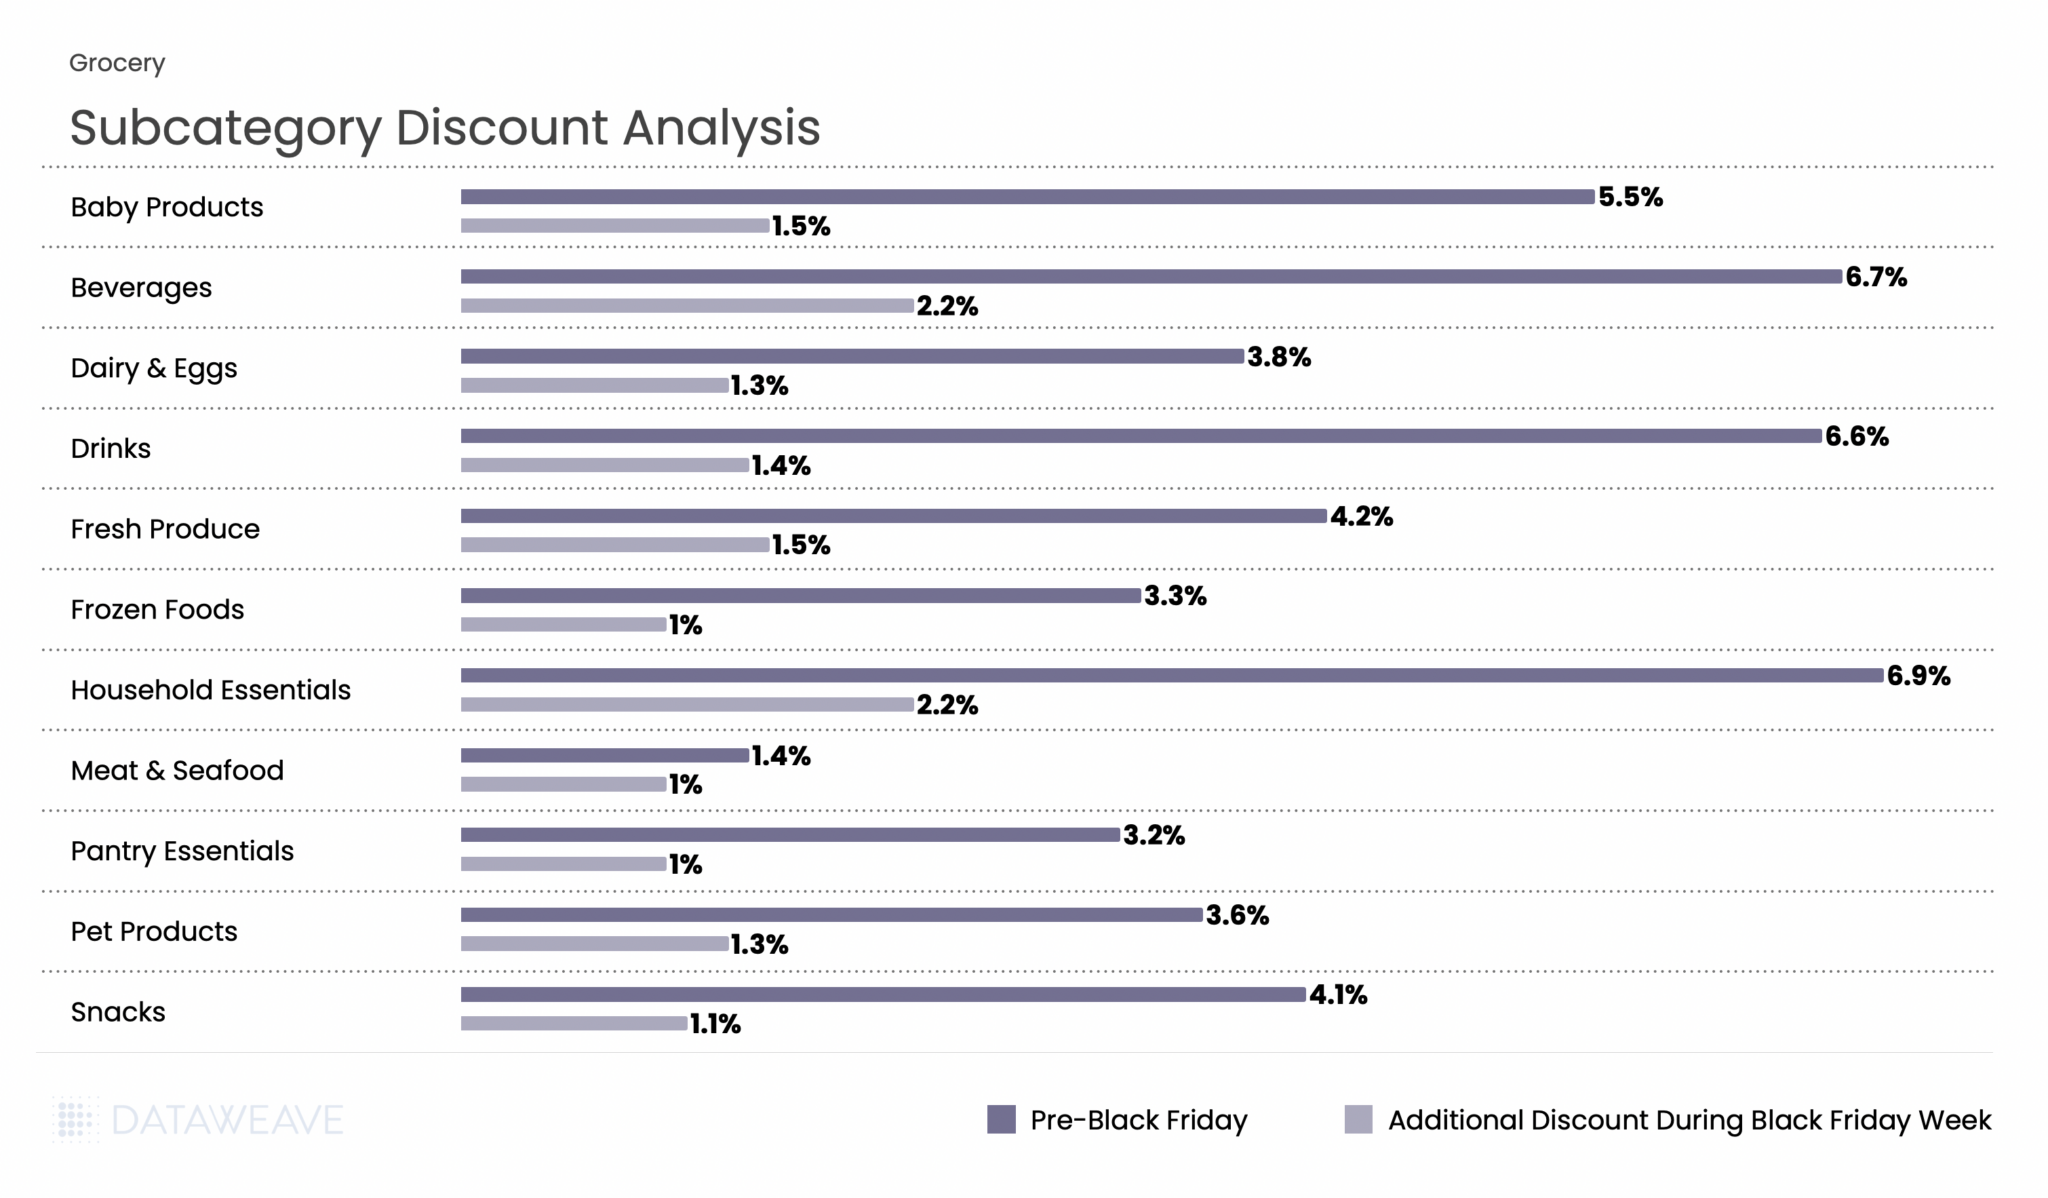
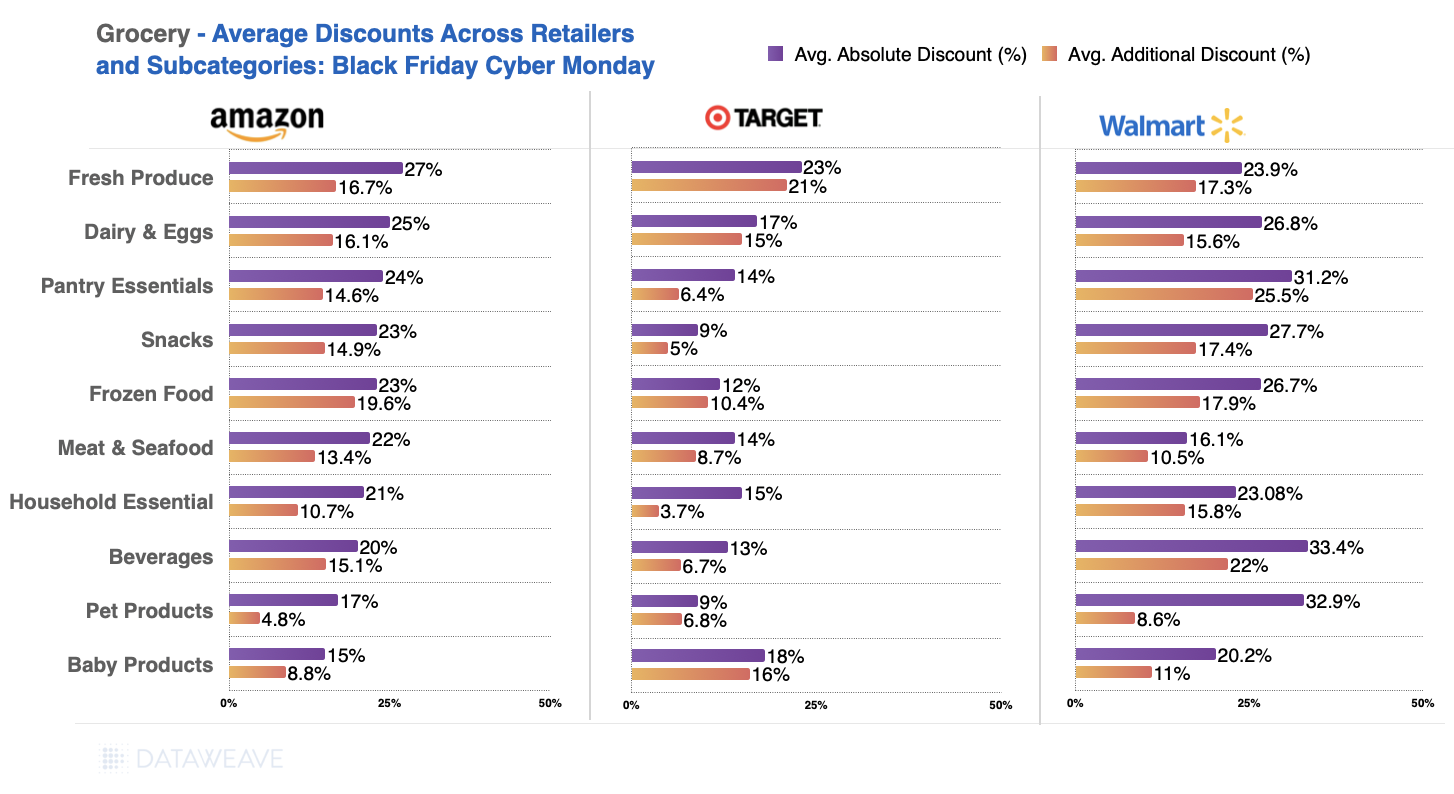
Subcategory Discount Analysis
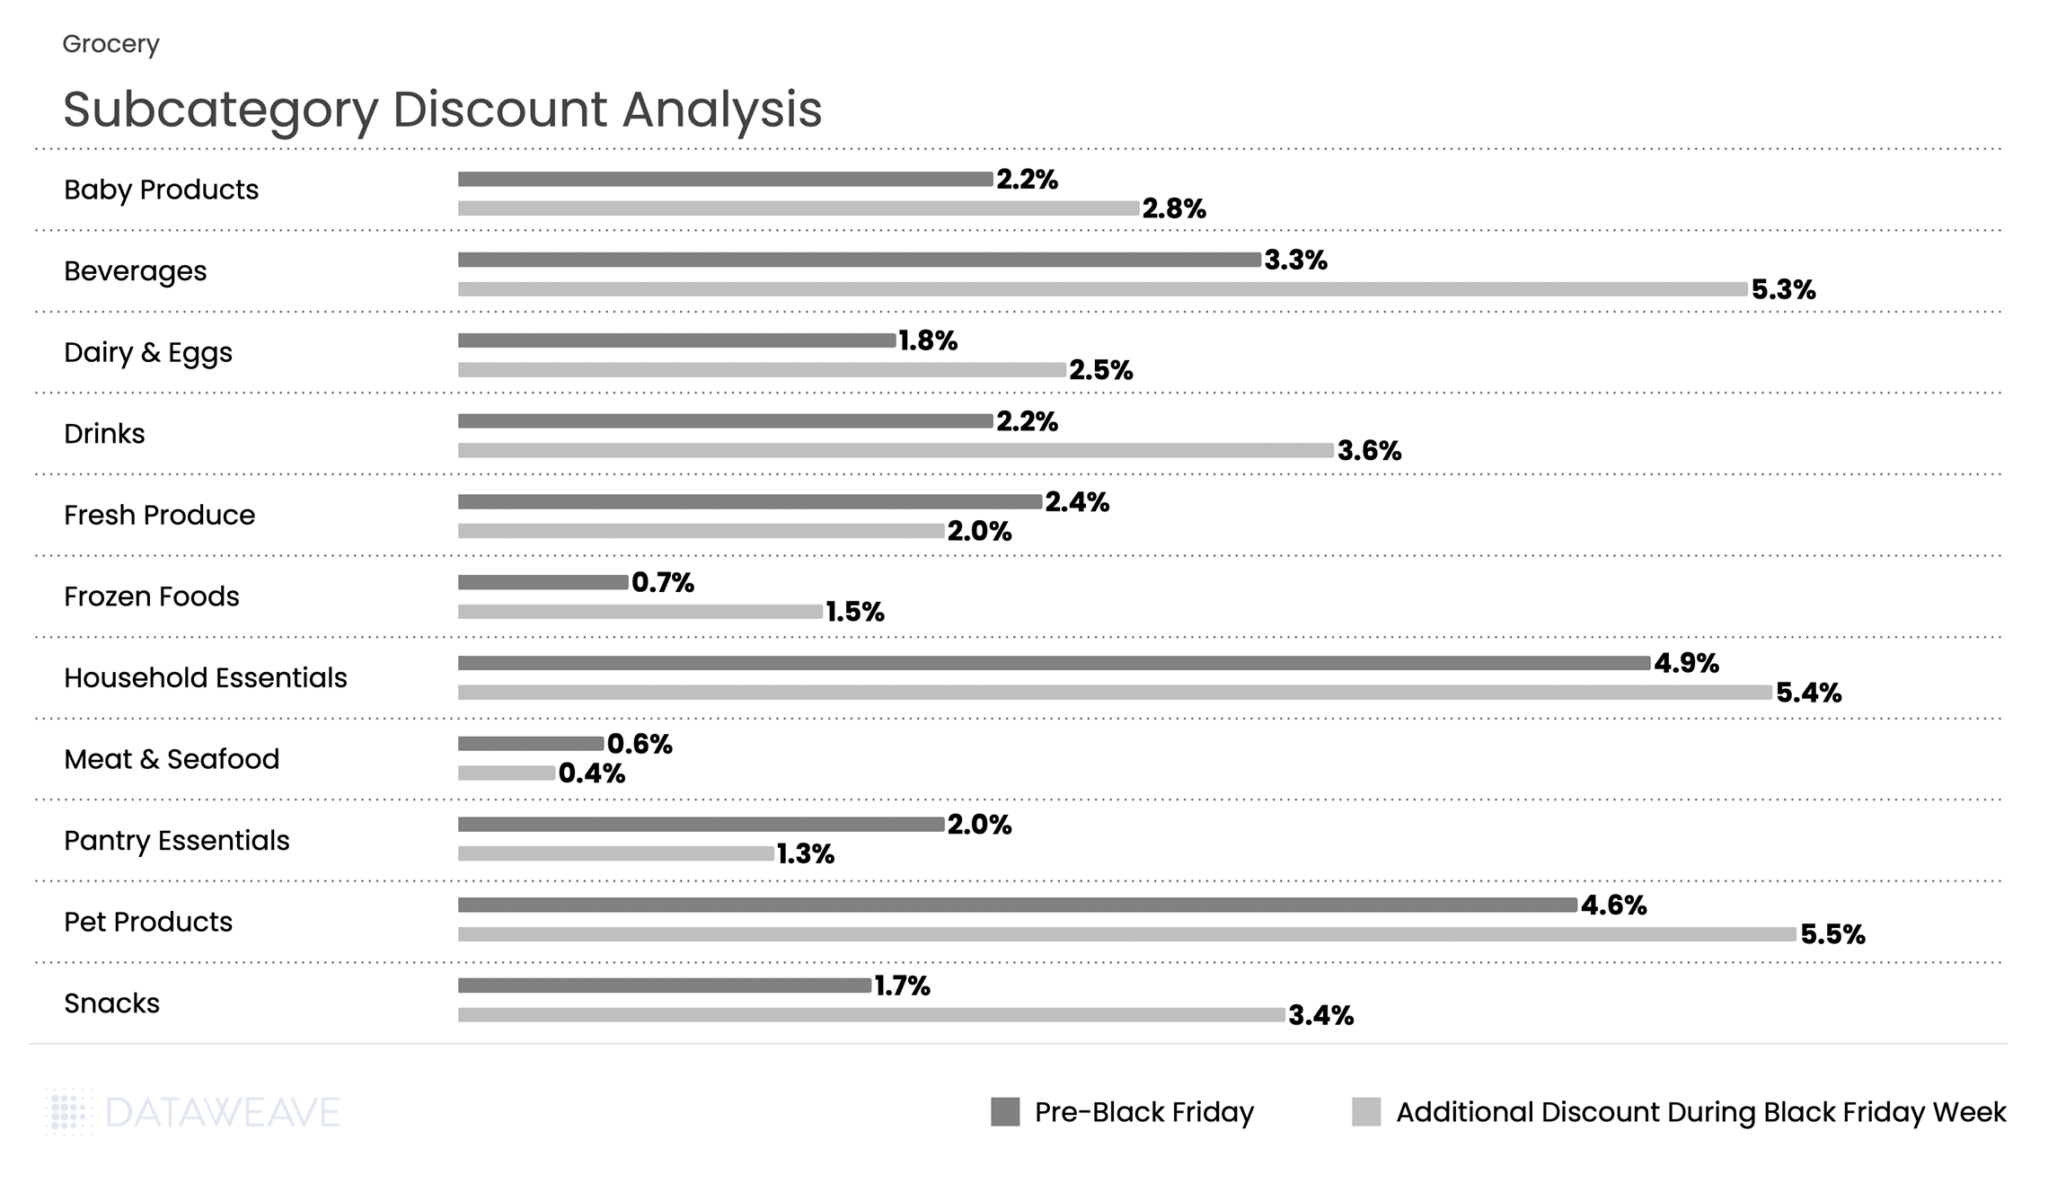
Pre-Black Friday discounts averaged just 2.6% in grocery. But Black Friday Week saw this surging to 3.5%, an increase that represents the highest proportional jump among all categories.
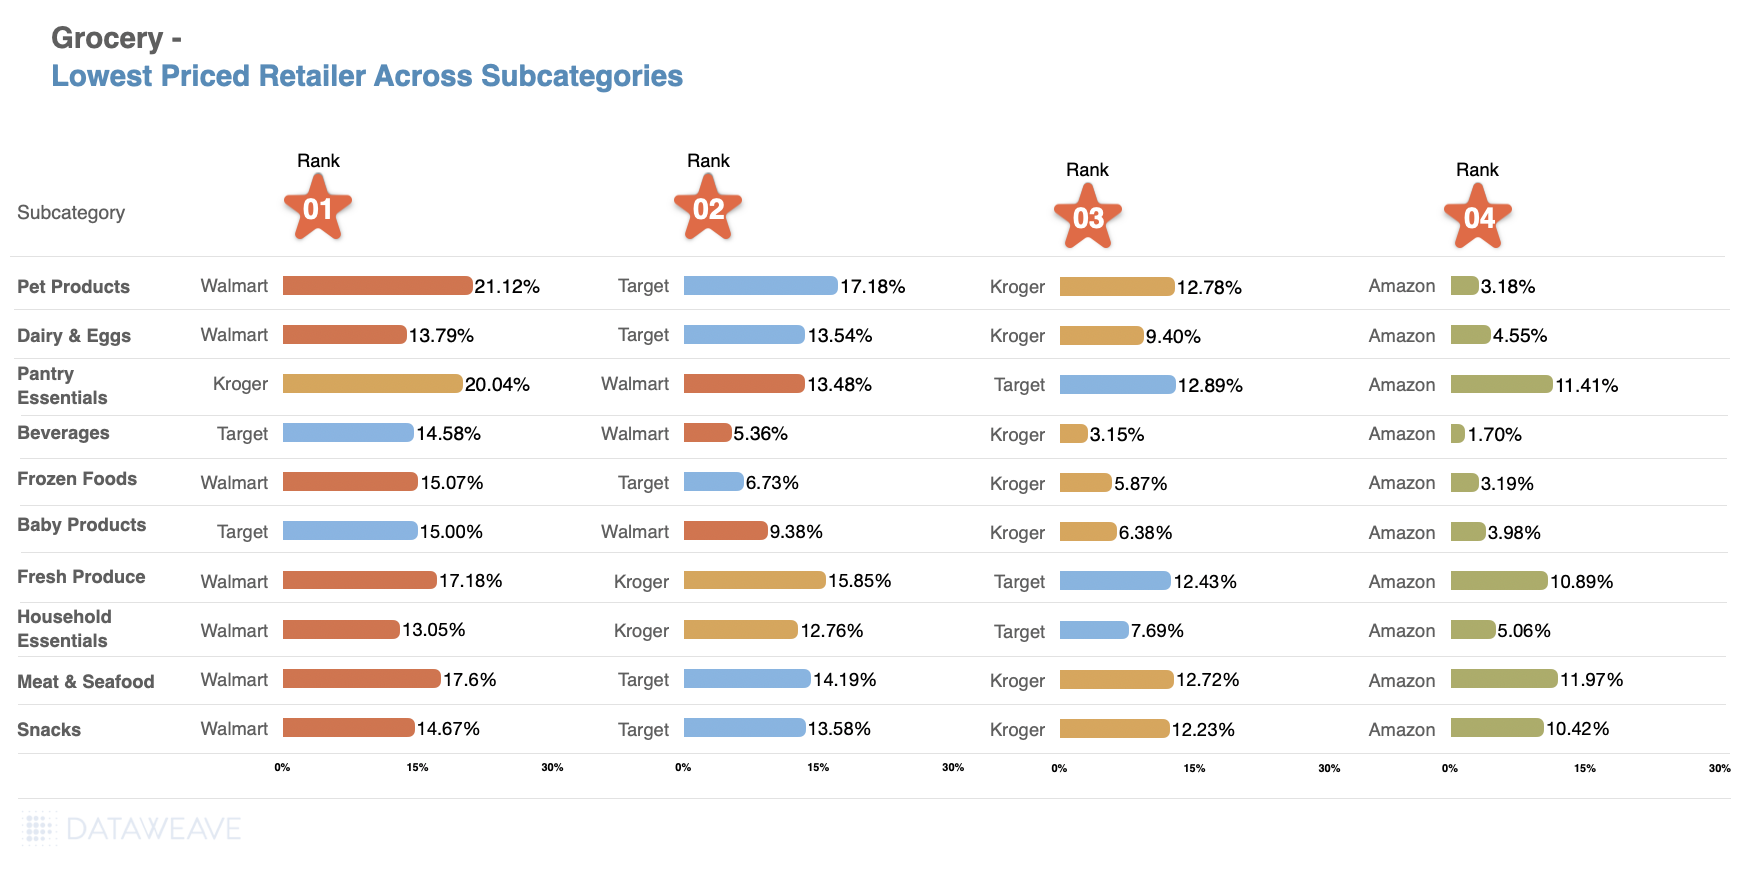
Pet Products and Household Essentials led discounting, with Pet Products at 4.6% pre-sale and an additional 5.5% during Black Friday Week. Meanwhile Household Essentials registered 4.9% and 5.4% respectively.
Beverages showed particularly strong Black Friday Week performance, jumping from 3.3% to 5.3%, while snacks doubled from 1.7% to 3.4%. Fresh categories maintained minimal promotional activity consistent with perishable inventory constraints: Meat & Seafood saw negligible discounts (0.6% pre-sale, 0.4% Black Friday Week), while Fresh Produce actually decreased from 2.4% to 2% during the main event.
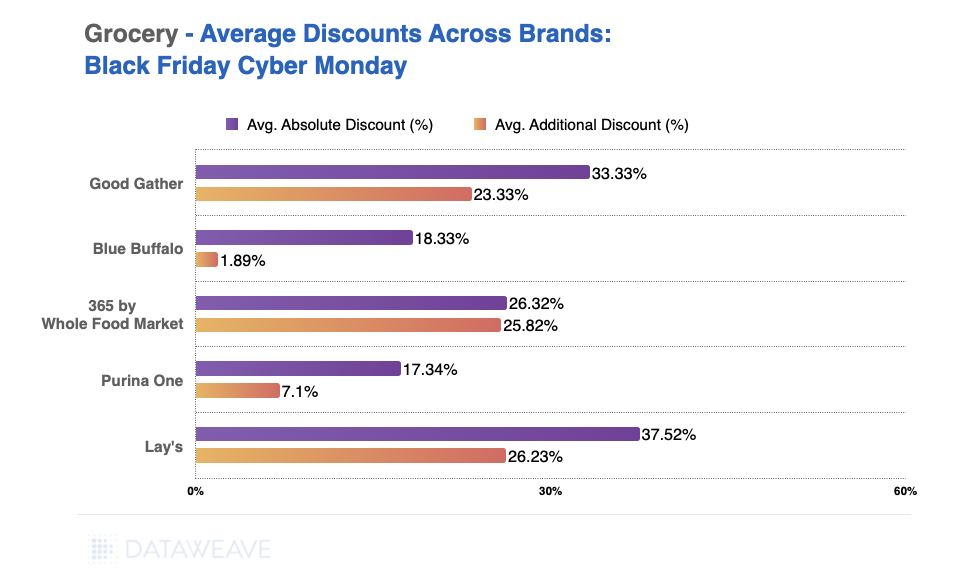
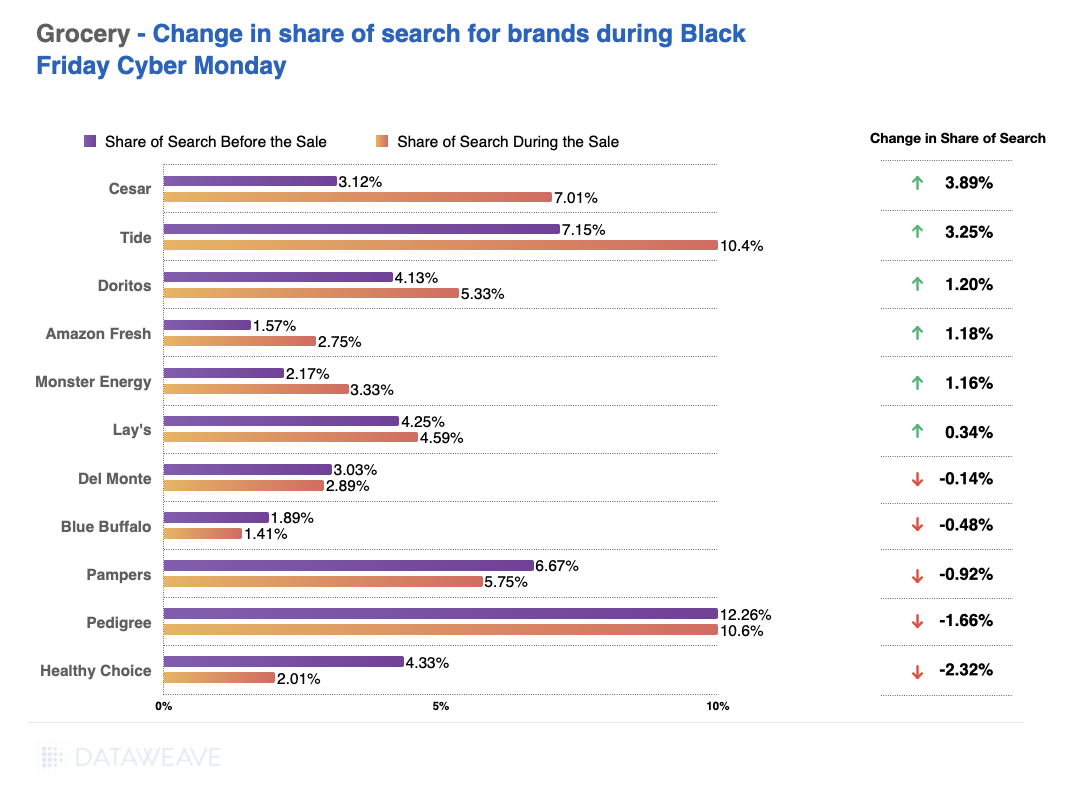
Share of Search: Brand Visibility Trends
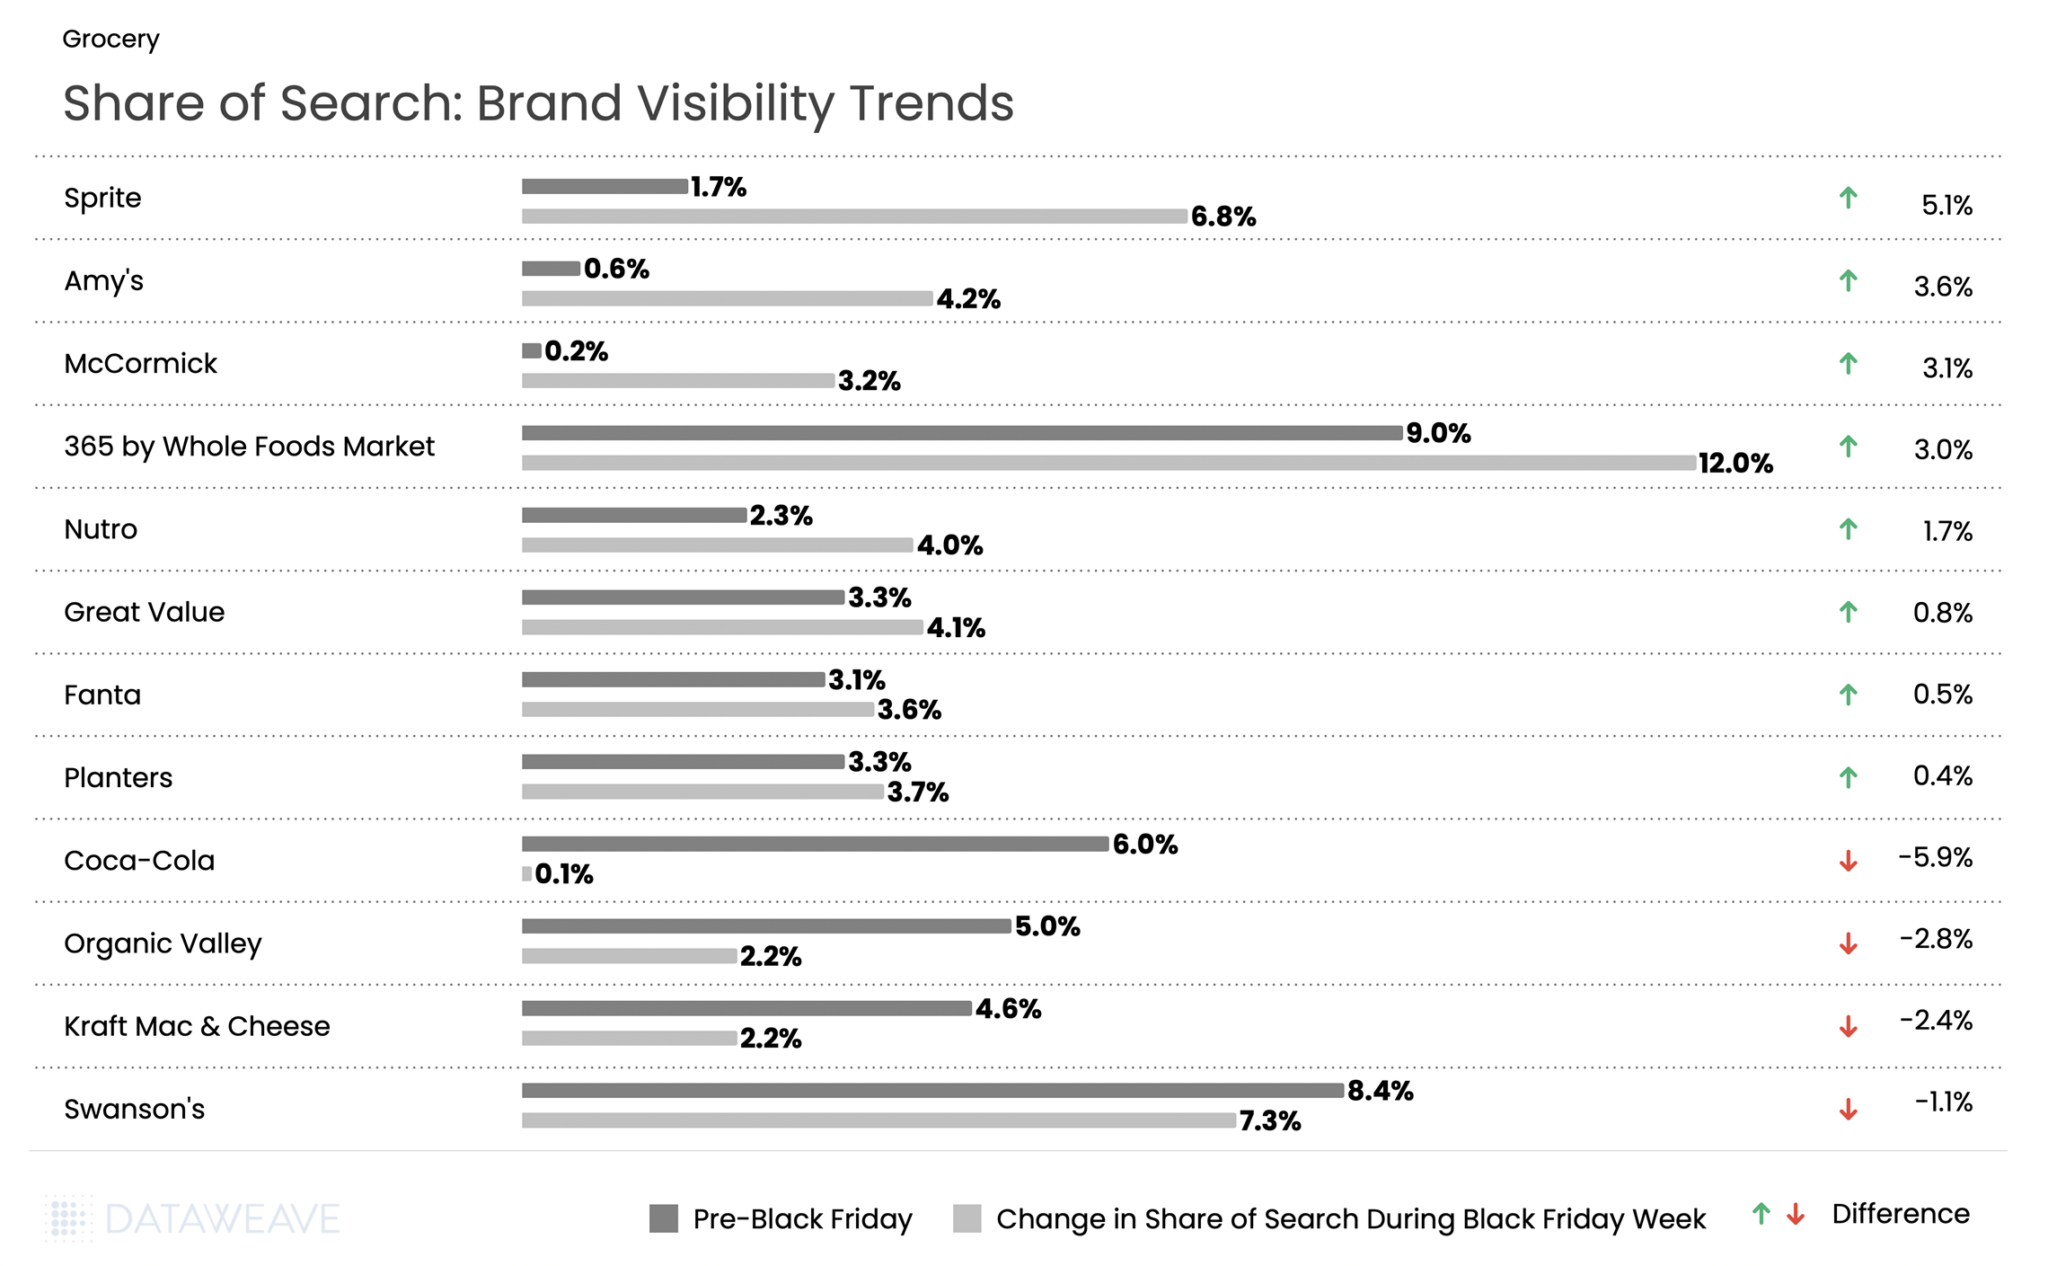
365 by Whole Foods saw the highest share of search at 9% pre event and 12% during Black Friday week. But Sprite led all brands with a 5.1% surge in share of search. Meanwhile, sister brand Coca-Cola experienced one of the steepest declines in our analysis, with visibility plummeting from 6.0% to just 0.1%. Fanta maintained modest search growth at 0.5 %. This stark divergence between two brands from the same parent company suggests vastly different promotional strategies during Black Friday Week.
Specialty and organic food brands performed well: Amy’s (organic/natural foods) gained 3.6 %, while spice brand McCormick surged 3.1 %. Pet food brand Nutro gained 1.7 %, while value-oriented Great Value added 0.8 %.
Snack brand Planters gained 0.4 %. On the decline side, Organic Valley dropped 2.8 %, Kraft Mac & Cheese fell 2.4 %, and Swanson’s declined 1.1 %.
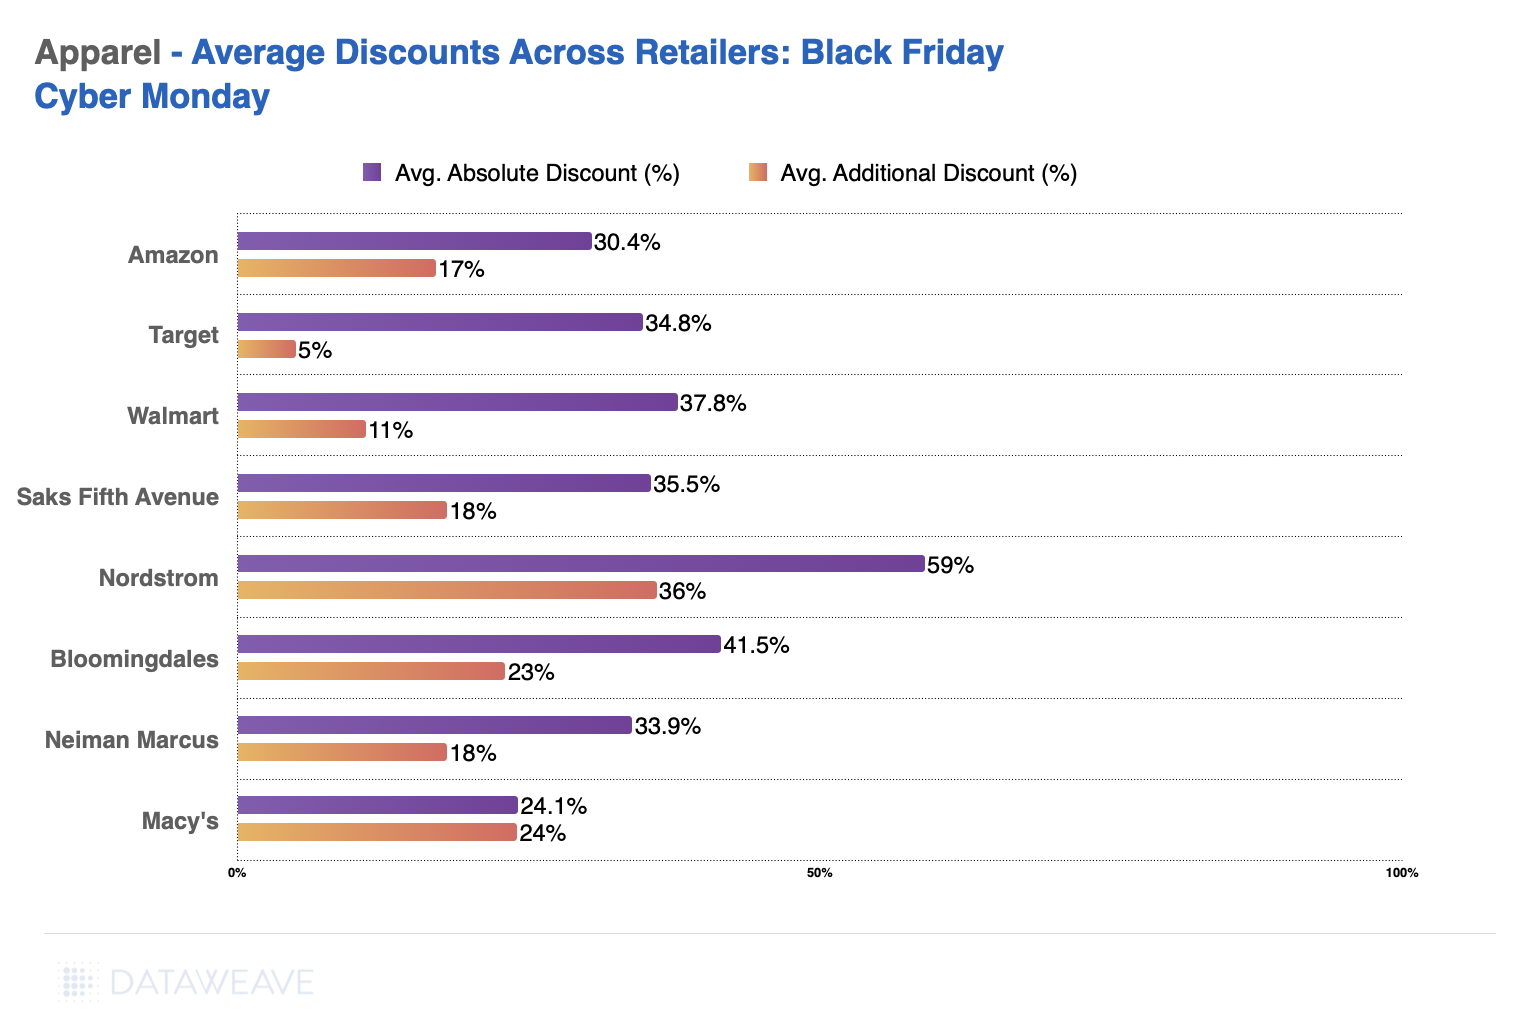
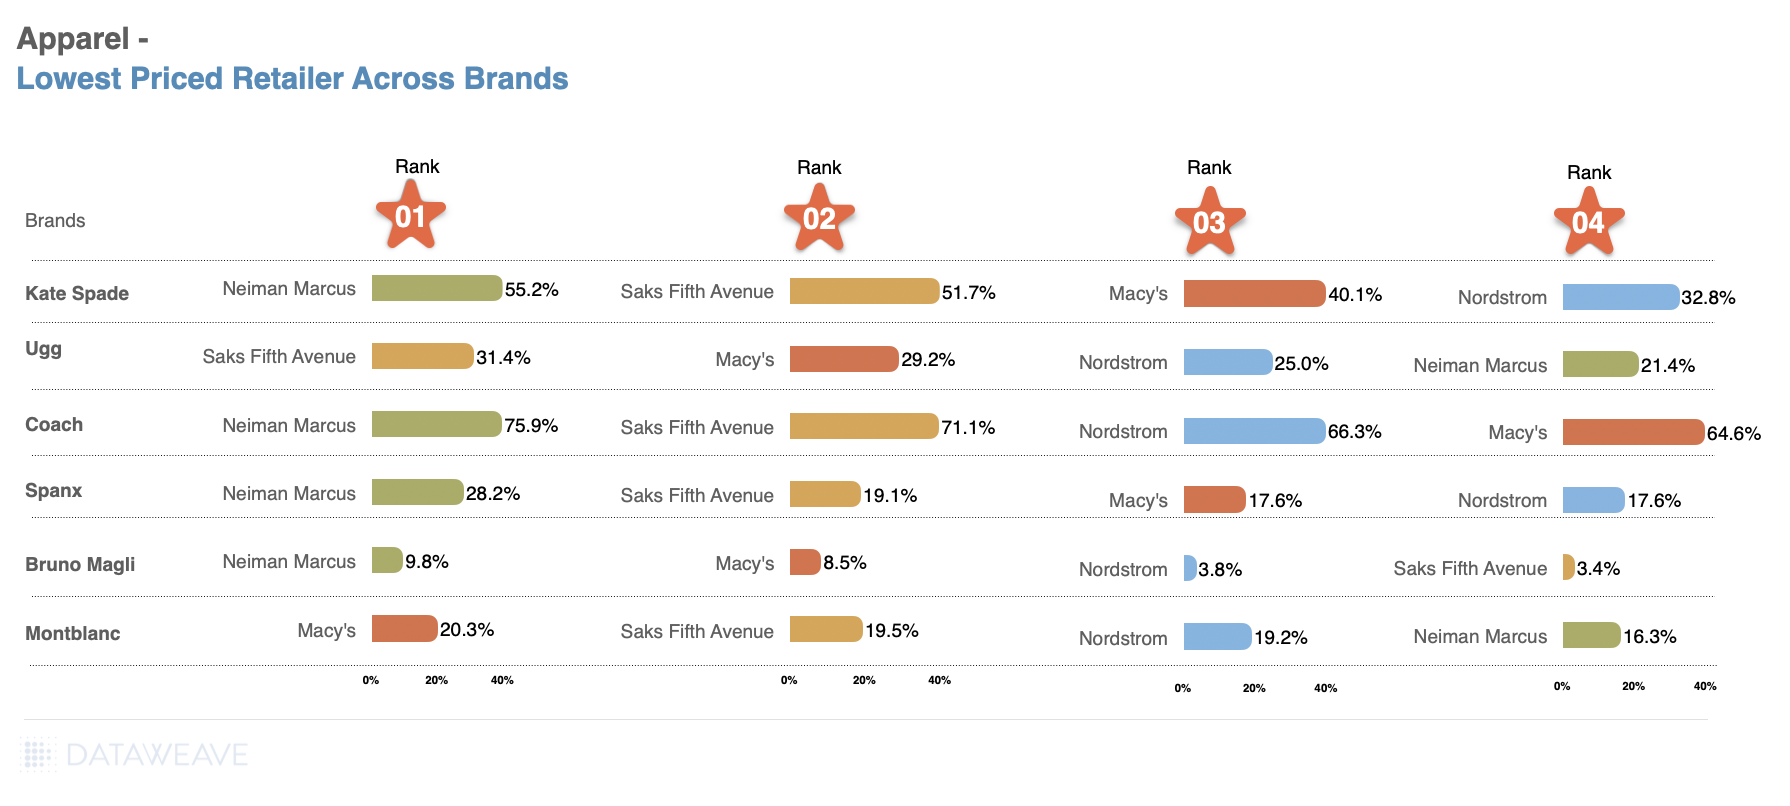
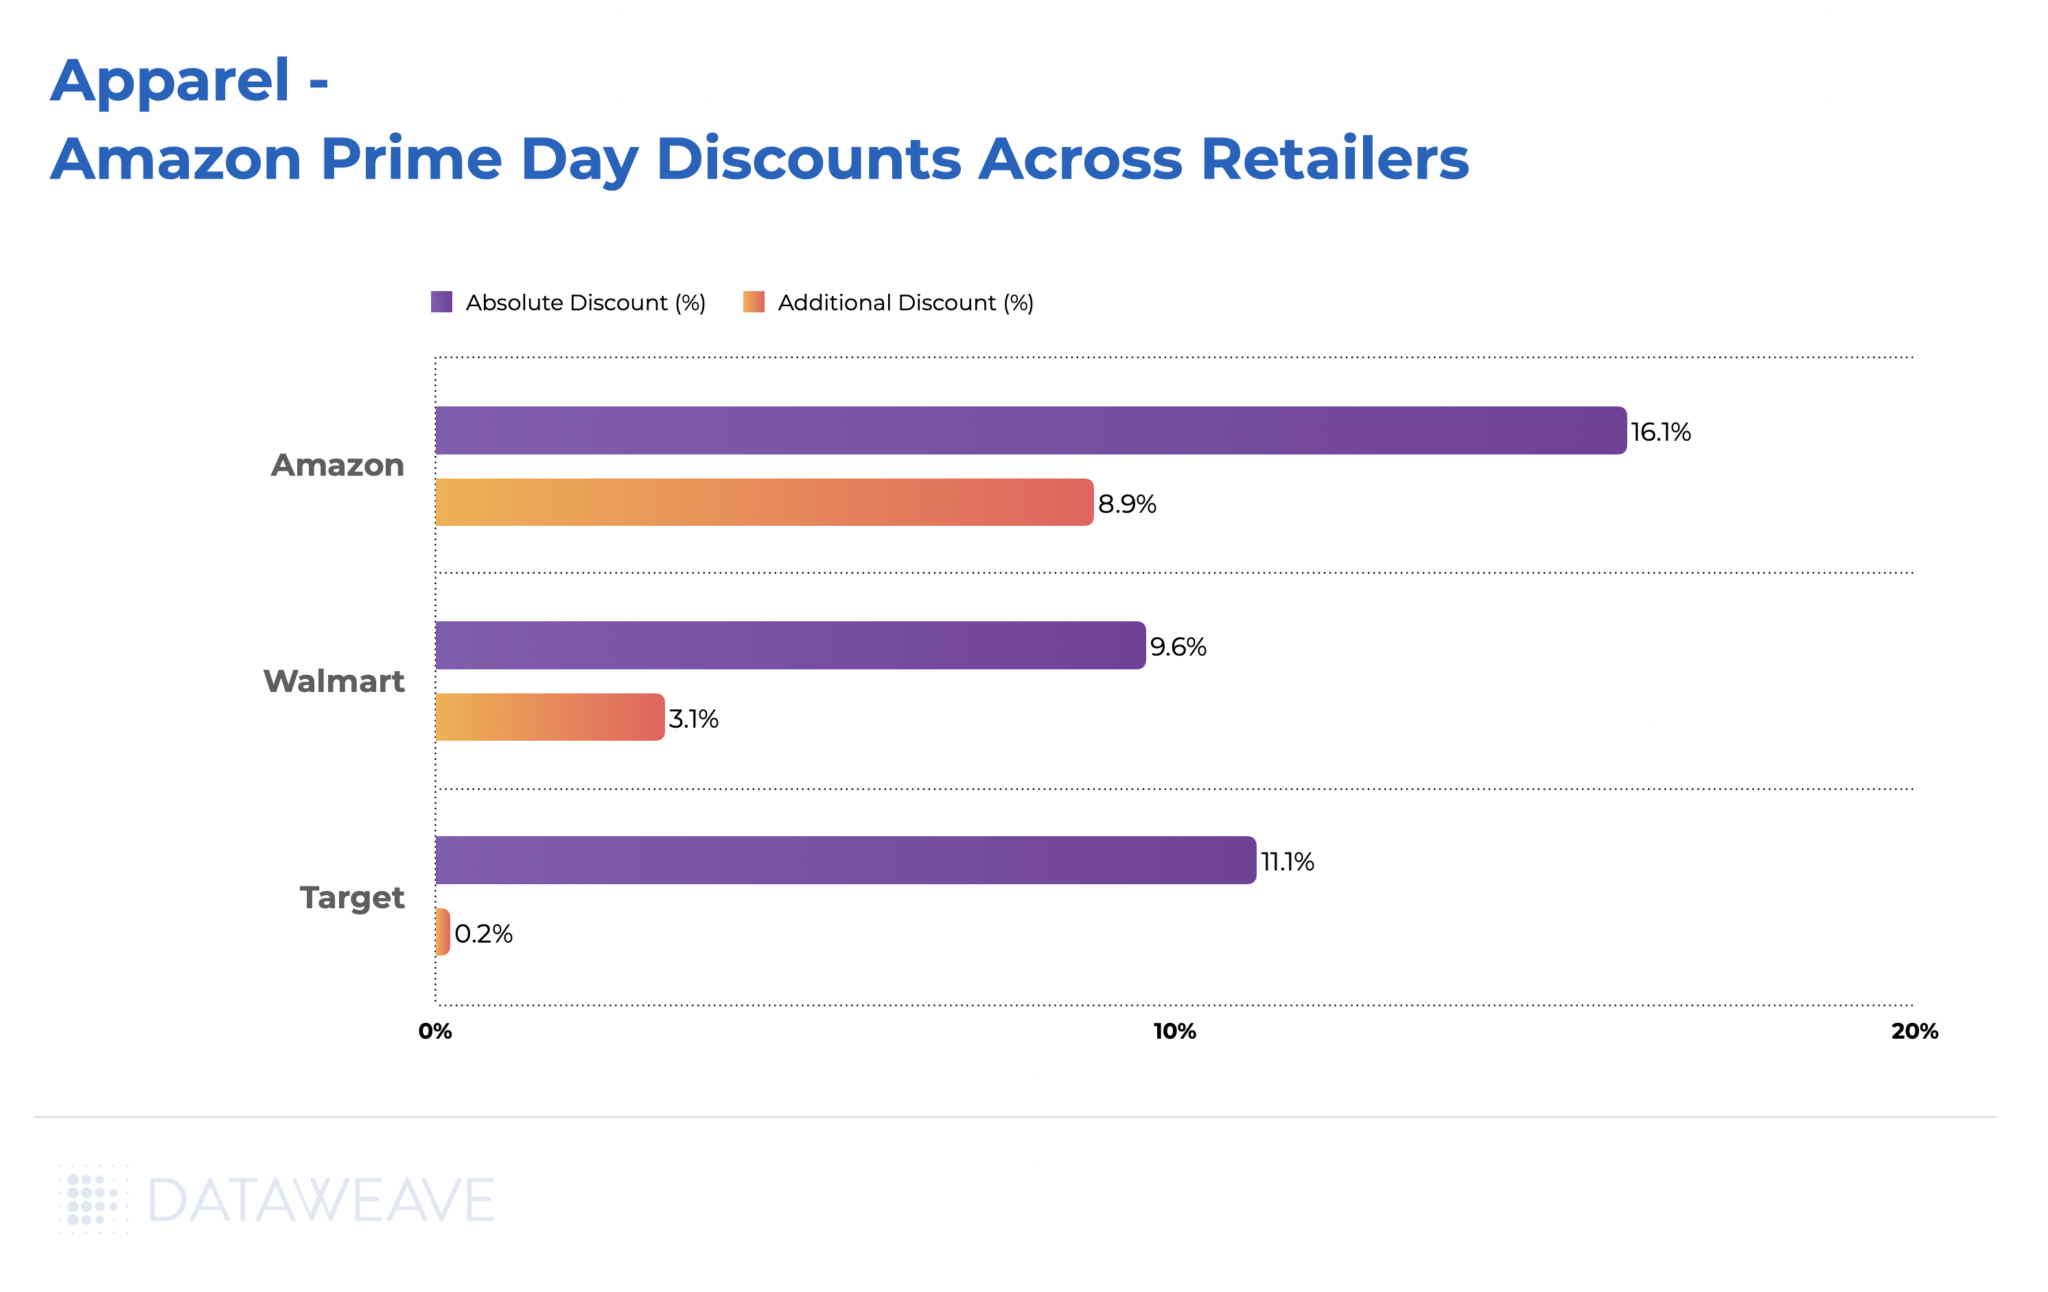
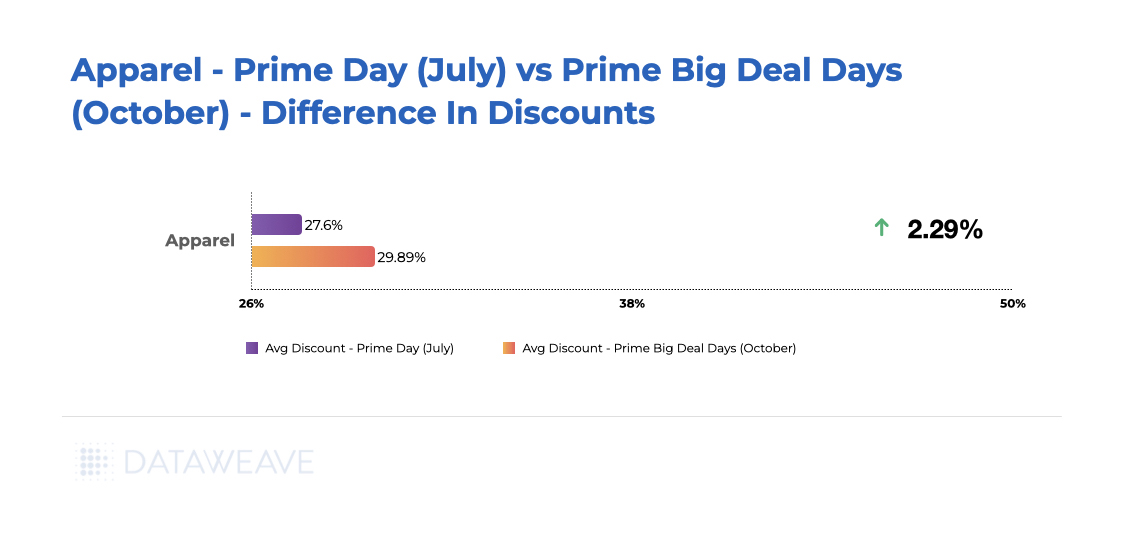
Apparel
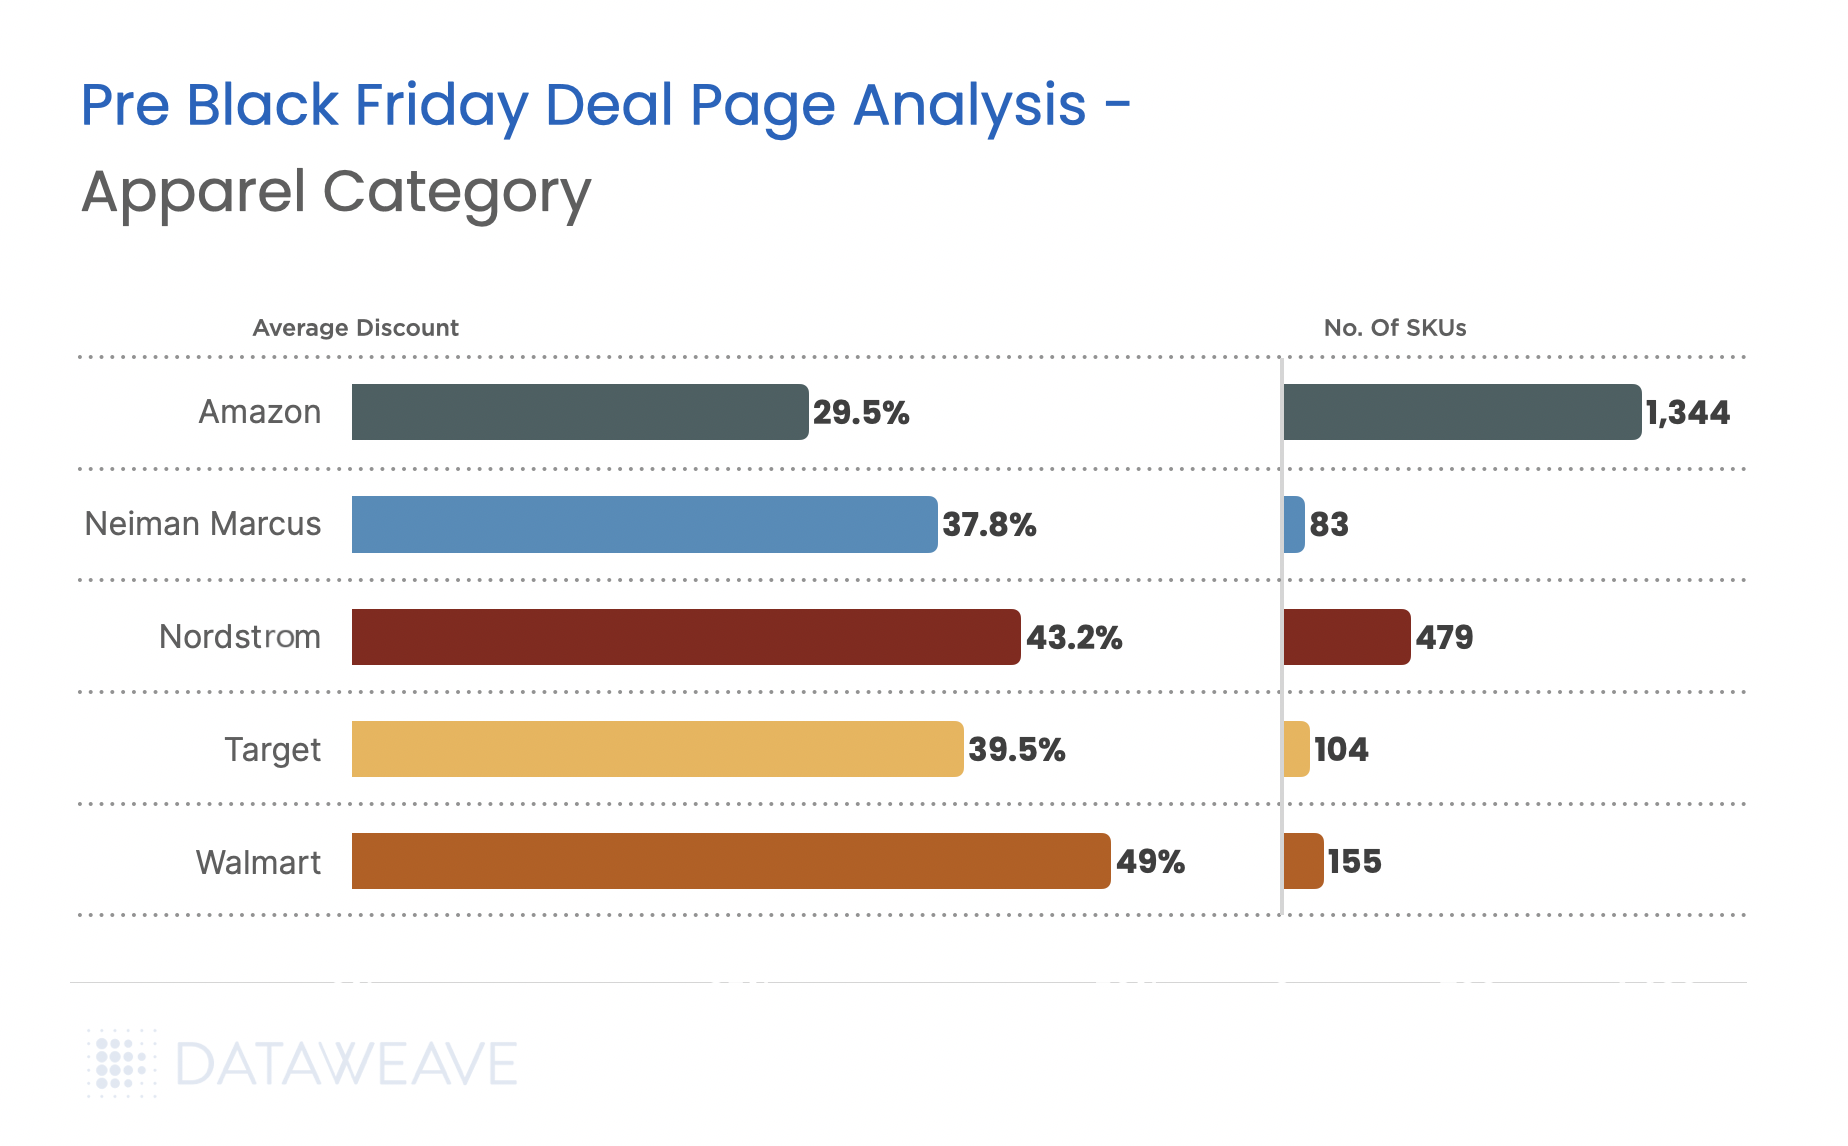
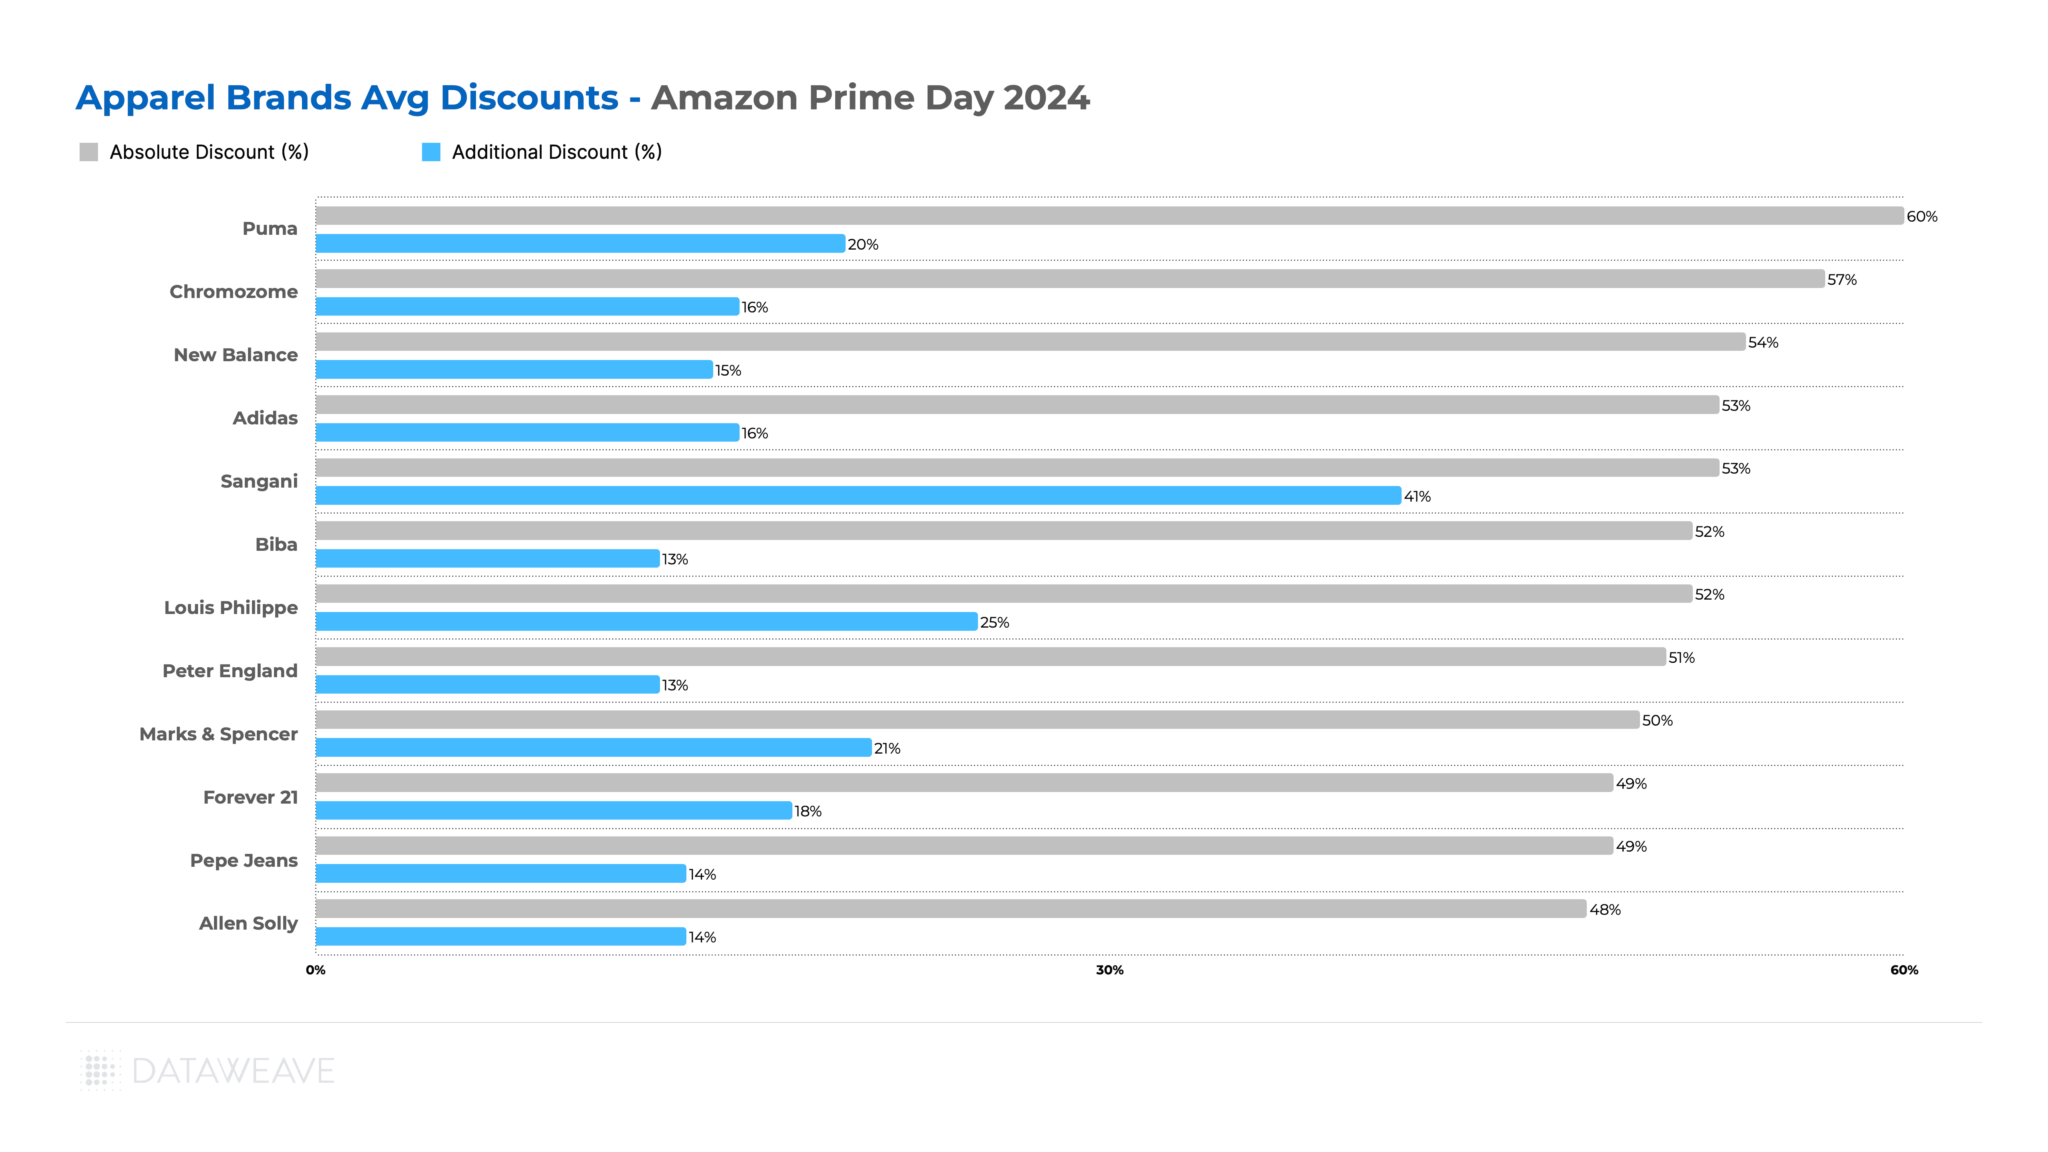
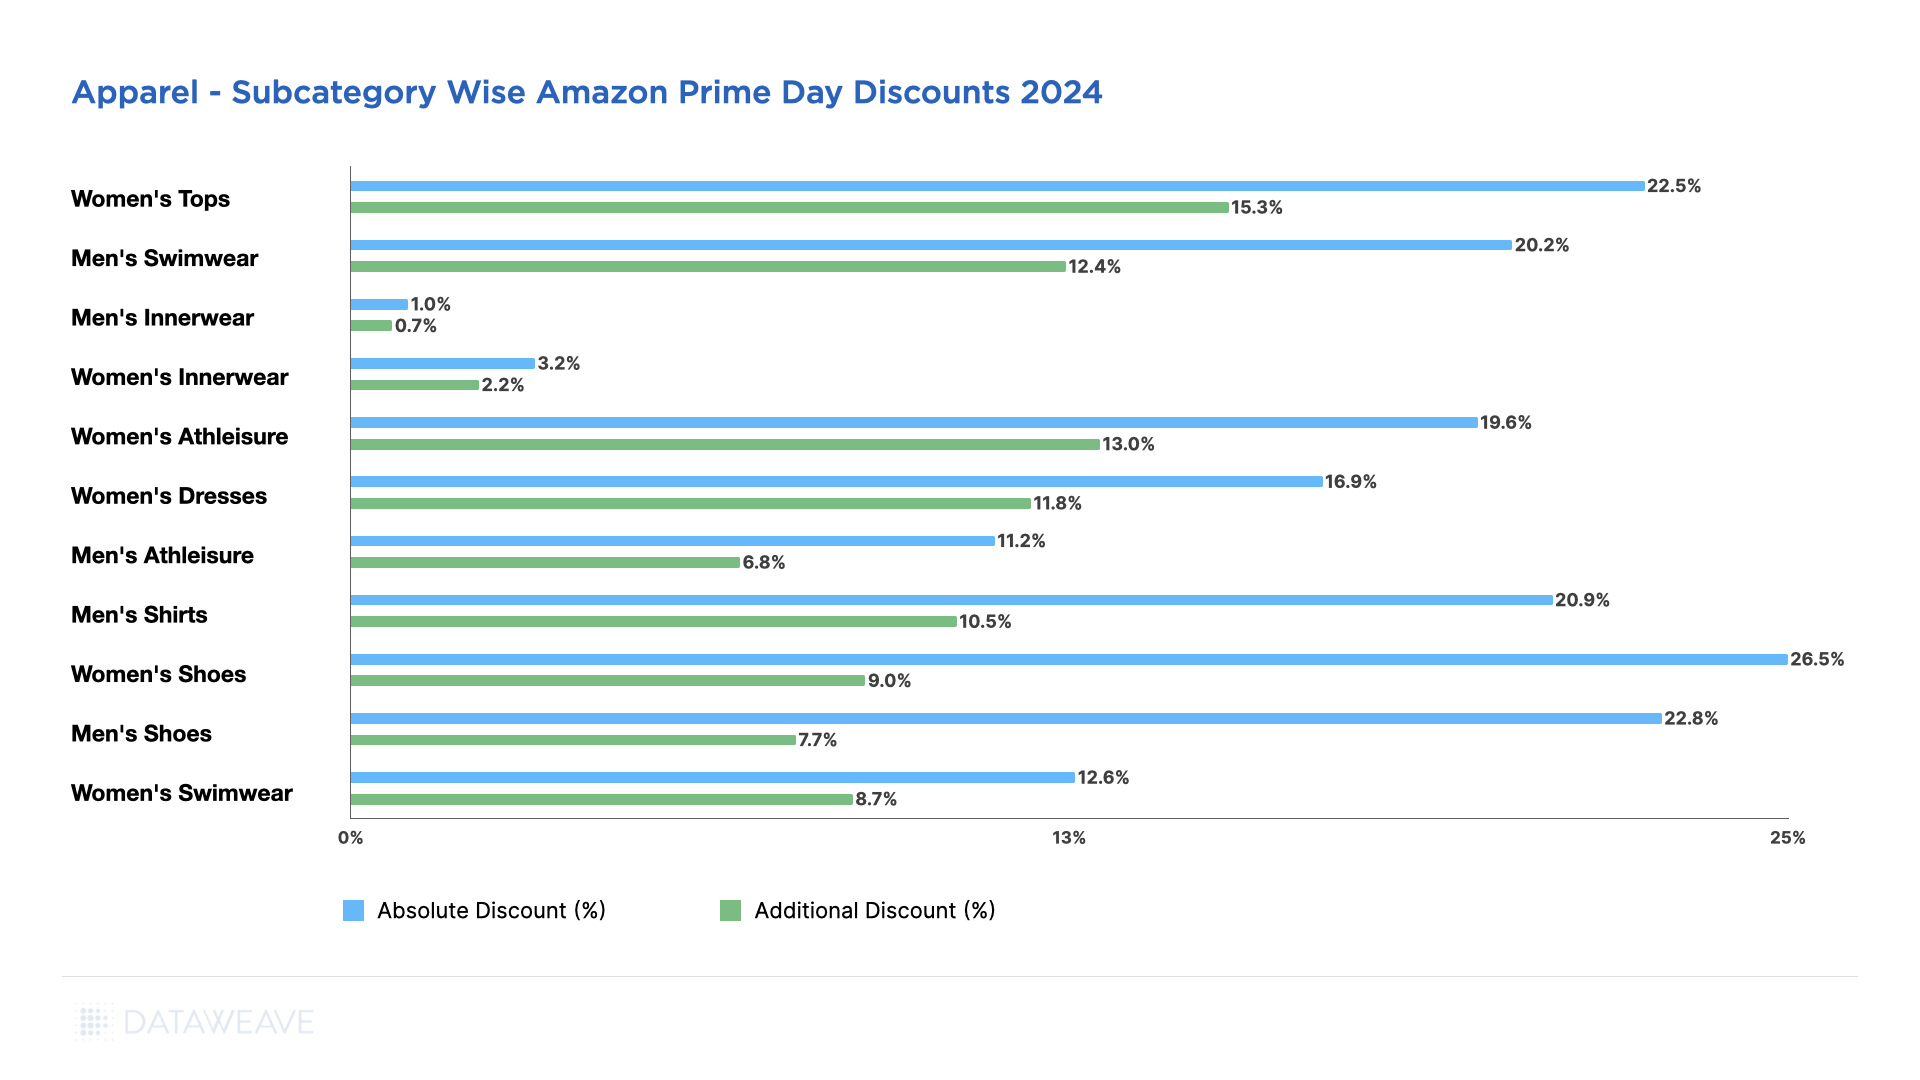
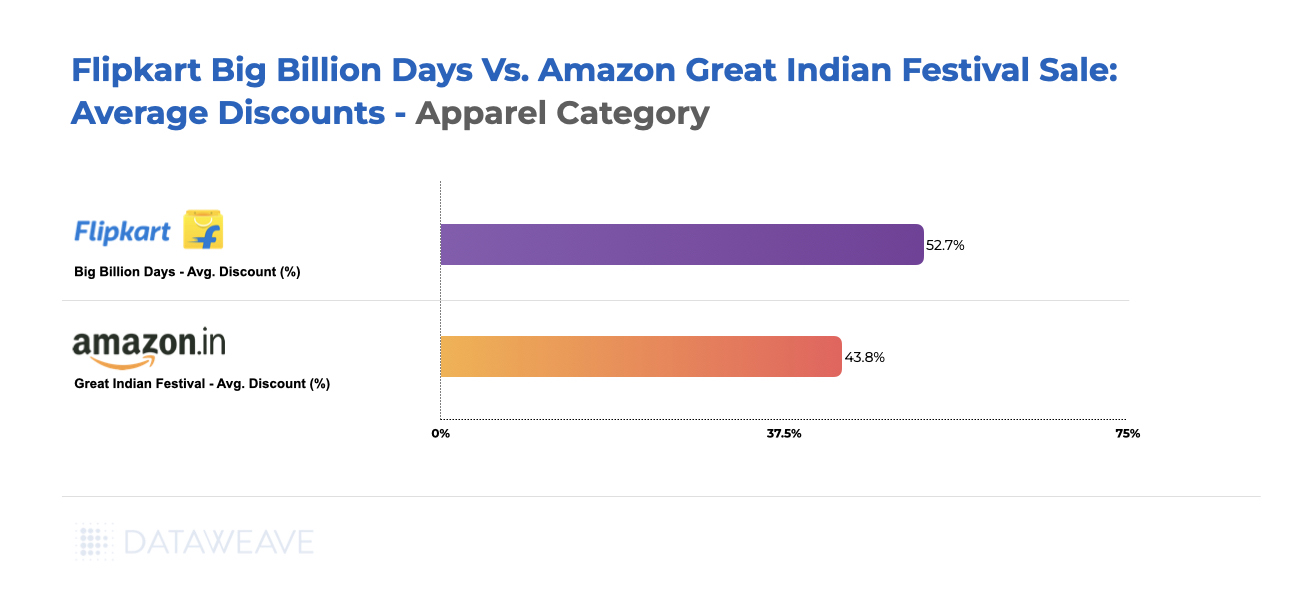
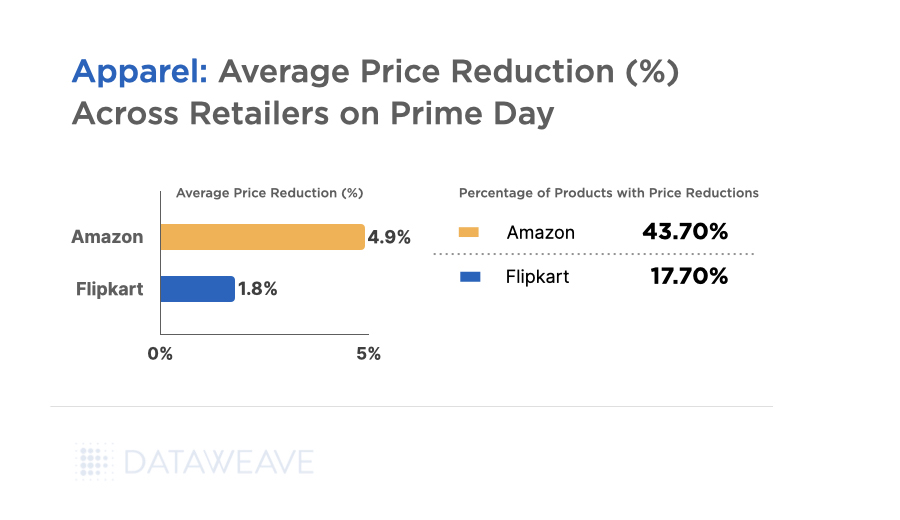
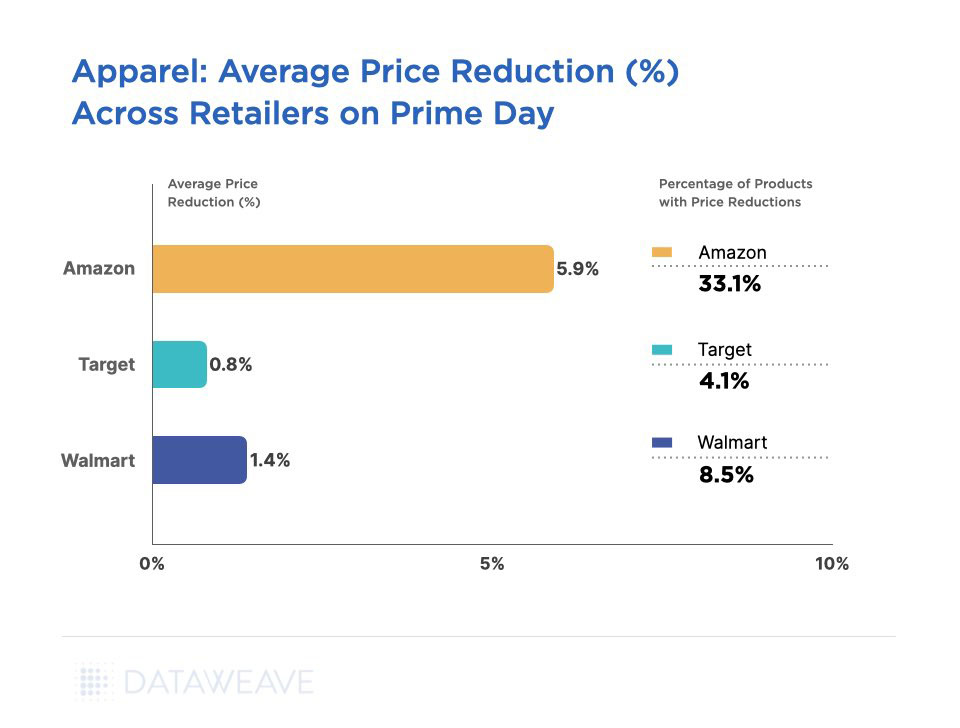
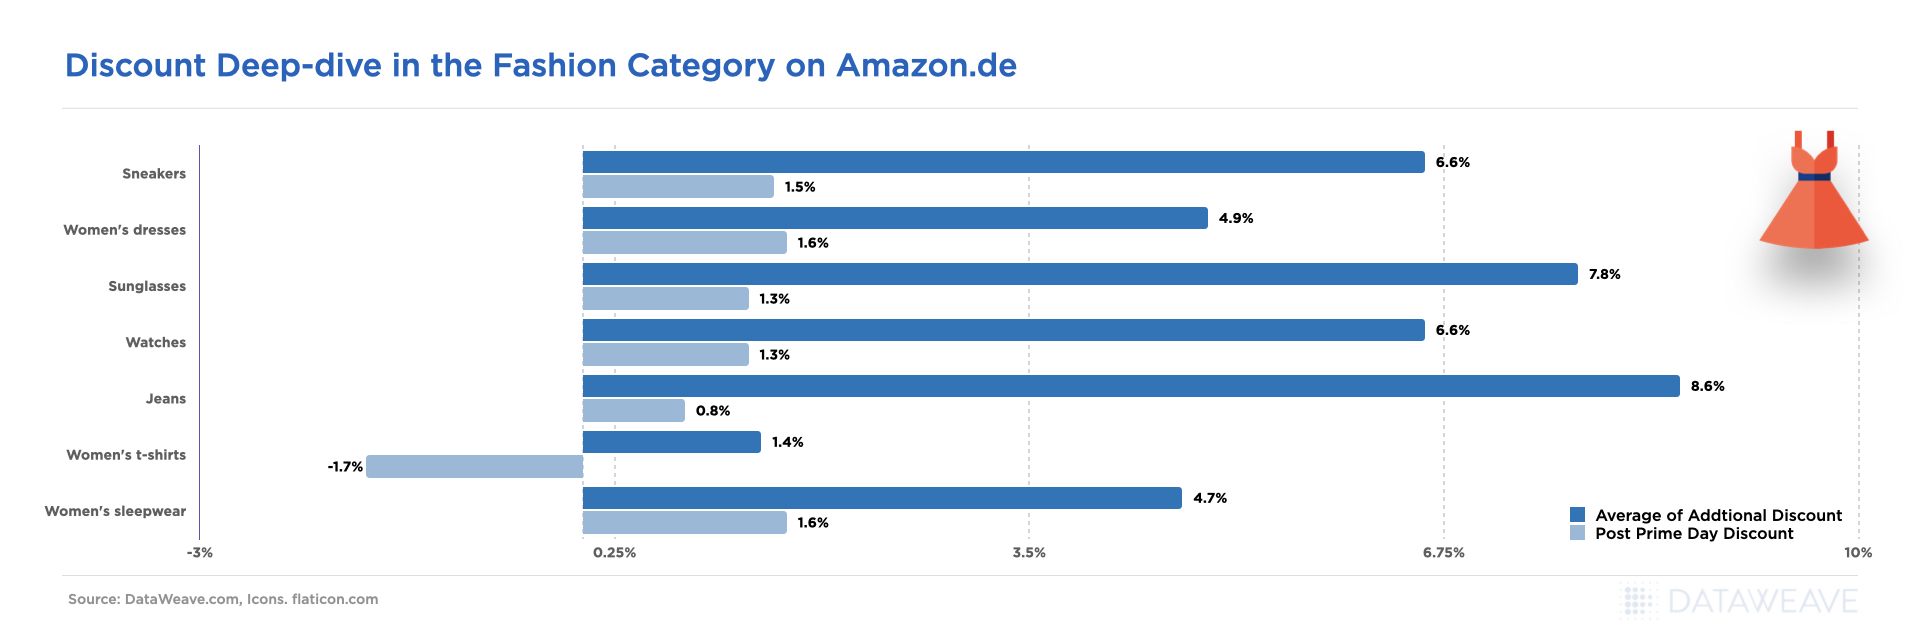
Apparel in the German market showed modest promotional activity compared to other markets, with Pre-Black Friday discounts averaging 5.9% and Black Friday Week at 5.2%. Our analysis of 2,321 SKUs reveals interesting patterns across fashion segments in the German market.
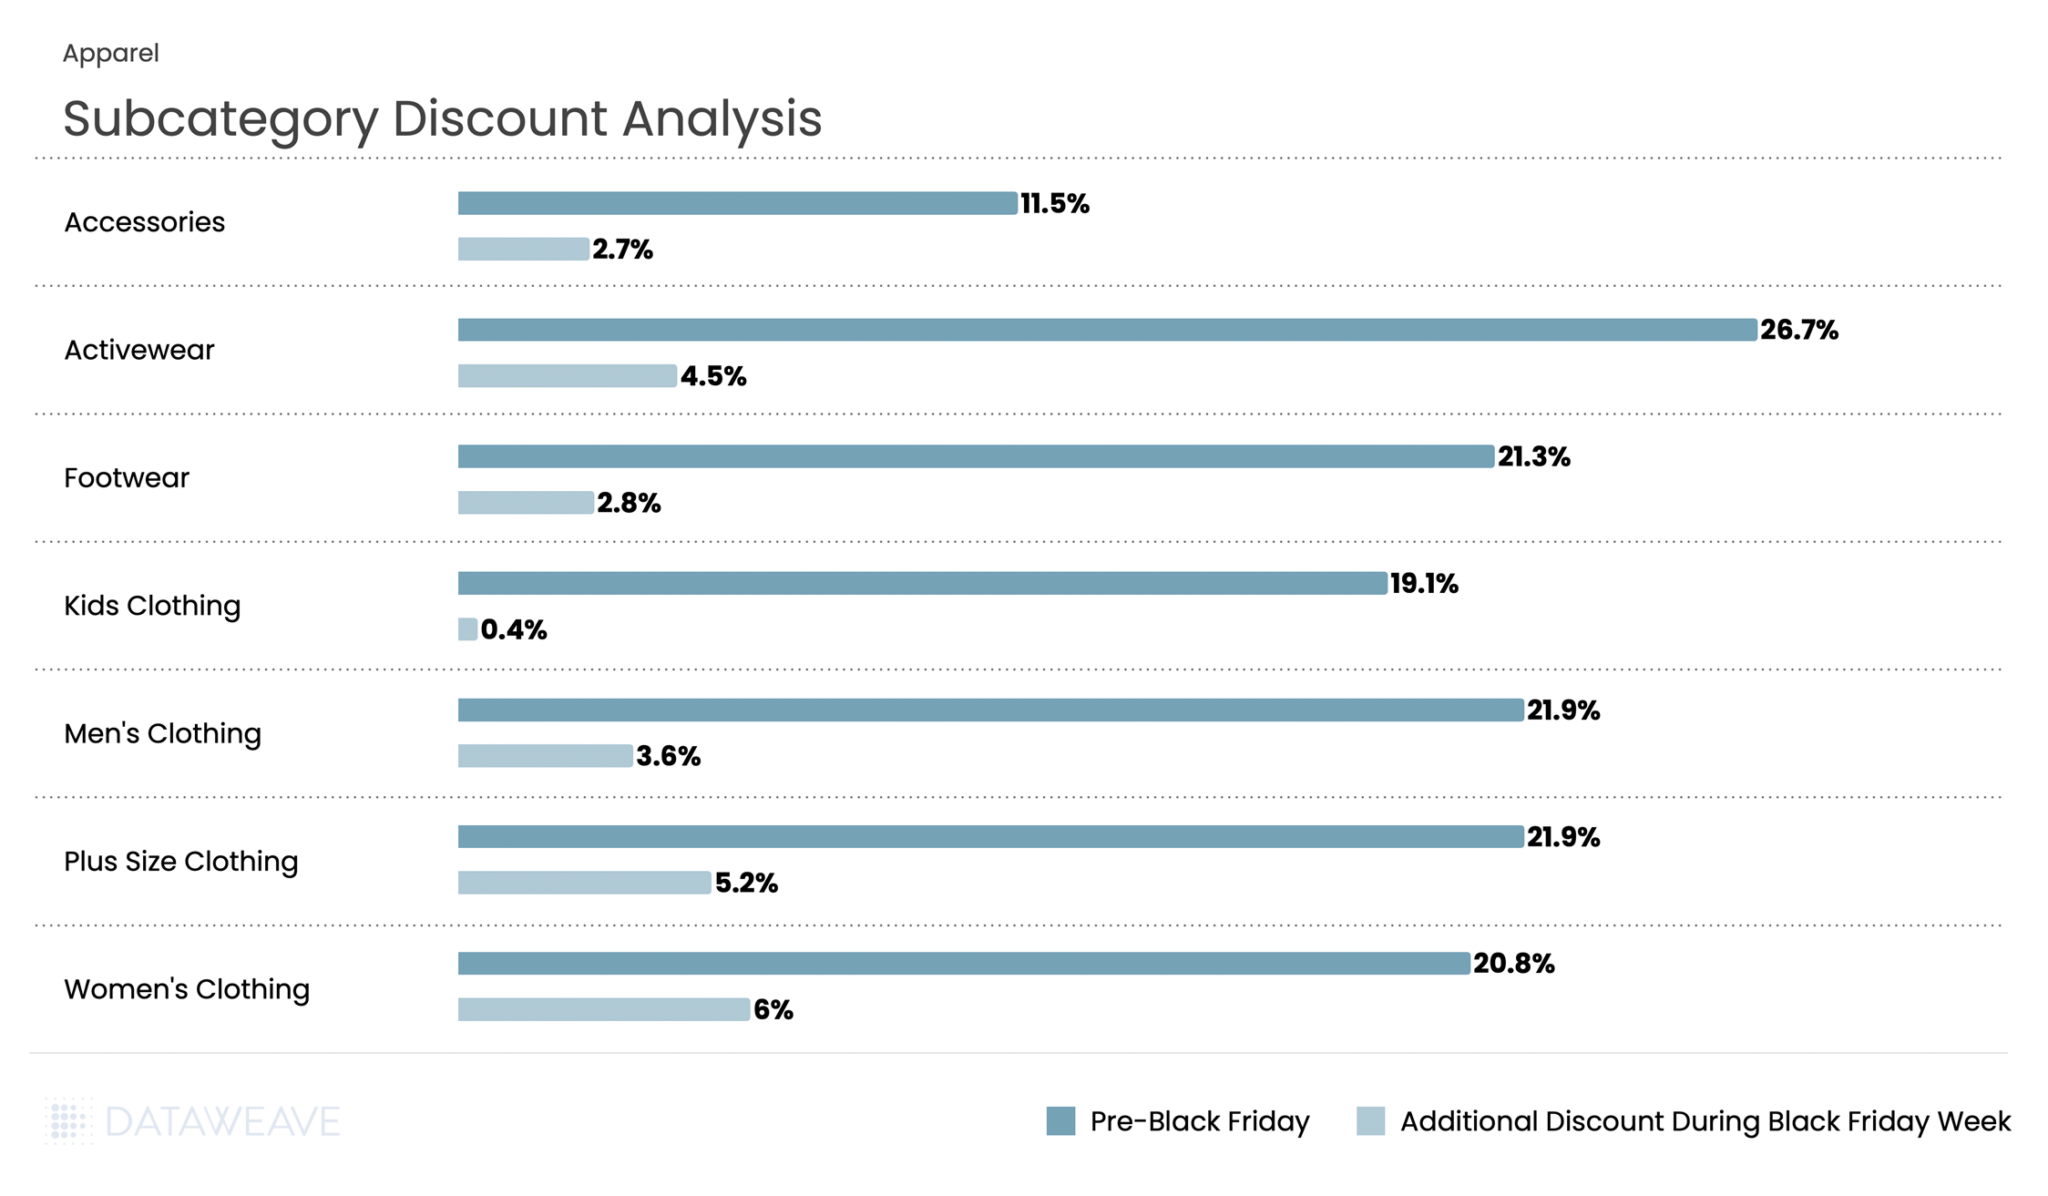
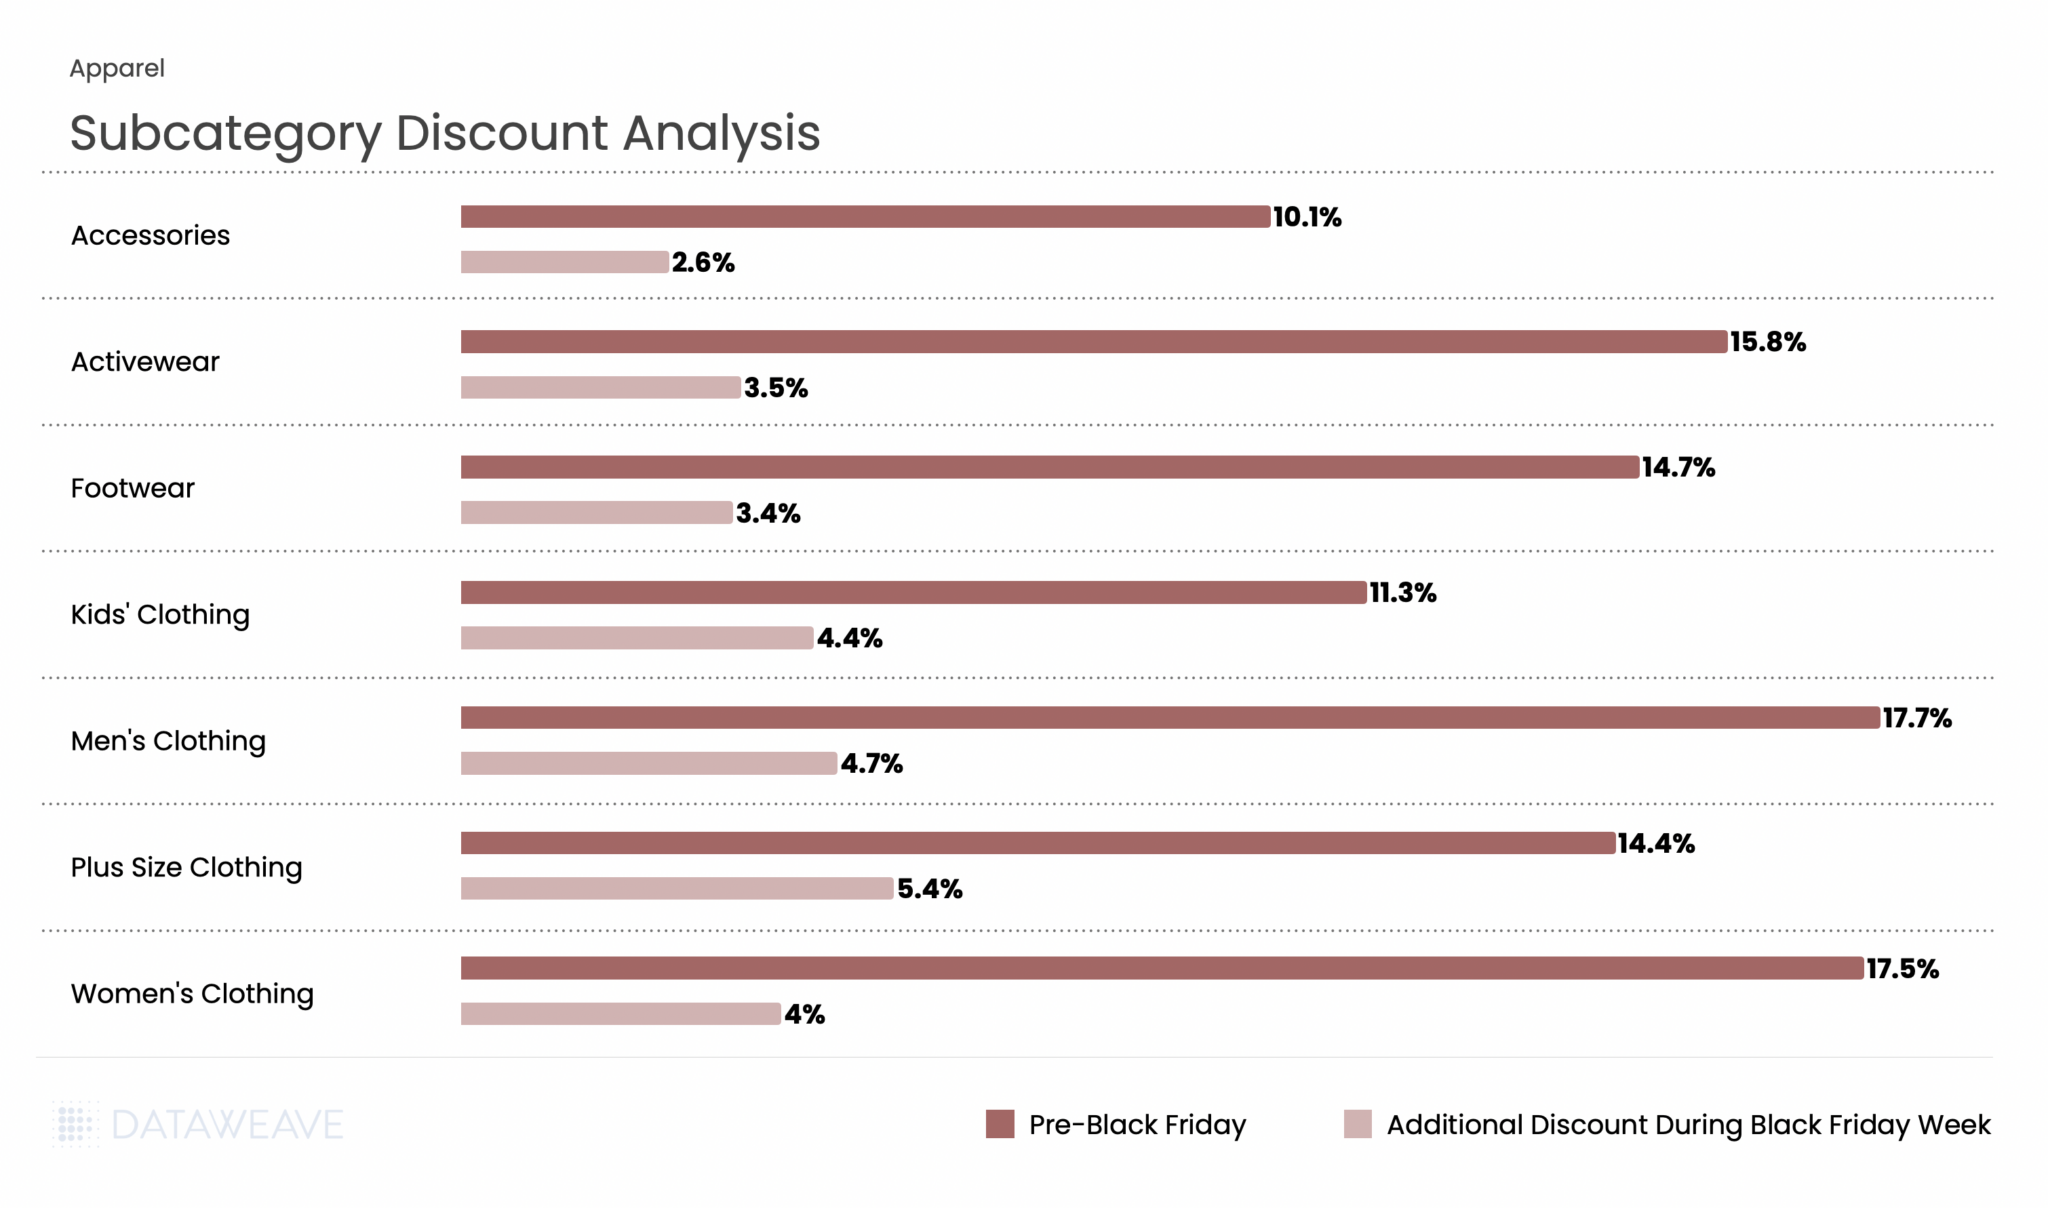
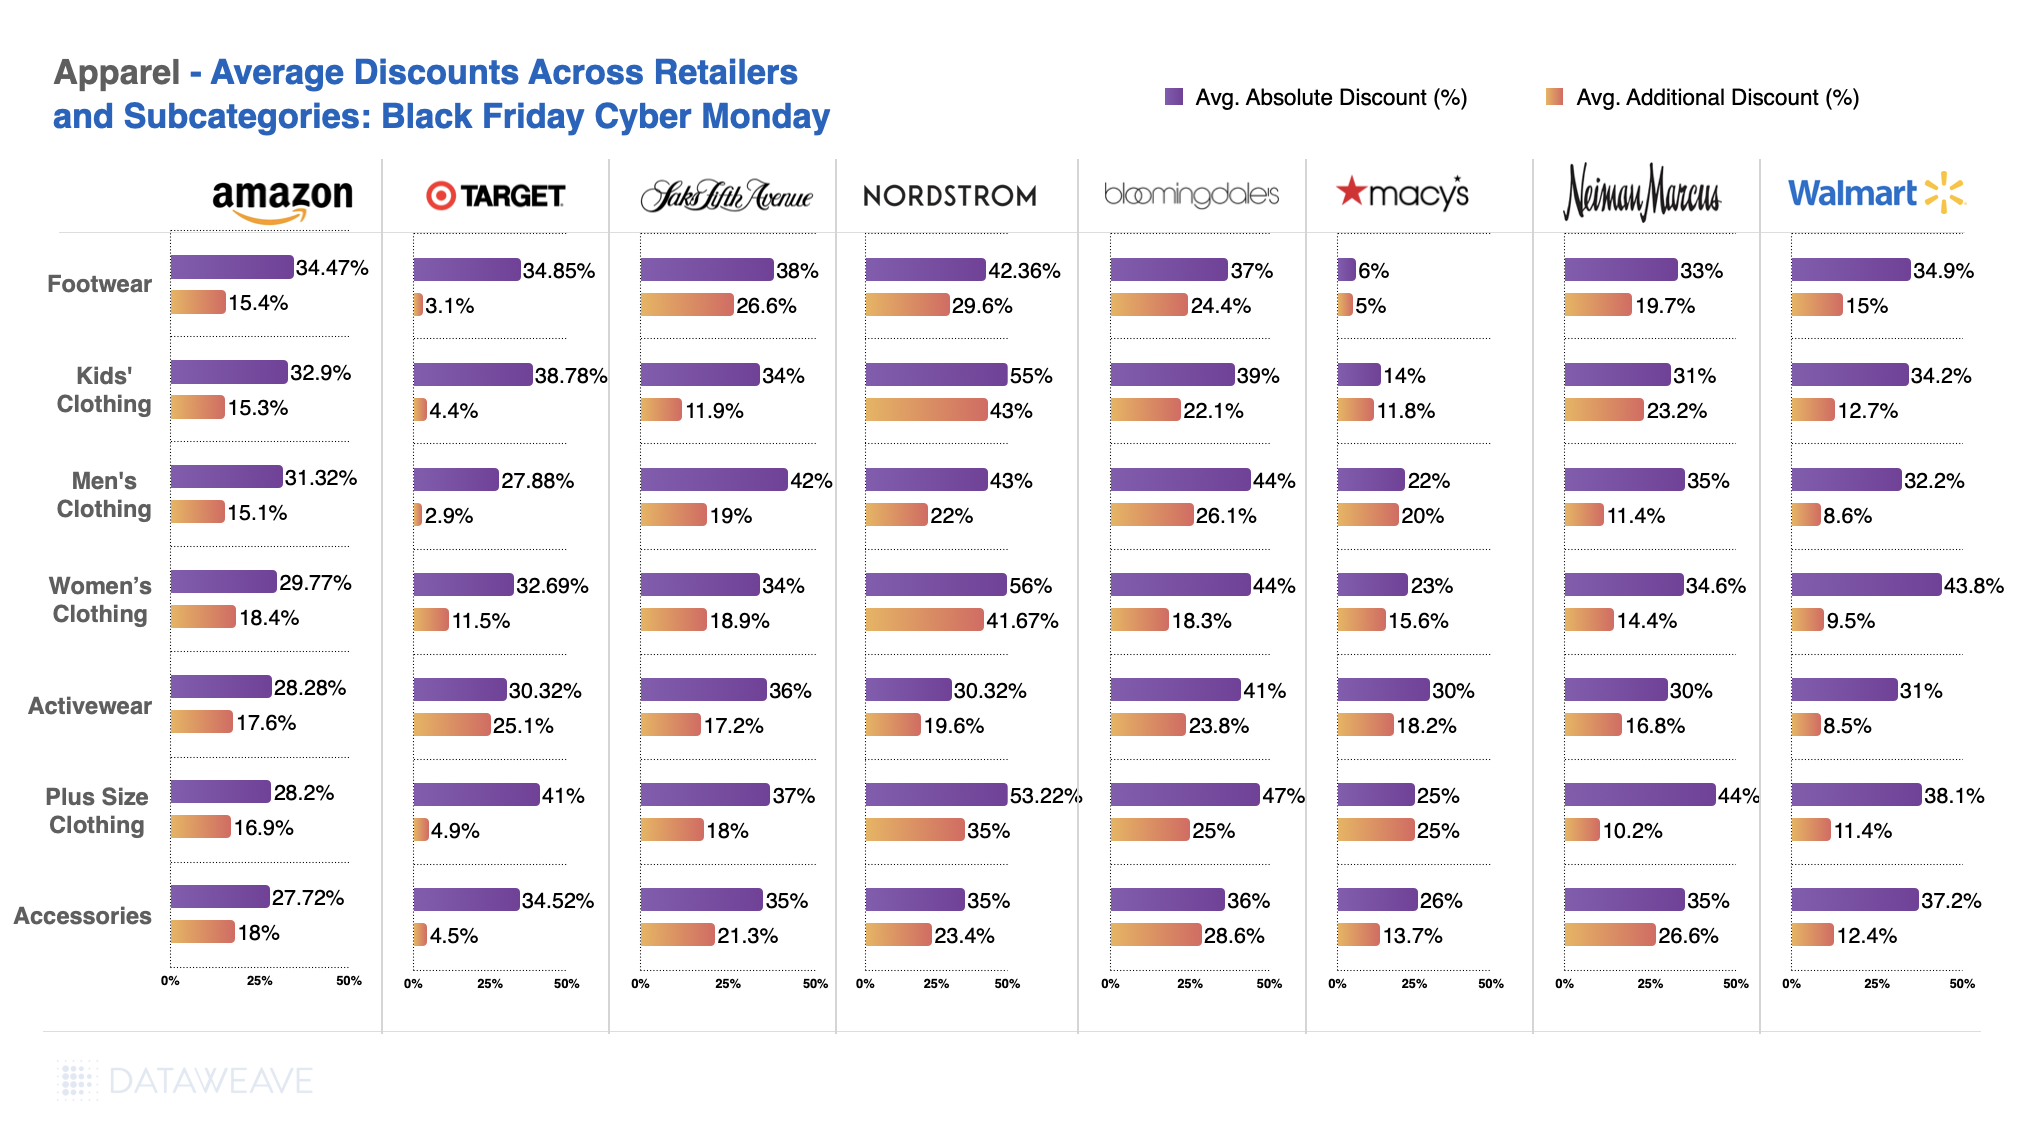
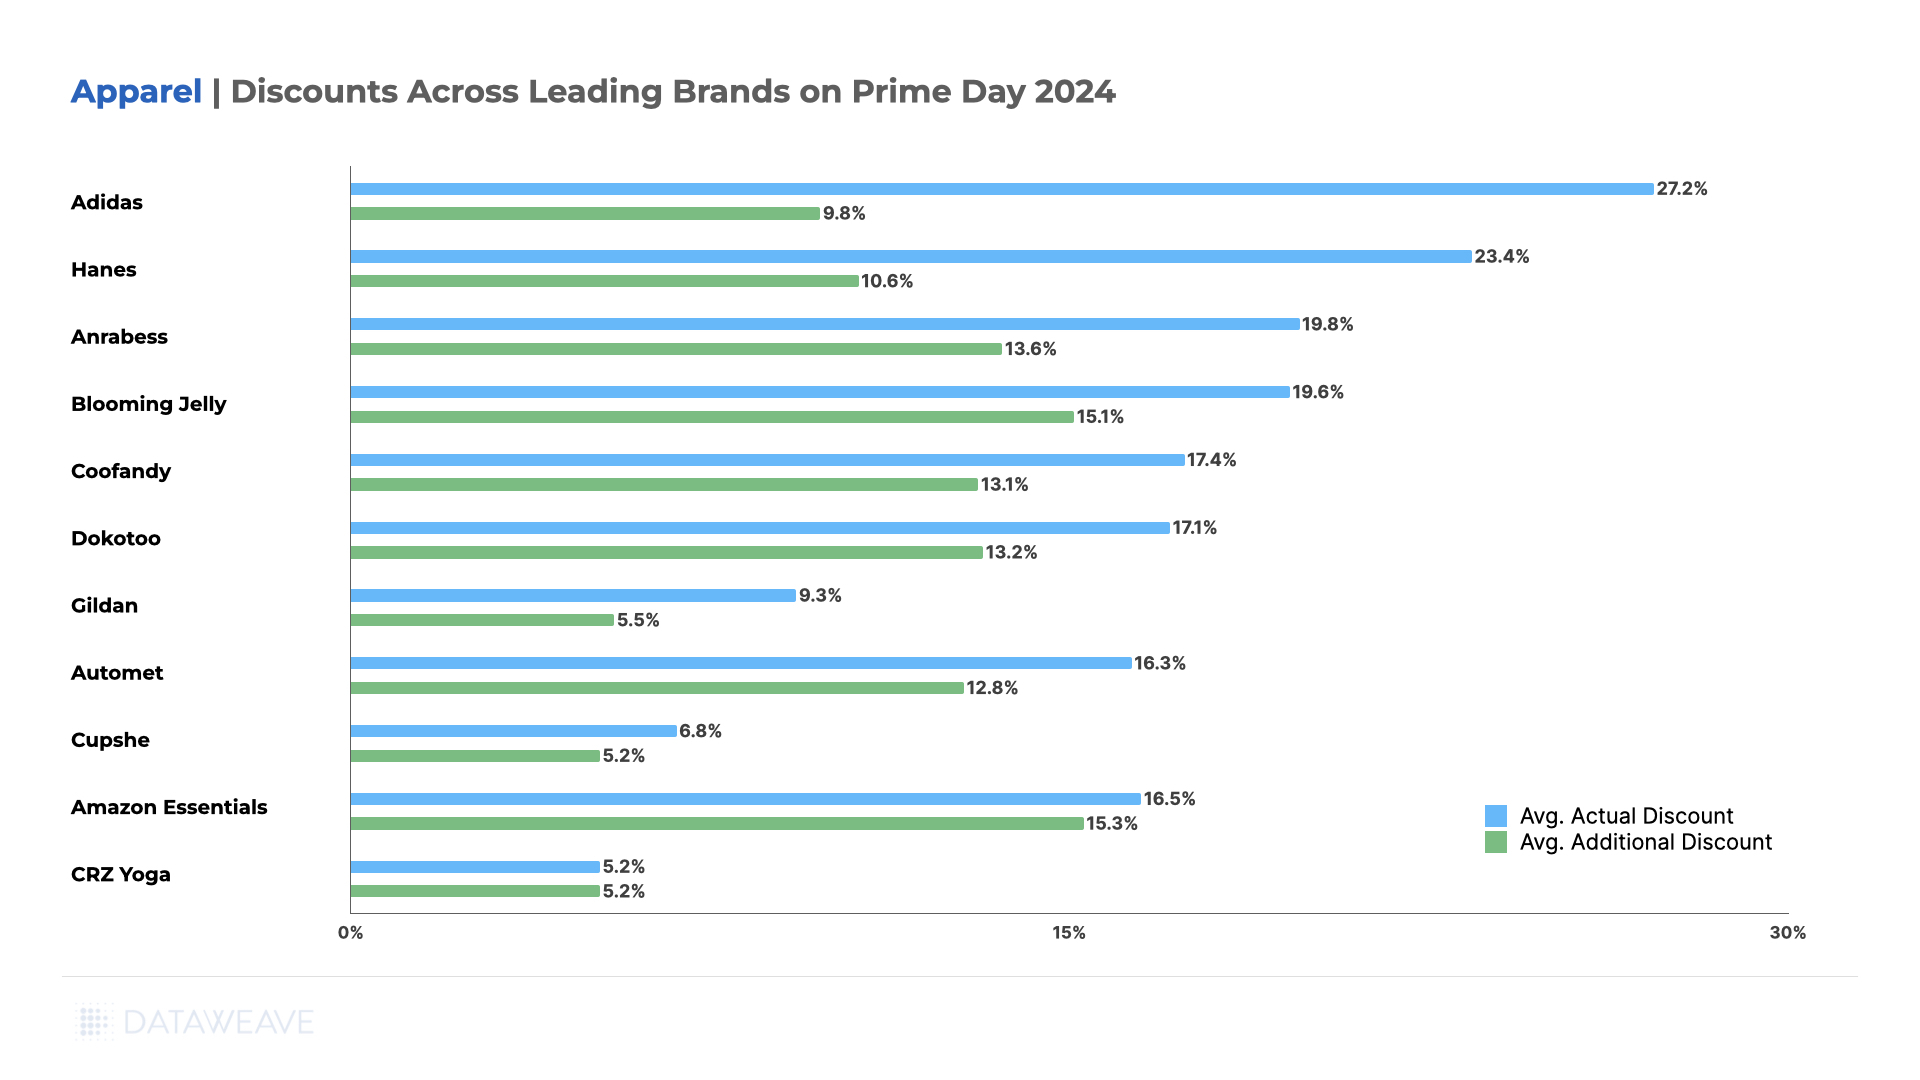
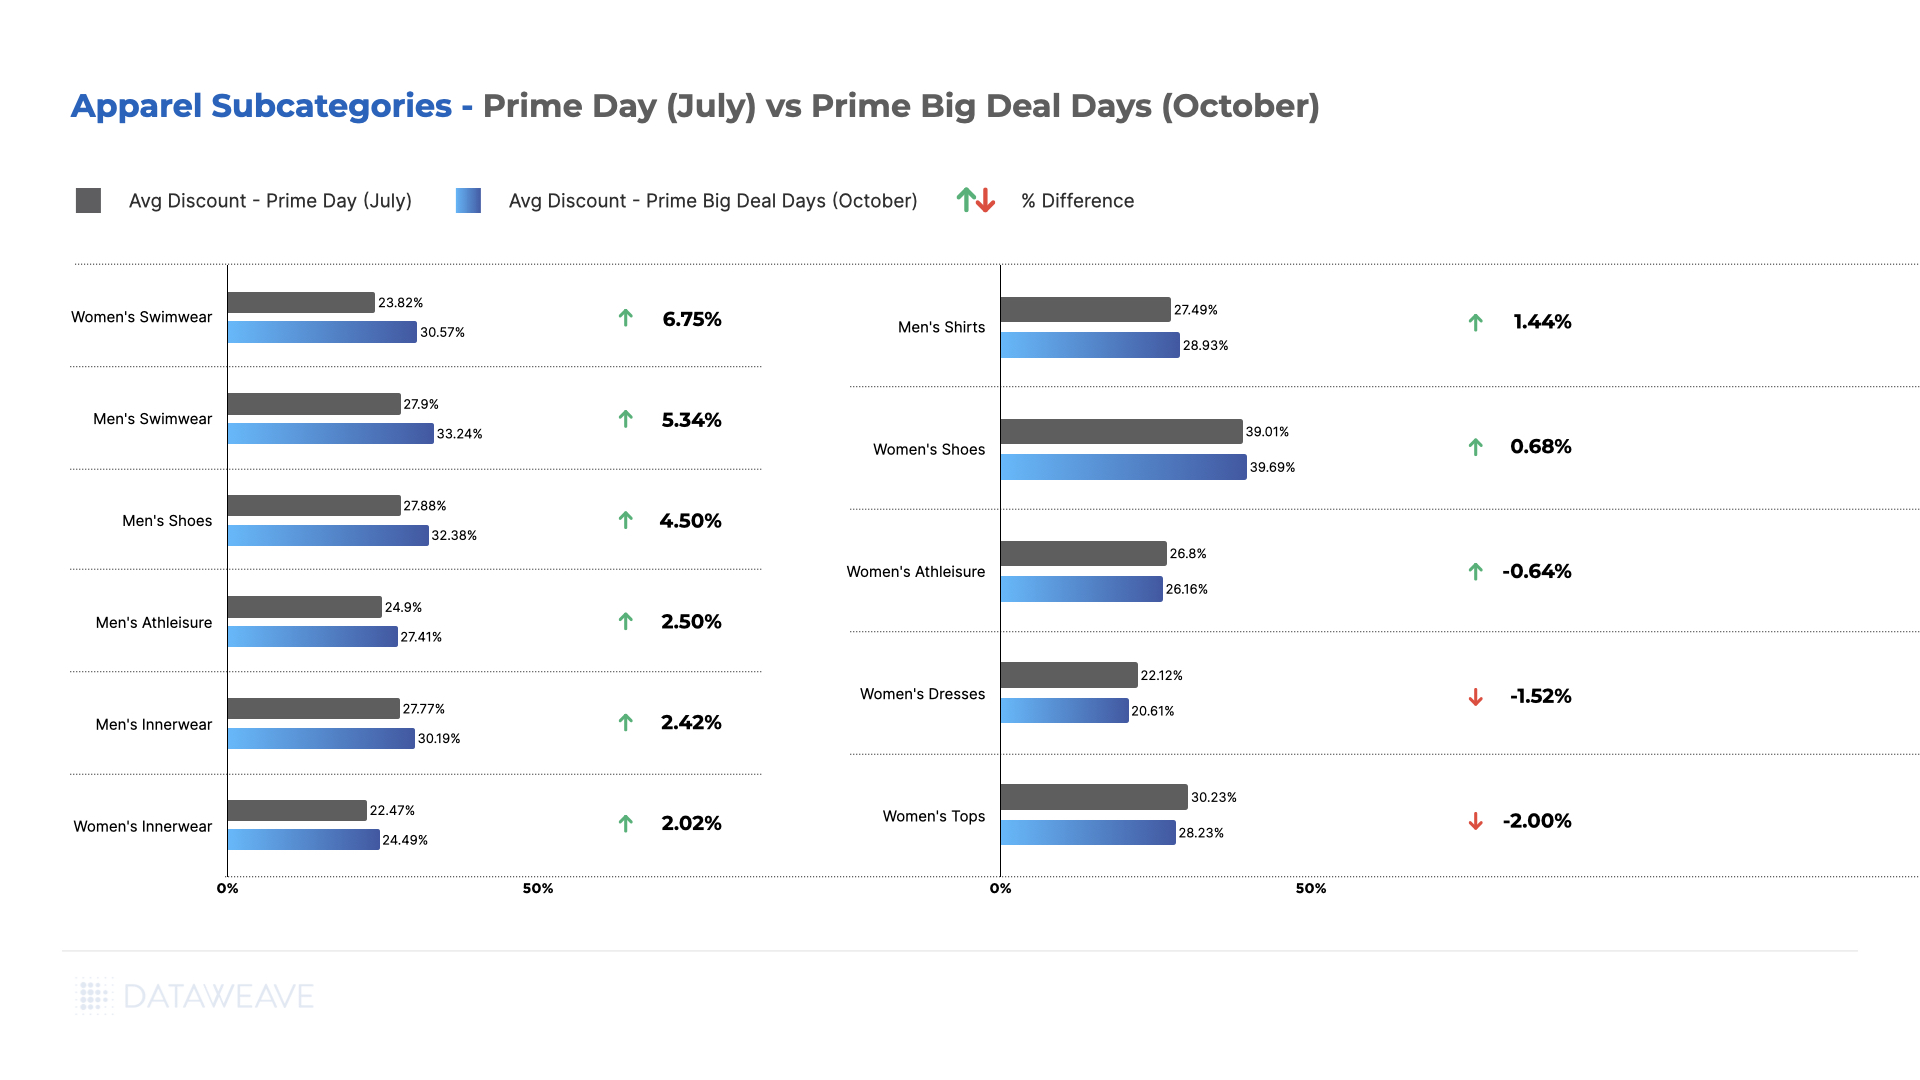
Subcategory Discount Analysis
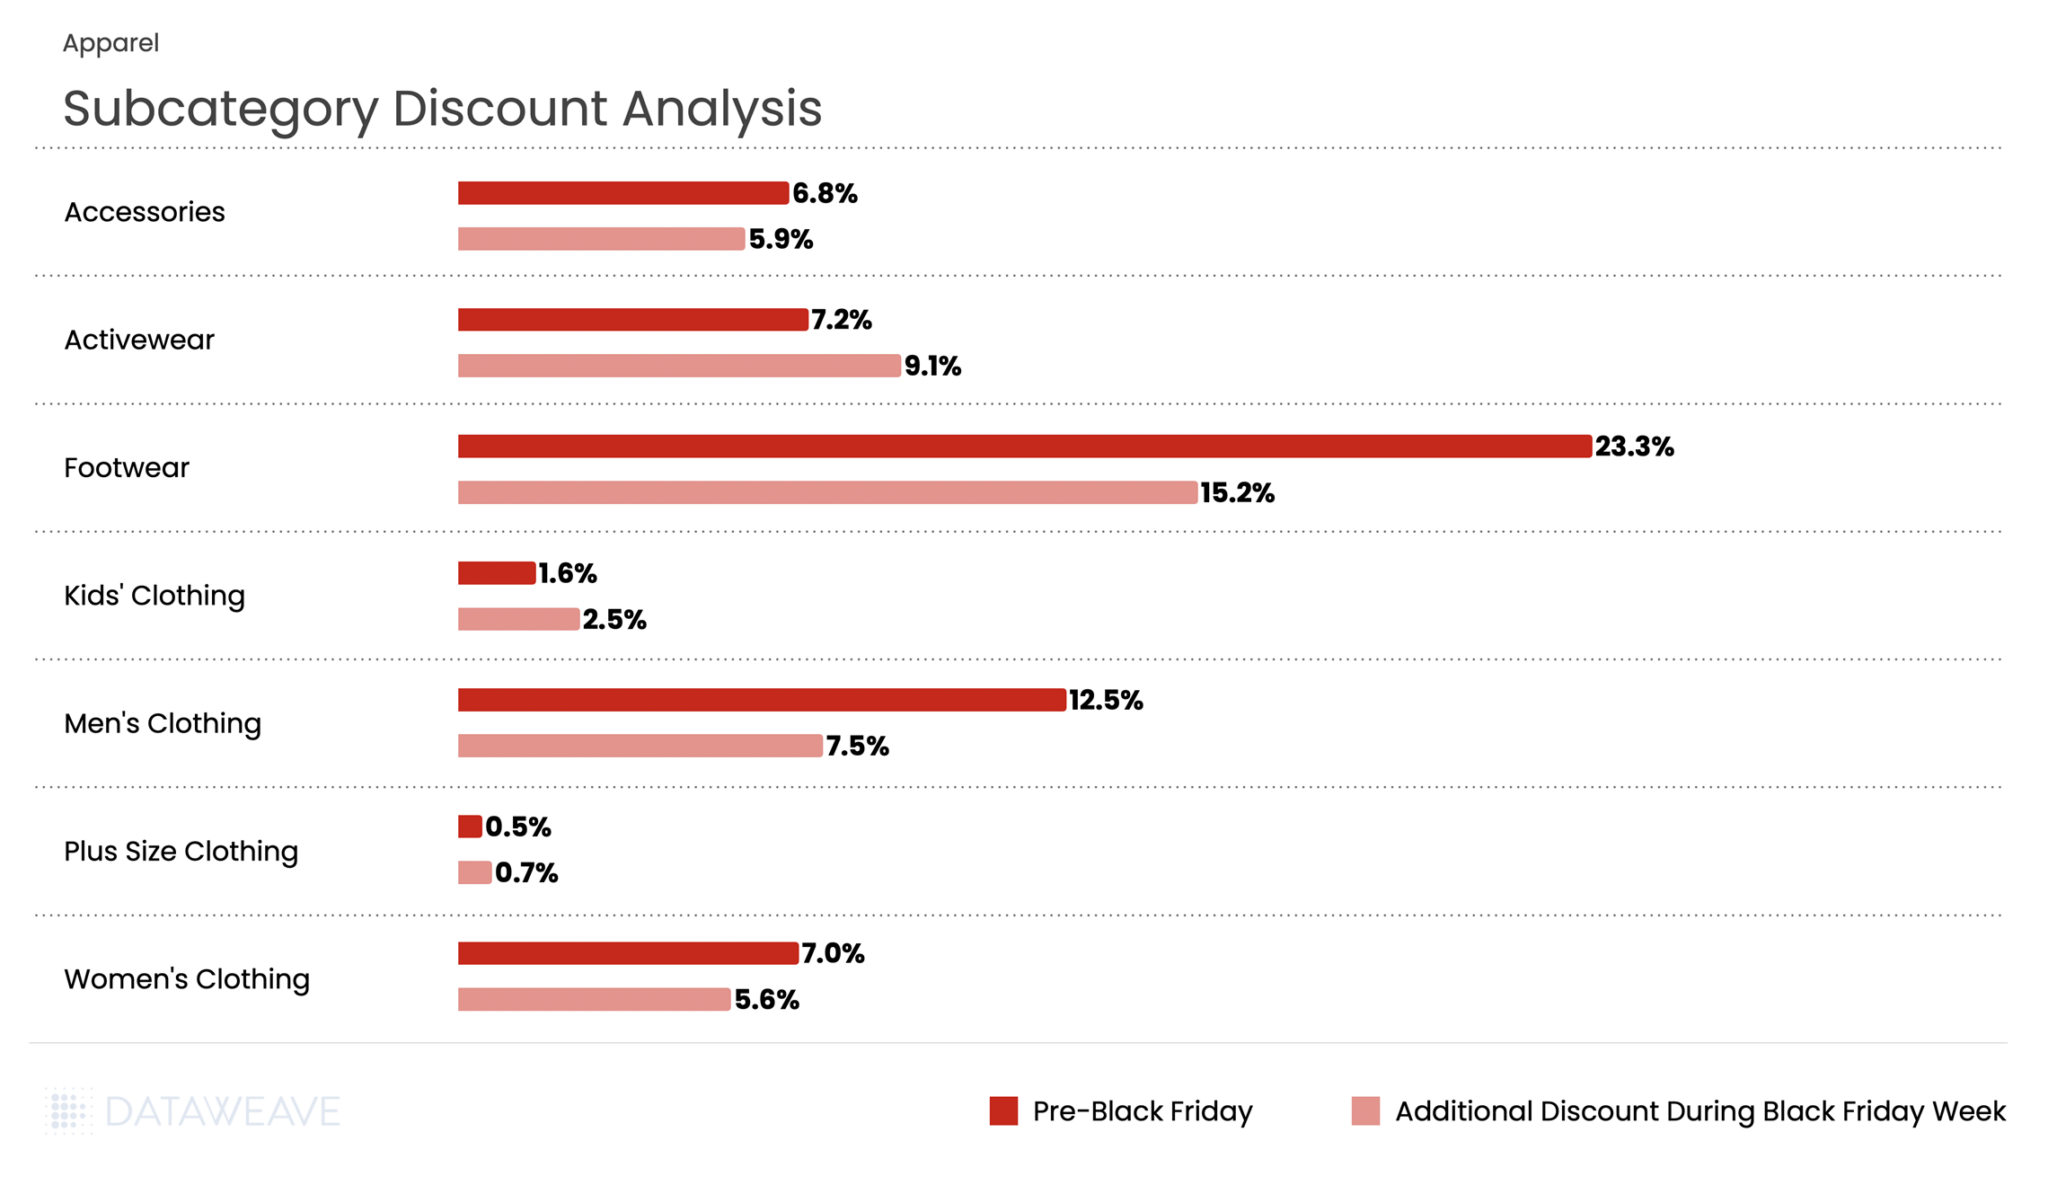
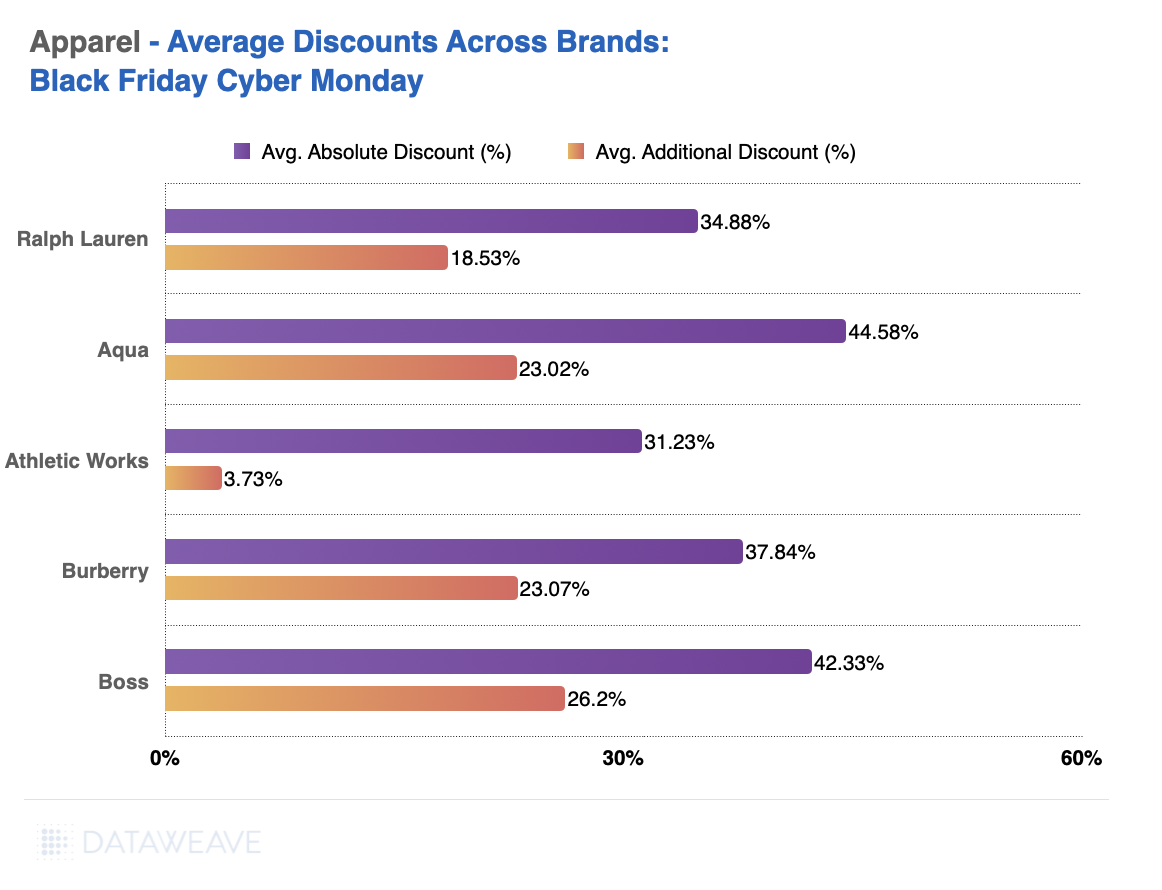
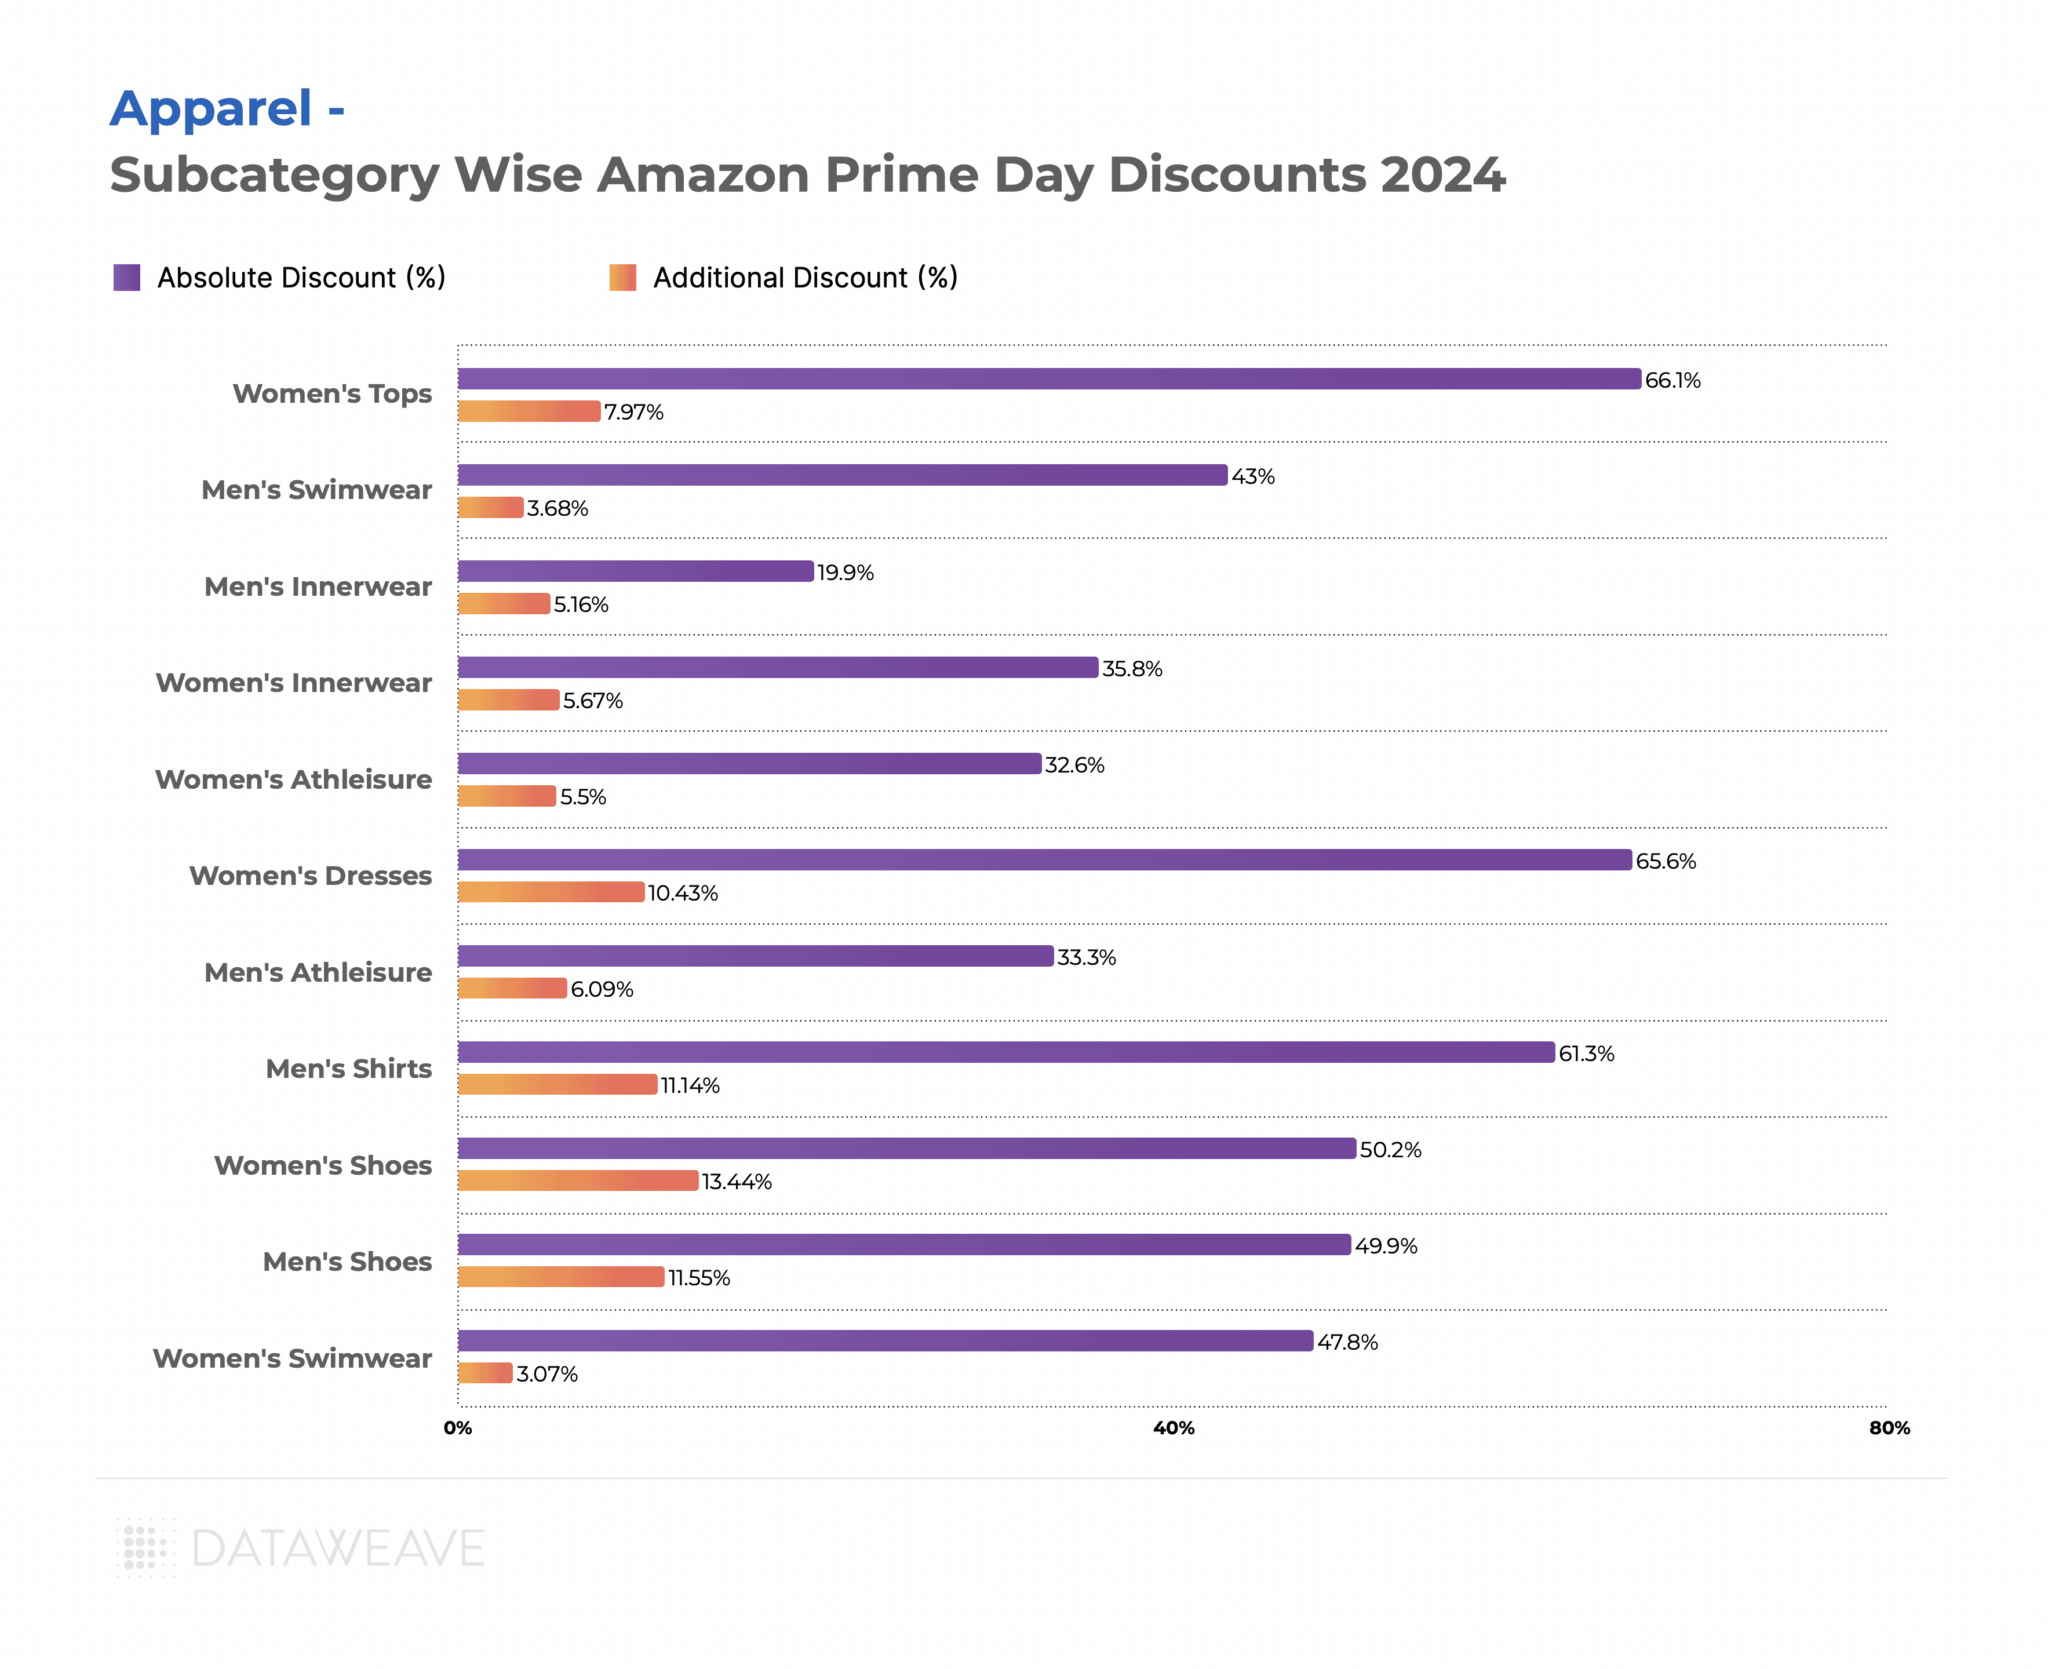
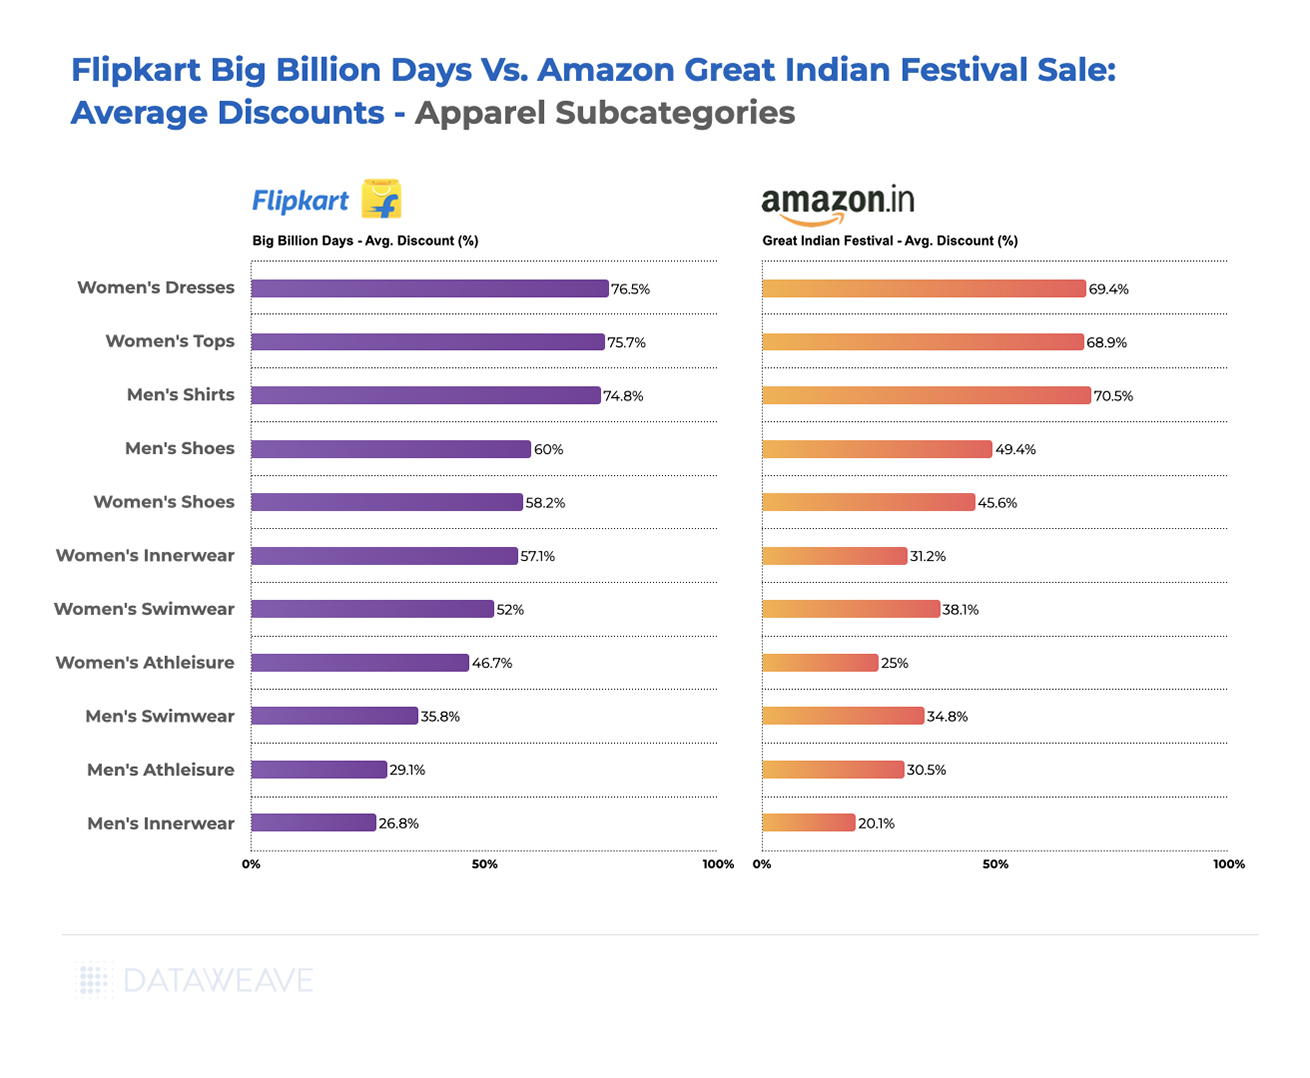
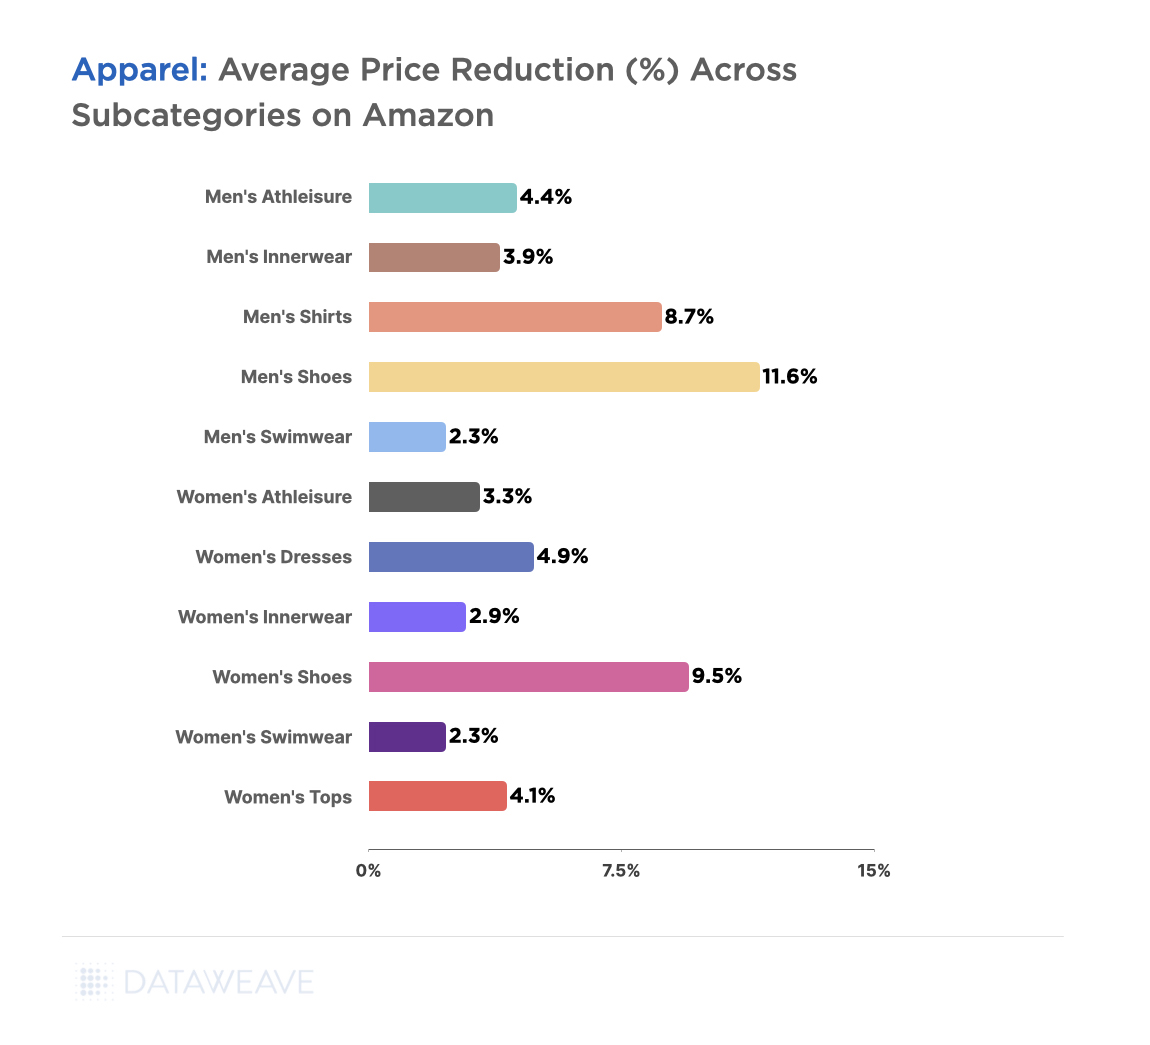
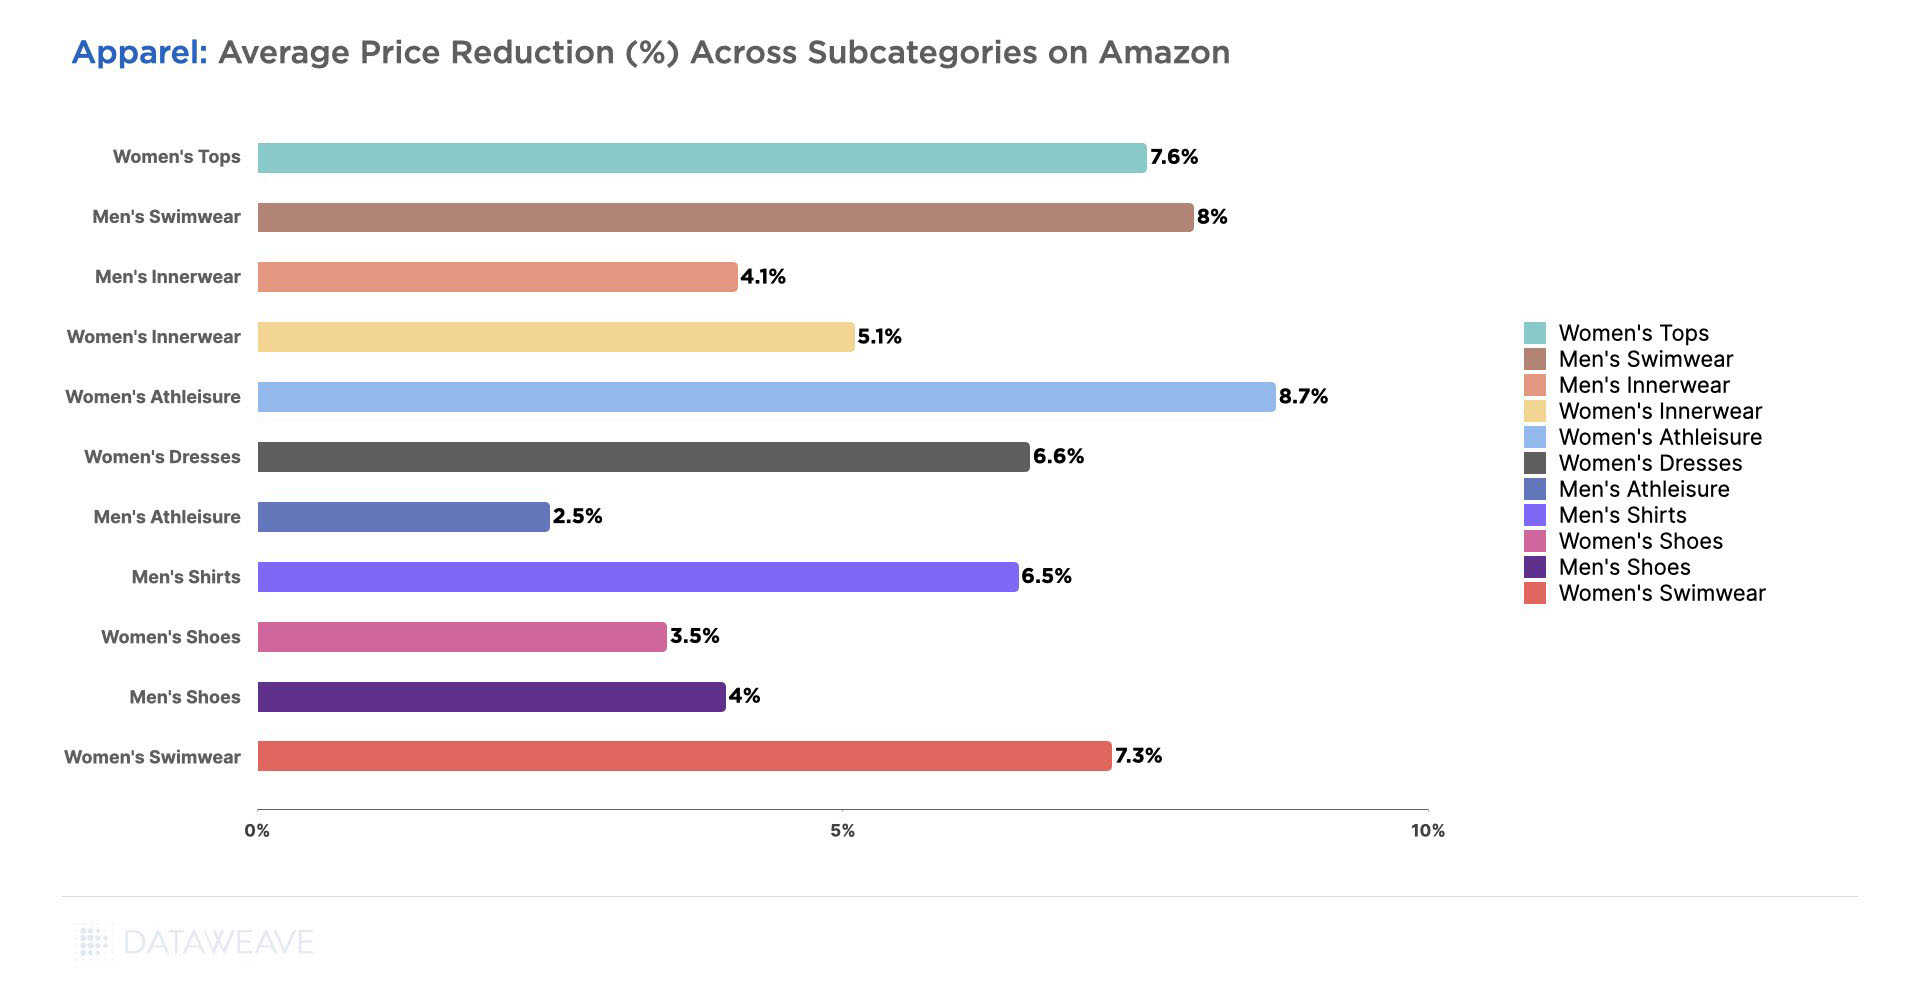
Footwear dominated discounting in both periods, with an impressive 23.3% pre-sale discount, and 15% additional discount during Black Friday Week. Men’s Clothing followed at 12.5% pre-sale, with additional 7.5% during Black Friday Week.
Activewear presented a unique pattern, with discounts increasing from 7.2% pre-event to additional 9.1% during Black Friday Week: one of the few subcategories to show higher discounts during the main event. Plus Size Clothing saw minimal promotional activity at 0.5% pre-sale and 0.7% during Black Friday Week, the lowest discounts in the entire category.
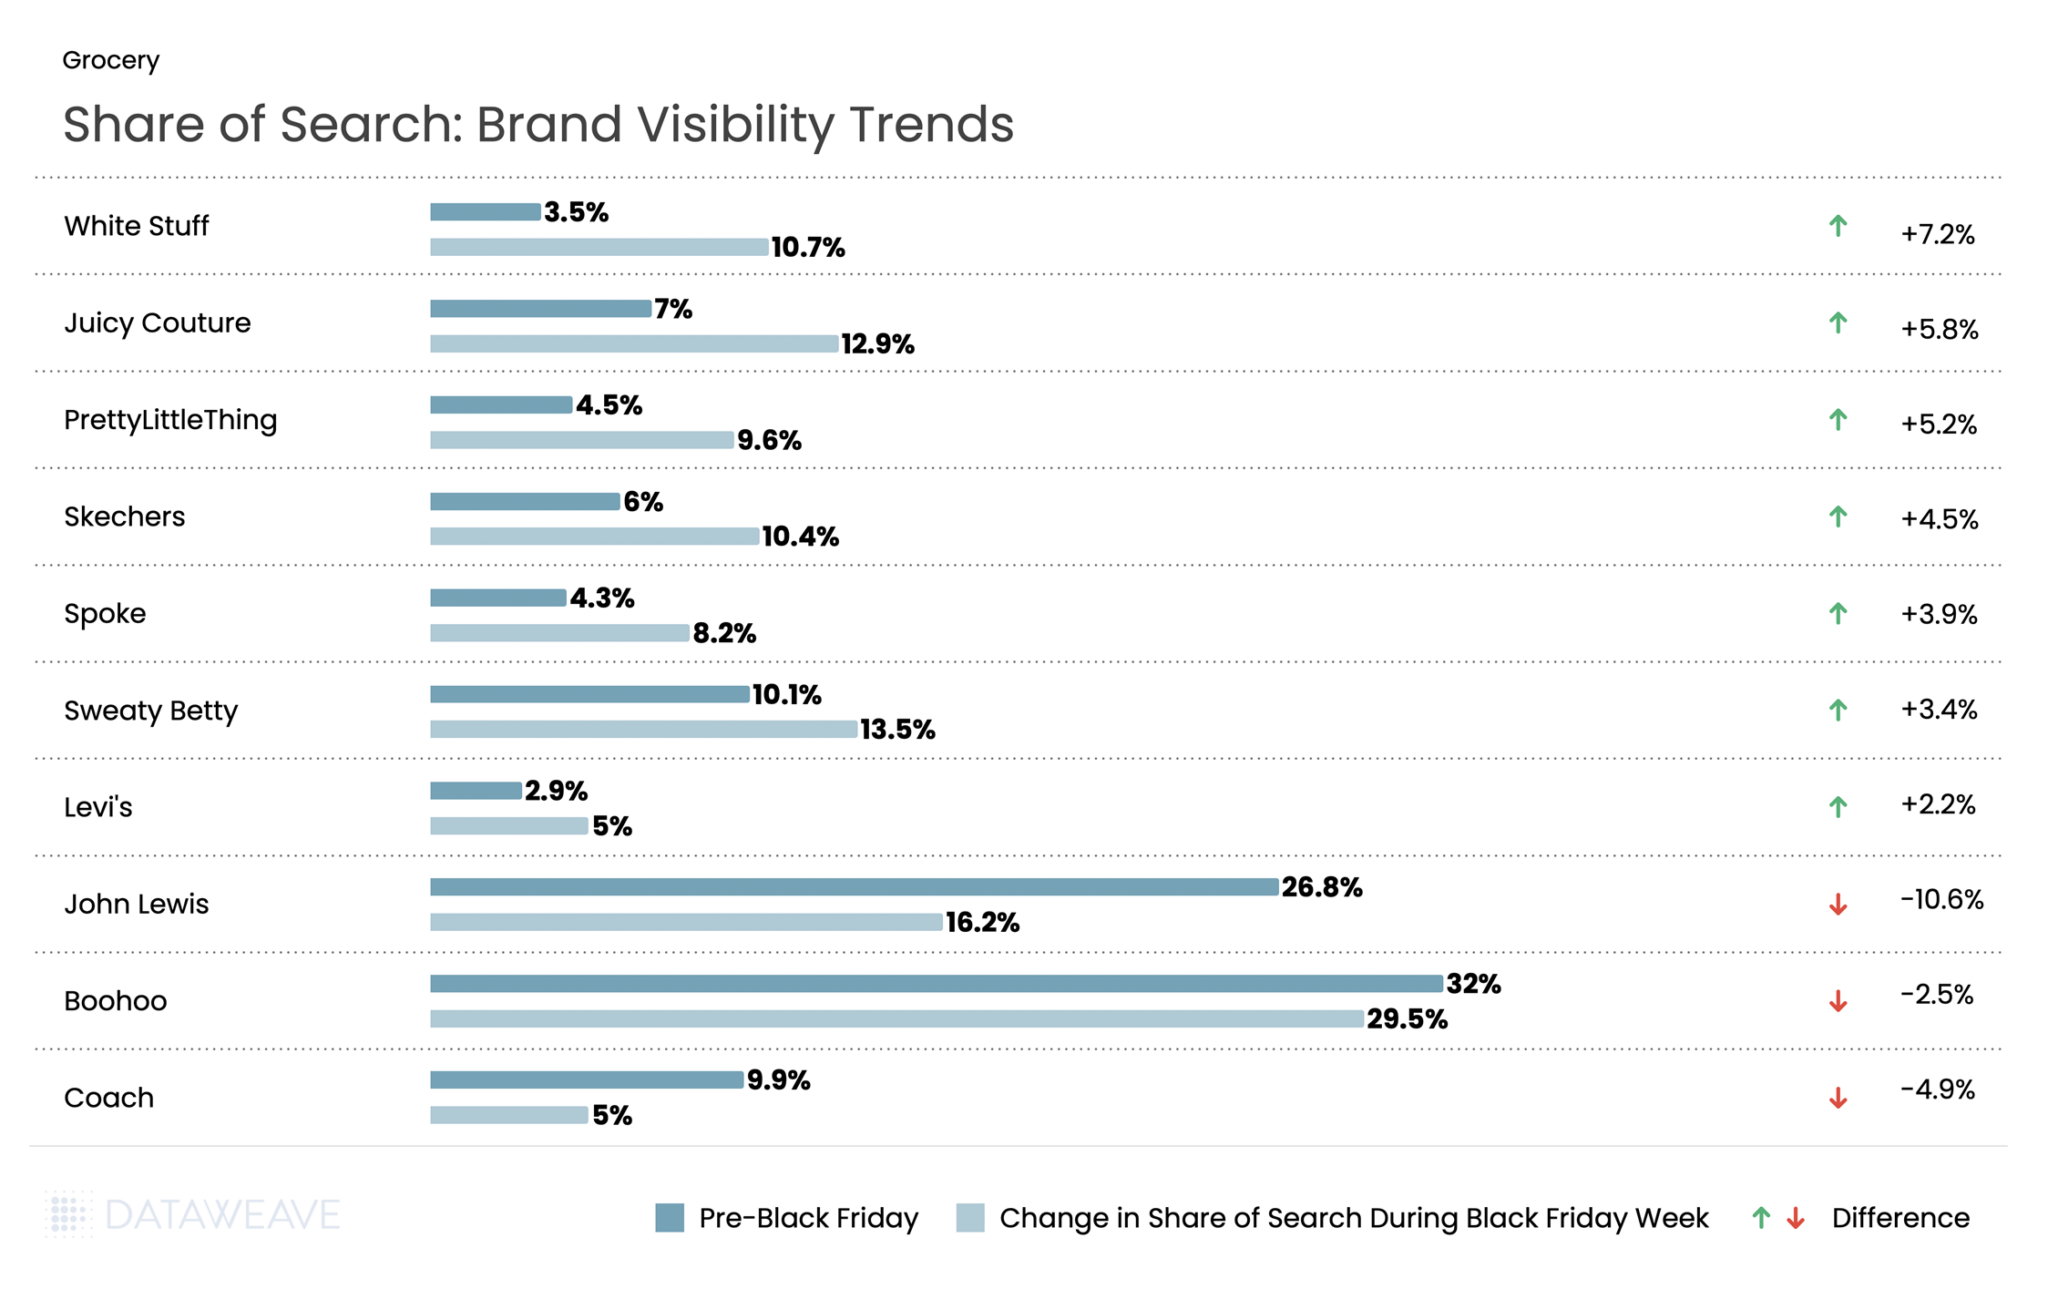
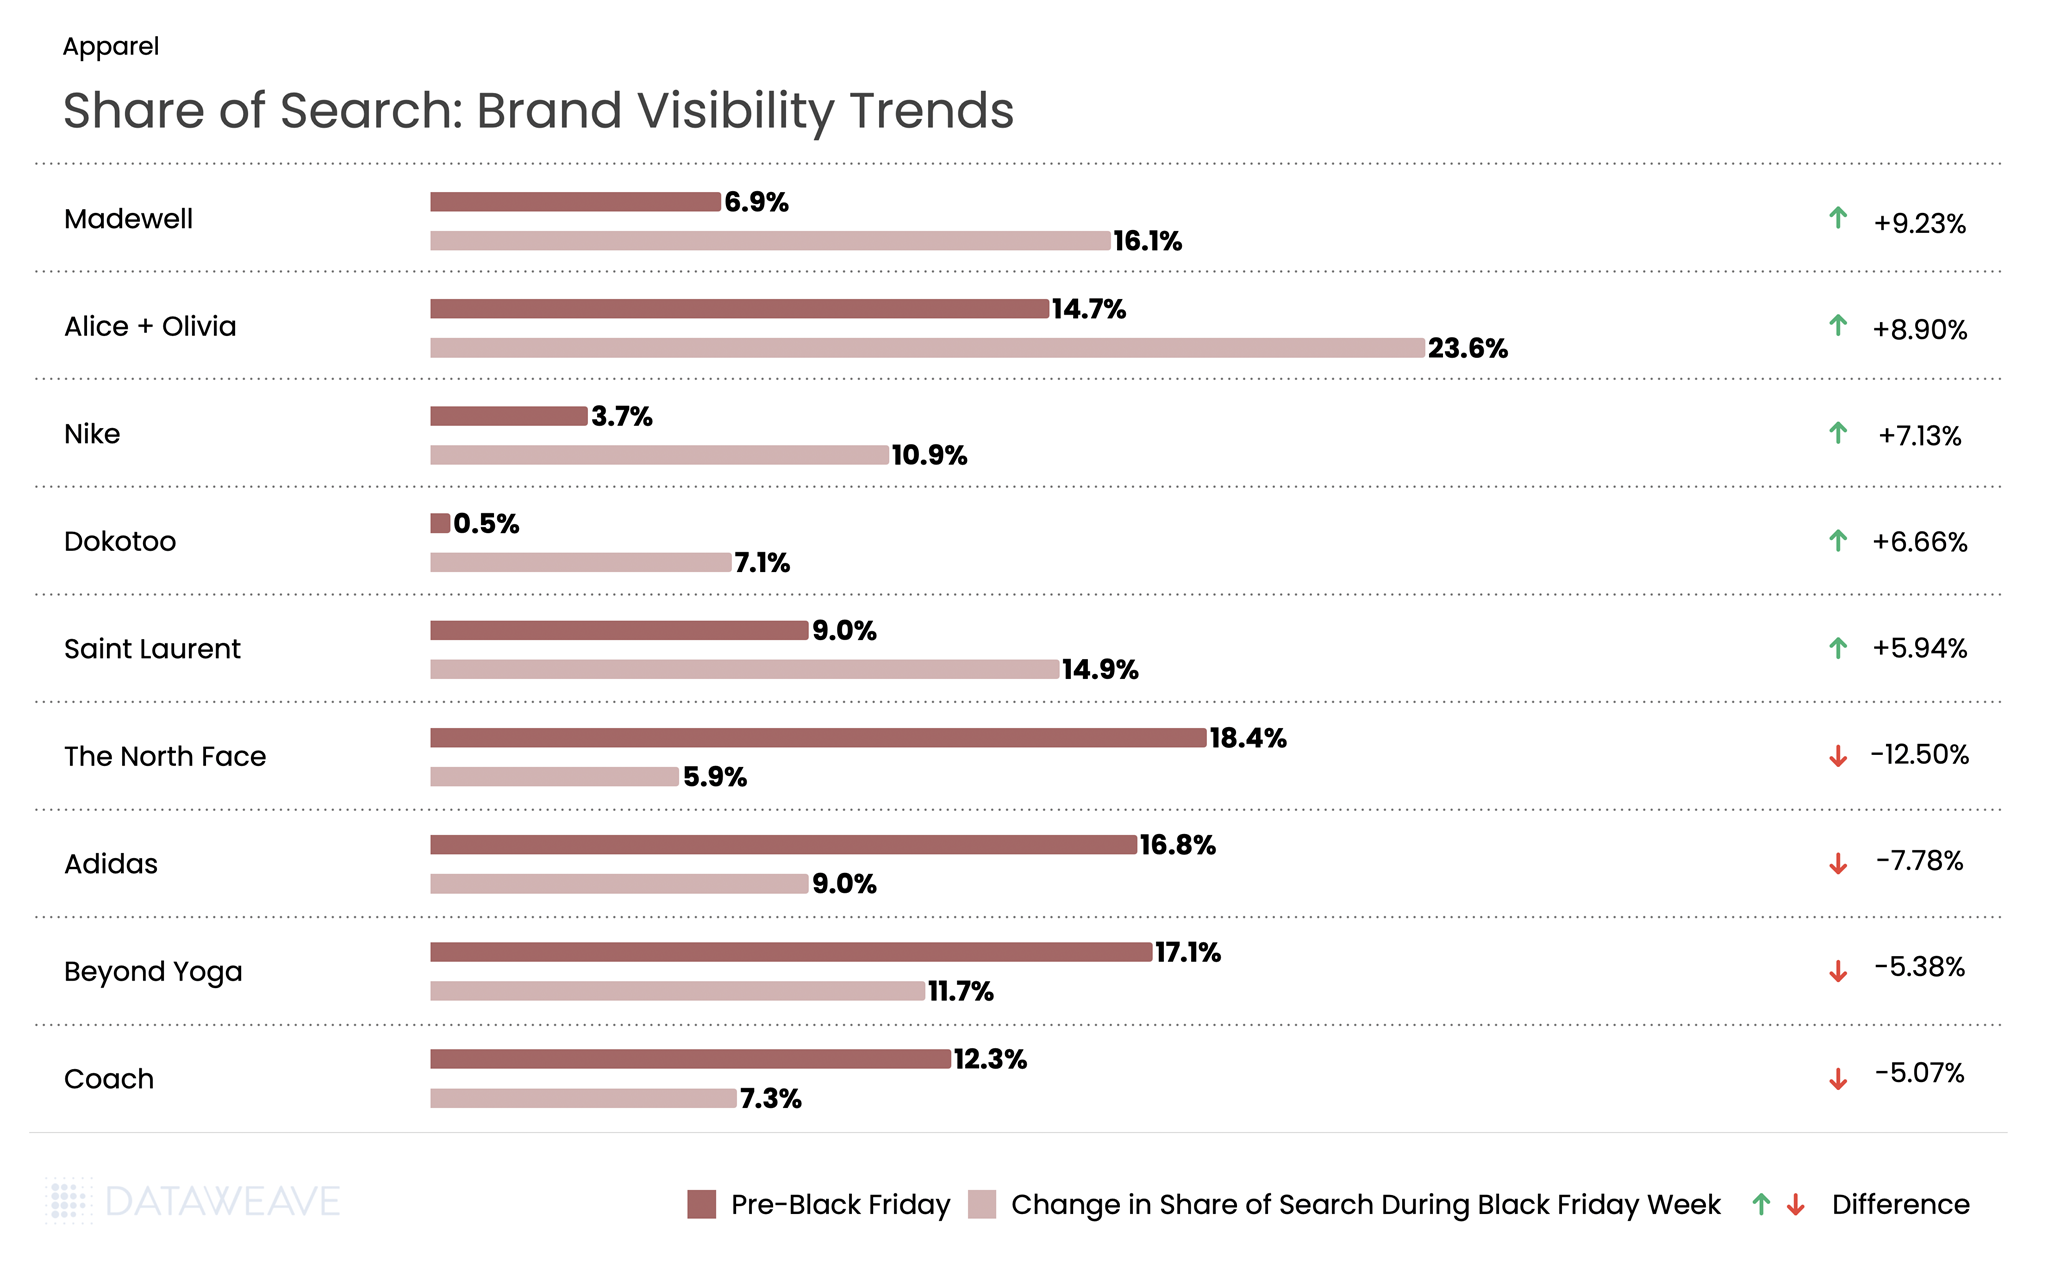
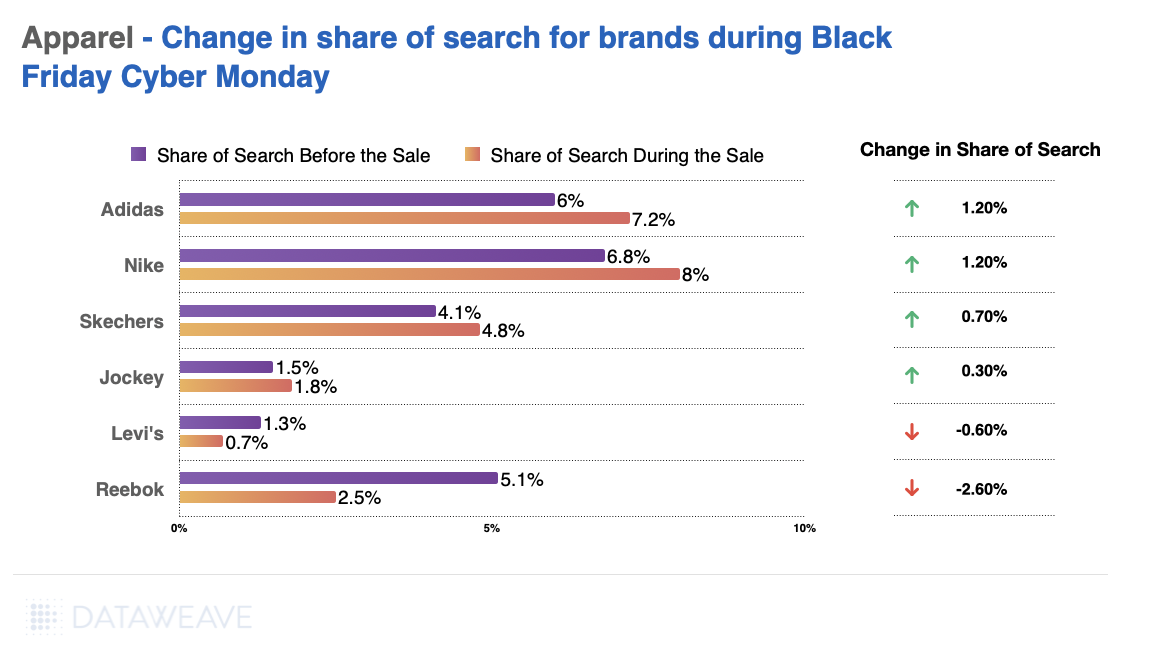
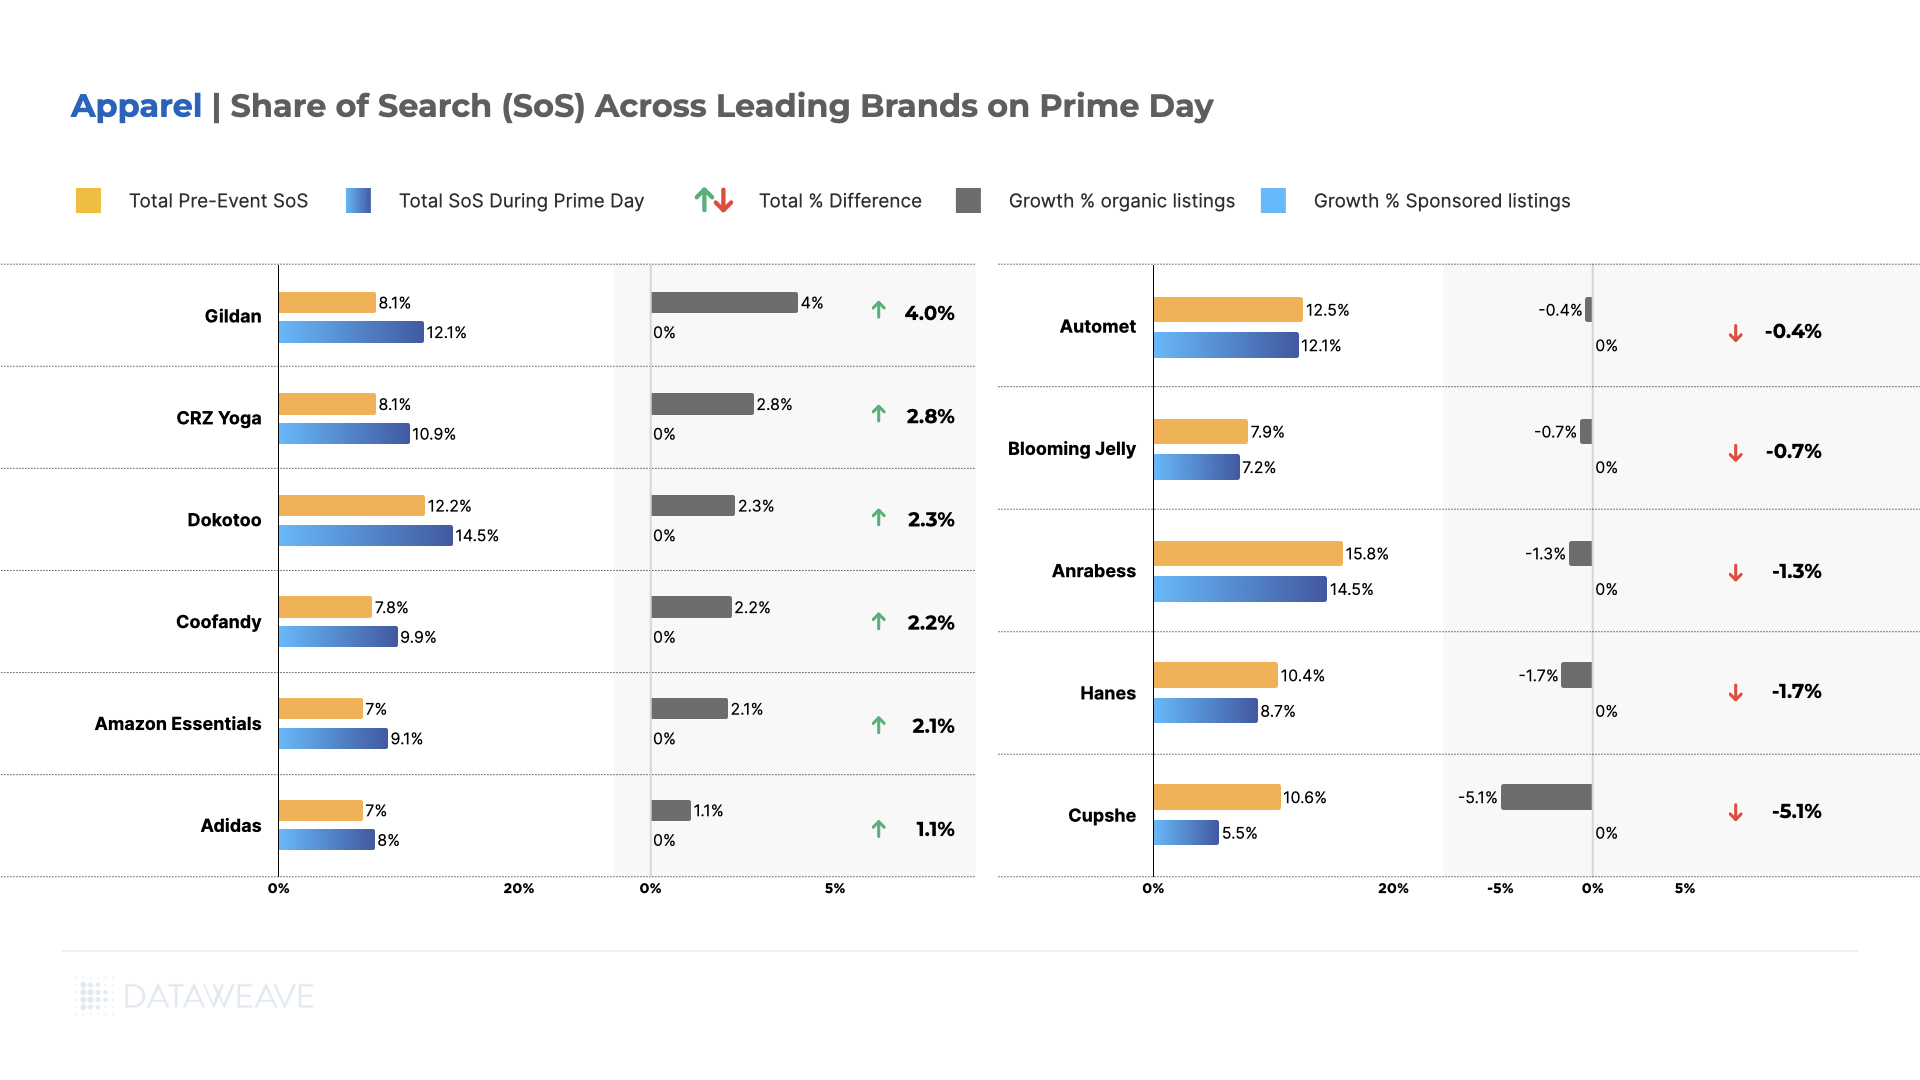
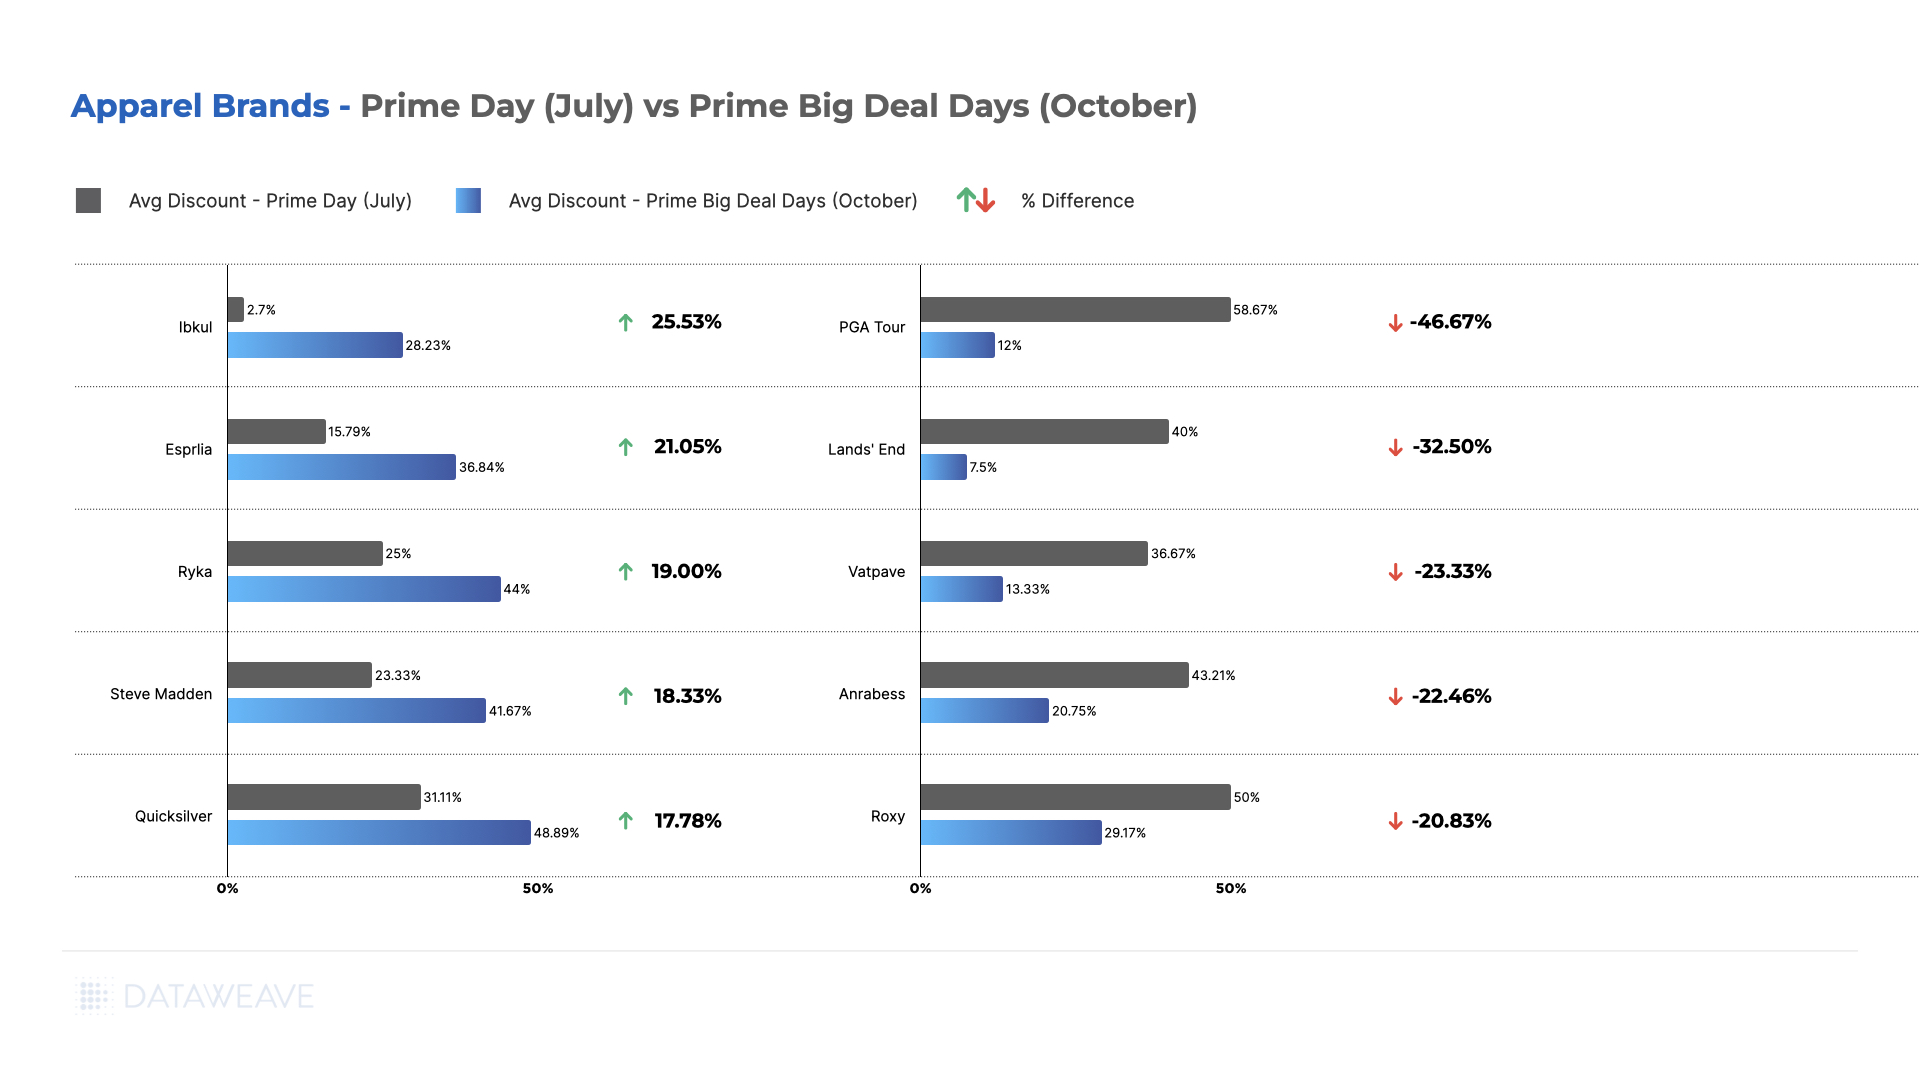
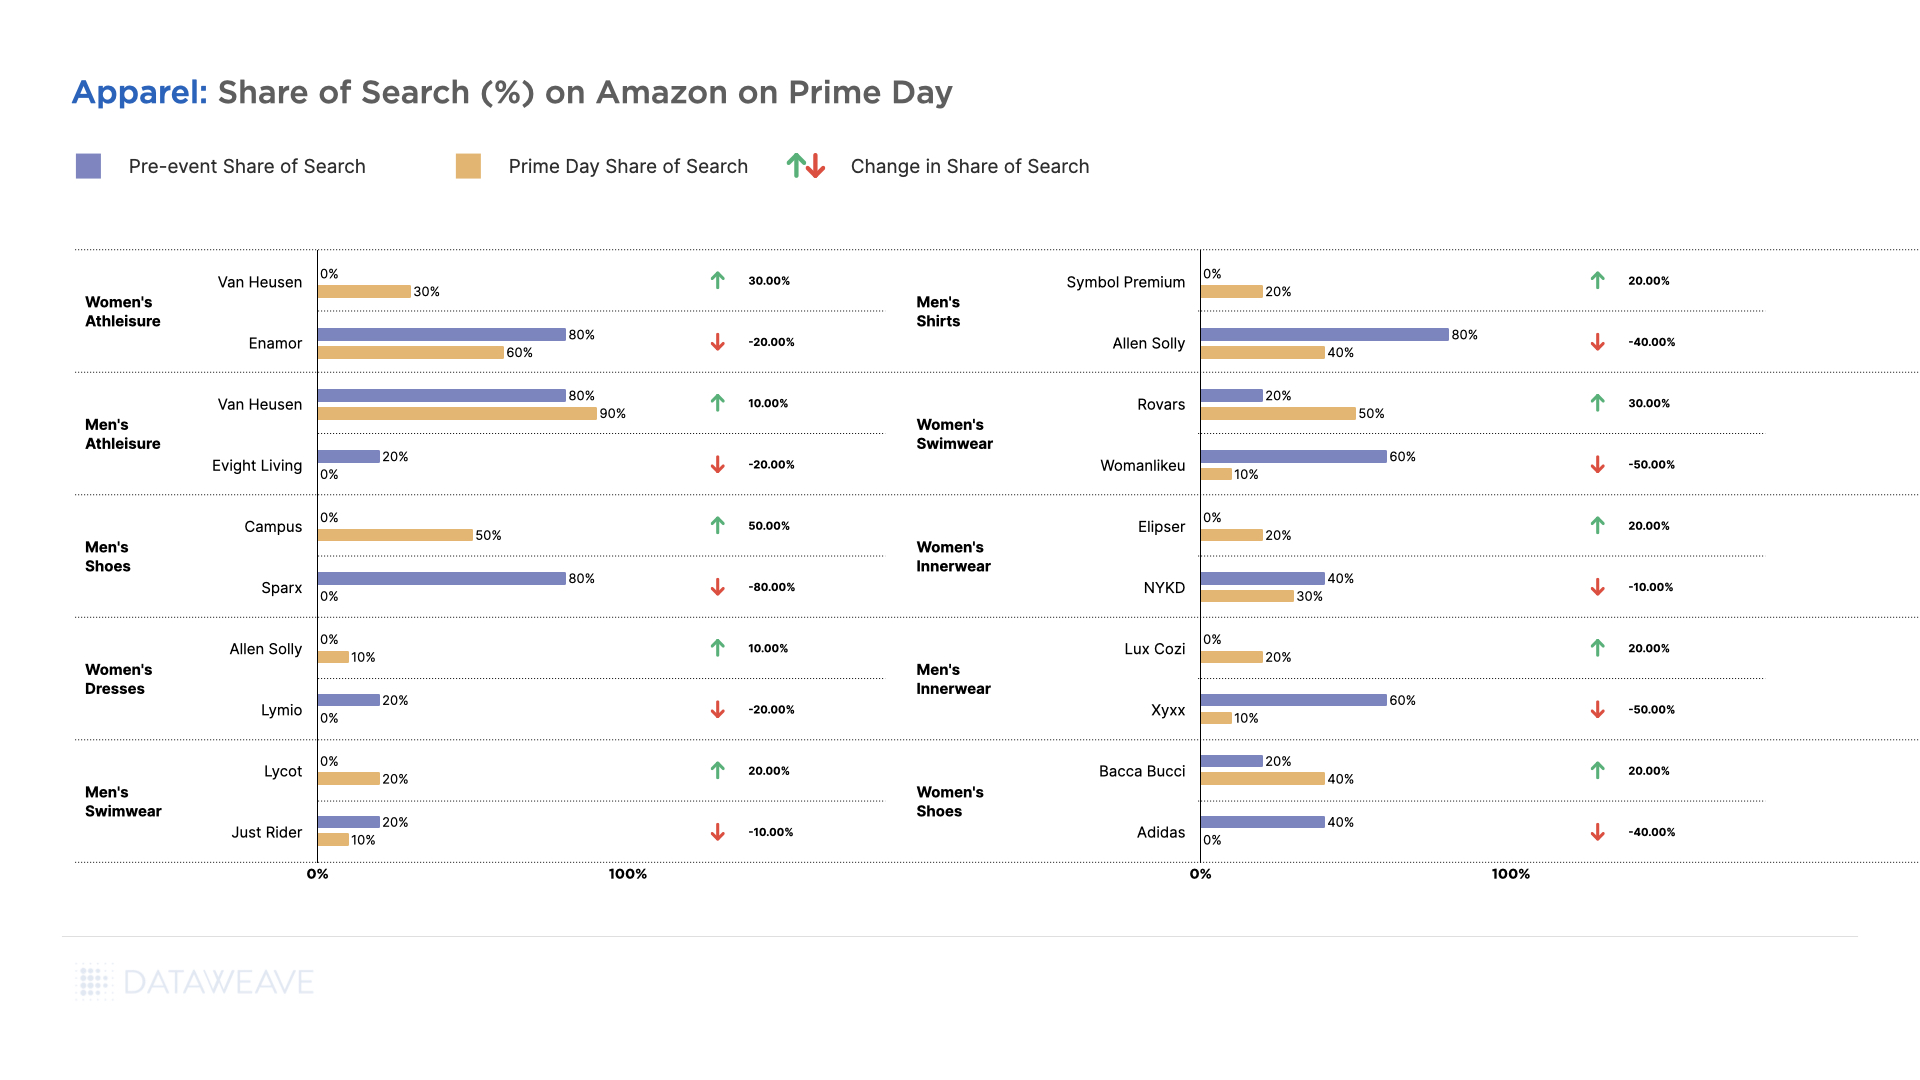
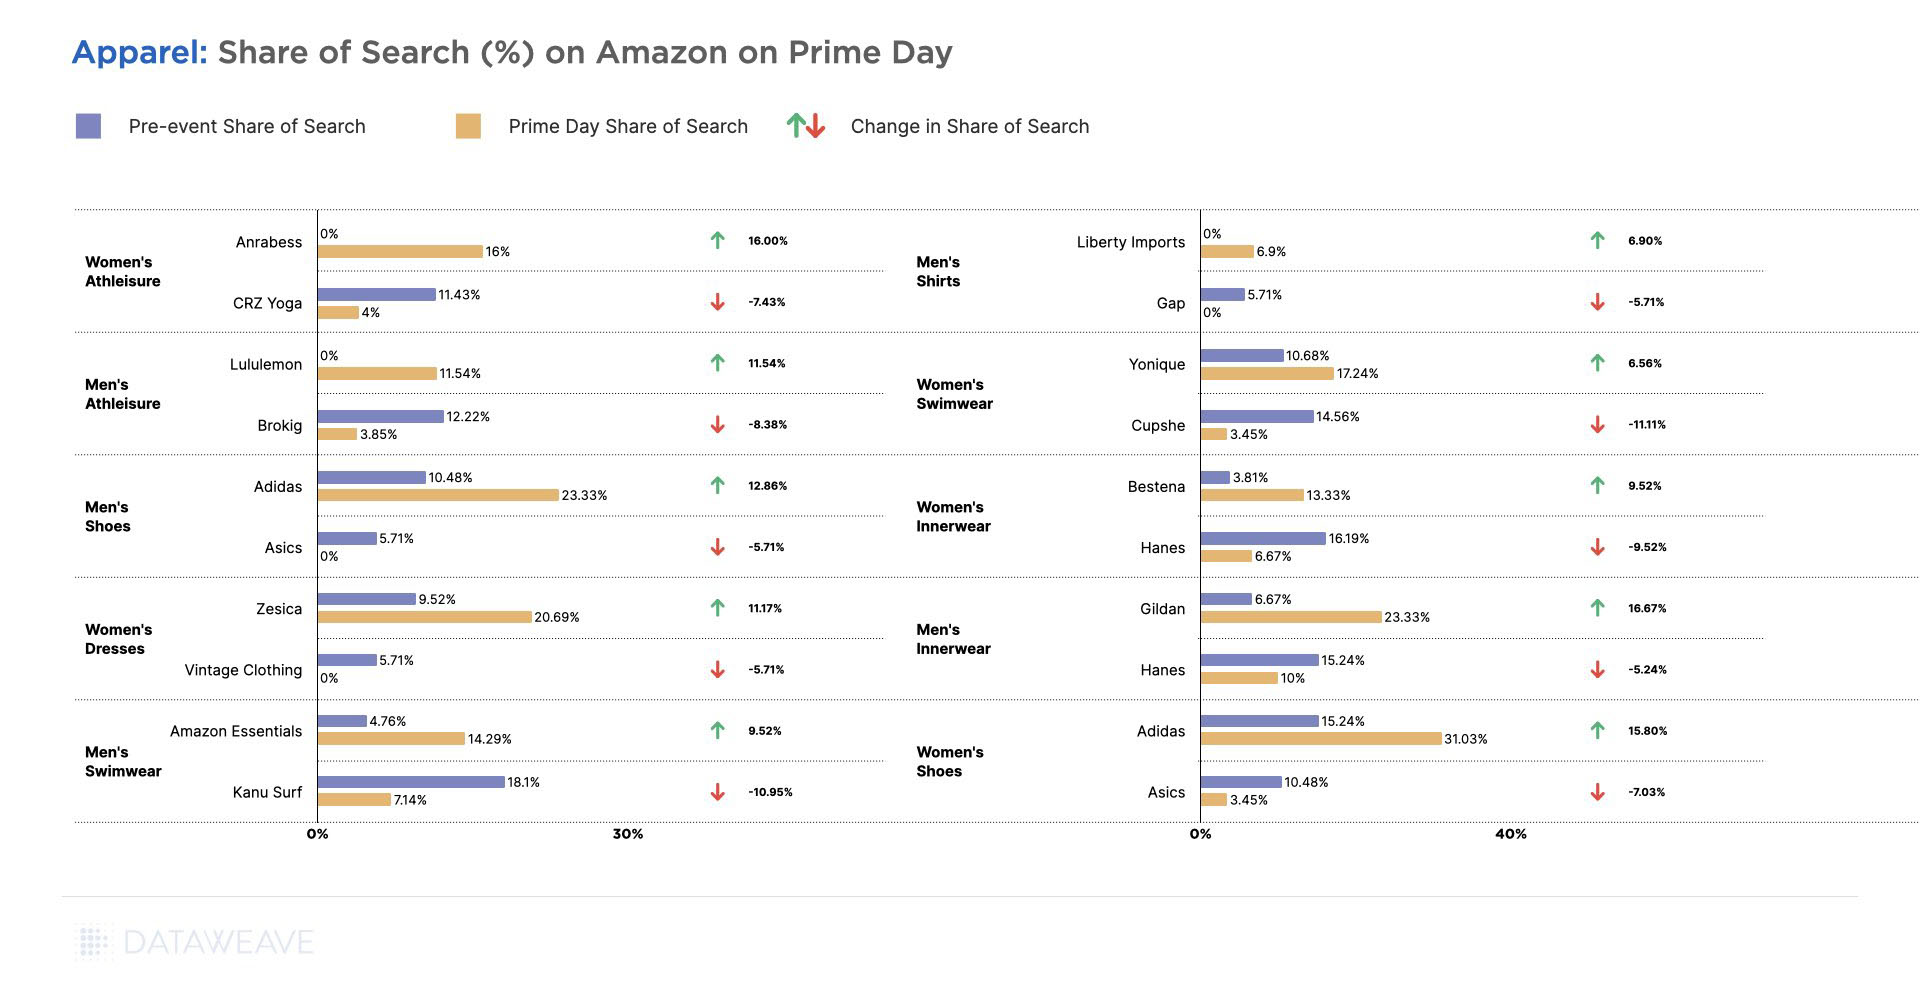
Share of Search: Brand Visibility Trends
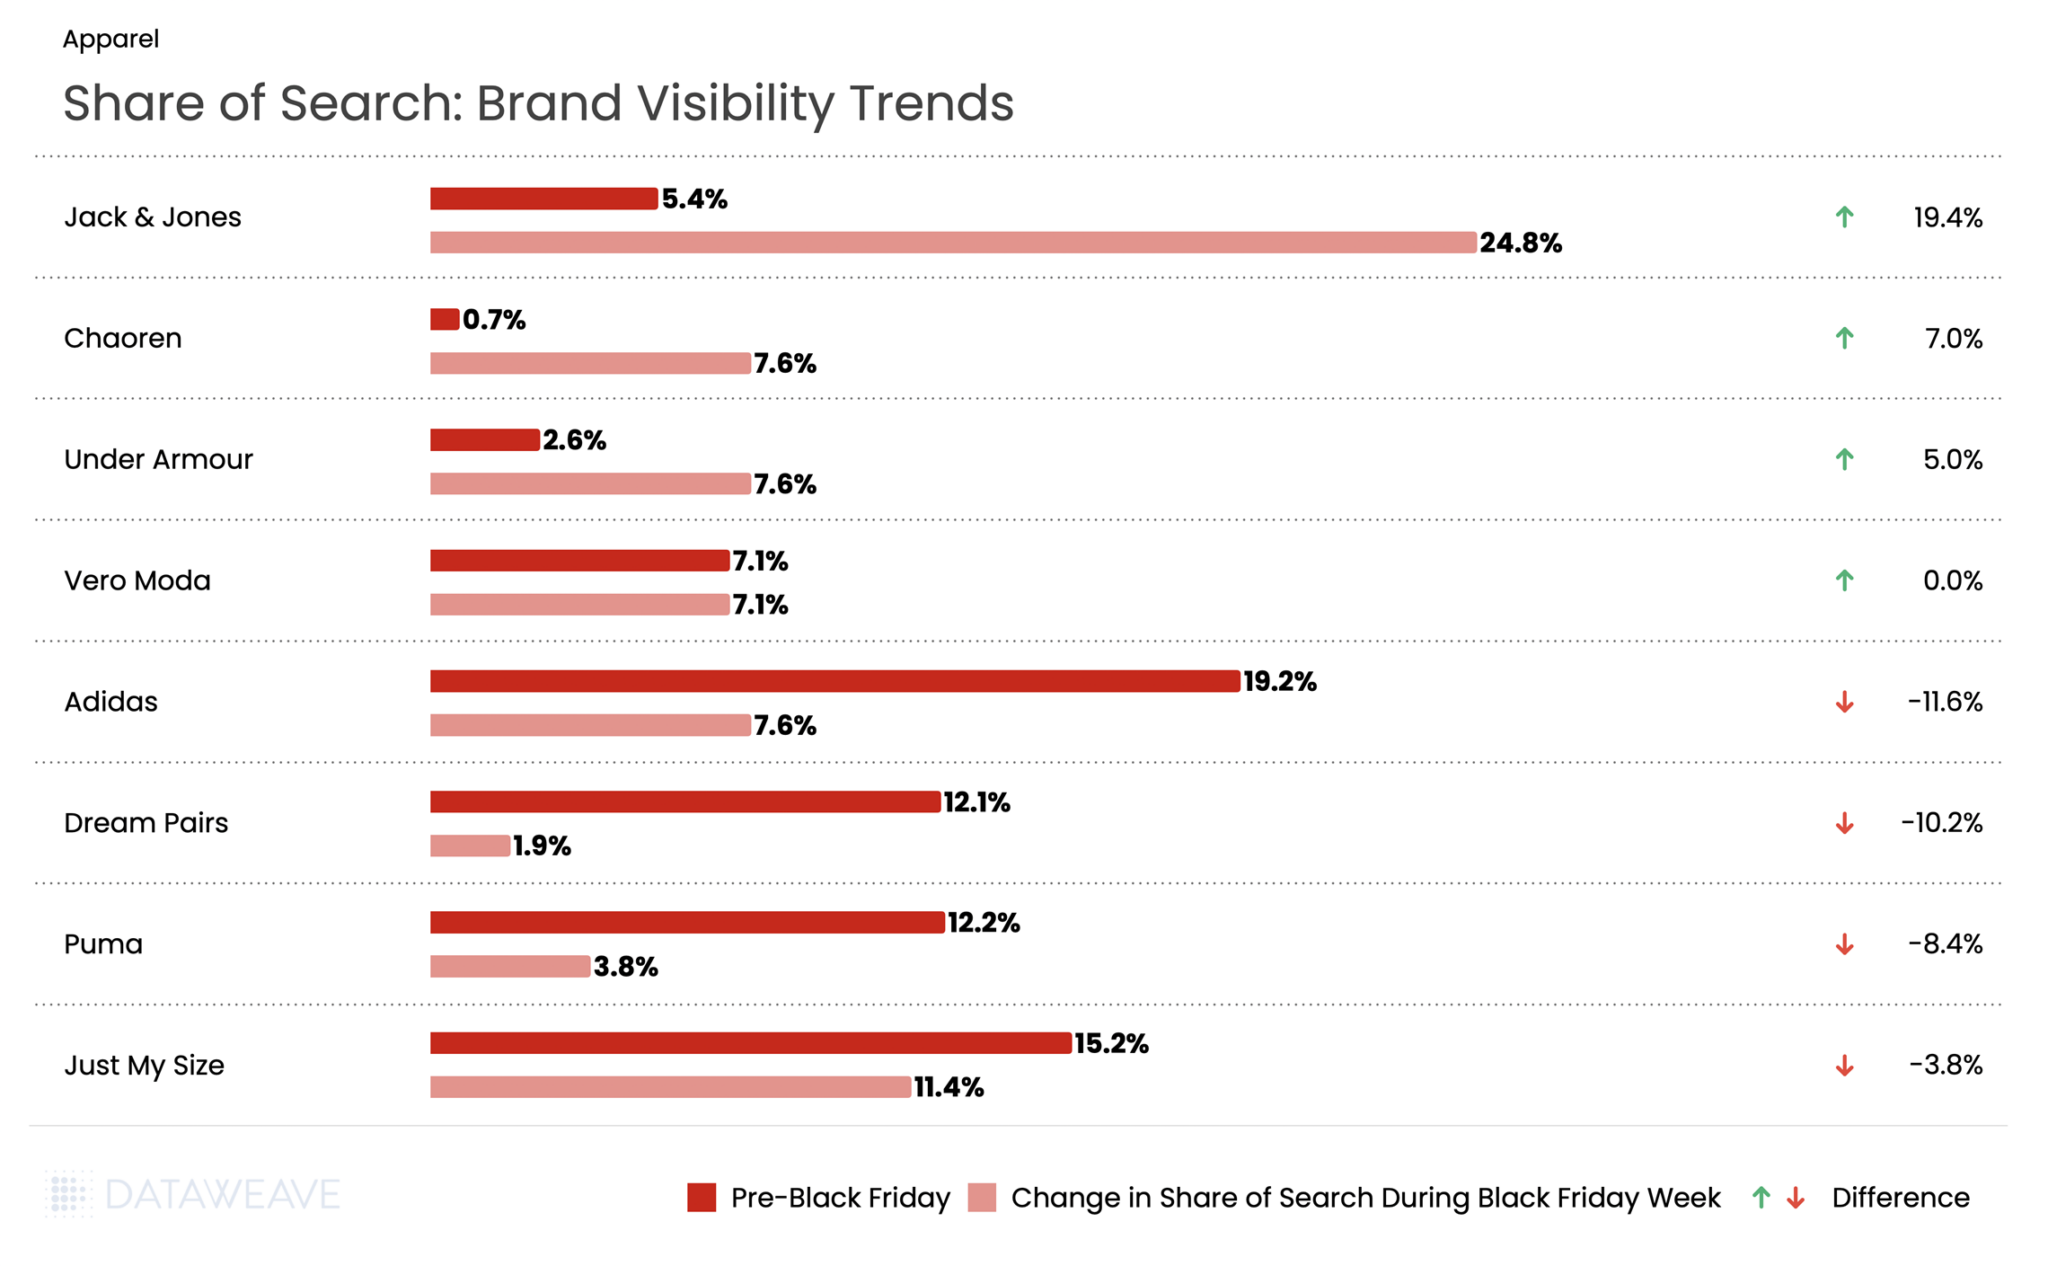
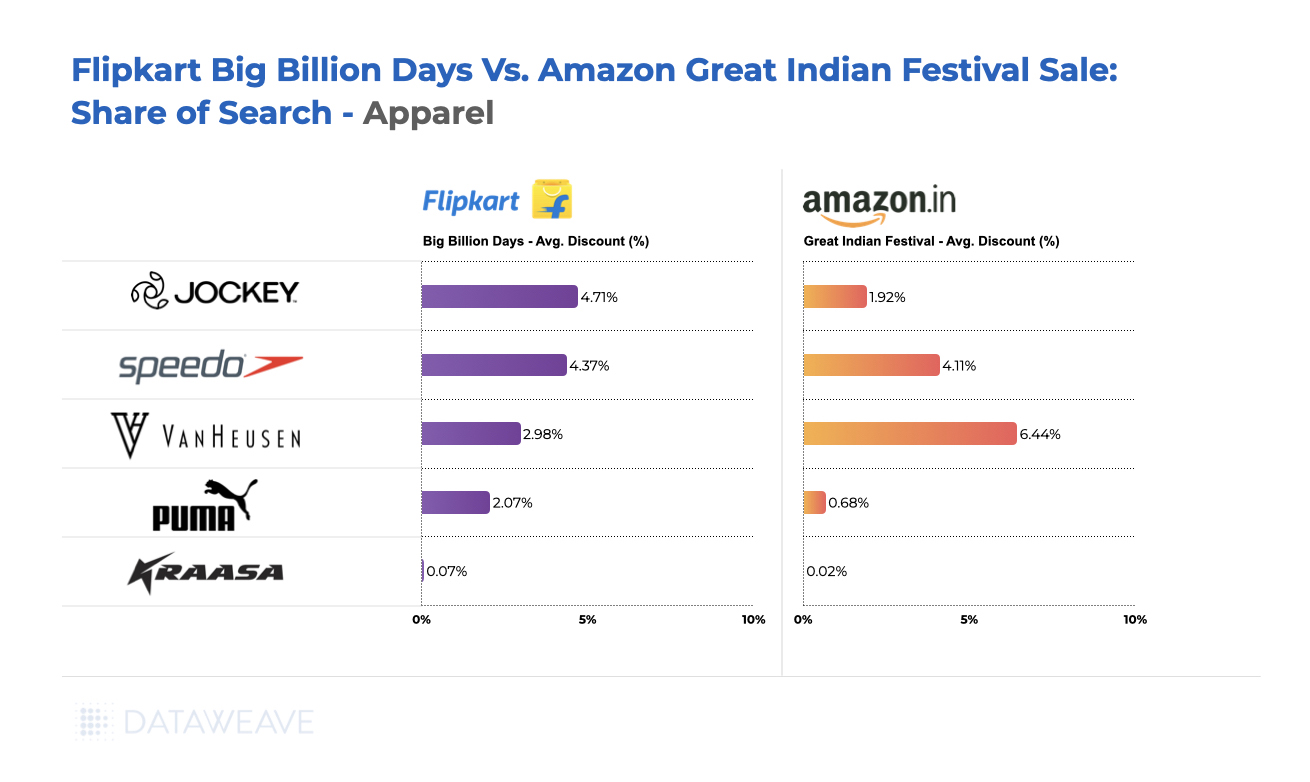
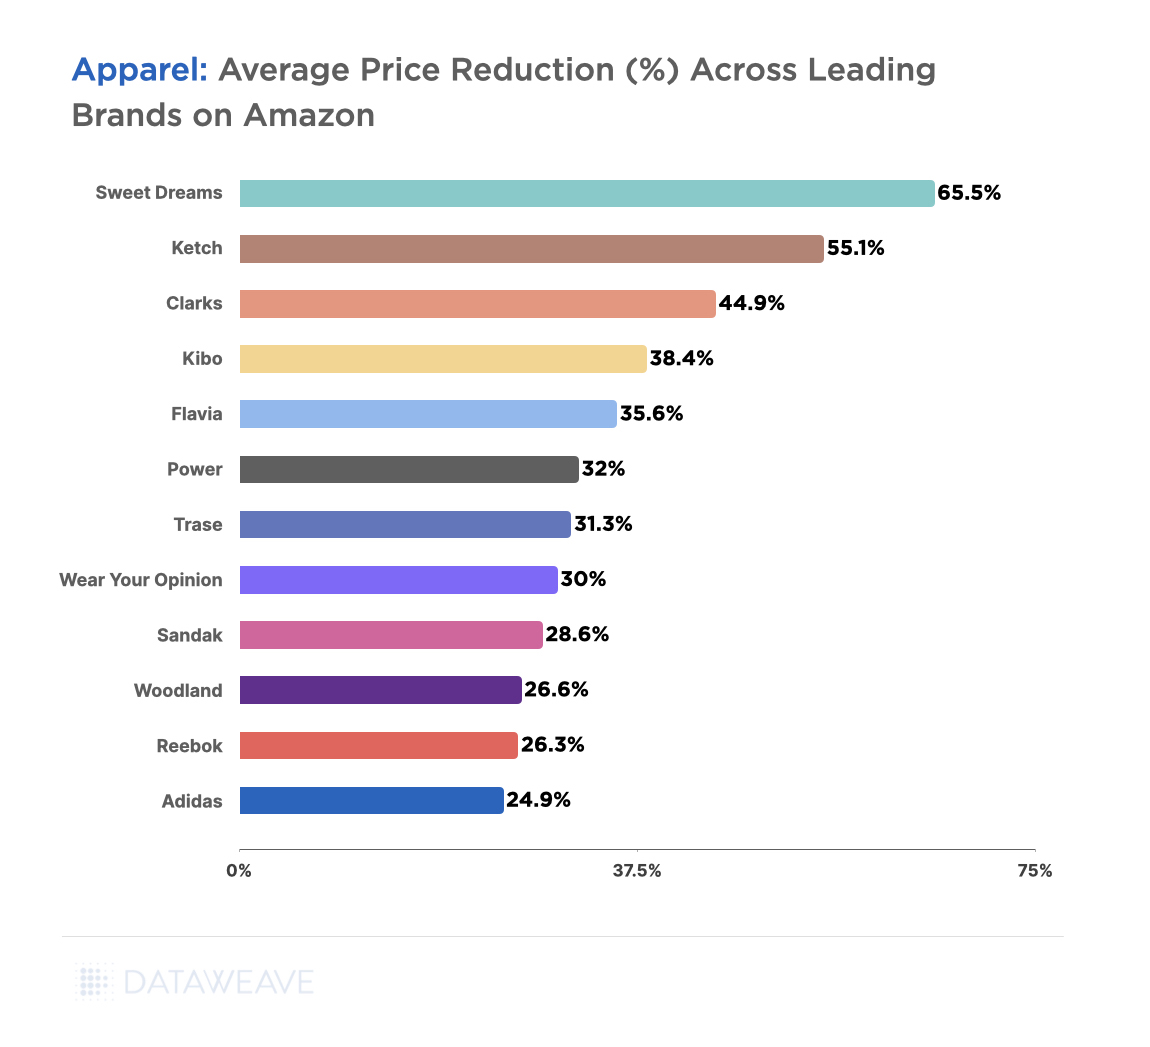
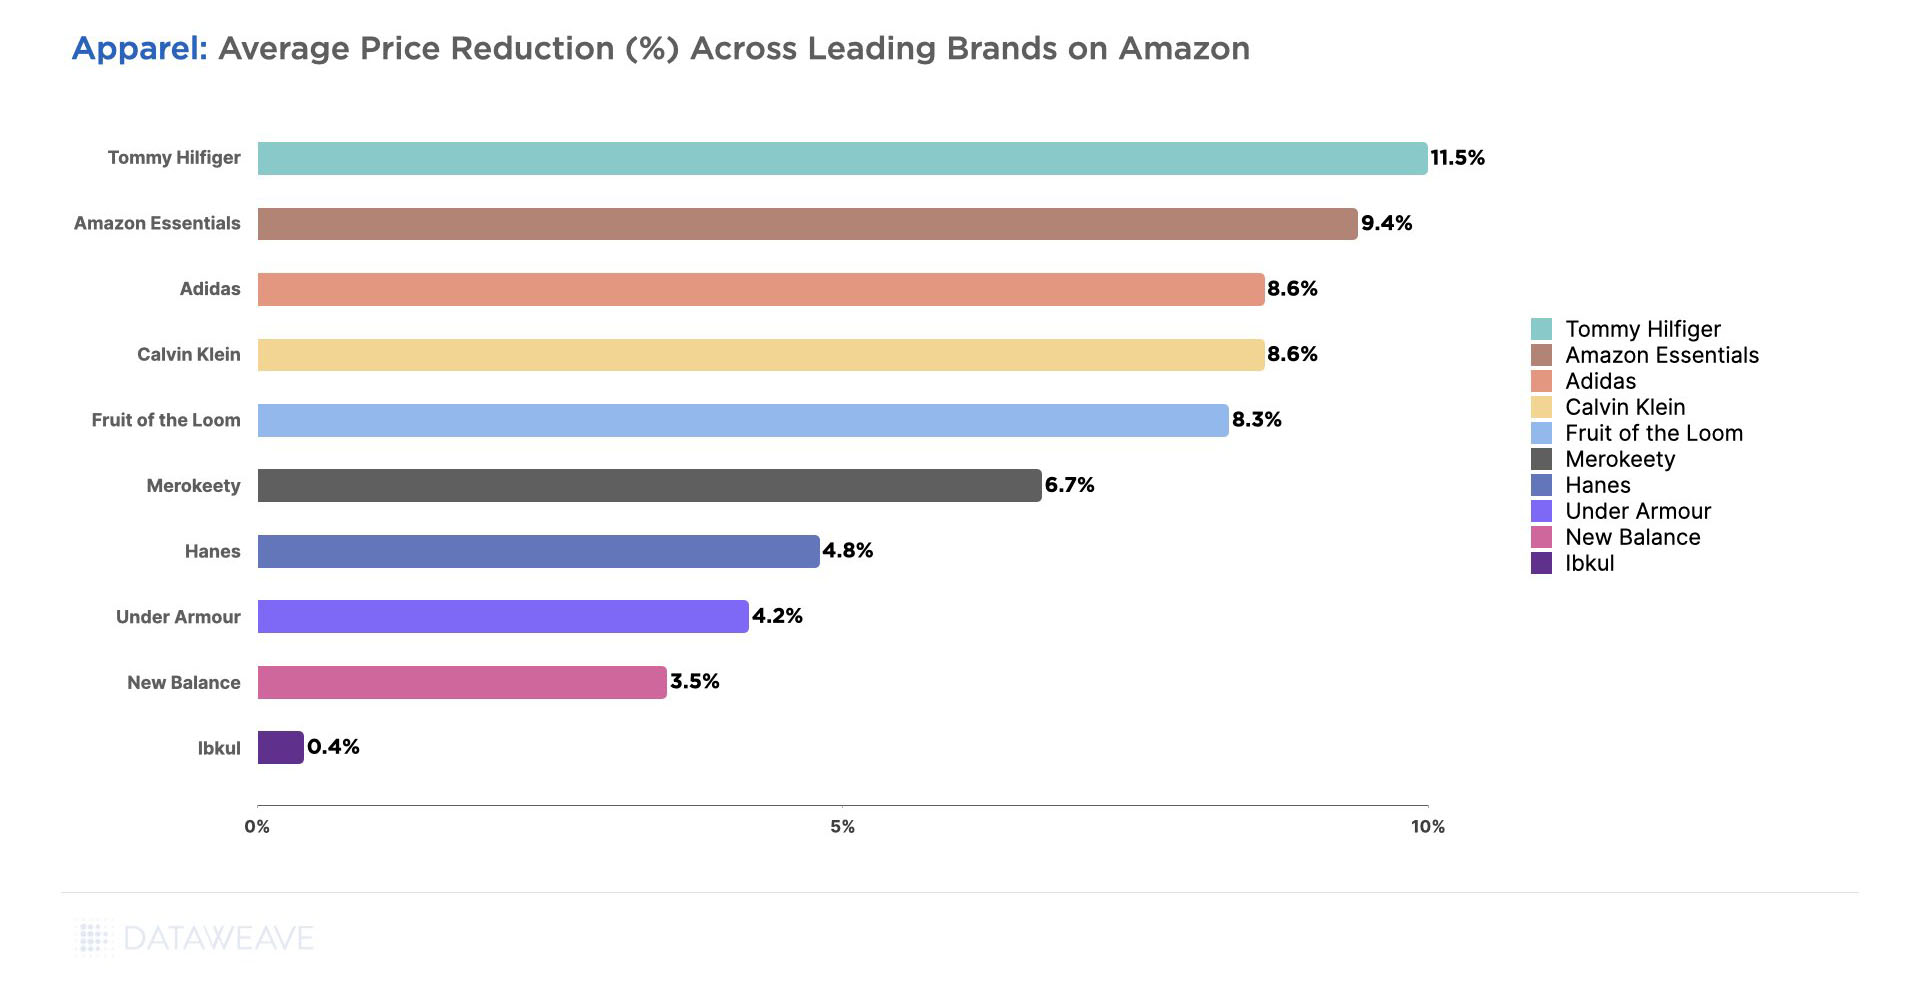
Danish fashion brand Jack & Jones experienced an unprecedented surge with a staggering 19.4% gain in visibility. Sister brand Vero Moda (also owned by Jack & Jones’ parent company Bestseller) maintained flat visibility at 7.1%. Footwear brand Chaoren gained 7%. Meanwhile activewear giant Under Armour rose by 5%.
However, established sportswear giants suffered dramatic visibility losses. Adidas experienced an 11.6% decline in share of search. Dream Pairs saw visibility drop by 10.2%, Puma fell 8.4%, and plus-size brand Just My Size declined by 3.8 %.
Want to understand how DataWeave’s pricing intelligence platform can help your business make data-driven decisions during peak sales events? Contact us to learn more about competitive insights, price intelligence, assortment analytics, content analytics, and digital shelf analytics.
Check out our analysis on Black Friday Pricing and Discount trends in the USA and UK. Follow our blog for more insights on retail pricing trends, brand visibility analysis, and data-driven commerce intelligence.