Category: Share of Search Keyword

  • Mastering Retail Media Metrics: A Deep Dive into Share of Media

    Mastering Retail Media Metrics: A Deep Dive into Share of Media

    Brands are investing millions of dollars in digital retail media to make their products stand out amid unrelenting competition.

    The ad spend on digital retail media worldwide was estimated at USD 114.4 billion in 2022, and the current projections indicate that it will grow to USD 176 billion by 2028. This amounts to a 54% increase in just six years.

    The current surge in digital retail media advertising has led brands to find an effective way to monitor the efficacy of their ad spend. While Share of Search has long been used to measure brand visibility effectively, the metrics often missed tracking ads on retail sites.

    DataWeave’s Share of Media solution helps solve this problem.

    What is the Share of Media?

    At DataWeave, Share of Media is a metric used to measure a brand’s presence in sponsored listings and banner ads on eCommerce platforms. It captures how often a brand appears in paid promotions compared to competitors, offering insights into advertising visibility and effectiveness.

    These days most marketplaces seamlessly blend banner ads and sponsored listings into organic search results. Let’s take a closer look.

    Banner Advertising

    Banner advertising strategically places creative banners across websites—often at the top, bottom, or sides. Some eCommerce platforms also integrate these banners into product search listings.

    Banner Advertising on Amazon_Share of Media Analytics to win the digital shelf

    What makes banner ads so special is the unique ability to allow marketers to use various types of media in a single ad, such as images, auto-play videos, and animations. Brands can also present curated collections of products. This flexibility provides marketers with creative opportunities to differentiate from competitors, capture customer interest, and encourage conversions.
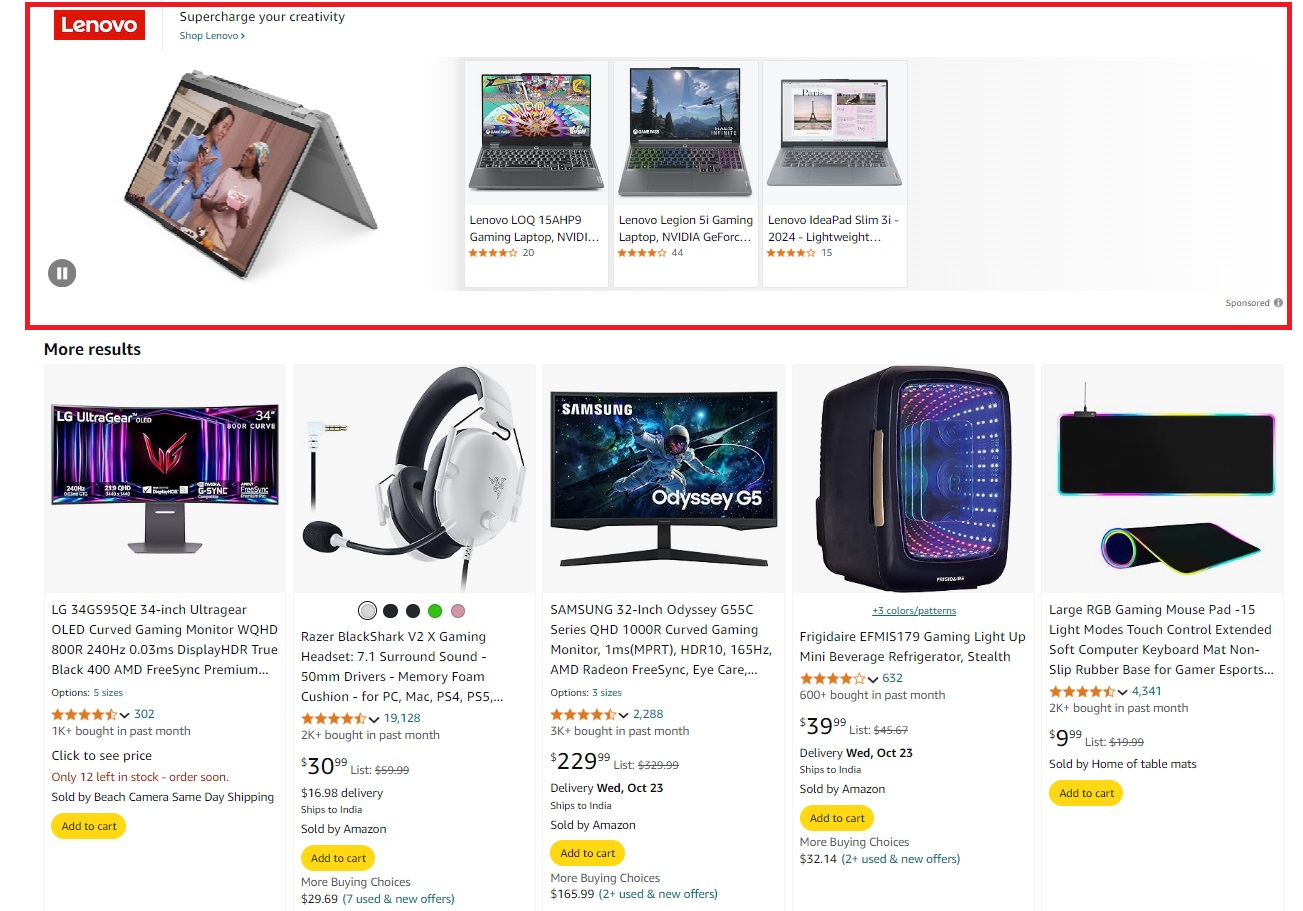
    Sponsored Listings

    Sponsored listings are paid placements within search engine results or eCommerce platforms. They are usually marked as ‘sponsored’ or ‘ad,’ and they often appear at the top of search results and alongside organic product listing results.

    Sponsored Product Listings on Amazon_Share of Media Analytics to win the digital shelf

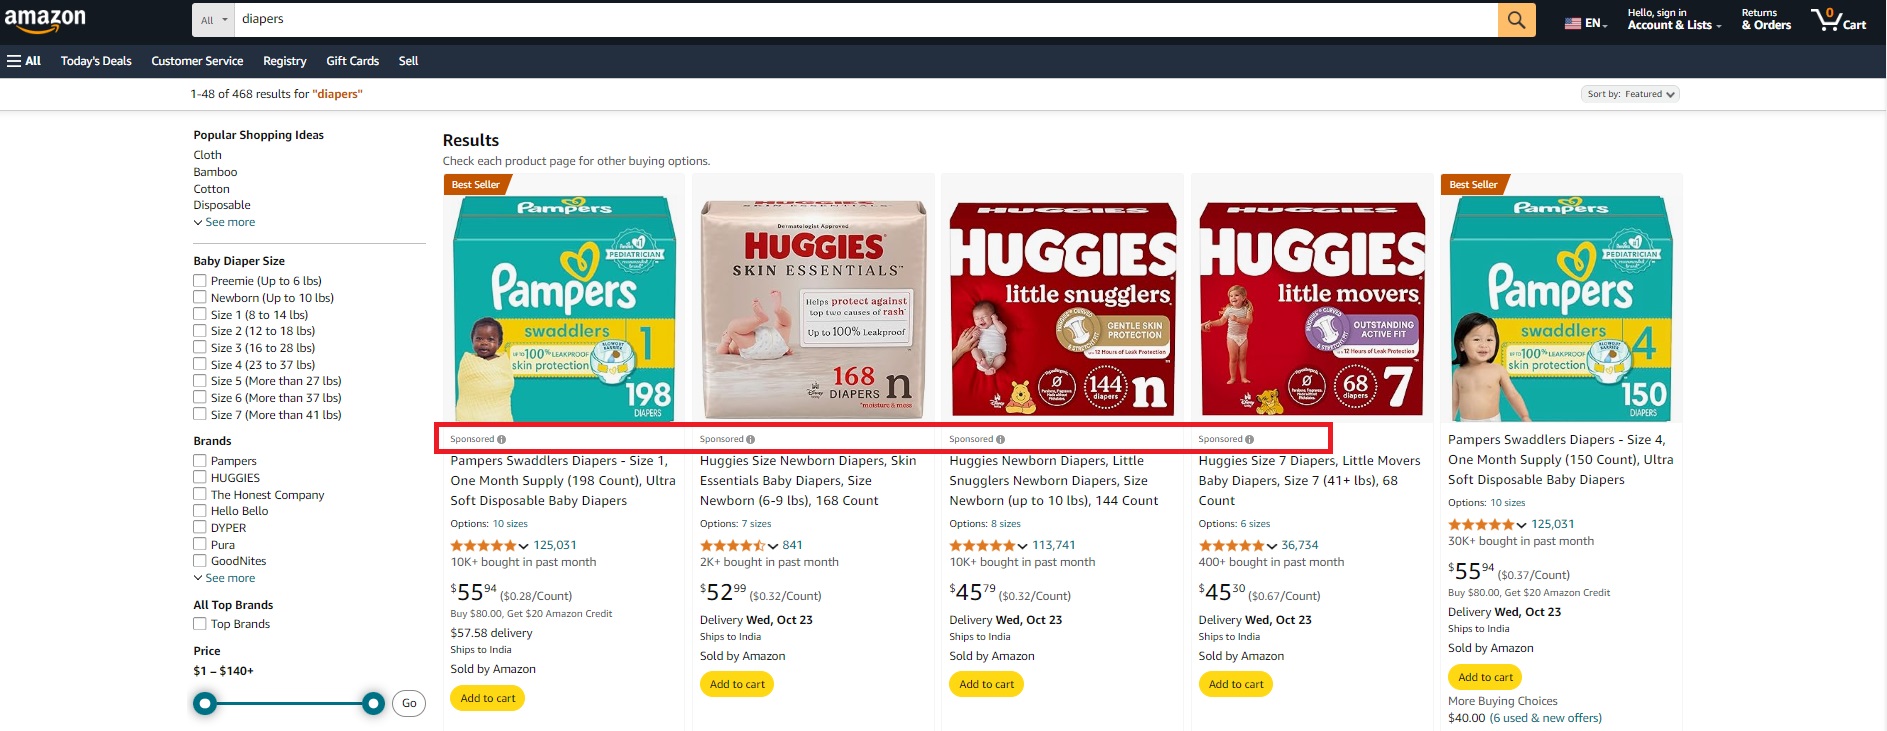
    Unlike organic search results, sponsored listings are prioritized based on the advertiser’s bid amount and relevance to users’ search queries.

    Sponsored listings offer a strategic advantage by enabling businesses to connect directly with consumers who are actively searching for their products. This targeted approach ensures that marketing efforts are focused on individuals with high intent of making a purchase, maximizing the potential return on investment.

    The Power of Banner Ads and Sponsored Listings

    Banner ads and sponsored listings are great choices for boosting customer engagement and product sales. Here are four key advantages they offer:

    • Enhanced Visibility: Digital retail media strategically places your brand where it will stand out—outshining competitors and grabbing the attention of high-purchase-intent consumers.
    • Precision in Reach: These ads target specific keywords or categories, allowing for highly focused advertising based on demographics and search intent.
    • Minimal Conversion Friction: Smooth transitions from ads to a brand’s native store or product listing on the marketplace keep conversion friction to a minimum.
    • Brand Awareness and Recall: Consistent exposure to your brand through banner ads and sponsored product listings can leave lasting impressions and build brand recognition.

    The bottom line is that it’s increasingly important for brands to monitor their Share of Media.

    How to Monitor Your Brand’s Share of Media

    DataWeave’s Digital Shelf Analytics (DSA) platform extends beyond the traditional Share of Search metrics and provides robust support for monitoring the Share of Media.

    DataWeave monitors the Share of Media in two ways: keywords and product categories. Users can view Share of Media insights through aggregated views, trend charts, and detailed tables. The views are designed to show brand visibility and the overall competitive landscape. For example, the screenshot below, taken from DataWeave’s dashboard, showcases the Share of Media across keywords, categories, and retailers.

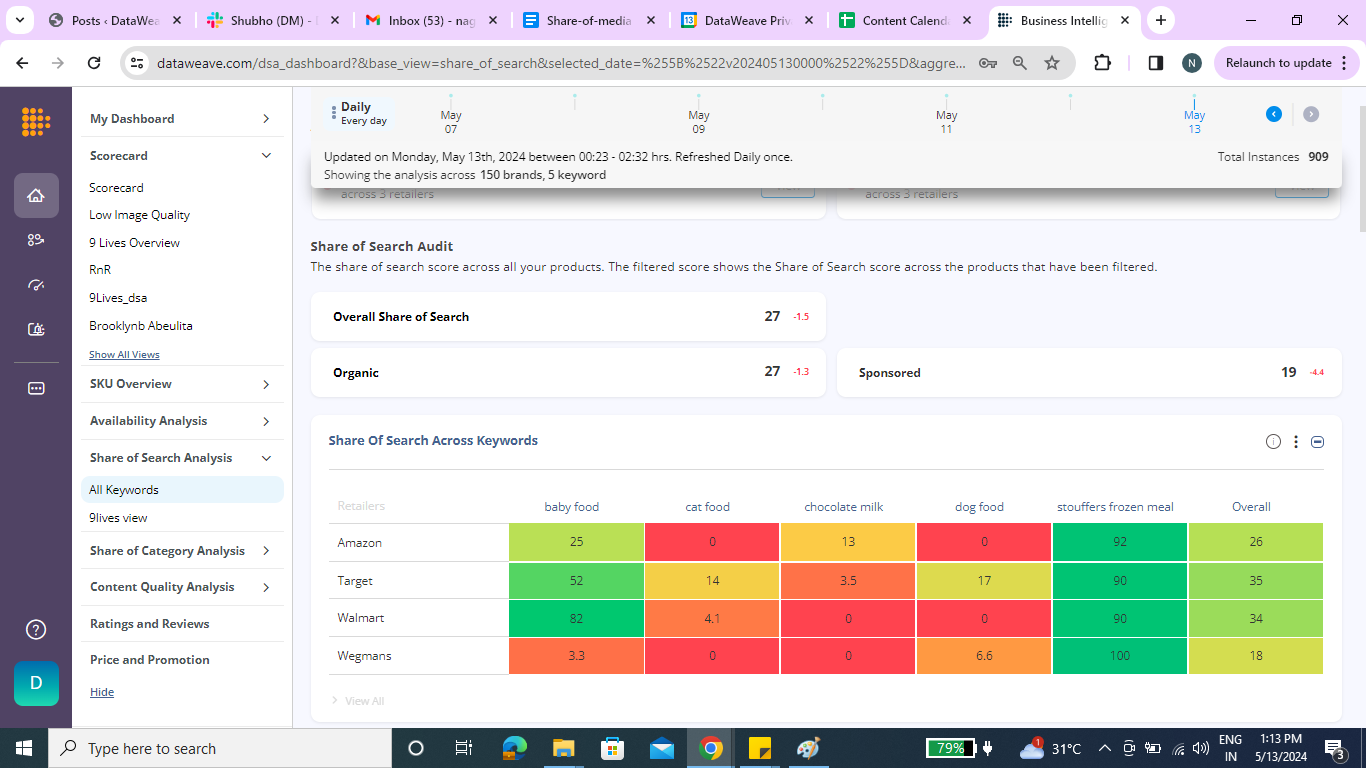
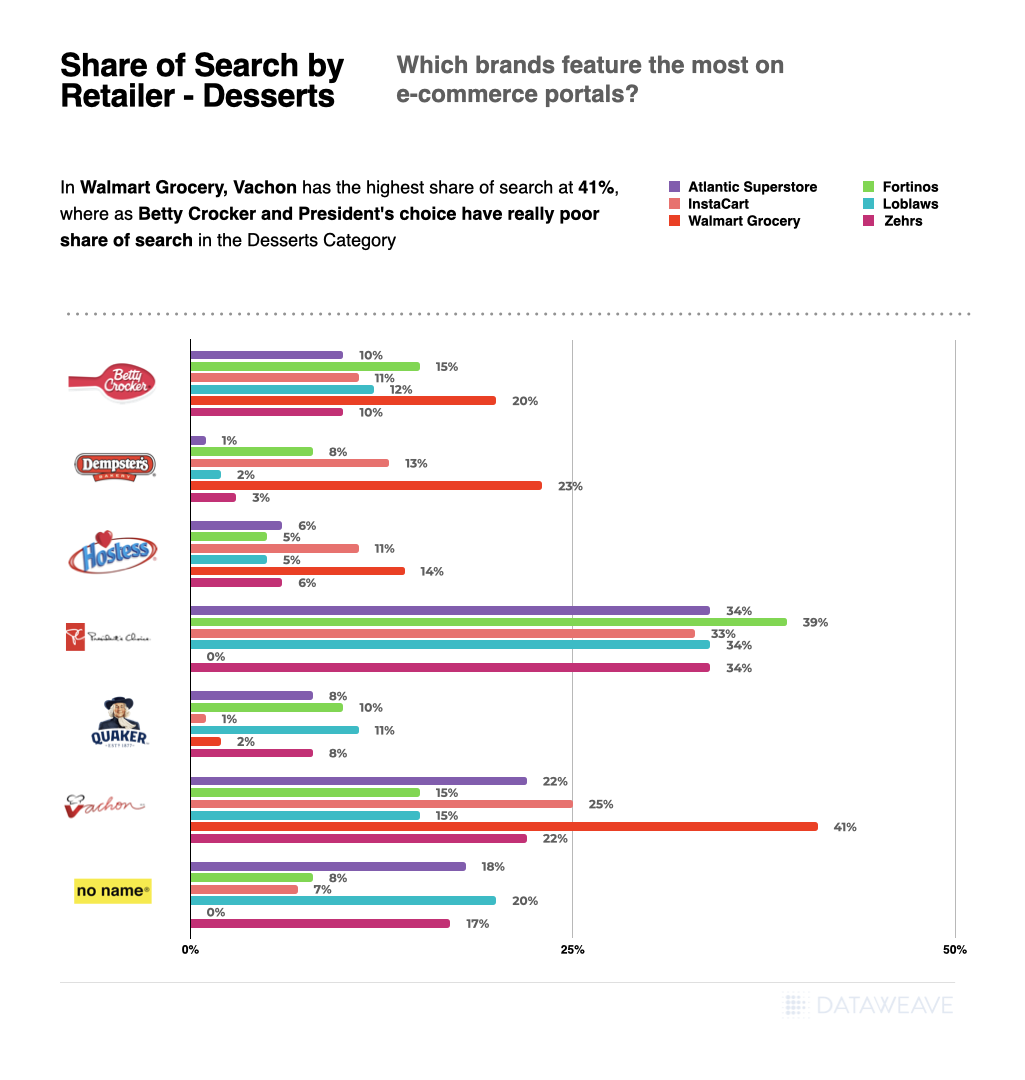
    Share of Media by Keyword

    The Share of Media metric captures a brand’s advertising presence within search listings for a designated keyword. This provides a comprehensive view of a brand’s visibility and promotional efforts across retail platforms, helping brands validate and gauge the effectiveness of their ad spend.

    For example, the screenshot below shows the trend of manufacturer’s Share of Media by keyword—‘baby food.’

    Share of media by keyword_Share of Media Analytics to win the digital shelf

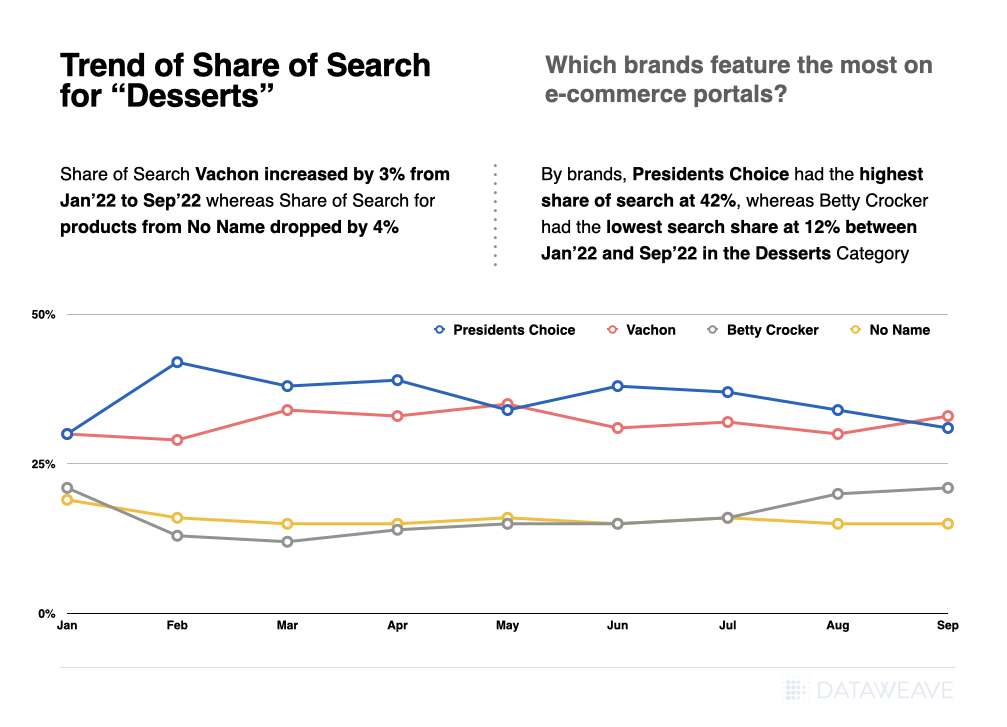
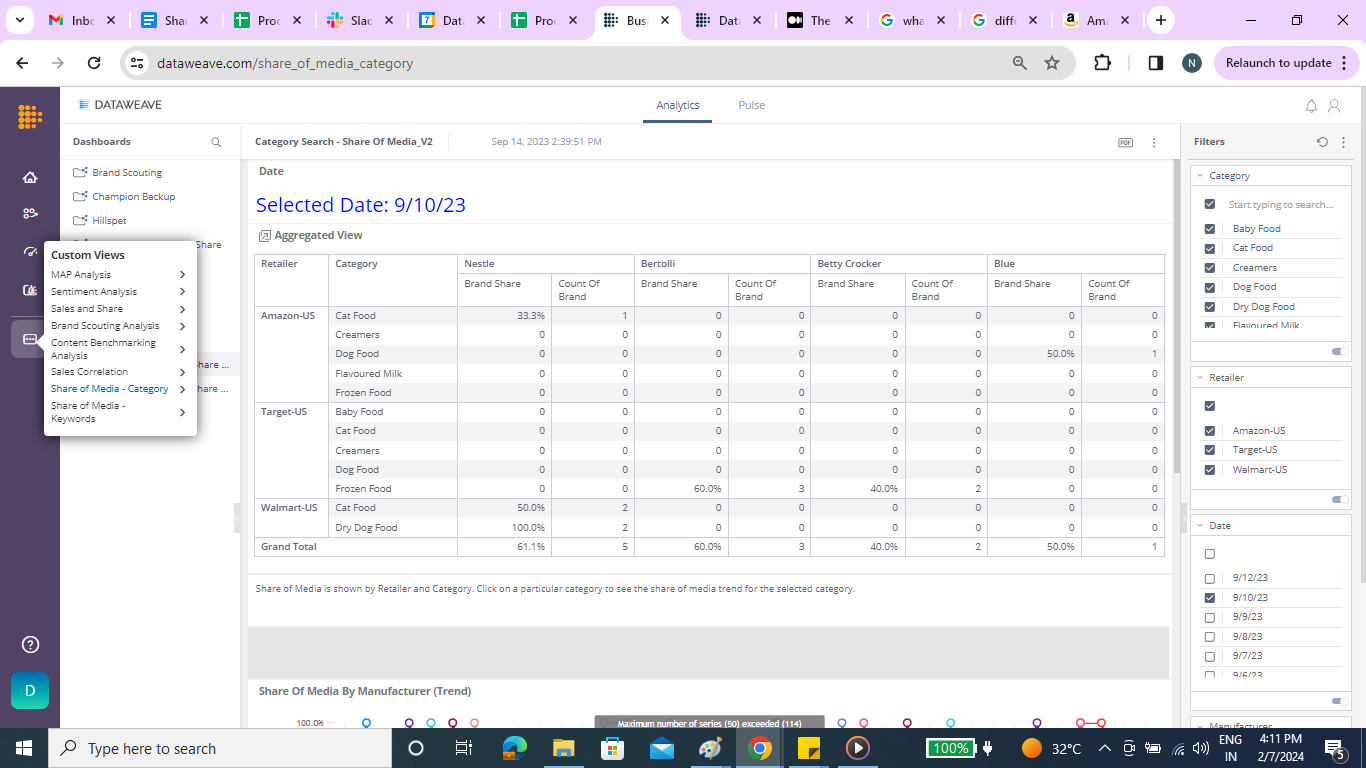
    Share of Media by Category

    The Share of Media metric measures the presence of brands’ banner ads and sponsored listings across product categories on retail sites. This helps brands see which product categories require more investment, making it easier for them to spend their ad budget wisely.

    The screenshot below illustrates manufacturers’ Share of Media by category across retailers.

    Share of Media: An Essential Ecommerce Metric

    As retail media continues to evolve, our analytics must follow—after all, knowledge is a competitive advantage. In the dynamic world of eCommerce, where competition is fierce and consumer attention is scarce, understanding your share of media is crucial.

    Analyzing the Share of Media can give brands a competitive edge. By regularly monitoring and analyzing this metric, you can make data-driven decisions to improve your brand’s visibility, attract more customers, and ultimately drive sales growth. With a deeper understanding of their target audience and market dynamics, brands can refine promotional efforts to drive more effective results and optimize return on ad spend (ROAS).

    For more information on how Digital Shelf Analytics can enhance your brand’s digital shelf presence, request a demo or contact us at contact@dataweave.com.

  • Capturing and Analyzing Retail Mobile App Data for Digital Shelf Analytics: Are Brands Missing Out?

    Capturing and Analyzing Retail Mobile App Data for Digital Shelf Analytics: Are Brands Missing Out?

    Consumer brands around the world increasingly recognize the vital role of tracking and optimizing their digital shelf KPIs, such as Content Quality, Share of Search, Availability, etc. These metrics play a crucial role in boosting eCommerce sales and securing a larger online market share. With the escalating requirements of brands, the sophistication of top Digital Shelf Analytics providers is also on the rise. Consequently, the adoption of digital shelf solutions has become an essential prerequisite for today’s leading brands.

    As brands and vendors continue to delve further and deeper into the world of Digital Shelf Analytics, a significant and often overlooked aspect is the analysis of digital shelf data on mobile apps. The ability of solution providers to effectively track and analyze this mobile-specific data is crucial.

    Why is this emphasis on mobile apps important?

    Today, the battle for consumer attention unfolds not only on desktop web platforms but also within the palm of our hands – on mobile devices. As highlighted in a recent Insider Intelligence report, customers will buy more on mobile, exceeding 4 in 10 retail eCommerce dollars for the first time.

    Moreover, thanks to the growth of delivery intermediaries like Instacart, DoorDash, Uber Eats, etc., shopping on mobile apps has received a tremendous organic boost. According to an eMarketer report, US grocery delivery intermediary sales are expected to reach $68.2 billion in 2025, from only $8.8 billion in 2019.

    In essence, mobile is increasingly gaining share as the form factor of choice for consumers, especially in CPG. In fact, one of our customers, a leading multinational CPG company, revealed to us that it sees up to 70% of its online sales come through mobile apps. That’s a staggering number!

    The surge in app usage reflects a fundamental change in consumer behavior, emphasizing the need for brands to adapt their digital shelf strategies accordingly.

    Why Brands Need To Look at Apps and Desktop Data Differently

    Conventionally, brands that leverage digital shelf analytics rely on data harnessed from desktop sites of online marketplaces. This is because capturing data reliably and accurately from mobile apps is inherently complex. Data aggregation systems designed to scrape data from web applications cannot easily be repurposed to capture data on mobile apps. It requires dedicated effort and exceptional tech prowess to pull off in a meaningful and consistent way.

    In reality, it is extremely important for brands to track and optimize their mobile digital shelf. Several digital shelf metrics vary significantly between desktop sites and mobile apps. These differences are natural outcomes of differences in user behavior between the two form factors.

    One of these metrics that has a huge impact on a brand’s performance on retail mobile apps is their search discoverability. Ecommerce teams are well aware of the adverse impact of the loss of even a few ranks on search results.

    Anyone can easily test this. Searching something as simple as “running shoes” on the Amazon website and doing the same on its mobile app shows at least a few differences in product listings among the top 20-25 ranks. There are other variances too, such as the number of sponsored listings at the top, as well as the products being sponsored. These variations often result in significant differences in a brand’s Share of Search between desktop and mobile.

    Share of Search is the share of a brand’s products among the top 20 ranked products in a category or subcategory, providing insight into a brand’s visibility on online marketplaces.

    Picture a scenario in which a brand heavily depends on desktop digital shelf data, confidently assuming it holds a robust Share of Search based on reports from its Digital Shelf Analytics partner. However, unbeknownst to the team, the Share of Search on mobile is notably lower, causing a detrimental effect on sales.

    To fully understand the scale of these differences, we decided to run a small experiment using our proprietary data analysis and aggregation platform. We restricted our analysis to just Amazon.com and Amazon’s mobile app. However, we did cover over 13,000 SKUs across several shopping categories to ensure the sample size is strong.

    Below, we provide details of our key findings.

    Share of Search on The Digital Shelf – App Versus Desktop

    Our analysis focused on three popular consumer categories – Electronics, CPG, and Health & Beauty.

    In the electronics category, brands like Apple, Motorola, and Samsung, known for their mobile phones, earbuds, headphones, and more, have a higher Share of Search on the Amazon mobile app compared to the desktop.

    Meanwhile, Laptop brands like Dell, Acer, and Lenovo, as well as other leading brands like Google have a higher Share of Search on the desktop site compared to the app. This is the scenario that brands need to be careful about. When their Share of Search on mobile apps is lower, they might miss the chance to take corrective measures since they lack the necessary data from their provider.

    In the CPG category, Ramen brand Samyang, with a lot of popularity on Tiktok and Instagram, shows a higher Share of Search on Amazon’s mobile app. Speciality brands like 365 By Whole Foods, pasta and Italian food brands La Moderna, Divinia, and Bauducco too have a significantly higher Share of Search on the app.

    Cheese and dessert brands like Happy Belly, Atlanta Cheesecake Company, among others, have a lower Share of Search on the mobile app. Ramen brand Sapporo is also more easily discovered on Amazon’s desktop site. Here, we see a difference of more than 5% in the Share of Search of some brands, which is likely to have a huge impact on the brand’s mobile eCommerce sales levels and overall performance.

    Lastly, in the Health & Beauty category, Shampoos and hair care brands like Olaplex, Dove, and Tresemme exhibited a higher Share of Search on the mobile app compared to the desktop.

    On the other hand, body care brands like Neutrogena and Hawaiian Tropic, as well as Beardcare brand Viking Revolution displayed a higher Share of Search on Amazon’s desktop site.

    Based on our data, it is clear that there are several examples of brands that do better in either one of Amazon’s desktop sites or mobile apps. In many cases, the difference is stark.

    So What Must Brands Do?

    Our findings emphasize the imperative for brands to move beyond a one-size-fits-all approach to digital shelf analytics. The striking variations in Share of Search between mobile apps and desktops conclusively demonstrate that relying solely on desktop data for digital shelf optimization is inadequate.

    If brands see that they’re falling behind on the mobile digital shelf, there are a few things they can do to help boost their performance:

    • If a brand’s Share of Search is lower on the mobile app, they can divert their retail spend to mobile in order to inorganically compensate for this difference. This way, any short-term impact due to lower discoverability is mitigated. This is also likely to result in optimized budget allocation and ROAS.
    • Brands also need to ensure their content is optimized for the mobile form factor, with images that are easy to view on smaller screens, and tailored product titles that are shorter than on desktops, highlighting the most important product attributes from the consumer’s perspective. Not only will this help brands gain more clicks from mobile shoppers, but this will also gradually lead to a boost in their organic Share of Search on mobile.
    • CPG brands, specifically, need to optimize their digital shelf for delivery intermediary apps (along with marketplaces). The grocery delivery ecosystem is booming with companies like DoorDash, Delivery Hero, Uber Eats, Swiggy, etc. leading the way. Using Digital Shelf Analytics to optimize performance on delivery apps is quite an involved process with a lot of bells and whistles to consider. Read our recently published whitepaper that specifically details how brands can successfully boost their visibility and conversions on delivery apps.

    But first, brands need to identify and work with a Digital Shelf Analytics partner that is able to capture and analyze mobile app data, enabling tailored optimization approaches for all eCommerce platforms.

    DataWeave leads the way here, providing the world’s most comprehensive and sophisticated digital shelf analytics solution, rising above all other providers to provide digital shelf insights for both web applications and mobile apps. Our data aggregation platform successfully navigates the intricacies of capturing public data accurately and reliably from mobile apps, thereby delivering a comprehensive cross-device view of digital shelf KPIs to our brand customers.

    So reach out to us today to find out more about our digital shelf solutions for mobile apps!

  • From Data to Dollars: How Digital Shelf Analytics Drives Tangible Business Impact and ROI for Brands

    From Data to Dollars: How Digital Shelf Analytics Drives Tangible Business Impact and ROI for Brands

    For consumer brands, the digital marketplace presents an unparalleled landscape of opportunities for engaging with consumers and expanding their market presence. Within this dynamic environment, Digital Shelf Analytics has emerged as a crucial pillar in a brand’s eCommerce strategy. This technology provides valuable insights into a brand’s organic and paid visibility on marketplaces, content quality, pricing strategies, promotional efforts, and product availability. These insights help brands gain a comprehensive understanding of their competitive positioning and overall market performance.

    Nevertheless, many brands often grapple with the question of whether this understanding translates into tangible actions that drive real business impact and return on investment (ROI). This uncertainty stems from a lack of clarity about the direct correlation between digital shelf insights and key metrics such as enhanced sales conversions.

    Nonetheless, there is compelling evidence that when these insights are effectively harnessed and strategic actions are taken, brands can realize significant, measurable benefits.

    So, the question arises: does Digital Shelf Analytics genuinely deliver on its promises?

    At DataWeave, we’ve partnered with numerous brands to fuel their eCommerce growth through the application of digital shelf analytics. In this article, we will delve into these insights, uncovering the concrete and quantifiable results that brands can achieve through their investments in digital shelf analytics.

    Digital Shelf KPIs and Their Impact

    Digital Shelf Analytics is a robust system that analyzes specific key performance indicators (KPIs) about the digital shelf, furnishing brands with precise recommendations to not only bolster these KPIs but also to monitor the enhancements over time. The following is a brief explanation of digital shelf KPis and their expected impact areas:

    Product Availability: Ensuring Shoppers Never Hear “Out of Stock” Again

    Timely insights on the availability of products ensures brands reduce replenishment times at scale, which can significantly impact sales, creating an unbreakable link between product availability and revenue. With Digital Shelf Analytics, procurement and replenishment teams can set up notifications to promptly identify low or out-of-stock items and take swift action. This can also be done for specific ZIP codes or individual stores. In addition, availability plays a crucial role in a brand’s Share of Search and search rankings, as online marketplaces often ensure only in-stock products are shown among the top ranks.

    Share of Search: Dominating the Digital Aisles

    If a product isn’t visible, does it even exist? In fact, 70% of consumers never go beyond the first page of search results on major online marketplaces. Therefore, as a brand, the visibility of your products for relevant search keywords and their appearance on the first page can heavily determine your awareness metrics. This is where the concept of Share of Search comes into play. Think of it as securing prime shelf space in a physical store. Digital shelf insights and benchmarking with category leaders for Share of Search help ensure your products command relevant attention on the digital shelf.

    Content Quality: Crafting the Perfect Product Story

    Creating engaging product descriptions and visuals is akin to giving your products a megaphone in a crowded marketplace. By enhancing content quality, including product names, titles, descriptions, and images, brands can climb the search result rankings, leading to increased visibility and subsequently, more sales.

    Ratings and Reviews: The Power of Social Proof

    Public opinion holds immense sway. Research indicates that a single positive review can trigger a 10% surge in sales, while a multitude of favorable reviews can propel your product to a 44% higher trajectory. The correlation between ratings and sales is not surprising—each step up the rating ladder can translate to substantial revenue growth.

    While it’s reasonable to anticipate a connection between these KPIs and downstream impact metrics such as impressions, clicks, and conversions, we were driven to explore this correlation through the lens of real-world data. To do so, we meticulously monitored the digital shelf KPIs for one of our clients and analyzed the improvements in these metrics.

    It’s essential to acknowledge that not all observed impact areas can be solely attributed to enhancements in digital shelf KPIs. Still, it’s evident that a robust correlation exists. The following section presents an in-depth case study, shedding light on the results of this analysis.

    A Success Story: Real-World Impact of Digital Shelf Analytics

    Let’s dive into the journey of one of our clients – a prominent CPG brand specializing in the sale of baked goods and desserts. Through their experience, we will illustrate the transformative impact of our DataWeave Digital Shelf Analytics product suite.

    Over a period of one year, from August 2022 to July 2023, the brand leveraged several key modules of Digital Shelf Analytics for Amazon, including Share of Search, Share of Category, Availability, Ratings and Reviews, and Content Audit. Each of these digital shelf KPIs played a vital role in shaping the brand’s performance across various stages of the buyer’s journey.

    The buyer’s journey is typically delineated into three key stages:

    • Awareness: At this stage, shoppers peruse multiple product options presented on search and category listing pages, gaining an initial understanding of the available choices.
    • Consideration: Here, shoppers narrow down their selections and evaluate a handful of products, moving closer to a purchase decision.
    • Conversion: In this final stage, shoppers make their ultimate product choice and proceed to complete the purchase.

    Let’s now examine the data to understand how digital shelf KPIs helped drive tangible ROI on Amazon for the brand across the stages of the buyer journey.

    Stage 1: Raising Awareness

    Enhancing Share of Search and Share of Category can help brands boost product visibility and raise brand awareness. The following chart demonstrates the steady, incremental improvements in our client’s Share of Search and Share of Category (in the top 20 ranks of each listing page) throughout the analyzed period. These enhancements were achieved through various measures, including product sponsorship, content enhancement, price optimization, promotional initiatives, and more.

    This amplified Share of Search and Share of Category directly translates into improved product discoverability, as evident from the surge in impressions depicted in the chart below.

    Stage 2: All Things Considered

    In the consideration stage, shoppers make their product selections by clicking on items that meet their criteria, which may include factors like average rating, number of ratings, price, product title, and images. For brands, this underscores the importance of crafting meticulously detailed product content and accumulating a substantial number of ratings.

    The subsequent chart illustrates the year-long trend in both average ratings and the number of ratings, both of which have displayed steady improvement over time.

    The enhancements in the number of ratings and the average rating have a direct and positive impact on product consideration. This, in turn, has led to a noticeable year-over-year increase in page views, as indicated in the chart below.

    These improvements are likely to have also been influenced by the overall enhancement of content quality, which is detailed separately in the section below.

    Stage 3: Driving Decisions

    As buyers progress to the next stage, they reach the pivotal point of making a purchase decision. This decision is influenced by multiple factors, including product availability, content quality, and the quality of reviews, reflecting customer sentiment.

    Our client effectively harnessed our Availability insights, significantly reducing the likelihood of potential out-of-stock scenarios and enhancing replenishment rates, as highlighted in the chart below. The same chart also indicates improvements in content quality, measured by the degree to which the content on Amazon aligns with the brand’s ideal content standards.

    Below, you’ll find the year-over-year growth in conversion rates for the brand on Amazon. This metric stands as the ultimate measure of business impact, directly translating into increased revenue for brands.

    As the data uncovers, growth in key digital shelf KPIs cumulatively had a strong correlation with impressions, page views, and conversion rates.

    It is also important to note that the effect of each KPI cannot be viewed in isolation, since they are often interdependent. For example, improvement in content and availability could boost Share of Search. Accurate content could also influence more positive customer feedback. Brands need to consider optimizing digital shelf KPIs holistically to create sustained business impact.

    Impact on eCommerce Sales

    After the implementation of digital shelf analytics, the results spoke for themselves. Sales consistently outperformed the previous year’s records month after month. As shown in the chart below, the diligent application of DataWeave’s recommendations paved the way for an impressive 8.5% year-over-year increase in sales, leaving an indelible mark on the brand’s eCommerce success.

    From boosting product visibility to catapulting conversion rates, Digital Shelf Analytics serves as the key to unlocking unparalleled online success.

    While the success story detailed above does not establish a direct causation between Digital Shelf Analytics and sales revenue, there is undoubtedly a strong correlation. It’s evident that digital shelf KPIs play a pivotal role in optimizing a brand’s eCommerce performance across all stages of the buyer journey. Hence, for brands, it is vital that they collaborate with the right partner and harness digital shelf insights to fine-tune their eCommerce strategies and tactics.

    That said, the eCommerce landscape is in a constant state of flux, and there is still much to learn about how each digital shelf KPI influences brand performance in the online realm. With more data and an increasing number of brands embracing Digital Shelf Analytics, it’s only a matter of time before a direct causation is firmly established.

    Reach out to us today to know more about how your brand can leverage Digital Shelf Analytics to drive higher sales and market share in eCommerce.

  • It’s not easy being a Bakery Brand: Insights from Digital Shelf

    It’s not easy being a Bakery Brand: Insights from Digital Shelf

    By 2028, Fortune Business Insights projects that the global bakery products market will reach USD 590 billion. The CAGR (Compounded annual growth rate) for 2021-28 is estimated at 5.12%. Products in this segment include bread, buns, cookies, tortillas, salted snacks, English muffins, bagels, confectionery food, hot dogs, cakes, popcorn, and so on.

    Due to disruptions in the global supply chain caused by lockdowns and border closures, the pandemic has had a negative impact on the demand for bakery products and snacks worldwide. However, the market is not only changing, but consumer demand is increasing. Post-pandemic, health, food, and safety have gained renewed attention.

    People across the world are making healthier choices with a focus on wellness. 

    A growing number of people are interested in plant-based foods and beverages, reducing sugar consumption, and understanding the link between lifestyle and health, including obesity and diabetes. As a result of these trends, food producers are reshaping their product strategies to meet new consumer demands.

    In this article, we take a look at the ways companies can leverage data to inform their e-commerce strategy.

    What’s driving up the demand for bakery products?

    More people are choosing easy-to-use bakery products and snacks over other foods due to urbanization, convenience, western diets, and women’s participation in the workforce. Additionally, innovations in baking systems, food technologies, ingredients, formulations, and product ideas are providing customers with a greater level of choice, flexibility, and freedom.

    How is e-commerce changing the game for bakery product companies?

    To optimize their supply chains, bakery food and snack companies must better understand e-commerce metrics given the wide variety of products available and eventually convert sales. There are several measures that companies need to pay attention to. 

    Stock availability metrics, discounts across locations, and share of search results – are all critical metrics companies need to track. In addition to providing manufacturers and retailers with an insight into the trends, DataWeave’s tools also allow them to make better business decisions and ultimately improve their bottom line. 

    Grocery Retailers and Bakery Brands tracked

    Methodology

    • Data Scrape period: February 2022 to September 2022
    • Country: Canada
    • Grocery Retailers tracked: Atlantic Superstore, Fortinos, InstaCart, Loblaws, Voila, Walmart Grocery, Zehrs.
    • Bakery brands: Betty Crocker, Dempsters, Hostess, No Name, Presidents Choice, Quaker, Vachon, Doritos.
    • Category tracked: Bread and Bakery, Chips, Crackers, Deserts, Snacks.

    Share of Search Analysis

    Which brands feature the most on e-commerce portals?

    When listing items on e-commerce platforms, share of search is crucial. The highest share of the top ten or top twenty items available on these platforms is correlated with how many times the item may be viewed. As a result, it would have a greater chance of being selected by the customer.

    By Retailer for Category “Desserts”

    Share of Search for Brands in each retailer
    • In Walmart Grocery, Vachon has the highest share of search at 41%, whereas Betty Crocker, Presidents Choice and No Name had the lowest share of search at 0%, in the Desserts Category.
    • In Loblaws, Presidents Choice had the highest share of search of 34%, whereas Dempsters had the lowest share of search of 2%  in the Desserts Category. 
    • The brand Presidents Choice consistently ranks high in the share of search results for Desserts across multiple retailers, including Atlantic Superstore, Fortinos, Instacart, Loblaws, and Zehrs – except at two retailers, Voila and Watlmart Grocery, where its share is zero.

    Trend of Share of Search for “Desserts”

    Share of Search analysis by Brands over Time in category “Desserts”
    • Share of search had dropped by around 4% for No Name, whereas for Vachon, it increased by 3% from Jan’-22 to Sep’ 22
    • By brands, Presidents Choice had the highest share of search at 42%, whereas Betty Crocker had the lowest share of search at 12% between Jan’ 22 and Sep’ 22 in the Desserts Category.

    Availability Analysis

    Which products are widely available across e-commerce portals?

    The availability of the product on the e-commerce portal is one of the key indicators of meeting customer demand. Brands can use insights from DataWeave to strategize how to restock their inventory and ease customer demand. Based on data analysis, brands can also determine which products to prioritize on which platforms.

    By Category

    Availability analysis by Category over Time
    • Availability of all five categories was around 52% in Feb’ 22, which steadily increased to 61% until Aug’ 22 and has reduced to reach 55% availability in Sep’ 22
    • Sliced Bread category has seen the most drop in availability by 12% between Jun’ 22 and Sep’ 22
    • The tortilla category has the most rise in availability. It has increased by 16% between Feb-22 and May-22. It also showed an overall rise in availability of 5% from Feb-22 to Sep-22

    By Location

    Availability analysis by Location and Category
    • Across categories, Snacks & Candy had better availability at 73% than Bread & Bakery, with 56% availability.
    • By Location, New Brunswick had more than 65% availability across all three categories; the closest Location is Nova Scotia, with 63% availability.
    • Alberta had the highest availability of 100% in the Snacks & Candy category and the lowest availability of 21% overall in all three categories (weighted aggregate)

    Discounts Analysis

    Several discount-based insights can be studied on e-commerce platforms. From location-based trends, retailer-based trends, and manufacturer-based insights. These insights can help companies make the most of the revenue opportunity while creating an attractive value proposition for the retail consumer.

    By Category

    Discount analysis by Category
    • Discounts of all three categories were around 24% in Feb’ 22, which steadily reduced to reach 15% in Sep’ 22
    • Snacks, cookies & chips category has contributed the most to the drop in discounting, which dropped by 17% between Apr’ 22 and Sep’ 22
    • The Tortilla Category does not have any discount in the month of Jul’ 22

    By Retailer

    • Discount on Bread & Bakery category in Walmart Grocery was around 9% in Feb’ 22. It steadily increased to 13% by Jun’ 22 and thereon reduced to reach 11% availability in Sep’ 22.

    By Location

    • Across Retailers, Nova Scotia had the highest availability of discounts at 22%, whereas New Brunswick had the lowest with discounts at 9% in Bread & Bakery category.
    Discount analysis by Retailers and Locations – Alberta, Ontario, New Brunswick, Nova Scotia
    Note: Analysis does not cover all locations

    Bakery and snack product manufacturers on e-commerce platforms have access to a rich trove of insights they can leverage to benchmark their strategies. They can better understand customer demands, align their supply chain and critically understand the trends impacting their bottom line. Engaging with a third-party platform like DataWeave’s Digital Shelf Analytics  can help brands unlock tremendous value. 

  • 5 Ways DataWeave Helps Brands Drive Growth With Amazon Ads

    5 Ways DataWeave Helps Brands Drive Growth With Amazon Ads

    Consumers are discovering and trialing new eCommerce marketplaces, brands and products at a faster rate than ever before, given the vast amount of choices encountered browsing for products online. A recent analysis shows how events like Amazon Prime Day, Black Friday, and Cyber Monday are especially fruitful for new-to-brand customer advertising, encouraging B2C marketers to increase their digital advertising spend to fuel product discovery, sales and market share for their brands.

    Amazon advertisers grow market share and brand loyalty with ecommerce intelligence
    DataWeave joins Amazon Advertising partner network

    The majority of eCommerce consumers are discovering products via relevant keywords attributable to their needs, with most clicks happening on page one results for the first few products listed. Simplifying the digital shopping experience is critical for brands to be in the consideration set for the majority of consumers who won’t venture past page one results. 

    An internal analysis conducted shows getting a product to page one on retailer websites can improve sales by as much as 50 percent, but figuring out the right levers to pull to get there organically—without paid advertising—is a real challenge, especially given fast-changing algorithms. While more than half of all retail related online browsing sessions are “organic”, sometimes brands need to boost their product visibility by investing in sponsored (paid) opportunities to improve a product’s rank.

    Data analytics can equip brands with intelligence to help them decide when, where, and how to make digital advertising investments profitably, while simultaneously acting on insights that help drive organic growth. Considering a majority of U.S. consumers begin their product discovery on marketplaces like Amazon, it makes sense for brands to prioritize digital advertising opportunities with Amazon.

    Maximize Return on Ad Spend (ROAS) with Amazon Ads

    Brands use Amazon Ads to drive brand awareness, acquire new customers, drive sales and gain market share, with the goal of furthering their marketing return on investment. Top performing advertisers average 40 percent greater year-on-year (YoY) sales growth, 50 percent greater YoY growth in customer product page viewership on Amazon, and 30 percent higher returns on ad spend (ROAS) with Amazon Ads, according to a recent analysis. Sponsored Products, Sponsored Brands, Amazon DSP and Sponsored Display are among the types of Amazon Ads options cited that produce maximum return.

    Ensuring your product listings appear at the top of page one results on Amazon for the most relevant discovery keywords is therefore the most important determinant for maximizing ROAS. DataWeave has become a vetted partner and measurement provider in the Amazon Advertising Partner Network, with the goal of supporting brands to optimize digital advertising campaigns by providing visibility to Digital Shelf Analytics (DSA) key performance indicators (KPIs), like Share of Search, Pricing and Product Availability, Content Audits, Ratings and Reviews, and Sales Performance and Market Share.

    Below is a summary of how our Digital Shelf solutions, in partnership with Amazon Ads, can improve the performance of your Amazon Ads campaigns

    1. Keyword Recommendations Improve Share of Search

    With the DataWeave Share of Search solution, brands can monitor their placement of both organic and paid discovery keywords relative to their competition. Once your keywords are determined, you are also provided a weighted Share of Search score that helps measure how well each keyword performs relative to product discoverability. Below is an example of insights you’d gain.

    Share of Keyword Search

    Brands can provide their own list of keywords to monitor, or through our Amazon Ads collaborative solution, learn which keywords are the “best” for them to measure in the realm of Amazon. Performance results are based on data that shows which keywords consumers are actually using when browsing online alongside other keywords brands request to measure. Users are able to see exactly which keywords are most popular, competitive (and even unexpected), and relevant at an Amazon Standard Identification Number (ASIN) level of granularity. 

    We can also estimate the degree of relevance and estimated traffic for the recommended keywords. Brands can then use these insights to adjust campaign strategies based on these parameters, which can boost product discoverability and rank visibility. A brand could assume people find its products by brand name, yet traffic insights may reveal a majority of people look for a generic product type before they end up buying that particular brand. 

    2. Content Audits Increase Discovery Relevancy Scores

    Strong product content is critical to succeeding on Amazon. Thorough, accurate, and descriptive content leads to better click through rates (CTR), conversion rates, more positive reviews, and fewer returns, which results in increased discoverability. DataWeave’s Content Audit solution reviews existing copy and images on a per-attribute basis to highlight any gaps essential to improving visibility, as seen in the example below.

    Content Analysis

    To further growth, it is equally as important that your product content aligns with your advertising strategy. With Amazon Ads partner add-on, our solution can also audit your content to measure how effectively you are incorporating Amazon Ads keywords into your product content to enhance discovery relevancy.

    3. Discover More Opportunities with Pricing and Product Availability Insights

    Quality content and keyword updates will only get you so far if your products are not consistently available and priced competitively. With DataWeave’s Pricing and Promotions and Product Availability modules, advertisers can monitor their selling prices and availability trends alongside their competitors to uncover more opportunities to incorporate into advertising campaigns, as seen in the Pricing and Promotions dashboard example below.

    Promotion Analysis

    Additionally, product targeting recommendations can be utilized to target a competitor’s ASIN that may be overpriced or that is having issues staying in stock. Alternatively, broaden your strategy to target specific brands, complementary products, or category listing pages.

    You can also create alerts on your own products to monitor when items are low on inventory or out of stock to ensure key products are consistently available when customers are shopping.

    4. Leverage Ratings and Reviews to Increase Conversion

    Product ratings and reviews are also a critical component to running a successful Amazon Ads campaign. A large number of reviews and a positive star rating will provide customers with the confidence to purchase, resulting in higher conversion rates. Conversely, negative feedback can have a detrimental impact, resulting in lost sales and wasted ad spend. DataWeave’s Ratings and Reviews module can help you monitor your reviews and extract attribute-level insights on your products. This information can then be utilized to further optimize your advertising strategy.

    If you see consistent feedback in your reviews on aspects of a product not meeting customer expectations, address them in your product content to prevent potential misplaced expectations. Alternatively, if customer reviews are raving about certain product features, ensure these are promoted and relevant keywords are populated throughout your descriptions and feature bullets. Below is an example of insights seen within the DSA Ratings & Reviews dashboard.

    Ratings and Reviews

    5. Correlate Digital Shelf KPIs to Sales Performance and Market Share

    The newest DSA module, Sales Performance and Market Share, provides SKU, sub-category, and brand-level sales and market share estimates on Amazon for brands and their competitors, via customer defined taxonomies, to easily benchmark performance results.

    This data can also be correlated with other Digital Shelf KPIs, like Content Audit and Product Availability, giving brands an easy way to check the effect of attribute changes and how they impact sales and market share. Similarly, brands can see how search rank, both organic and sponsored, affects sales and market share estimates.

    Understanding the correlation between your advertising campaigns and your Digital Shelf brand visibility will help you identify which areas to prioritize to drive sales and win more market share.

    Digital Shelf Insights Help Brands Win with Amazon Ads

    The need for access to flexible, actionable eCommerce insights is growing exponentially as a way to help brands drive growth, increase their Share of Voice, and to gain a competitive edge. As a result, more global brands are seeking Digital Shelf Analytics for access to near real-time marketplace changes and to develop data-driven growth strategies that leverage pricing, merchandising, and competitive insights at scale.

    By monitoring, measuring and analyzing key performance indicators (KPIs) like Sales Performance and Market Share, Share of Search, Content Audits, Product Availability, Pricing and Promotions and Ratings and Reviews alongside competitors, brands will know what actions to take to boost brand visibility, customer satisfaction, and online sales. 

    DataWeave’s acceptance into the Amazon Advertising Partner Network enables Amazon advertisers to effectively build their Amazon growth strategies and determine systems that enable faster and smarter advertising and marketing decision-making to optimize product discoverability and overall results.

    Connect with us now to learn how we can scale with your brand’s analytical needs, or for access to more details regarding our Amazon Ads Partnership or Digital Shelf solutions.

    UPDATED: Read the full press release here

  • Share of Keyword Search Cinco de Mayo 2022

    Share of Keyword Search Cinco de Mayo 2022

    As inflation continues to hike costs for consumers and supply chains challenge them to maintain loyalty, there is still an active audience willing to pay the ultimate price for the convenience of food and alcohol delivery. That being said, we analyzed 8 popular Retail and Delivery Intermediary websites and 11 popular ‘Cinco de Mayo’ keywords to see which Brands are predicted to win the battle of Digital Shelf Share of Search this holiday.

    2022 Cinco de Mayo Share of Search Insights - Top Brands for 'Cinco de Mayo'
    2022 Cinco de Mayo Share of Search Insights – Top Brands for ‘Cinco de Mayo’

    Opportunities for Food & Bev on Cinco de Mayo

    While most of our analysis focused on popular Cinco de Mayo food and beverage products, none of these brands populated on either Target (pictured on left below) or Walmart (pictured on right below) page 1 search results for the term ‘Cinco de Mayo’. Keyword search results for this term are dominated primarily by décor brands as indicated below.

    Brands Achieving Top Share of Search for Food and Beverage Categories on Cinco de Mayo 2022
    Brands Achieving Top Share of Search for Food and Beverage Categories on Cinco de Mayo 2022

    Share of Keyword Search Results – Alcohol Category

    Three of the most popular alcohol types sought out during Cinco de Mayo are ‘Mexican Beer’, ‘Mezcal’, and ‘Tequila’. Below are the brands dominating Share of Keyword Search results on each of the major retail websites we researched.

    AmazonFresh, Meijer, Kroger, and Sam's Club Share of Search - Beer, Mezcal, and Tequila Keywords on Cinco de Mayo 2022
    AmazonFresh, Meijer, Kroger, and Sam’s Club Share of Search – Beer, Mezcal, and Tequila Keywords on Cinco de Mayo 2022

    We also reviewed the same keyword performance across popular delivery intermediaries to see how Share of Keyword Search altered for ‘Mexican Beer’, ‘Mezcal’, and ‘Tequila’. The results are below for TotalWine, Instacart, Drizly and GoPuff:

    TotalWine, Instacart, Drizly, and GoPuff of Search - Beer, Mezcal, and Tequila Keywords on Cinco de Mayo 2022
    TotalWine, Instacart, Drizly, and GoPuff of Search – Beer, Mezcal, and Tequila Keywords on Cinco de Mayo 2022

    The keyword ‘Agave’ is also a popular search term within the alcohol category during the time leading up to Cinco de Mayo. We reviewed keyword search performance at various zip codes to see how price points that populated on page 1 search results varied given the change in median income. Below are the results:

    Share of Search for Alcohol by Price Point and Zip Code on AmazonFresh
    Share of Search for Alcohol by Price Point and Zip Code on AmazonFresh

    Share of Keyword Search Results – Grocery Categories

    We also reviewed some of the most popular grocery items purchased during Cinco de Mayo by Keyword Share of Search results to see which brands are primed to win the Digital Shelf this year. Below are the results for Target.com and Walmart.com.

    Walmart and Target Share of Search - Food and Beverage Keywords on Cinco de Mayo 2022
    Walmart and Target Share of Search – Food and Beverage Keywords on Cinco de Mayo 2022

    Below are the results for the same popular grocery items and alcohol keywords related to Cinco de Mayo and the page 1 results seen for Brand Share of Search on Safeway.com.

    Safeway Share of Search - Food and Beverage Keywords on Cinco de Mayo 2022
    Safeway Share of Search – Food and Beverage Keywords on Cinco de Mayo 2022

    Access to these types of real-time digital marketplace insights can enable retailers and brands to make strategic decisions and help drive profitable growth in an intensifying competitive environment. Be sure to reach out to our Retail Analytics experts for access to more details regarding the above analysis, and let us know what other holiday insights you’d be interested in seeing this year. Happy Cinco de Mayo!