Black Friday 2025 marked another significant shopping event for Canadian consumers, with retailers deploying sophisticated pricing strategies to capture holiday spending. Online and in-store spending on Black Friday reached an estimated $865 million in Canada, which marked a 6% increase compared to last year.
At DataWeave, we analyzed Black Friday 2025 pricing dynamics across two major categories in the Canadian market: Consumer Electronics and Home & Furniture. Our AI-powered pricing intelligence platform tracked approximately 16,000 SKUs across leading Canadian retailers like Target, Walmart, Wayfair, Home Depot, Amazon, Best Buy, Loblaws, Metro and more, uncovering distinct patterns in how brands and retailers structured their promotional calendars this year.
Our Methodology
DataWeave monitored pricing and discount trends across Canadian retailers during two key timeframes:
Pre-Black Friday Period: Up to November 23, 2025 – establishing baseline promotional activity and early holiday deals
Black Friday Week: November 24 – December 1, 2025 – spanning Thanksgiving through Black Friday (November 28) and Cyber Monday (December 1)
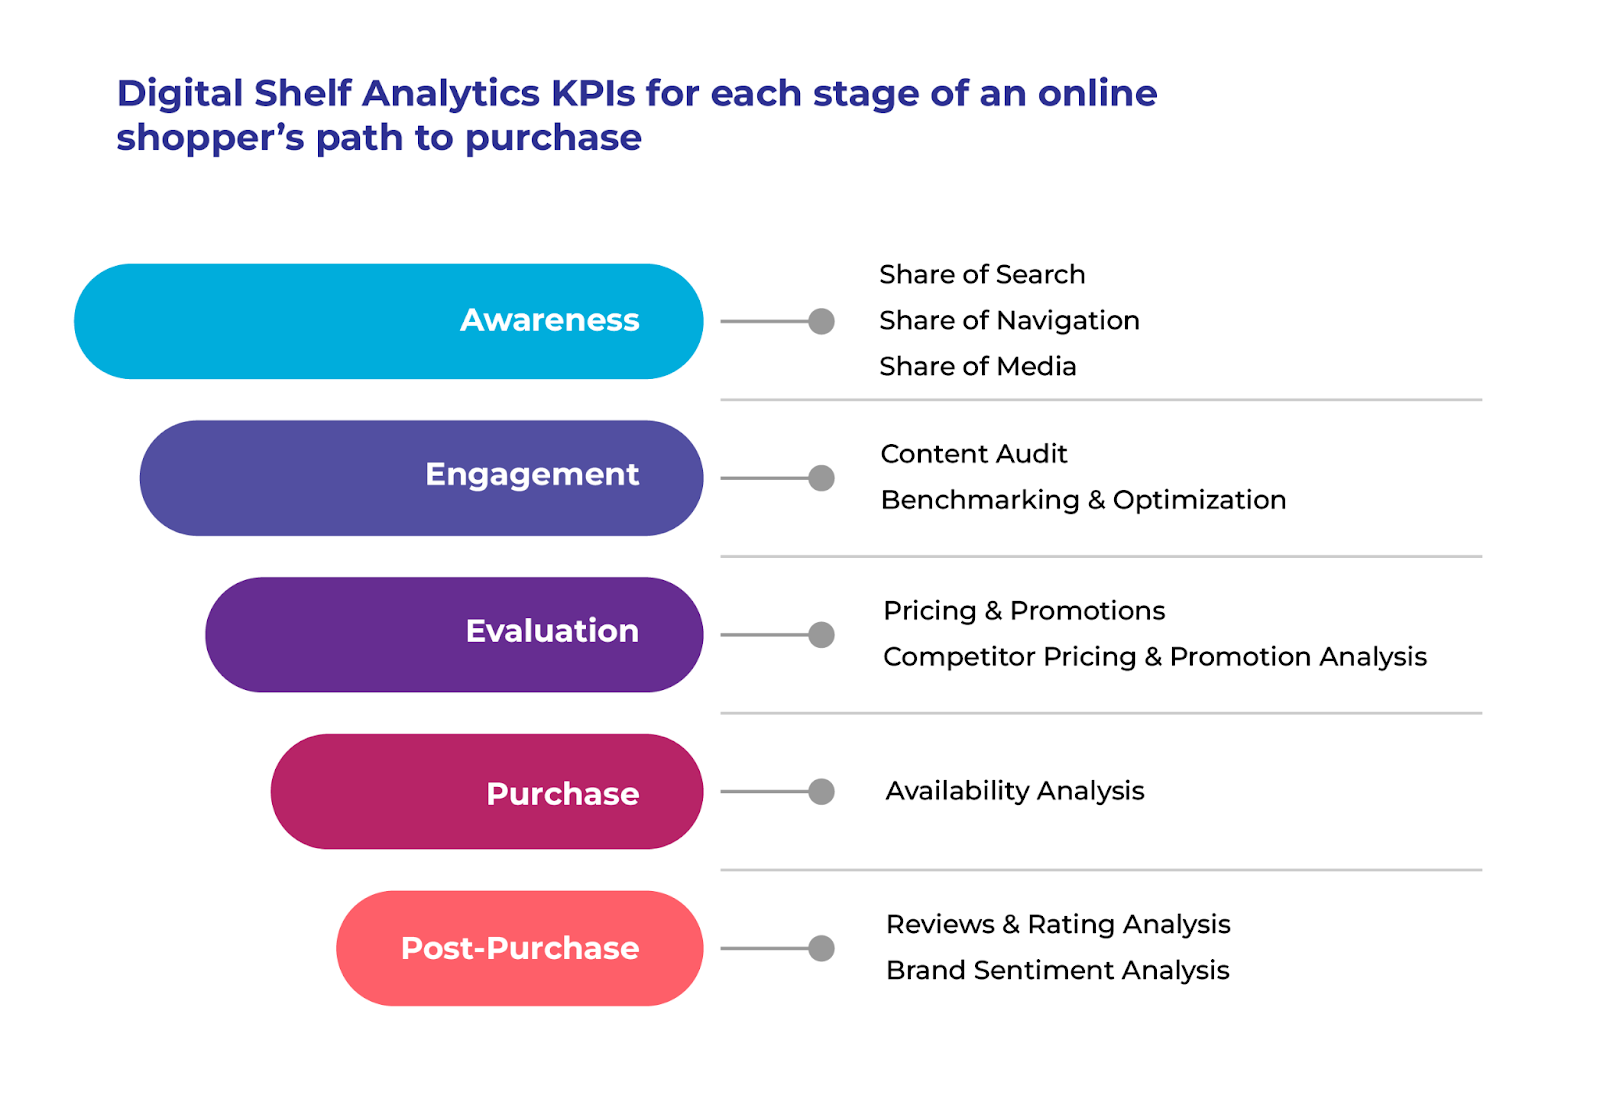
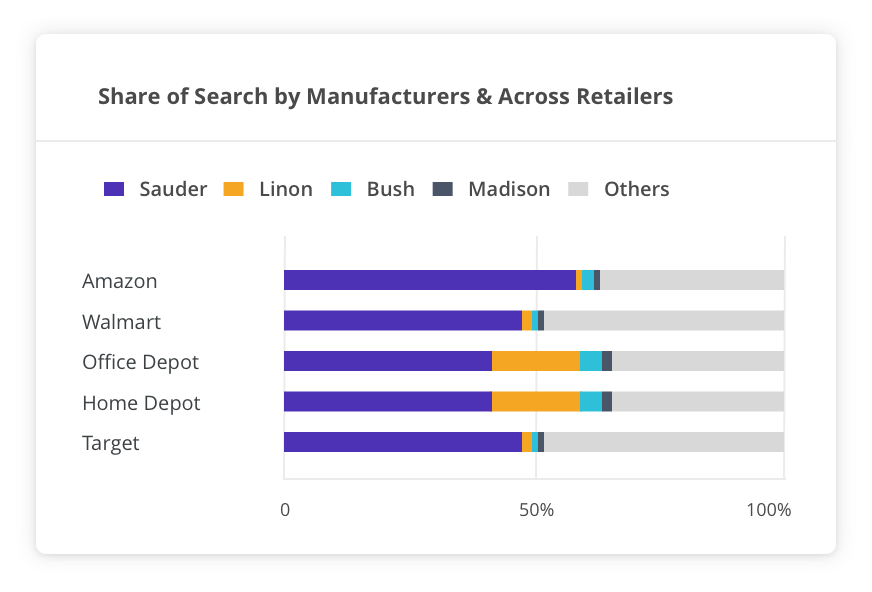
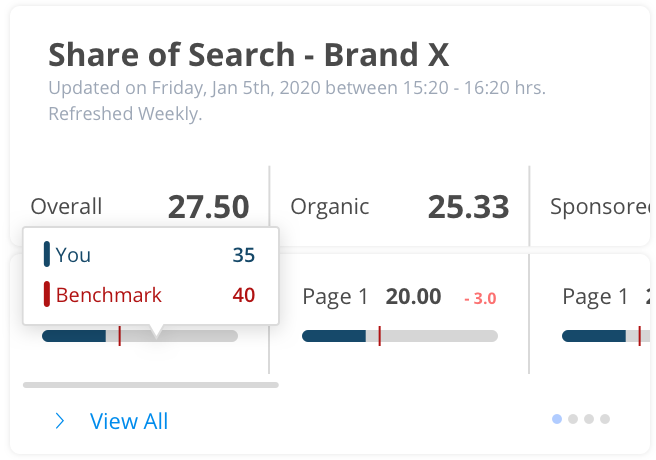
Our dataset included top-performing products across multiple subcategories on major Canadian retail platforms. We also tracked Share of Search metrics, measuring brand prominence by analyzing which brand names appeared in the top 20 search results for high-value keywords during each period.
Black Friday 2025 Canada: Overview
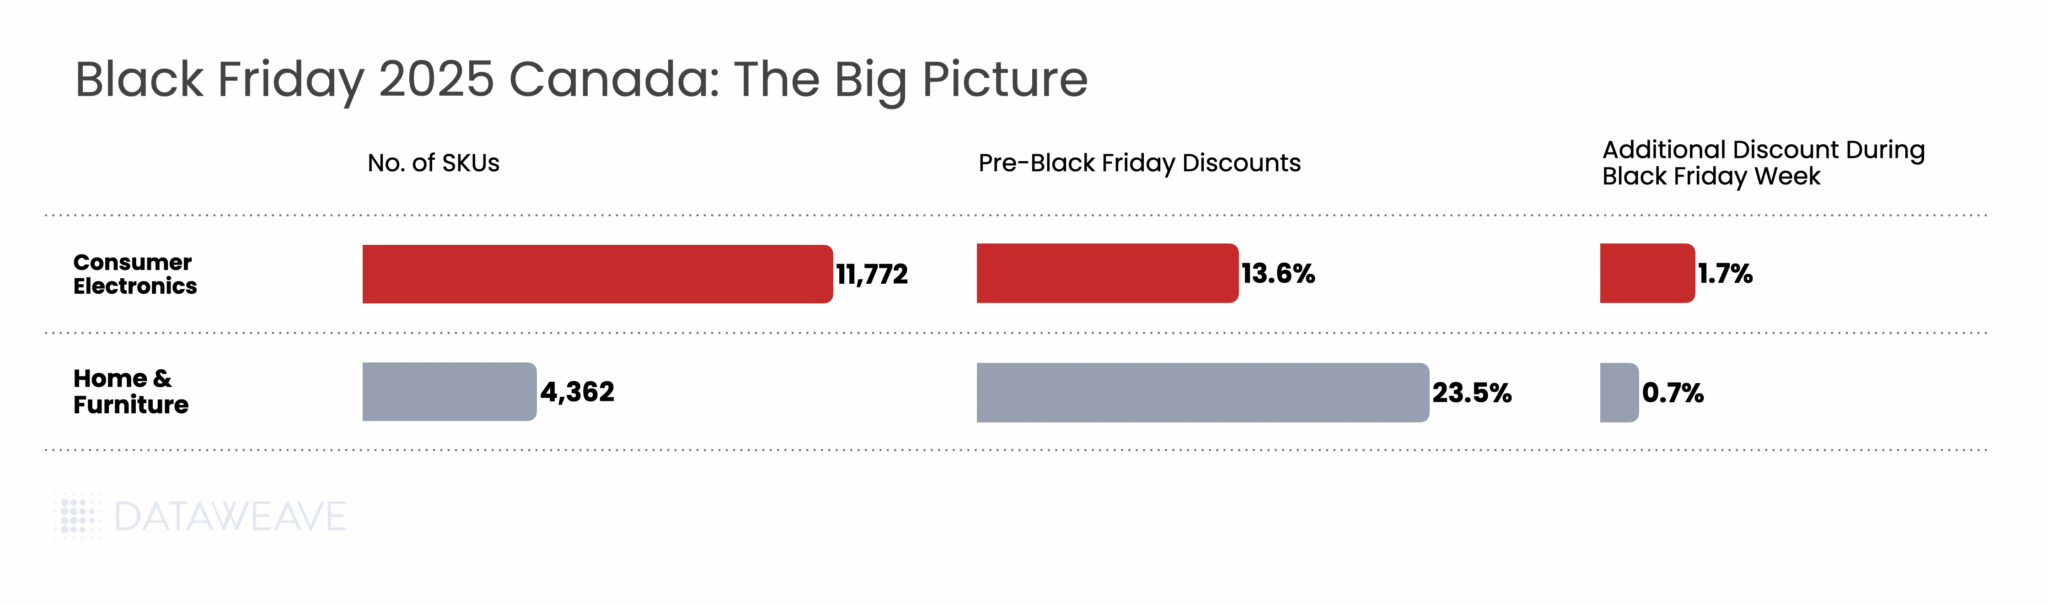
Here’s how average discounts compared between the Pre-Black Friday period and Black Friday Week:
Key Finding: Canadian retailers front-loaded their promotional strategy significantly, with Pre-Black Friday discounts averaging 16.3% across categories. The additional lift during Black Friday Week was modest at 1.4%.
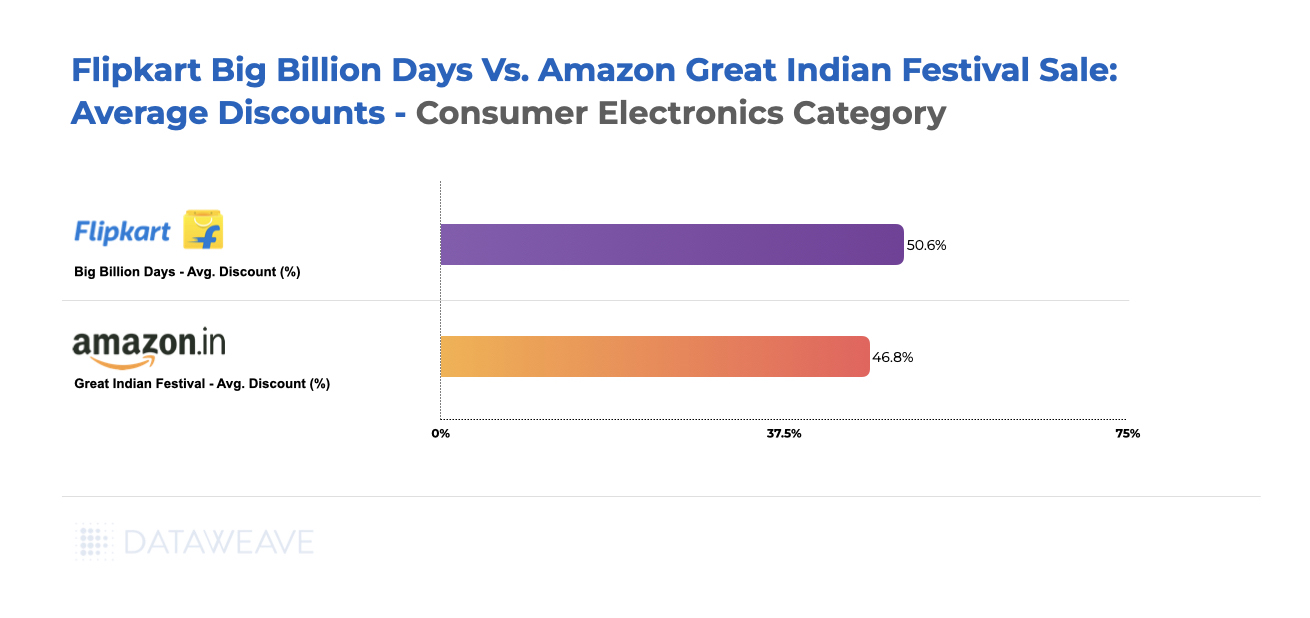
Consumer Electronics
Consumer electronics consistently drives Black Friday traffic, and Canadian retailers delivered compelling early-season value. Our analysis of 11,772 SKUs reveals nuanced subcategory performance.
Subcategory Discount Breakdown
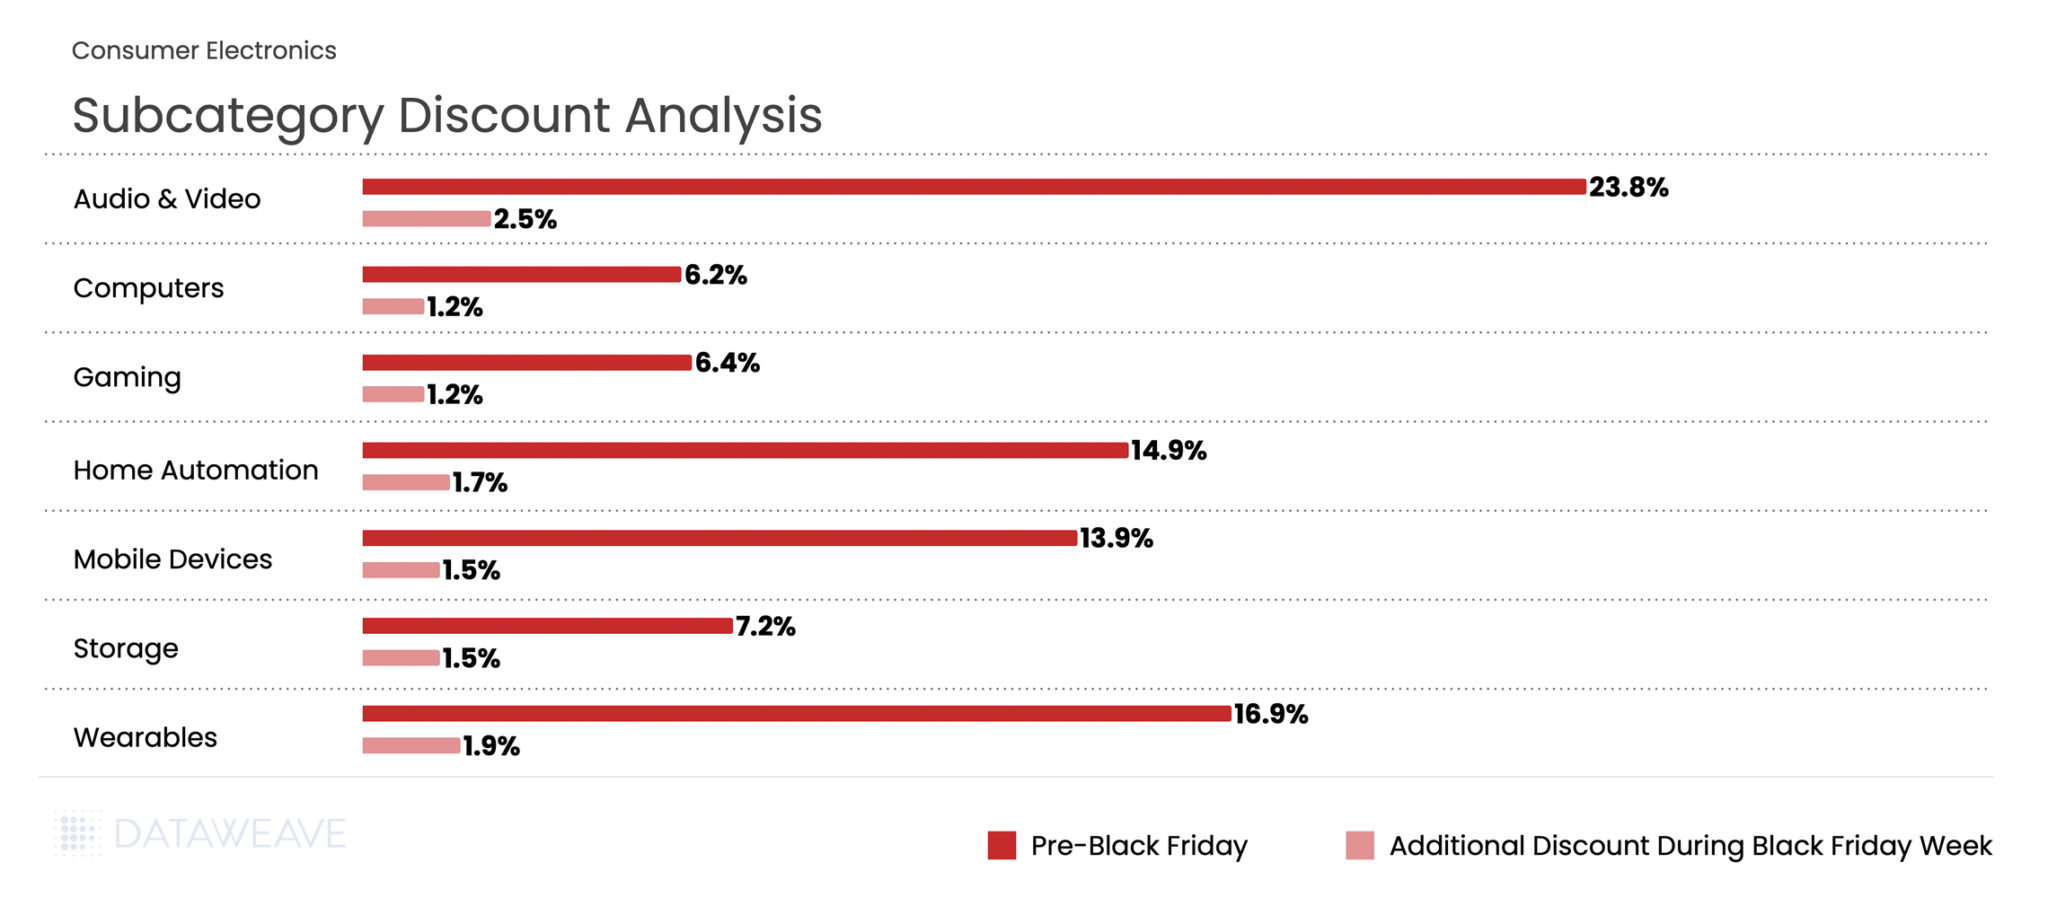
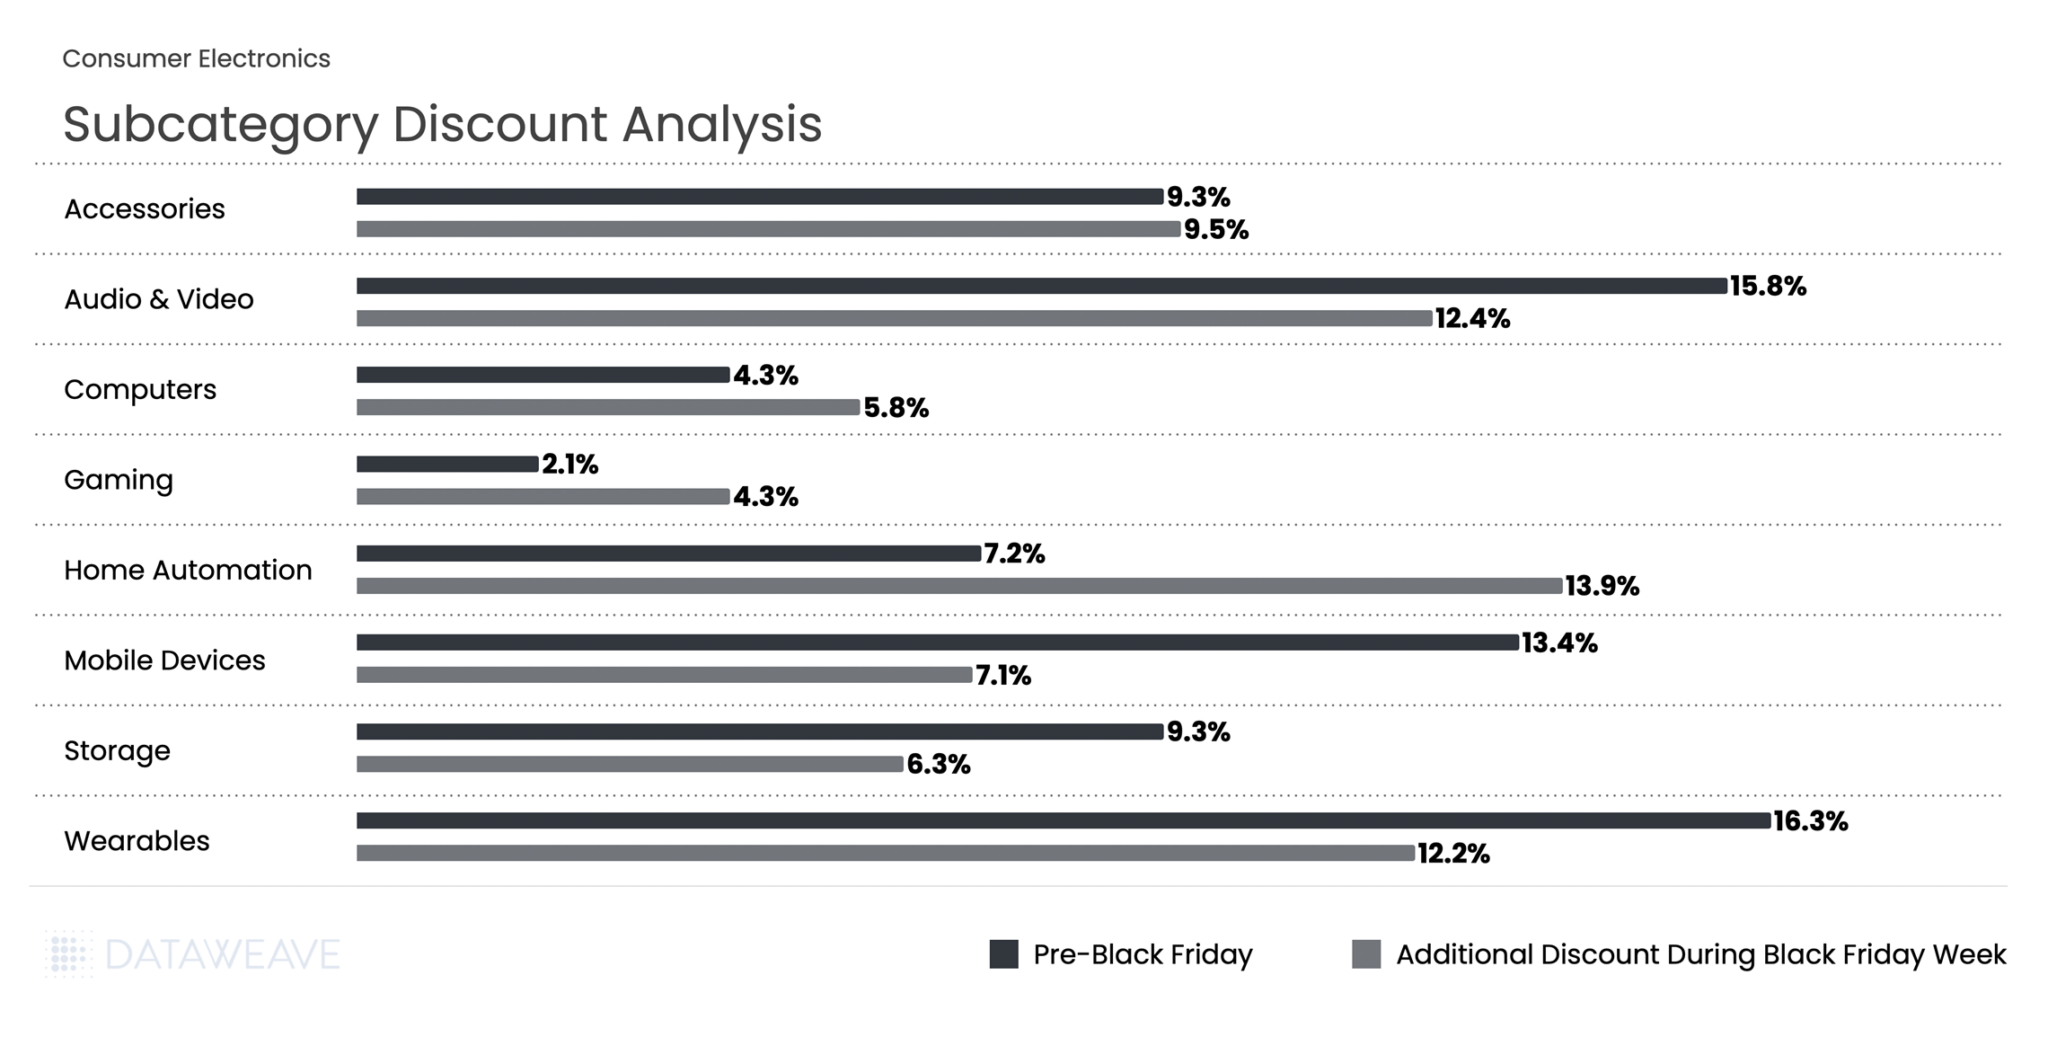
Consumer Electronics averaged 13.6% discounts in the Pre-Black Friday period, with Black Friday Week adding 1.7%. Audio & Video dominated early promotional activity at 23.8%, signalling retailers’ intent to clear inventory ahead of the main event. Wearables followed at 16.9%, likely timed to capture gift-buying momentum.
During Black Friday Week, Audio & Video maintained leadership with an additional 2.5% discount, the highest incremental lift in the category. Meanwhile, Computers and Gaming, already positioned at modest pre-sale discounts of 6.2% and 6.4%, saw minimal additional movement, suggesting constrained inventory or deliberate pricing discipline in these segments.
Share of Search: Brand Visibility Trends
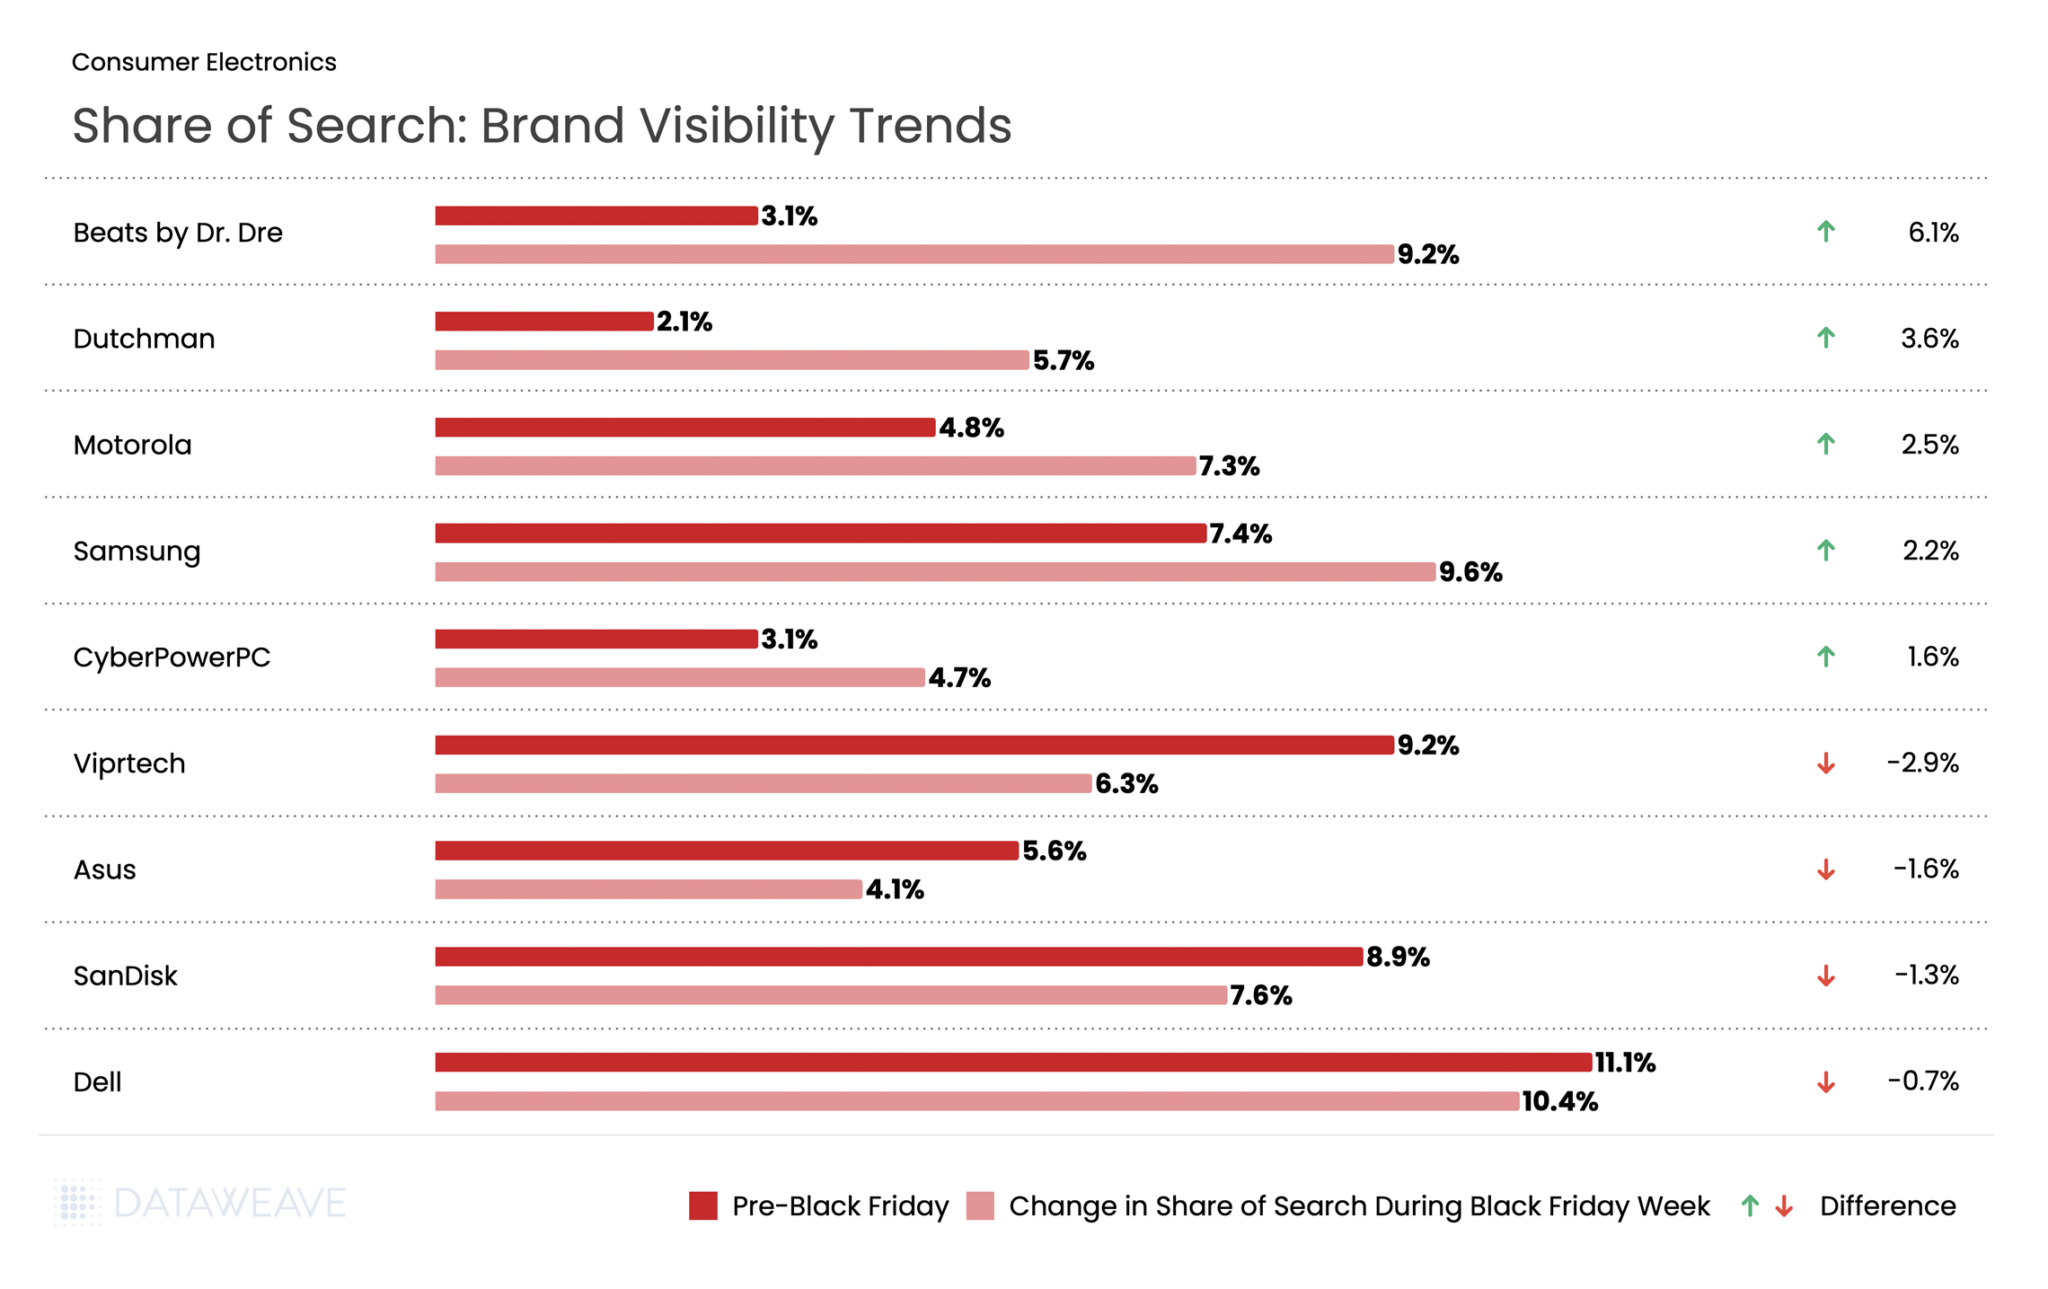
Our Share of Search data reveals which brands gained or lost prominence during Black Friday Week:
Audio brands dominated visibility gains during Black Friday Week. Beats by Dr. Dre nearly tripled its Share of Search from 3.1% to 9.2%, showing the strongest gains. Visibility for Dutchman climbed 3.6%. Motorola and Samsung also captured increased search prominence with gains of 2.5% and 2.2% respectively.
Conversely, some established tech brands experienced visibility declines. Gaming brand Viprtech by 2.9%. Asus declined by 1.6%, and SanDisk dropped by 1.3%.
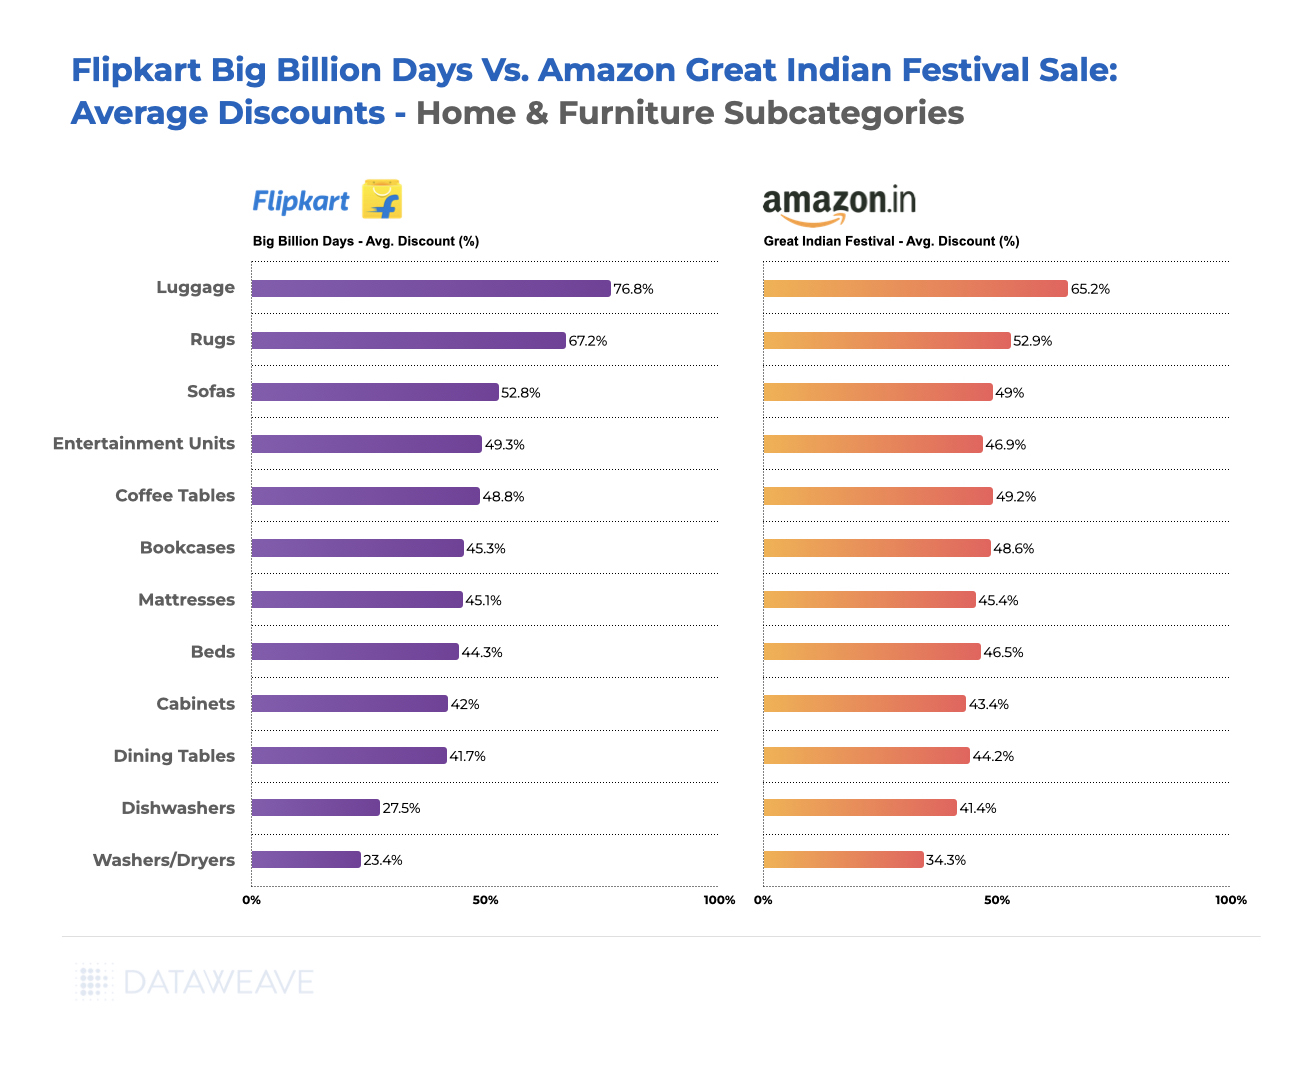
Home & Furniture
Home & Furniture showed the most aggressive early discounting of any category in our Canadian analysis. Tracking 4,362 SKUs, we found retailers heavily promoted home goods well before Black Friday weekend.
Subcategory Discount Breakdown
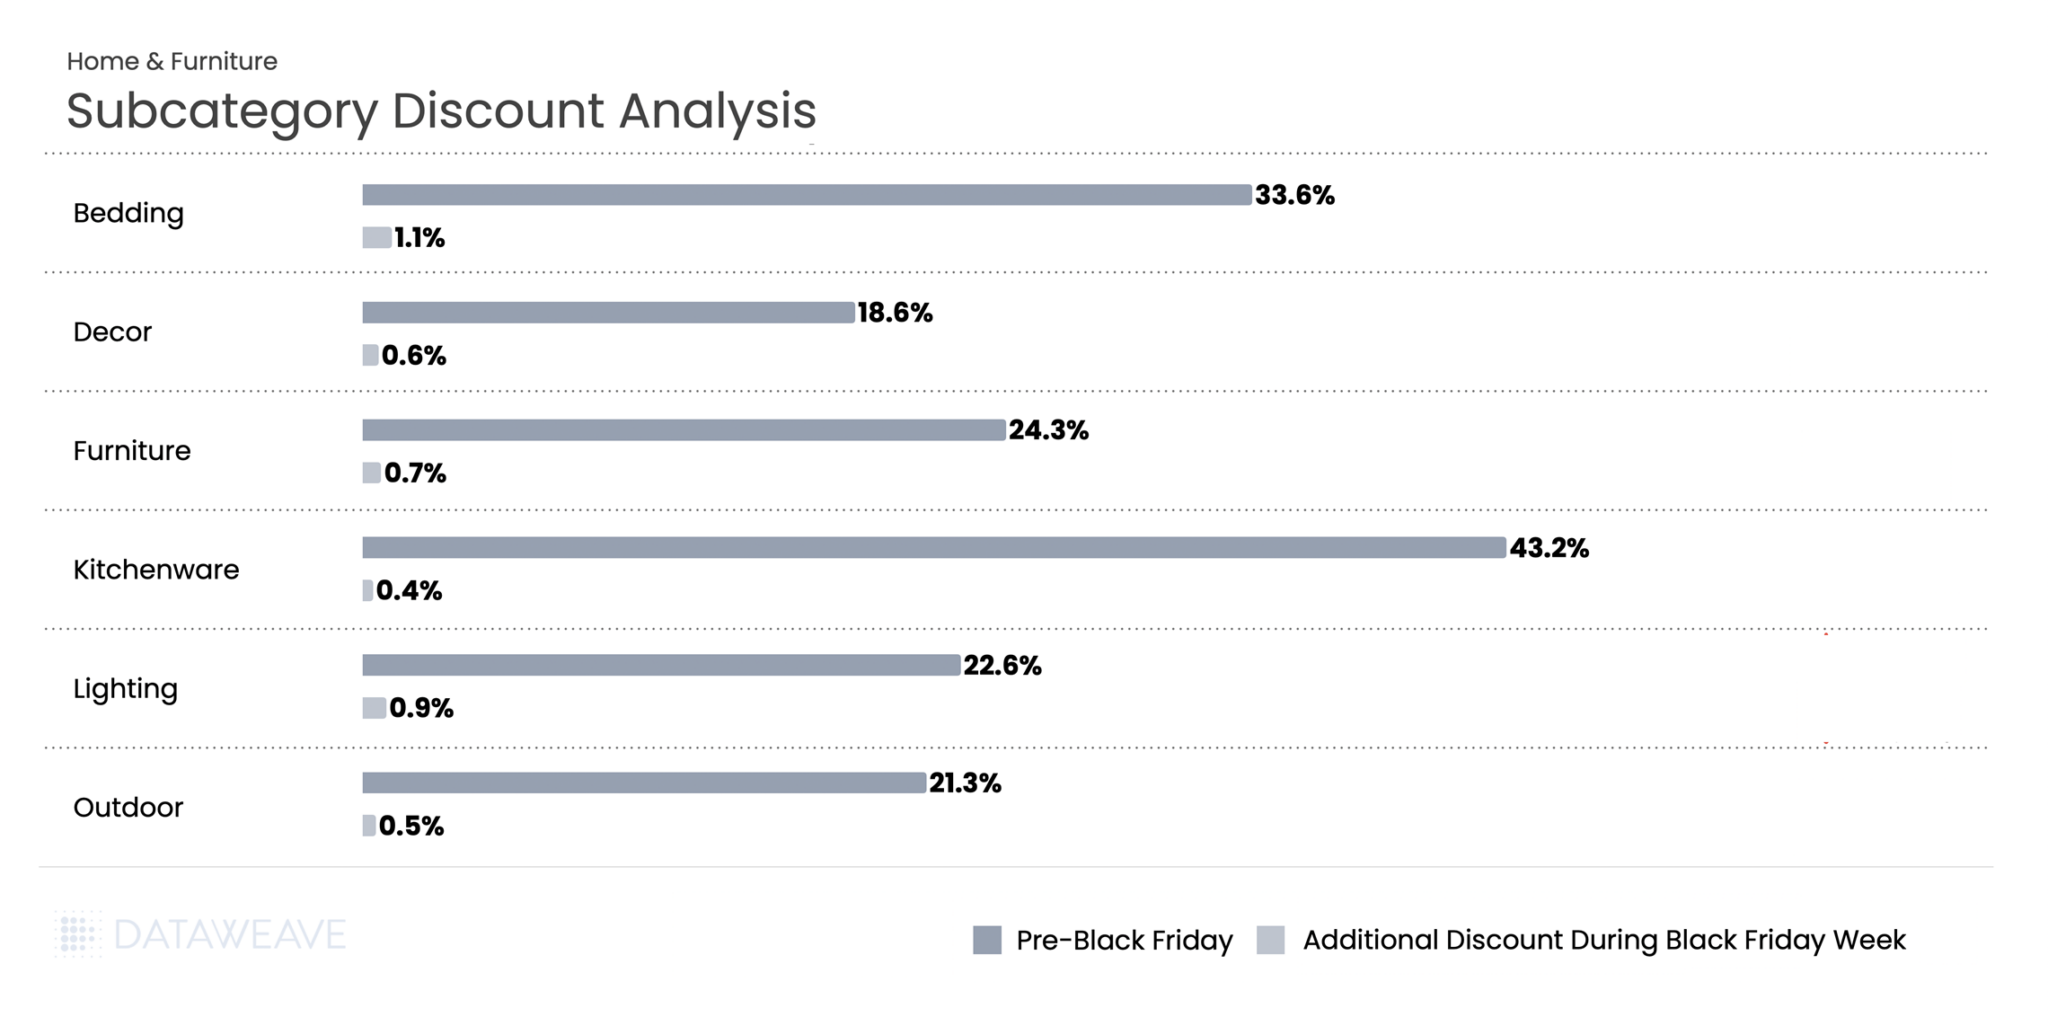
Home & Furniture led all categories with Pre-Black Friday discounts averaging 23.5%, but Black Friday Week added only 0.7%, the smallest incremental discount in our entire study. Kitchenware saw extraordinary pre-sale discounts of 43.2%, the highest in any subcategory we tracked. Bedding followed at 33.6%, while Furniture reached 24.3%. These deep early discounts likely aimed to drive early conversions and manage bulky inventory ahead of peak logistics constraints.
During Black Friday Week, additional discounting remained minimal across the board. Bedding posted the highest lift at 1.1%, while Kitchenware saw just 0.4%. The data suggests Canadian home goods retailers viewed the pre-sale period as their primary promotional window, with Black Friday serving more to sustain momentum than deliver new value.
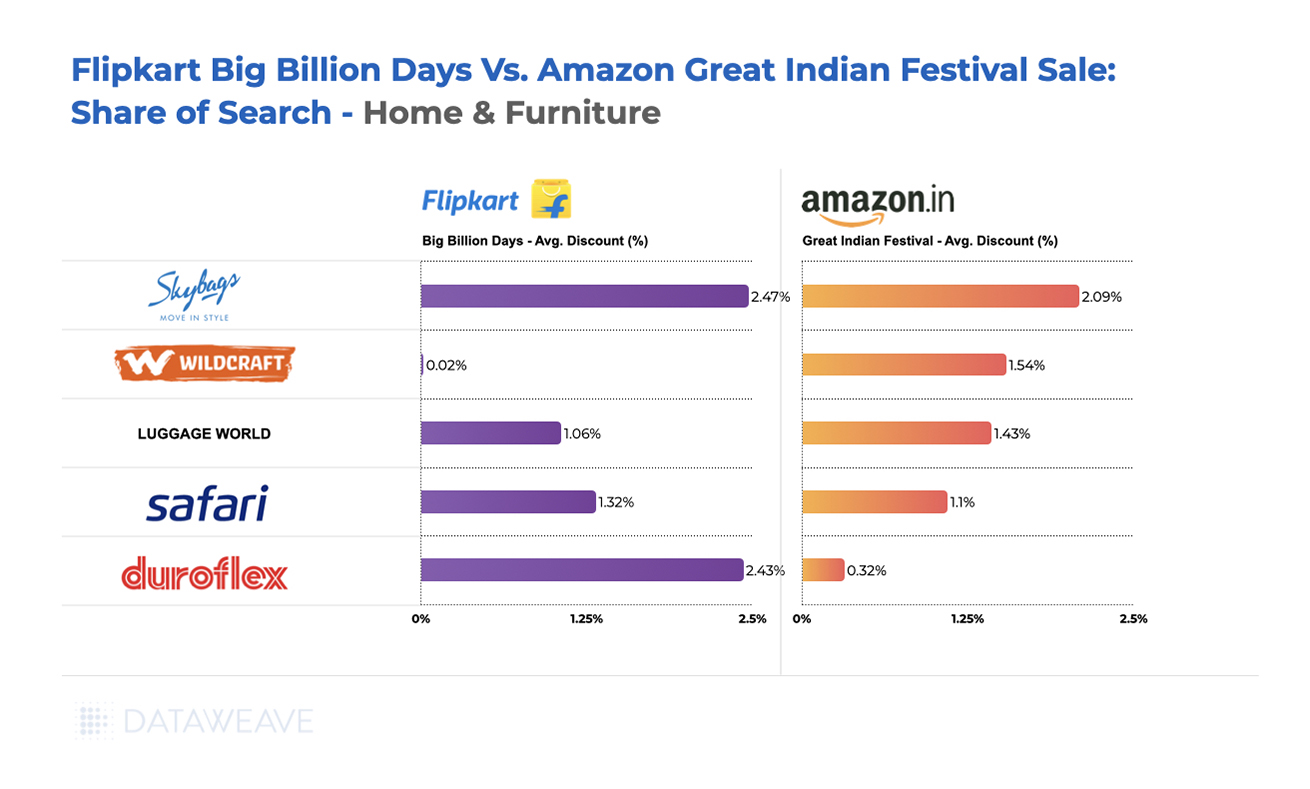
Share of Search: Brand Visibility Trends
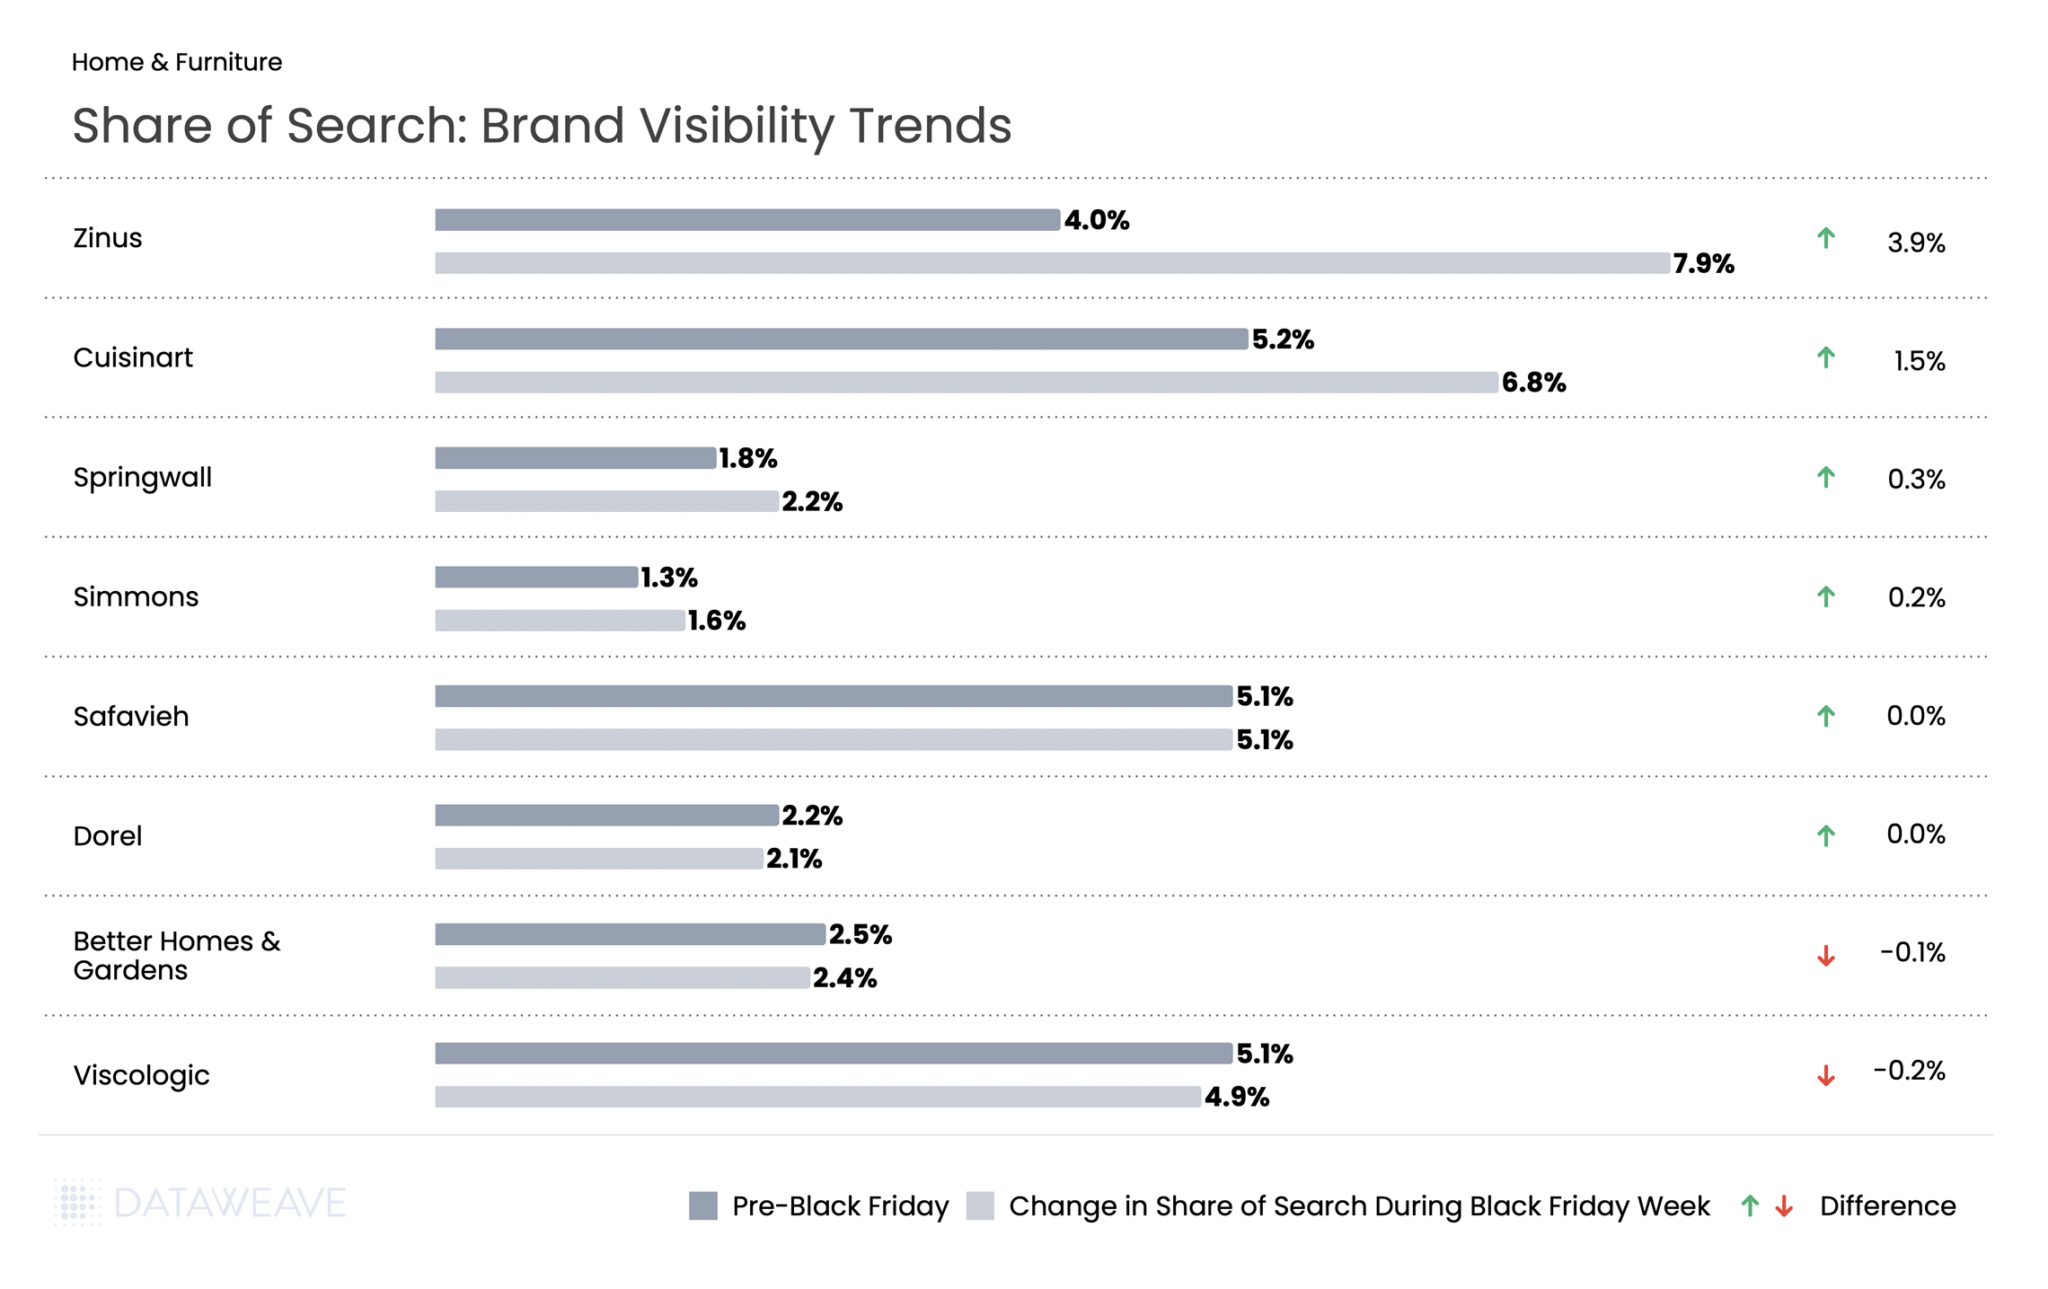
Mattress brand Zinus led gains with a 3.9% increase, positioning itself as a value-focused furniture leader during the sale period. Cuisinart climbed by 1.5%, suggesting strategic amplification of this established kitchenware brand.
Most home brands maintained relatively stable visibility throughout the sale period. Safavieh and Dorel showed essentially no change, while Better Homes & Gardens and Viscologic experienced only minor declines of 0.1% and 0.2% respectively.
Want to understand how DataWeave’s pricing intelligence platform can help your business make data-driven decisions during peak sales events? Contact us to learn more about competitive insights, price intelligence, assortment analytics, content analytics, and digital shelf analytics.
Check out our coverage on Black Friday 2025 across US, UK, and Germany. Follow our blog for more insights on retail pricing trends, brand visibility analysis, and data-driven commerce intelligence.
Black Friday 2025 solidified its position as a major retail event in the German market. German consumers demonstrated an average Black Friday budget of €317, the highest among select European countries.
The German market, however, exhibited unique consumer behavior patterns during Black Friday 2025. Rather than meticulous planning, 59% of German shoppers allowed deals to inspire their purchases, compared to just 32% who shopped with predetermined lists and budgets. This spontaneous yet budget-conscious approach distinguishes German consumers from other markets, where FOMO-driven purchasing tends to dominate.
Against this backdrop of rational deal-seeking and regional diversity, how did retailers and brands perform across key categories this Black Friday?
At DataWeave, we conducted a comprehensive analysis of Black Friday 2025 discounting trends across five major categories in the German market: Consumer Electronics, Home & Furniture, Health & Beauty, Grocery, and Apparel. Our AI-powered pricing intelligence platform monitored over 16,000+ SKUs across leading German retailers like Amazon, Aldi, Douglas, Nutritienda, Carethy, Bofrost, and more, revealing fascinating patterns in how retailers and brands approached this year’s sale season.
Our Methodology
For this analysis, DataWeave monitored average discounts across leading German retailers during two distinct periods:
Pre-Black Friday: November 6 – November 23, 2025 – capturing early holiday deals and baseline pricing
Additional Discounts During Black Friday Week: November 24 – December 1, 2025 – covering Thanksgiving week through Black Friday (November 28) and Cyber Monday (December 1)
Our sample encompassed the top-ranked products across subcategories on major retail sites. We also analyzed Share of Search data, which measures brand visibility by monitoring which brand names appear in the top 20 search results for critical keywords.
Black Friday 2025 Germany: The Big Picture
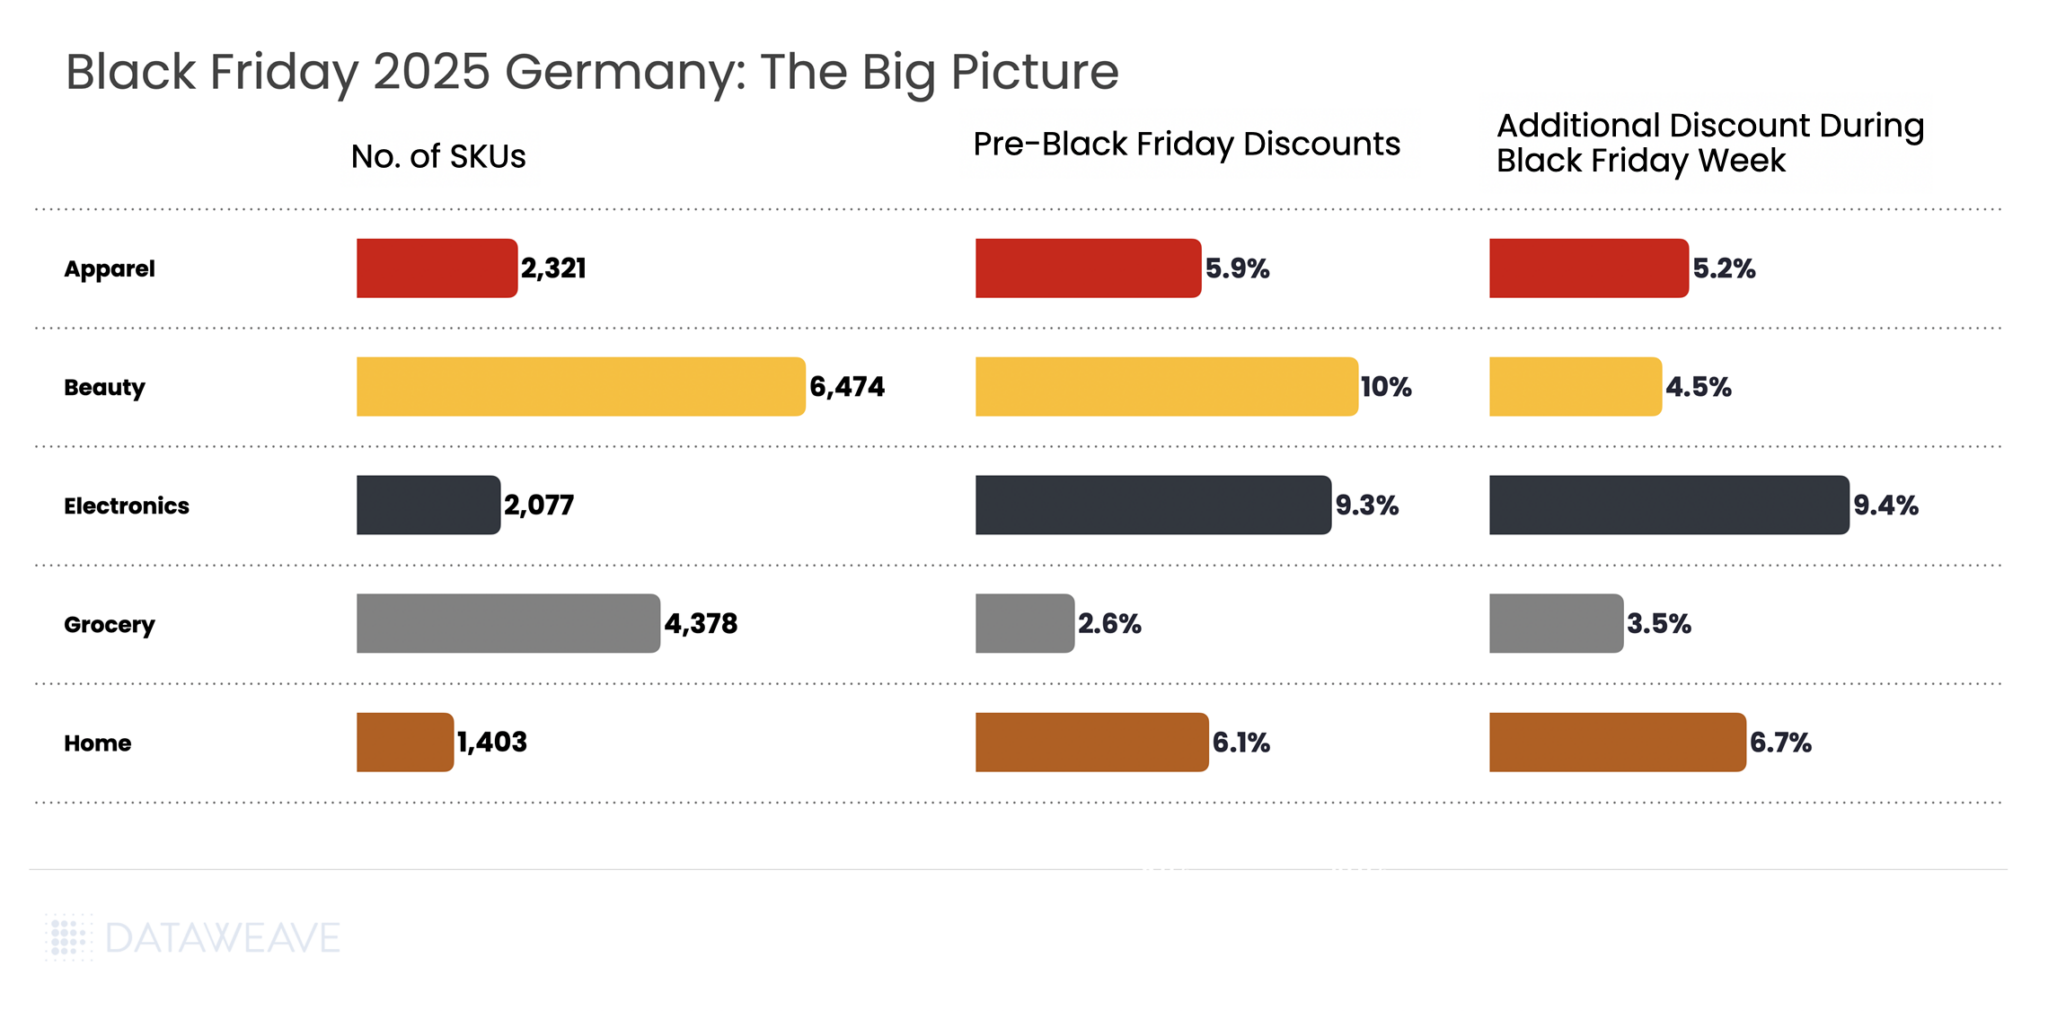
Our analysis covered 16,653 SKUs across five major categories. Here’s the snapshot of average discounts during the Pre-Black Friday period compared to Black Friday Week:
Key Insight: The German market presented a notably different discounting pattern compared to other markets. Pre-Black Friday discounts averaged 7% across all categories, with Black Friday Week adding 5.1% on average. Unlike the UK and US markets where retailers front-loaded promotions heavily, German retailers took a more balanced approach, with several categories actually seeing higher discounts during the main Black Friday Week.
Beauty led pre-sale discounts at 10%, followed by Electronics at 9.3%. Consumer electronics stood out with the highest Black Friday Week discounts at 9.4%, slightly exceeding even the pre-sale period at 9.3%.
Shopping Behavior Patterns: The relatively modest discount levels reflect the rational, value-oriented approach of German consumers. With the majority of shoppers setting budgets between €100-€299 and prioritizing wish fulfillment over impulse purchases, German retailers focused on strategic discounting rather than aggressive margin erosion.
Consumer Electronics
Consumer electronics dominated German Black Friday interest, with 77% of German shoppers most interested in electronics deals, making it the most anticipated category during the sales period. Our analysis of 2,077 SKUs reveals how discounts varied across subcategories and which brands dominated search visibility in this highly competitive category.
Subcategory Discount Analysis
This was one of the few categories where Black Friday Week discounts matched or exceeded pre-sale levels. Wearables led pre-sale discounting at 16.3%, followed closely by Audio & Video at 15.8%. During Black Friday Week, these categories saw additional discounts of 12.2% and 12.4% respectively.
The standout performer was Home Automation, which nearly doubled its additional discount from 7.2% to 13.9% during Black Friday Week. Mobile Devices saw additional discounts dropping from 13.4% pre-sale to 7.1% during Black Friday Week. Meanwhile Gaming doubled additional discounting from 2.1% to 4.3%.
Share of Search: Brand Visibility Trends
Our Share of Search analysis reveals significant shifts in brand visibility during Black Friday Week:
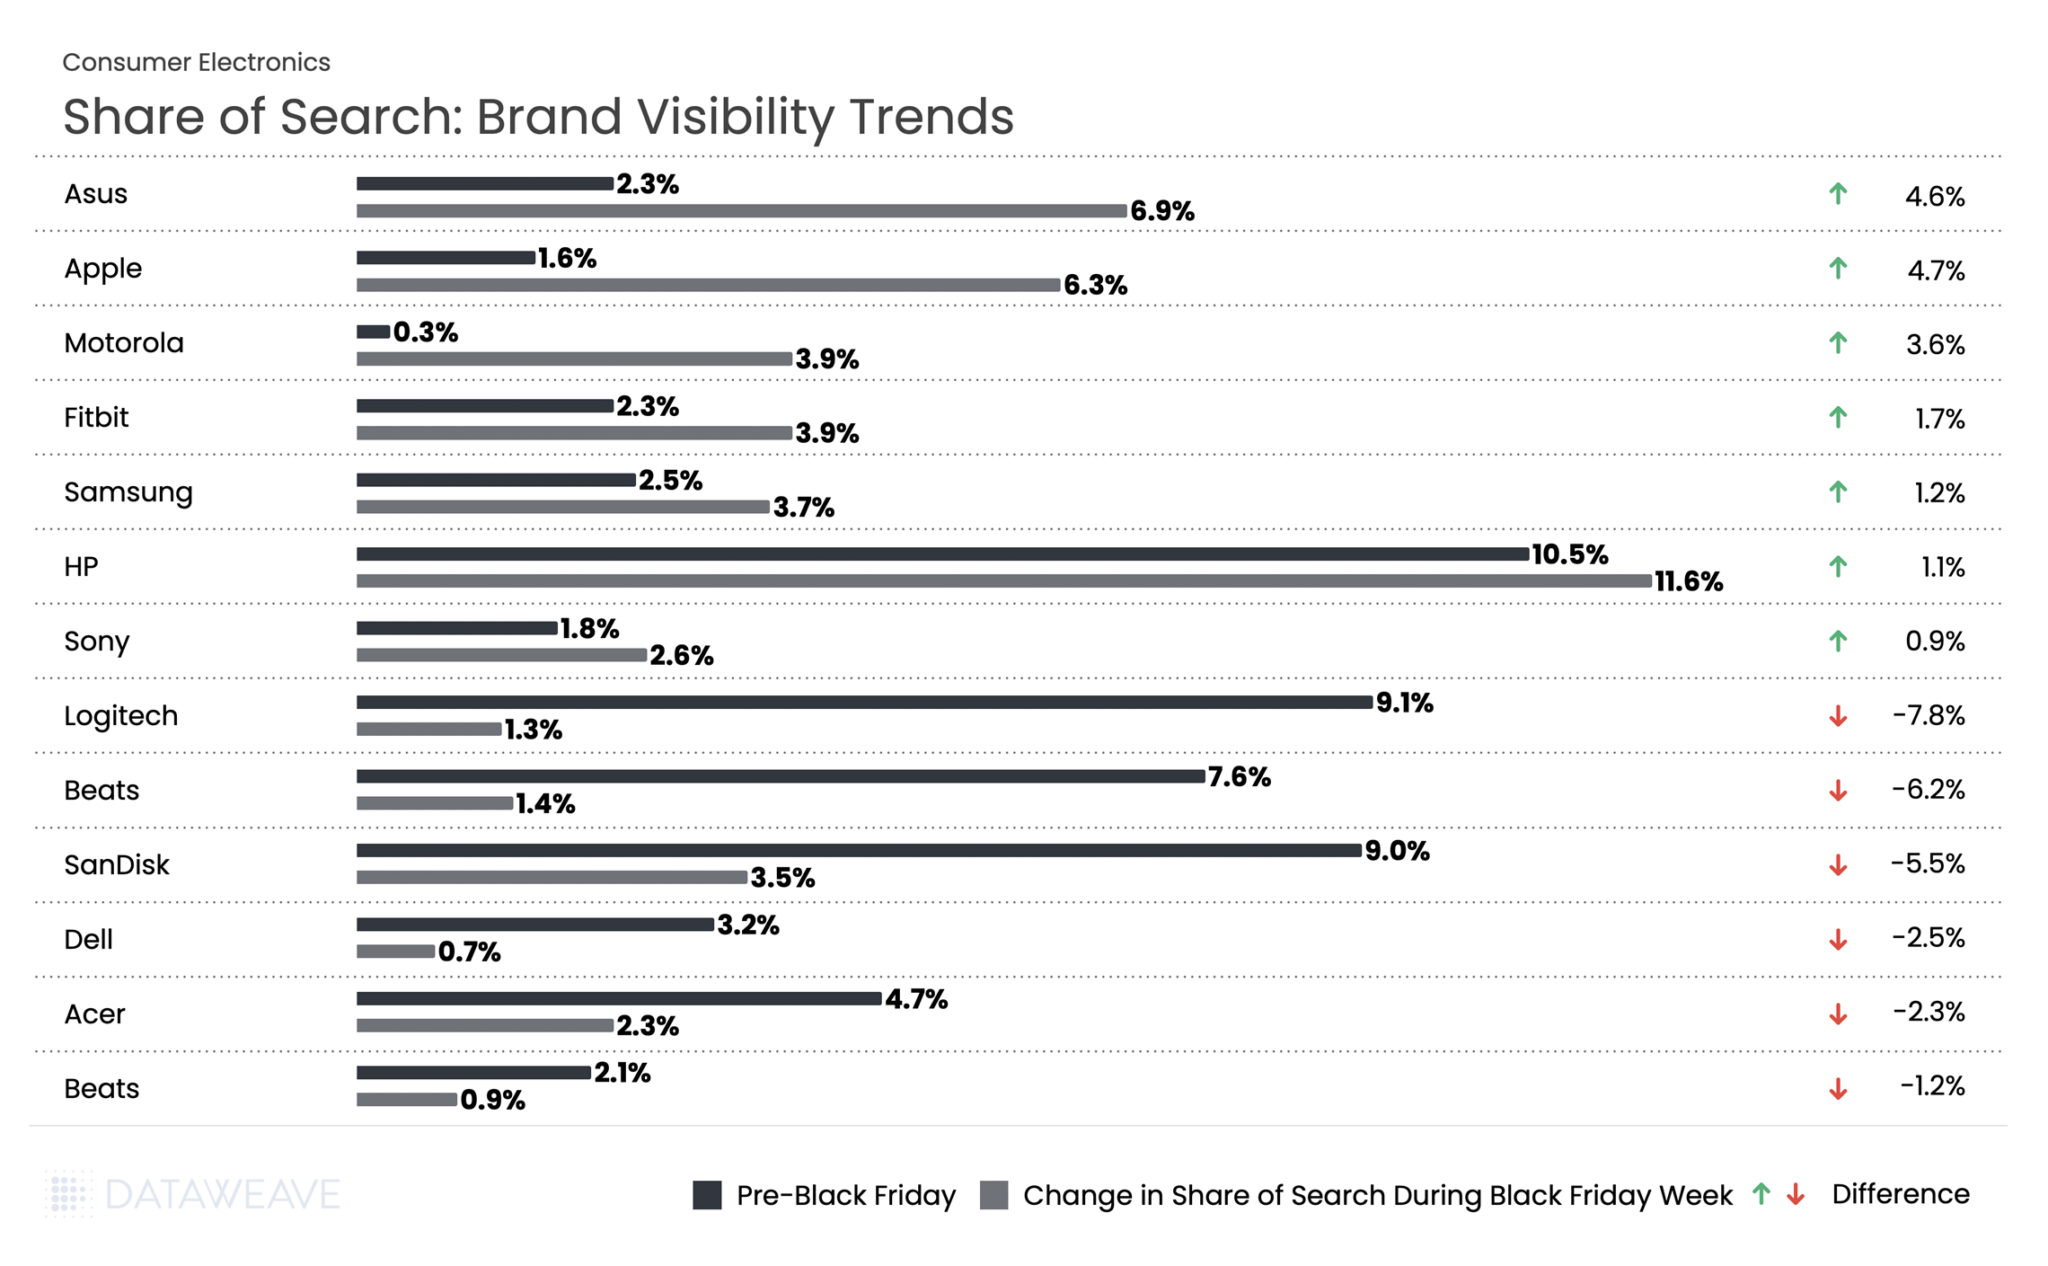
HP saw the highest share of search across Black Friday at 10.5% pre event and 11.6% during the event. Apple led with a 4.7% increase in visibility, jumping from 1.6% to 6.3%. Asus followed at 4.6%. Motorola surged 3.6 %, while wearables brand Fitbit gained 1.7%.
In stark contrast, Logitech dropped by 7.8 %, Beats fell 6.2 %, and SanDisk declined 5.5 %. Computer manufacturers Dell and Acer also struggled, falling 2.5 and 2.3 % respectively.
Home & Furniture
The Home & Furniture category in Germany showed unique discounting behavior compared to other markets, with additional Black Friday Week discounts (6.7%) actually exceeding Pre-Black Friday levels (6.1%). Our analysis of 1,403 SKUs shows how discounts were distributed across subcategories.
Subcategory Discount Analysis
Kitchenware led pre-sale discounts at 8.7%. Decor surged from 5% to 7.5%, lighting jumped from 5% to 6.9%, and bedding more than doubled from 3.2% to 6.6%. These substantial increases suggest strategic timing to capture consumer attention during peak shopping days.
Share of Search: Brand Visibility Trends
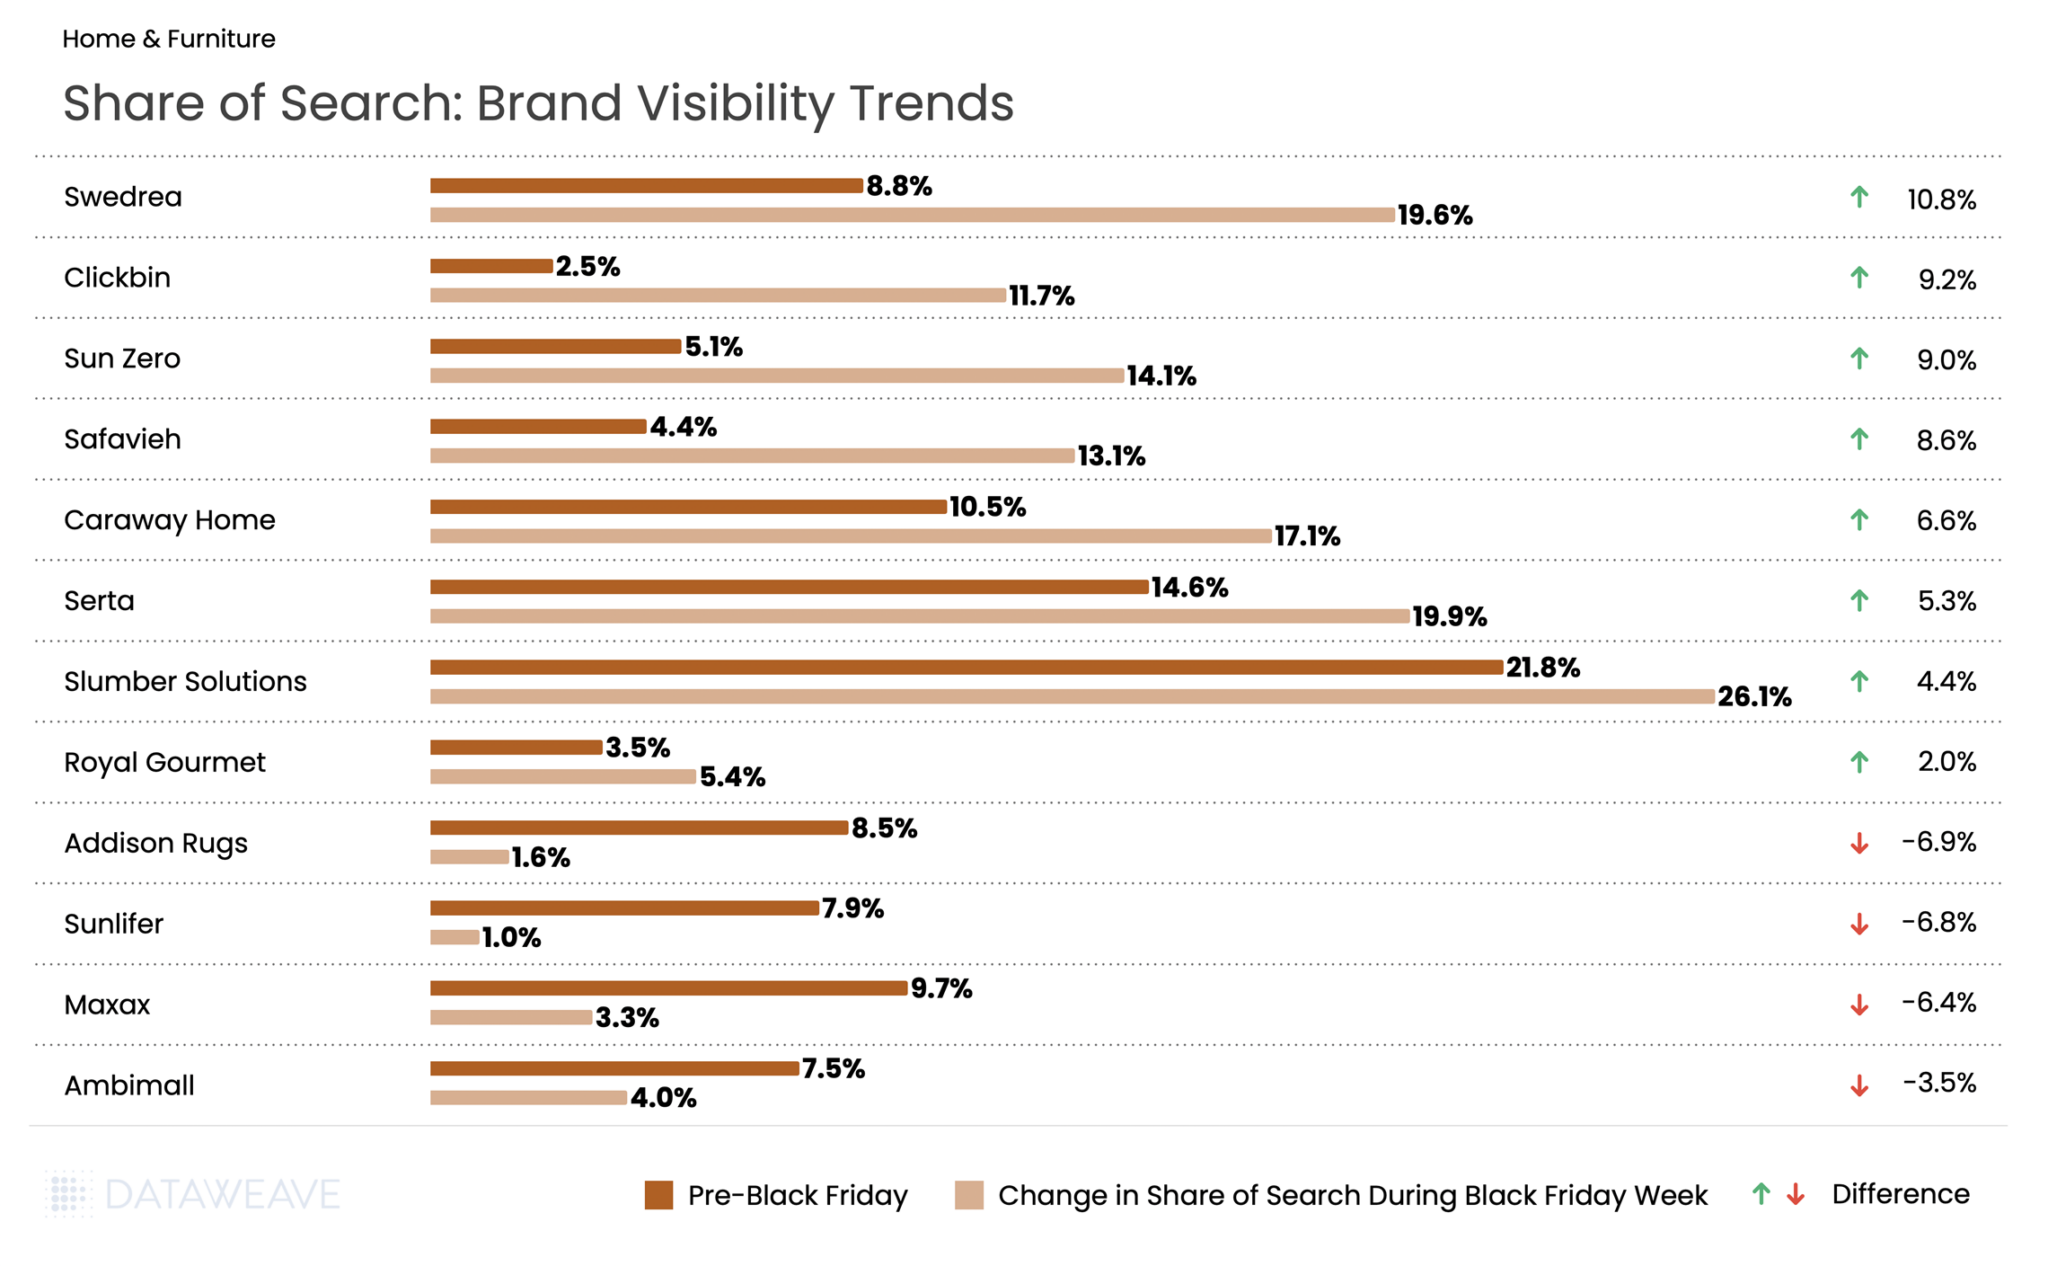
Mattress brand Slumber Solutions saw the highest share of search at 21.8% pre event and 26.1% during Black Friday week. Meanwhile, another mattress brand Swedrea led all brands with a remarkable 10.8% surge in visibility, jumping from 8.8% to 19.6%. Budget-friendly furniture brand Clickbin gained 9.2%, while window treatment brand Sun Zero increased 9% and home textiles brand Safavieh surged 8.6%.
Premium and established brands also performed well: Caraway Home (cookware) rose 6.6%, mattress brand Serta gained 5.3%, and Slumber Solutions added 4.4%. Royal Gourmet, specializing in outdoor cooking equipment, gained 2.0%.
However, several mid-tier brands faced steep declines. Addison Rugs dropped 6.9% from 8.5% to just 1.6%, while Sunlifer fell 6.8 % and Maxax declined 6.4 %.
Health & Beauty
Our analysis of 6,474 SKUs reveals subcategory-level insights and dramatic brand visibility shifts that highlight the evolving German beauty landscape.
Subcategory Discount Analysis
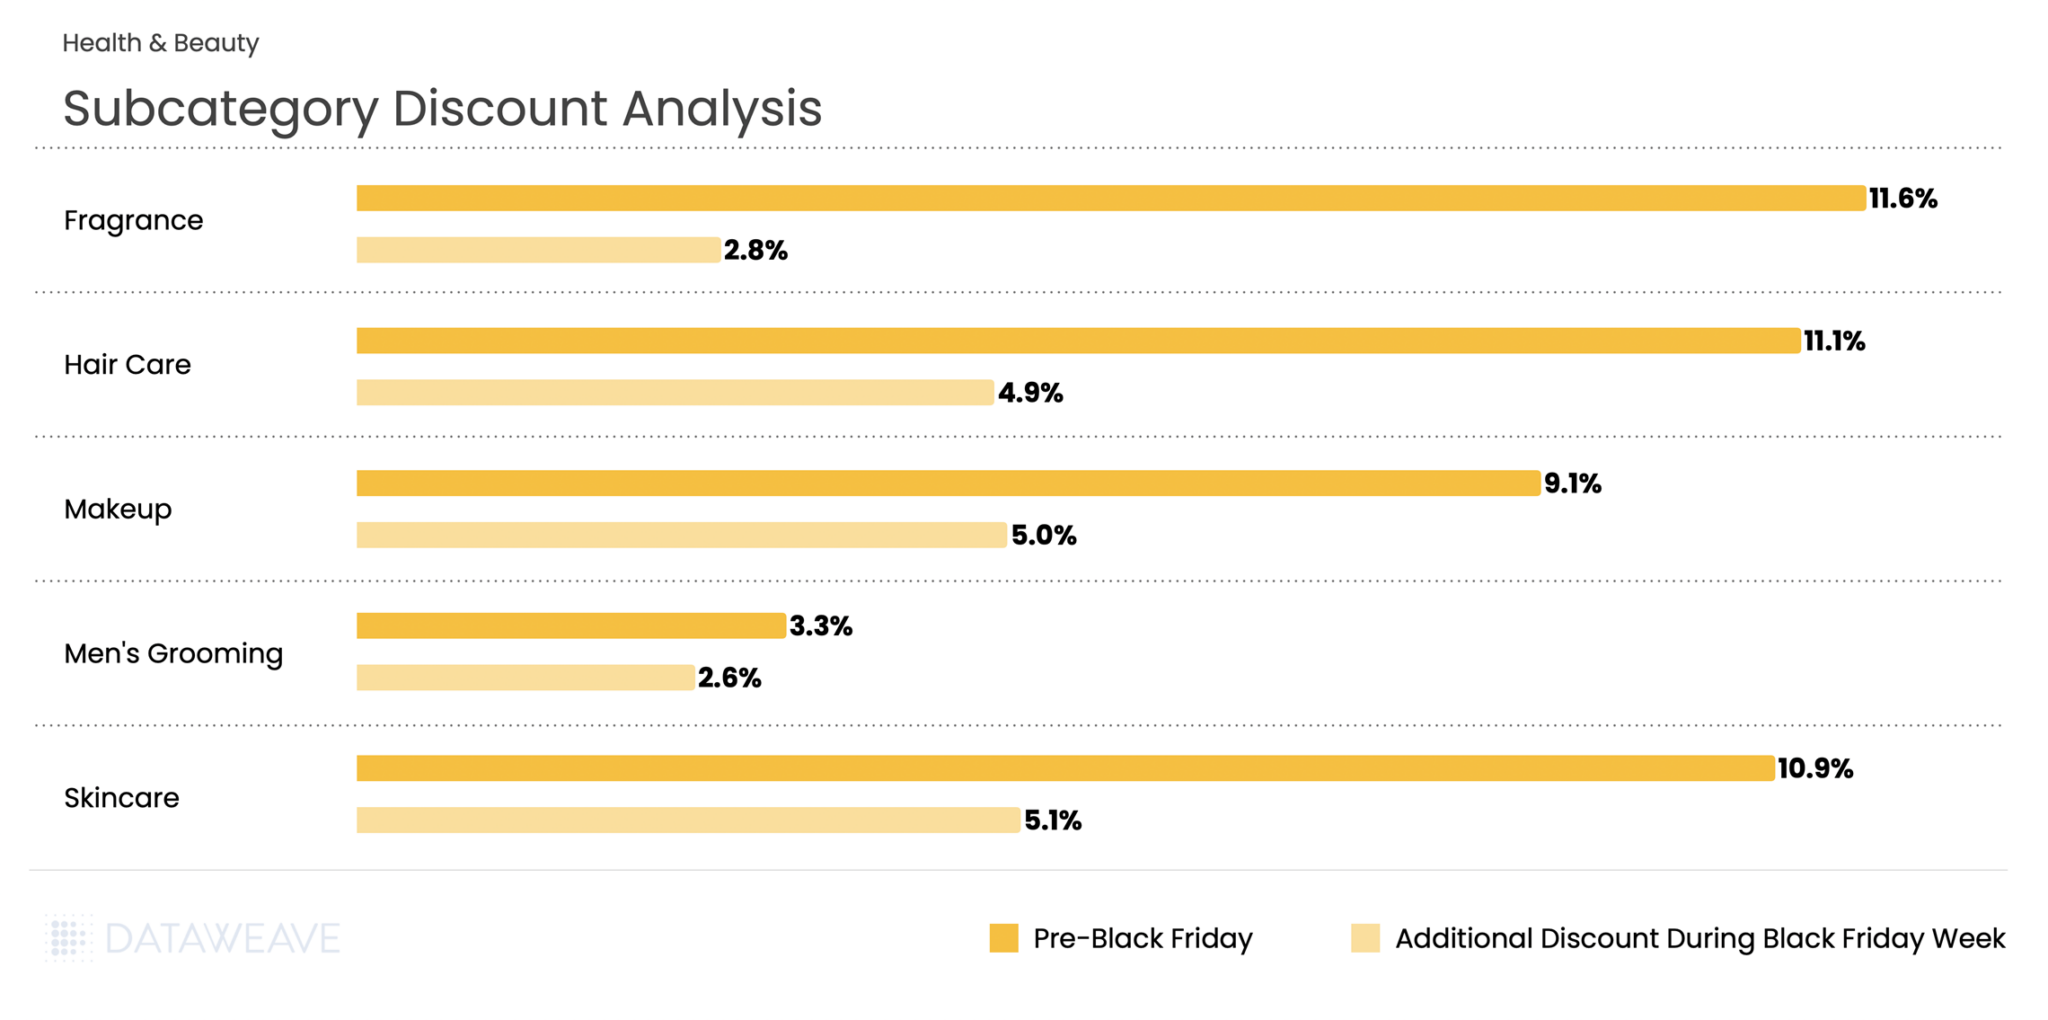
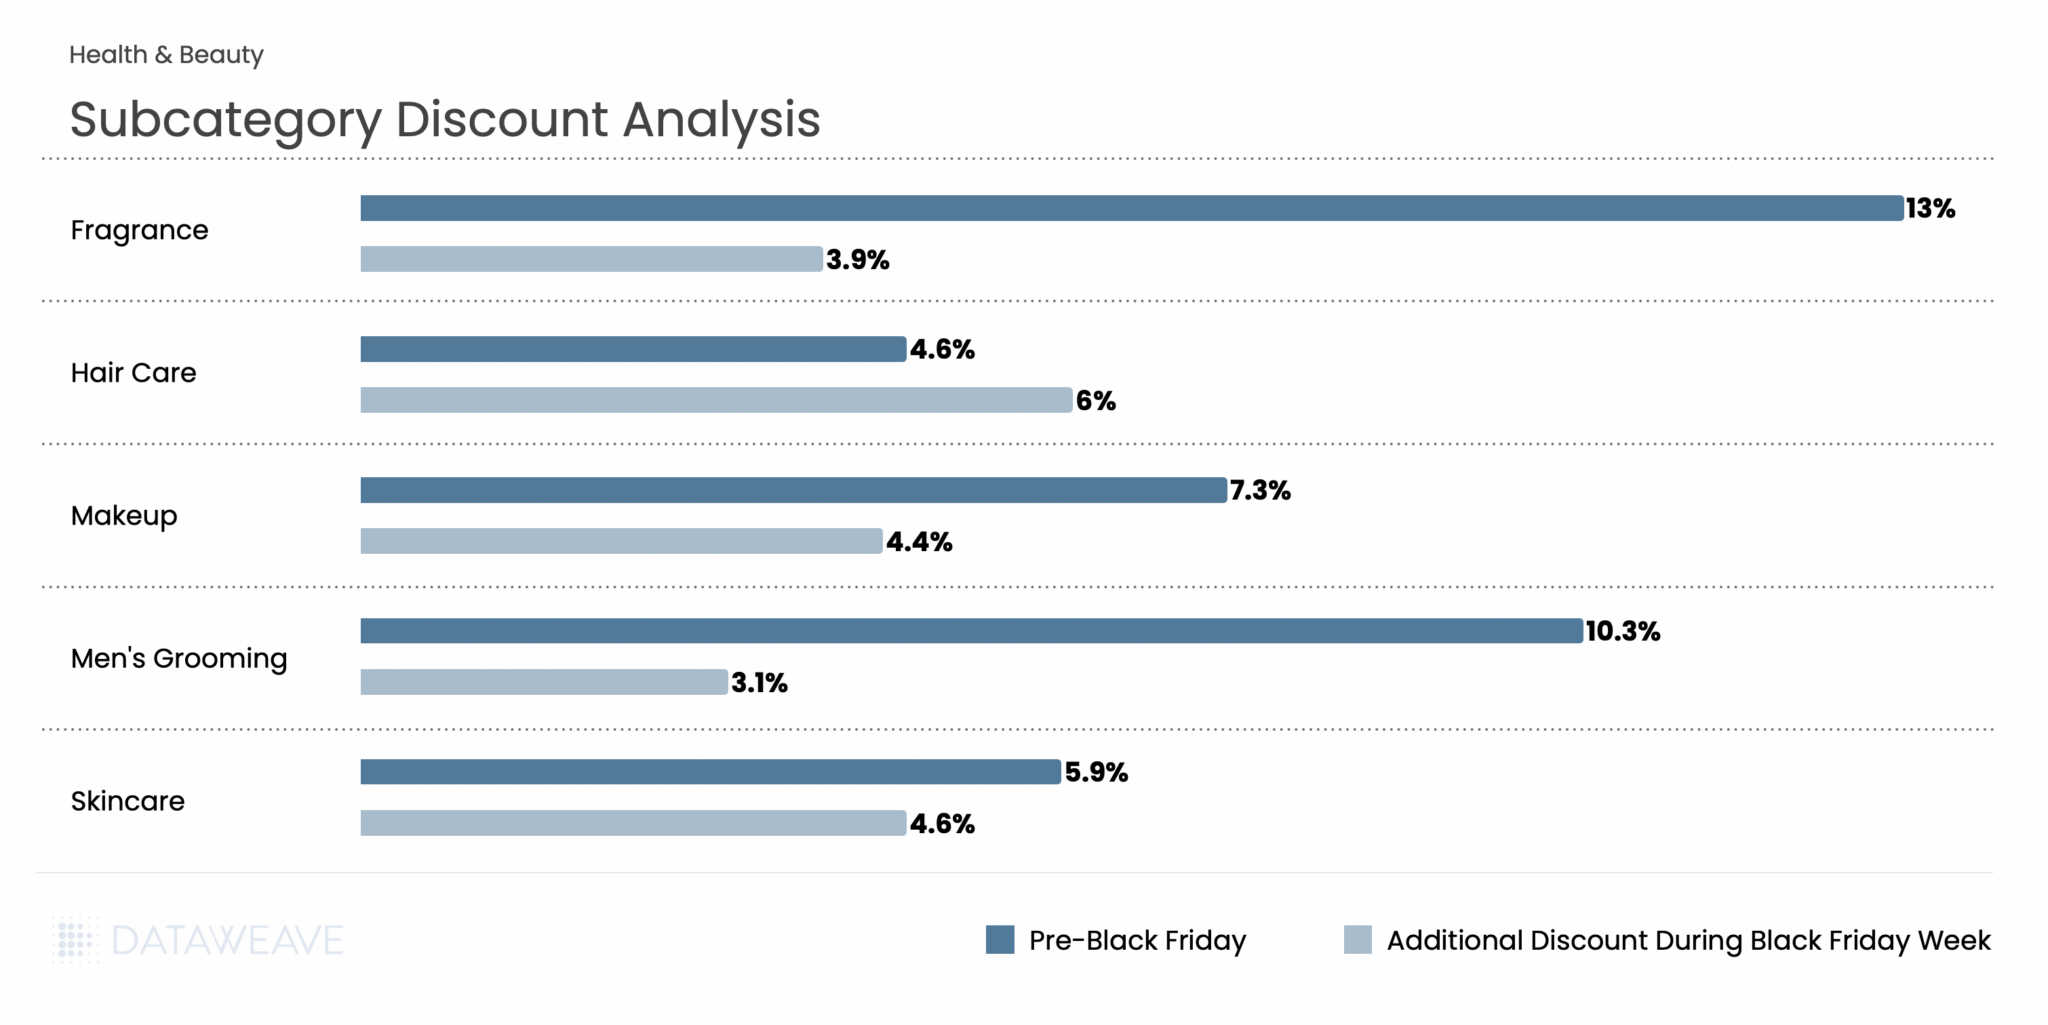
Pre-Black Friday discounts averaged 10%, with Black Friday Week adding 4.5% on average. Fragrance led pre-sale discounting at 11.6%, positioning perfumes and colognes as attractive early holiday purchases. However, Fragrance saw the smallest Black Friday Week addition at just 2.8%.
Hair Care and Skincare both showed strong performance across both periods, with Hair Care at 11.1% pre-sale and 4.9% during Black Friday Week, while Skincare registered 10.9% and 5.1% respectively. Skincare’s 5.1% Black Friday Week discount was the highest in the category.
Men’s Grooming stood apart with notably lower discounts at 3.3% pre-sale and 2.6% during Black Friday Week, suggesting either tighter margins in this subcategory or strategic positioning at different price points.
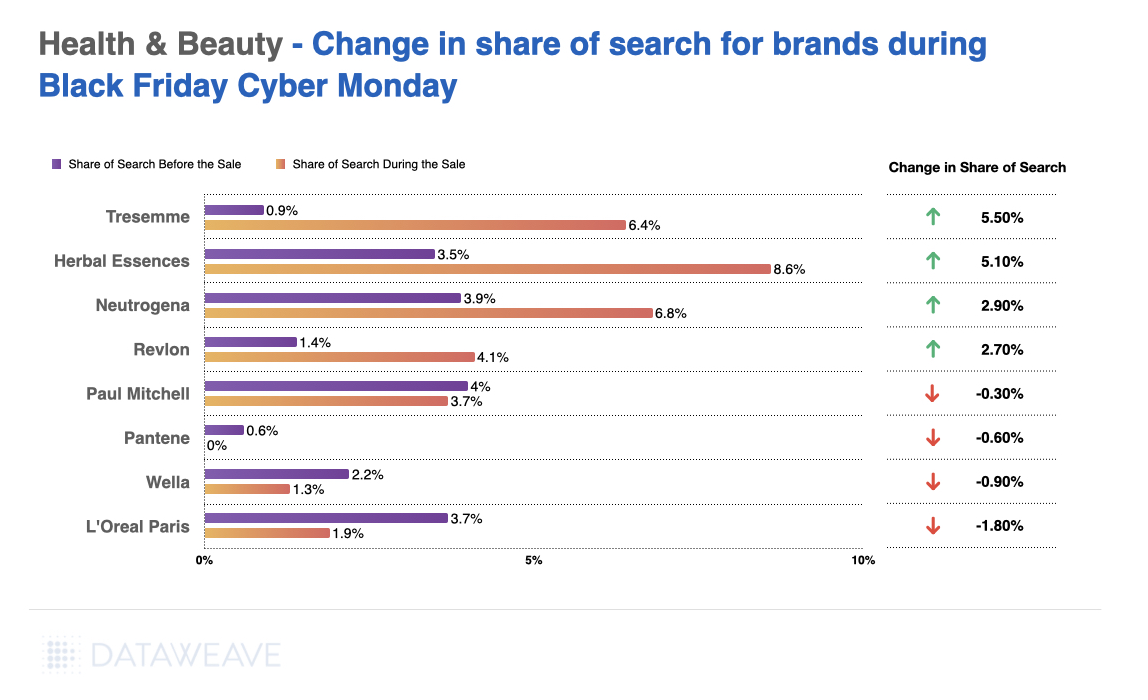
Share of Search: Brand Visibility Trends
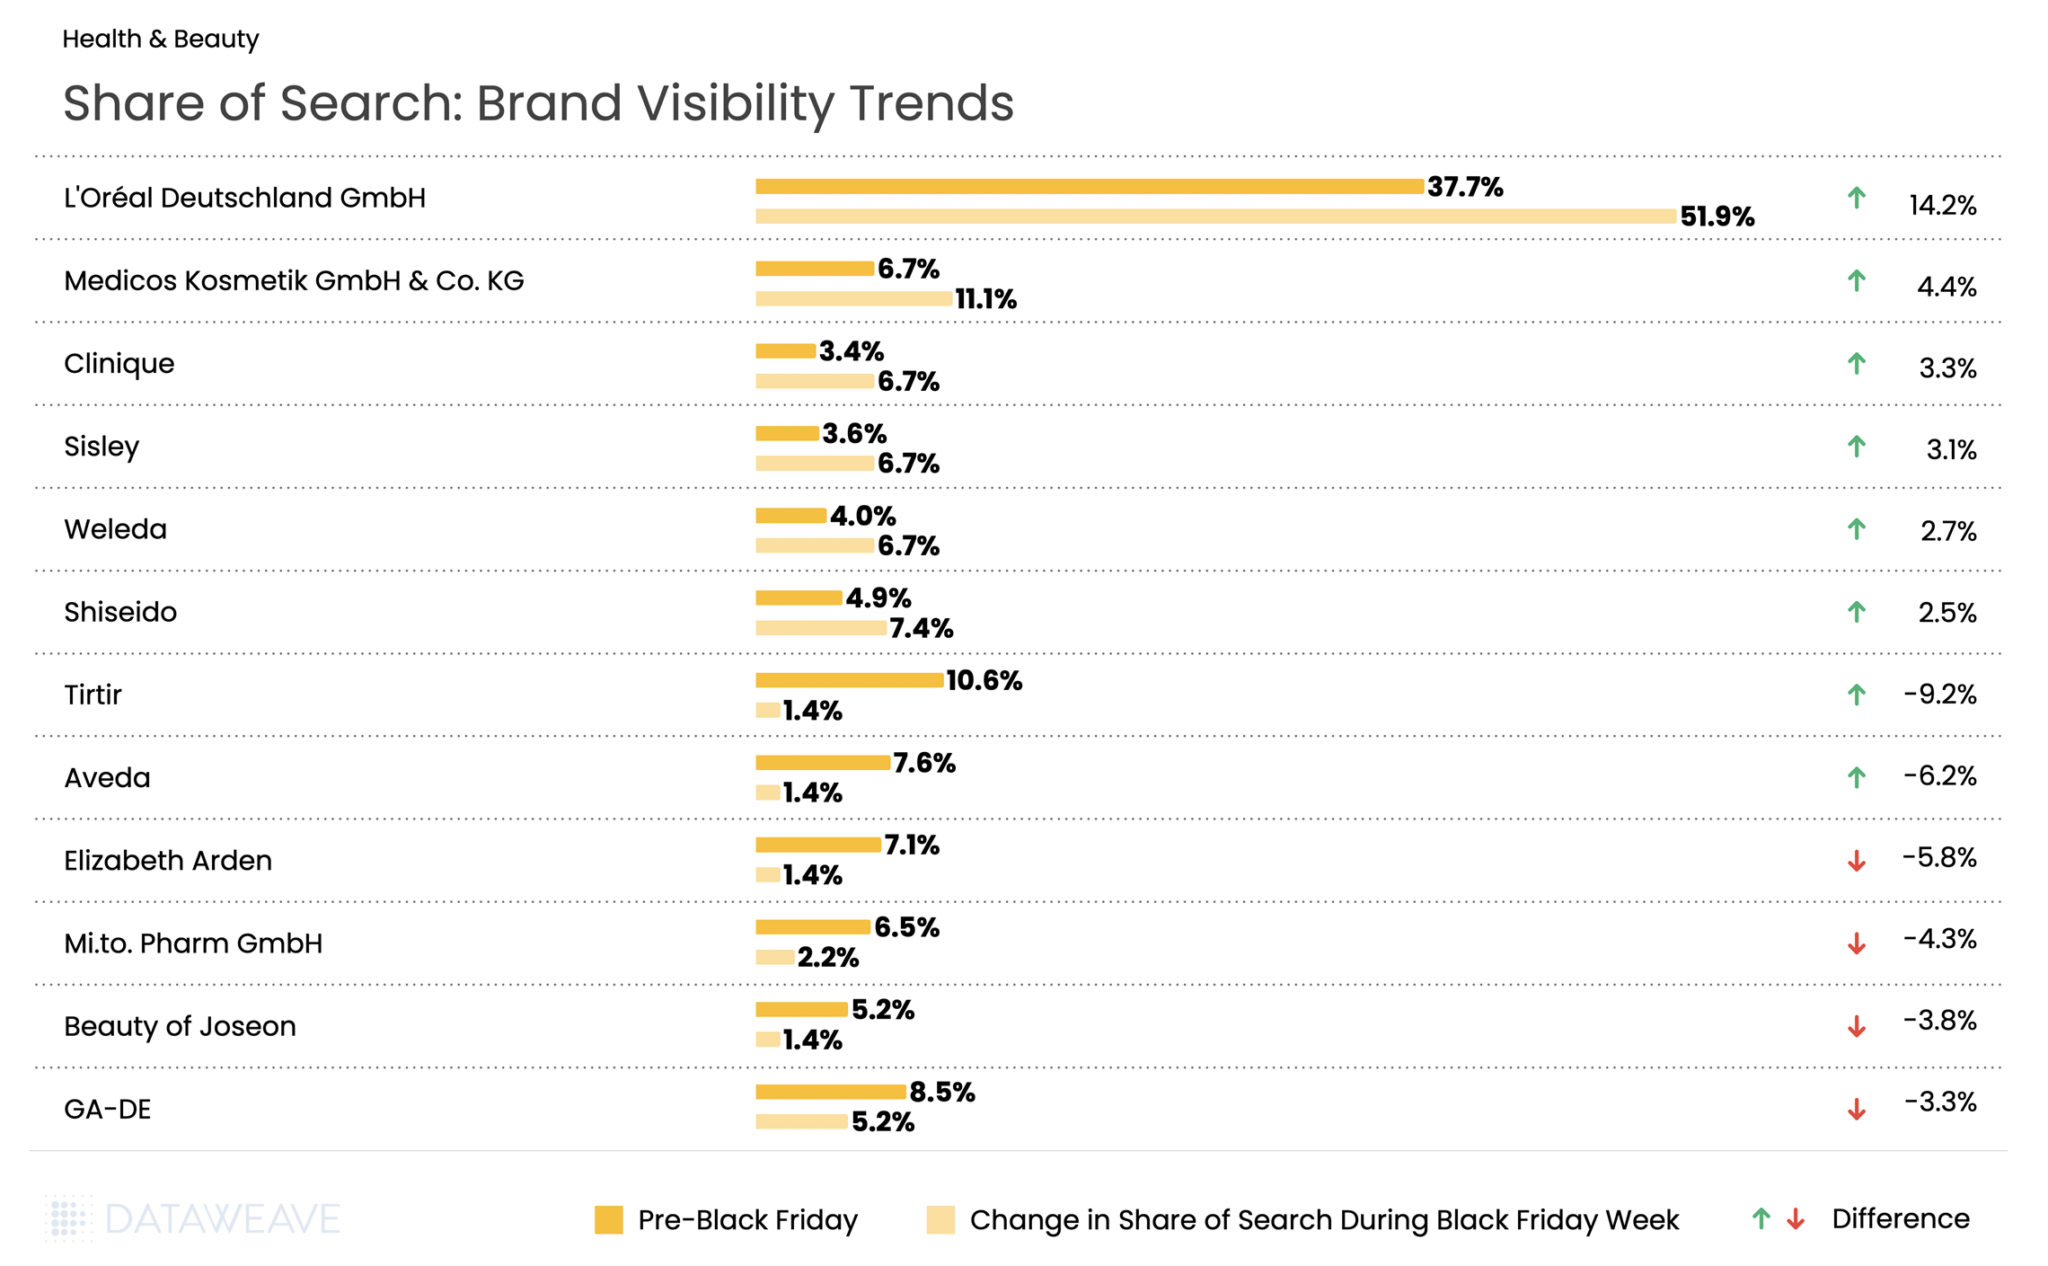
L’Oréal Deutschland GmbH emerged as the most visible brand, surging from 37.7% to 51.9%, (+14.2). German pharmaceutical cosmetics company Medicos Kosmetik GmbH & Co. KG gained 4.4 %. Clinique gained 3.3 %, and French luxury brand Sisley added 3.1 %, German natural cosmetics brand Weleda rose 2.7 %, and Japanese prestige brand Shiseido gained 2.5 %.
The flip side? K-beauty brands and some international names faced significant challenges. Viral make-up brand Tirtir experienced the steepest decline visibility, dropping by 9.2 %. Aveda fell 6.2 %, Elizabeth Arden dropped 5.8 %, and Beauty of Joseon declined 3.8 %. German pharmacy brand Mi.to. Pharm GmbH lost 4.3 %, while Israeli makeup brand GA-DE fell 3.3 %.
The data reveals a clear German preference for European beauty heritage, pharmaceutical-grade cosmetics, and established prestige brands during Black Friday, rather than trendy K-beauty products or mid-tier international brands.
Grocery
While Grocery typically sees more modest discounts compared to discretionary categories, the German market showed interesting patterns with Black Friday Week discounts (3.5%) actually exceeding Pre-Black Friday levels (2.6%). Our analysis of 4,378 SKUs shows how German retailers approached promotions across essential and indulgent subcategories.
Subcategory Discount Analysis
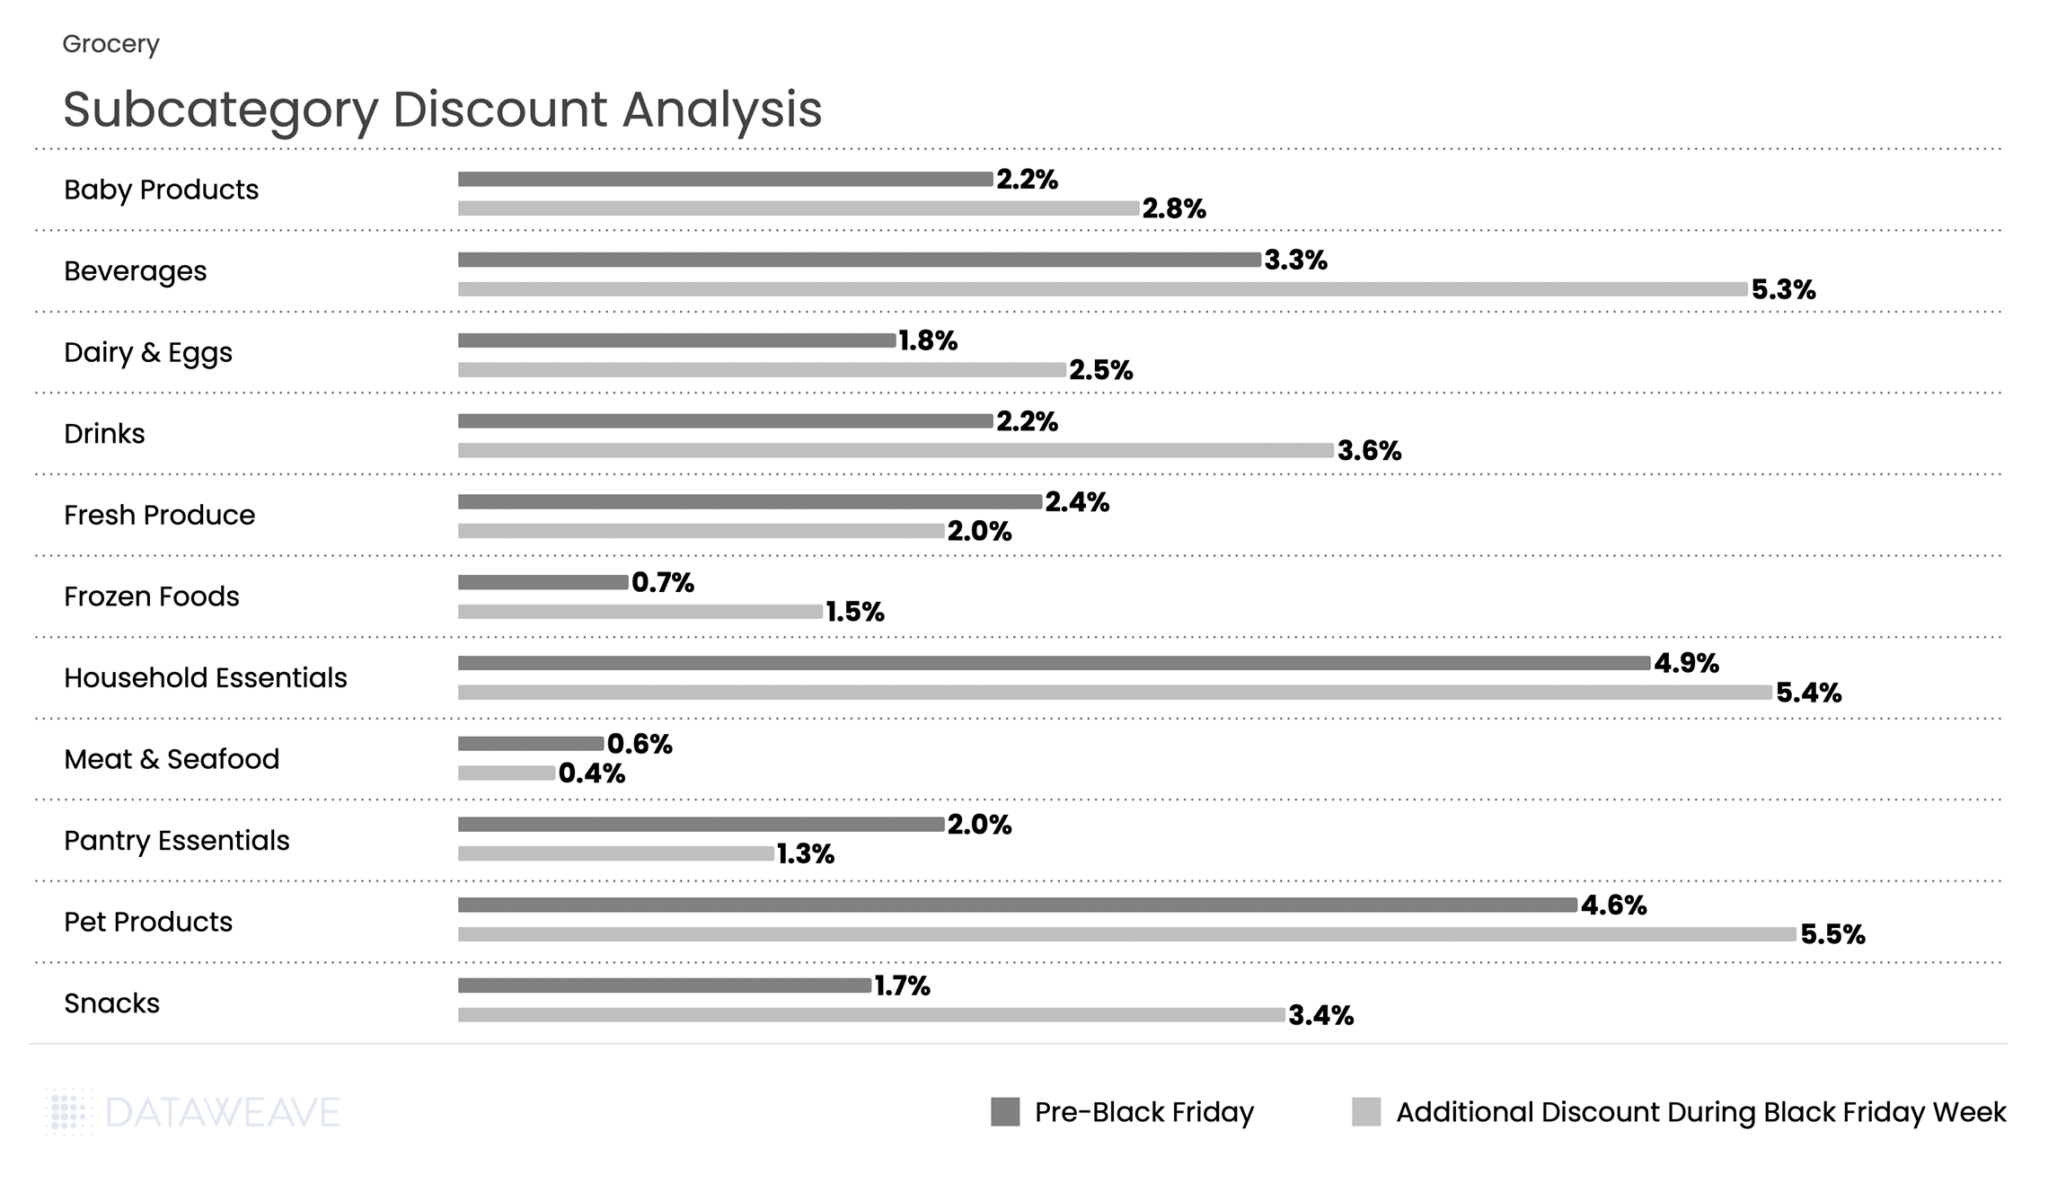
Pre-Black Friday discounts averaged just 2.6% in grocery. But Black Friday Week saw this surging to 3.5%, an increase that represents the highest proportional jump among all categories.
Pet Products and Household Essentials led discounting, with Pet Products at 4.6% pre-sale and an additional 5.5% during Black Friday Week. Meanwhile Household Essentials registered 4.9% and 5.4% respectively.
Beverages showed particularly strong Black Friday Week performance, jumping from 3.3% to 5.3%, while snacks doubled from 1.7% to 3.4%. Fresh categories maintained minimal promotional activity consistent with perishable inventory constraints: Meat & Seafood saw negligible discounts (0.6% pre-sale, 0.4% Black Friday Week), while Fresh Produce actually decreased from 2.4% to 2% during the main event.
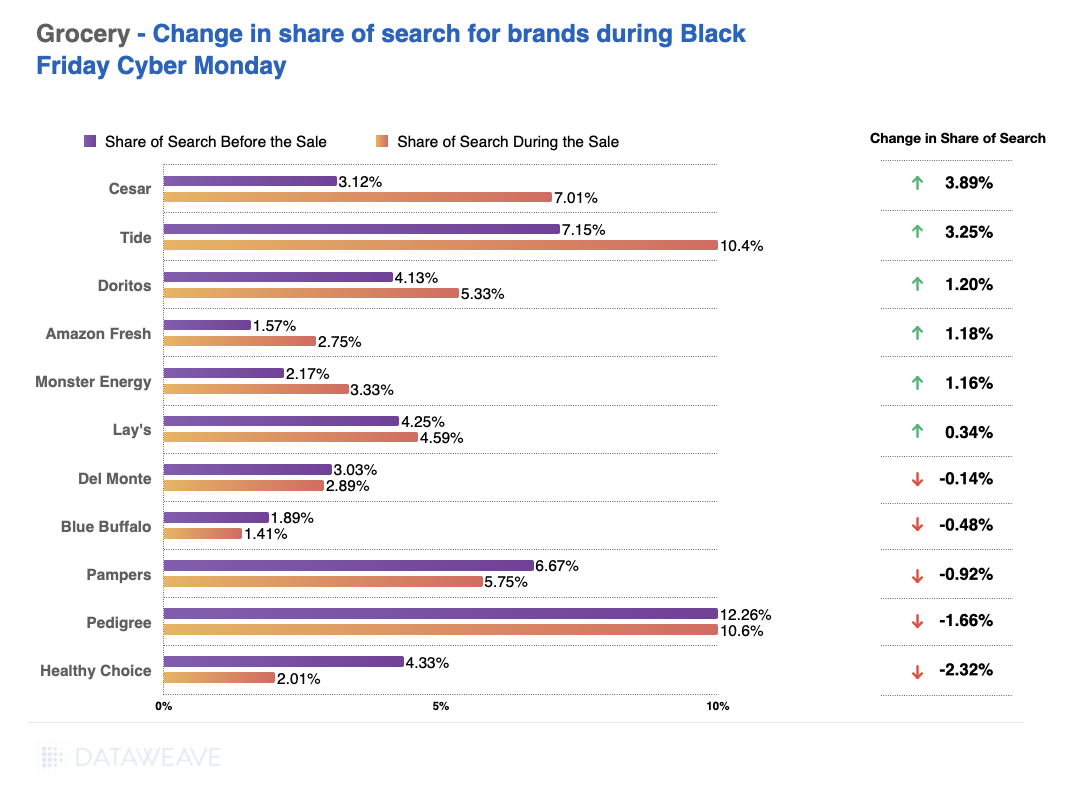
Share of Search: Brand Visibility Trends
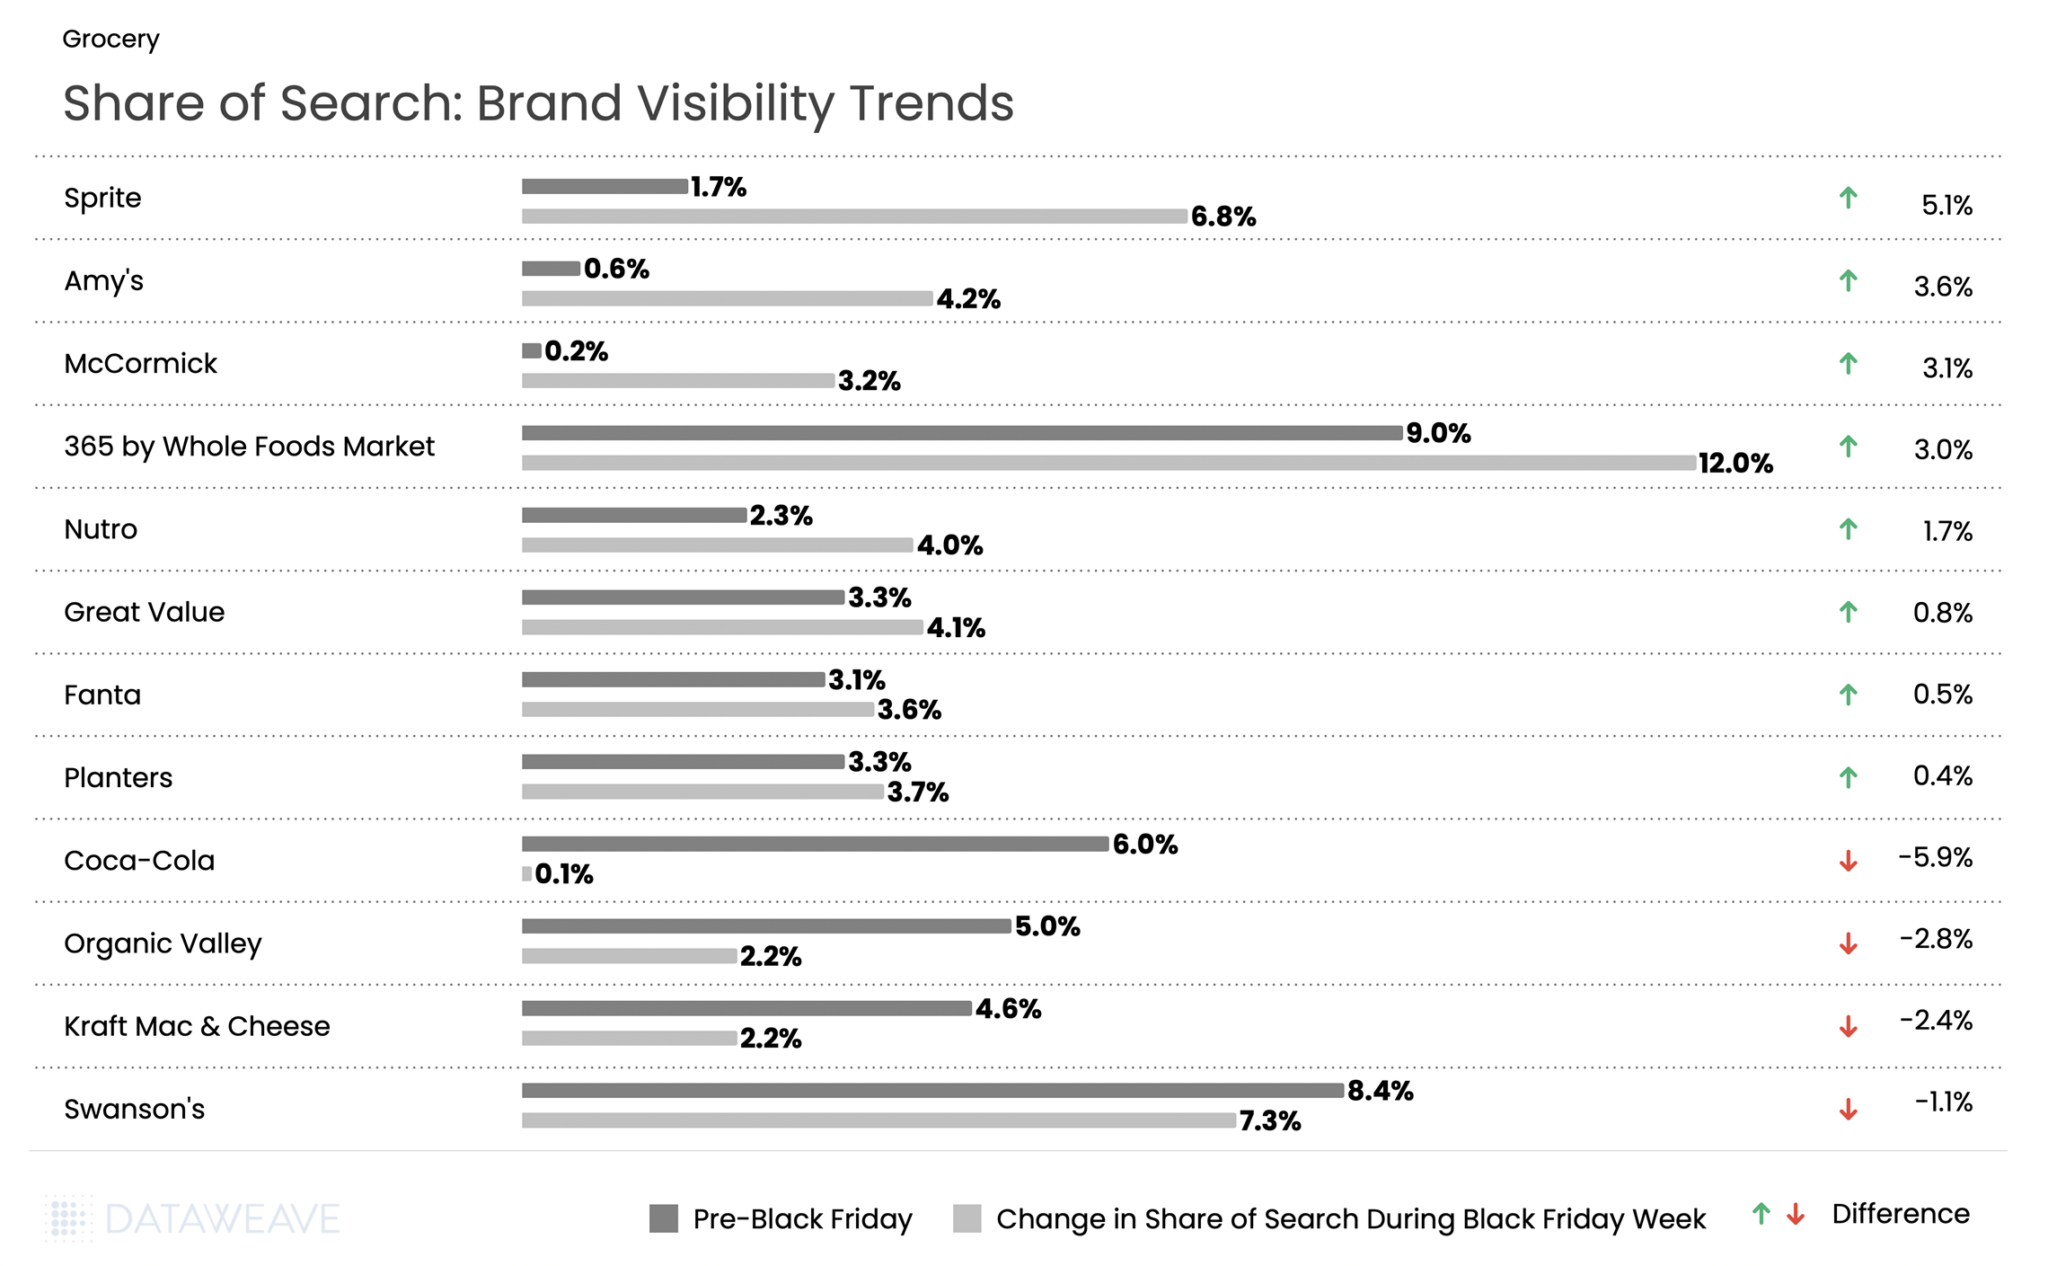
365 by Whole Foods saw the highest share of search at 9% pre event and 12% during Black Friday week. But Sprite led all brands with a 5.1% surge in share of search. Meanwhile, sister brand Coca-Cola experienced one of the steepest declines in our analysis, with visibility plummeting from 6.0% to just 0.1%. Fanta maintained modest search growth at 0.5 %. This stark divergence between two brands from the same parent company suggests vastly different promotional strategies during Black Friday Week.
Specialty and organic food brands performed well: Amy’s (organic/natural foods) gained 3.6 %, while spice brand McCormick surged 3.1 %. Pet food brand Nutro gained 1.7 %, while value-oriented Great Value added 0.8 %.
Snack brand Planters gained 0.4 %. On the decline side, Organic Valley dropped 2.8 %, Kraft Mac & Cheese fell 2.4 %, and Swanson’s declined 1.1 %.
Apparel
Apparel in the German market showed modest promotional activity compared to other markets, with Pre-Black Friday discounts averaging 5.9% and Black Friday Week at 5.2%. Our analysis of 2,321 SKUs reveals interesting patterns across fashion segments in the German market.
Subcategory Discount Analysis
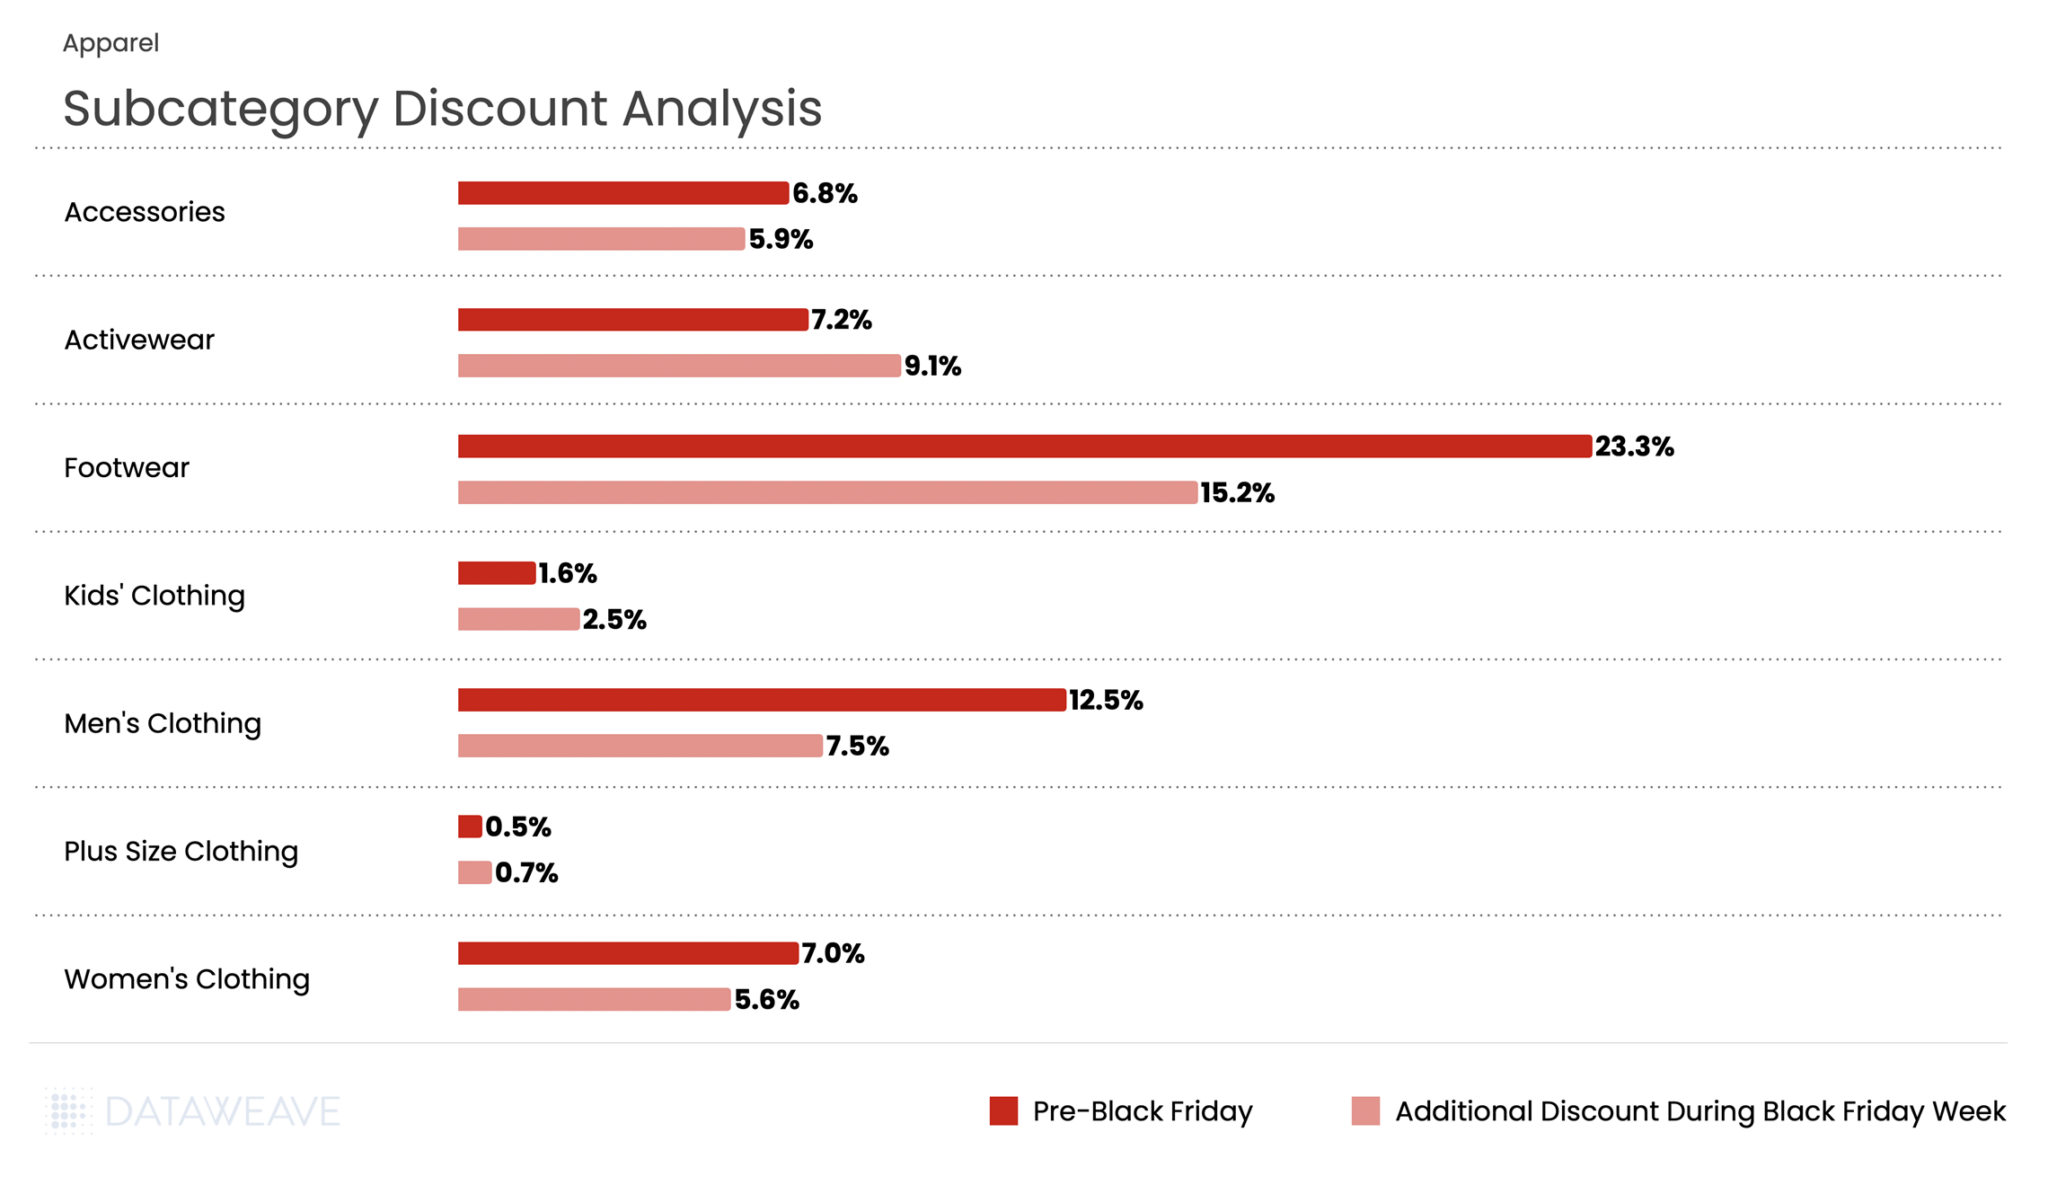
Footwear dominated discounting in both periods, with an impressive 23.3% pre-sale discount, and 15% additional discount during Black Friday Week. Men’s Clothing followed at 12.5% pre-sale, with additional 7.5% during Black Friday Week.
Activewear presented a unique pattern, with discounts increasing from 7.2% pre-event to additional 9.1% during Black Friday Week: one of the few subcategories to show higher discounts during the main event. Plus Size Clothing saw minimal promotional activity at 0.5% pre-sale and 0.7% during Black Friday Week, the lowest discounts in the entire category.
Share of Search: Brand Visibility Trends
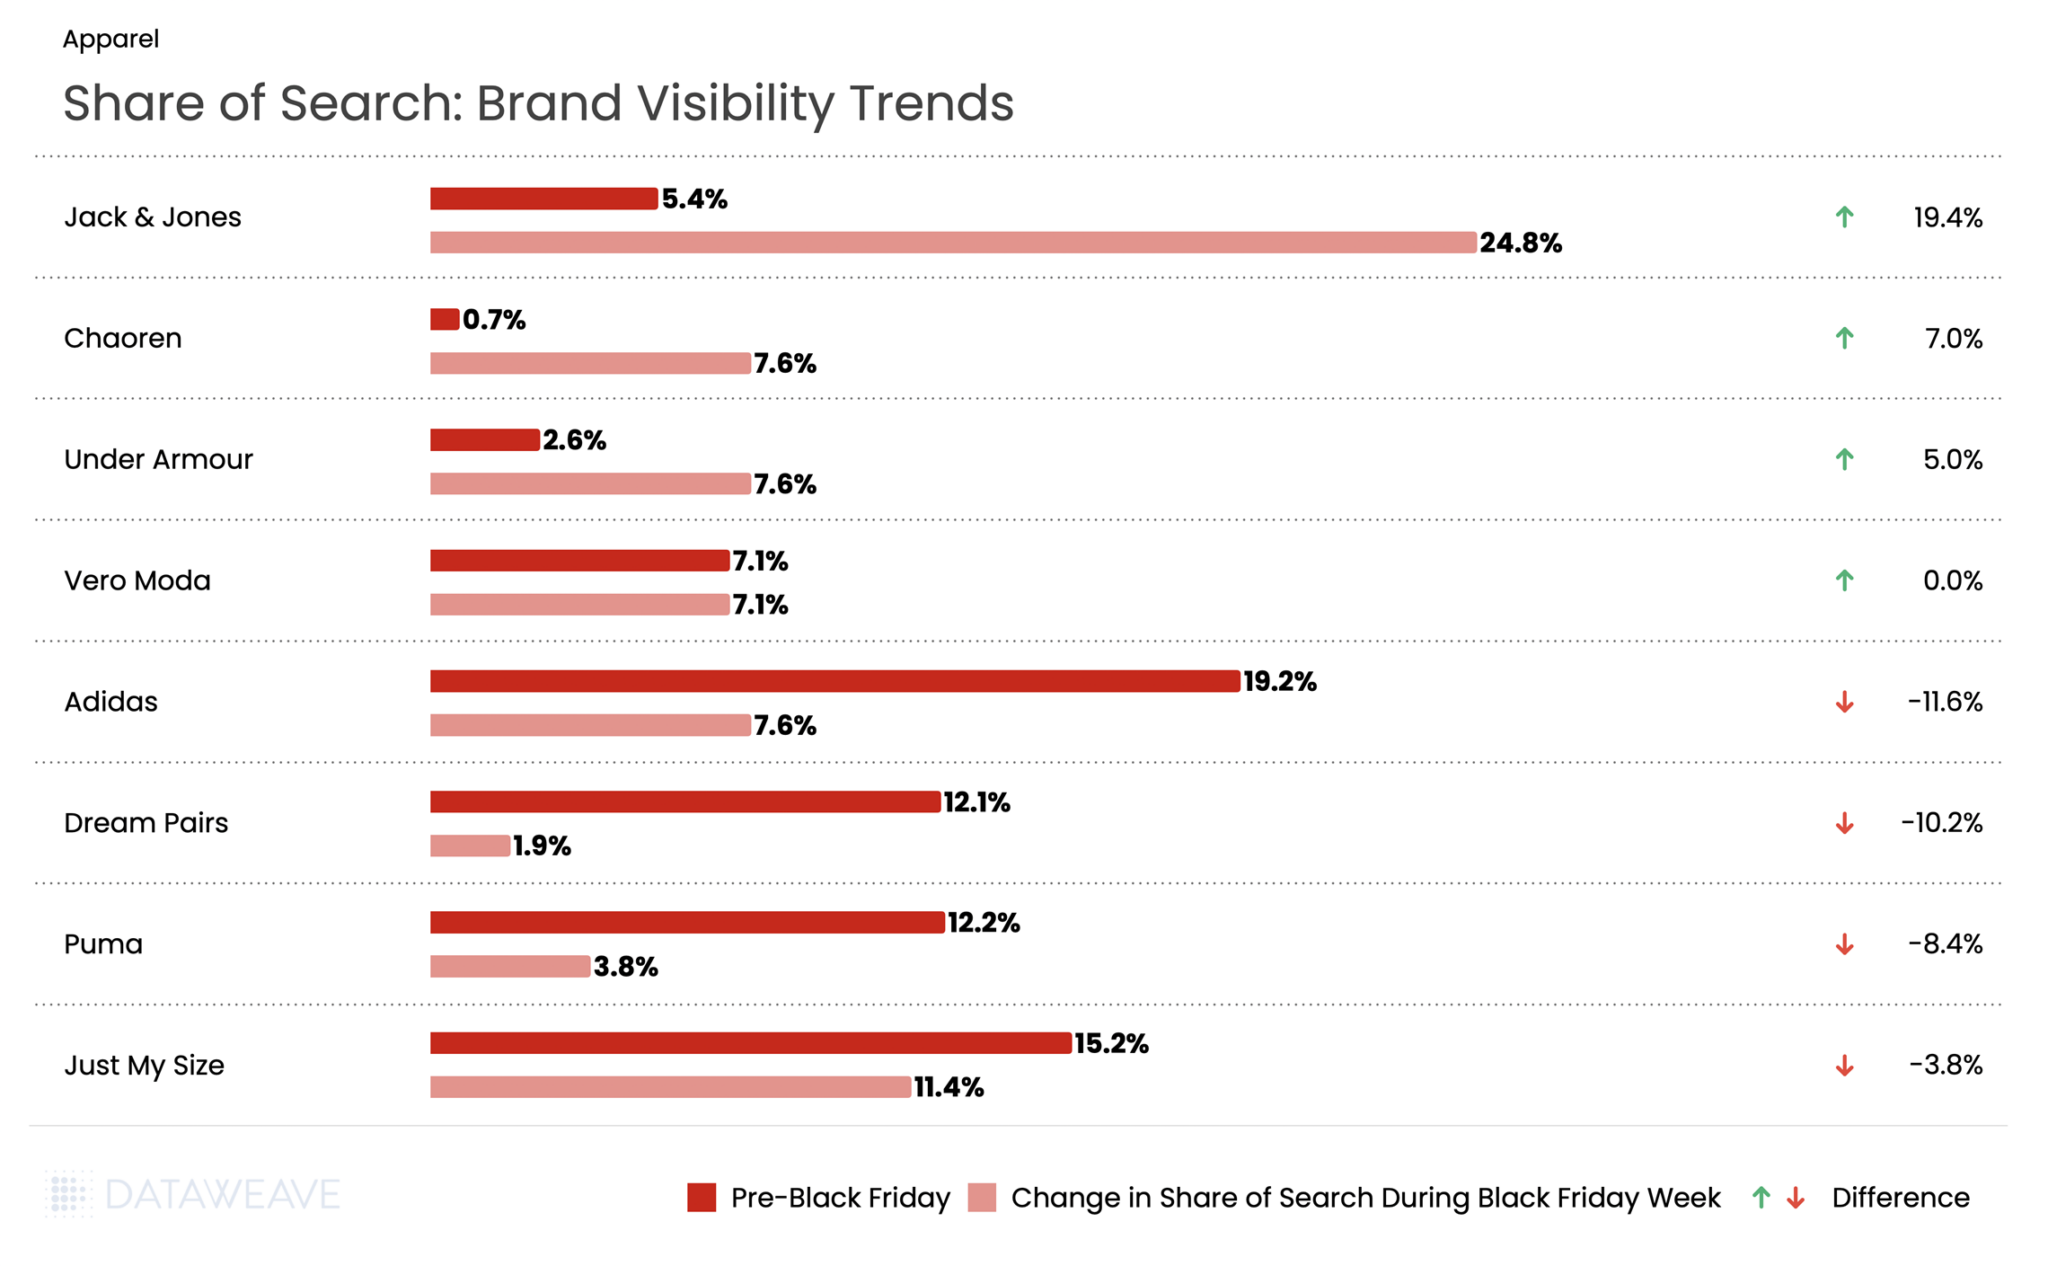
Danish fashion brand Jack & Jones experienced an unprecedented surge with a staggering 19.4% gain in visibility. Sister brand Vero Moda (also owned by Jack & Jones’ parent company Bestseller) maintained flat visibility at 7.1%. Footwear brand Chaoren gained 7%. Meanwhile activewear giant Under Armour rose by 5%.
However, established sportswear giants suffered dramatic visibility losses. Adidas experienced an 11.6% decline in share of search. Dream Pairs saw visibility drop by 10.2%, Puma fell 8.4%, and plus-size brand Just My Size declined by 3.8 %.
Want to understand how DataWeave’s pricing intelligence platform can help your business make data-driven decisions during peak sales events? Contact us to learn more about competitive insights, price intelligence, assortment analytics, content analytics, and digital shelf analytics.
Check out our analysis on Black Friday Pricing and Discount trends in the USA and UK. Follow our blog for more insights on retail pricing trends, brand visibility analysis, and data-driven commerce intelligence.
Black Friday 2025 saw British shoppers spend an average of £430 each this year representing a £91 increase from last year and totaling over £10.2 billion across the sales period.
The 2025 sales event arrived at a pivotal moment for UK retail. Retail sales fell 1.1% in October 2025 as consumers held back spending in anticipation of Black Friday promotions, according to the Office for National Statistics. Over 2 in 5 UK adults participated in Black Friday shopping, with 45% planning to pick up Christmas gifts at a discount, according to a Barclays study.
Against this backdrop of cautious optimism and strategic consumer behavior, how did retailers and brands perform across key categories this Black Friday? At DataWeave, we conducted a comprehensive analysis of Black Friday 2025 discounting trends across five major categories in the UK market: Consumer Electronics, Home & Furniture, Health & Beauty, Grocery, and Apparel. Our AI-powered pricing intelligence platform monitored over 71K SKUs across leading UK retailers like Costco, Selfridges, Boots, Debenham’s, Carethy, Argos, John Lewis, Amazon, and more, revealing fascinating patterns in how retailers and brands approached this year’s sale season.
Our Methodology
For this analysis, DataWeave monitored average discounts across leading UK retailers during two distinct periods:
Pre-Black Friday: November 6 – November 23, 2025 – capturing early holiday deals and baseline pricing
Additional Discounts During Black Friday Week: November 24 – December 1, 2025 – covering Thanksgiving week through Black Friday (November 28) and Cyber Monday (December 1)
Our sample encompassed the top-ranked products across subcategories on major retail sites. We also analyzed Share of Search data, which measures brand visibility by monitoring which brand names appear in the top 20 search results for critical keywords.
Black Friday 2025 UK: The Big Picture
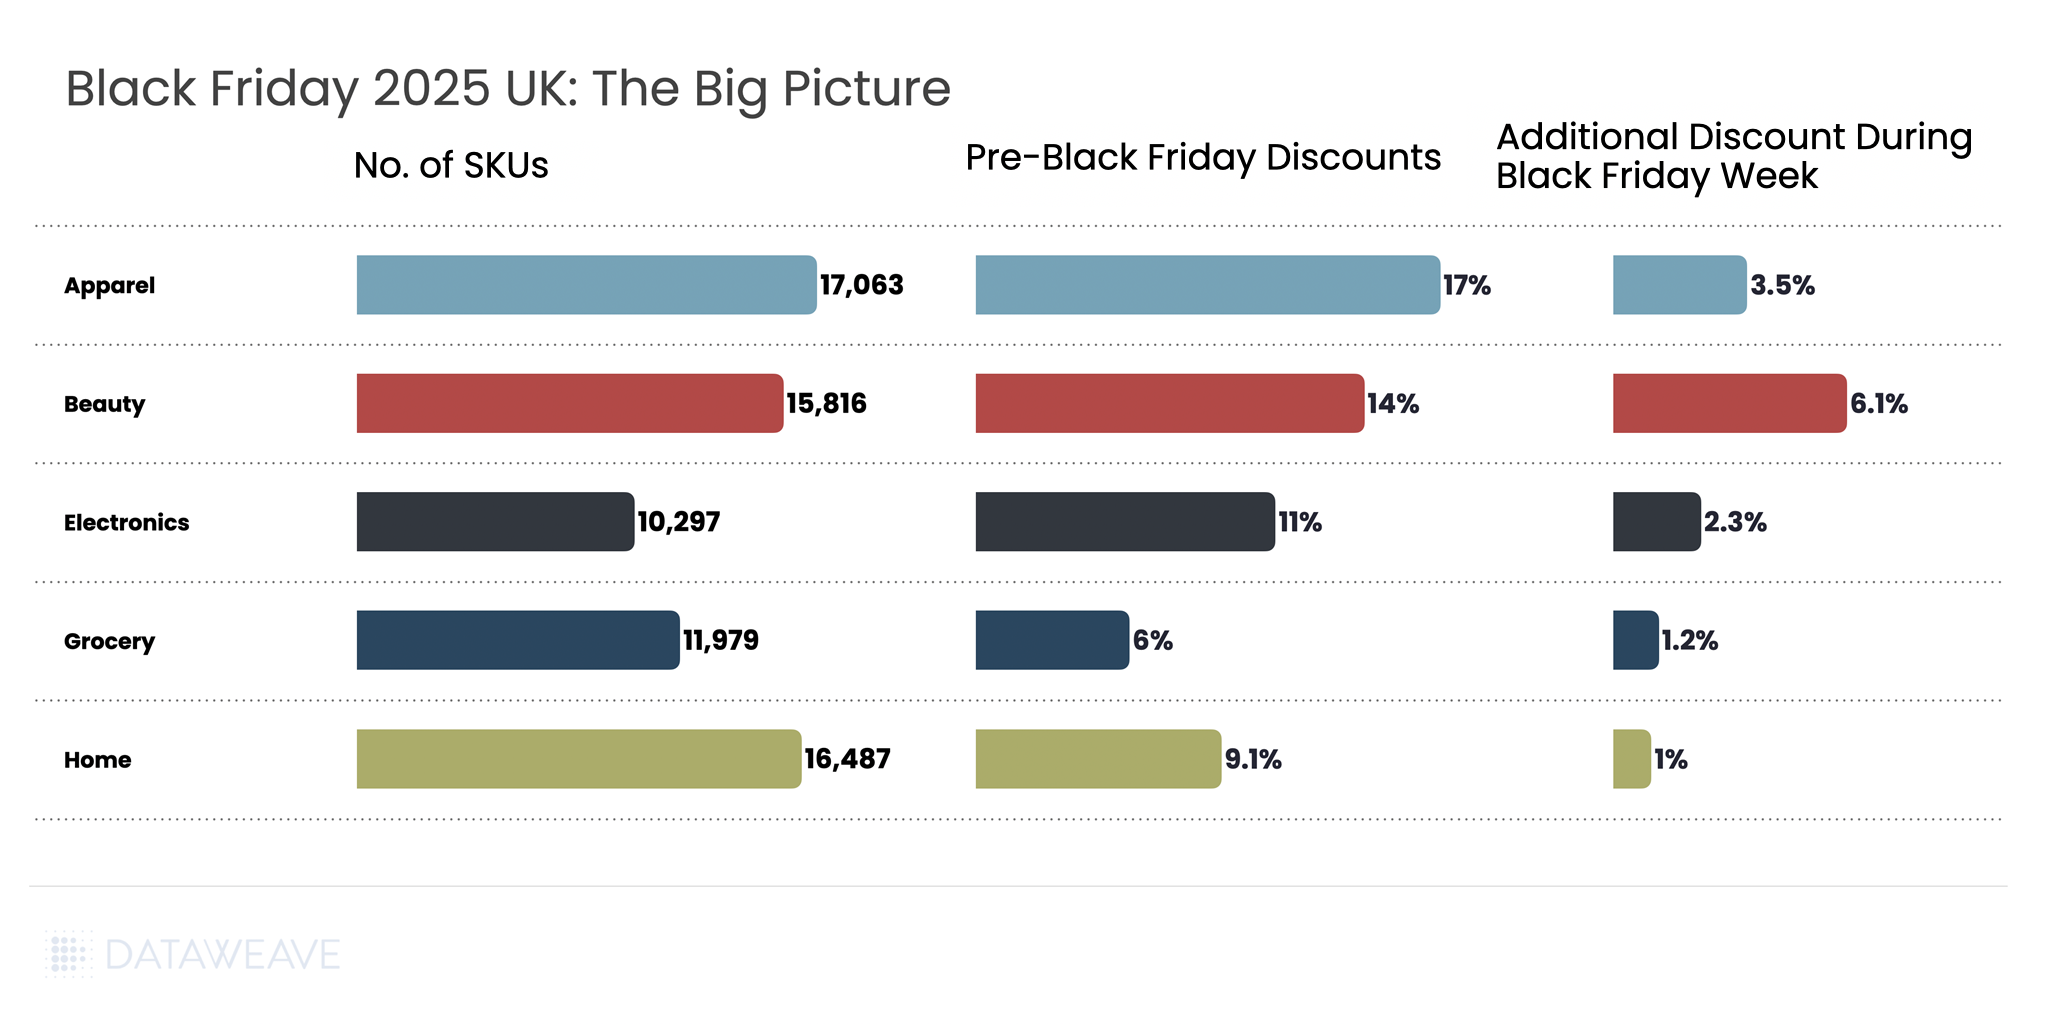
Our analysis covered 71,642 SKUs across five major categories. Here’s the snapshot of average discounts during the Pre-Black Friday period compared to Black Friday Week:
Key Insight: Pre-Black Friday discounts were substantial across all categories. This suggests UK retailers front-loaded their promotions to capture early holiday shoppers, with additional discounts during Black Friday Week adding to the baseline discounts already in place. The extended promotional period transformed Black Friday from a single-day event into a month-long campaign, with 60% of UK shoppers beginning their deal searches as early as October.
Consumer Electronics
Consumer electronics remains a cornerstone of Black Friday shopping in the UK, with technology accounting for 48% of planned consumer spending during the sales period, according to PwC.
AI is transforming how consumers shop for electronics, with AI-driven traffic to retail sites expected to rise 410% year-on-year during the 2025 holiday season. Younger shoppers particularly embraced AI tools, with 17% of Gen Z consumers using AI platforms like Chat GPT and Gemini to source and compare deals. Our analysis of 10,297 SKUs reveals how discounts varied across subcategories and which brands dominated search visibility.
Subcategory Discount Analysis
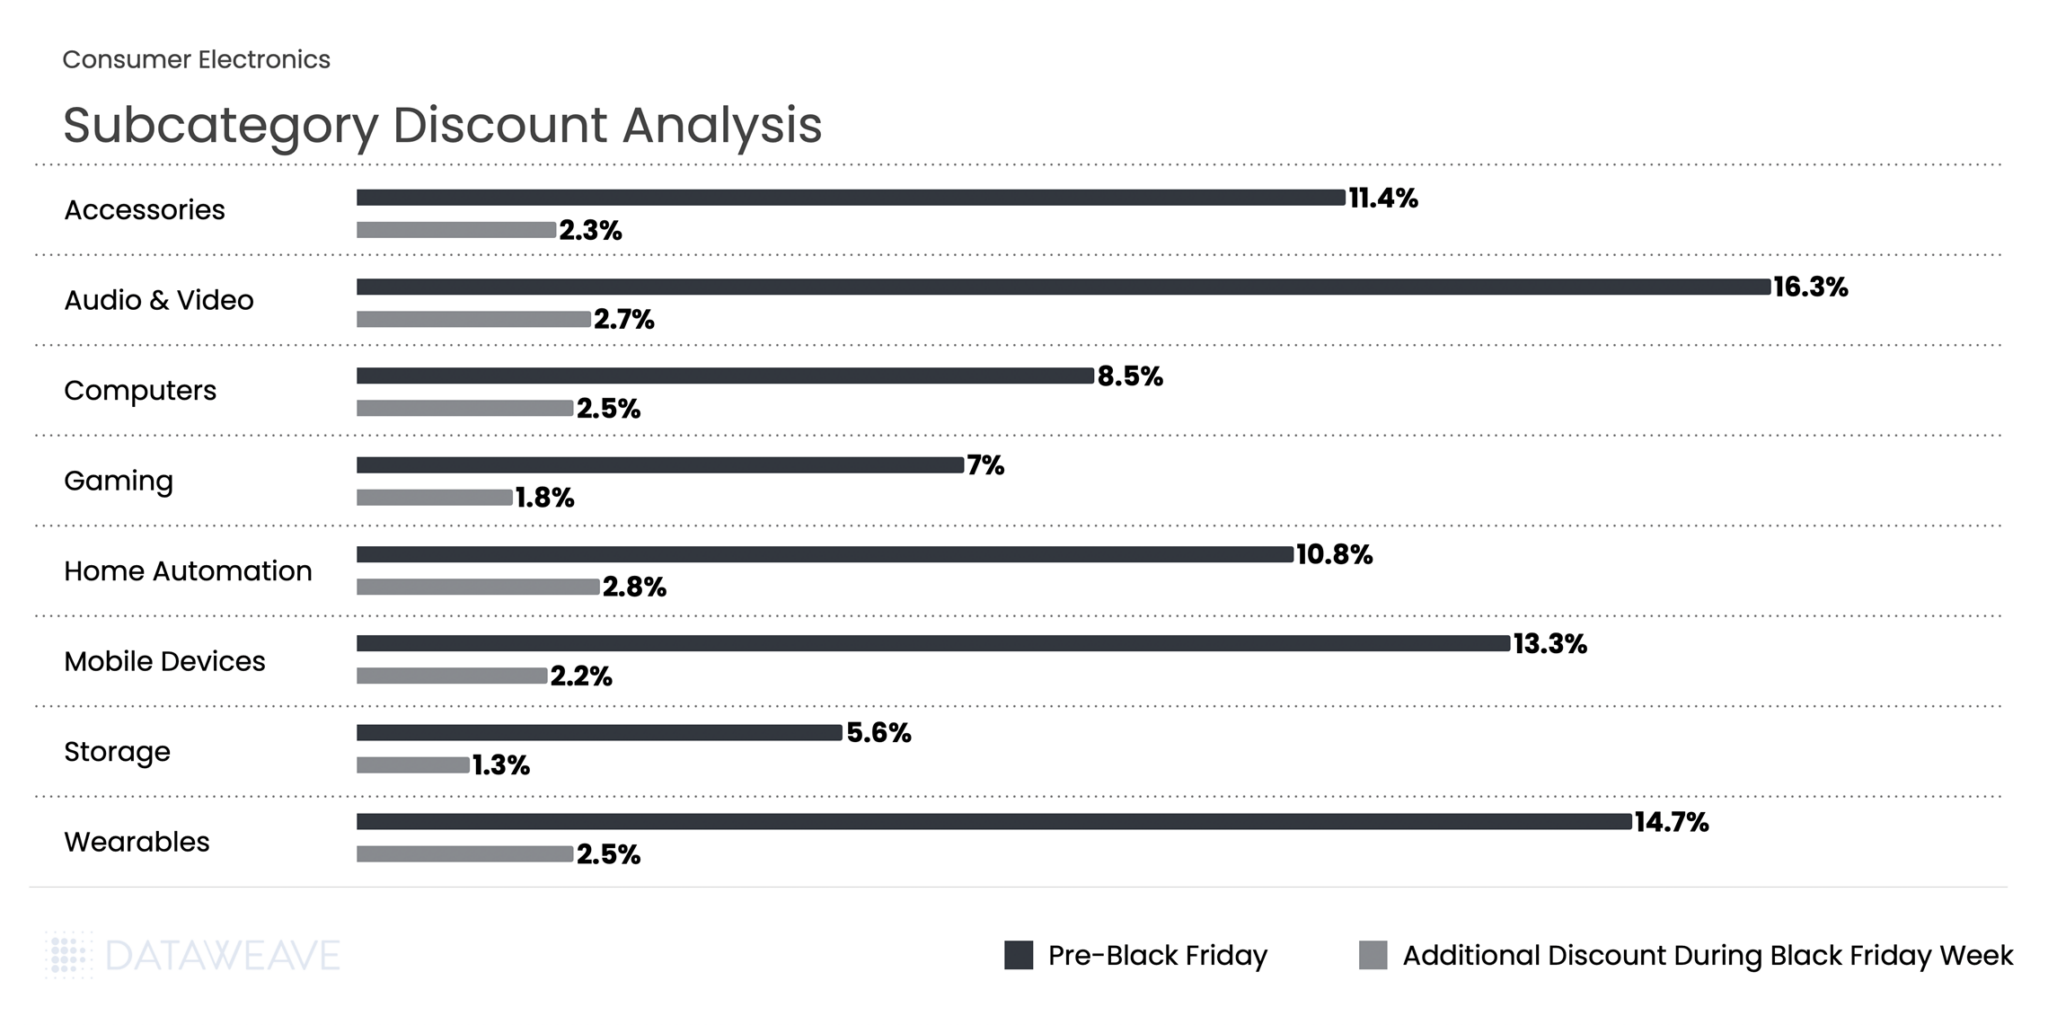
Pre-Black Friday discounts averaged 11.1% across subcategories, while Black Friday Week saw an additional 2.3% discount on average. Audio & Video products led the pre-sale discounting at 16.3%, indicating retailers were eager to move inventory early in the season.
During Black Friday Week, Home Automation saw the highest additional discount at 2.8%. Wearables and Computers both saw solid 2.5% additional discounts, making them attractive categories during the peak shopping period.
Share of Search: Brand Visibility Trends
Our Share of Search analysis reveals significant shifts in brand visibility during Black Friday Week:
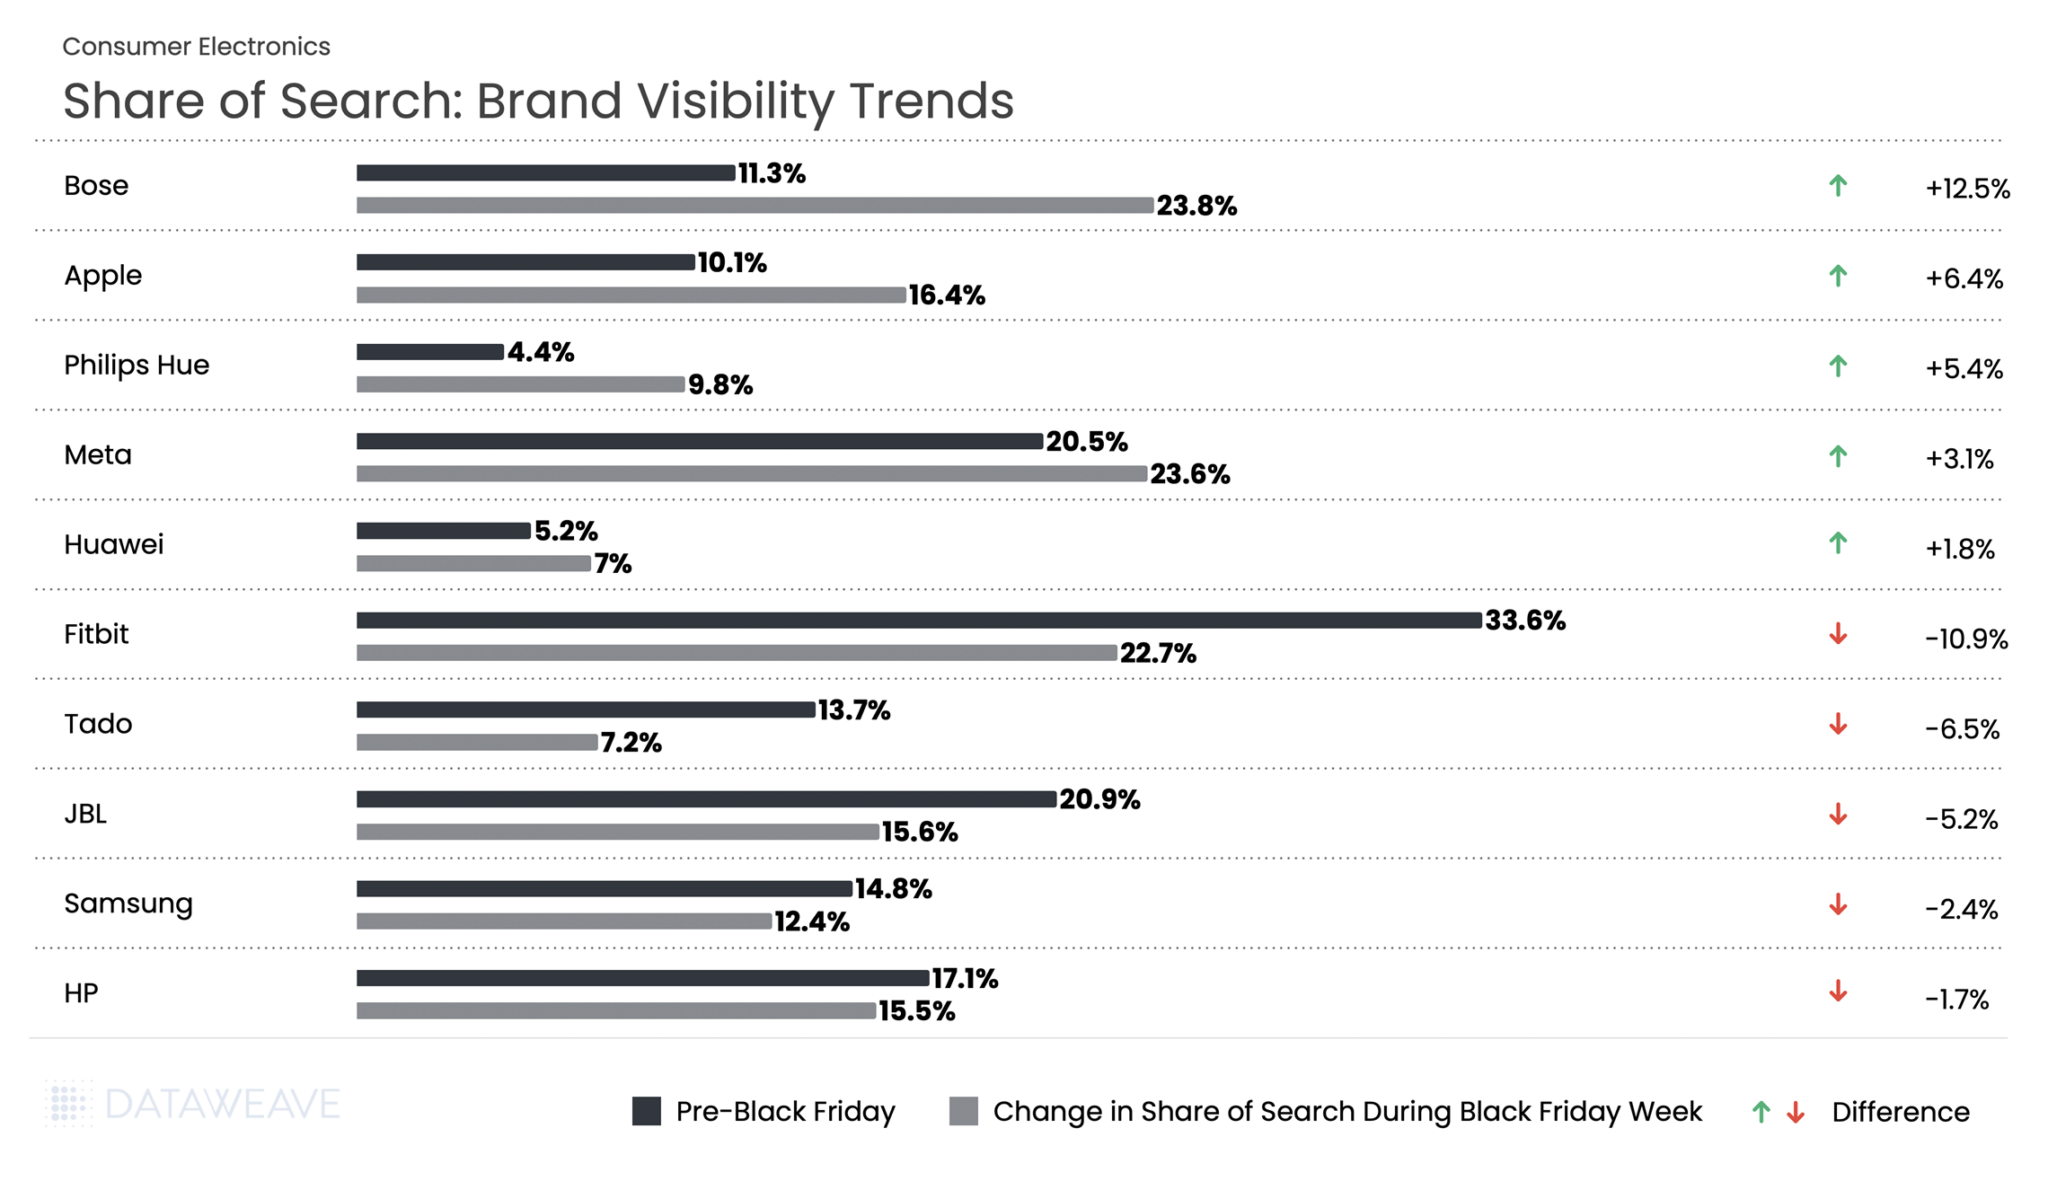
Bose dominated with its Share of Search more than doubling from 11.3% to 23.8%, a remarkable +12.5% gain. Lighting brand Philips Hue followed, gaining by +5.4% in share of search during Black Friday week. Notably, Meta, with it’s range of wearables, stands out for a +3.1% increase in visibility.
Apple’s Share of Search jumped from 10.1% to 16.4%, a gain of 6.4%. At the same time, Fitbit’s share dropped nearly 11%, the steepest decline in the entire electronics category. Meanwhile, Samsung and HP also lost on visibility this Black Friday in the UK.
Home & Furniture
The Home & Furniture category continues to attract UK consumers during Black Friday, though with a more measured discounting approach compared to other categories. Our analysis of 16,487 SKUs shows how discounts were distributed across subcategories.
Subcategory Discount Analysis
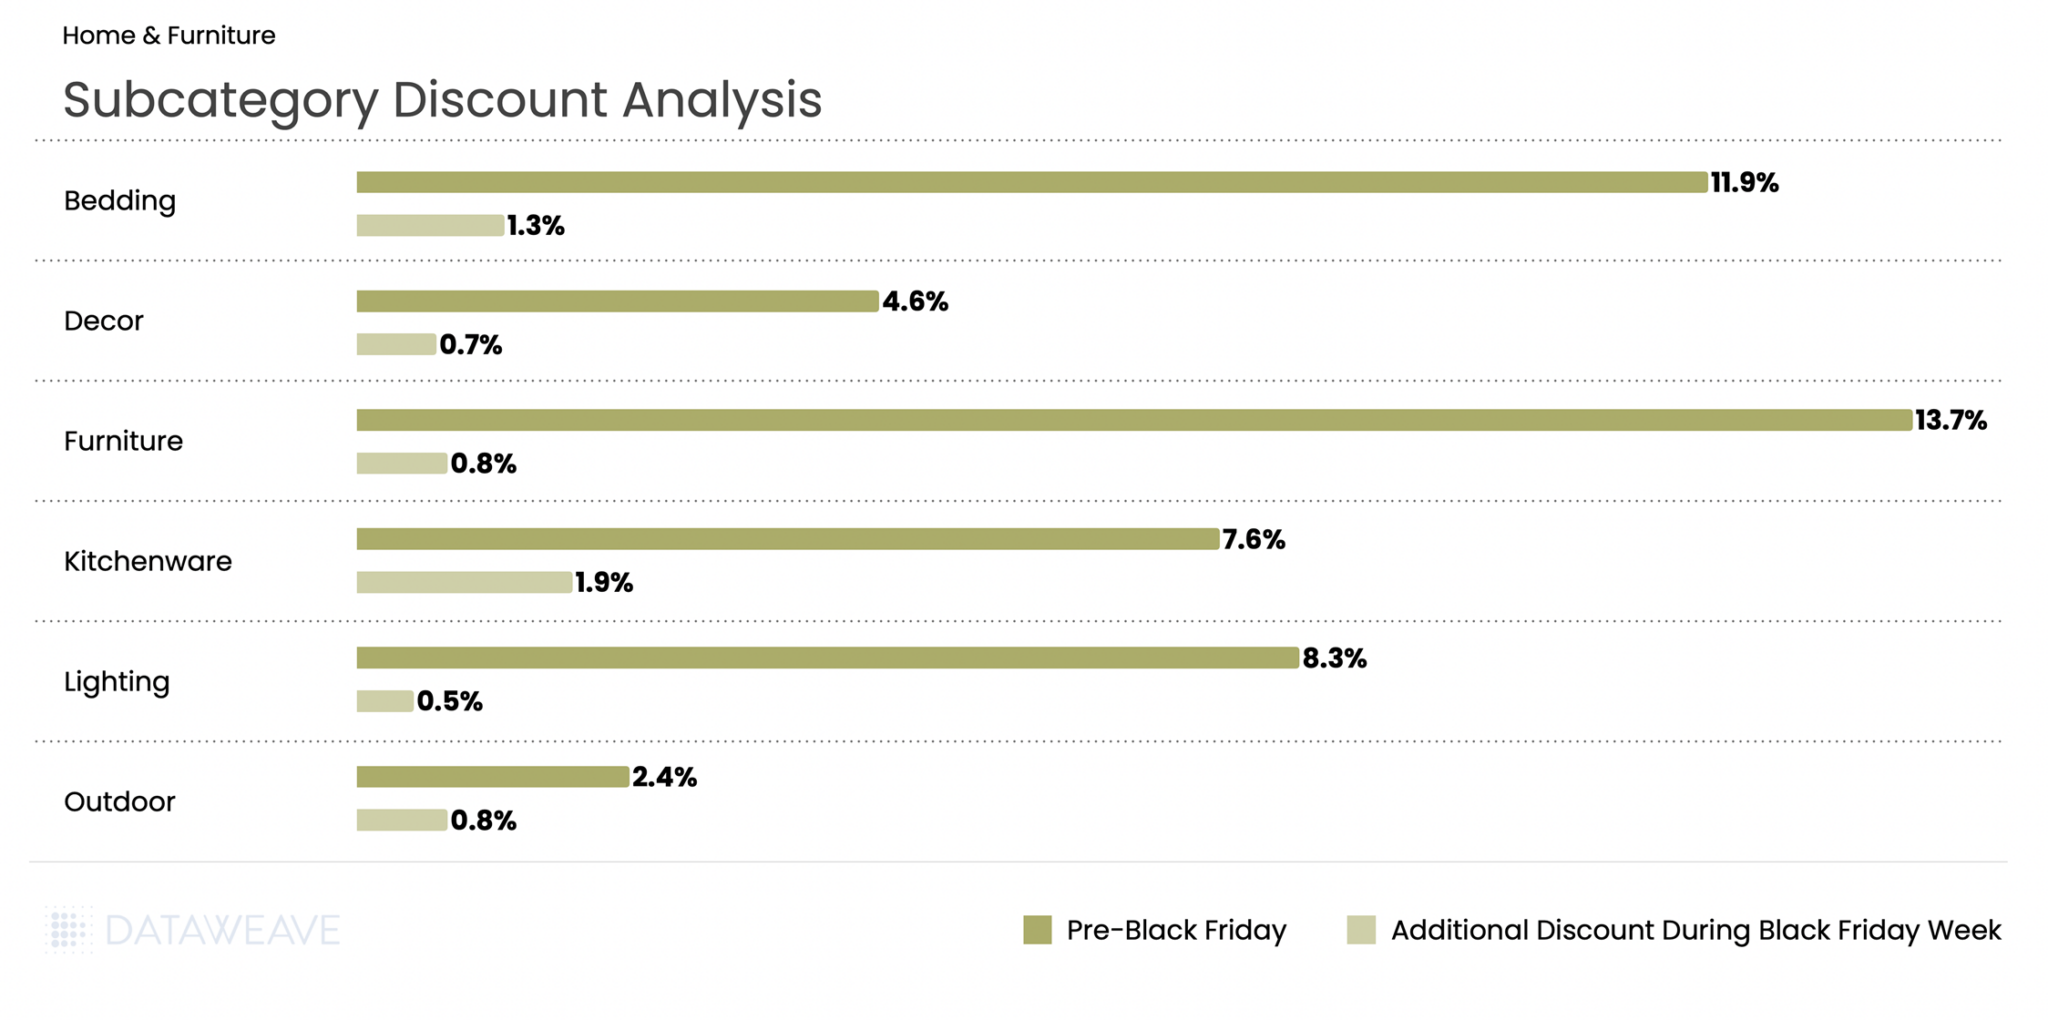
Home & Furniture saw Pre-Black Friday discounts averaging 9.1%, with Black Friday Week adding just 1% on average, the lowest additional discount among all categories. Furniture led pre-sale discounts at 13.7%, followed by Bedding at 11.9%. This suggests retailers aggressively promoted larger home goods early in the season to capture deal-seekers.
During Black Friday Week, Kitchenware saw the highest additional discount at 1.9%, making it attractive for holiday cooking and gifting needs. Conversely, Lighting saw minimal additional promotion at just 0.5%.
Share of Search: Brand Visibility Trends
Made.com, the contemporary furniture brand, saw visibility surge during Black Friday with an impressive 8.9% increase. Similarly, emerging mattress brand Vesgantti gained 5.4%. Rug specialist Gooch Oriental also made significant gains with a 4.9% increase.
On the flip side, British heritage brands faced challenges. Both Laura Ashley and Julian Bowen saw share of search drop 2.2%. Premium mattress maker Vispring also declined 2.1%, while French cookware brand Le Creuset fell 1.9%.
Health & Beauty
Health & Beauty has emerged as a growth engine during Black Friday in the UK. The beauty industry is projected to grow 5% annually through 2030 according to a McKinsey survey. The category continues to demonstrate resilience even as consumers show caution in other discretionary categories. Our analysis of 15,816 SKUs reveals fascinating subcategory-level insights and dramatic brand visibility shifts that highlight evolving consumer preferences in the beauty space.
Subcategory Discount Analysis
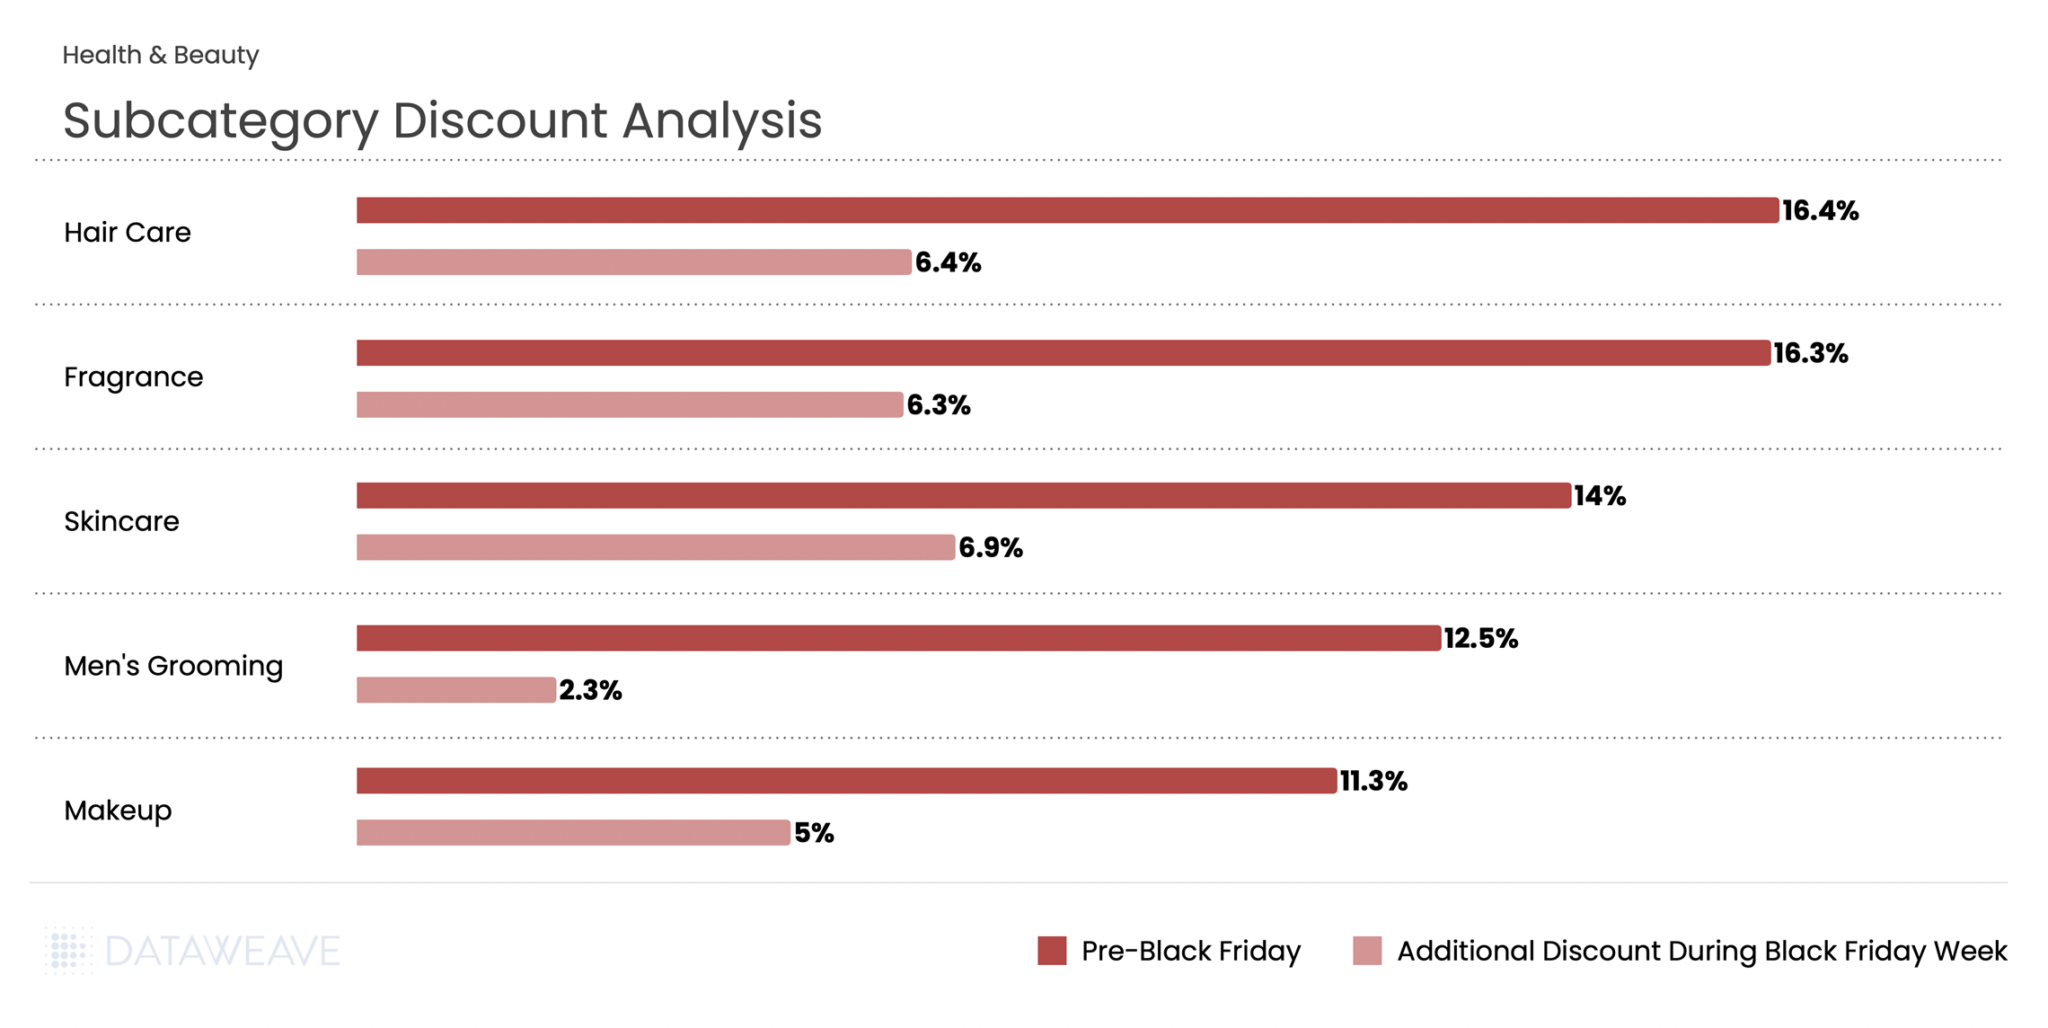
Health & Beauty presented a unique discounting pattern compared to other categories. Pre-Black Friday discounts averaged 14.4%, the second-highest among all categories. But Black Friday Week discounts were also robust at 6.1%, the highest additional discount increase.
Hair Care led both periods with 16.4% pre-sale discounts and an additional 6.4% during Black Friday Week. Skincare saw the highest Black Friday Week discount at 6.9%, suggesting retailers strategically saved their best skincare promotions for the main event when consumers are actively seeking holiday gift sets. Men’s Grooming stood apart with strong pre-sale discounts of 12.5% but more modest Black Friday Week additions of just 2.3%.
Share of Search: Brand Visibility Trends
The UK Beauty category saw some of the most dramatic Share of Search swings in our analysis.
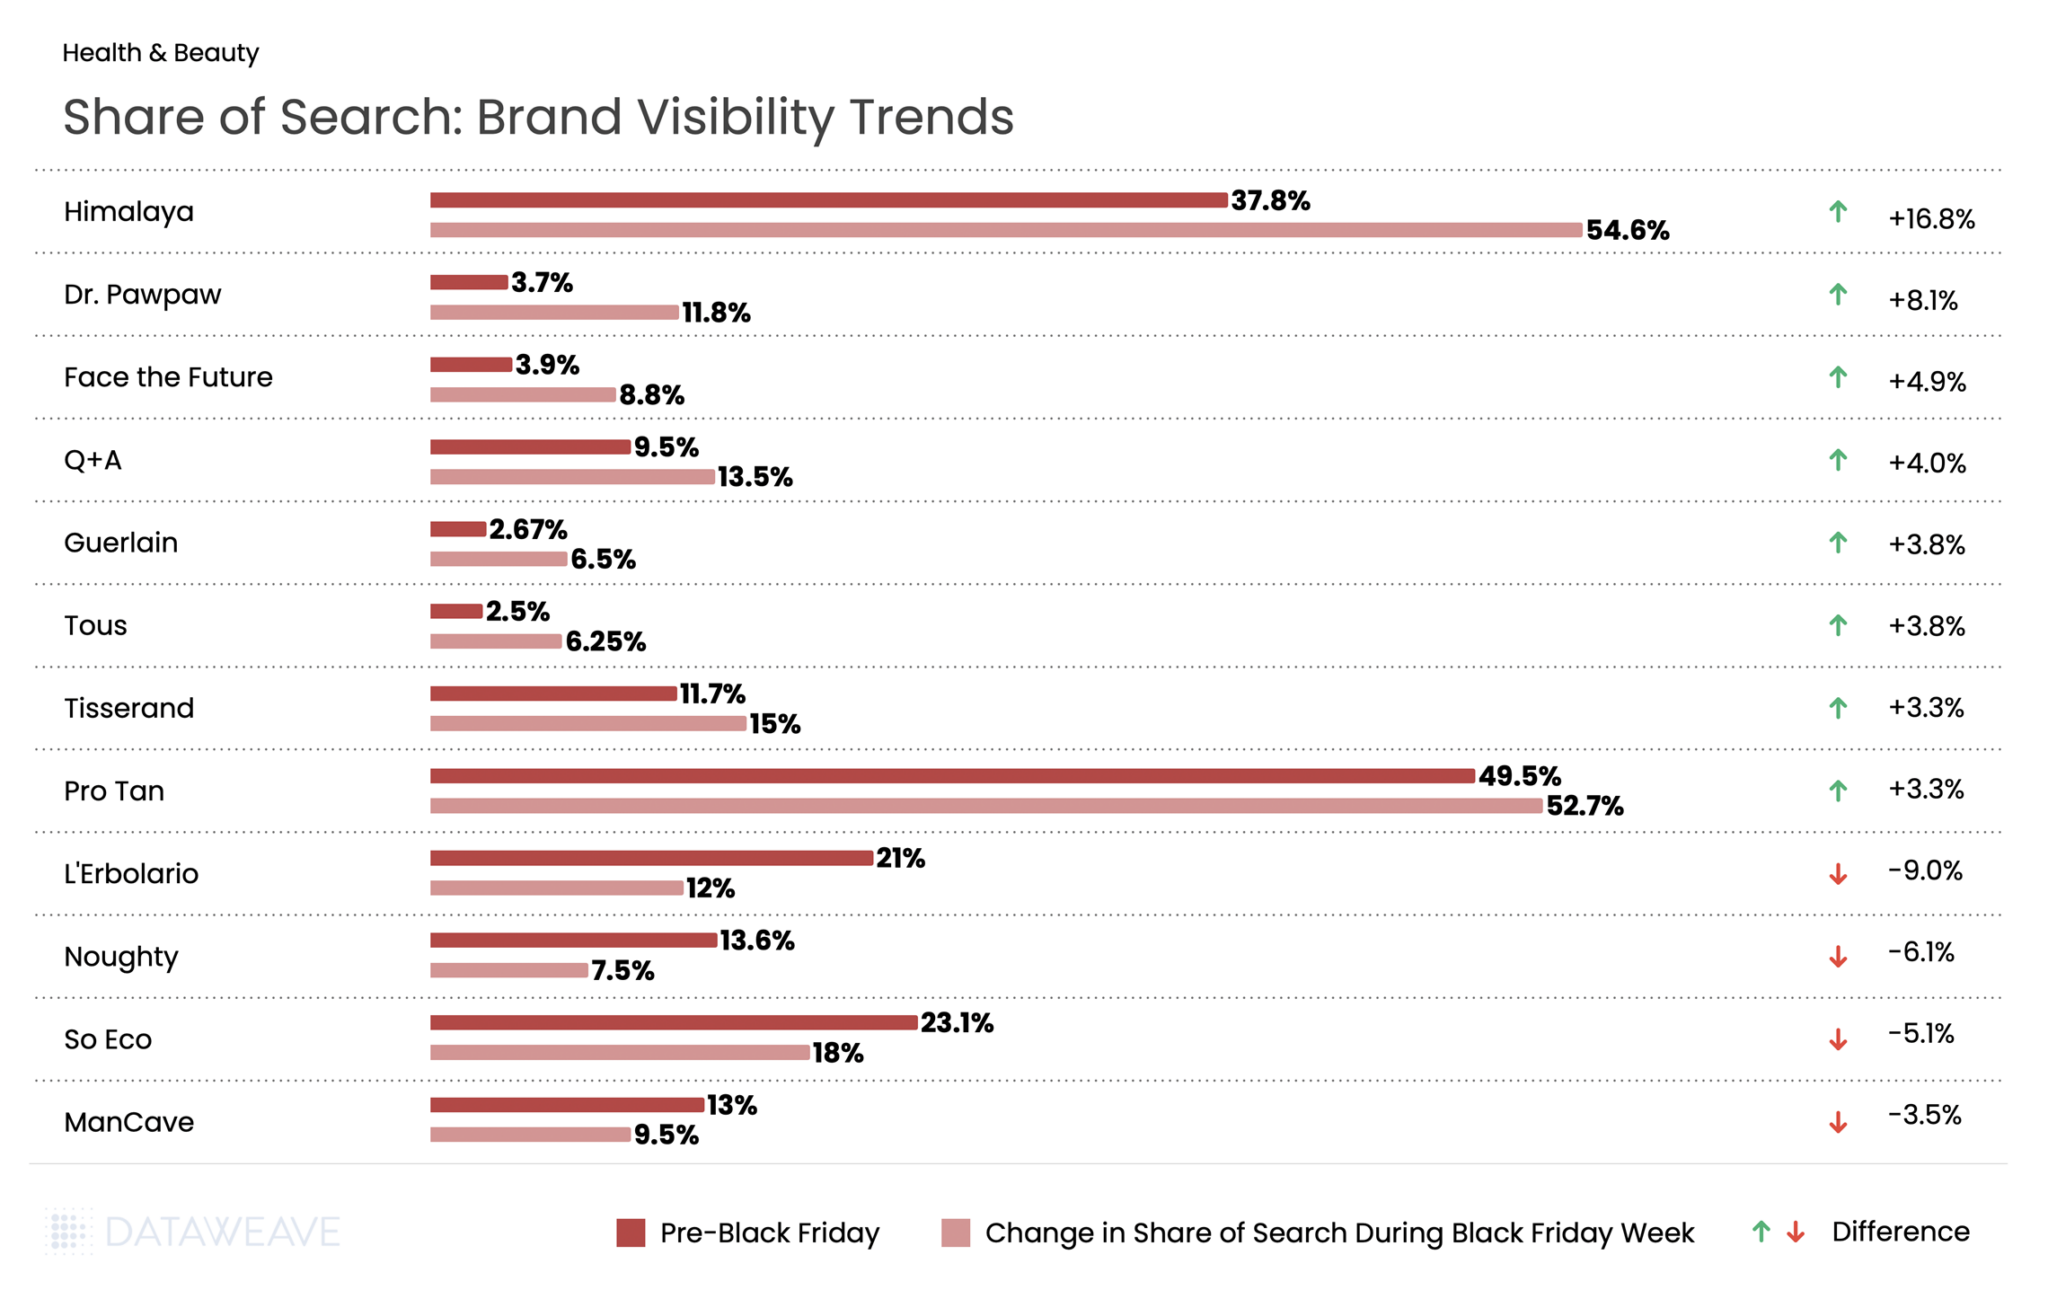
Himalaya, the Ayurvedic skincare brand, dominated the category with a stunning 16.8% gain. British cult favorite Dr. Pawpaw exploded from 3.7% to 11.8%, a gain that reflects the brand’s growing mainstream appeal. Face the Future, the skincare specialist, also gained significant ground with a 4.9% increase.
Budget-friendly British brand Q+A continued its momentum, rising 4%, while prestige names like Guerlain and Tous each gained 3.8%.
Italian natural beauty brand L’Erbolario saw the steepest decline, with visibility dropping by 9%. Haircare brand Noughty fell 6.1%, and eco-beauty brand So Eco declined by 5.1%.
Grocery
While Grocery typically sees more modest discounts compared to discretionary categories, the sector remains a critical part of Black Friday shopping in the UK, particularly as consumers prepare for holiday entertaining and gifting. Our analysis of 11,979 SKUs shows how UK retailers approached promotions across essential and indulgent subcategories.
Subcategory Discount Analysis
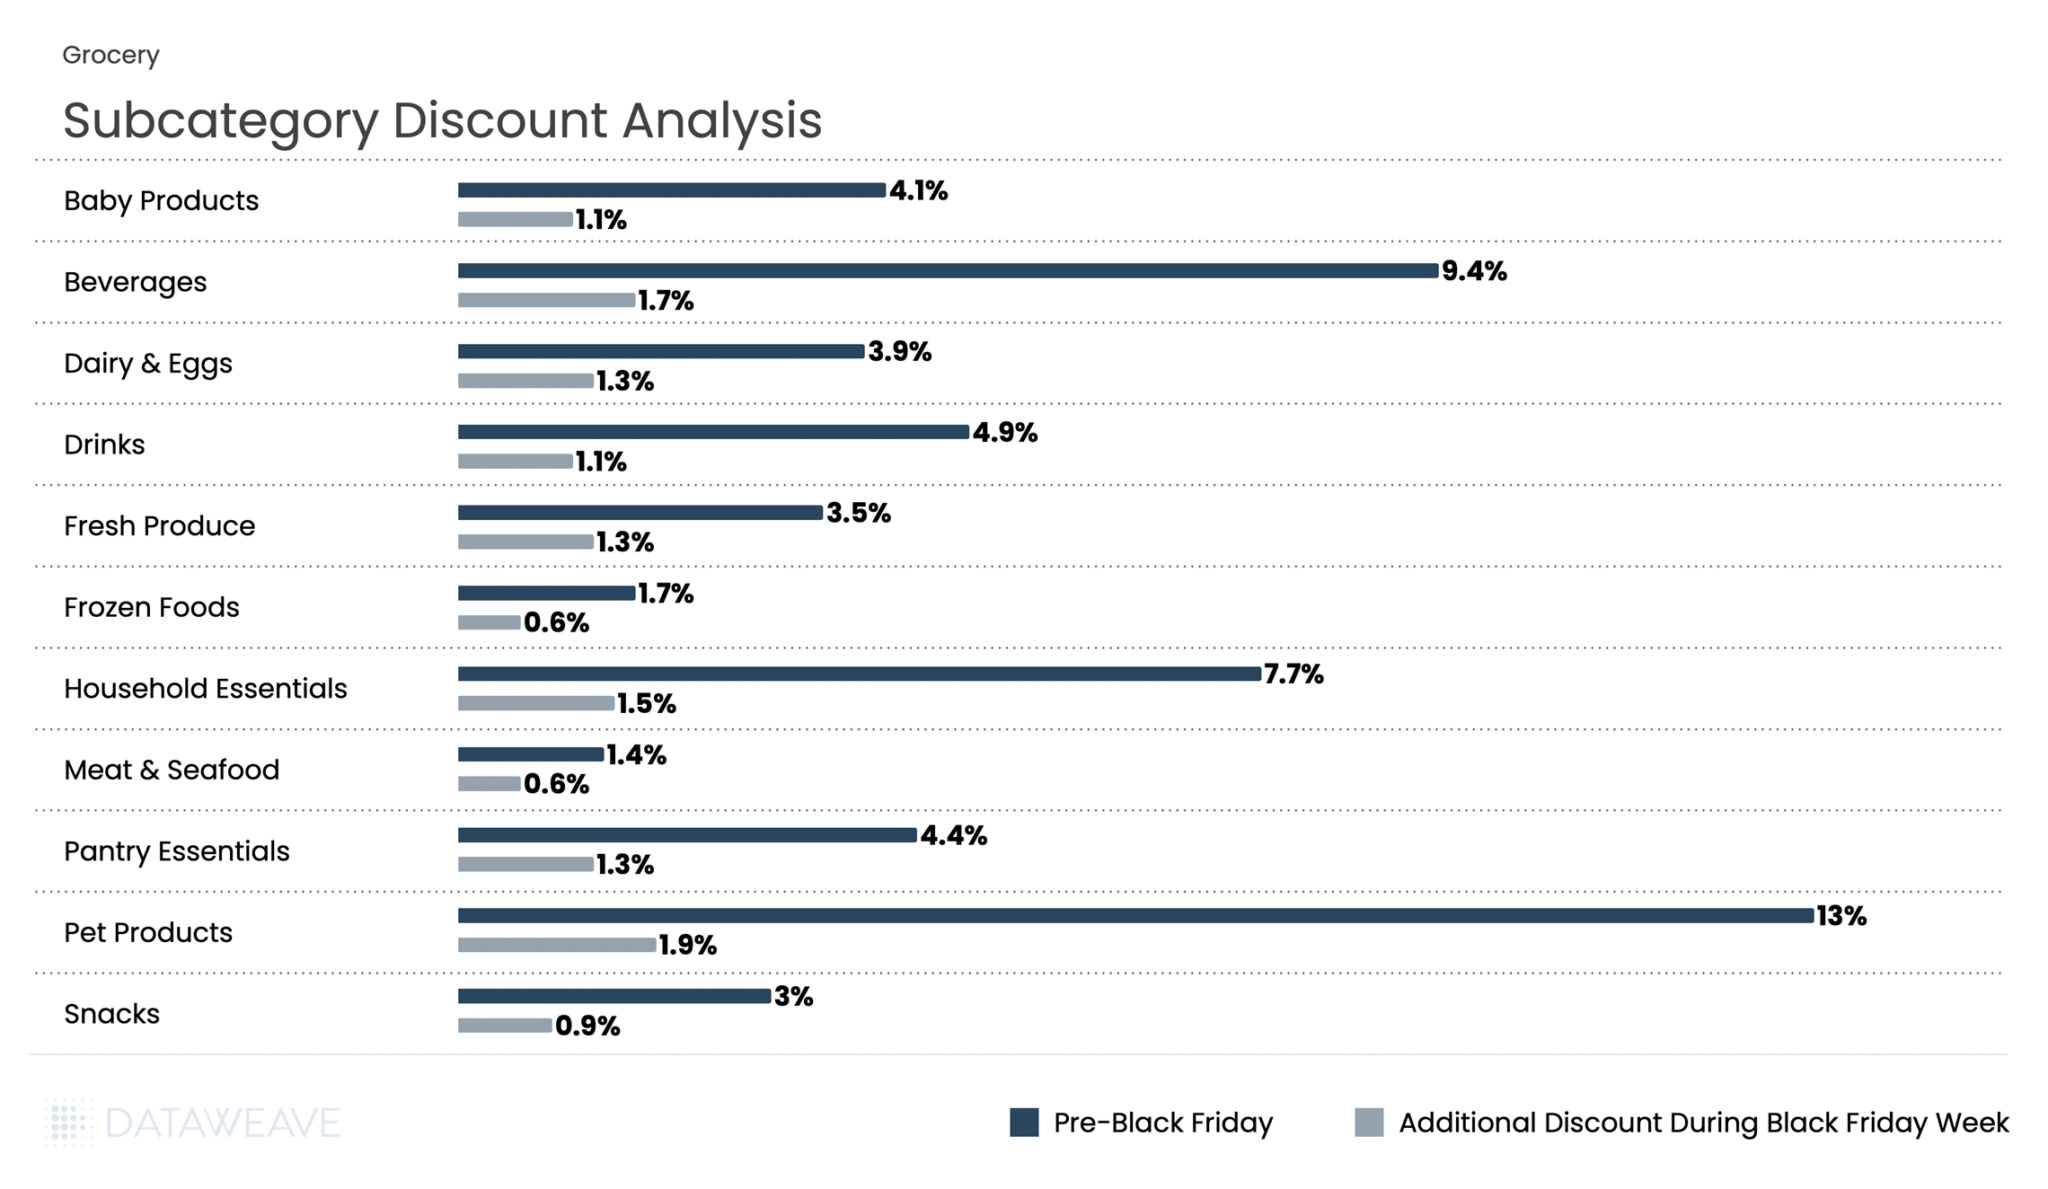
Grocery had the lowest discounts across all categories, reflecting the already-thin margins in food retail. Pre-Black Friday discounts averaged just 5.7%, with Black Friday Week adding only 1.2%. Pet Products led pre-sale discounts at an impressive 13%, significantly outpacing other grocery subcategories.
Beverages and Household Essentials followed with 9.4% and 7.7% pre-sale discounts respectively, and maintained their lead during Black Friday Week with 1.7% and 1.5% additional discounts each. Fresh categories like Meat & Seafood (1.4% pre-sale, 0.6% Black Friday Week) and Frozen Foods (1.7% pre sale, 0.6% additional discounts during Black Friday week) saw minimal promotional activity, consistent with perishable inventory constraints and tight margins.
Share of Search: Brand Visibility Trends
Doritos led with a 7.3% surge in visibility. Pepsi delivered an equally impressive performance, rising from 3.6% pre Black Friday to 10.7% during Black Friday week. Fanta too saw 5.2% gain in share of search.
Conversely, Coca-Cola gained more modestly at 1.6%, while its Sprite brand actually declined 0.9%.
Apparel
Apparel remains a Black Friday staple in the UK and is projected to deliver the strongest year-on-year growth of any UK retail segment this festive season. With clothing accounting for 39% of planned Black Friday purchases, the category represents one of the most hotly contested battlegrounds during the sales period.
Our analysis of 17,063 SKUs, the largest category in our study, reveals interesting patterns across fashion segments that demonstrate both the opportunities and competitive intensity in UK apparel retail.
Subcategory Discount Analysis
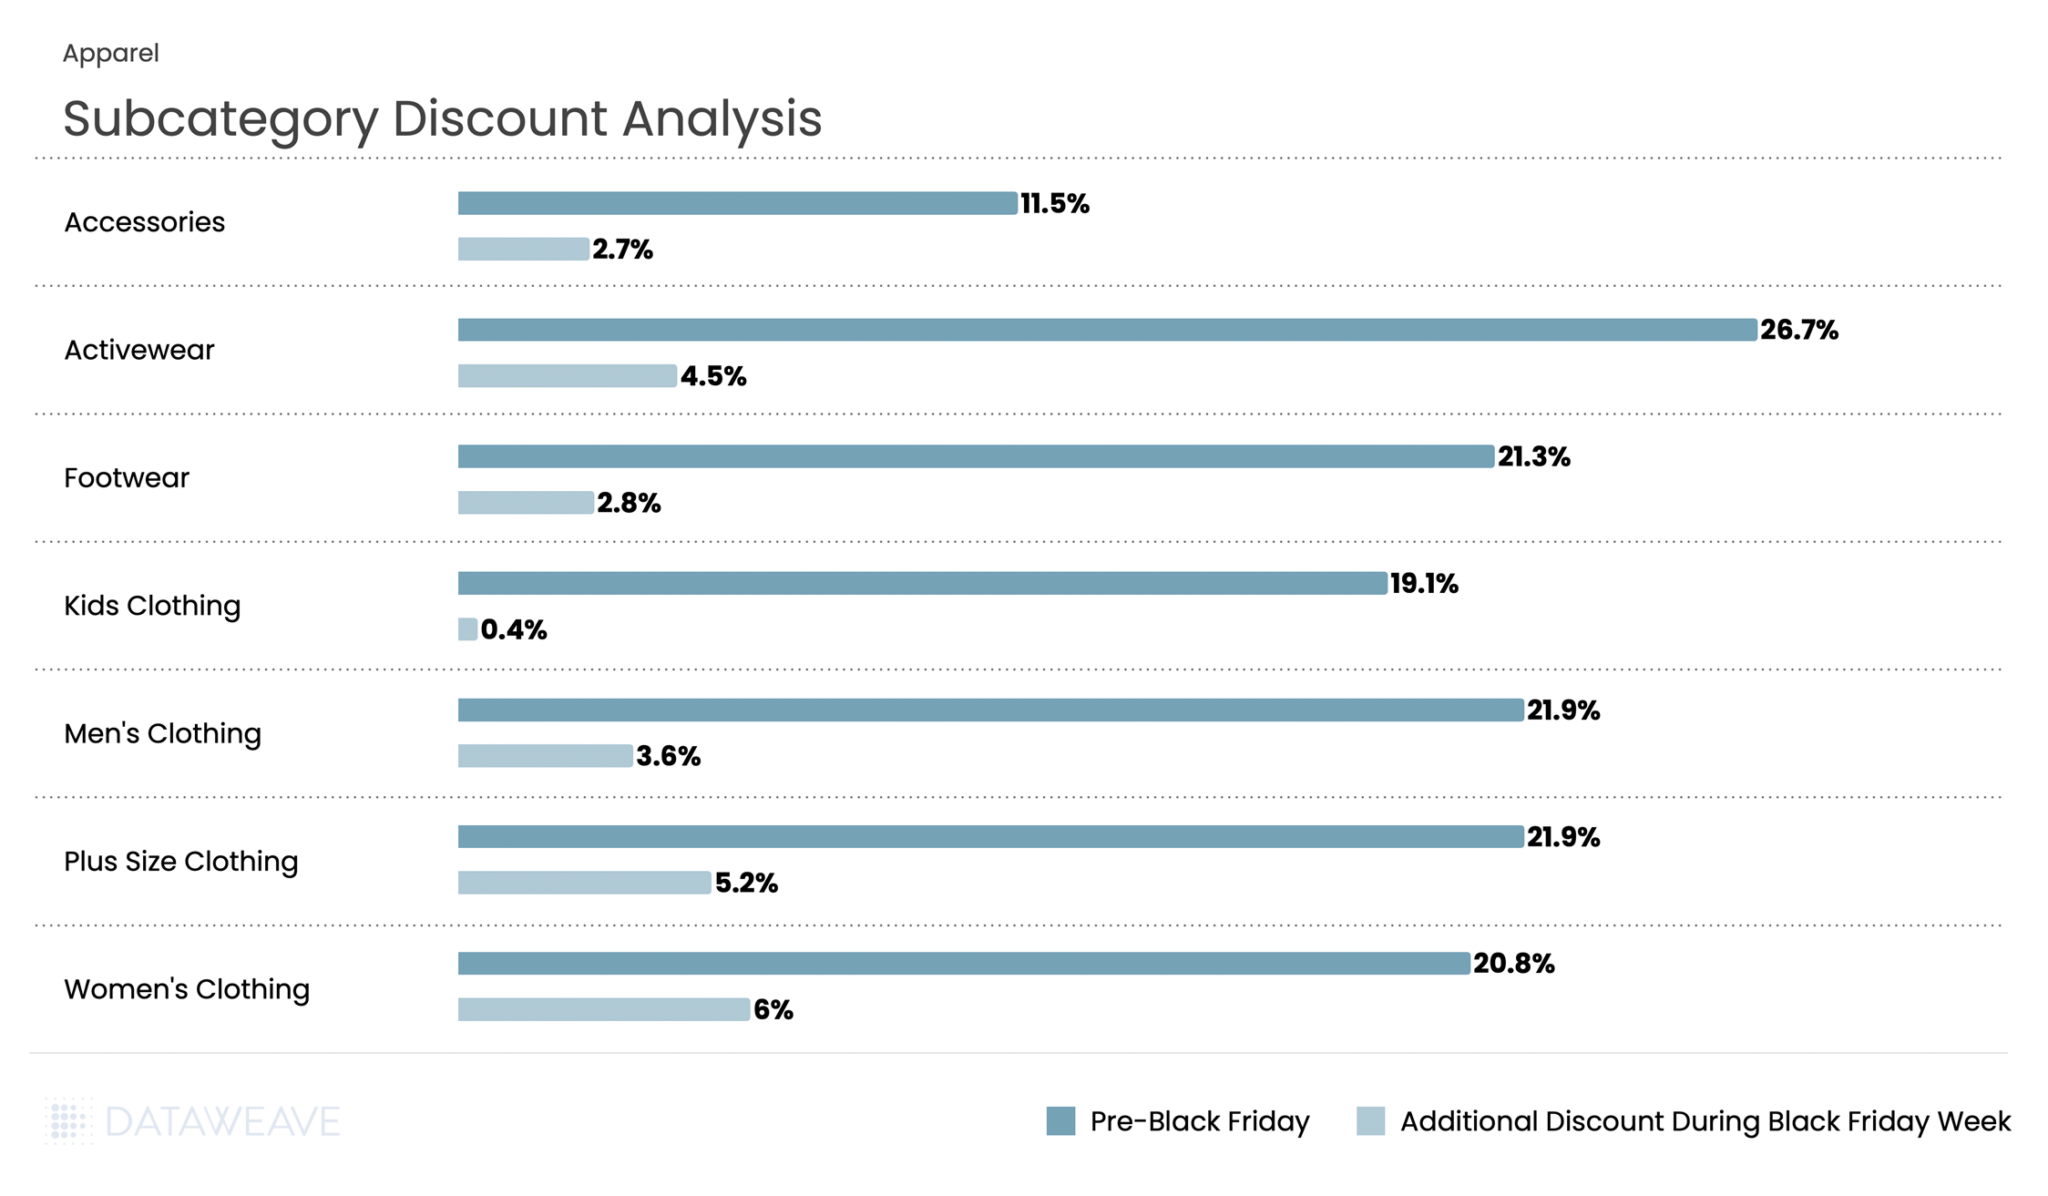
Apparel showed the strongest discounting activity throughout the BFCM period among all categories. Pre-Black Friday discounts averaged 17.2%, with Black Friday Week adding 3.5%, making it one of the most heavily promoted categories.
Activewear led pre-sale discounts at an impressive 26.7%, with an additional 4.5% discount during Black Friday week. Plus Size Clothing and Men’s Clothing tied for second place in pre-sale discounts at 21.9% each. Notably, Plus Size Clothing saw the highest Black Friday Week discount at 5.4%.
Women’s Clothing saw robust discounts throughout, with 20.8% pre-sale and an additional 6% during Black Friday Week (the highest additional discount in the category).
Share of Search: Brand Visibility Trends
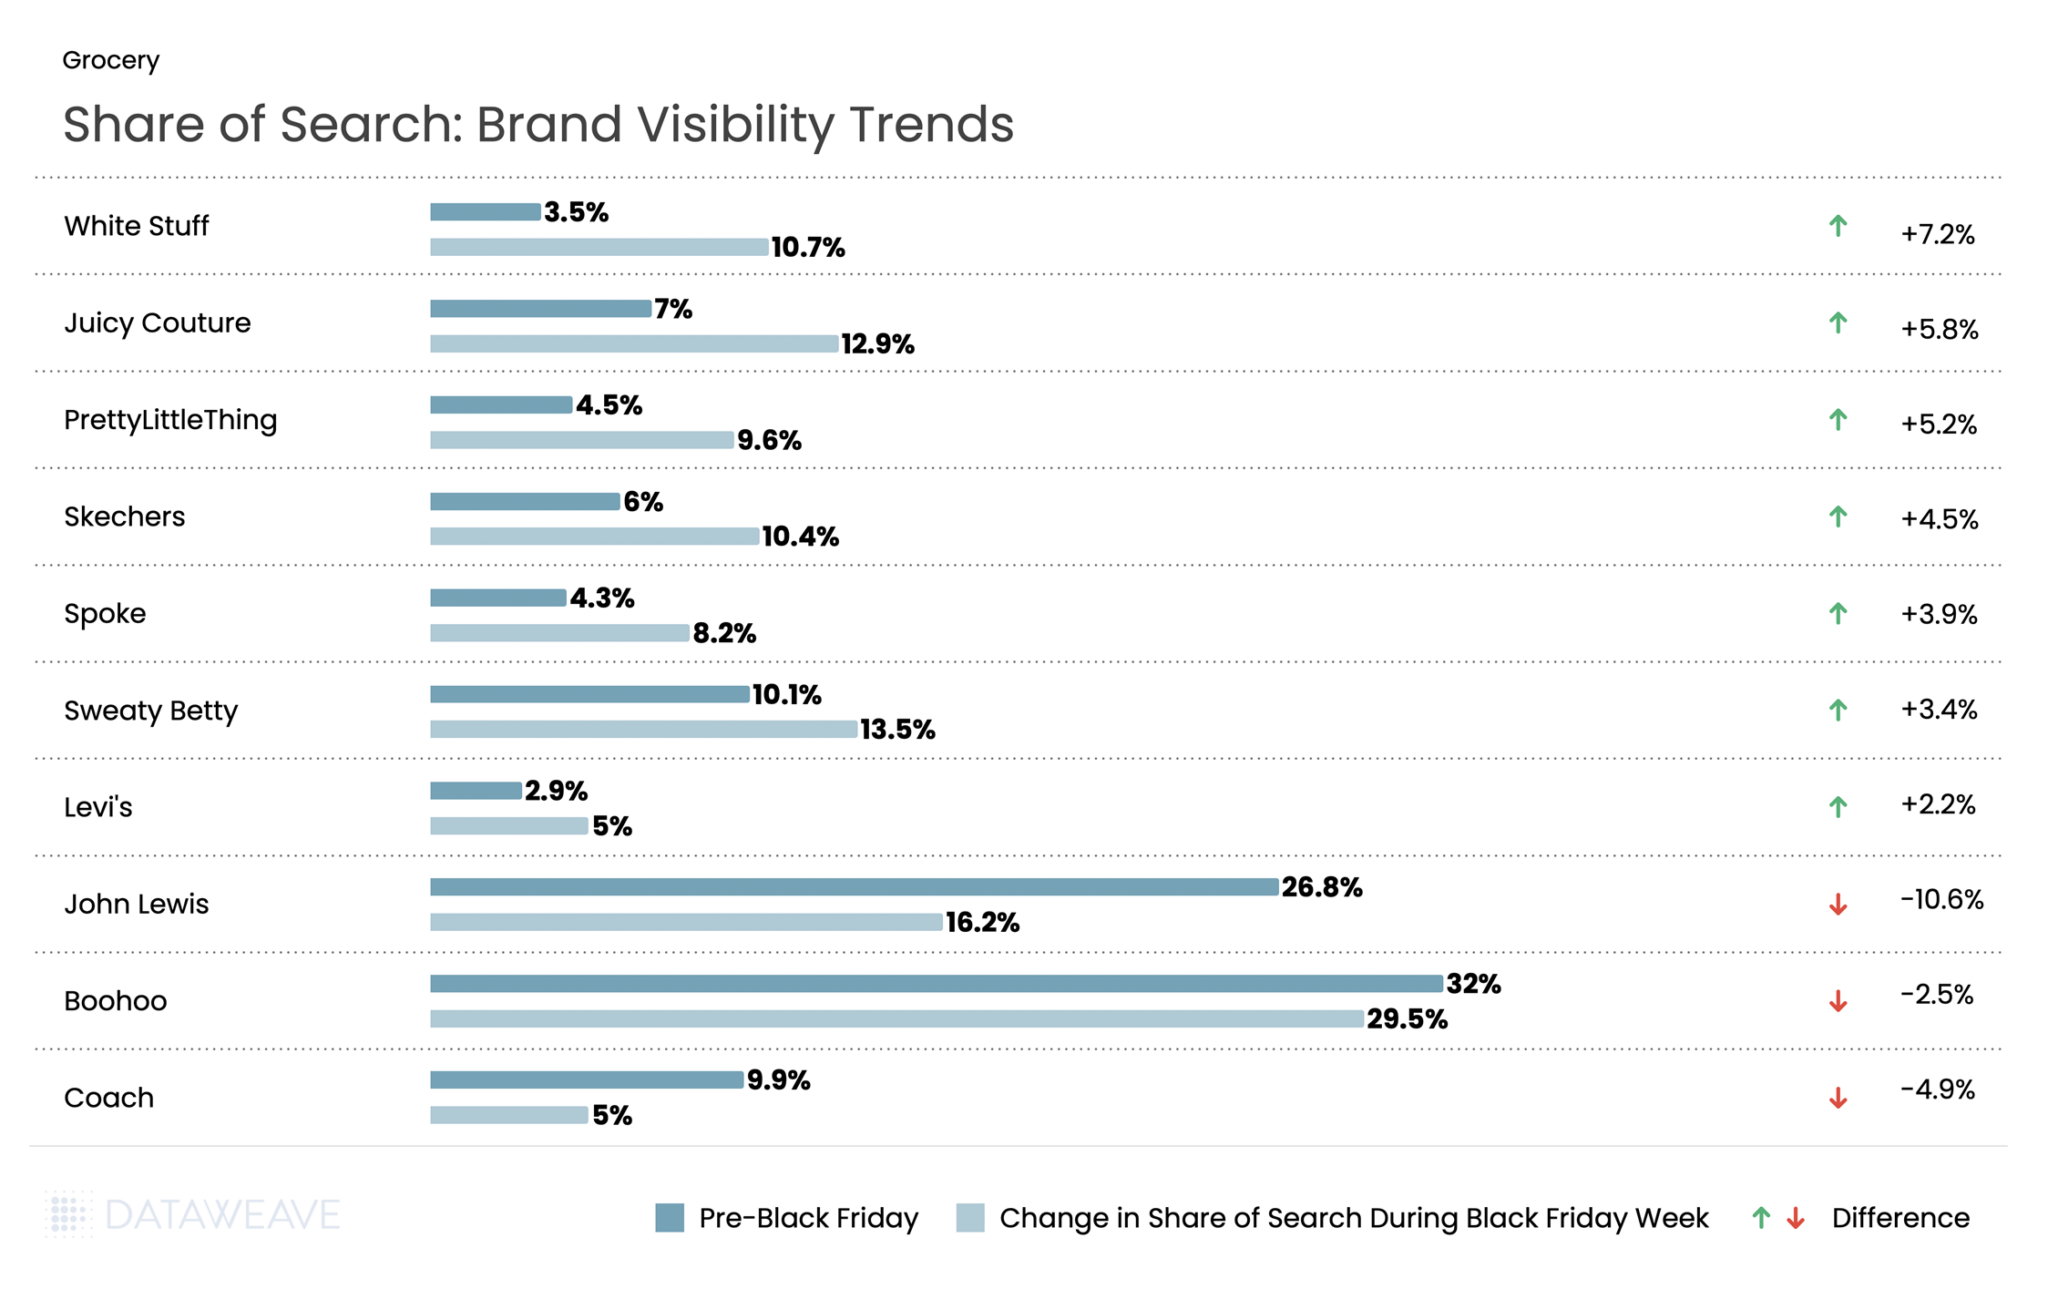
White Stuff, the British lifestyle brand, saw a 7.2% surge in visibility during Black Friday. Y2K fashion made a statement as Juicy Couture jumped 5.8 %. Fast fashion player Pretty Little Thing gained in visibility by 5.2%. Comfort brands performed strongly, with Skechers gaining 4.5% and activewear specialist Sweaty Betty rising 3.4%. Even premium denim brand Levi’s gained ground, increasing share of search by 2.2%.
However, retail giants faced significant visibility challenges. John Lewis saw the steepest decline in the Apparel category, with share of search dropping by 10.6% during Black Friday week. Fast fashion giant Boohoo declined 2.5%. Premium accessory brand Coach’s share fell 4.9%.
The data suggests UK consumers gravitated toward distinctive brands with clear identities during Black Friday, whether heritage British labels, Y2K nostalgia, or comfort-focused specialists, rather than generalist retailers or fast fashion platforms.
Want to understand how DataWeave’s pricing intelligence platform can help your business make data-driven decisions during peak sales events? Contact us to learn more about competitive insights, price intelligence, assortment analytics, content analytics, and digital shelf analytics.
Black Friday 2025 shattered records once again. U.S. consumers spent a record $11.8 billion online on Black Friday, a 9.1% increase from 2024 and the first time online sales exceeded $11 billion. The National Retail Federation (NRF) projects holiday retail sales (November-December) to grow 3.7% to 4.2% over 2024, with total holiday spending expected to surpass $1 trillion for the first time ever. Against this backdrop of robust consumer spending, how did leading retailers and brands perform across key categories this Black Friday?
At DataWeave, we conducted a detailed analysis of Black Friday 2025 pricing trends across five major categories: Consumer Electronics, Home & Furniture, Health & Beauty, Grocery, and Apparel. Our AI-powered pricing intelligence platform monitored nearly 80,000 SKUs across leading U.S. retailers like Amazon, Walmart, Target, Macy’s, Home Depot, Sephora, and more, revealing interesting patterns in how retailers and brands approached this year’s sale season.
Our Methodology
For this analysis, DataWeave monitored average discounts across leading U.S. retailers during two distinct periods:
Pre-Black Friday: Up to November 23, 2025 – capturing early holiday deals and baseline pricing
Additional Discounts During Black Friday Week: November 24 – December 1, 2025 – covering Thanksgiving week through Black Friday (November 28) and Cyber Monday (December 1)
Our sample encompassed the top-ranked products across subcategories on major retail sites. We also analyzed Share of Search data, which measures brand visibility by monitoring which brand names appear in the top 20 search results for critical keywords.
Black Friday 2025: The Big Picture
Here’s the snapshot of average discounts during the Pre-Black Friday period compared to Black Friday Week:
Key Insight: Pre-Black Friday discounts were significant across all categories. This suggests retailers front-loaded their promotions to capture early holiday shoppers, with additional discounts during Black Friday Week adding to the baseline discounts already in place.
Consumer Electronics
Consumer electronics remain one of the most anticipated categories during Black Friday and Cyber Monday. Notably, AI traffic to retail websites grew 805% year-over-year, with consumers using AI tools most frequently for video games, appliances, and electronics categories. Our analysis of 10,356 SKUs reveals how discounts varied across subcategories.
Subcategory Discount Analysis
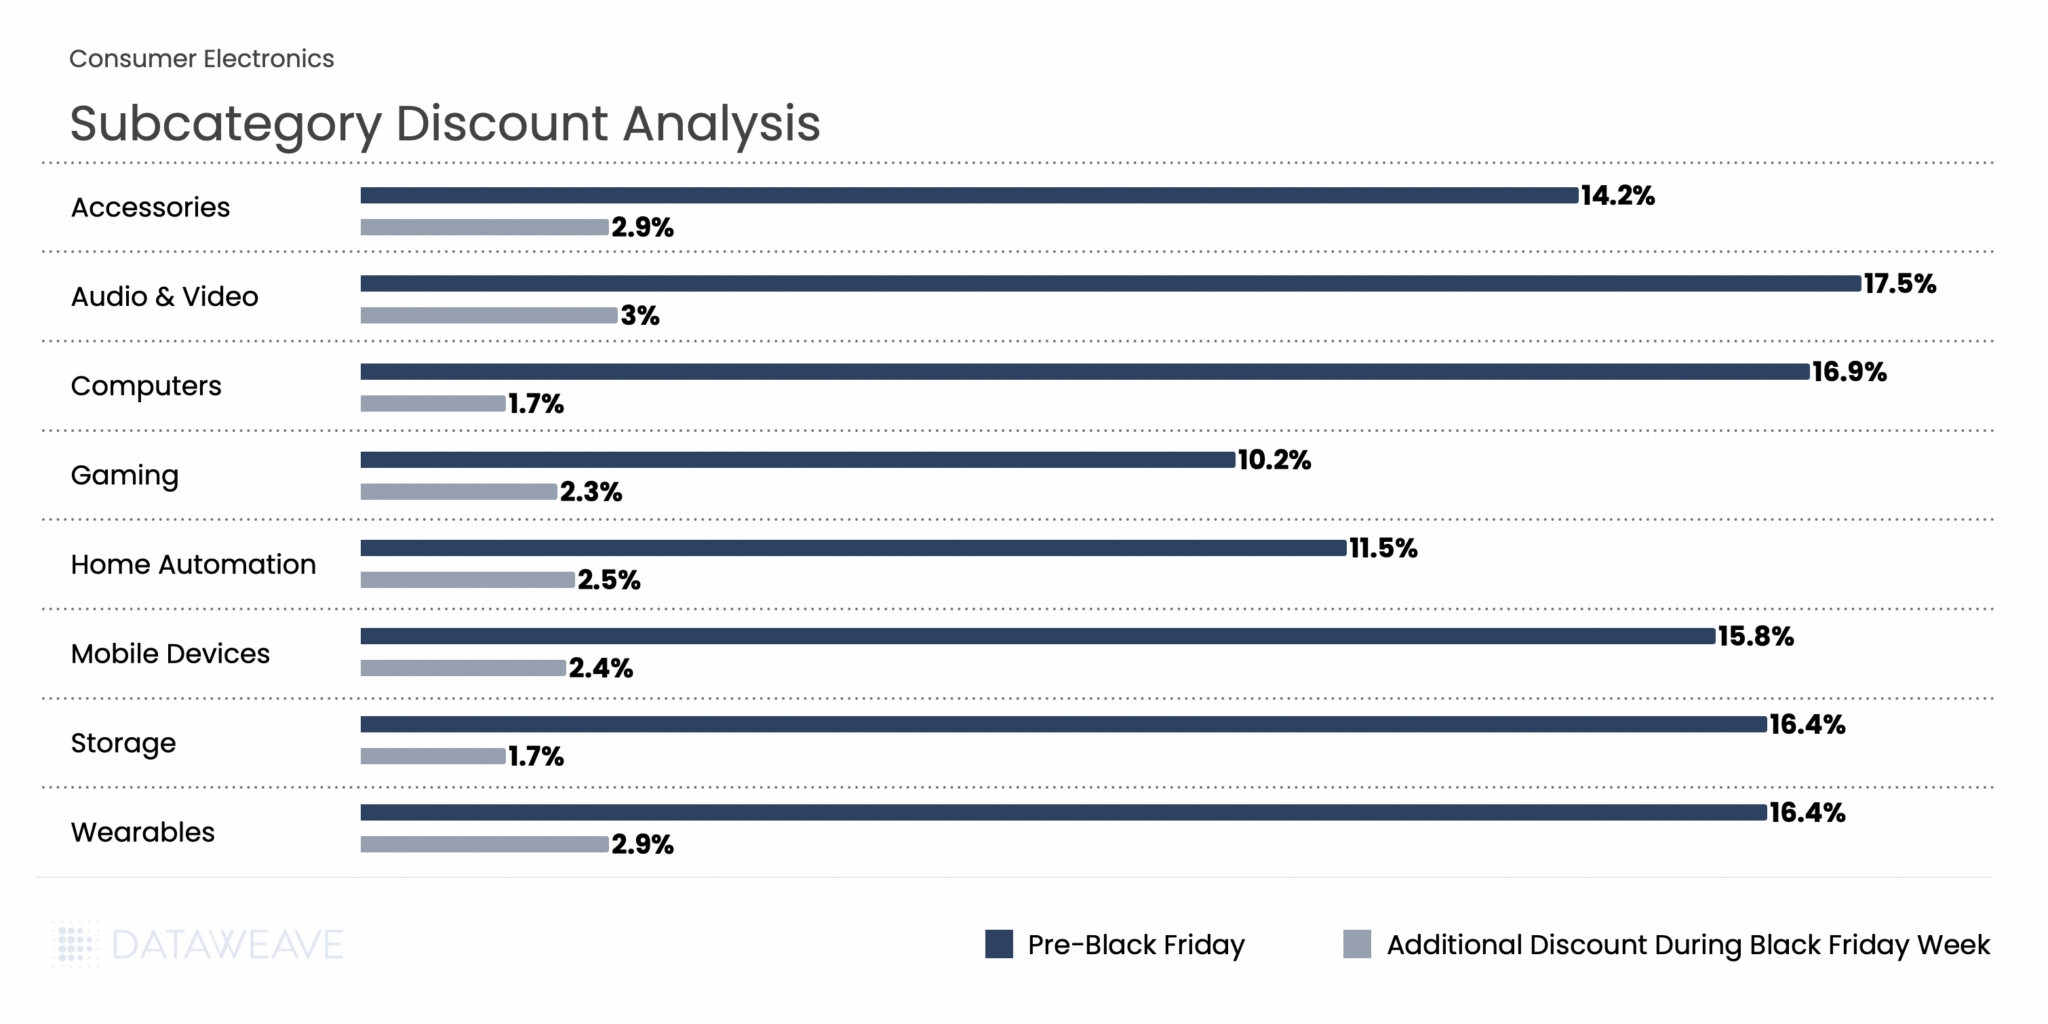
In Consumer Electronics, Pre-Black Friday discounts averaged 14.6% across subcategories, while Black Friday Week saw an additional 2.6% discount on average. Audio & Video products led the pre-sale discounting at 17.5%, indicating retailers were eager to move inventory early. During Black Friday Week, Audio & Video, Accessories, and Wearables saw the highest additional discounts (2.9-3 %), while Computers and Storage had already been heavily discounted pre-sale, leaving minimal room for further reductions during the main event.
Share of Search: Brand Visibility Trends
Our Share of Search analysis reveals significant shifts in brand visibility during Black Friday Week:
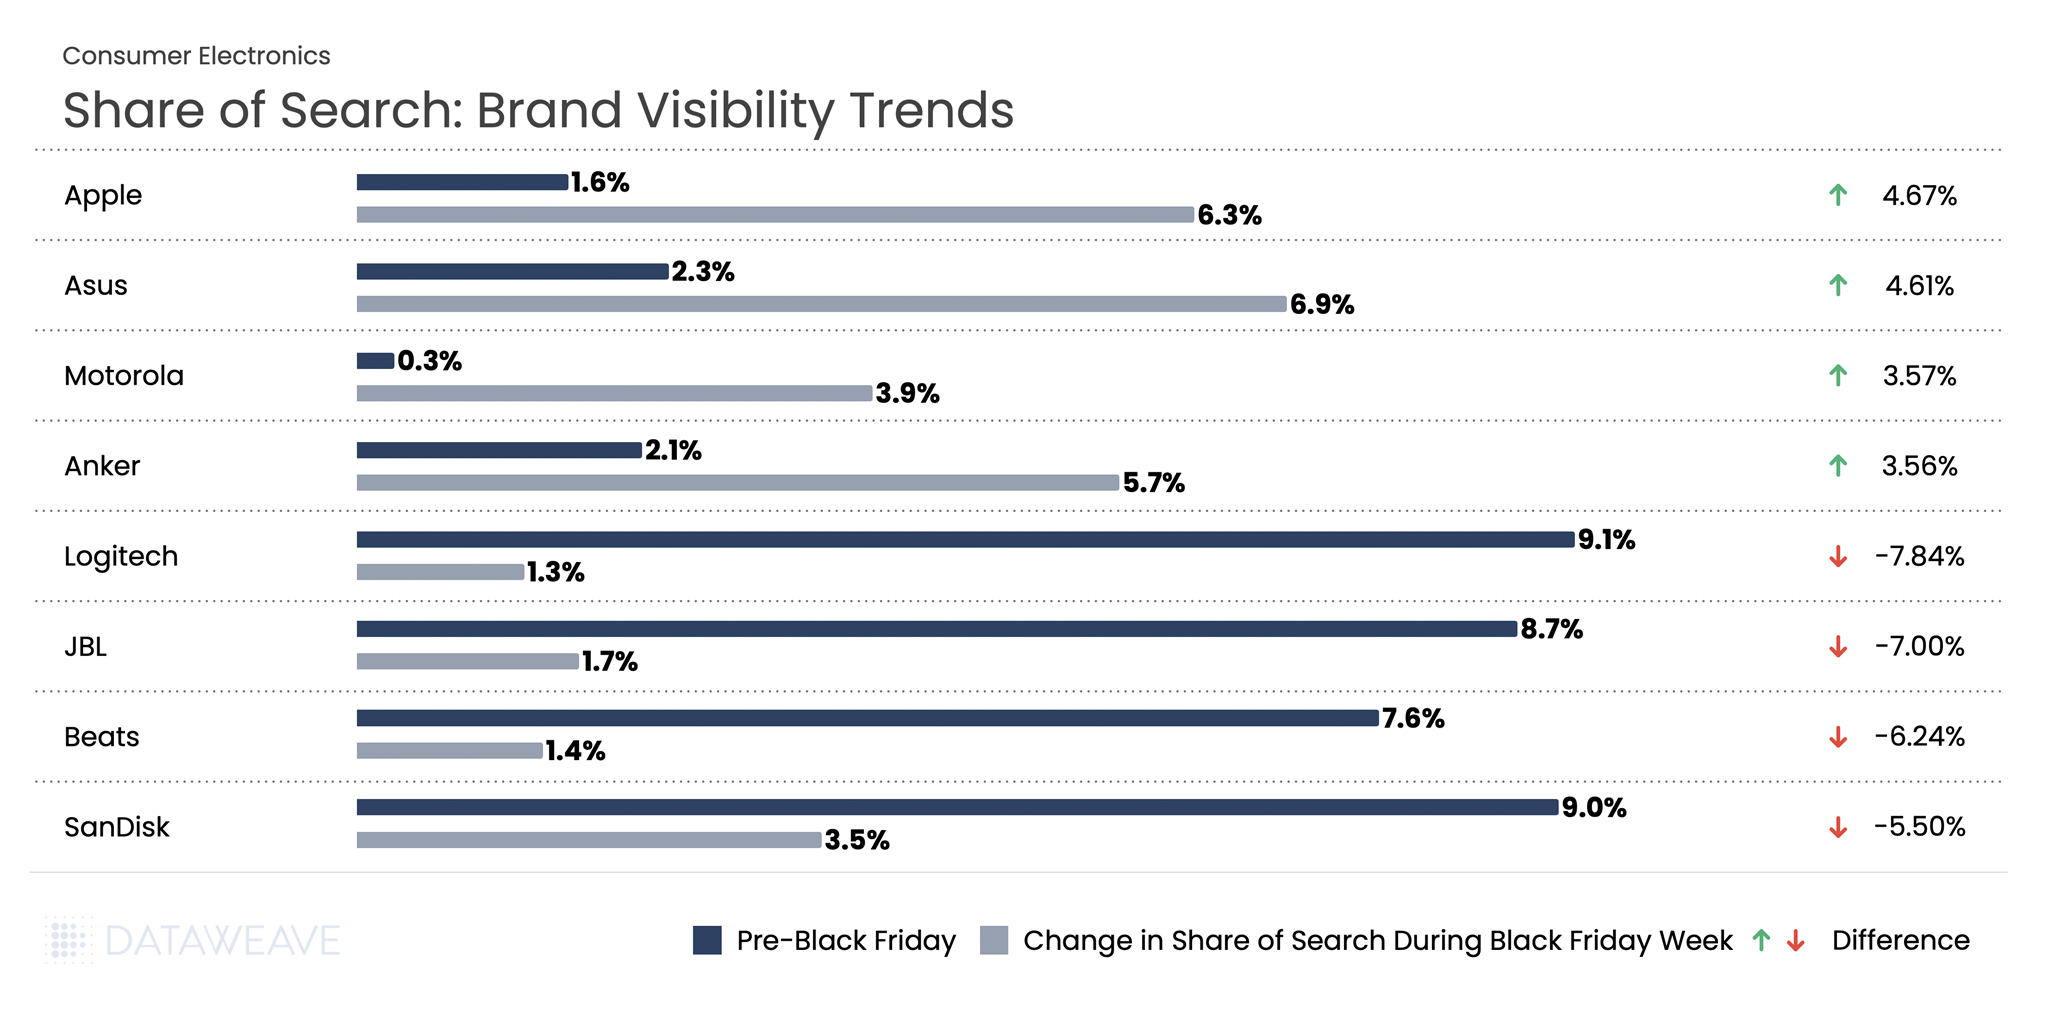
The Takeaway: Our analysis reveals significant shifts in brand visibility during Black Friday Week compared to the pre-sale period. Computing and mobile-focused brands like Apple and Asus gained substantial ground, while audio brands like Logitech, JBL, and Beats saw their visibility plummet. Apple’s Share of Search jumped from 1.58% to 6.2%, a gain of 4.6%, suggesting strong promotional activity or heightened consumer interest. Meanwhile, Logitech dropped nearly 8%, from 9.9% to just 1.2%.
Home & Furniture
The Home & Furniture category continues to be a consumer favorite during Black Friday. Our analysis of 12,610 SKUs shows how discounts were distributed across subcategories.
Subcategory Discount Analysis
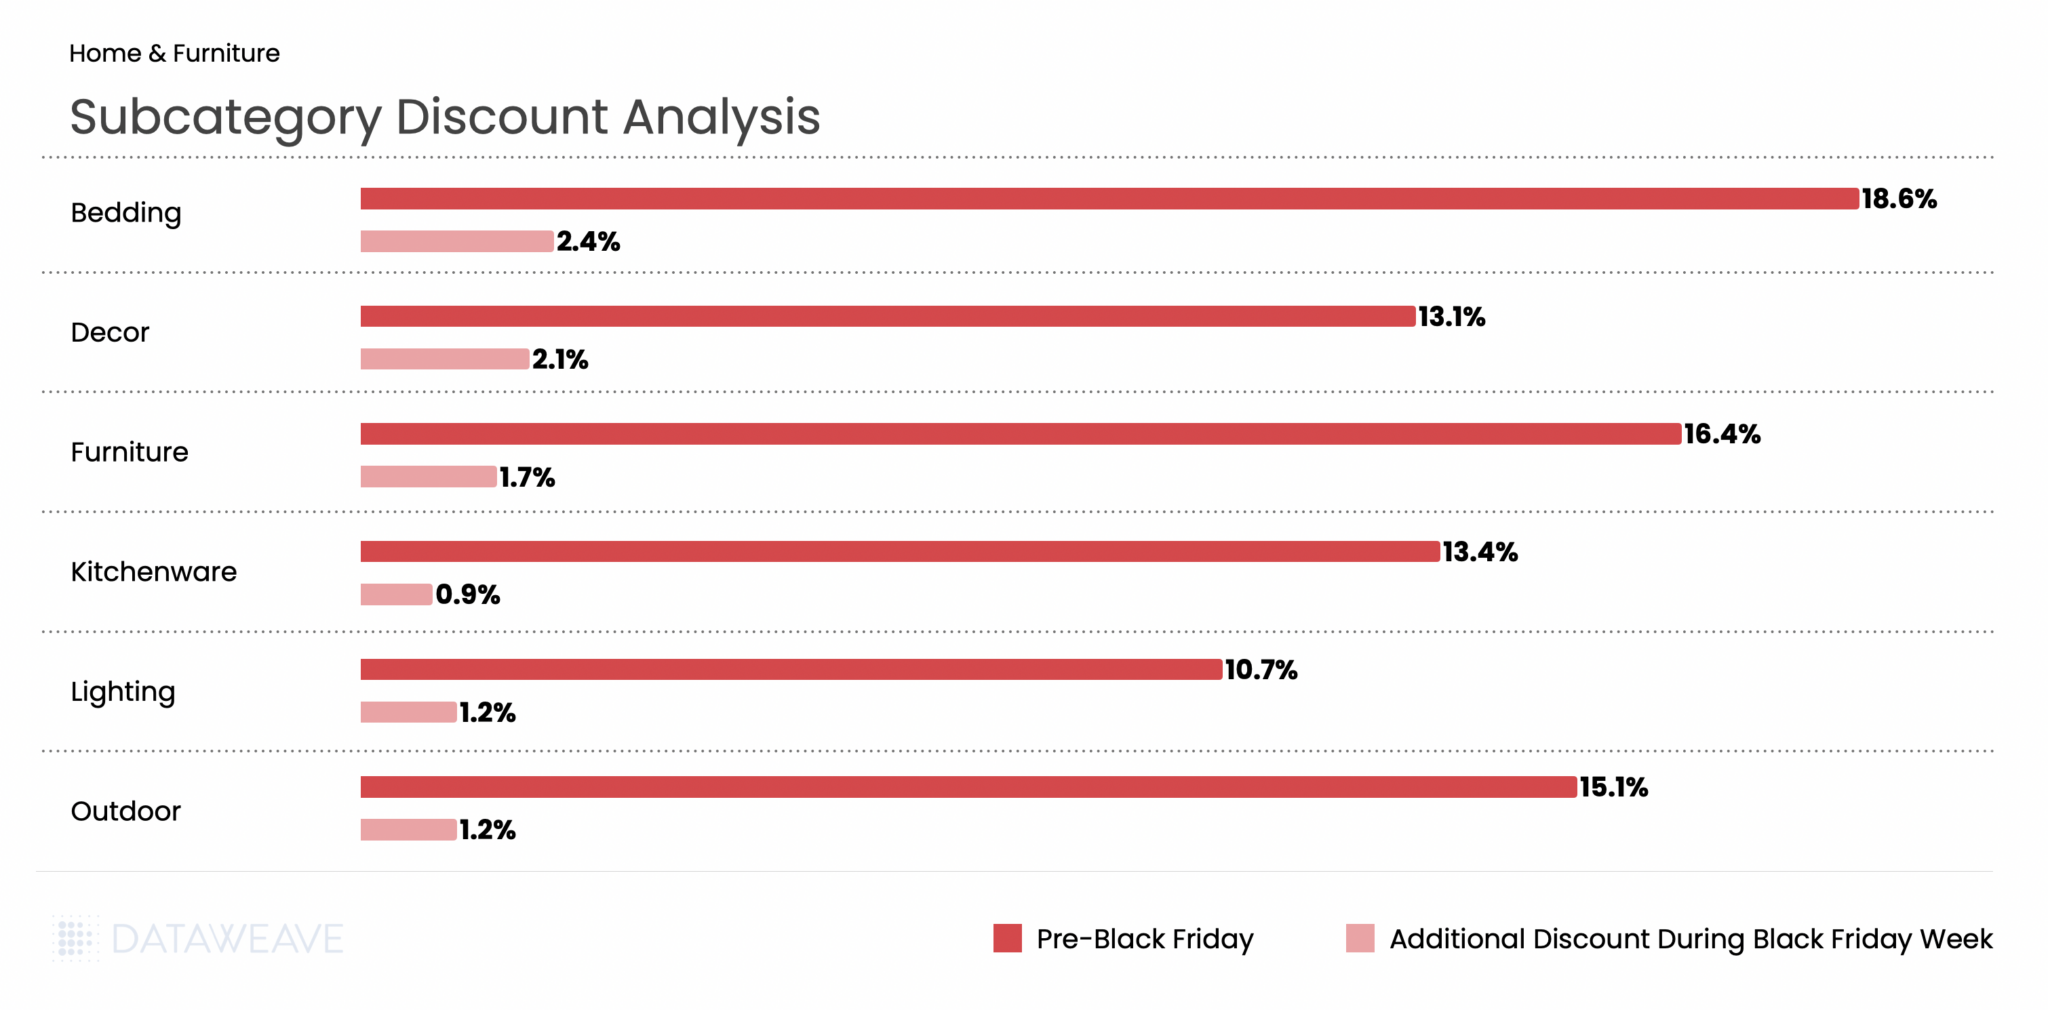
Home & Furniture saw Pre-Black Friday discounts averaging 13.9%, with Black Friday Week adding just 1.7% on average, the second-lowest additional discount among all categories. Bedding led pre-sale discounts at an impressive 18.6%, followed by Furniture at 16.4% and Outdoor at 15.1%. This suggests retailers aggressively promoted home goods early in the season to capture deal-seekers.
During Black Friday Week, Bedding maintained leadership with 2.4% additional discounts, while Kitchenware saw the smallest bump at just 0.9%, indicating early promotions had already captured most of the discount opportunity.
Share of Search: Brand Visibility Trends
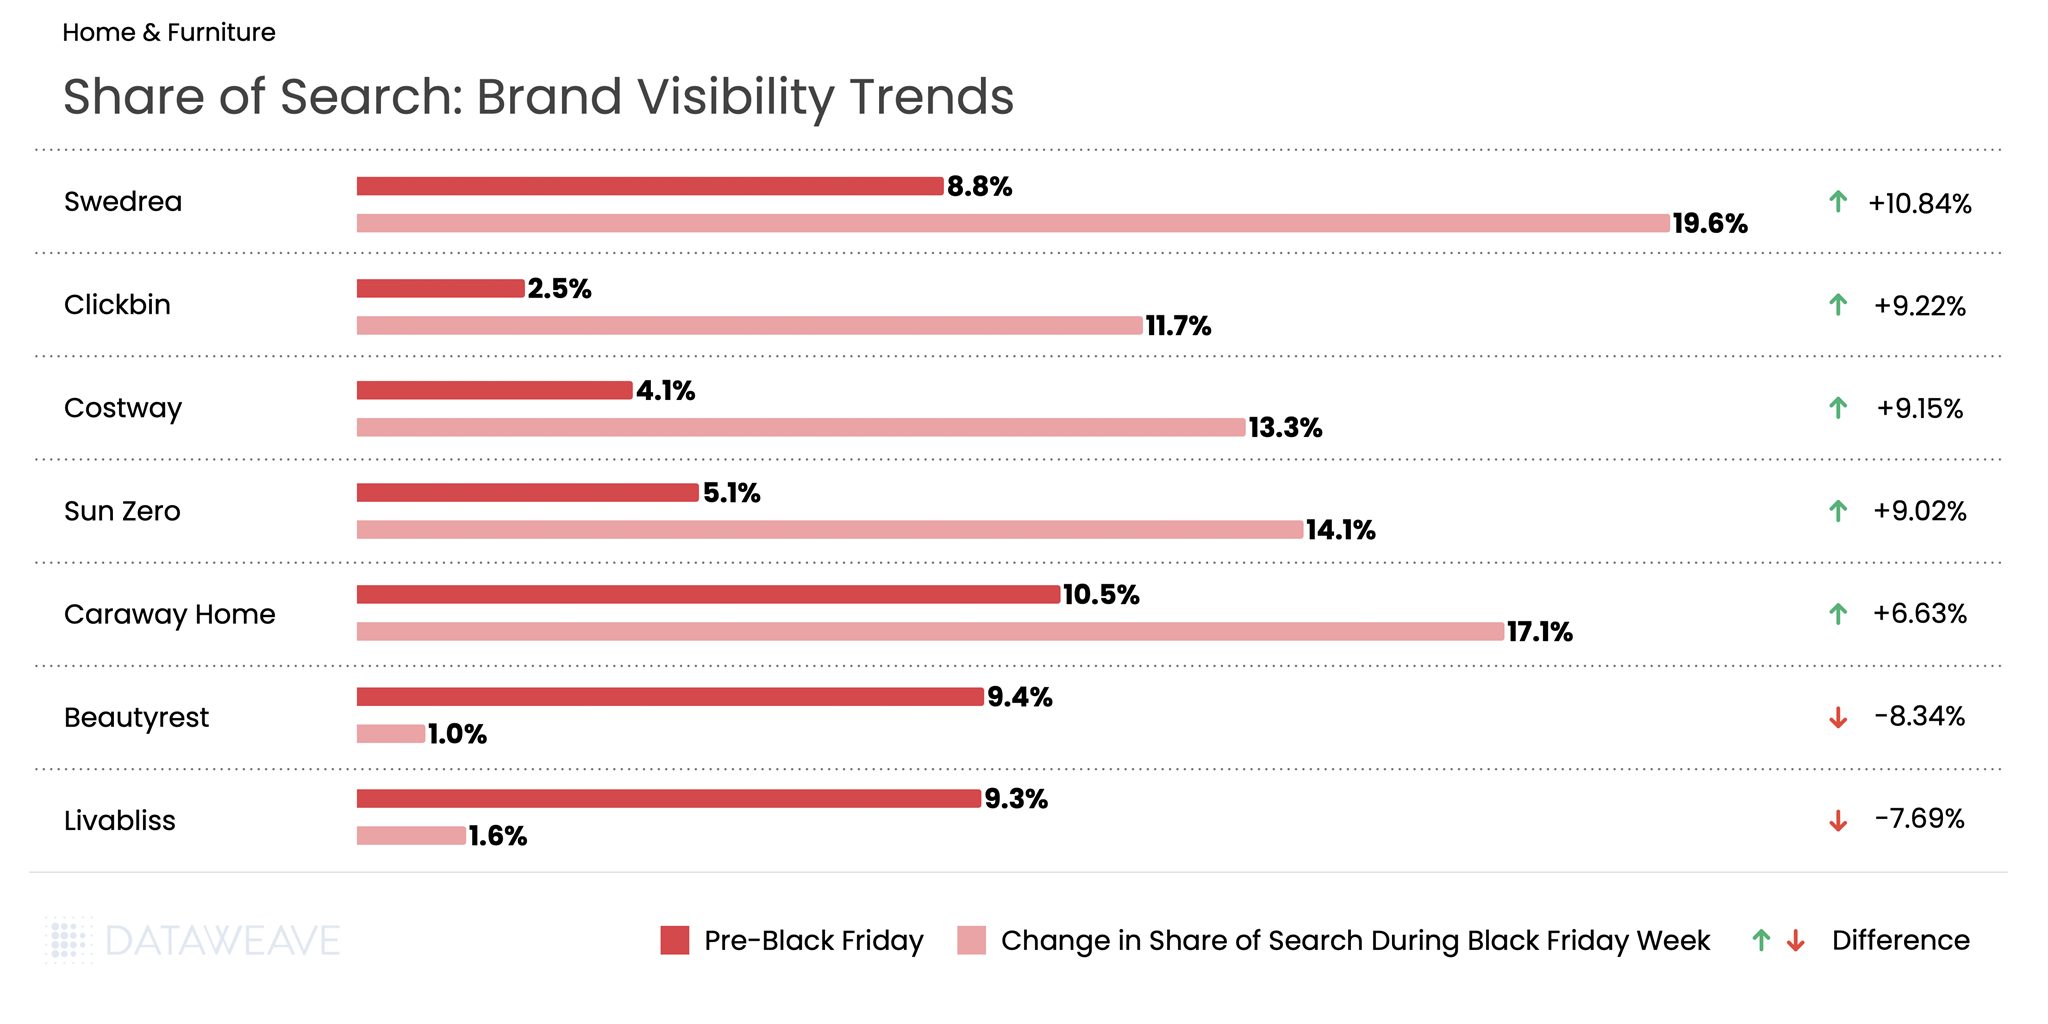
The Takeaway: The Home & Furniture category saw some of the most dramatic Share of Search swings in our entire analysis. Emerging and value-oriented brands dominated the gains, with Swedrea surging from 8.7% to 19.6%, a remarkable 10.8% increase. Similarly, Clickbin and Costway each gained over 9%. On the flip side, established premium brands like Beautyrest and Livabliss saw sharp visibility declines, dropping over 7-8%.
Health & Beauty
Health & Beauty has emerged as a growth engine during Black Friday. The beauty industry is projected to grow 5% annually through 2030 according to a McKinsey survey. Our analysis of 16,141 SKUs reveals subcategory-level insights.
Subcategory Discount Analysis
Notable finding: Health & Beauty presented a unique discounting pattern compared to other categories. Pre-Black Friday discounts averaged just 7.1%, the second-lowest among all categories. But Black Friday Week discounts were relatively strong at 4.8%. This indicates the Beauty category held back more discounts for the main event.
Notably, Hair Care was the only subcategory across our entire analysis where Black Friday Week discounts (6%) exceeded Pre-Black Friday discounts (4.6%), suggesting retailers strategically saved their best hair care promotions for the big weekend. Fragrance led pre-sale discounts at 13%, making it an attractive early shopping category.
Share of Search: Brand Visibility Trends
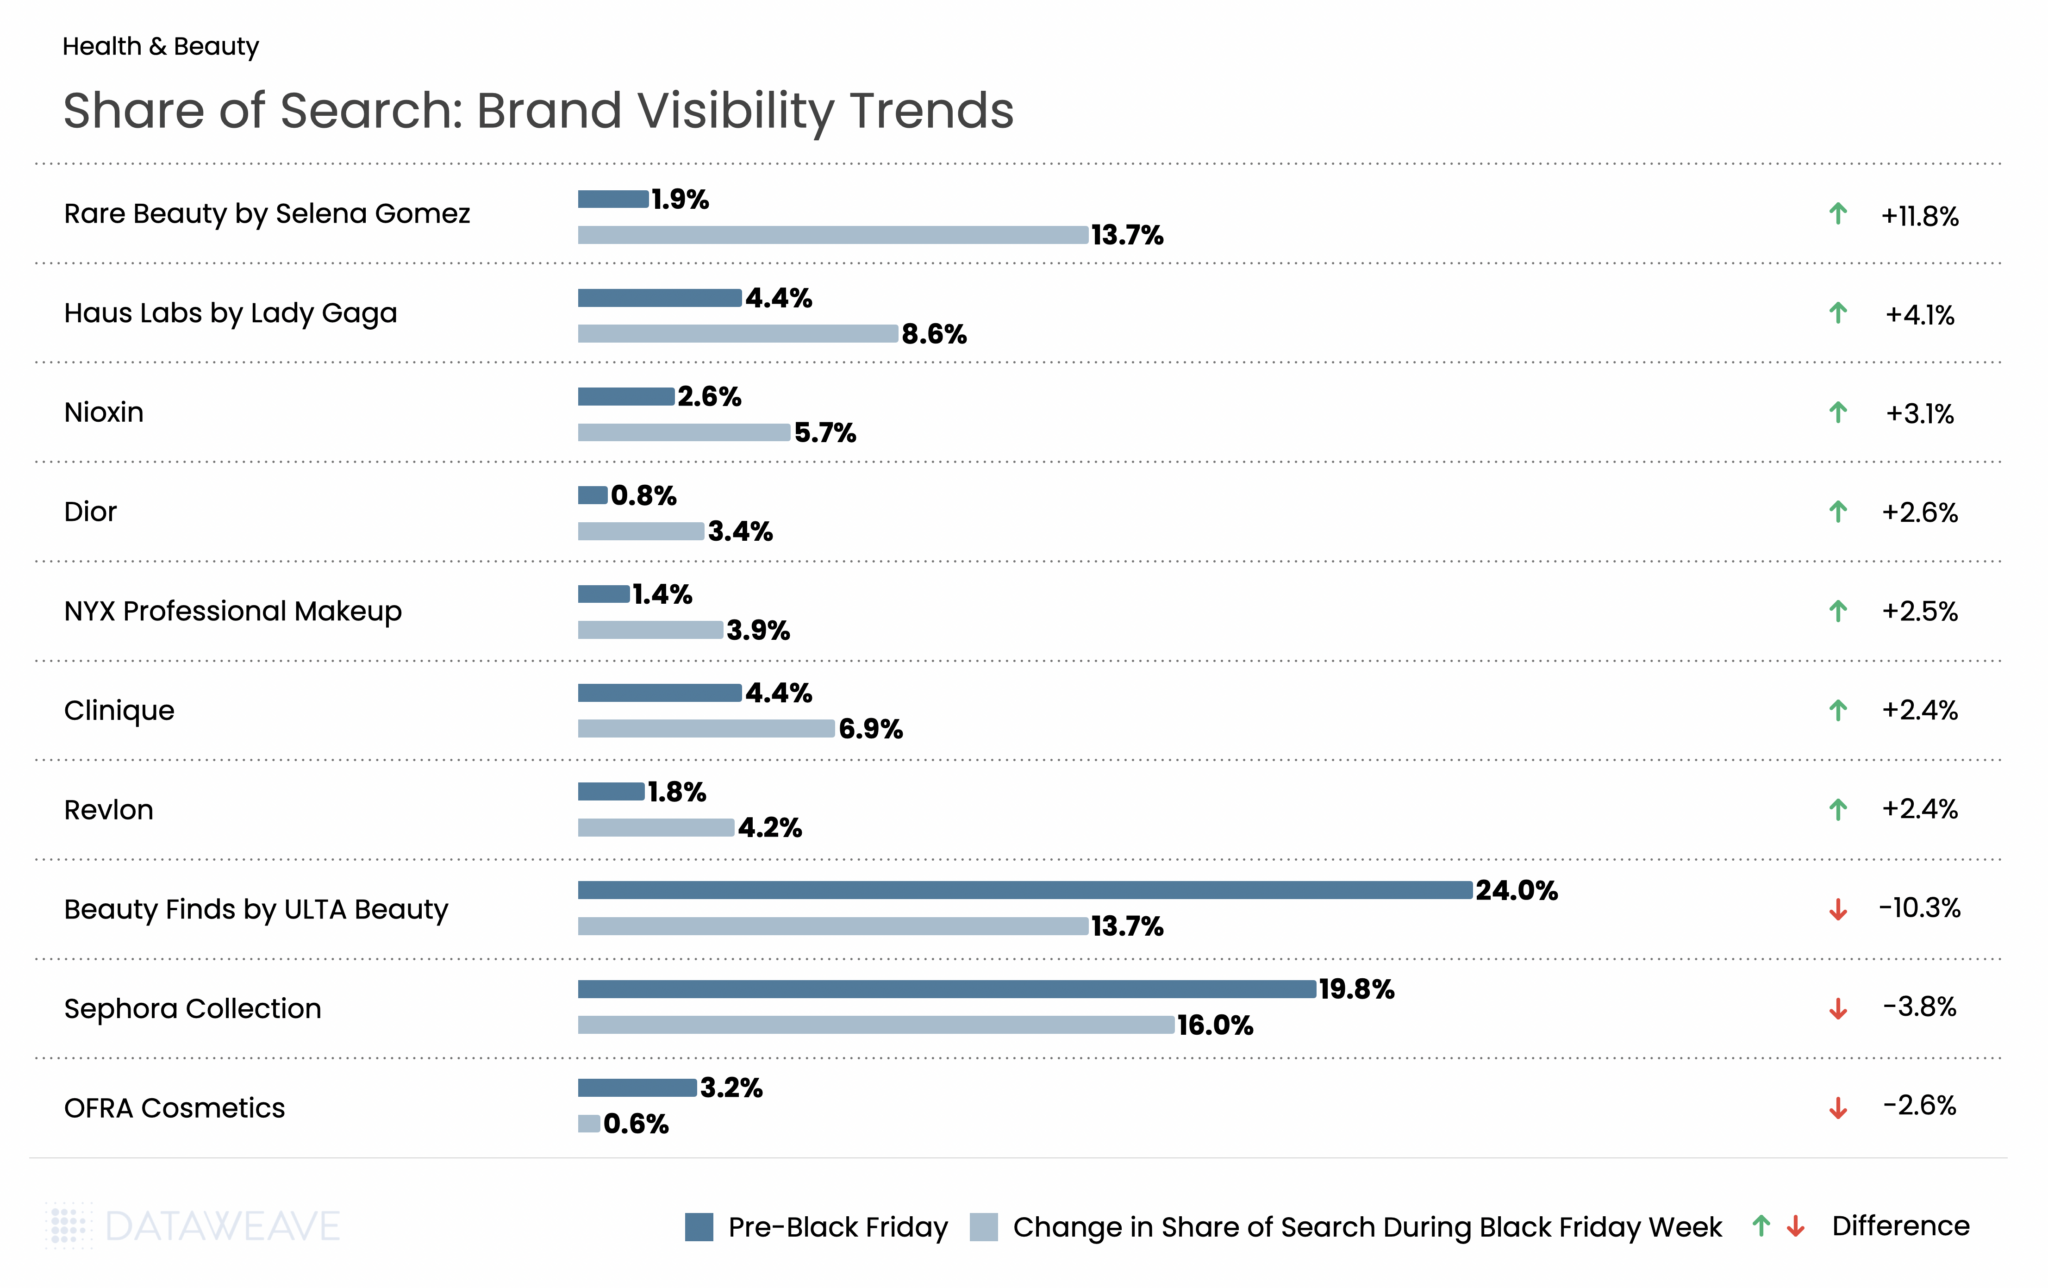
Health & Beauty saw some of the most dramatic Share of Search swings in our analysis, driven largely by celebrity-backed brands. Rare Beauty by Selena Gomez exploded from just 1.9% to 13.7%, a whopping 11.8% gain that made it the biggest winner across all categories. Haus Labs by Lady Gaga also surged (+4.1%), while prestige brands like Dior (+2.6%) and Clinique (+2.4%) gained ground.
The flip side? Retailer private labels took a hit: Beauty Finds by ULTA Beauty collapsed from 24% to 13.7% (-10.3%), and Sephora Collection dropped from 19.8% to 16.0% (-3.8%).
Key Takeaway: The Beauty category tells a compelling story about the power of celebrity brands during Black Friday. The Share of Search shifts appear to reflect how retailers and brands recalibrated their promotional focus for Black Friday. Celebrity-driven lines rose sharply in visibility, suggesting stronger placement, promotion, or search prioritization during the sale period. At the same time, private-label ranges from ULTA and Sephora lost ground, indicating a pivot away from house-brand visibility in favor of more spotlighted national and prestige brands throughout the event.
Grocery
While Grocery typically sees more modest discounts compared to discretionary categories, the sector remains a critical part of Thanksgiving weekend shopping. According to the National Retail Federation, grocery stores and supermarkets ranked as the third most popular shopping destination during Thanksgiving weekend, with 40% of consumers making purchases there. Our analysis of 18,823 SKUs shows how retailers approached promotions across essential and indulgent subcategories.
Subcategory Discount Analysis
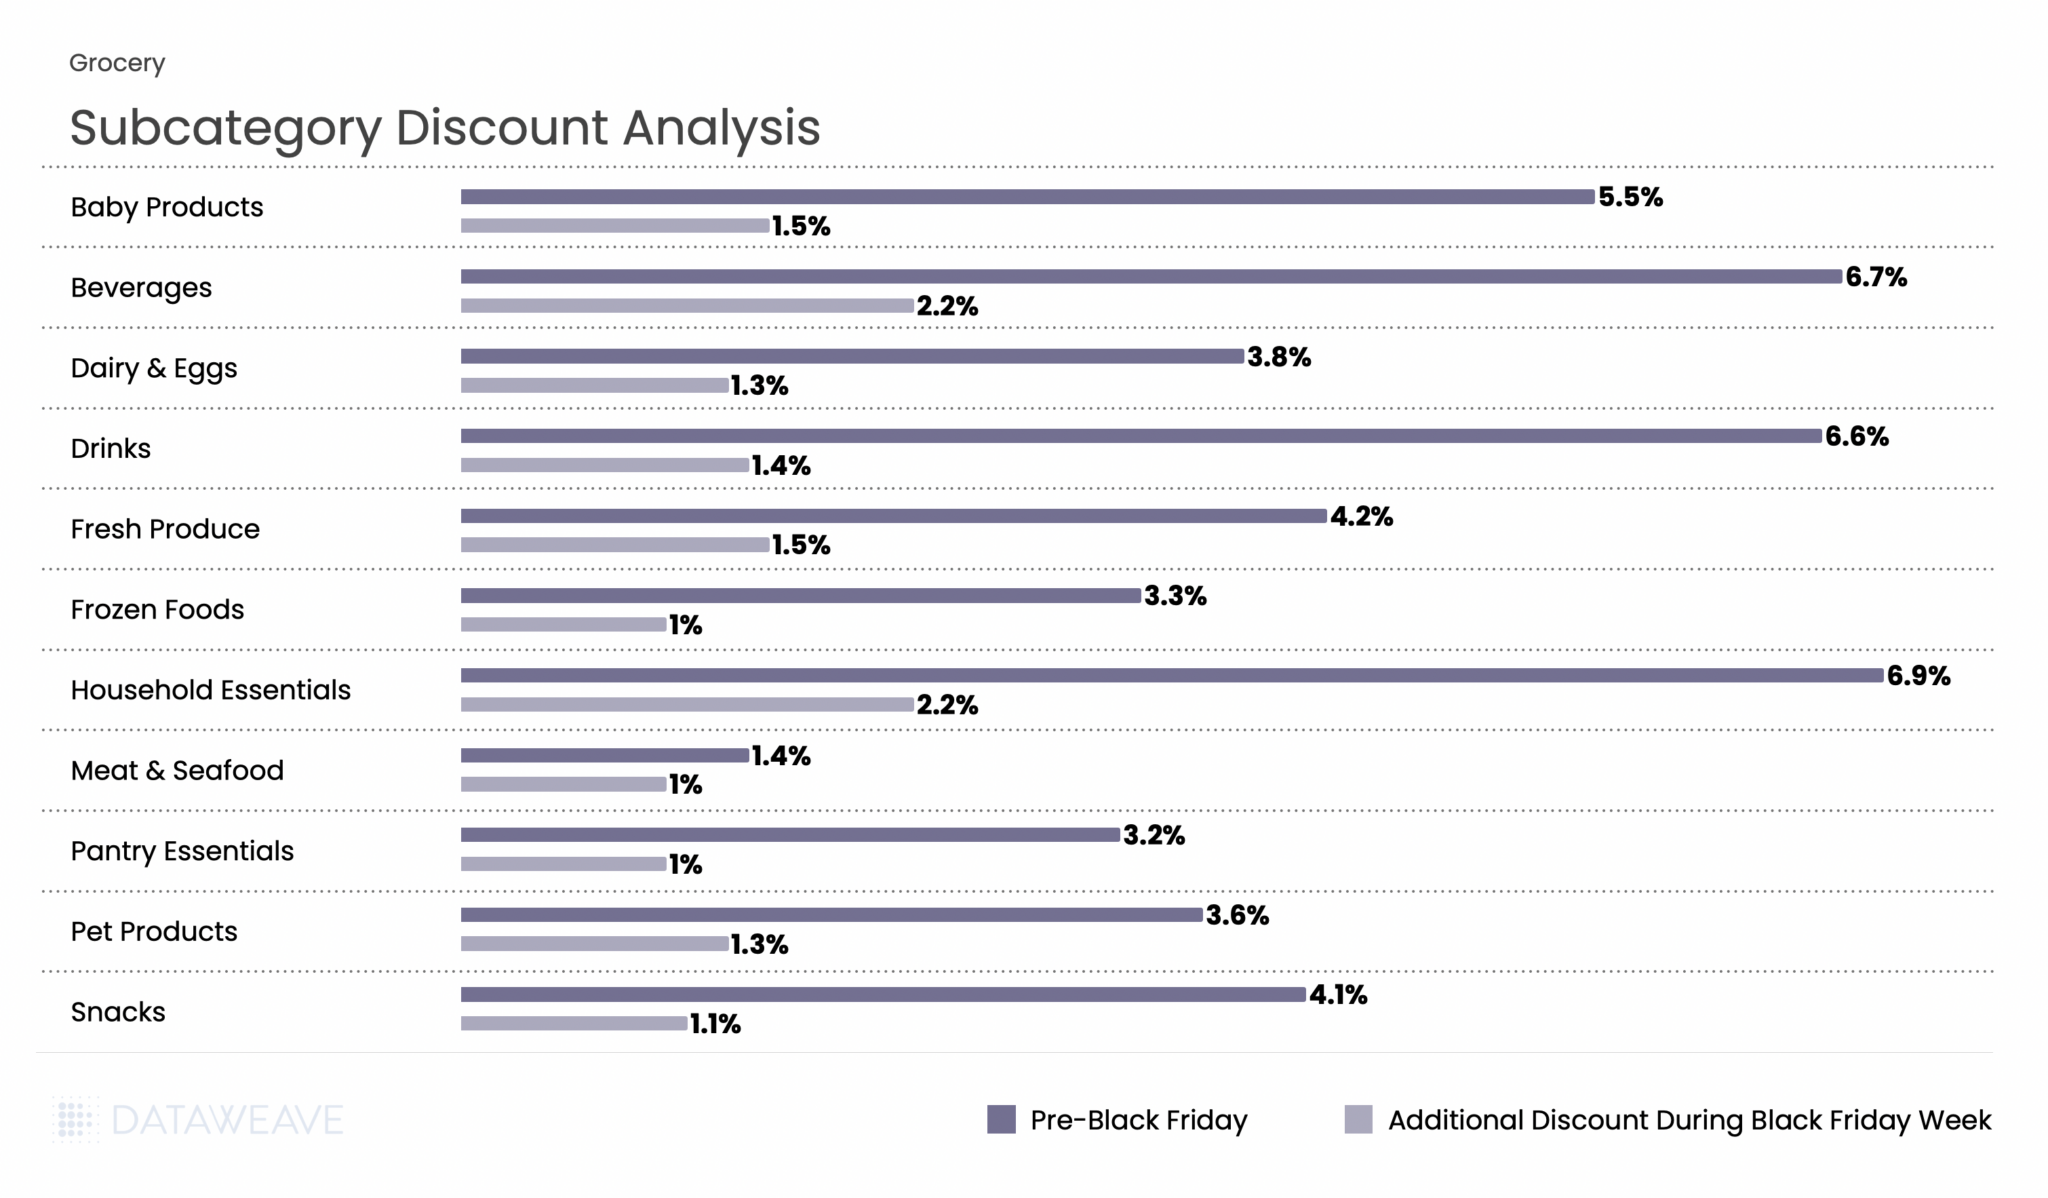
Grocery had the lowest discounts across all categories, reflecting the already-thin margins in food retail. Pre-Black Friday discounts averaged just 5.2%, with Black Friday Week adding only 1.5%. Household Essentials and Beverages led pre-sale discounts at 6.9% and 6.7% respectively, and maintained their lead during Black Friday Week with 2.2% additional discounts each. Fresh categories like Meat & Seafood (1.4% pre-sale, 1% Black Friday Week) and Frozen Foods (3.3%, 1%) saw minimal promotional activity, consistent with perishable inventory constraints and tight margins.
Key Takeaway: Grocery discounting remains conservative, with shelf-stable and household items seeing the most promotional activity. The Beverages and Household Essentials subcategories, which have longer shelf life and higher margins, were the primary battleground for grocery promotions during BFCM 2025.
Share of Search: Brand Visibility Trends
The Grocery category saw some surprising Share of Search swings during Black Friday Week. Most notably, there was a dramatic divergence between beverage giants: Sprite surged from 1.7% to 6.8% (+5.1%), while Coca-Cola collapsed from 6% to just 0.1% (-5.9%). This stark contrast suggests vastly different promotional strategies or algorithmic visibility changes between the two brands. Private label 365 by Whole Foods Market continued its steady rise, gaining 3%, reflecting ongoing consumer interest in store brands as shoppers seek value.
The Sprite vs. Coca-Cola divergence is one of the most striking findings in our analysis. Additionally, brands like Amy’s (organic/natural foods) and McCormick (spices/seasonings) gained significant visibility.
Apparel
Apparel remains a Black Friday staple and performed strongly this year. Our analysis of 21,749 SKUs (the largest category in our study) reveals interesting patterns.
Subcategory Discount Analysis
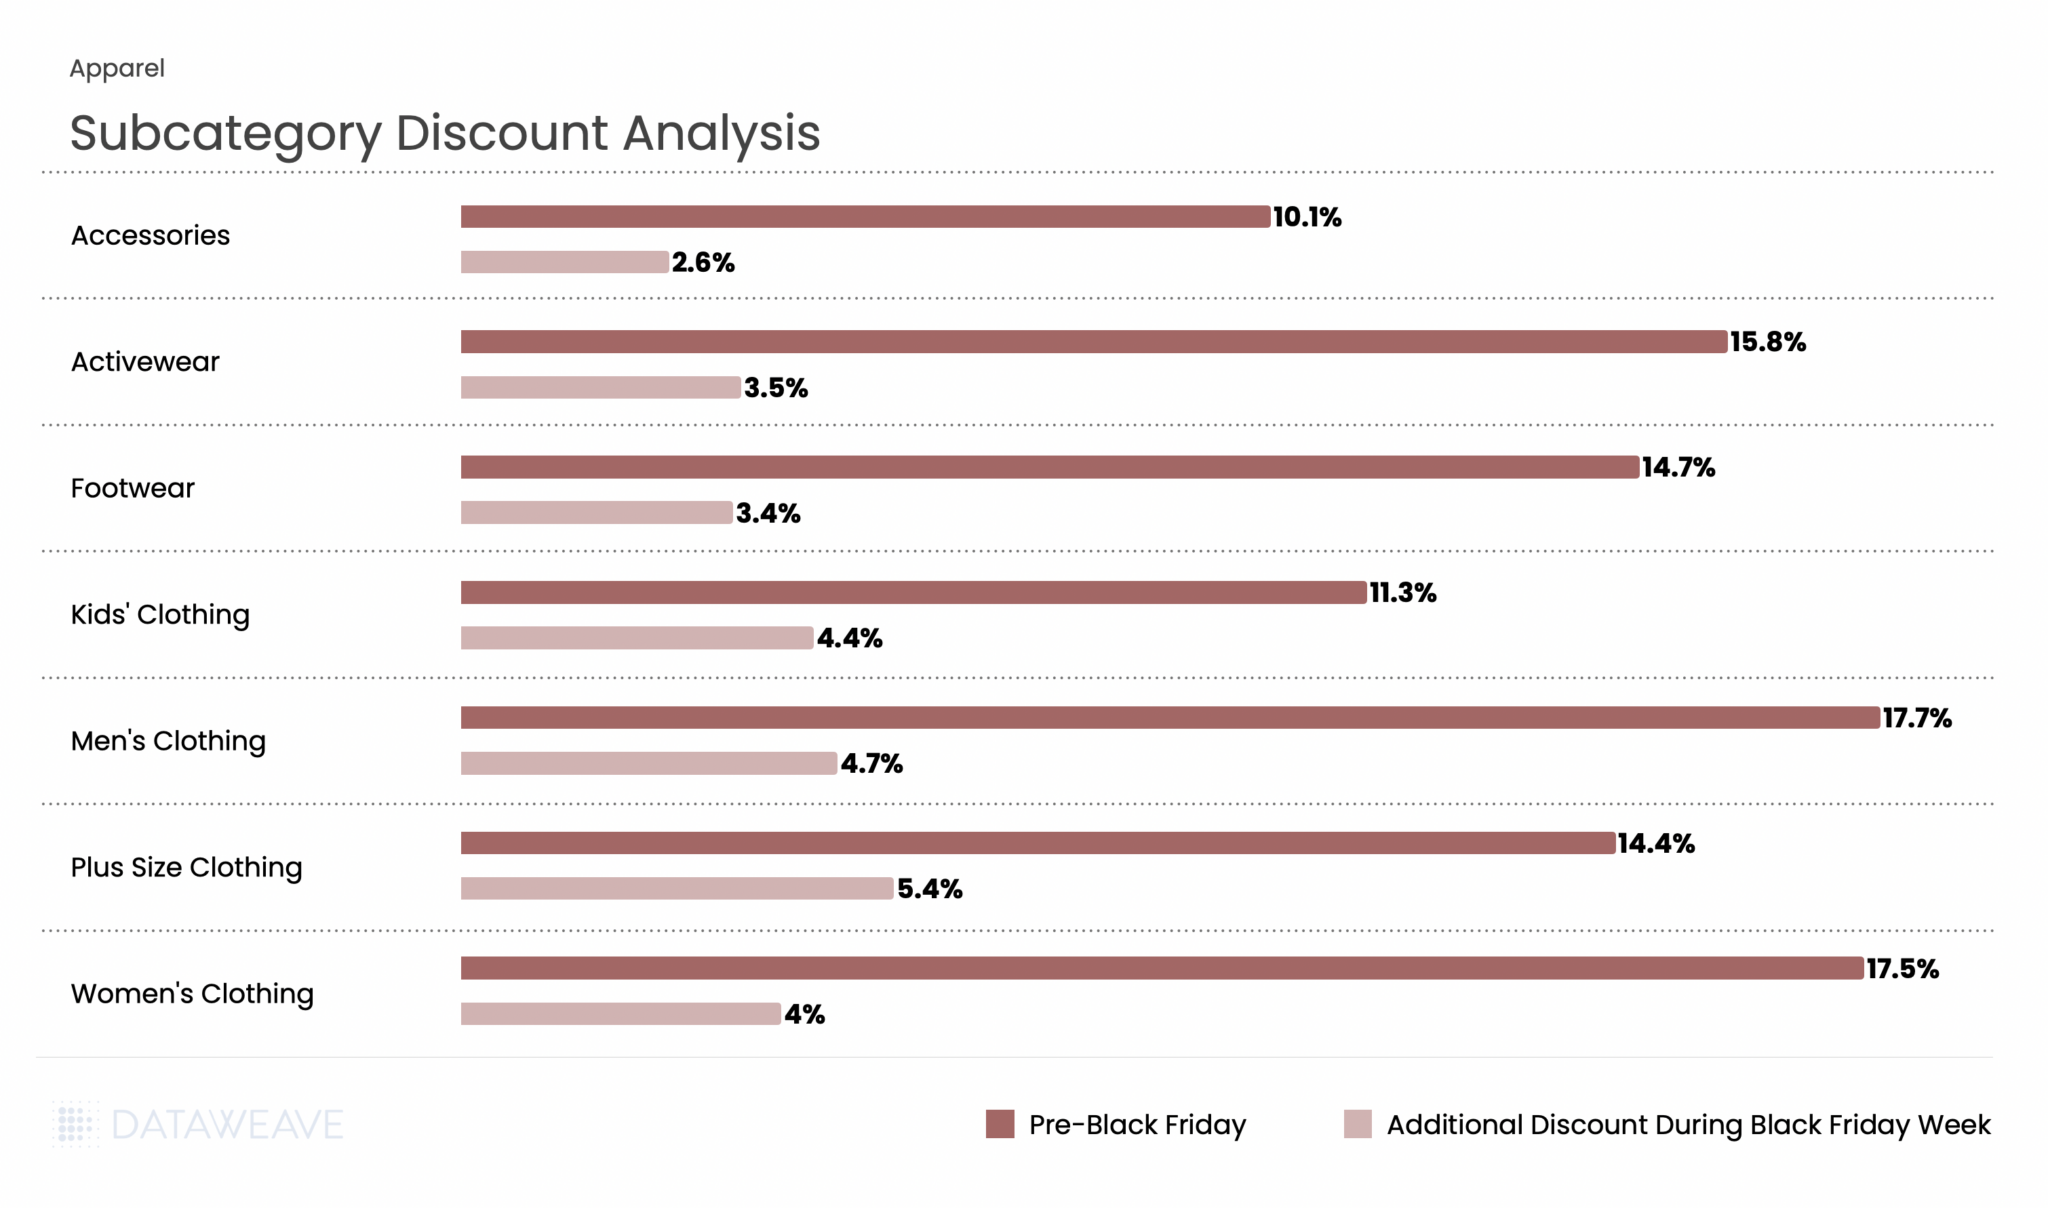
Apparel showed strong discounting activity throughout the BFCM period. Pre-Black Friday discounts averaged 13.8%, with Black Friday Week adding 3.8%, the highest additional discount among all five categories. Men’s Clothing and Women’s Clothing led pre-sale discounts at 17.7% and 17.5% respectively, reflecting aggressive early promotions on core apparel. Interestingly, Plus Size Clothing saw the highest Black Friday Week discount at 5.4%, suggesting retailers pushed harder during the main event to drive conversions in this segment. Kids’ Clothing also saw strong Black Friday Week discounts at 4.4%.
Share of Search: Brand Visibility Trends
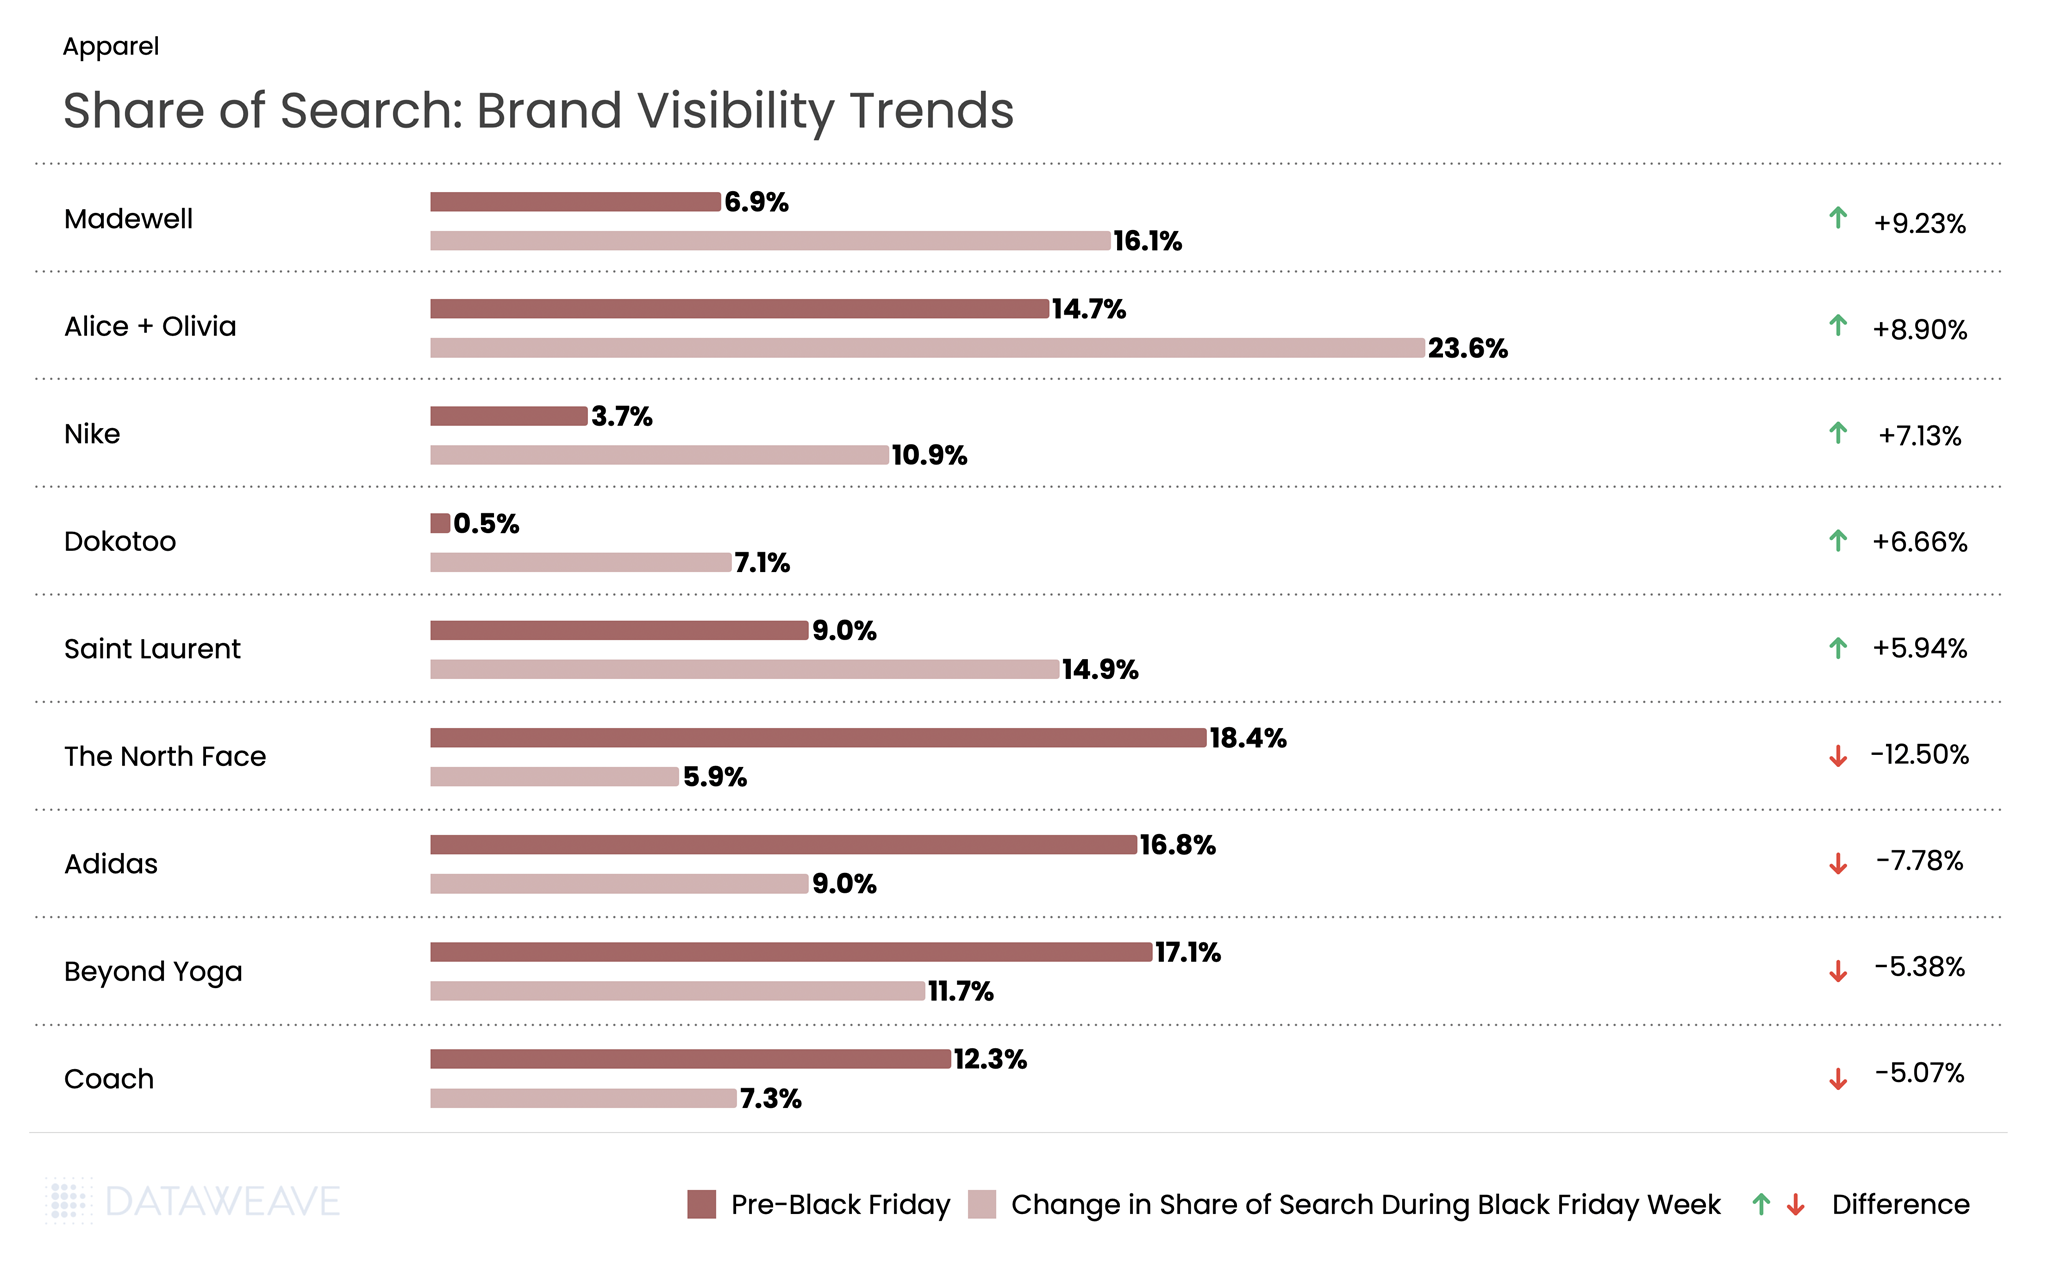
Apparel saw dramatic Share of Search movements during Black Friday Week. Fashion-forward brands dominated the gains: Madewell surged from 6.9% to 16.1% (+9.2%), while Alice + Olivia jumped from 14.7% to 23.6% (+8.9%). Nike also performed strongly with a 7.1% gain. Conversely, outdoor and athletic brands faced steep declines: The North Face dropped from 18.4% to 5.9%, a massive 12.5% decline, the largest in our entire analysis. Adidas fell 7.7%, Beyond Yoga declined 5.3%, and luxury brand Coach by 5%.
Key Takeaway: The data suggests fashion-forward and lifestyle brands (Madewell, Alice + Olivia, Saint Laurent) gained visibility at the expense of outdoor/athletic brands (The North Face, Adidas, Beyond Yoga). This could indicate that fashion brands invested more heavily in promotional visibility during the sale period.
Want to understand how DataWeave’s pricing intelligence platform can help your business make data-driven decisions during peak sales events? Contact us to learn more about competitive insights, price intelligence, assortment analytics, content analytics, and digital shelf analytics.
Follow our blog for more insights on retail pricing trends, brand visibility analysis, and data-driven commerce intelligence.
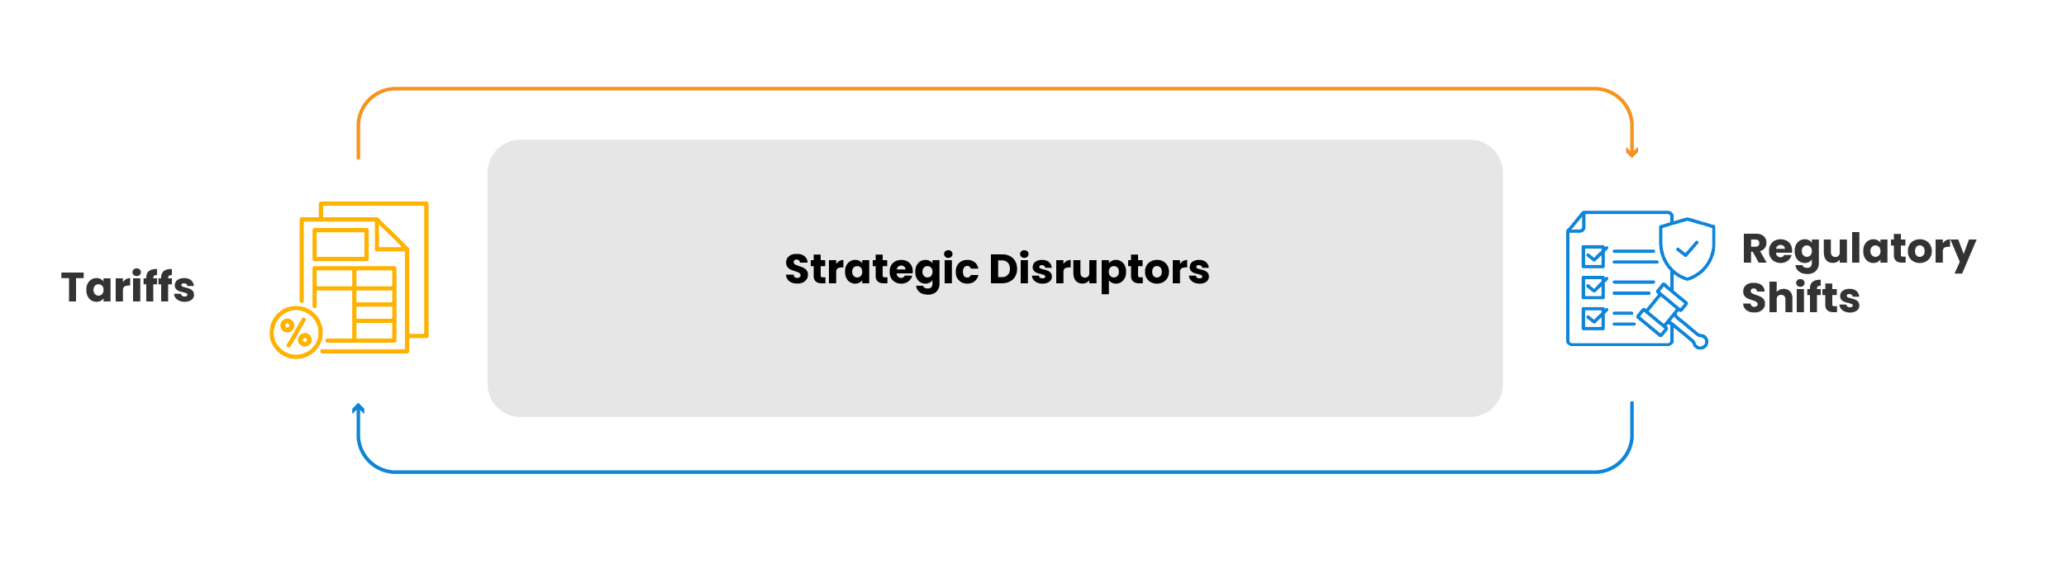
Tariffs can spike landed costs overnight, regulations rewrite labelling rules, and competitors slash prices before your team finishes its daily stand-up. And yet, some consumer brands thrive.
The winning brands see changes early, decide quickly, and execute flawlessly across the digital shelf. This post blends three decades of pricing and merchandising expertise with timely digital shelf insights from DataWeave, offering a clear path forward for brands navigating today’s volatile retail environment.
From Cost Shock to Chronic Uncertainty
Tariffs are no longer just one-off headlines; they’ve become an unpredictable, ongoing variable in the global marketplace. The true challenge isn’t always the duty rate itself, but the constant whiplash of not knowing if, when, or how much that duty will change. This pervasive uncertainty is having a tangible impact:
Unpredictable Competitive Response: Delaying price moves while watching competitors can erode margins as much as tariffs.
To stay ahead, pricing decisions must be stress-tested against multiple tariff scenarios and aligned with likely competitor reactions. Timing matters as much as accuracy, move too soon or too late, and margins suffer either way.
The Tariff Math No One Can Afford to Get Wrong
When it comes to tariff disruption, the difference between profit and loss often hinges on a precise understanding of a three-step process. Get any part of this chain wrong, and the financial ripple effect can undermine pricing and promotions. The duty you pay, therefore, is the direct result of the following three critical steps:
Step 1: Harmonized System (HS) Code
What it is: A six- to ten-digit classifier that drills down to product sub-types.
Why it matters: A single digit change can shift an item into a higher-tariff bracket.
Step 2: Country of Origin
What it is: The nation in which the imported item was made.
Why it matters: Mis-tagging the origin can lead to mis-pricing and inaccurate margin calculations.
Step 3: Trade-Agreement Overlay
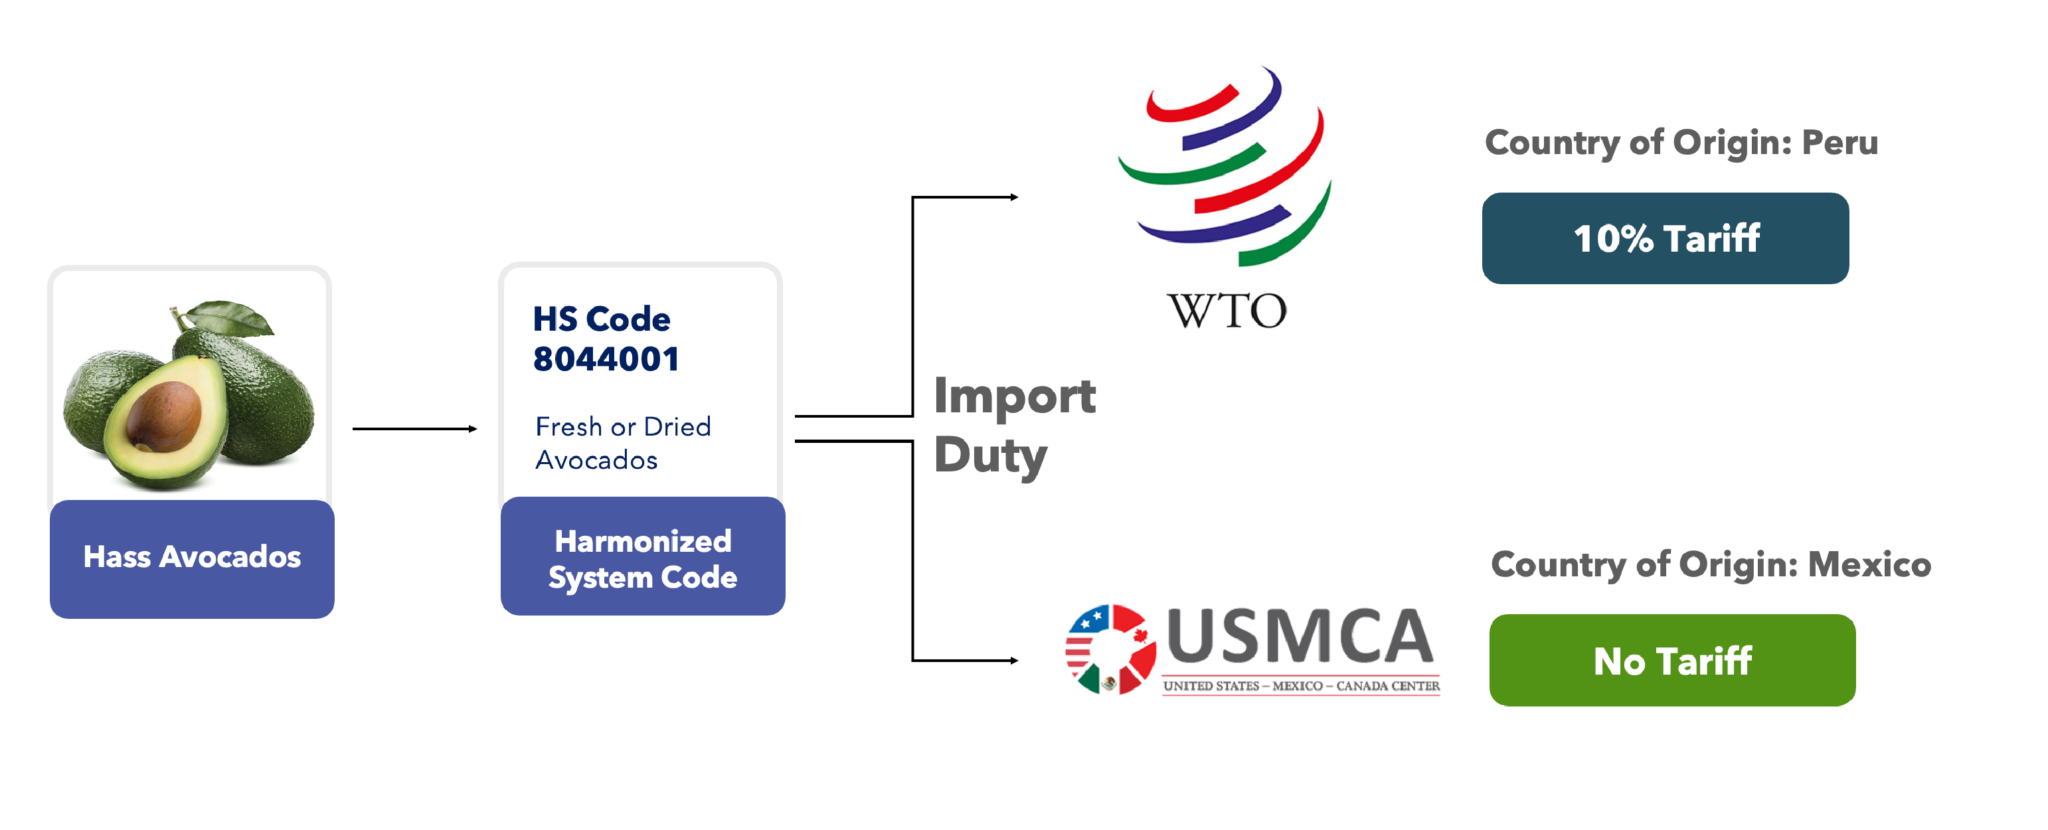
What it is: Differentiation between the World Trade Organization (WTO) baseline tariffs and special trade agreements (e.g., USMCAUnited States-Mexico-Canada Agreement).
Why it matters: The same HS code can result in significantly different duties, up to a 10% swing, depending on the originating country (see the example below).
This isn’t just about paying the correct duty; it’s about safeguarding your bottom line in a global marketplace where every digit and every designation carries substantial weight.
The wrong origin, the wrong rule, the wrong margin.
Hard Numbers: Where Prices Are Already Climbing
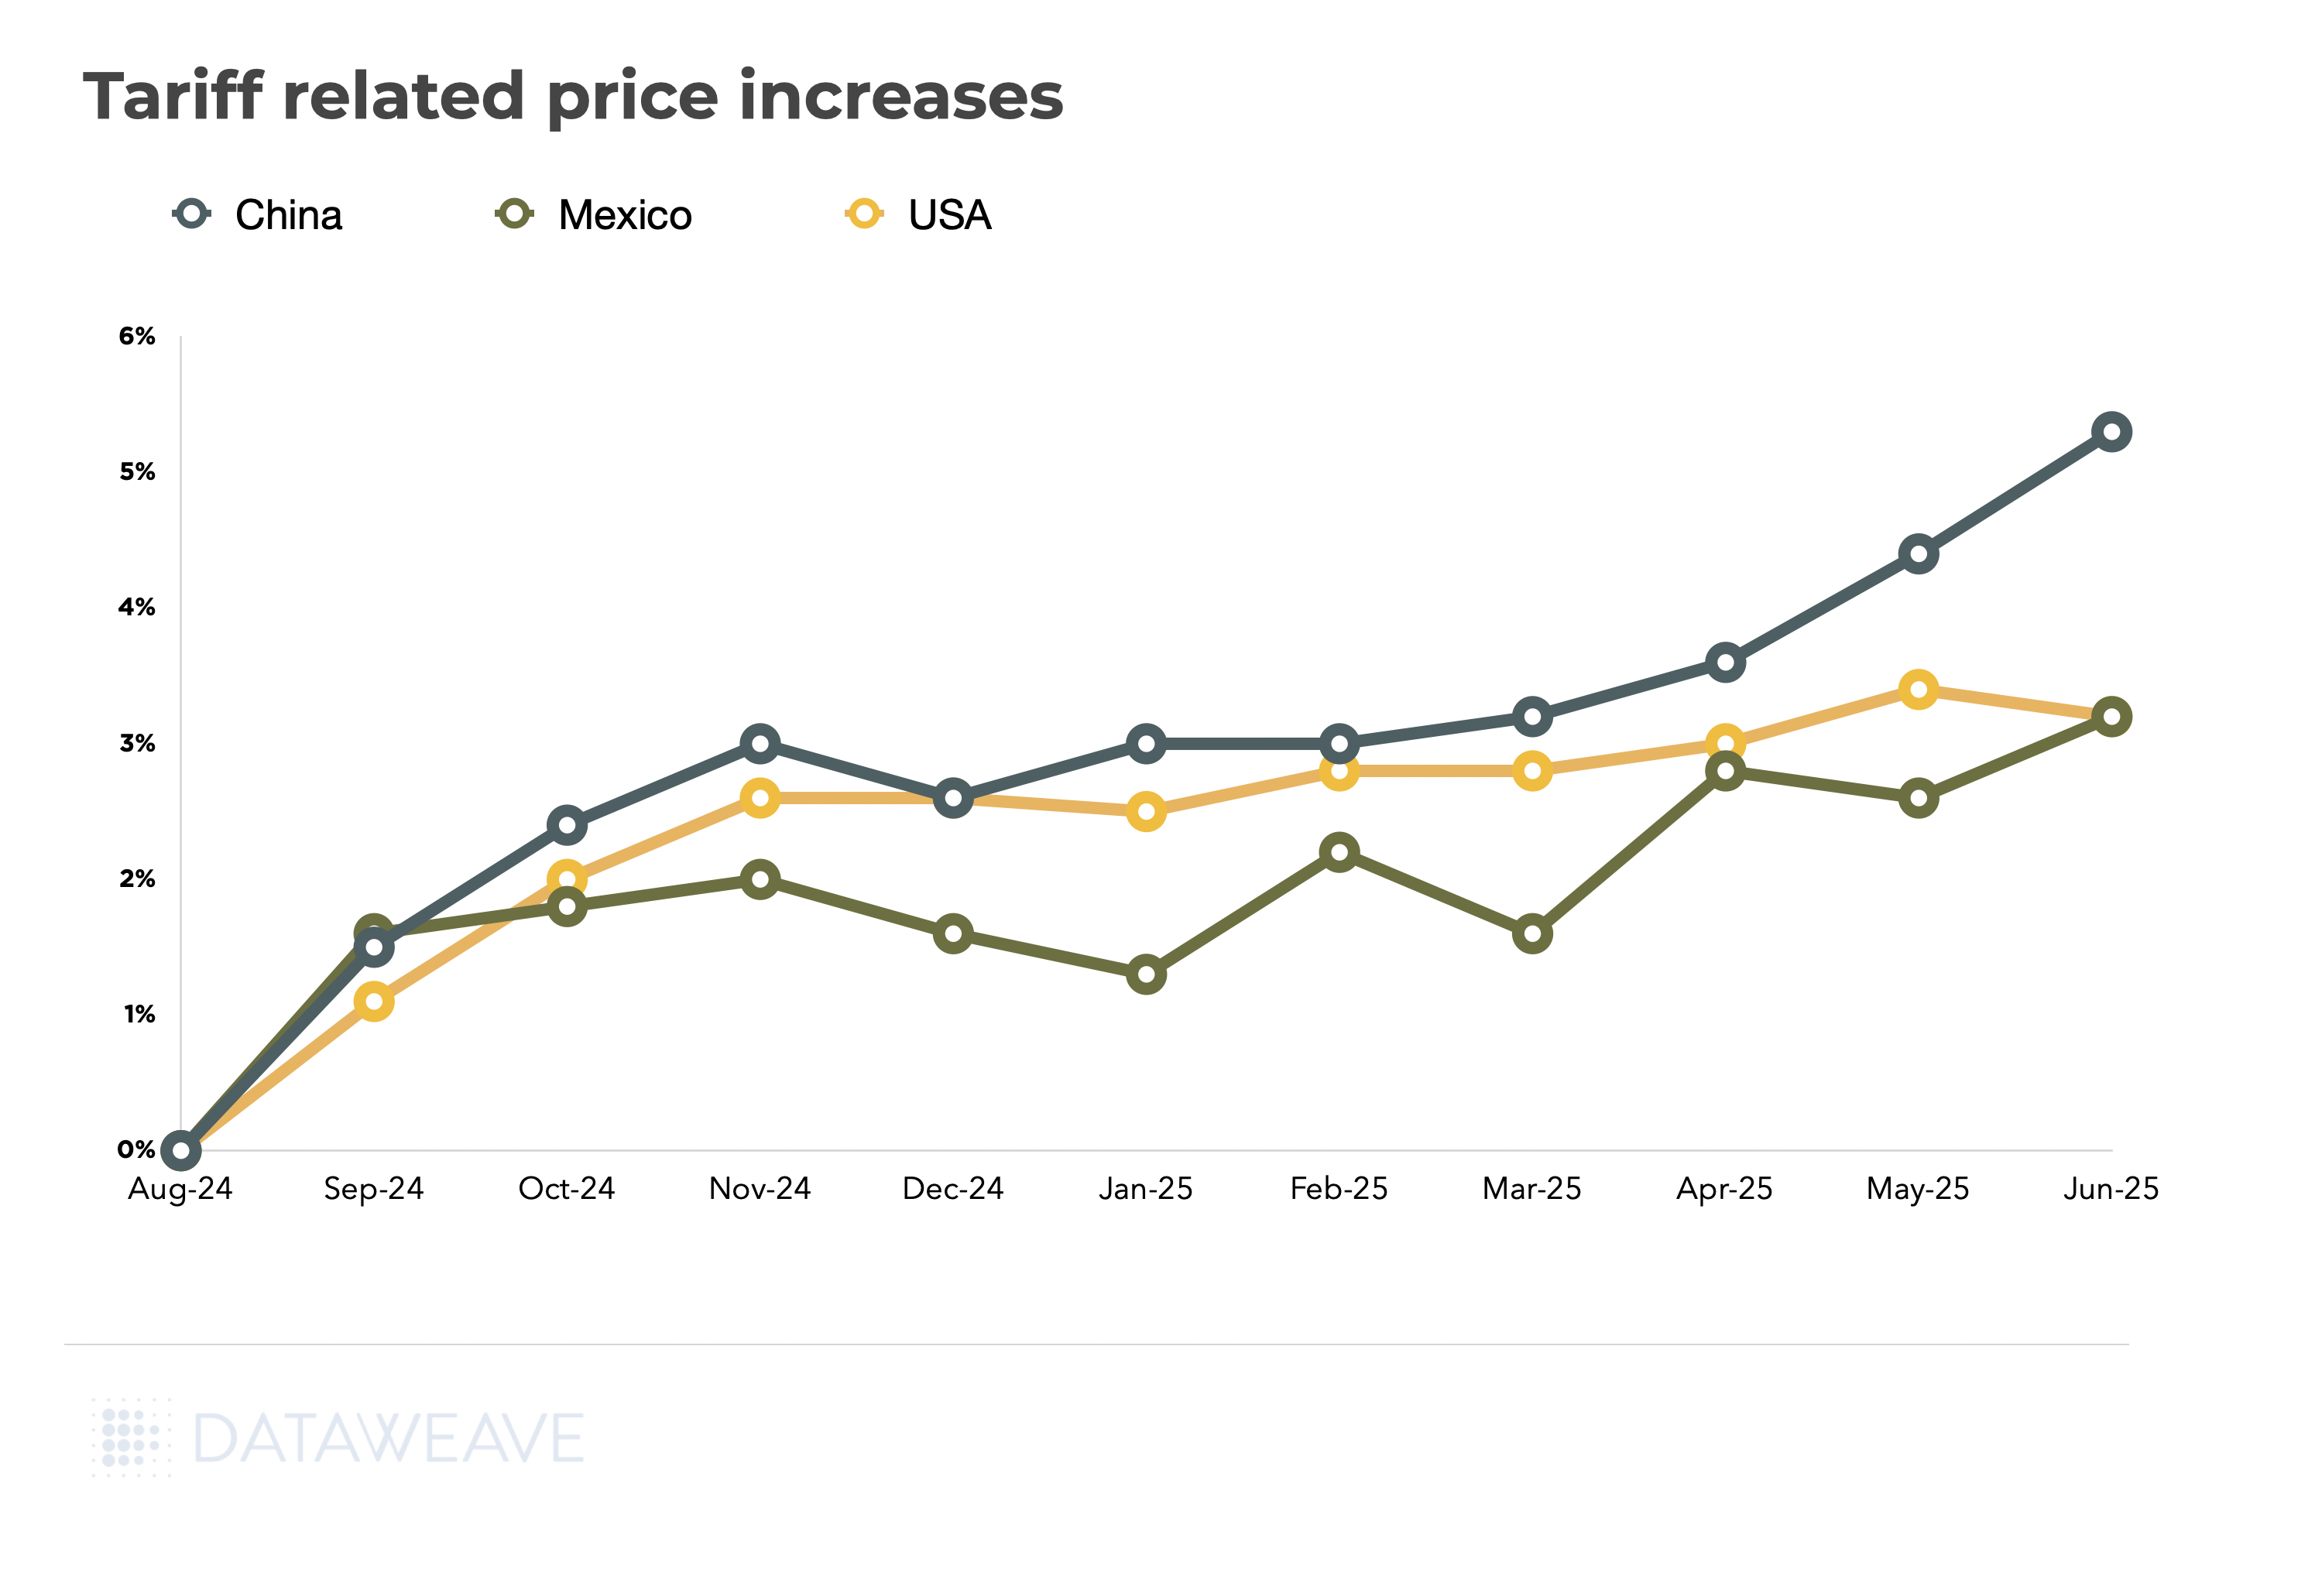
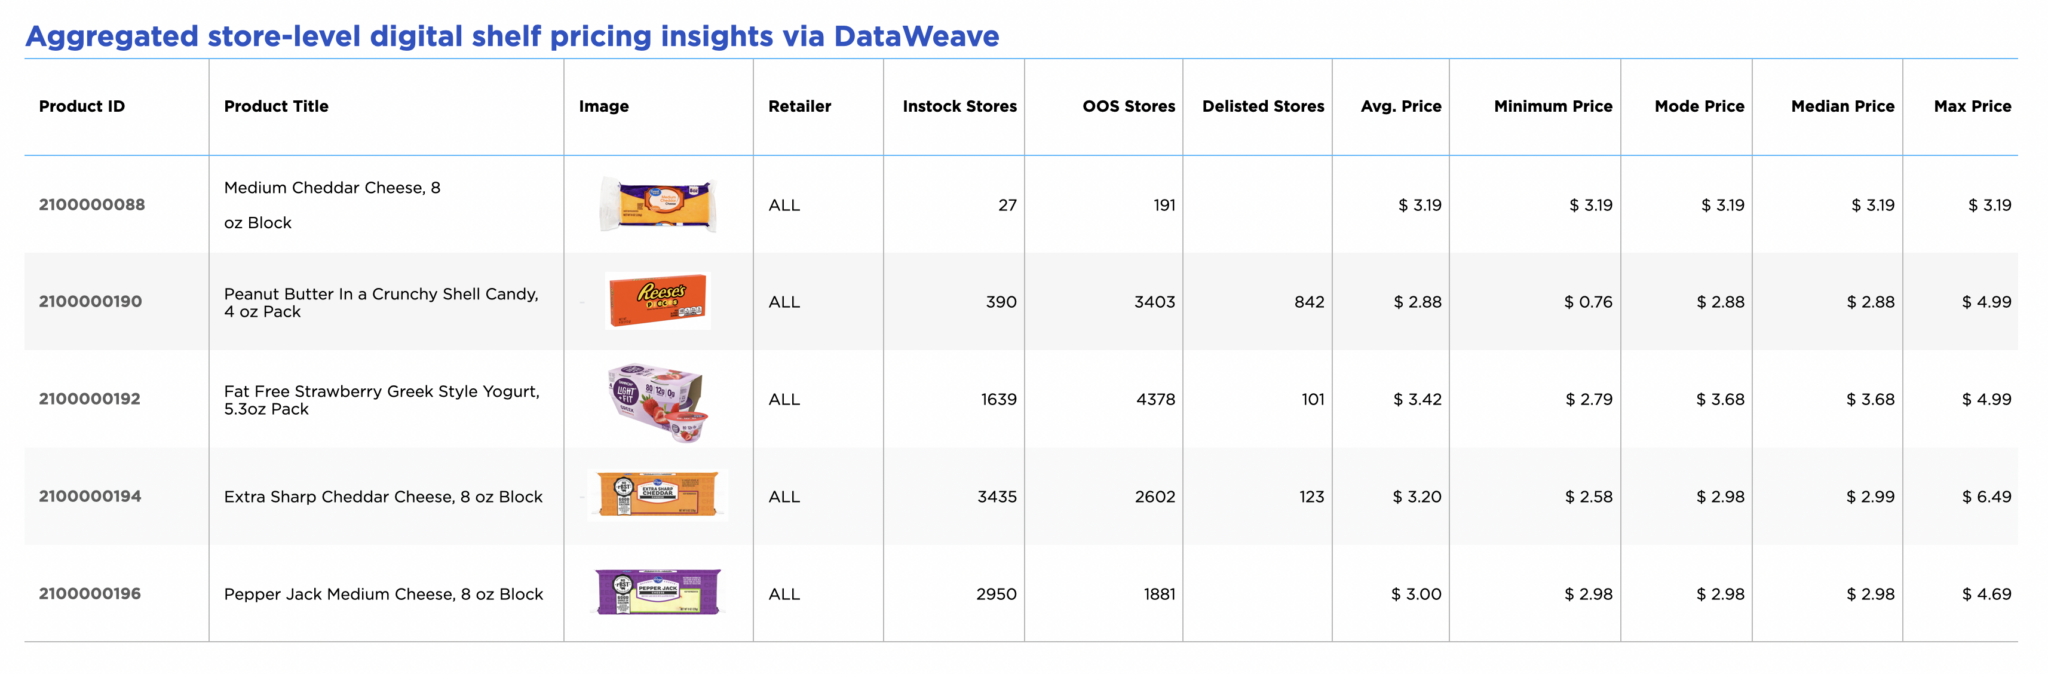
DataWeave’s latest digital shelf analysis shows import-driven price inflation diverging sharply by source country.
The intricate dance of HS codes, country of origin, and trade agreements directly translates into the prices consumers see. And the data doesn’t lie. Below, we delve into the hard numbers: where prices are already climbing, as illuminated by DataWeave’s latest digital shelf monitoring, showing significant import-driven price inflation by source country.
China: Products sourced from China are up 5%. This is largely attributable to the numerous tariffs currently imposed on Chinese goods.
Mexico: Prices for products from Mexico have risen by 3%.
United States: Interestingly, even U.S.-sourced products show a 3% increase.
This rise in U.S. product prices might seem counterintuitive if tariffs are solely focused on imports. However, the reality lies in the global supply chain for many products.
Consider guacamole as an example: While the final product might be “Made in the USA,” its components often come from various international sources. Avocados might be imported from Mexico, lime juice from Central America, and seasonings from India or China. Even packaging could originate in Asia. Each of these imported components can be subject to tariffs. Therefore, even if an item is assembled in the U.S., the tariffs on its constituent parts contribute to an overall price increase, explaining the rising rates for U.S.-sourced goods.
Action step: Map tariff exposure at both finished-goods and component-level to avoid “Made in USA” blind spots.
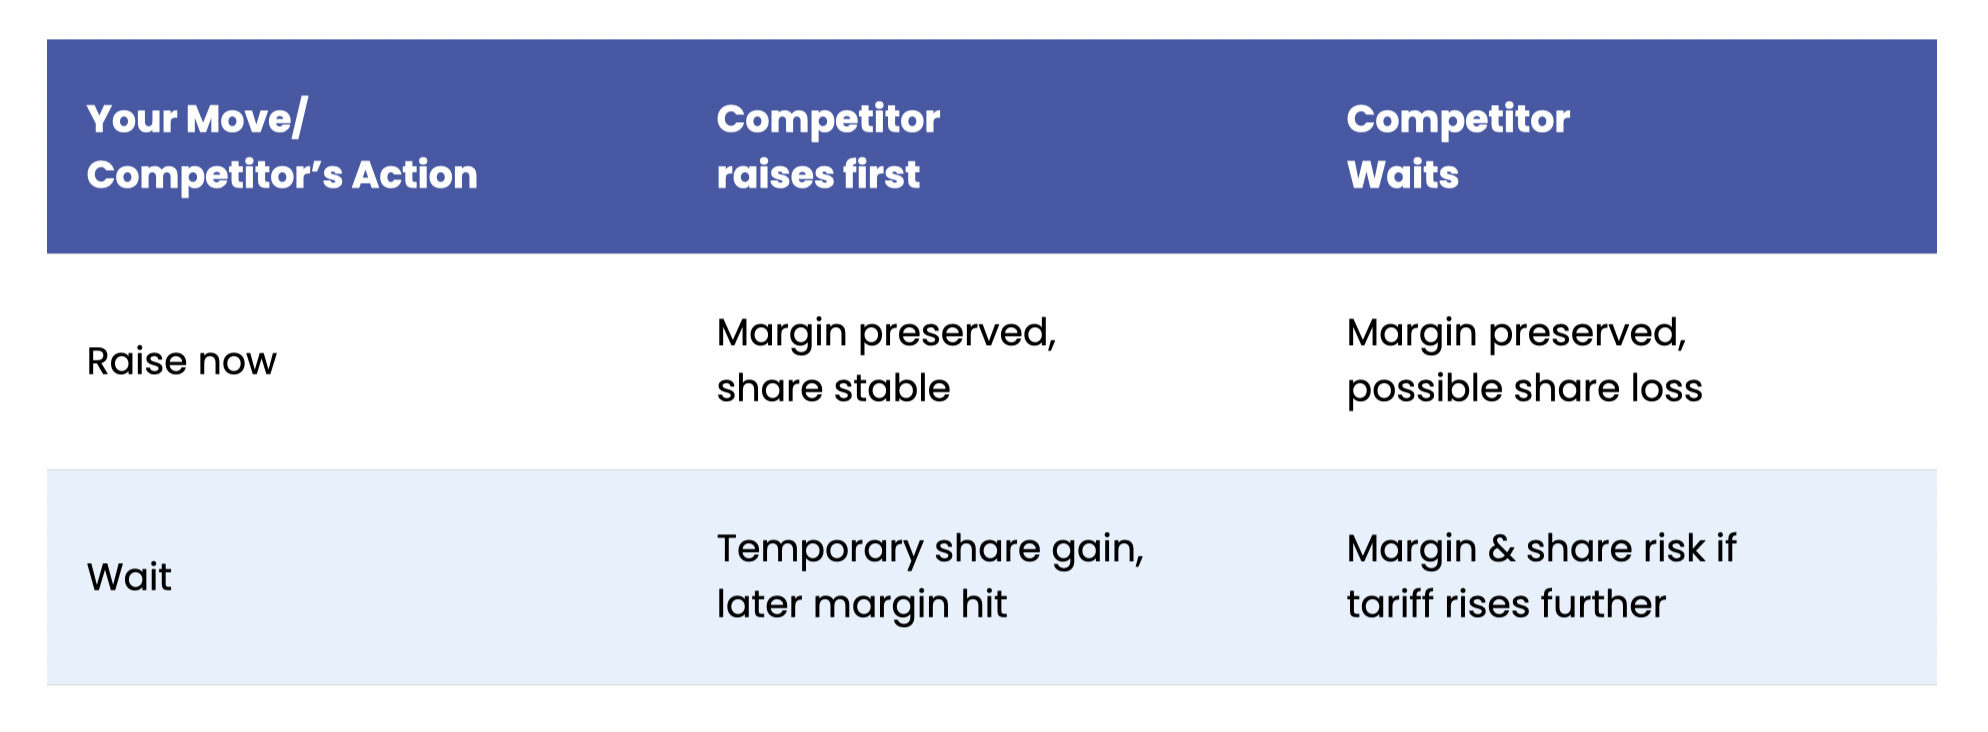
Timing Is a Competitive Weapon
With duty tables and competitor reactions changing fast, the question is: move first or follow? Early movers recoup cost fastest but risk overshooting if tariffs ease; laggards may enjoy a brief price advantage but suffer sudden margin compression.
The Strategic Dilemma
The table below illustrates this strategic choice and its potential outcomes:
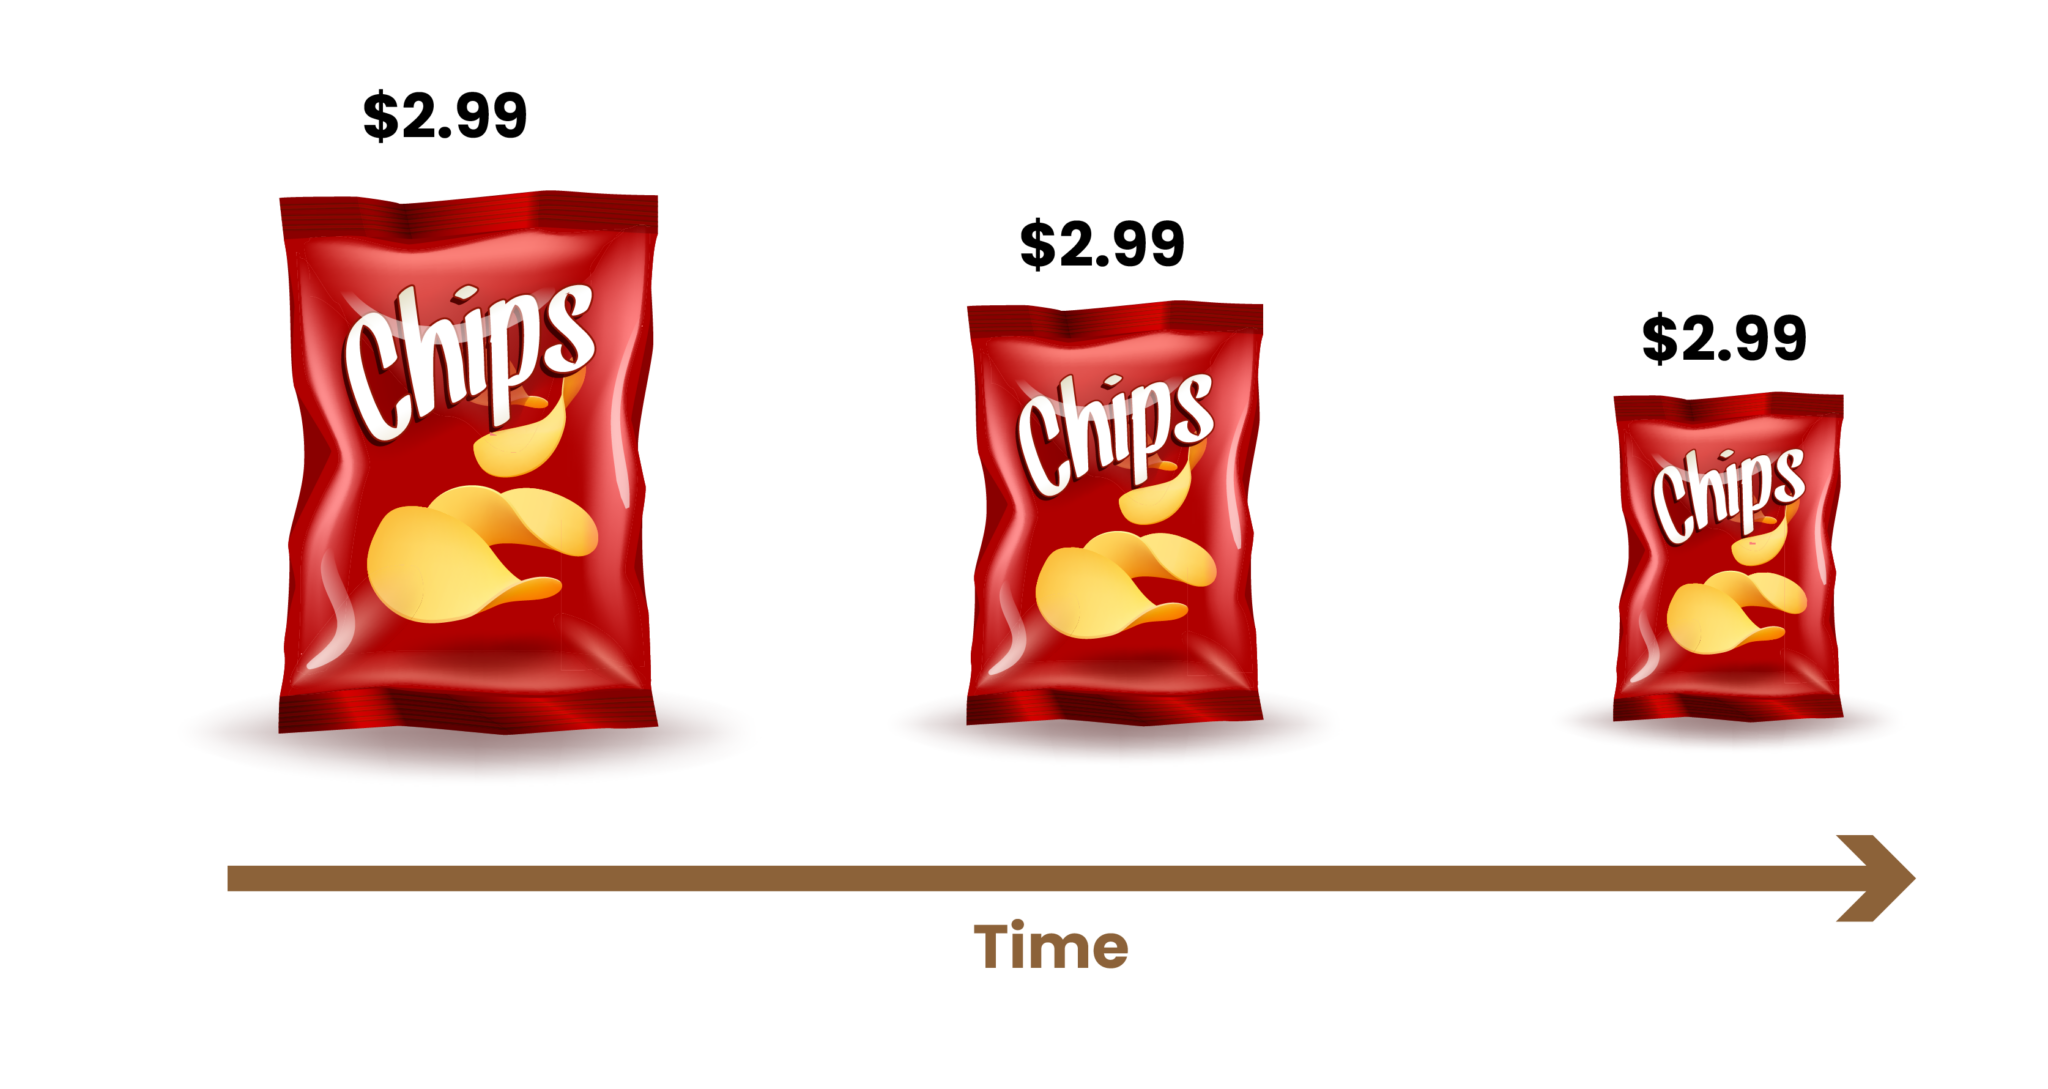
Shrinkflation: Margin Patch or Trust Erosion?
Beyond direct price adjustments, many brands are turning to shrinkflation to manage tariff-driven cost pressure, shaving net weight instead of hiking prices. DataWeave’s analysis reveals an average package reduction of 5 – 6%, with extreme cases reaching 15 – 25%, sometimes even coupled with a shelf-price increase.
While this can cushion immediate margin, it comes at a significant cost: brand credibility. Savvy shoppers quickly spot these changes, sharing “before-and-after” photos online and fueling consumer frustration. What begins as a margin patch can rapidly erode trust and damage long-term loyalty.
Ultimately, navigating this volatile environment requires dynamic intelligence and a holistic pricing strategy that balances profitability with market share and, crucially, consumer trust.
Price Hikes May be Inevitable, But You Can Still Run Your Digital Shelf
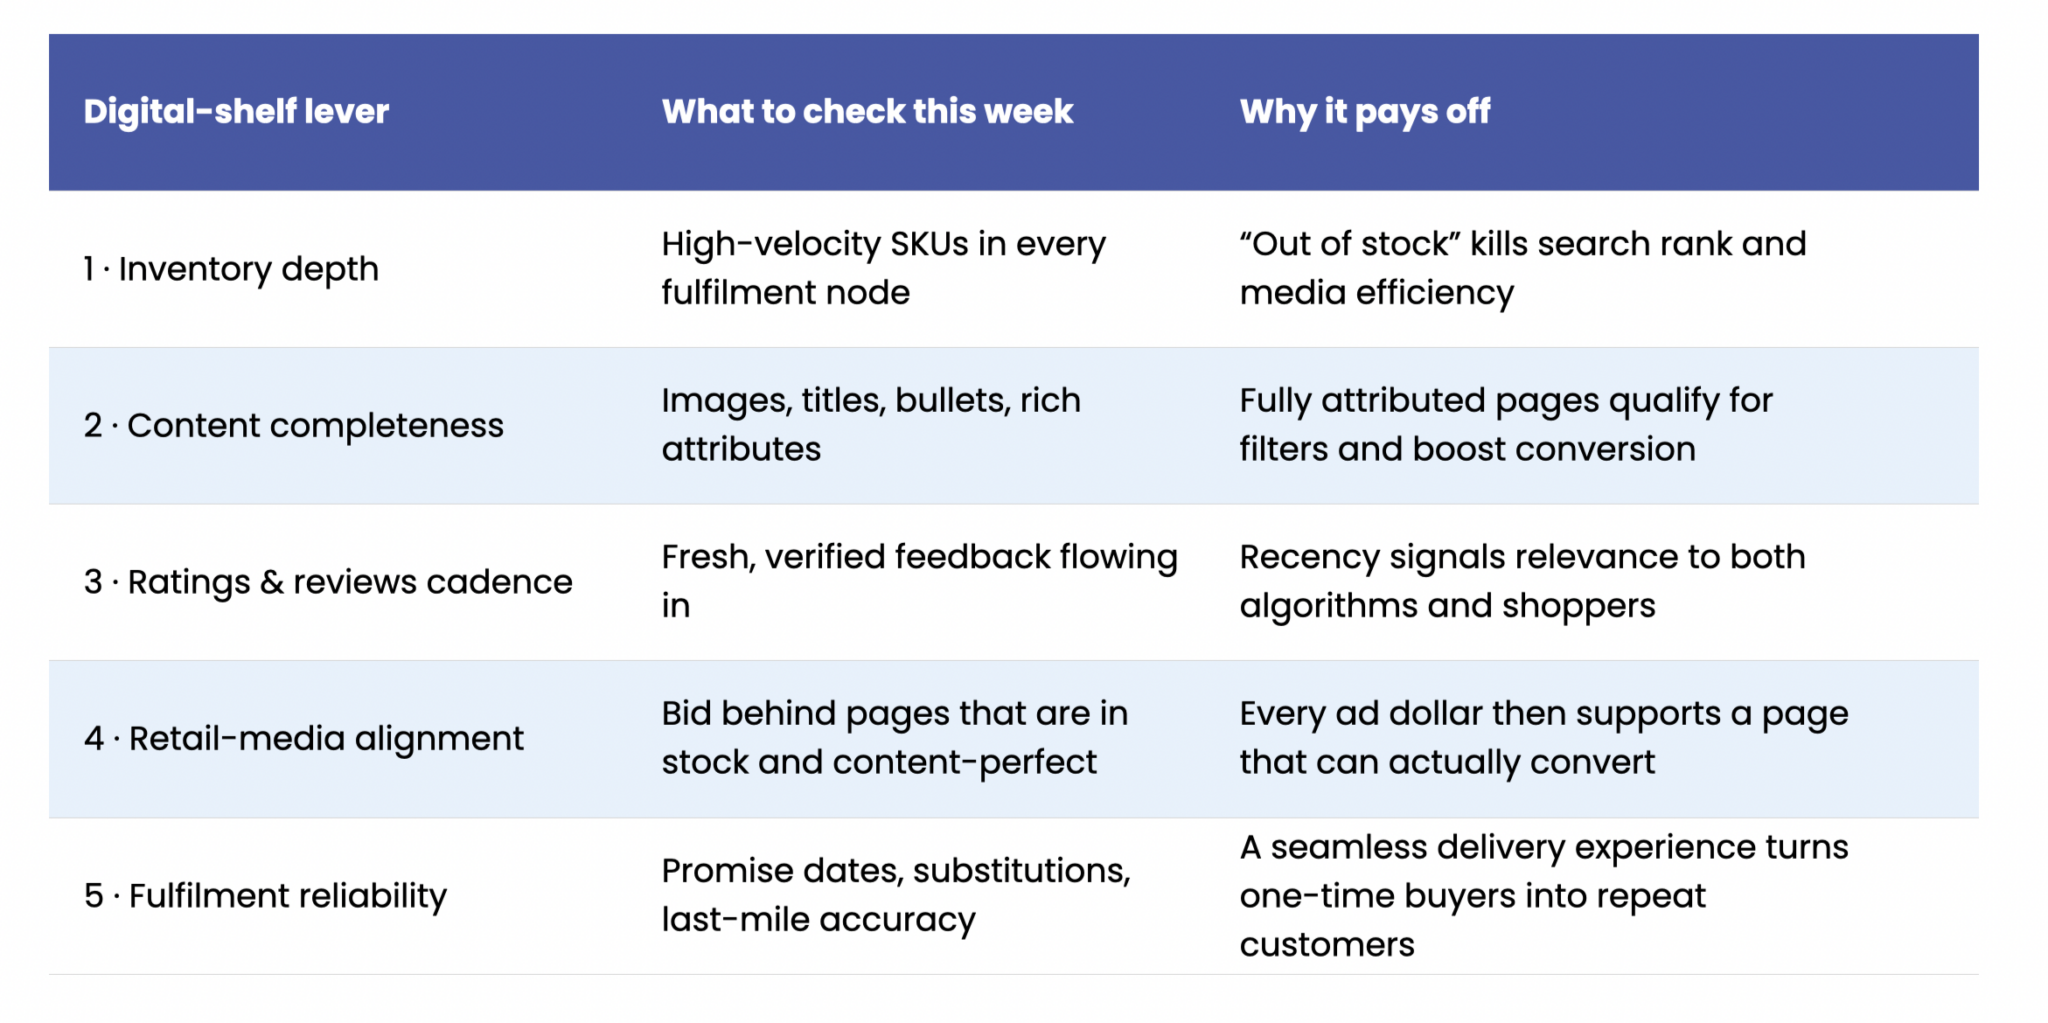
Tariff‑driven cost pressure can force list‑price increases, but it does not dictate how well your products show up, sell through, or satisfy shoppers online. Those outcomes still hinge on five levers that live entirely inside your control. Master them and you cushion margin hits while protecting (or even expanding) share.
The Five Levers of Digital‑Shelf Control
Inventory Depth – Maintain online in‑stock rates above 95 percent for high‑velocity SKUs and flag substitute logic when unavoidable out‑of‑stocks occur.
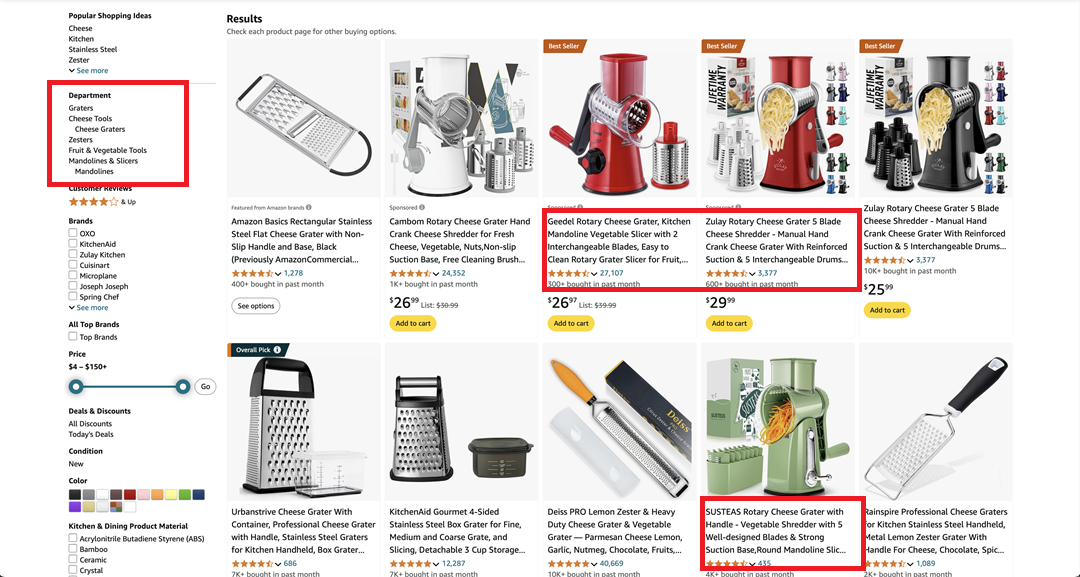
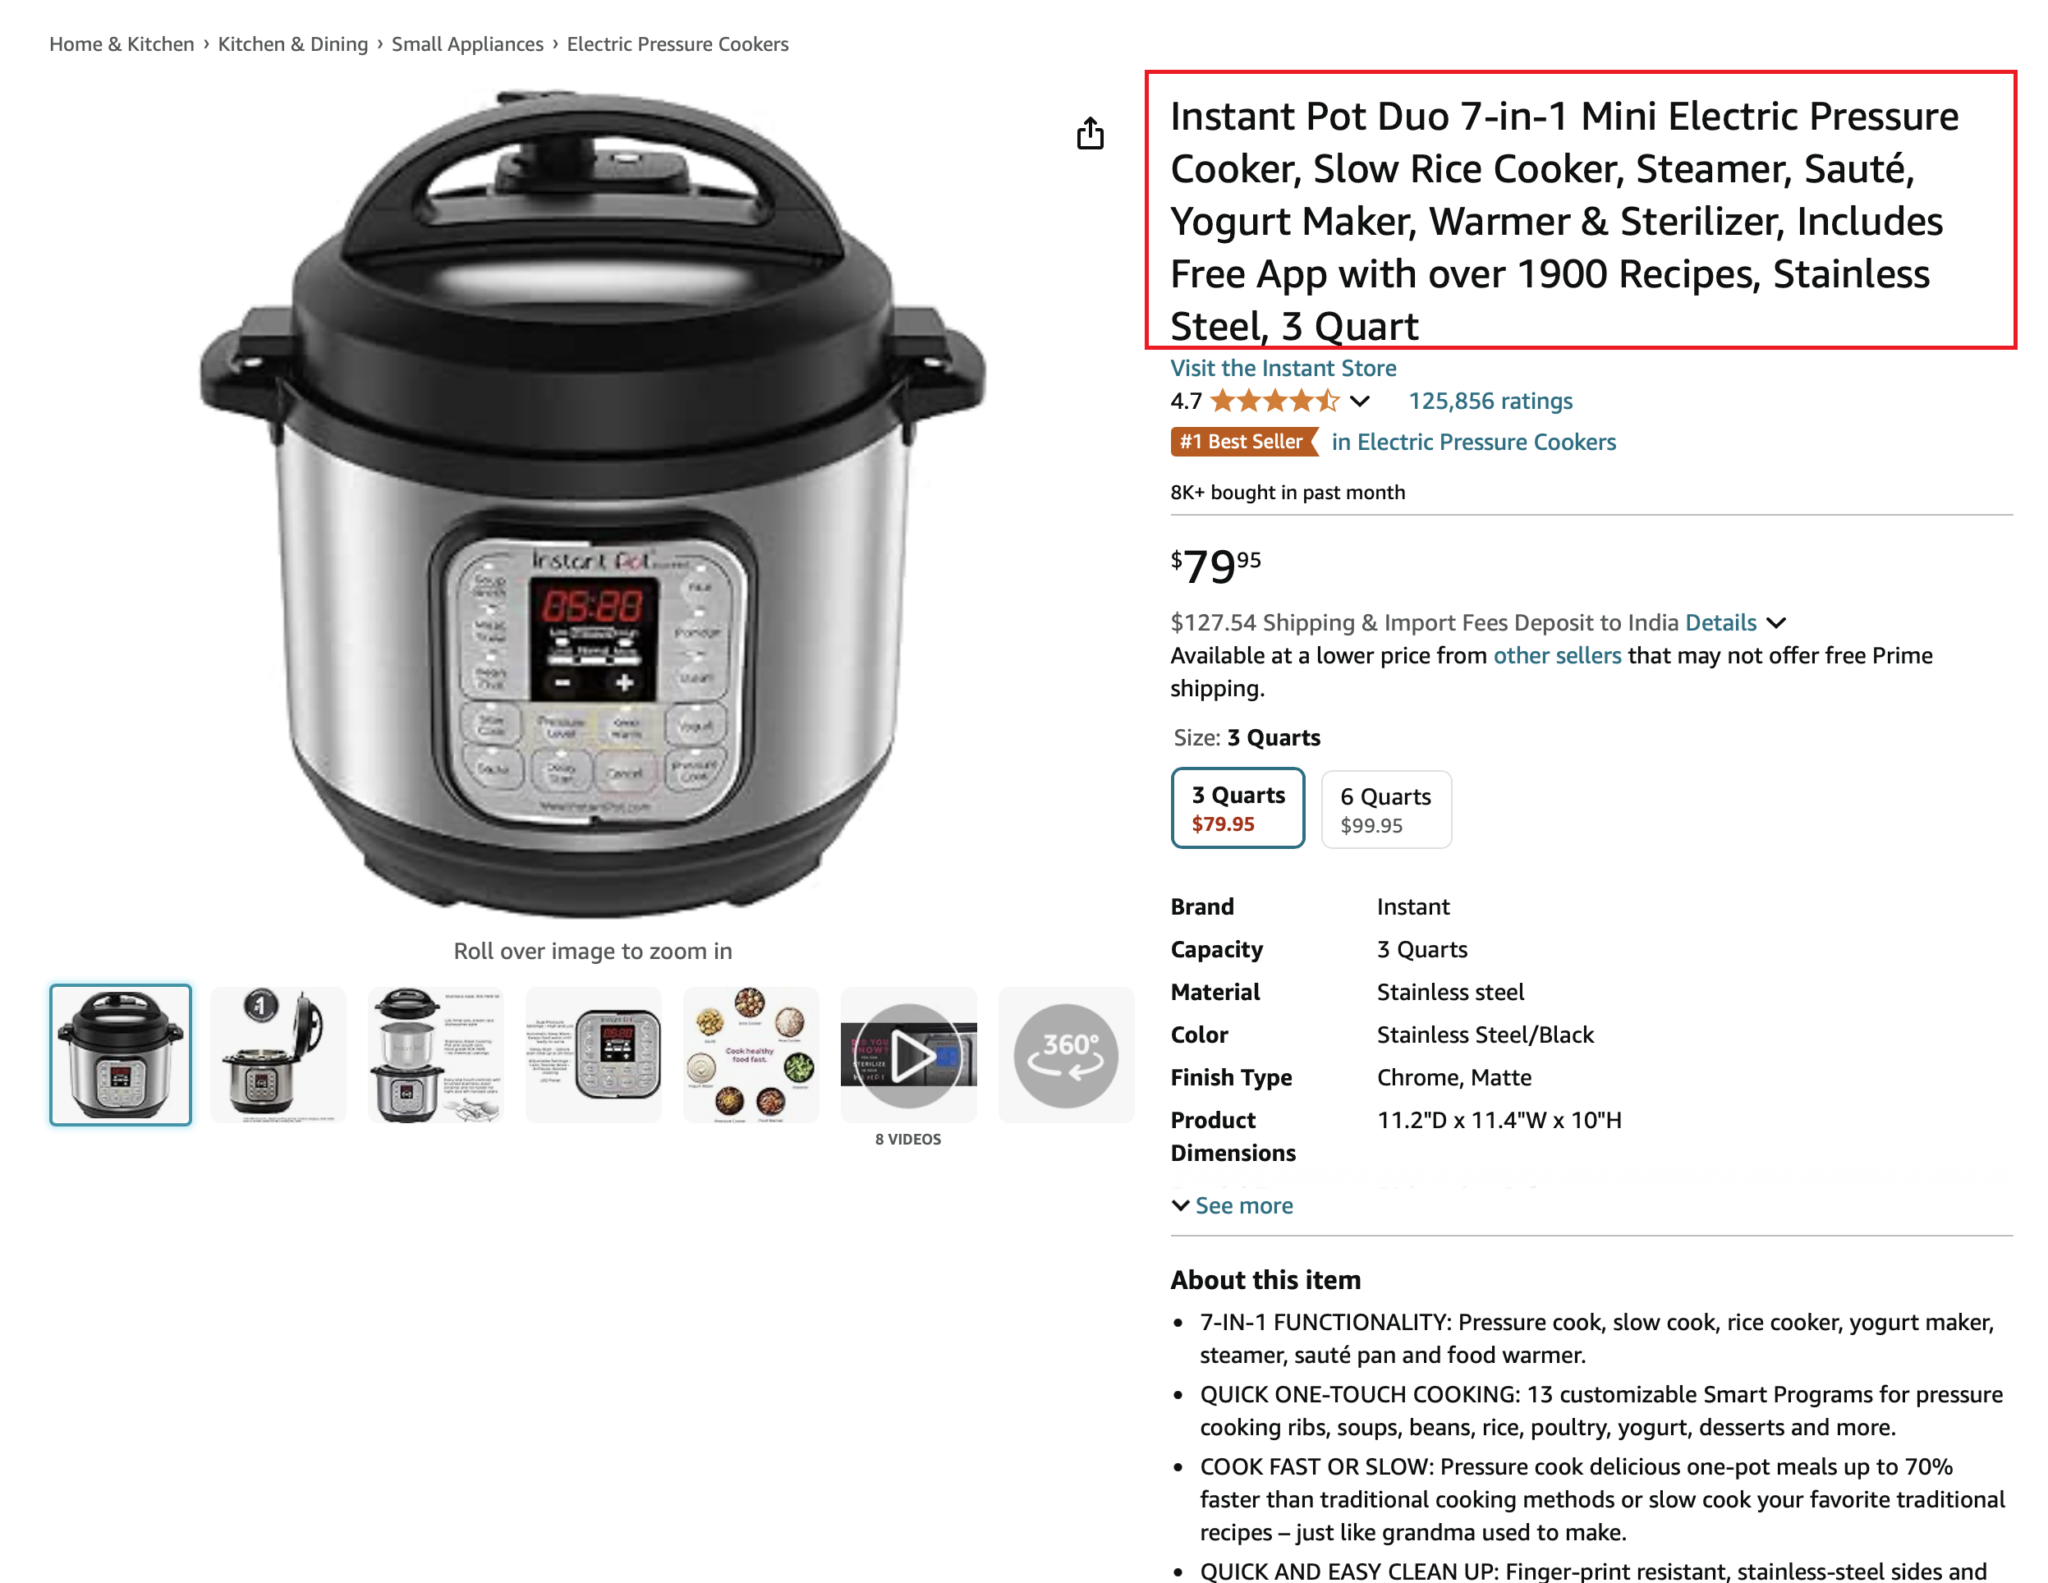
Content Quality & Accuracy – Keep titles keyword‑rich, imagery crisp, and attributes complete so search filters never bury you.
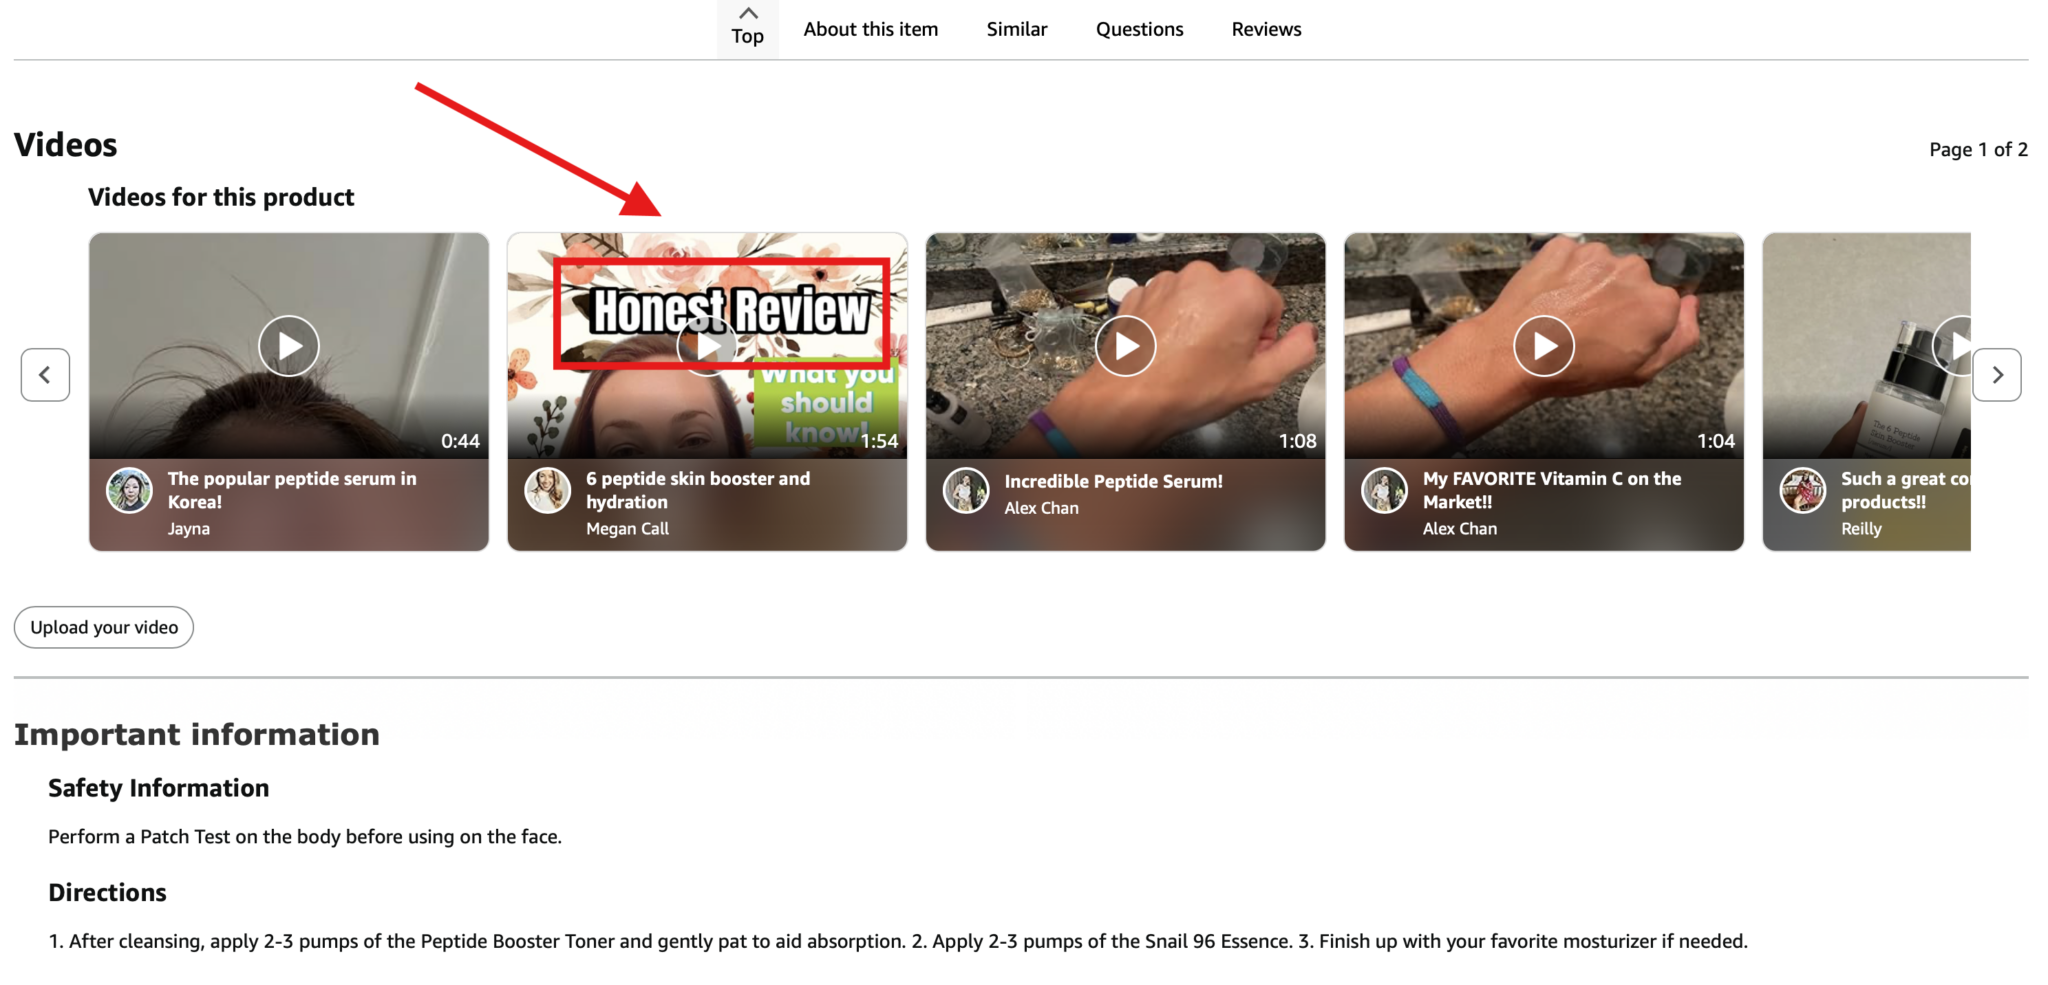
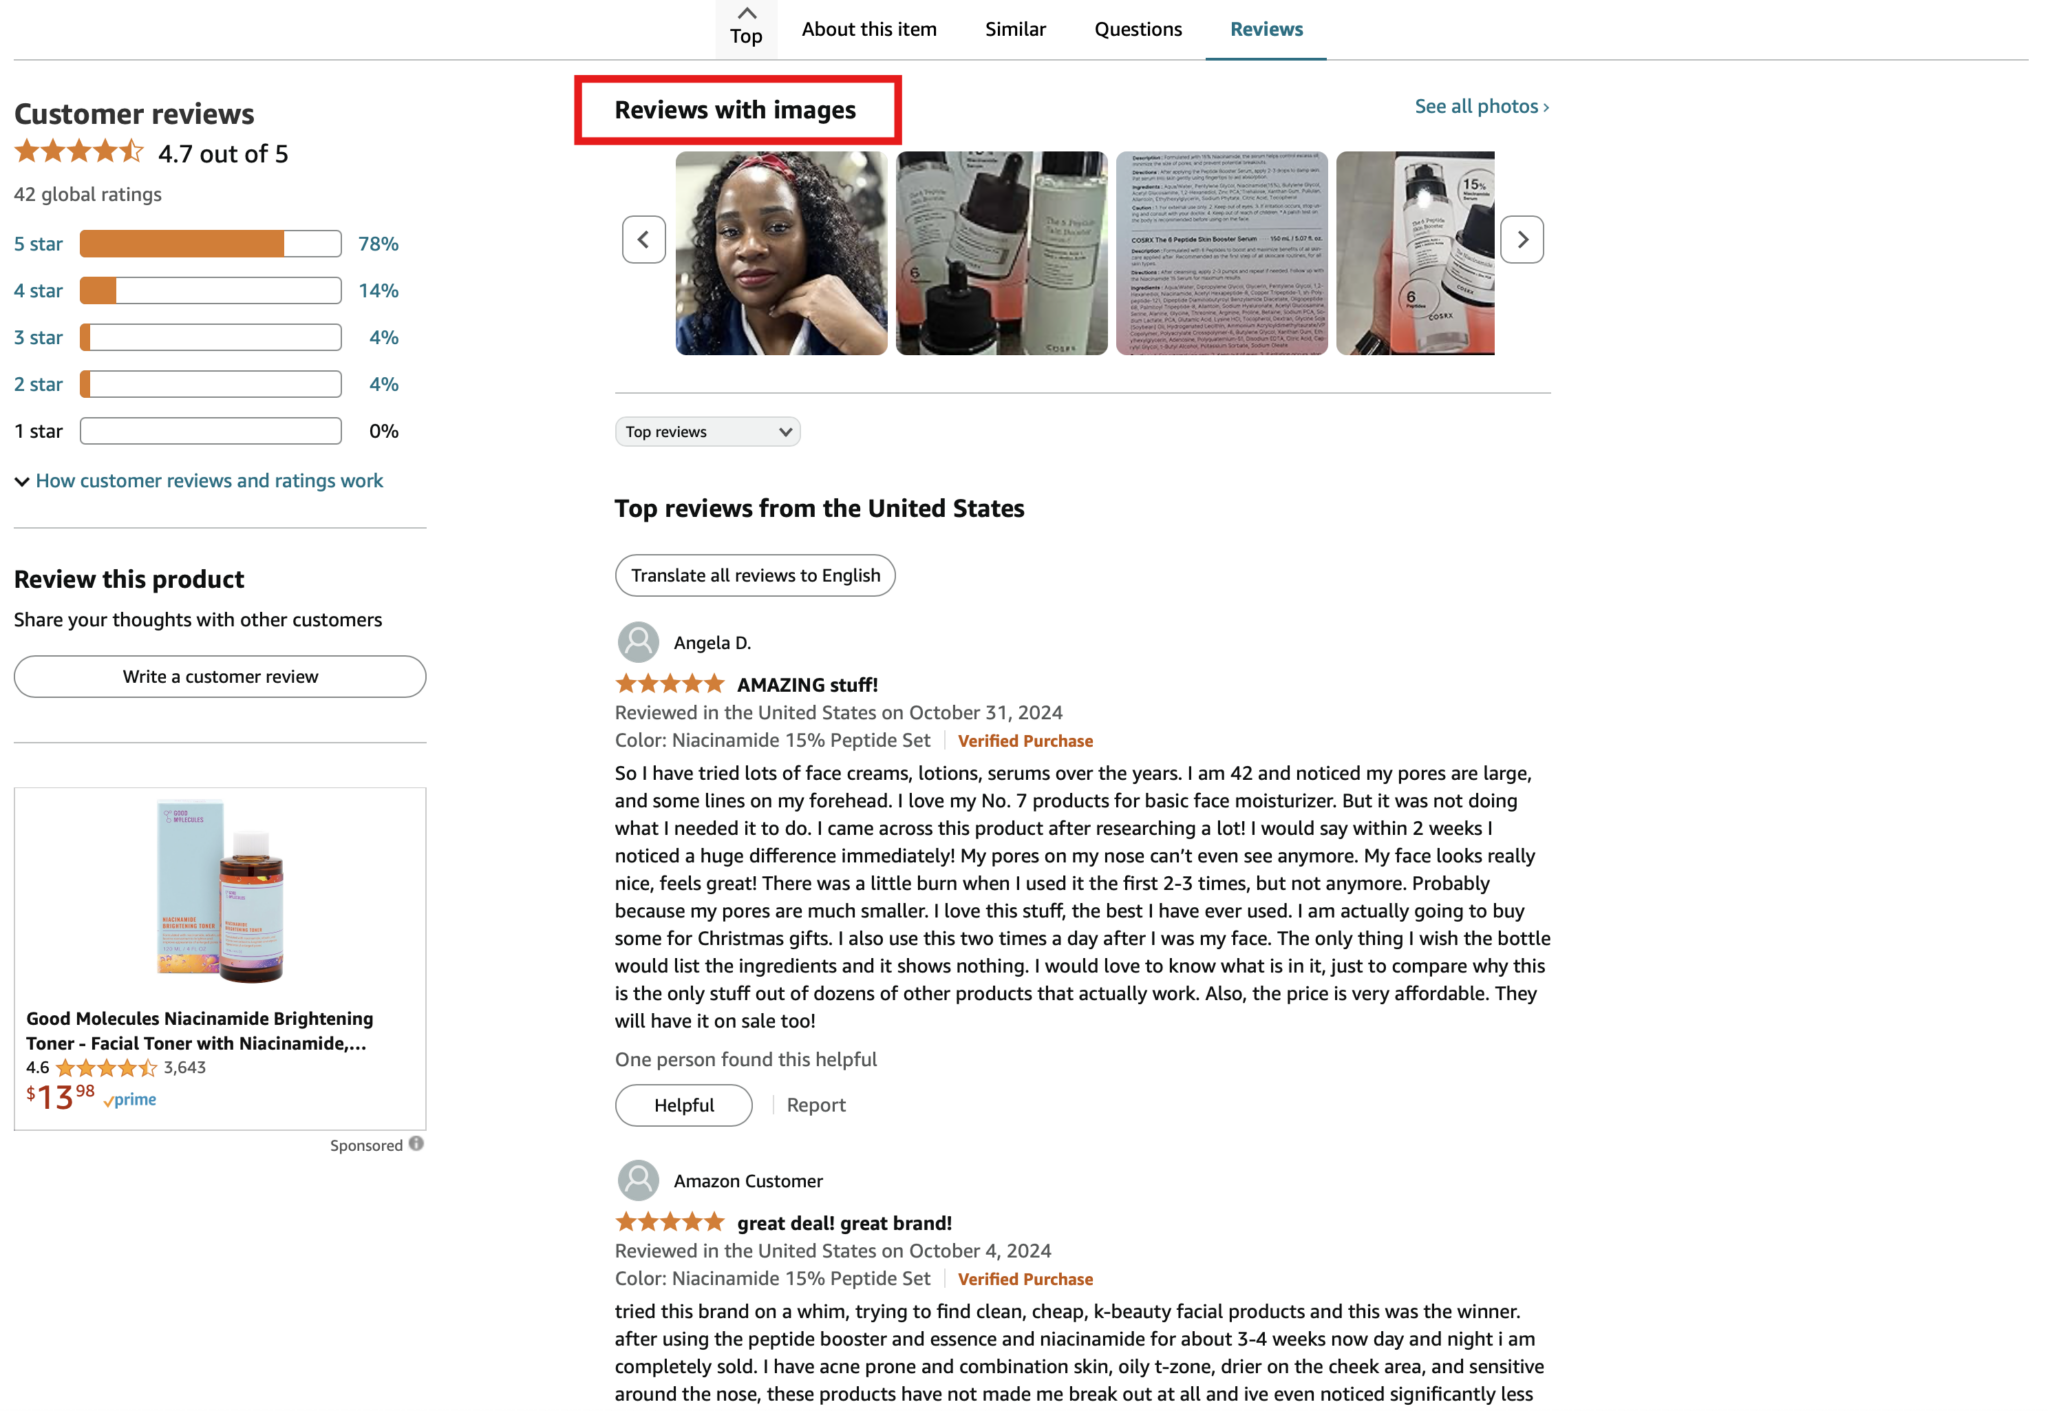
Ratings & Reviews Cadence – Proactively request fresh reviews to earn retailer search boosts and reassure value‑conscious shoppers.
Retail‑Media Precision – Bid where pages are healthy and in‑stock; pause spend on broken listings that leak conversion and ROAS.
Fulfillment Excellence – Monitor pick‑pack accuracy, on‑time delivery, and substitution rates; each one influences retailer algorithmic visibility.
Content Hygiene Keeps You Visible, Compliant, and Conversion-Ready
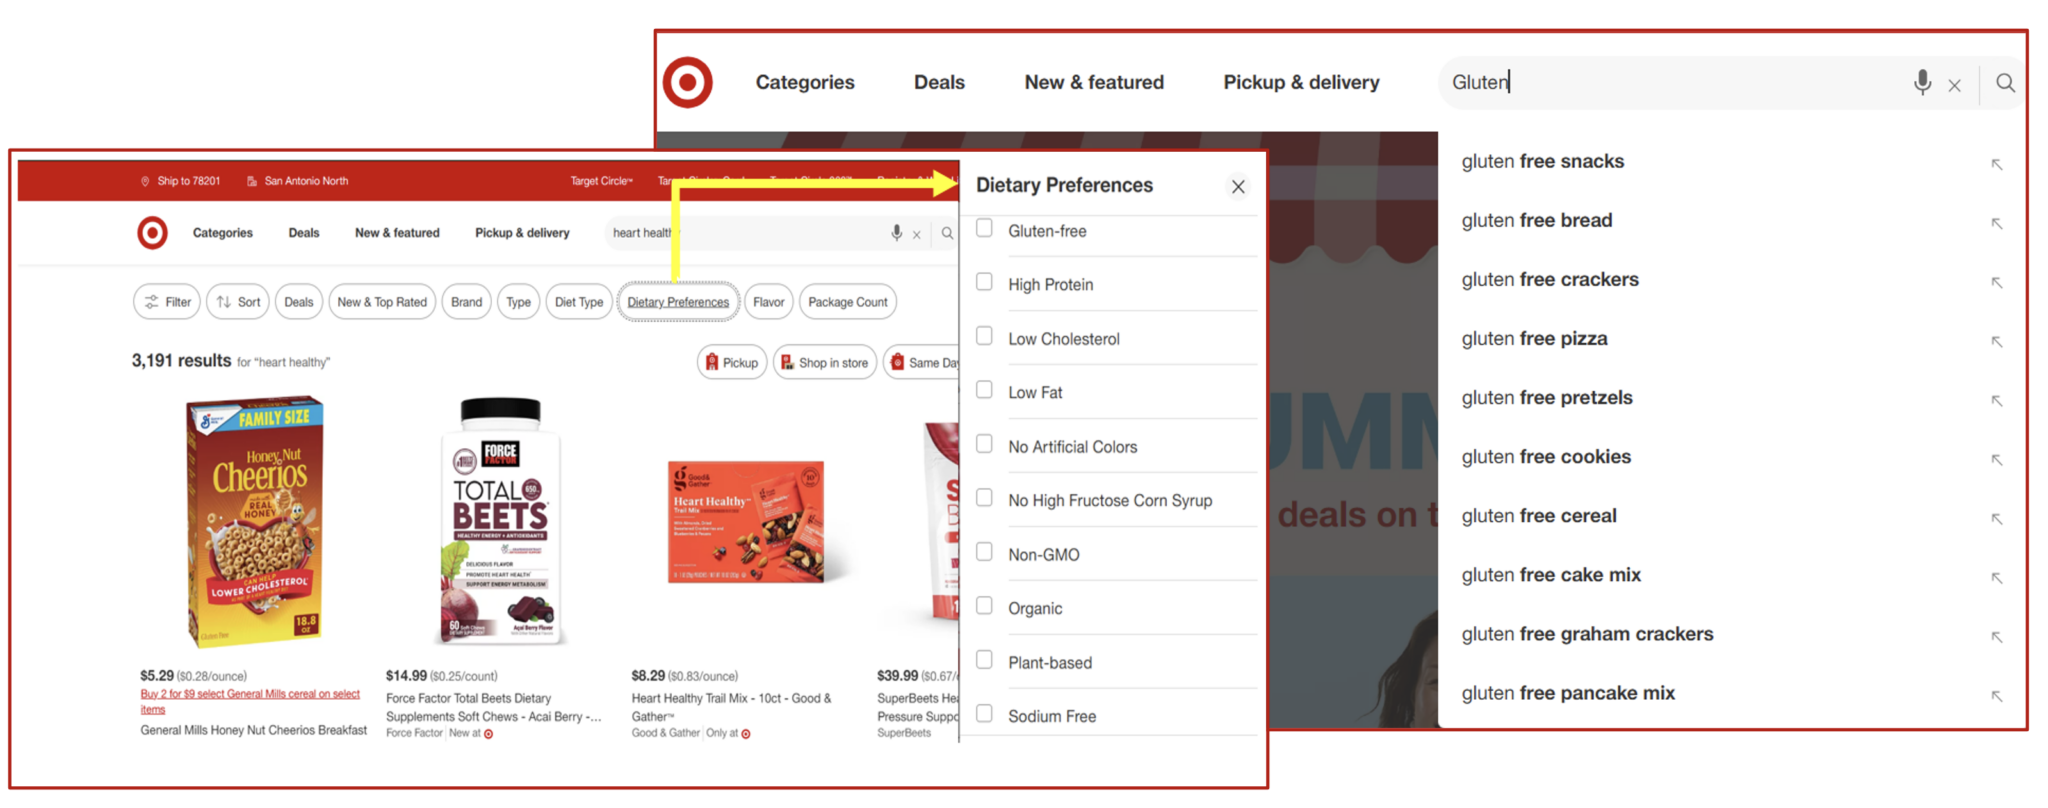
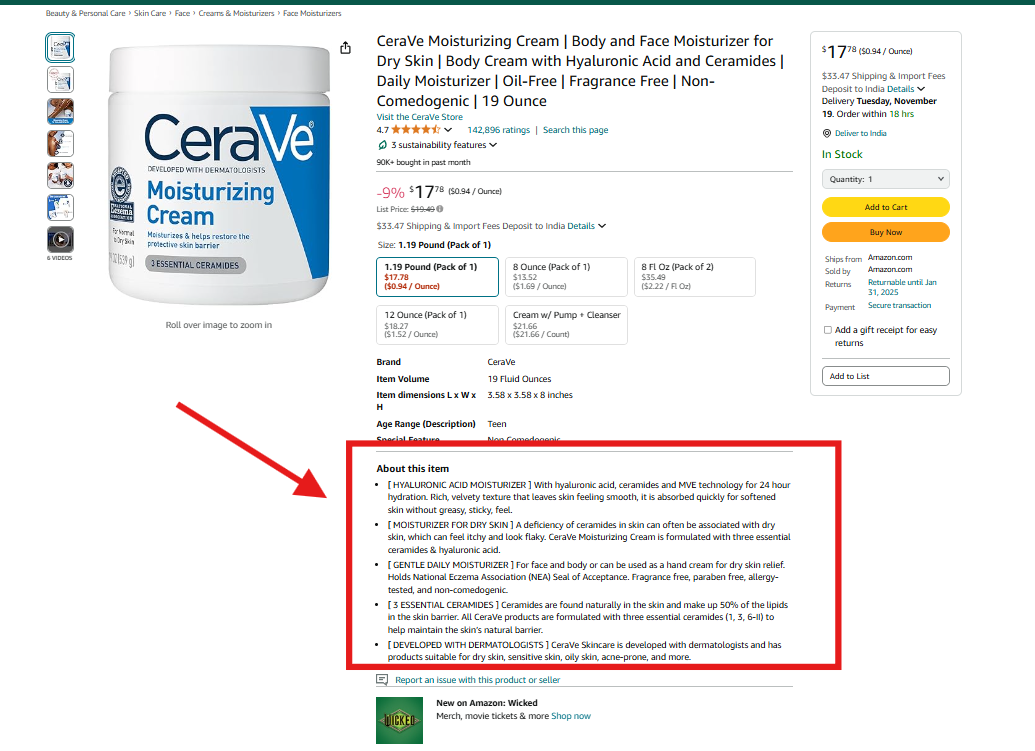
Missing or incorrect product attributes (e.g., “gluten-free,” “caffeine content”) can swiftly jeopardize both regulatory compliance and your product’s fundamental search visibility. Simply put, if it’s not labeled right, it won’t be found.
This impact plays out in two crucial areas:
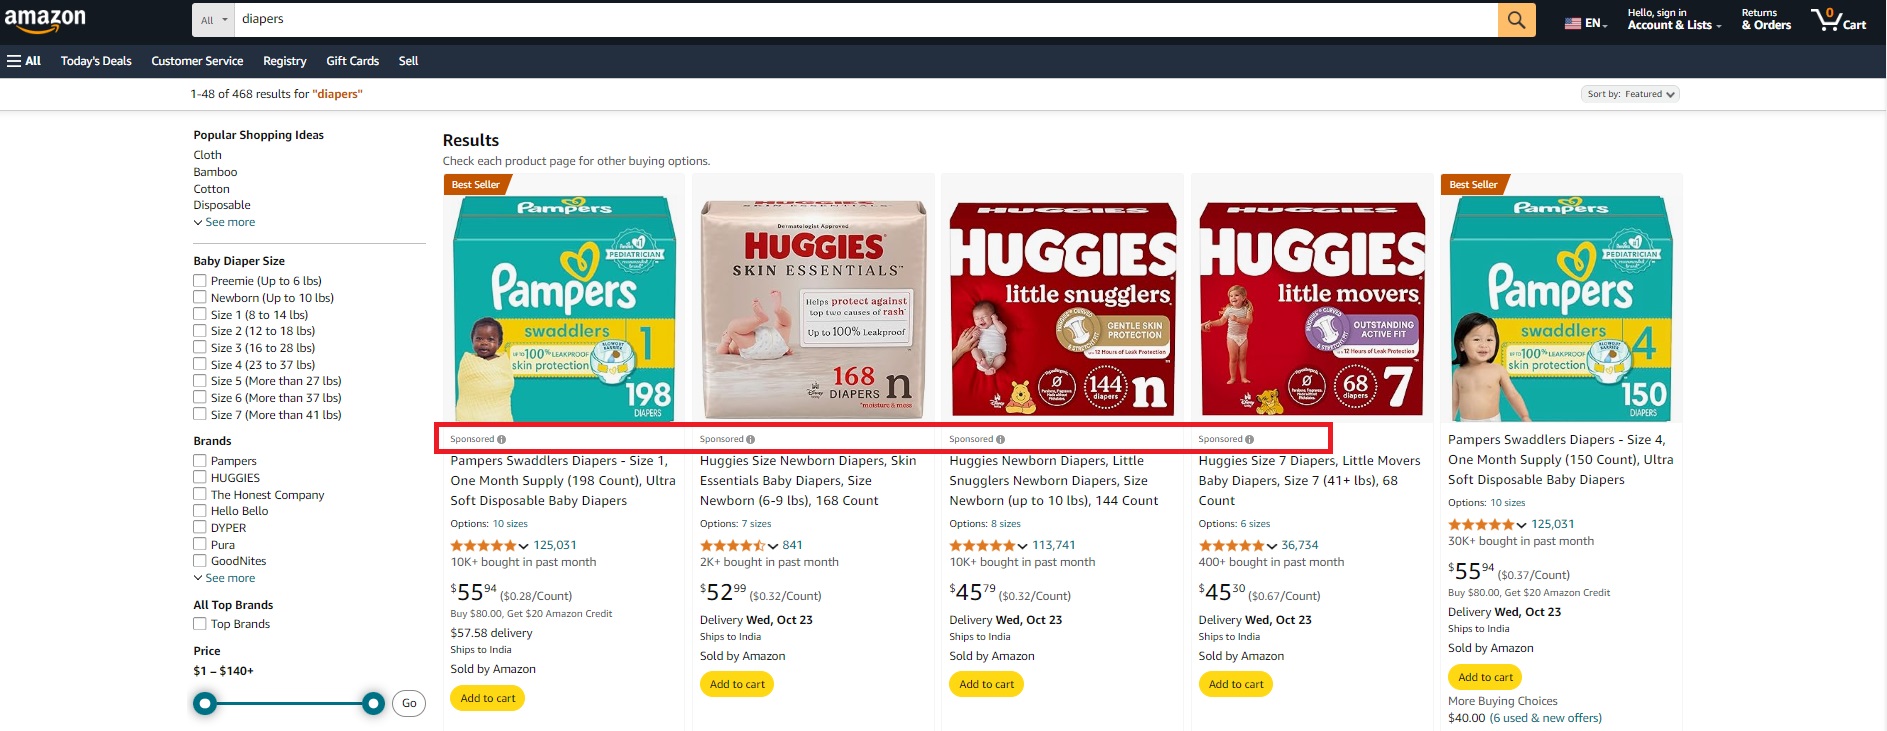
Retailer Search Visibility: Filter logic on major e-commerce platforms like Target.com, Walmart.com, and Instacart is increasingly driven by precise attribute tags (e.g., “gluten-free,” “BPA-free,” “0g added sugar”). Fail to provide or correctly format these claims, and your product will simply never appear when shoppers apply these critical search filters. You become invisible to a motivated audience.
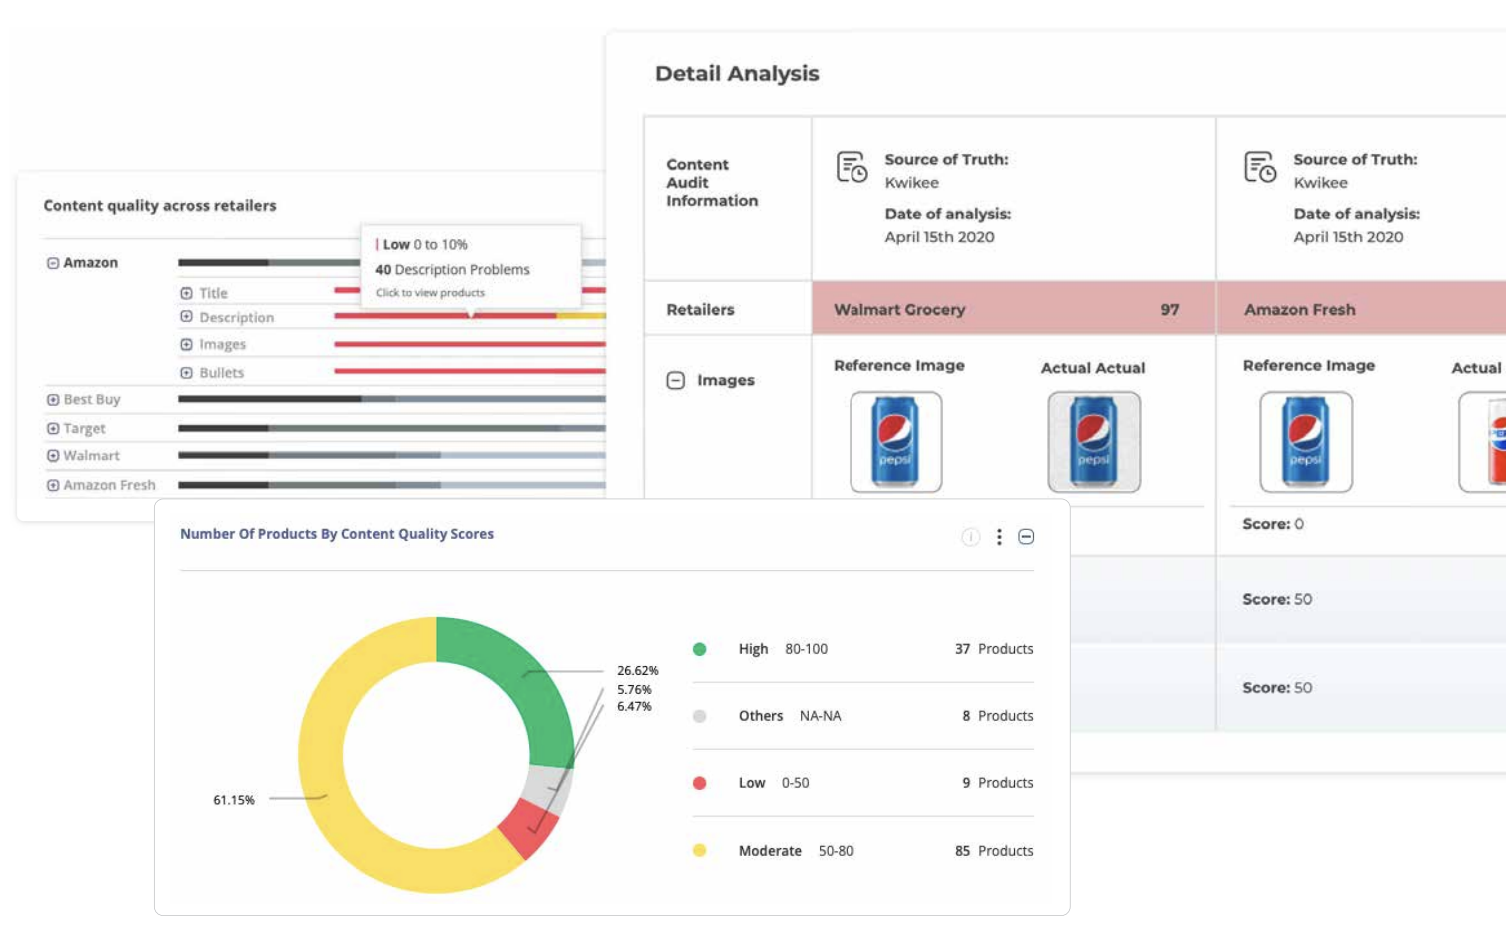
Regulatory Compliance: Global regulatory bodies, including the U.S. FDA and EU authorities, now treat online product detail pages as officially regulated labeling space. This means that a single missing allergen statement or an inaccurate nutritional claim can trigger severe consequences, from product takedowns and hefty fines to a devastating “straight-to-zero” share of search. Non-compliance isn’t just a legal risk; it’s a direct threat to your market presence (see example below).
The Hygiene Playbook: Audit → Score → Fix → Grow
Your Product Detail Pages (PDPs) are your digital storefronts, and they need to be impeccable. Modern content-intelligence tools are like vigilant auditors, constantly scanning, structuring, and scoring every PDP across your retail network.
Tools like DataWeave do the heavy lifting by:
Surfacing critical gaps: They’ll pinpoint issues like blurry images, inaccurate titles, or missing nutrition information.
Optimizing for search: They ensure your product attributes align with live search filters, turning claims into clicks.
Flagging compliance risks: You’ll know about potential issues before regulators or retail partners ever do.
Quantifying your impact: Get a clear Content Quality Score that your teams can own and improve, week after week.
When you execute this well, it’s not just about tidying up; it’s a powerful growth engine. This proactive approach fuels every step of the digital customer journey – from getting found, to winning the click, converting the cart, and ultimately, capturing reviews that boost your search rankings.
A Case Study: Bush’s Beans Converts Visibility into Revenue
Before Bush’s Beans achieved rapid success with their “audit → scorecard → rapid-fix” approach, they confronted a significant hurdle. Here’s how they overcame it to drive impressive revenue growth.
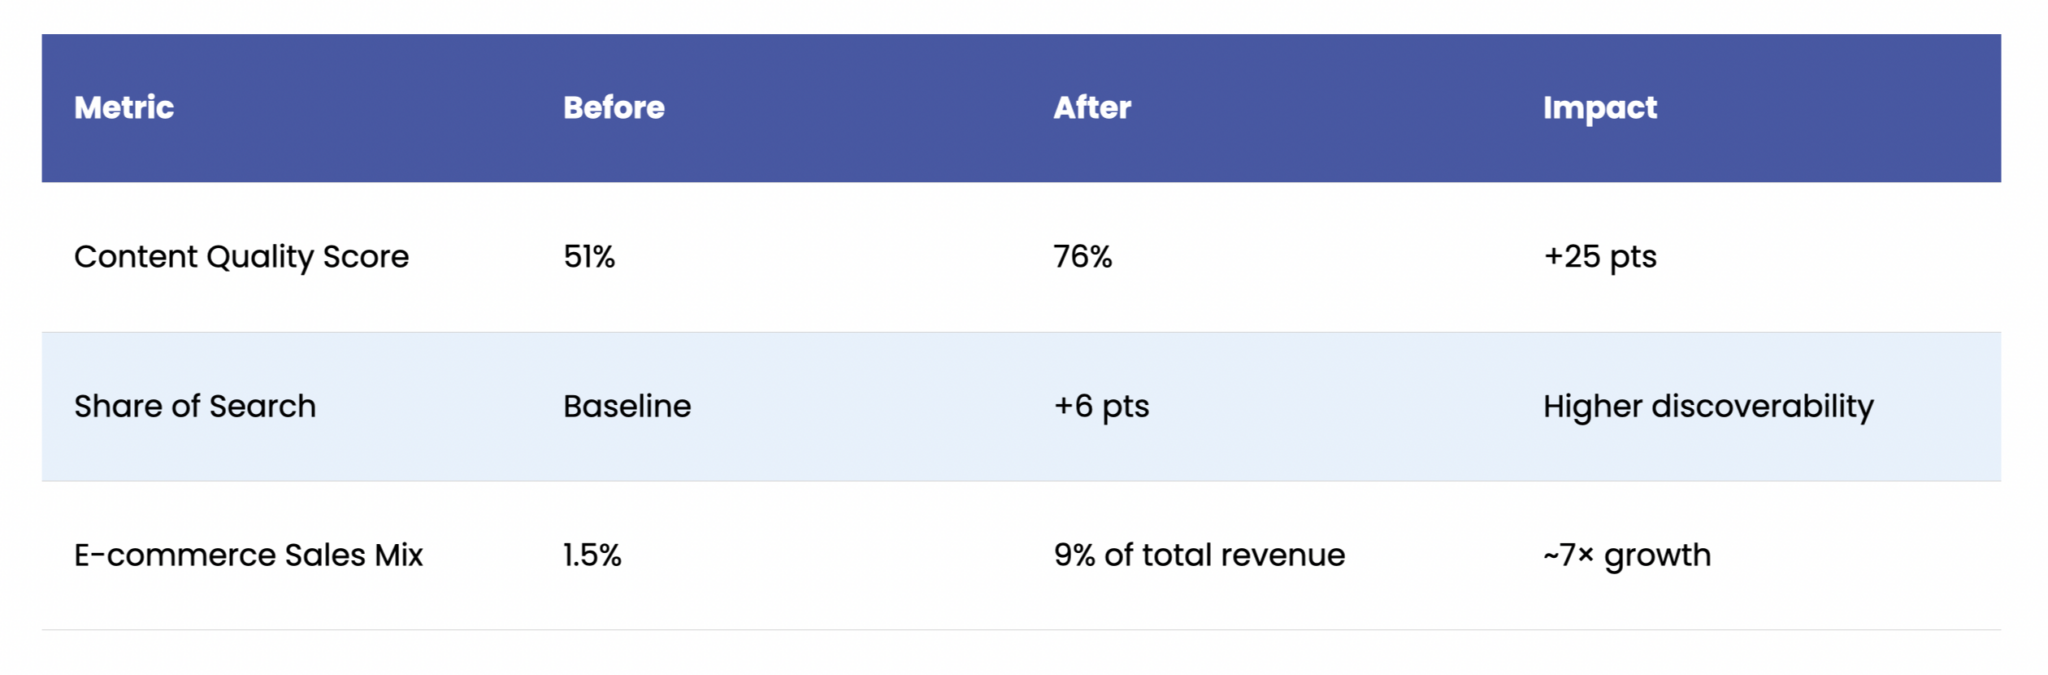
The Challenge
Bush’s Beans saw its e-commerce contribution stall at just 1.5 percent while competition in canned goods intensified. A quick audit revealed three root causes:
Dipping online sales that signalled slipping visibility and conversion.
Fragmented product content across major retailer sites as images, titles, and claims were inconsistent or missing altogether.
Heavier category competition making it harder to hold first-page search positions.
The Fix
The brand adopted DataWeave’s Digital Shelf Analytics to create a single source of truth for every PDP. A lean internal team then:
Ran content audits across priority retailers to surface incomplete or non-compliant attributes.
Prioritized quick wins focusing on high-velocity SKUs where simple edits (e.g., adding pack-size keywords or allergy statements) would unlock search filters.
Tracked progress weekly using an automated scorecard to keep everyone focused on the next set of fixes.
The Win
Twelve months later the numbers told the story:
Bush’s Beans transformed their product data into a strategic asset, significantly improving online visibility, safeguarding brand reputation, and driving sustained revenue growth. Accurate and complete product pages ensured compliance and boosted search rankings, directly increasing sales. While you can’t control external factors like tariffs, you can control the quality and compliance of your product pages and that control directly translates margin pressure into market share gains.
Unified Insight: Turning Signals into Sustained Advantage
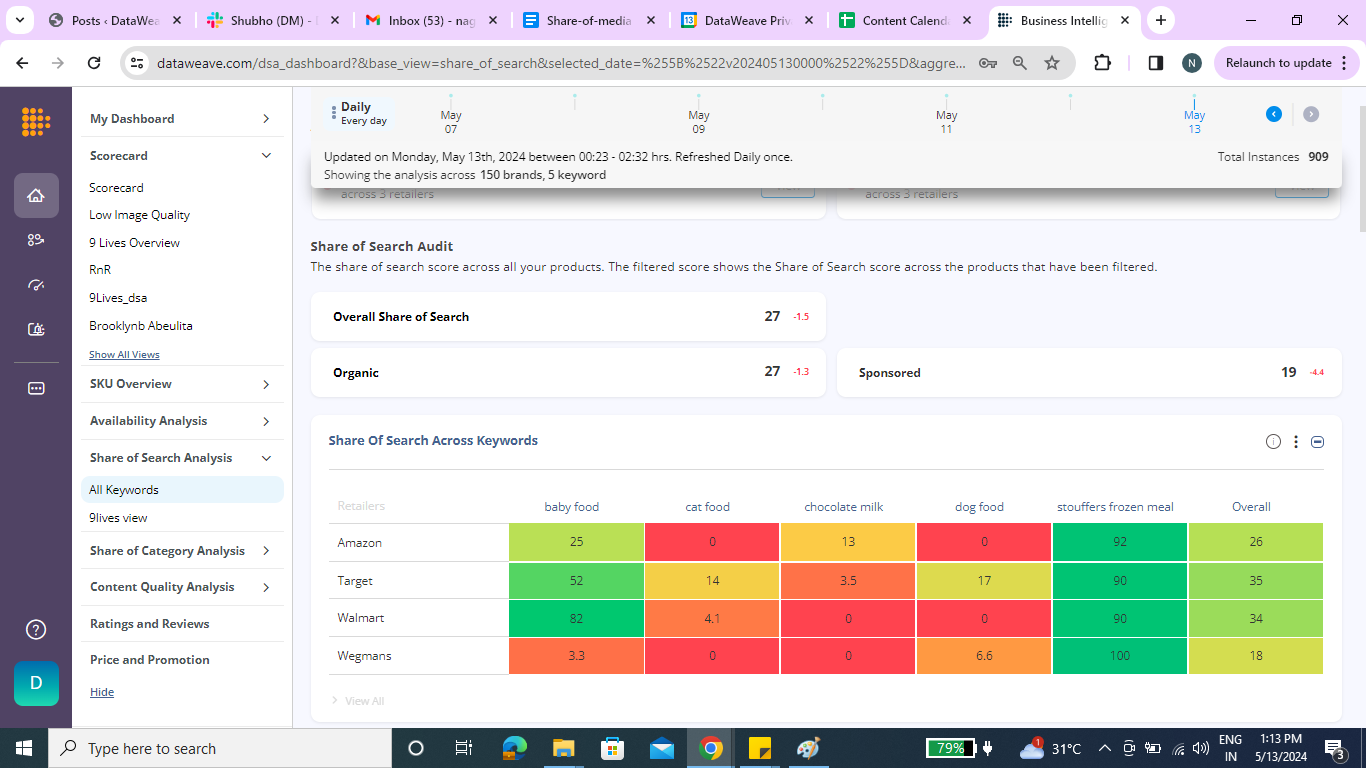
Imagine one living dashboard where every digital shelf signal like timely price moves, share-of-search shifts, retail media spend, on-shelf availability gaps, compliance flags, MAP breaches, plus content and review health flows together. With that single lens, the “whose numbers are right?” debate disappears and cross-functional teams can act in minutes rather than days.
A consolidated feed lets you:
Build market awareness: Spot competitor price changes as they happen, understand who owns first-page search, and measure the true lift of retail media campaigns.
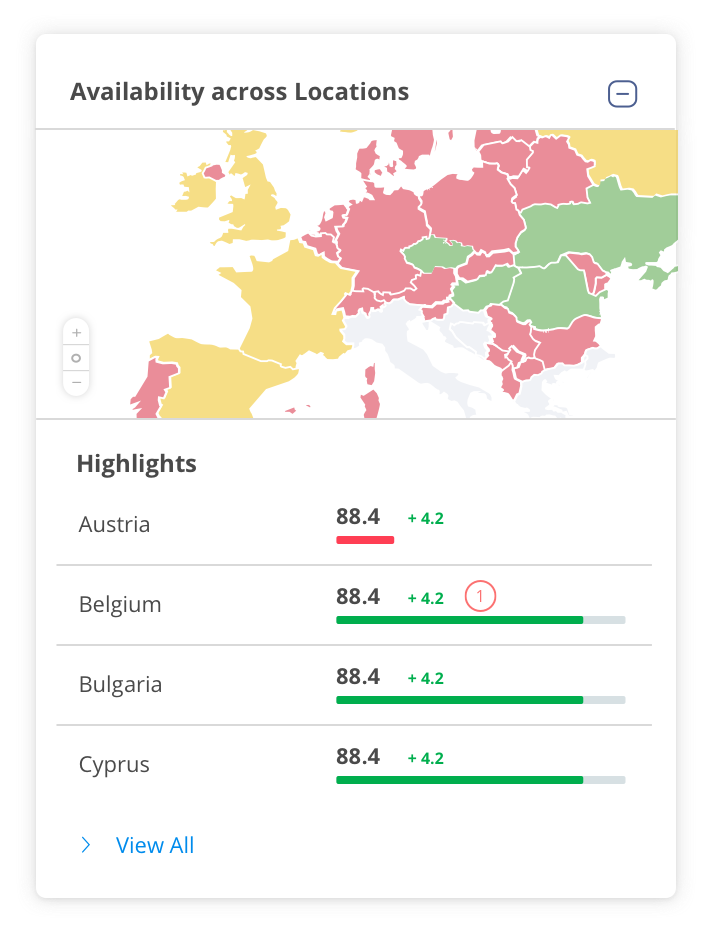
Mitigate emerging risks: Surface impending out-of-stocks before rank erodes, catch claim or label errors ahead of audits, and receive instant alerts when a seller breaks MAP.
Activate growth levers: Prioritize content edits that open search filters and use ratings and reviews trends to fine-tune messaging and assortment.
Brands that weave these signals into one workflow move faster than the disruption. That’s the connective tissue highlighted in our recent post on pairing Digital Shelf Analytics with Digital Shelf Impact Modelling: when granular shelf data sits beside strategic performance metrics, smarter decisions follow.
A platform like DataWeave brings the pieces together quietly ingesting millions of price checks, availability reads, and PDP audits each day, then presenting only the next best actions. The payoff is simple: sharper market awareness, lower operational risk, and growth that compounds with every iteration.
Keep Moving, Keep Winning
Tariffs, evolving regulations, and agile competitors are no longer storms; they are the climate. Brands that pair a clear, shared insight stream with rapid execution turn volatility into durable advantage. Keep your data united, keep iterating on the five digital-shelf levers, and every new headwind becomes another step ahead.
Marketing analytics has evolved dramatically over the past decade, yet many brands still struggle to connect their marketing investments to real business outcomes. While traditional analytics platforms provide valuable historical insights, they often miss the critical external factors that drive consumer behavior in today’s fast-moving digital marketplace.
The challenge isn’t just about measuring what happened. It’s about understanding why it happened and predicting what comes next. This is where Digital Shelf Impact Modeling becomes essential for smarter marketing investments.
The Critical Data Gap In Marketing Analytics
Traditional marketing analytics expose brands to considerable risk, especially in the CPG and retail space. The fundamental challenge lies in their reliance on lagging indicators for essential metrics like historical sales and ad spend. Data inputs may be months or quarters old before they’re used for strategic decision-making.
That’s like making million-dollar marketing decisions while only looking in the rearview mirror when you need to watch the road ahead simultaneously.
Most marketing analytics tools also typically overlook external market factors that can dramatically impact performance. In today’s retail landscape, where market conditions change rapidly, being blind to real-time competitive dynamics creates significant vulnerability. Key external factors that traditional analytics fail to capture include:
In fact, opaque data integration and siloed insights remain substantial barriers to actionable intelligence from marketing analytics tools. Most critically, old school approaches often miss vital such variables influencing consumer behavior.
These blind spots must be addressed to unlock the full value of marketing analytics investments and make truly informed marketing decisions.
How Digital Shelf Impact Modeling Completes The Picture
This is where Digital Shelf Impact Modeling plays a complementary role. Brands leveraging digital shelf analytics gain insights into actual market dynamics that traditional analytics alone cannot provide. However, brands using digital shelf insights in isolation often struggle to quantify how digital shelf improvements directly impact revenue. Answering questions like “Did better product content drive sales, or was it the influencer campaign?” remains challenging.
Bridging these disconnected platforms requires intentional integration and a solution that can feed intensively cleaned and organized data into existing analytics frameworks. With the right data inputs, companies establish a powerful feedback loop for agile, data-driven decisions.
A comprehensive DSA solution like DataWeave provides granular, actionable data on critical external variables such as:
Daily or weekly competitor pricing movements and promotional activity
Product content standardization and optimization across retailers
Review sentiment trends and potential reputation issues
Share of search/shelf performance relative to competitors
When merged with established analytics capabilities, digital shelf impact modeling creates a complete picture that fills the blind spots holding marketing teams back from maximizing ROI.
The Digital Shelf Advantage in Retail Media
The popularity of retail media networks has further amplified the need for integrated digital shelf analytics approaches. These advertising platforms, operated by retailers, allow brands to display targeted ads to shoppers across digital properties based on first-party customer data and purchase insights.
The retail media revolution has transformed e-commerce pages into sophisticated search engines for product discovery. This evolution has been so impactful that retail media ad revenue surged 16.3% in 2023, reaching $43.7B in the U.S., with continued growth projected.
Major platforms like Walmart have expanded their retail media networks to capitalize on closed-loop attribution. Since retailers own the entire customer journey, they can track everything from ad impression to purchase on their e-commerce sites. This creates a significant advantage through accurate ROI measurement, unlike traditional advertising where attribution remains challenging.
How Digital Shelf Impact Modeling Enhances Retail Media Optimization
With retail media emerging as a top-performing sales channel, brands need sophisticated optimization strategies. Every brand wants to maximize visibility and performance across individual eCommerce sites, just as they optimize for Google or emerging AI platforms.
Integrating digital shelf analytics into marketing mix models enables brands to:
Allocate ad spend more intelligently using real-time competitive insights
Identify timely campaign activation opportunities in response to market changes
Monitor organic ranking trends to strategically time paid promotional activities
Measure true campaign impact on digital shelf performance metrics
For example, when a competitor launches an aggressive price drop in your category, Digital Shelf Impact Modeling provides immediate visibility into this change. This intelligence can trigger recommended campaign adjustments, such as increased sponsored ad bidding in affected categories. Traditional analytics alone cannot deliver this level of responsive optimization.
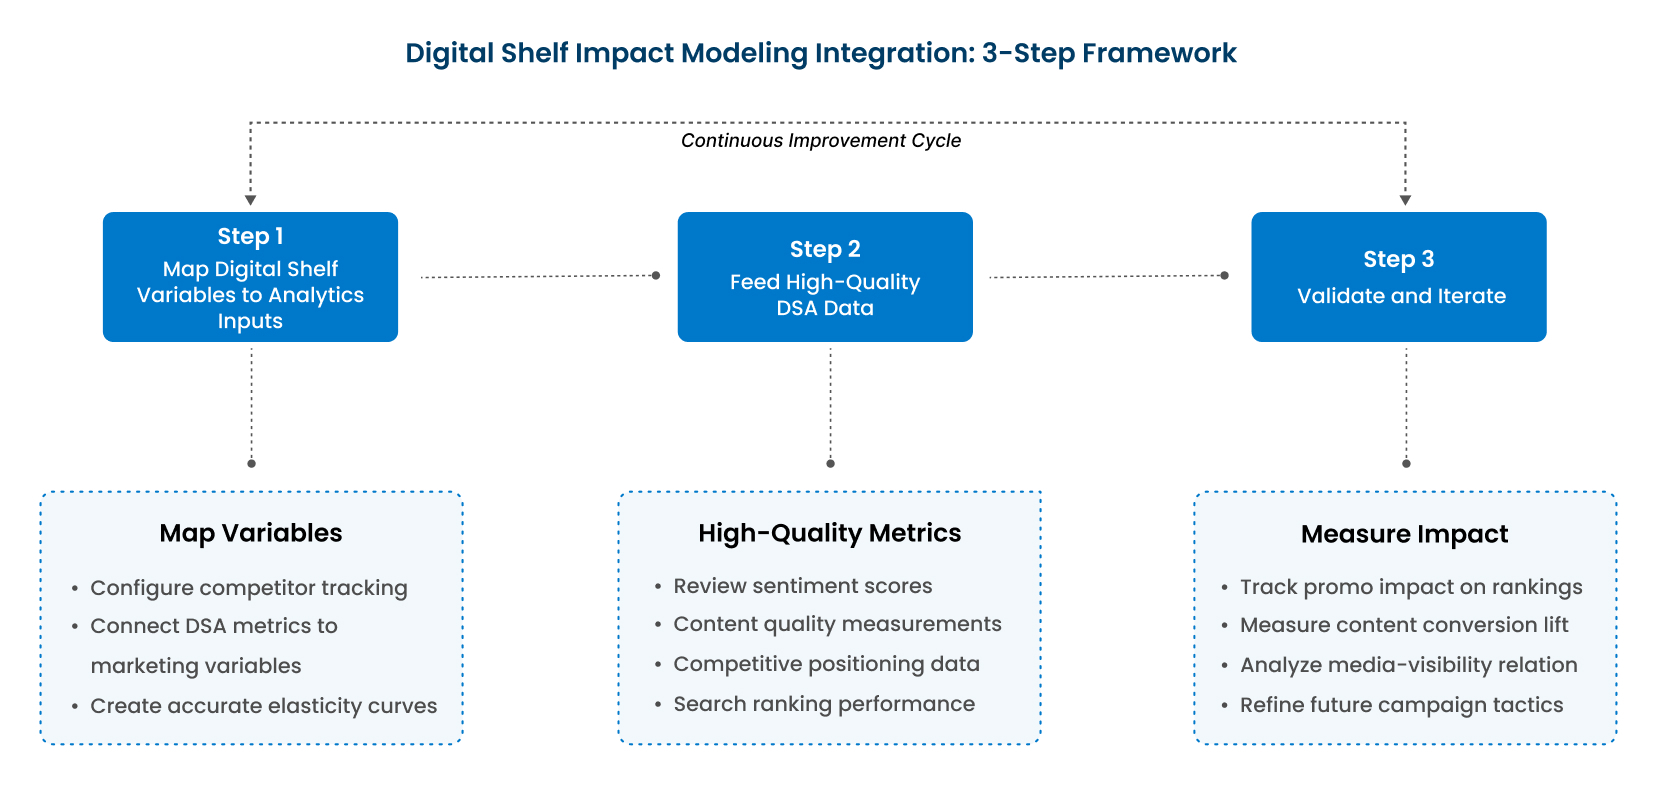
How to Integrate Digital Shelf Impact Modeling: A 3-Step Framework
Here’s how to integrate Digital Shelf Impact Modeling into your marketing strategy to start making better data-driven decisions for your brand.
Step 1: Map Digital Shelf Variables to Analytics Inputs
Begin by mapping specific digital shelf variables to your existing analytics inputs. Ensure that competitors are properly configured for monitoring in your digital shelf platform and that timely metrics like price changes and search ranking positions are linked with your marketing measurement systems.
This integration is crucial because traditional analytics rely exclusively on historical data for forecasting. Adding real-time inputs delivers several benefits:
More accurate elasticity curves reflecting current market conditions
Better understanding of root causes behind demand shifts
Prevention of misattributing sales changes to your marketing activities when external factors may be responsible
At DataWeave, our comprehensive coverage spans 500+ billion data points, 400,000 brands, and 1,500+ websites, ensuring brands never miss a competitor move and maintain complete visibility across the connected e-commerce landscape.
Step 2: Feed High-Quality Digital Shelf Data into Analytics Platforms
Next, integrate critical digital shelf metrics into your measurement framework:
Review and sentiment scores and trends
Content quality measurements
Competitive positioning data
Price gap analytics
Search ranking performance
DataWeave employs a rigorous data accuracy validation process to ensure teams work with the cleanest, most reliable data possible. Our sophisticated processing pipeline removes anomalies and standardizes information across retailers, providing the consistent, high-integrity data foundation that robust marketing mix modeling demands.
Step 3: Validate and Iterate
A powerful Digital Shelf Impact Modeling solution helps measure whether your marketing efforts achieved their intended impact on the digital shelf. Use your digital shelf platform to assess your campaigns’ actual effect on key performance indicators:
Do promo-driven sales lifts correlate with improved search rankings?
How do content improvements impact conversion rates?
What is the relationship between paid media and organic visibility?
It is no surprise to anyone that we are living through volatile times. Executives may be uncomfortable if they cannot provide their teams with strategic direction based on data or the tools they need to accelerate their workdays.
By integrating Digital Shelf Impact Modeling with existing analytics, companies gain early warning signals about market shifts, enabling smarter resource allocation during budget constraints. This integration helps organizations move from tactical execution to strategic direction by:
Providing cross-channel impact analysis to understand the full marketing ecosystem
Equipping category managers with tactical optimization tools that support broader strategic objectives
Identifying competitive threats before they impact sales
Forecasting potential ROI impacts across various spending scenarios
These capabilities help prevent wasted ad spend, missed opportunities, and lost sales.
Future-Proofing Your Marketing Strategy with Digital Shelf Impact Modeling
Several emerging trends highlight the growing importance of digital shelf-enhanced marketing analytics:
Trend 1: Navigating Economic Volatility – Brands can use Digital Shelf Impact Modeling to track how competitors adjust pricing in response to cost shocks like tariffs and inflation. This real-time intelligence directly improves demand forecasting accuracy.
Trend 2: AI-Powered Predictive Insights – Combining digital shelf trend detection (such as viral product reviews or sudden inventory fluctuations) with marketing performance metrics helps forecast demand spikes from otherwise unforeseen events.
Trend 3: Automated Optimization – Smart campaign activations and adjustments based on real-time digital shelf triggers drive efficiency. DataWeave’s vision includes an automated retail media intelligence layer that optimizes spend across channels based on integrated insights.
DataWeave’s Unique Advantage
At DataWeave, we’ve seen our digital shelf analytics customers significantly improve their organic search rankings because of better-sponsored ad campaigns. What makes DataWeave’s approach to Digital Shelf Impact Modeling uniquely powerful? Our platform is specifically designed to address the challenges of modern marketing measurement:
Superior data refresh rates ensure timely insights when they matter most
Unmatched marketplace coverage across more than 1,500 eCommerce sites globally
Advanced data normalization that standardizes metrics across disparate categories and retailers
API-first architecture enabling flexible data access and utilization
Conclusion – From Hindsight to Foresight
In the past, companies relied primarily on historical data for their marketing analytics. Today’s market leaders are incorporating Digital Shelf Impact Modeling to unlock superior insights, improve decision accuracy, and drive measurable ROI.
DataWeave serves as the essential bridge between traditional analytics systems and real-time, comprehensive market intelligence. When digital shelf analytics and marketing measurement work together, brands gain a complete picture: traditional analytics show precisely what happened, while Digital Shelf Impact Modeling explains why it happened. Together, they reveal what’s coming next.
Ready to transform your marketing analytics from hindsight to foresight? Contact us today to discover how our Digital Shelf Analytics can enhance your existing marketing investments and drive measurable business results.
Black Friday and Cyber Monday are major retail events in Canada, with 43% and 29% of the population making purchases during these sales respectively, according to a YouGov report. Consumer electronics continue to lead the Canadian retail market during these events, with 55% of surveyed shoppers choosing to buy tech products on Black Friday. Household appliances come in second, with 25% of shoppers opting for these items, while 18% prefer to shop for furniture deals.
These statistics highlight the importance of delivering value during the Thanksgiving sales week. Retailers must cater to shoppers’ expectations with competitive pricing, attractive deals, and a seamless shopping experience. So, what unique offerings did Canadian retailers present to shoppers this season?
To understand the pricing and discount dynamics during BFCM 2024 in Canada, DataWeave analyzed discounts across leading consumer electronics and home & furniture retailers. Using our AI-powered pricing intelligence platform, we analyzed 37,108 SKUs across these categories for major retailers including Amazon, Walmart, Best Buy, Home Depot, and Canadian Tire from the 10th to 29th November. We focused on the top 500 products ranked for each search keyword on each retail site, using targeted terms aligned with categories like “sofa” and “wearables”.
In the following insights, the Absolute Discount represents the reduction of the selling price compared to the Manufacturer’s Suggested Retail Price (MSRP). The Additional Discount reflects how much lower the selling price is during Black Friday compared to its price a week before the sale. This metric reveals the actual or effective value of the sale event, beyond the standard discounts typically offered.
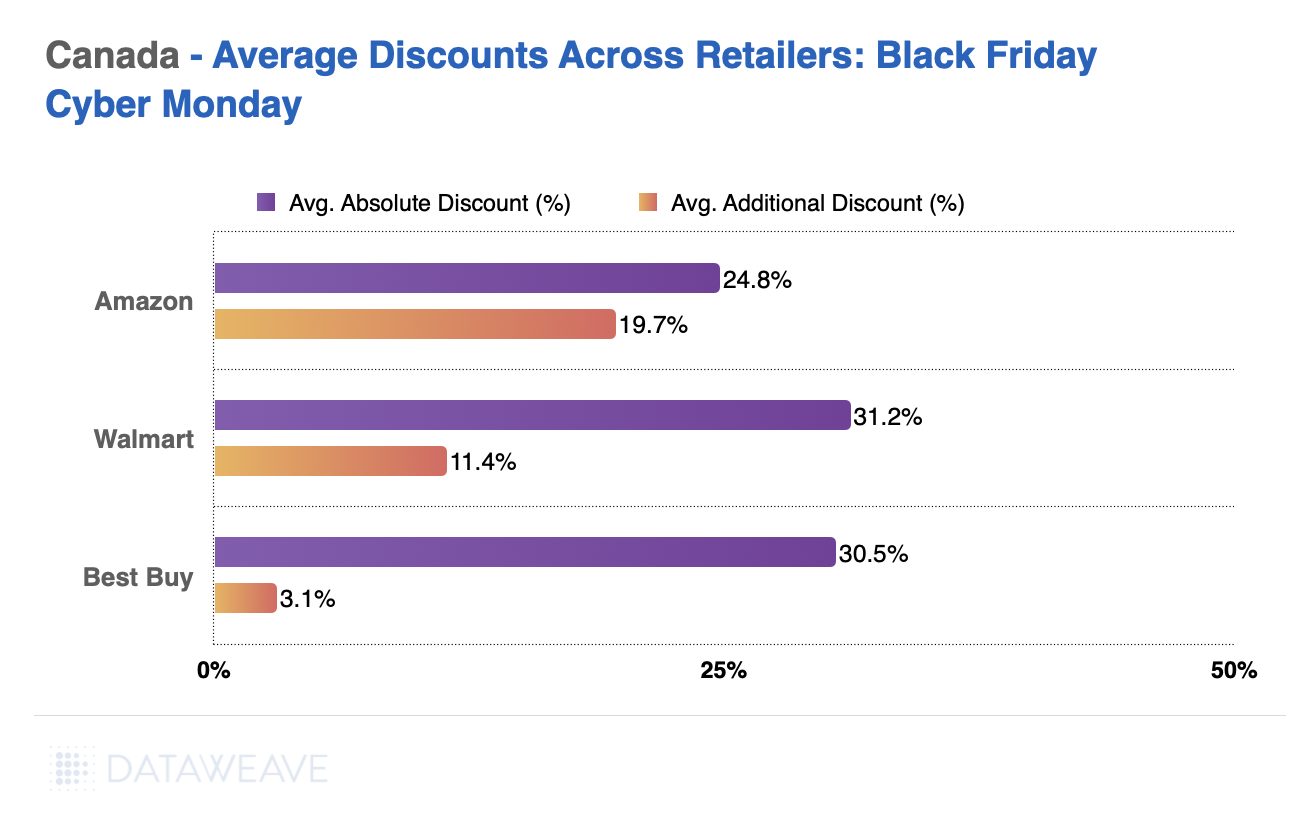
Consumer electronics saw robust participation from major retailers, with Amazon, Best Buy, and Walmart leading the charge. Here’s how they stacked up in terms of discounts:
Best Buy emerged as the frontrunner in absolute discounts at 31.2%, while Amazon impressed with a notable 19.7% additional discount, indicating a strong Black Friday-specific markdown strategy.
Walmart offered steady competition, particularly in audio and video products, which reached an average absolute discount of 37.2%. However, it’s average additional discount was only 3.1%, indicating muted BFCM-specific price reductions in this category.
Subcategory Insights
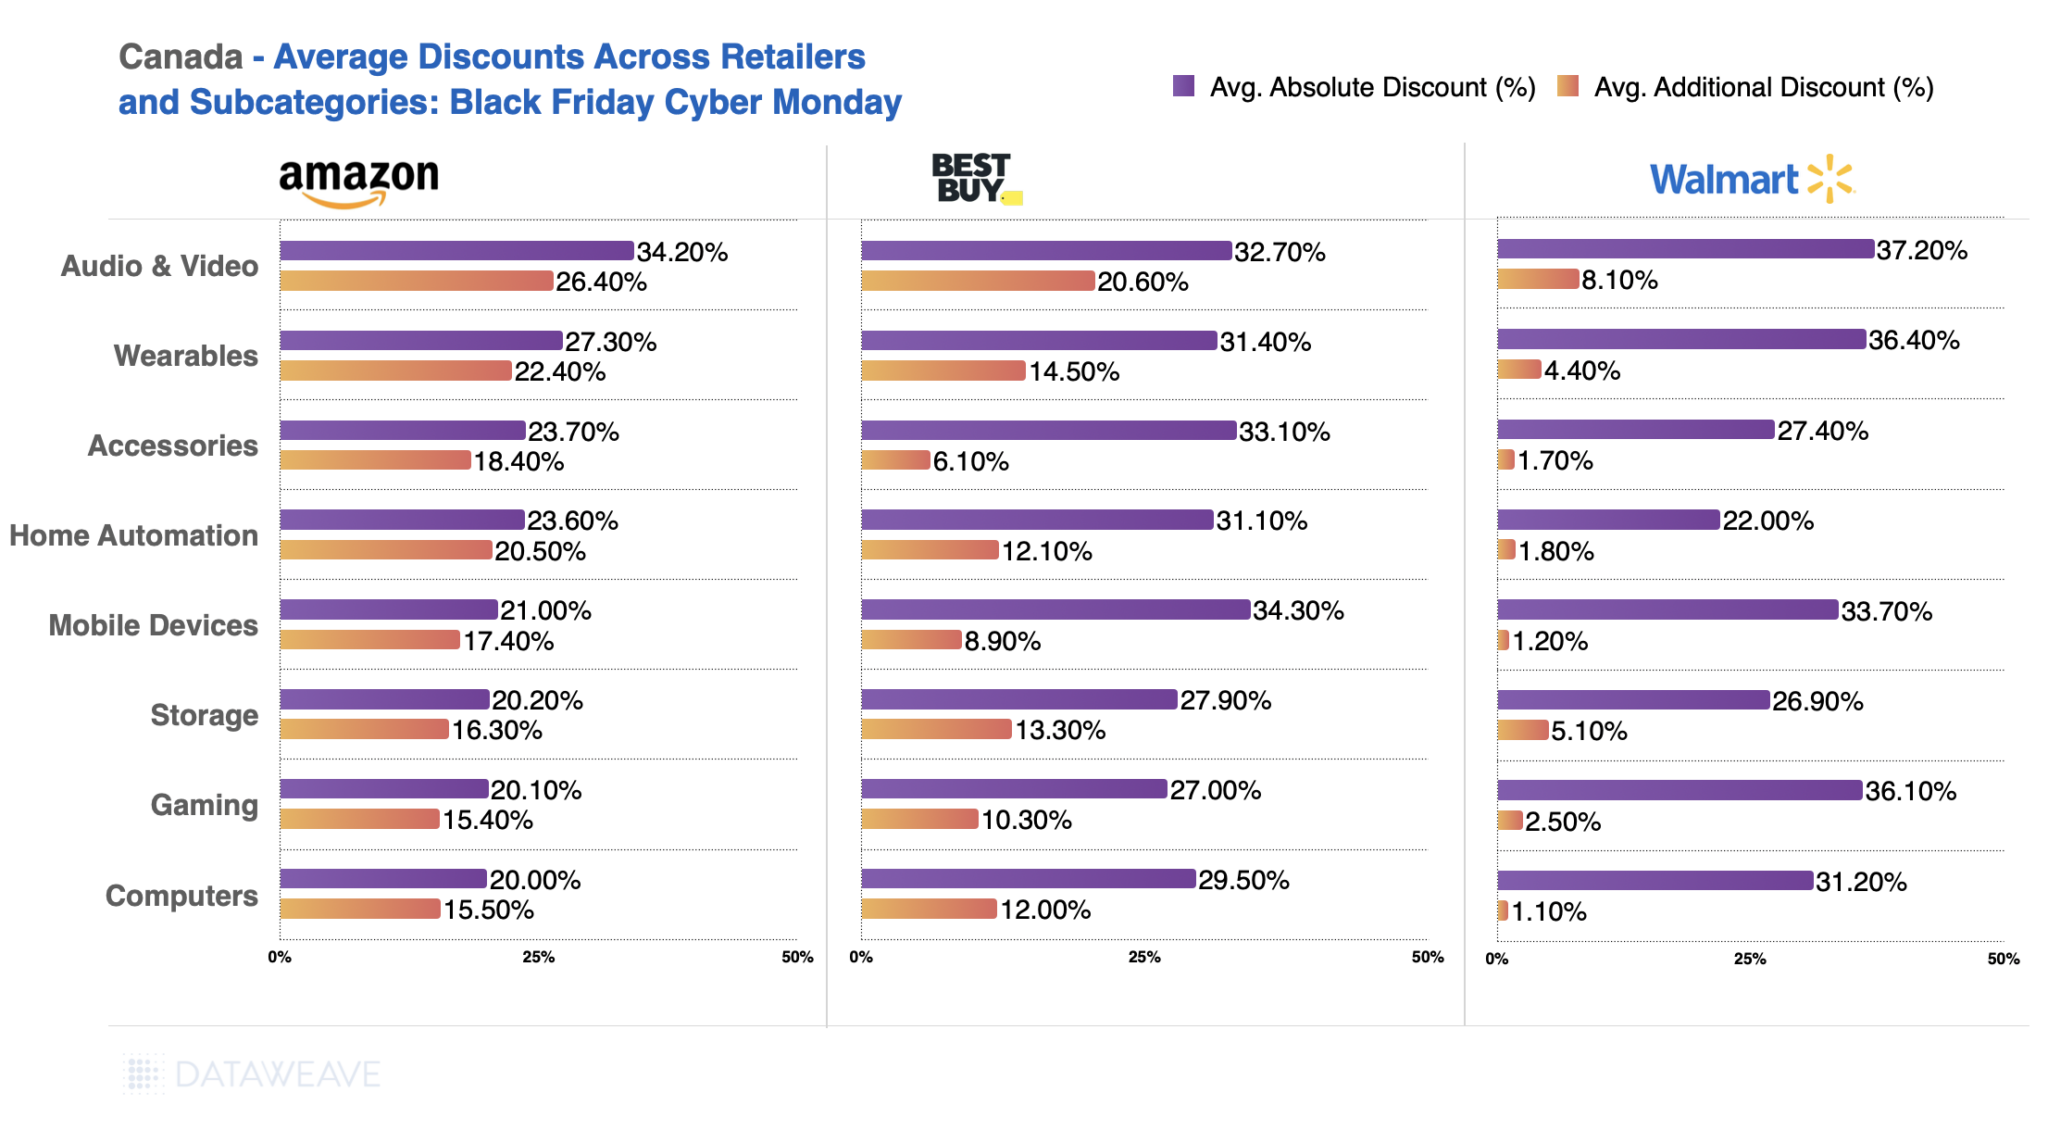
Diving deeper into consumer electronics subcategories, we observed varied discounting strategies.
Audio & Video stood out as the most discounted subcategory, with Walmart leading at 37.2%.
In Wearables, Walmart again took the top spot with 36.4%, while Amazon offered higher additional discounts (22.4%).
Discounting for computers and gaming was less aggressive, highlighting strategic pricing to maintain profitability in these high-demand segments.
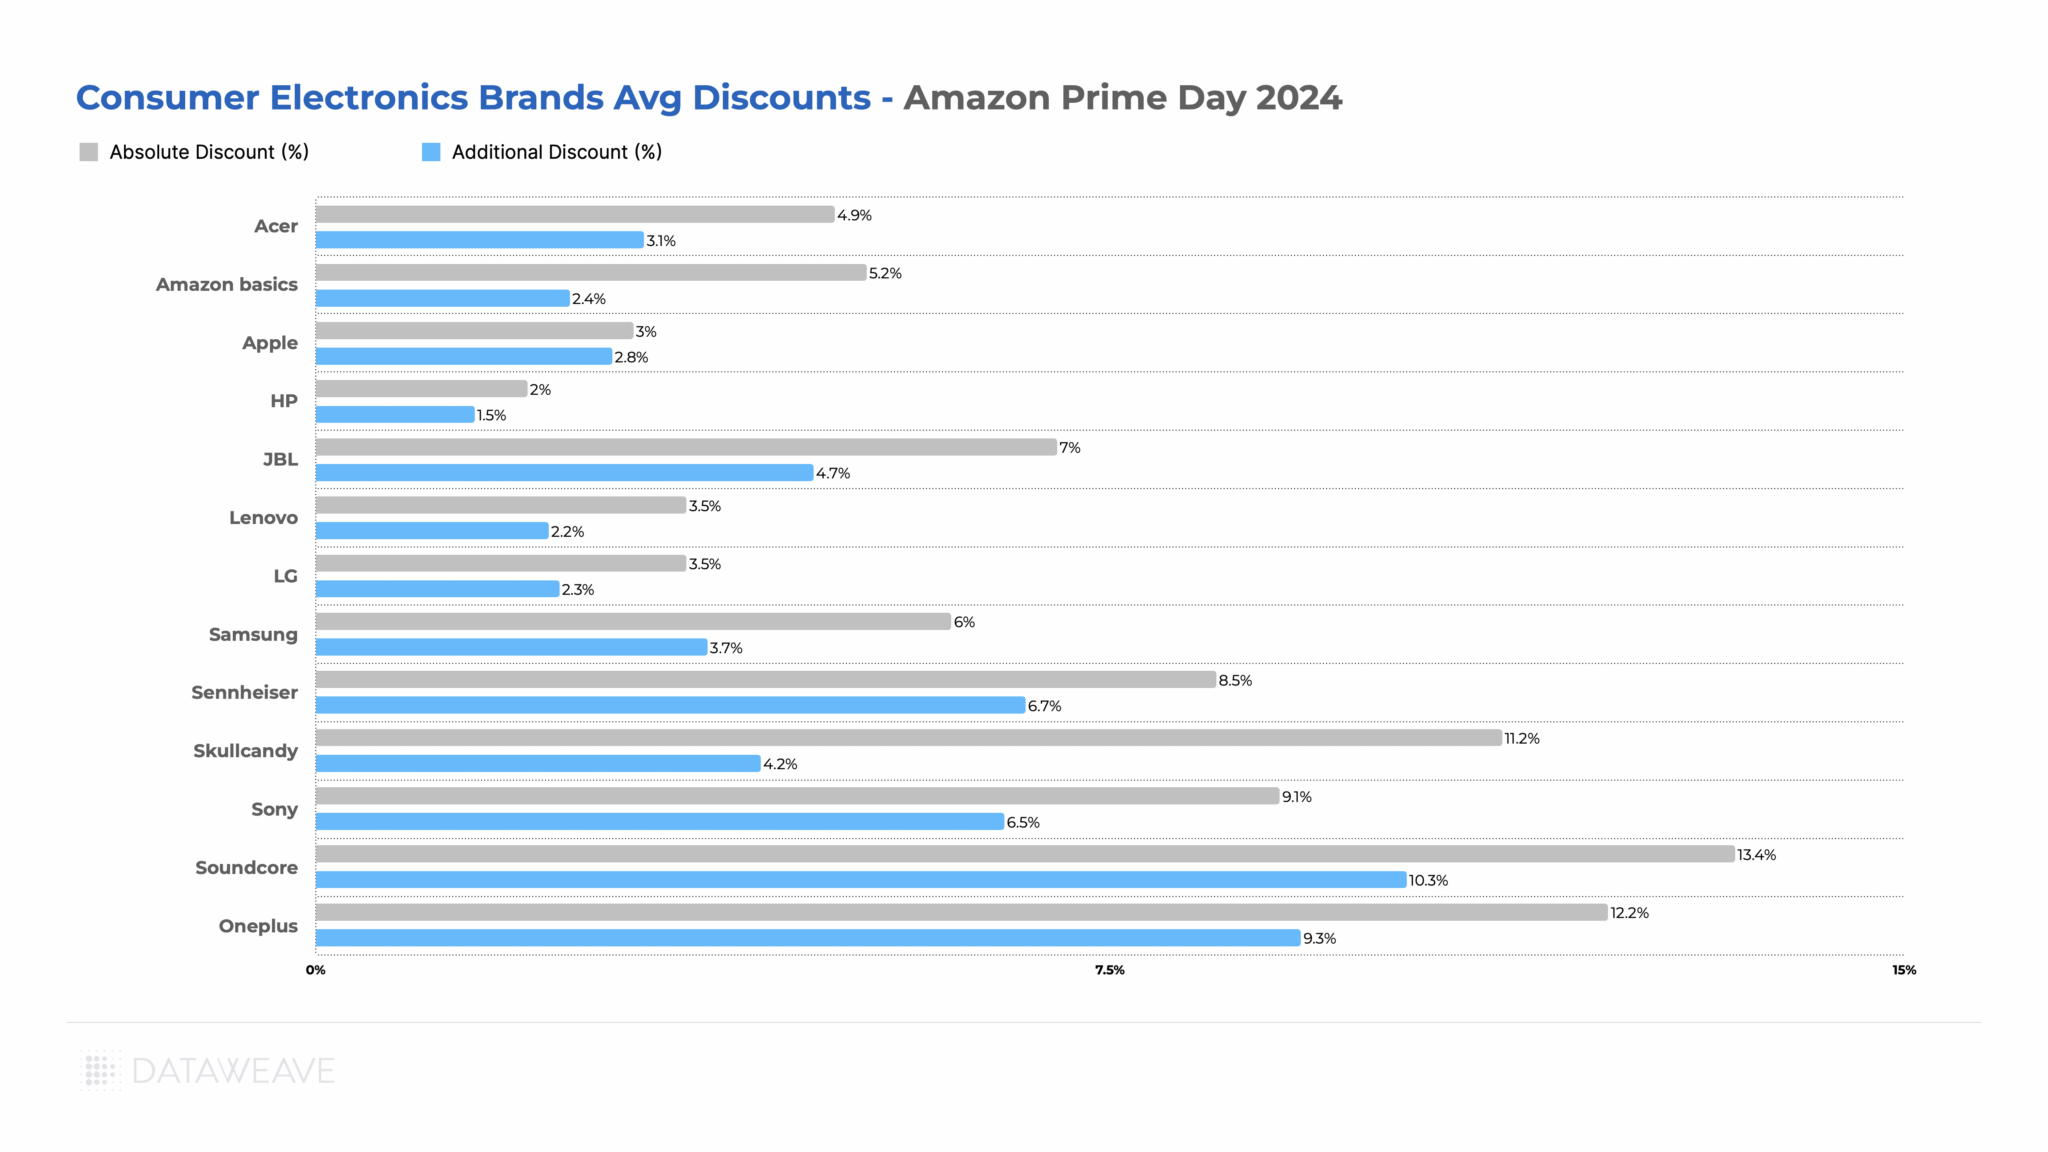
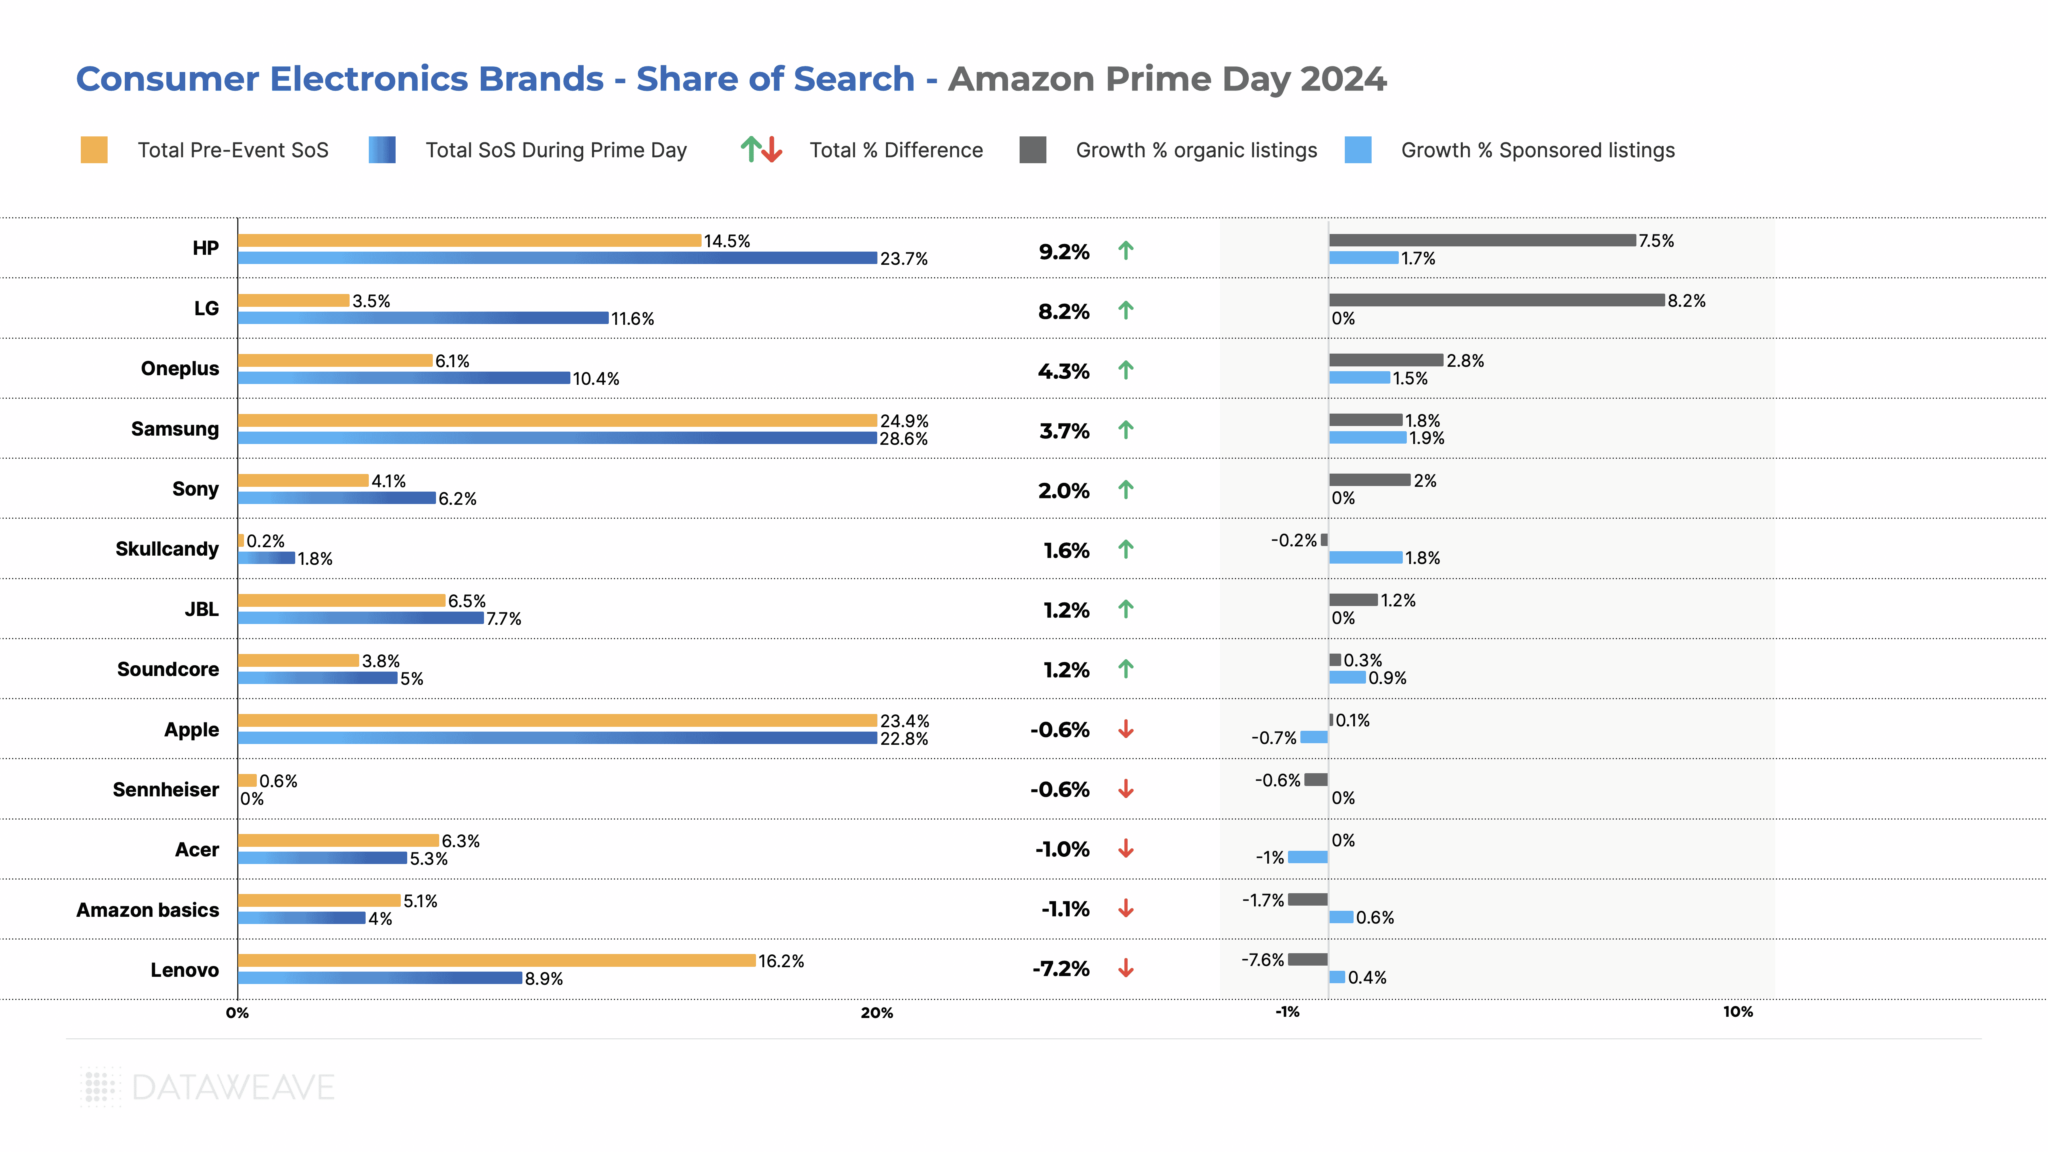
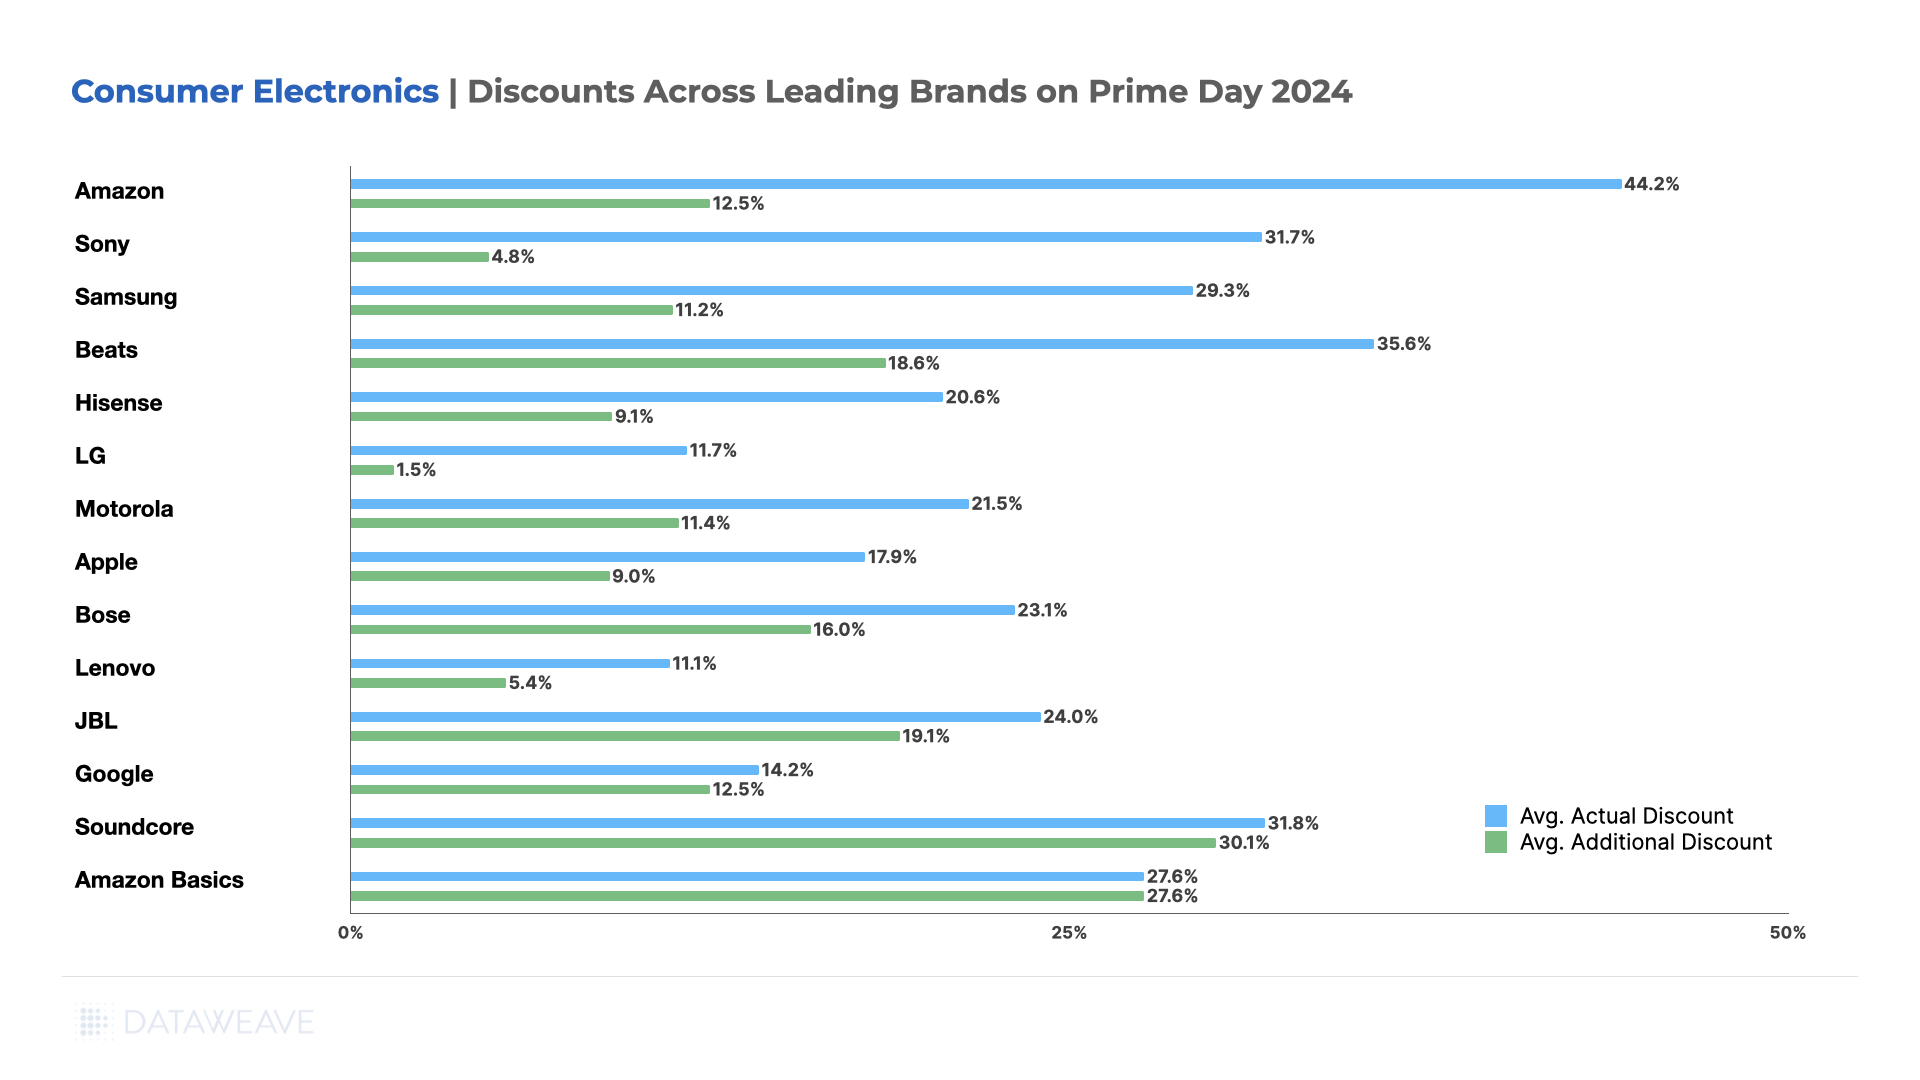
Brand Performance
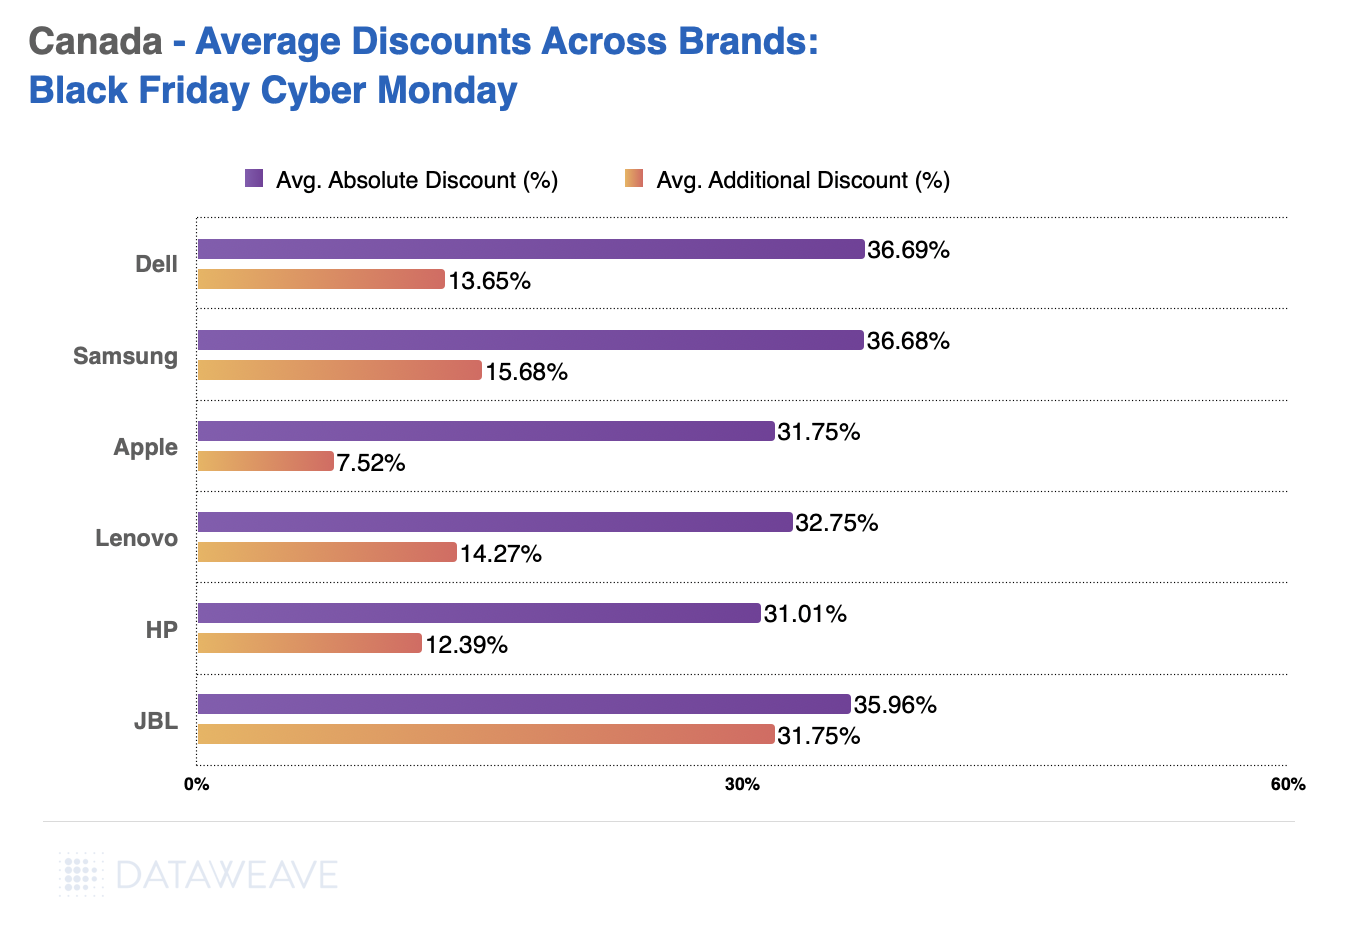
Brand-level data highlighted how key players used Black Friday to drive visibility and sales.
Dell led in average absolute discounts (36.7%) followed by Samsung at 36.68%
Audio brand JBL offered significant absolute discounts at 35.9%.
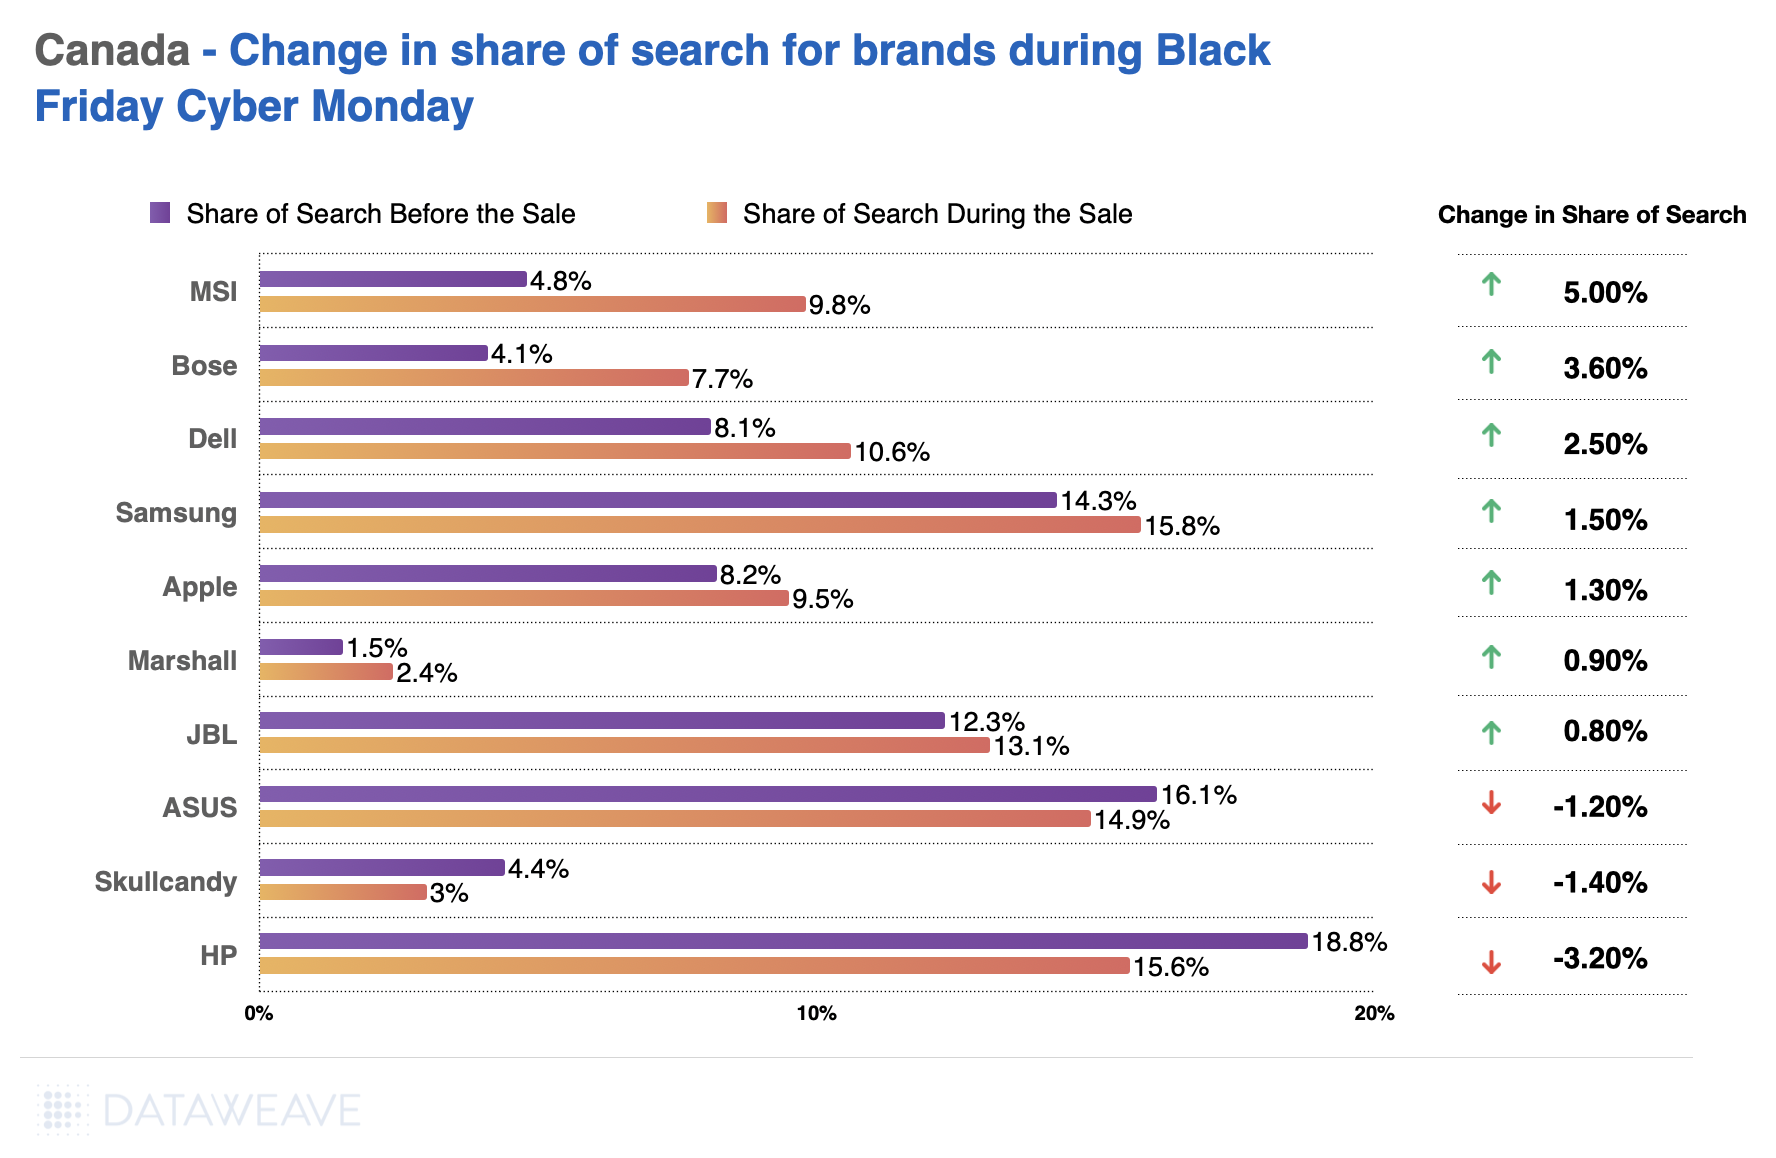
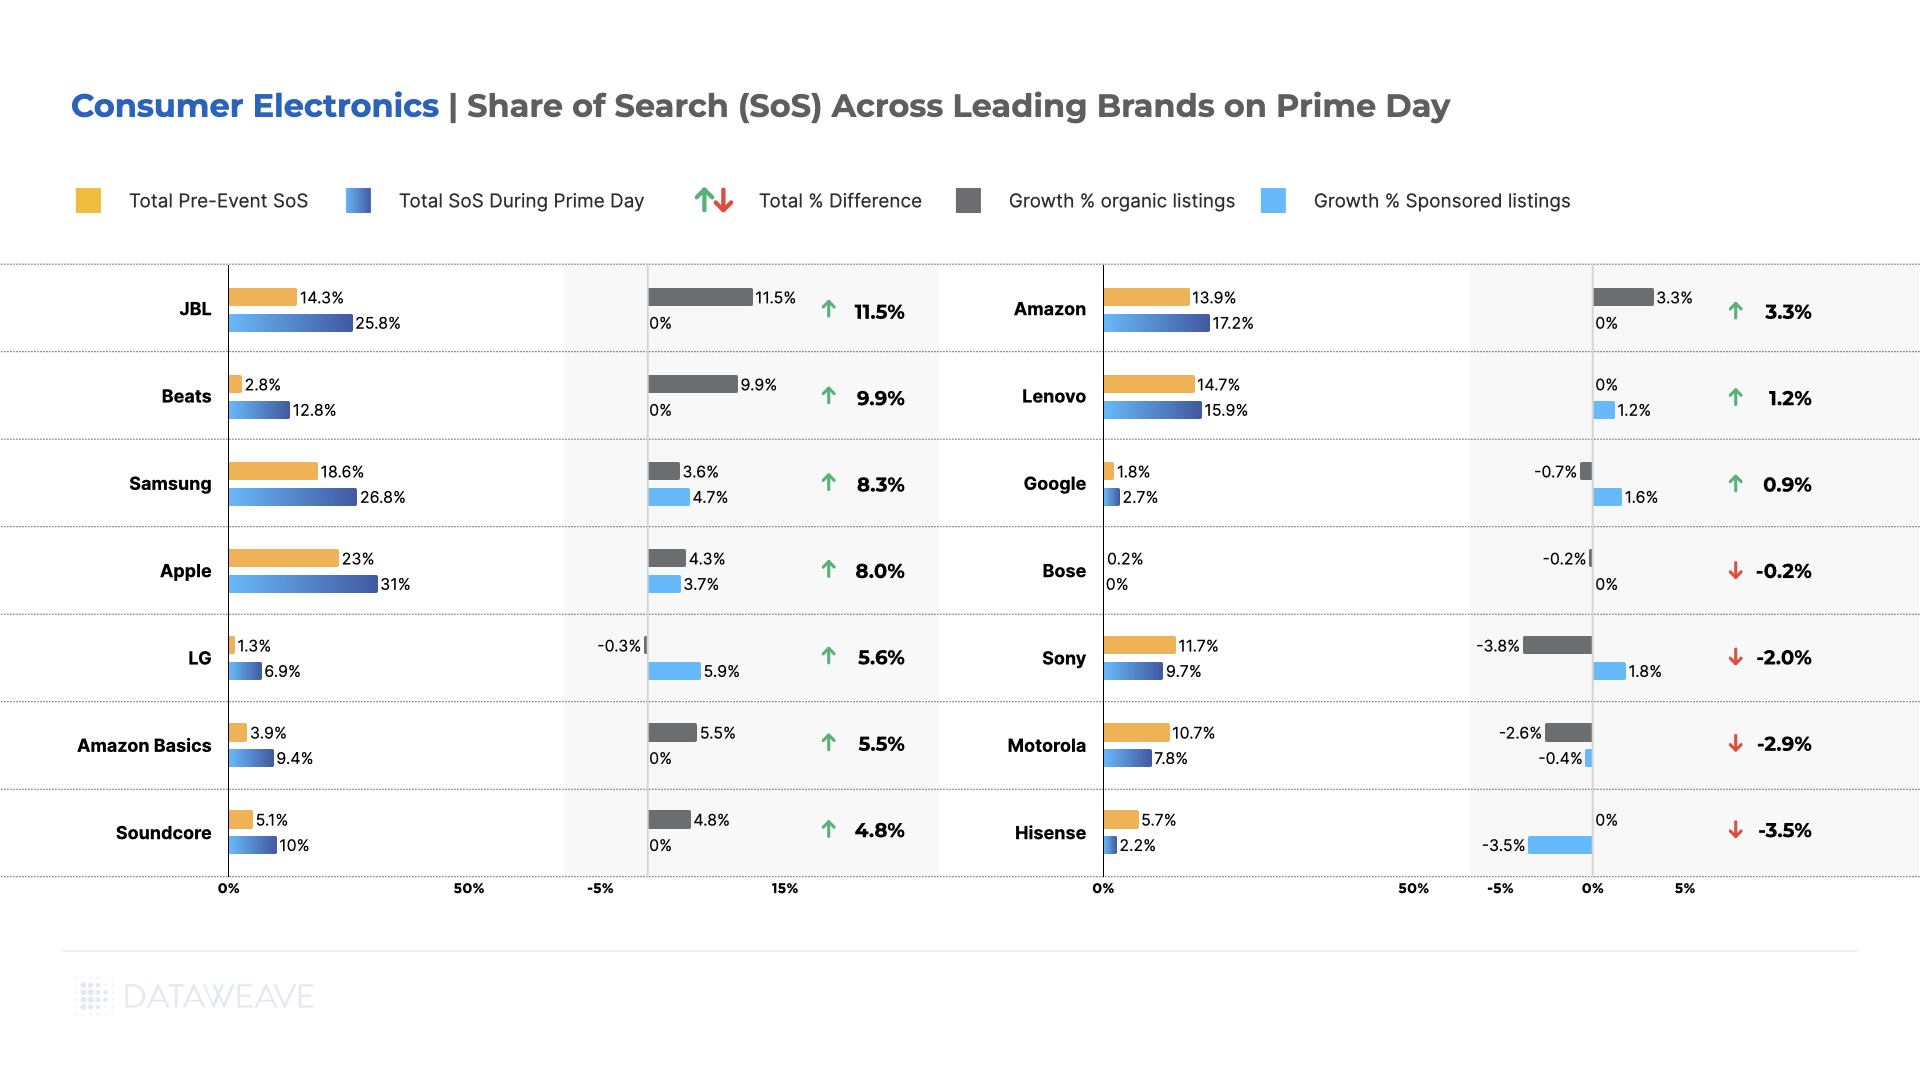
Apple and Lenovo offered comparatively fewer discounts but maintained strong visibility, as seen in their increase in the Share of Search during the sale period.
MSI (laptop brand) and Bose (audio and earphone brand) experienced significant increases in visibility, with Share of Search increases of 5% and 3.6%, respectively.
Notably, HP faced a decline (-3.2%) in the Share of Search, suggesting missed opportunities to align promotions with consumer interest.
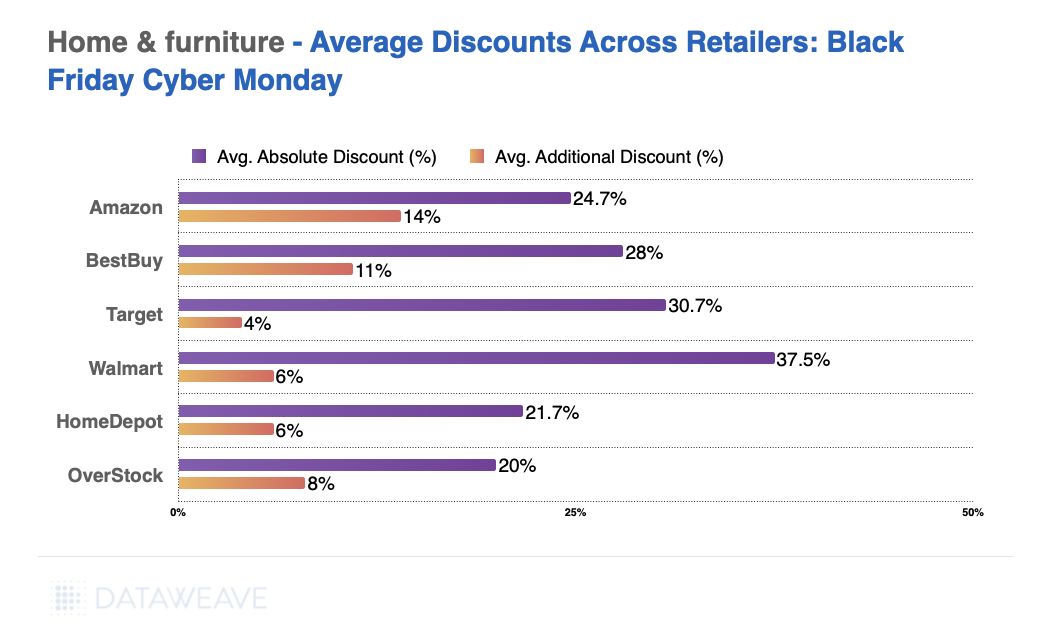
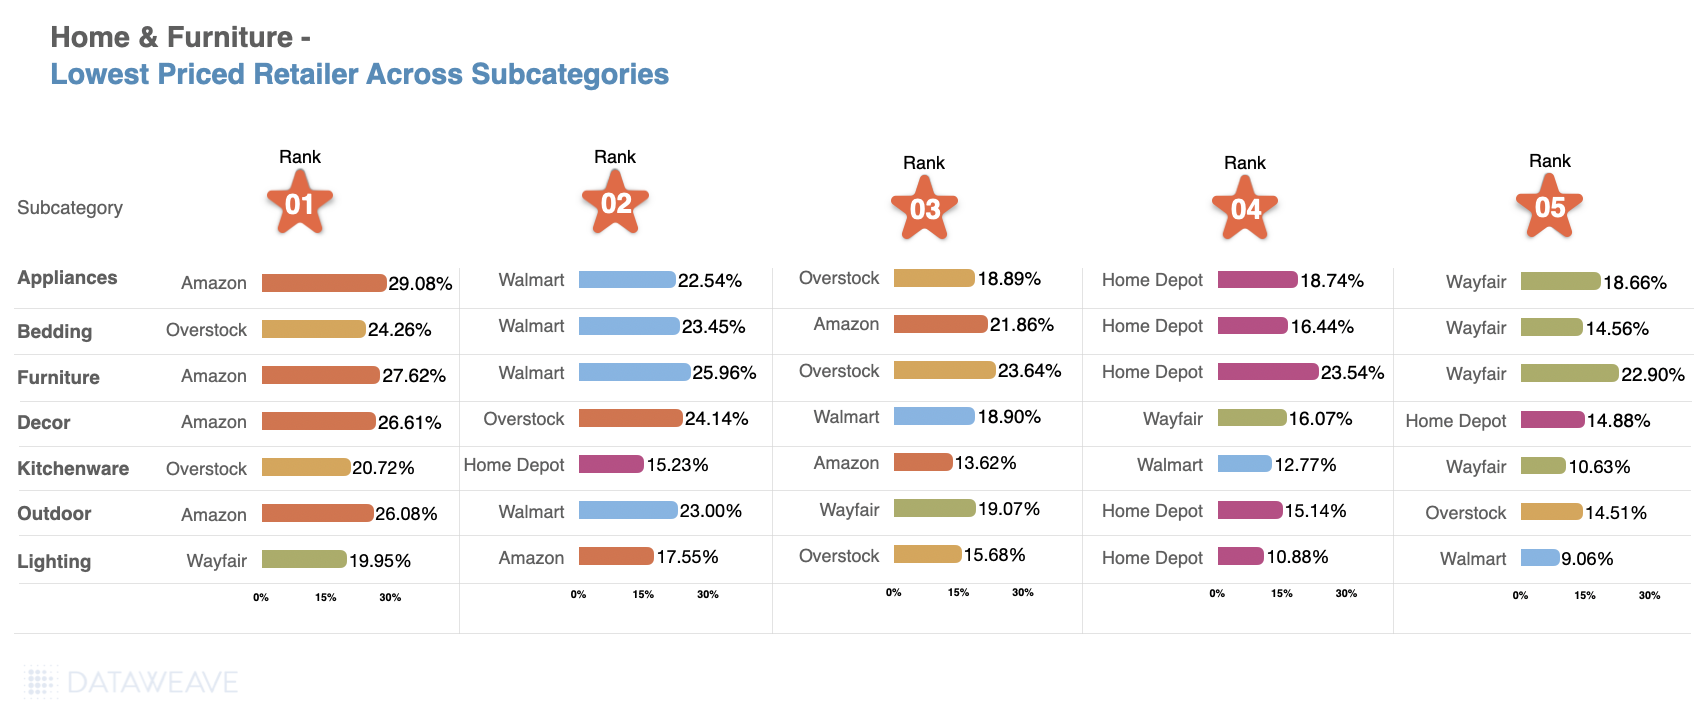
Home & Furniture
Retailers in Focus
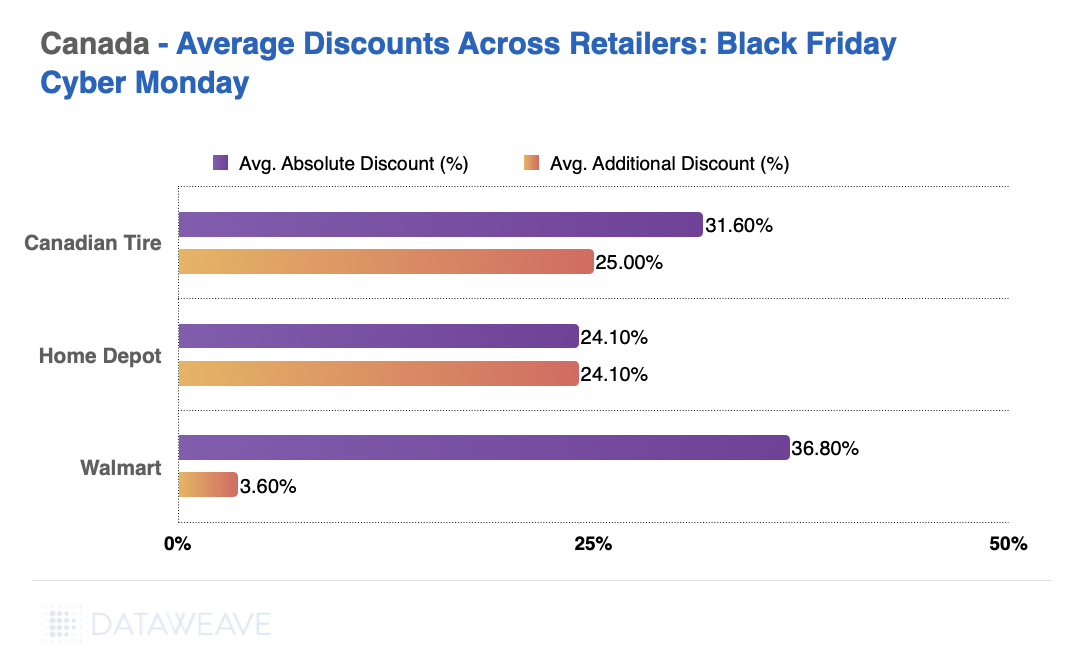
The home and furniture category saw competitive discounting, with Walmart, Canadian Tire, and Home Depot vying for consumer attention.
Walmart took the lead with the highest absolute discounts at 36.8%. The retailer’s additional discounts were more conservative at 3.6%. This is similar to their discount levels in Consumer Electronics.
Canadian Tire offered stiff competition, providing 31.6% absolute discounts and 25% additional discounts.
Home Depot matched its absolute and additional discounts, maintaining consistency at 24.1%.
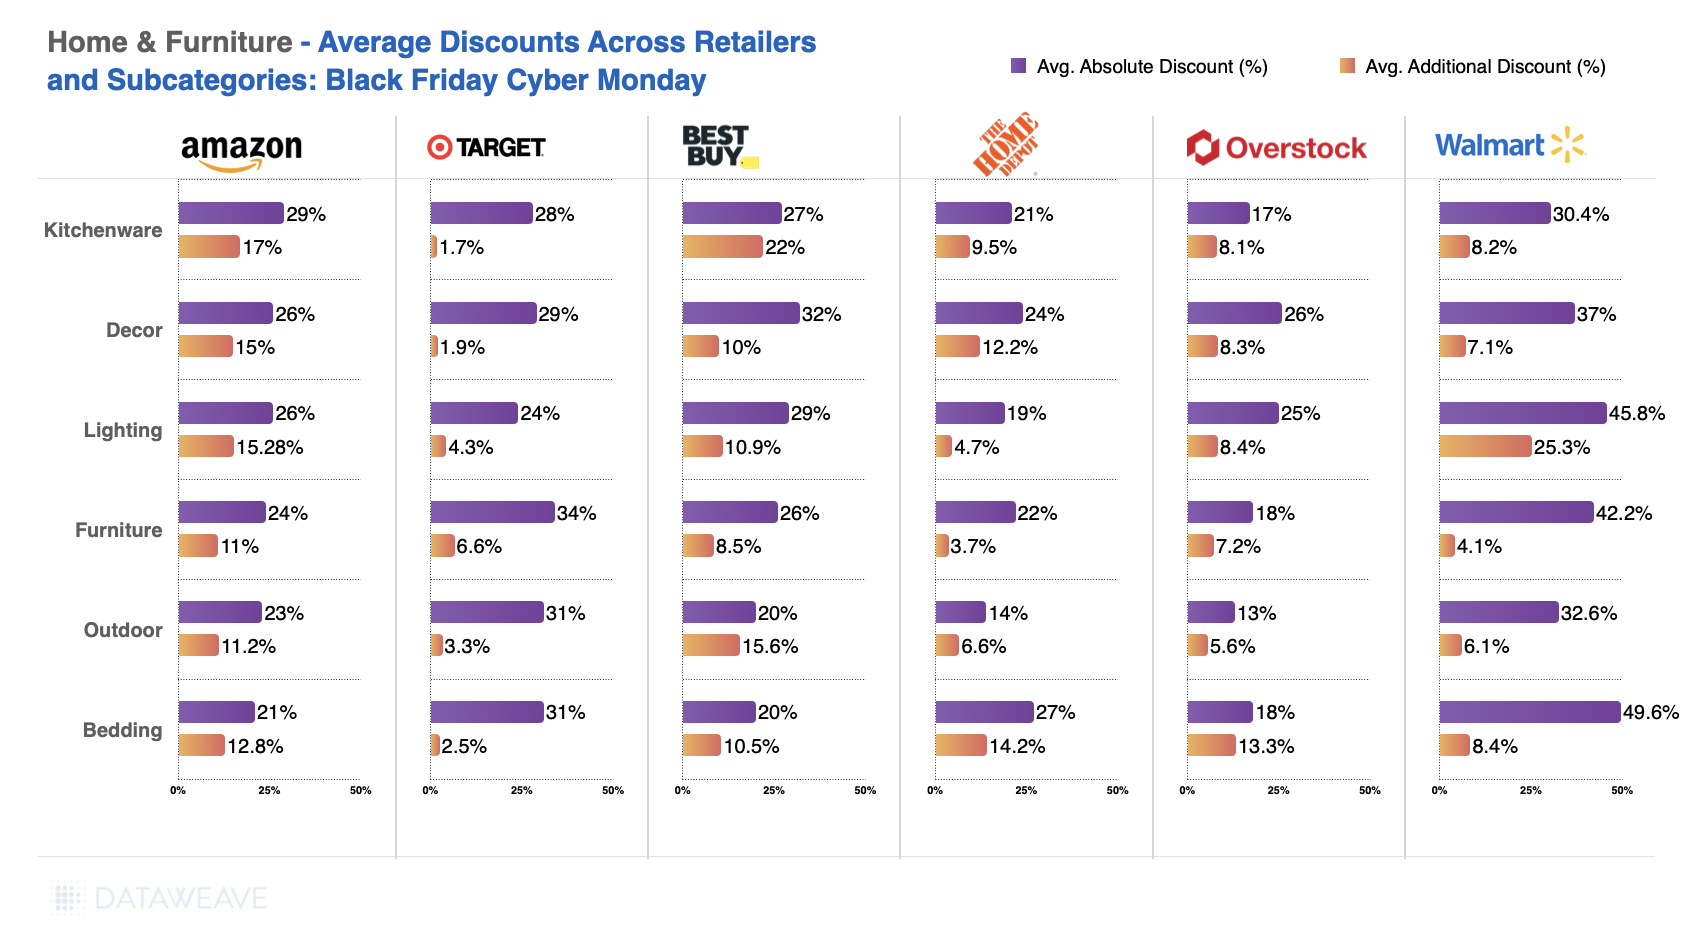
Subcategory Insights
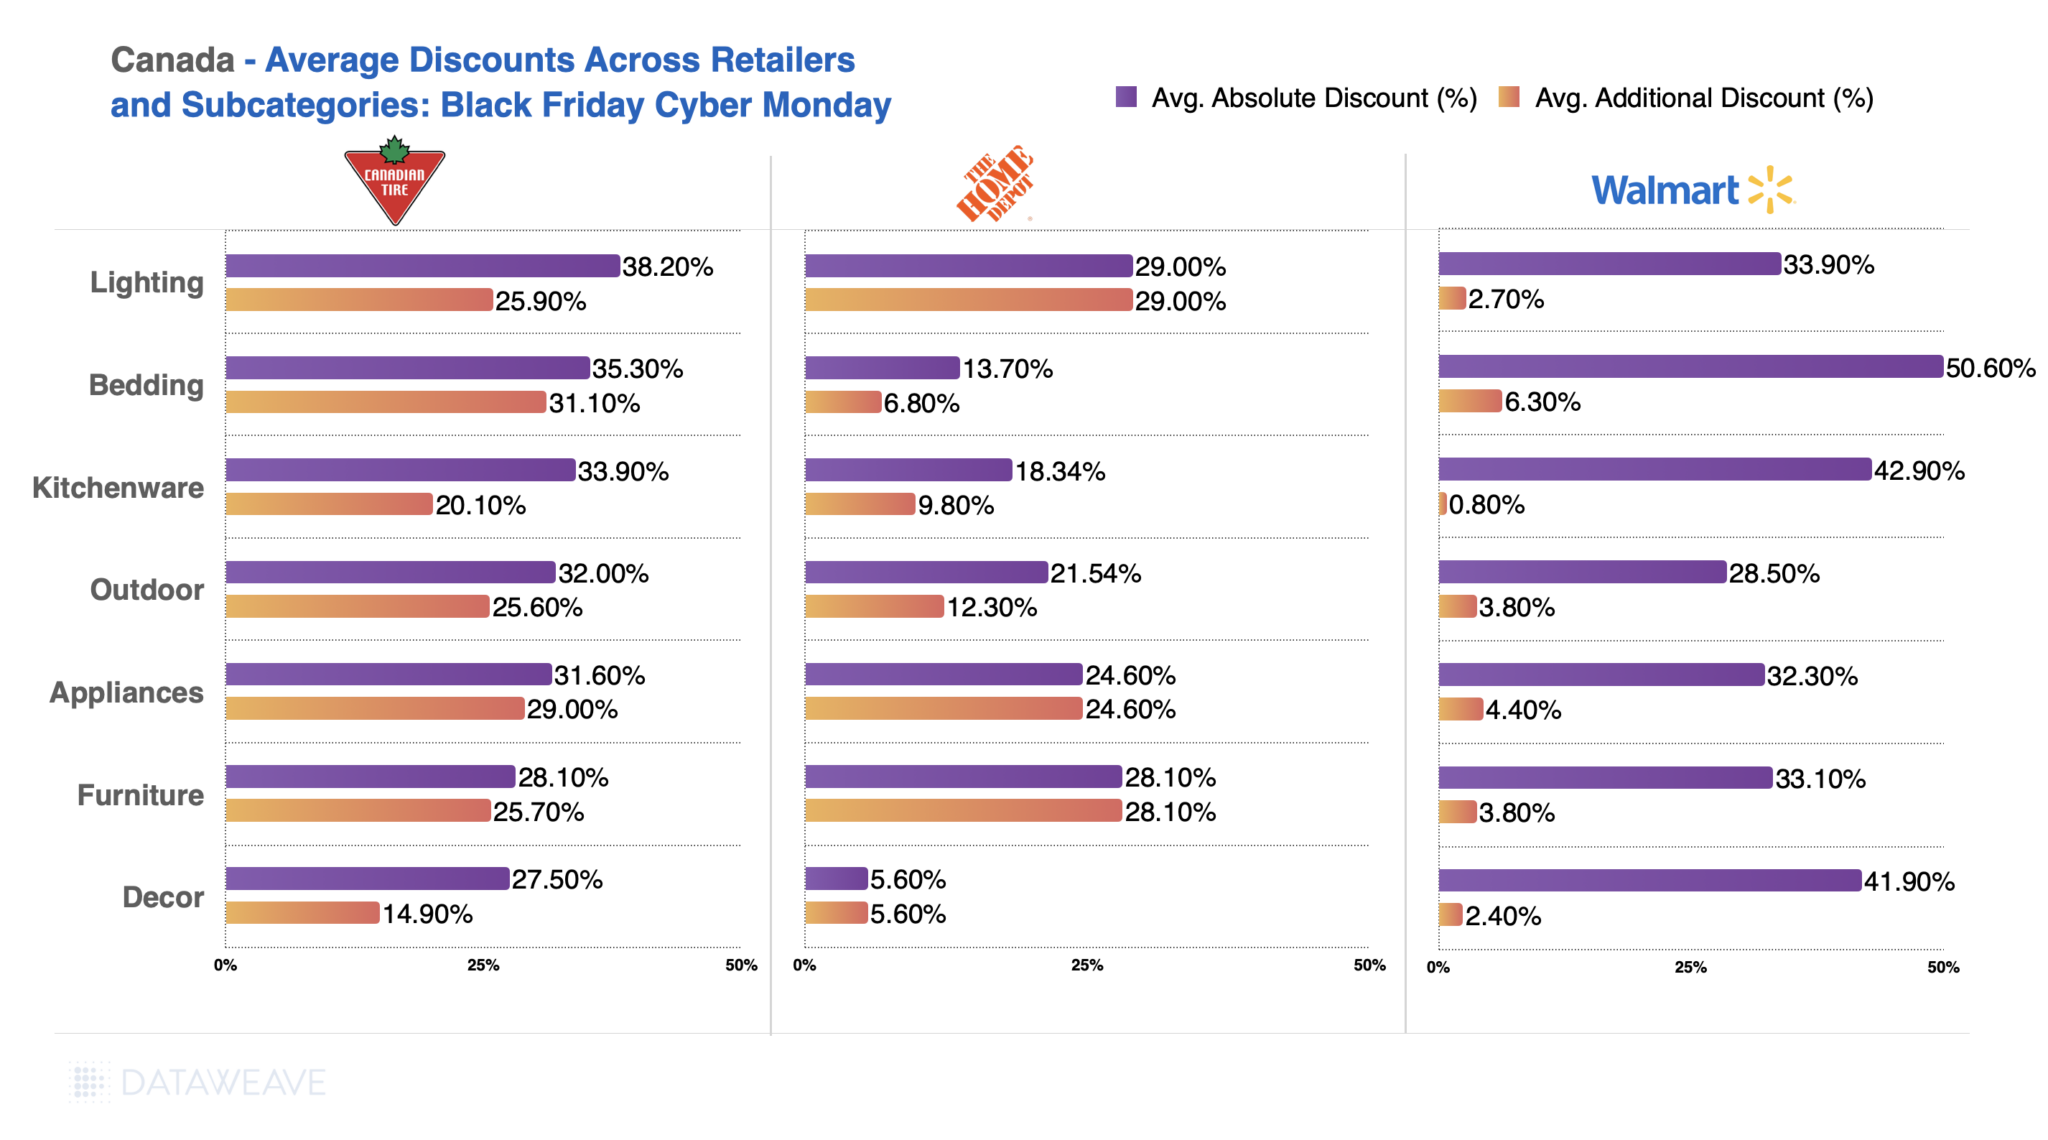
Home and furniture subcategories revealed targeted discount strategies.
Bedding emerged as the most discounted subcategory at Walmart (50.6%) and Canadian Tire (35.3%).
Kitchenware saw competitive pricing, with Walmart leading at 42.9%, followed by Canadian Tire at 33.9%.
Canadian Tire focused on lighting, offering the highest absolute discounts in this subcategory (38.2%)
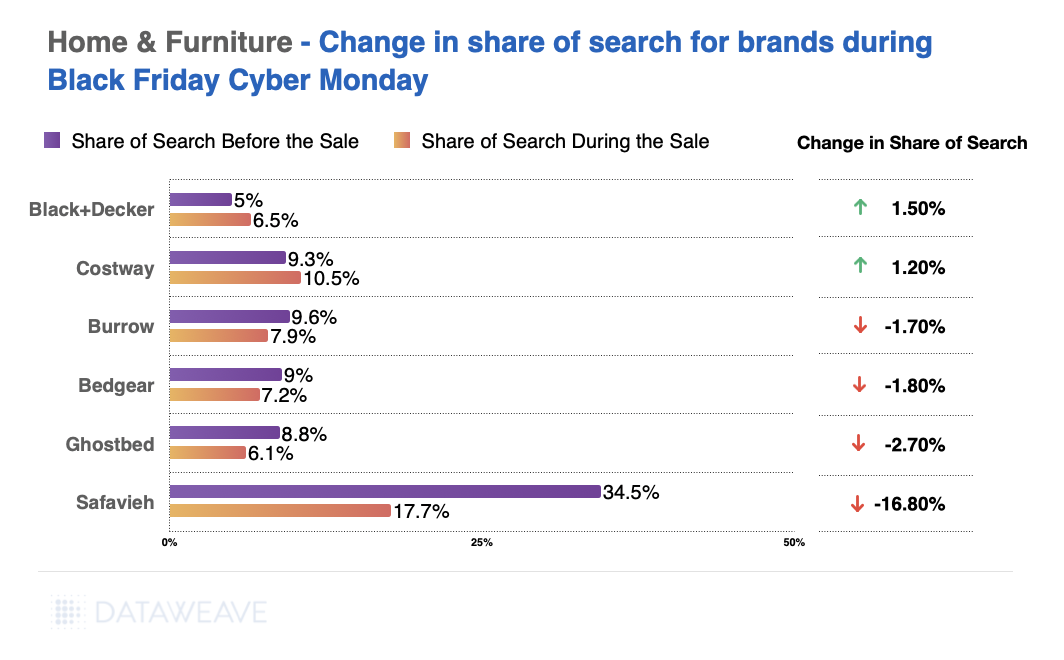
Brand Performance
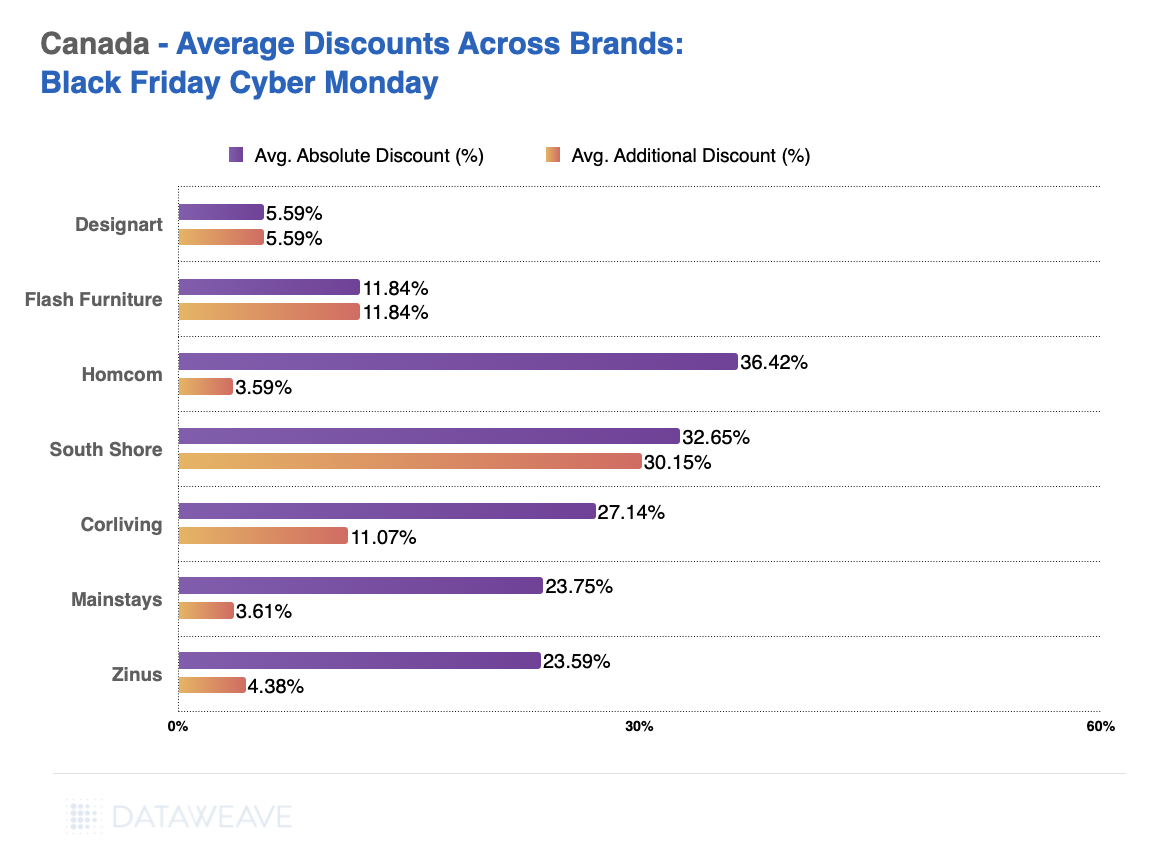
Brand-level analysis revealed stark contrasts in discounting approaches.
Furniture brands Homcom led in absolute discounts (36.4%), while South Shore stood out with the highest additional discounts (30.2%).
Value-oriented brands like furnishings brand Mainstays and mattress and bedding brand Zinus offered more modest discounts, focusing on consistent affordability.
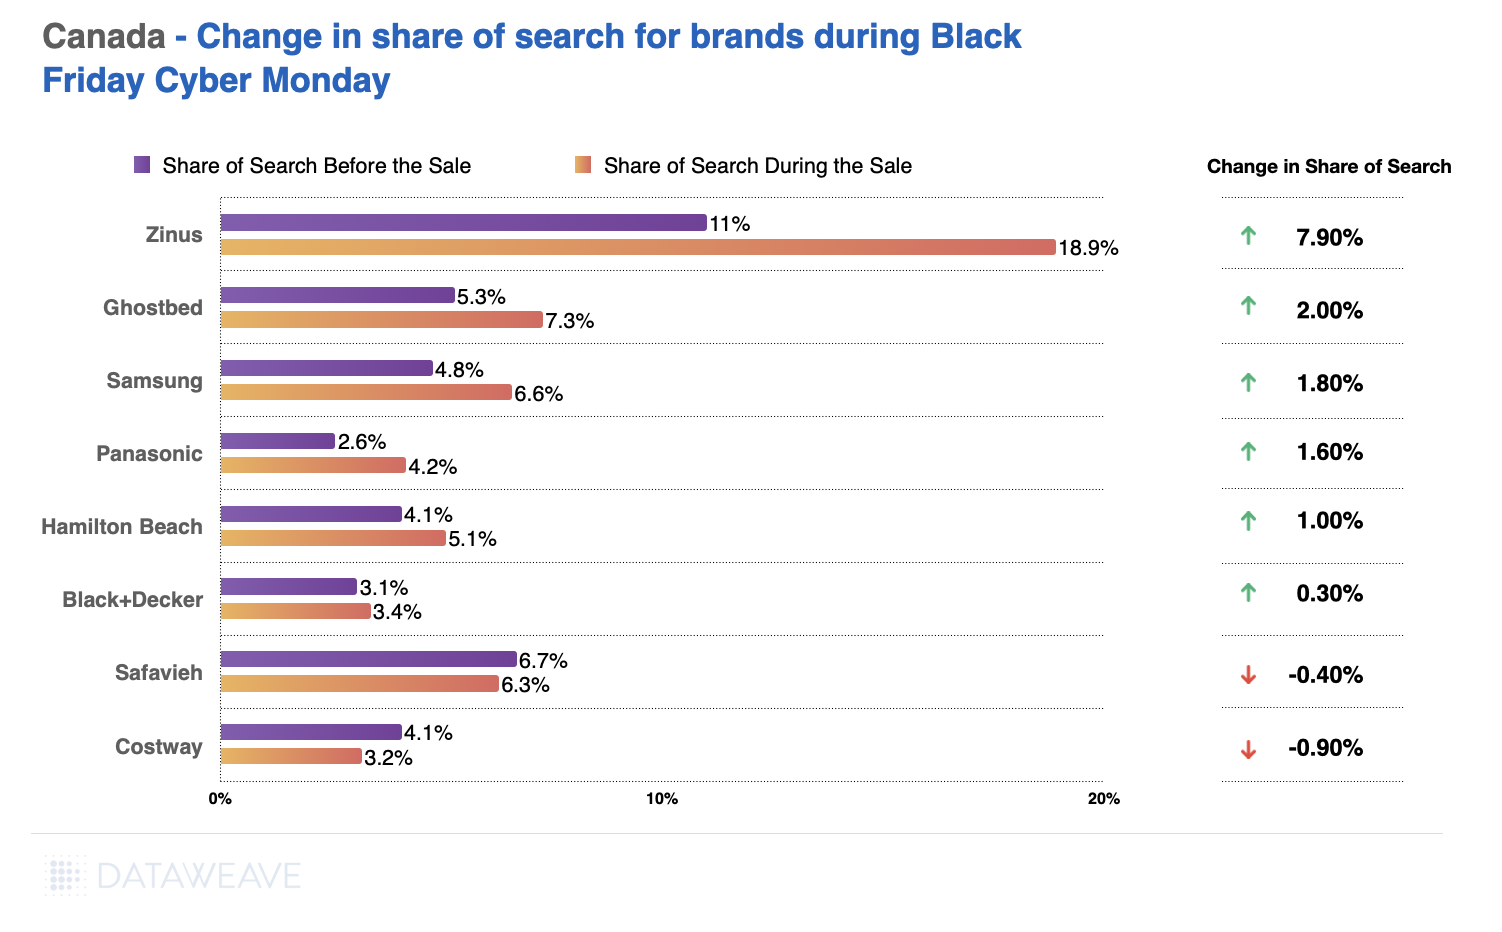
Zinus (mattresses and sofa brand) experienced a significant 7.9% increase in the Share of Search, driven by aggressive promotions.
Home furnishings brands like Costway and Safavieh faced declines, reflecting the importance of aligning promotional strategies with consumer expectations.
Insights for Retailers and Brands
This Black Friday, Canadian retailers effectively balanced deep discounts with category-specific strategies to maximize sales. However, the fluctuating Share of Search highlights the critical need for brands to align promotions with consumer interest.
For brands and retailers looking to stay ahead of the competition, DataWeave’s pricing intelligence platform offers unparalleled insights to refine discounting strategies and boost visibility. Contact us to learn how we can help you stay competitive in this dynamic retail landscape.
Americans spent a whopping total of $10.8 billion online this Black Friday. As Thanksgiving Week 2024 wraps up, one thing is clear: the consumer electronics category continues to dominate seasonal shopping trends. Fueled by a blend of enticing deals and high consumer demand, the sector delivered competitive discounts across subcategories like wearables, gaming, and mobile devices.
At DataWeave, we analyzed discounting trends in the U.S. consumer electronics market during this year’s sales events. Using our AI-powered pricing intelligence platform, we tracked pricing and promotions for 22383 SKUs across Amazon, Walmart, Target, and Best Buy from November 10 to 29. We focused on the top 500 products ranked for each search keyword on each retail site, using targeted terms aligned with categories like “gaming” and “apple.” Here’s what we uncovered.
Retailers Battle It Out with Competitive Discounts
Discount trends reveal clear leaders in terms of markdowns:
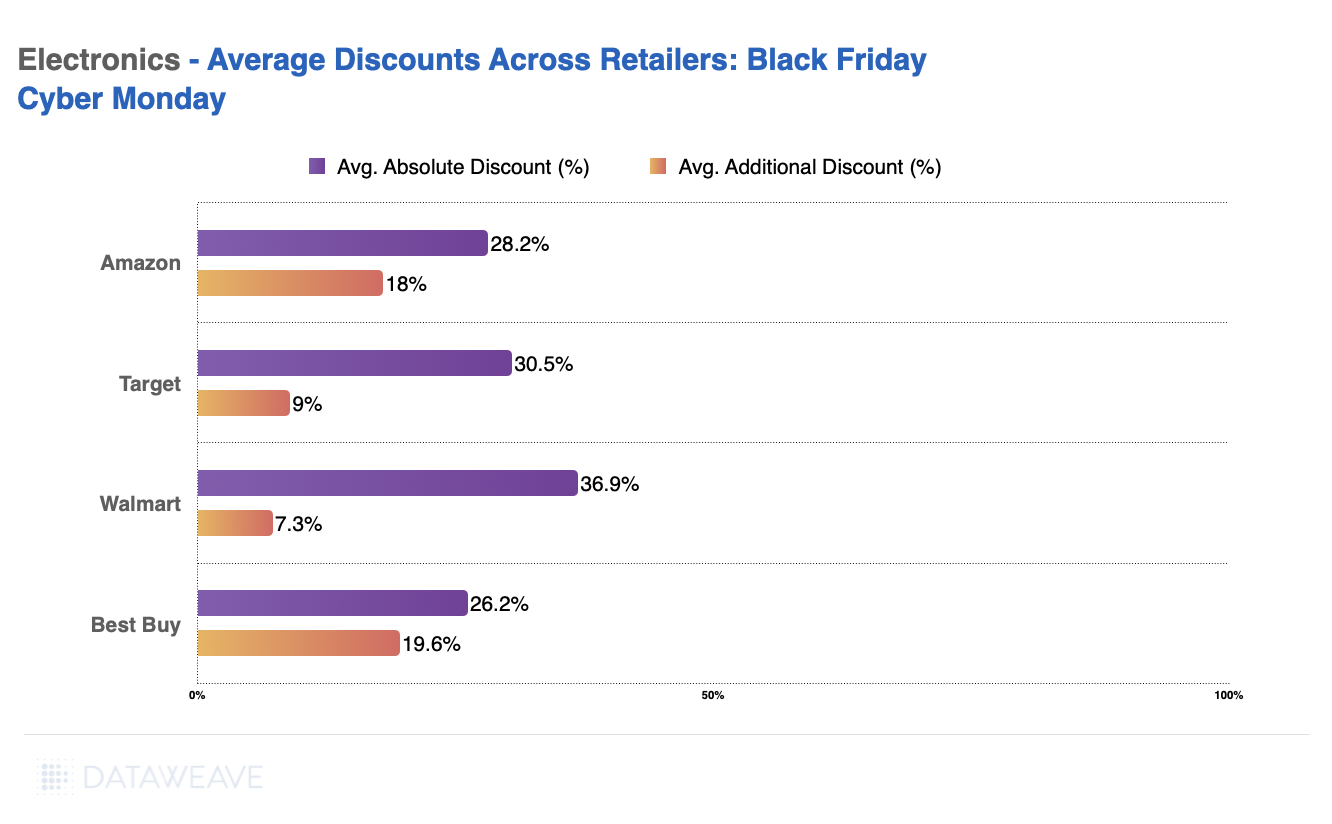
Walmart offered the deepest average absolute discounts at 36.9%.
Amazon and Target followed closely, highlighting a diverse range of deals designed to appeal to budget-conscious shoppers
Best Buy, the specialist consumer electronics retailer, offers the lowest discounts this Black Friday at 26.2%.
Note: The Absolute Discount represents the reduction of the selling price compared to the Manufacturer’s Suggested Retail Price (MSRP). The Additional Discount reflects how much lower the selling price is during Black Friday compared to its price a week before the sale. This metric reveals the actual or effective value of the sale event, beyond the standard discounts typically offered.
Subcategory Spotlight: Where the Best Deals Happened
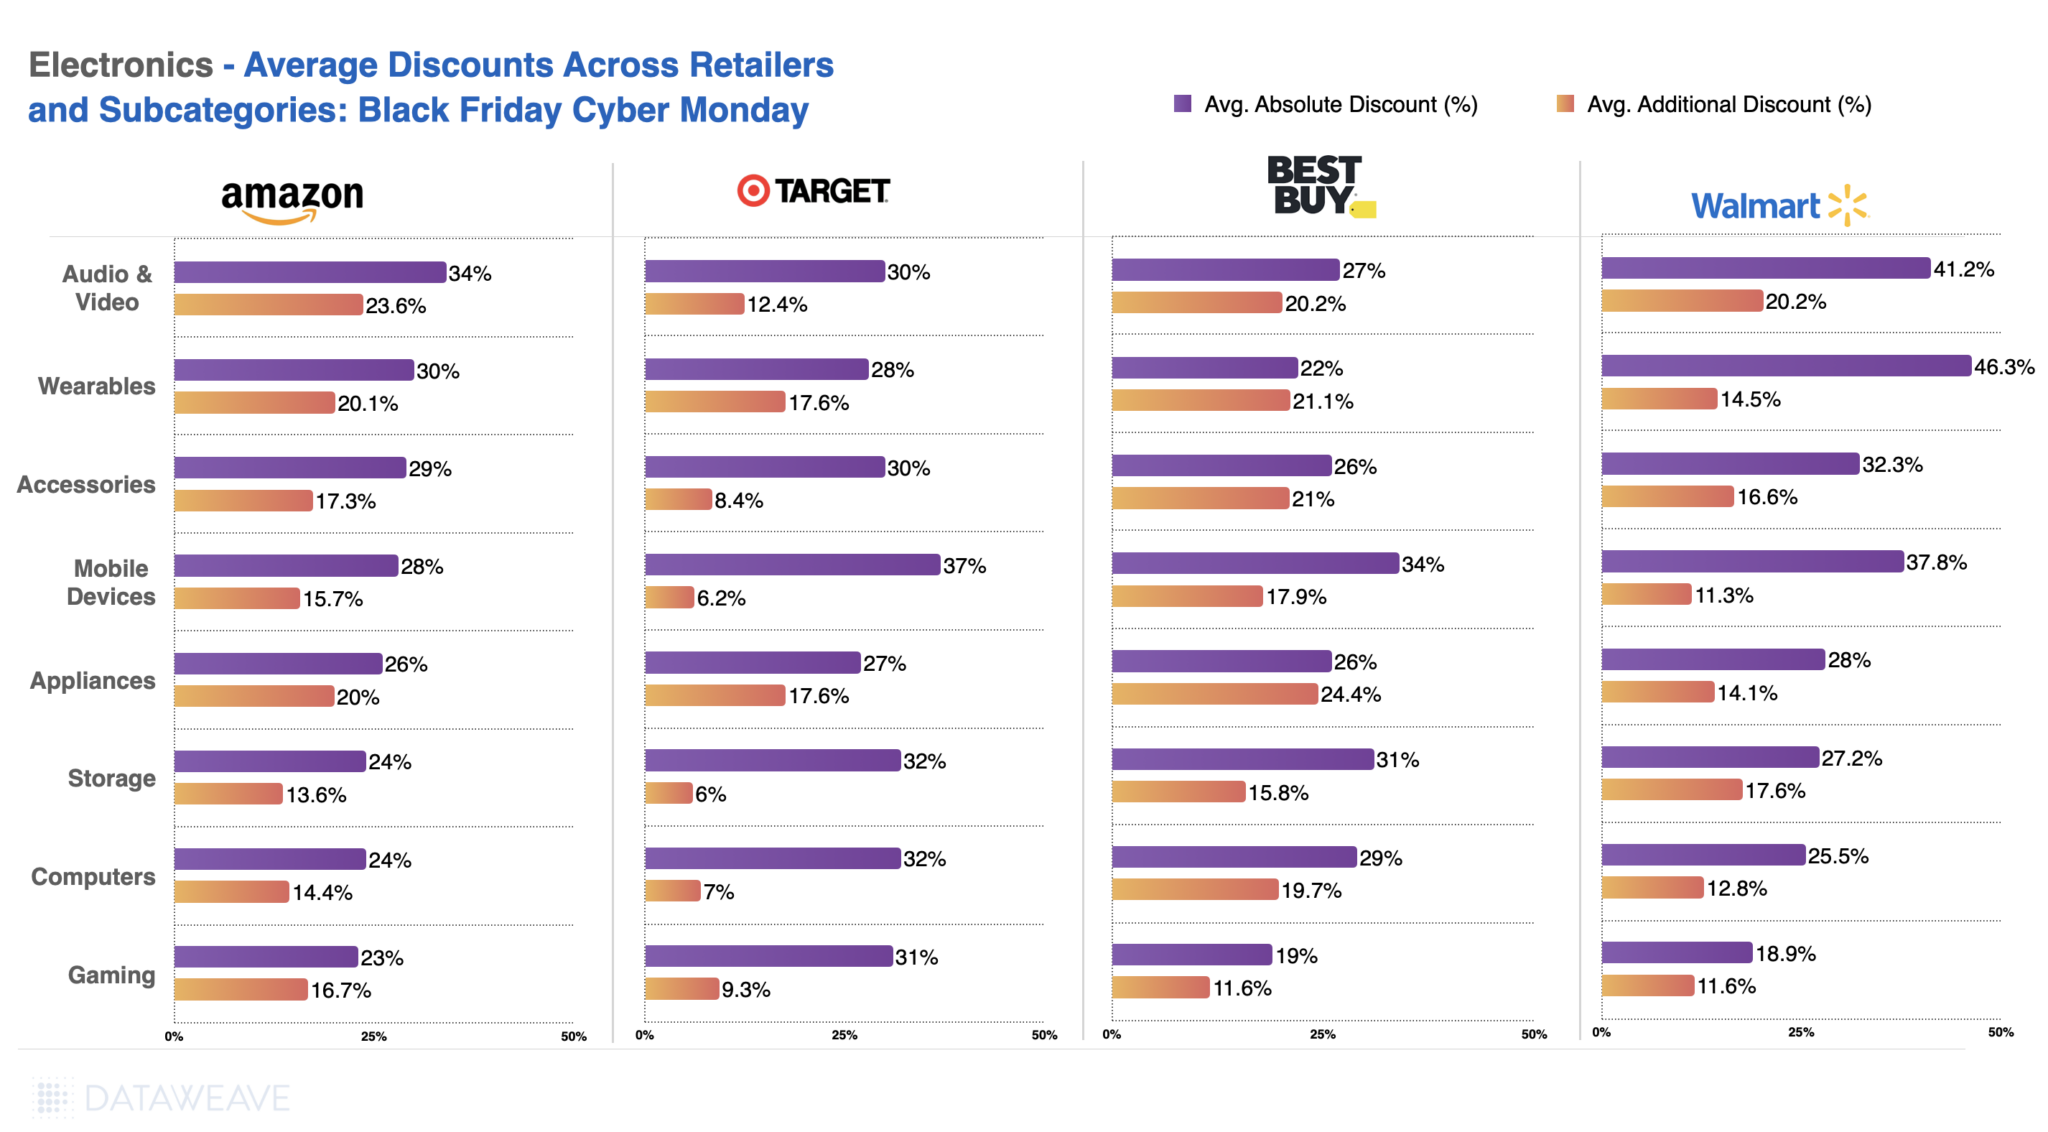
From audio & video to wearables, each retailer carved out competitive advantages across subcategories.
Both Amazon and Walmart offered high discounts in audio & video and wearables, but Walmart led, with discounts up to 46.3%.
Best Buy, meanwhile, offered high absolute discounts on Mobile Devices(34%) and Storage (31%), followed by high discounts on wearables and Audio & Video.
Amazon maintained a balanced approach, excelling in audio & video and mobile devices.
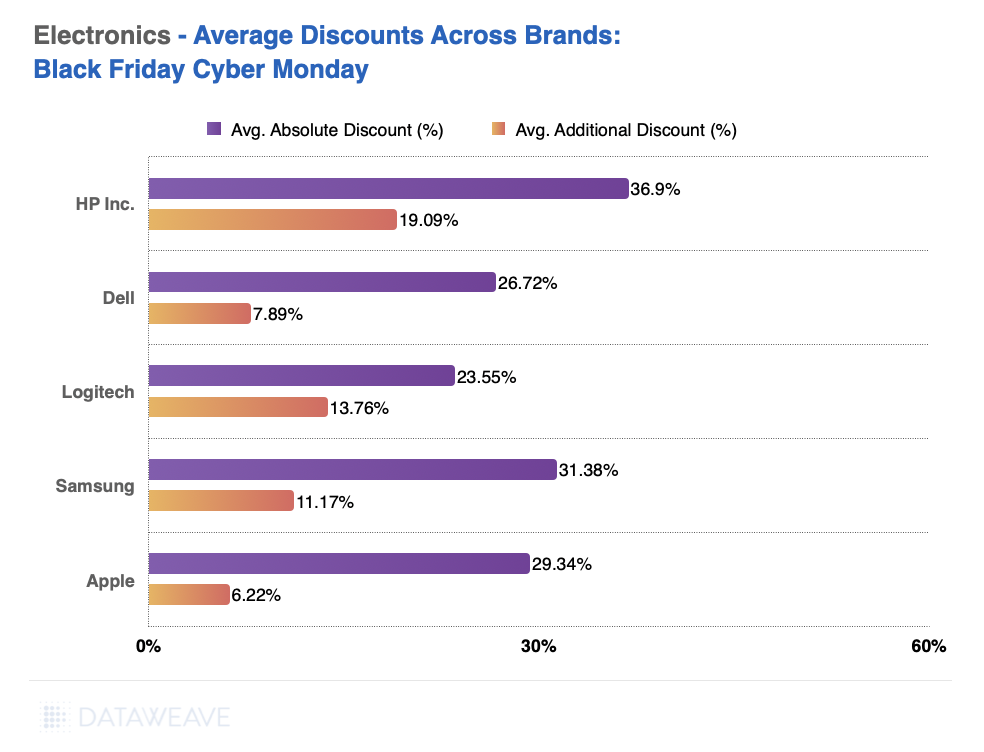
Brand-Level Insights: HP and Samsung Dominate
The biggest winners this year were brands that strategically leveraged Black Friday discounts to boost visibility and sales:
HP took the top spot with average discounts of 36.9%, followed by Samsung at 31.4%.
Despite its premium reputation, Apple offered an average discount of 29.3%, signaling a shift in strategy to attract deal hunters.
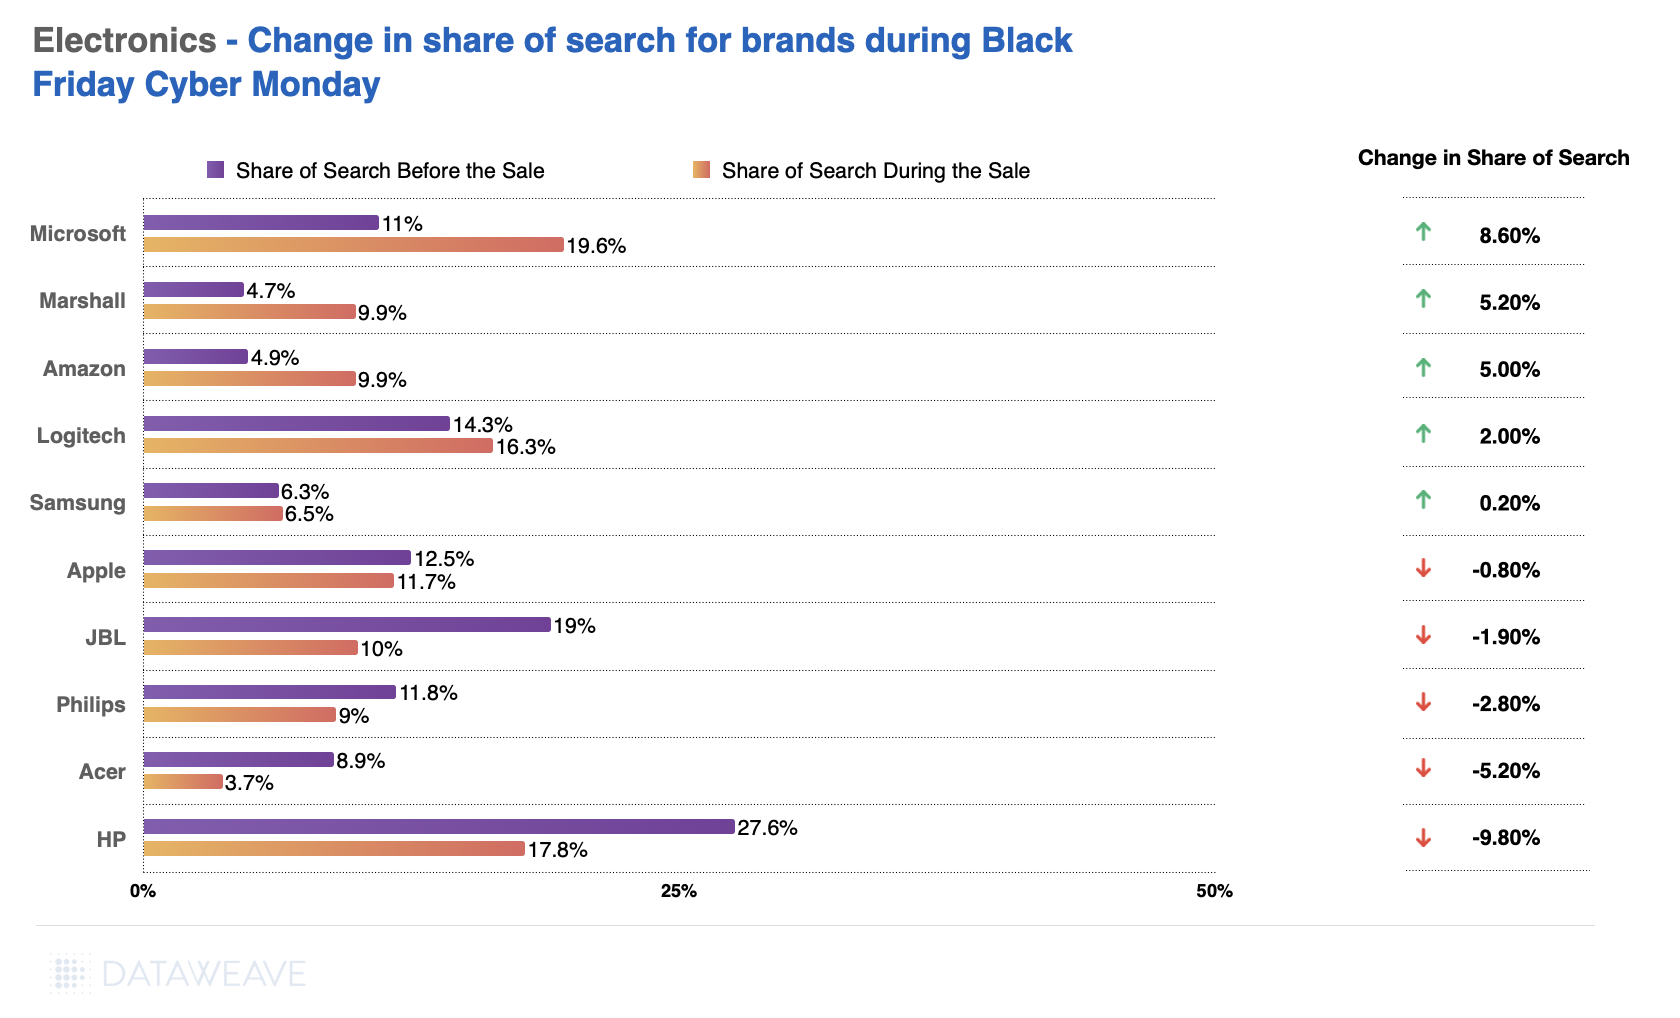
Share of Search: Shifting Consumer Attention
Search trends reveal how discounts shaped brand visibility:
Microsoft saw the largest spike in share of search (+8.6%), thanks to aggressive pricing on gaming consoles and accessories.
Marshall and Amazon also saw significant gains in visibility.
Surprisingly, HP experienced a sharp decline (-9.8%), indicating missed opportunities despite steep discounts.
In the previous analysis, we focused on the top 500 products within each subcategory for each retailer, showcasing the discount strategies for their highlighted or featured items. However, to identify which retailer offered the lowest or highest prices for the same set of products, it’s necessary to match items across retailers. For this, we analyzed a separate dataset of 340 matched products across retailers to compare their pricing during Black Friday. This approach provides a clearer picture of price leadership and competitiveness across categories.
Here are the key takeaways from this analysis.
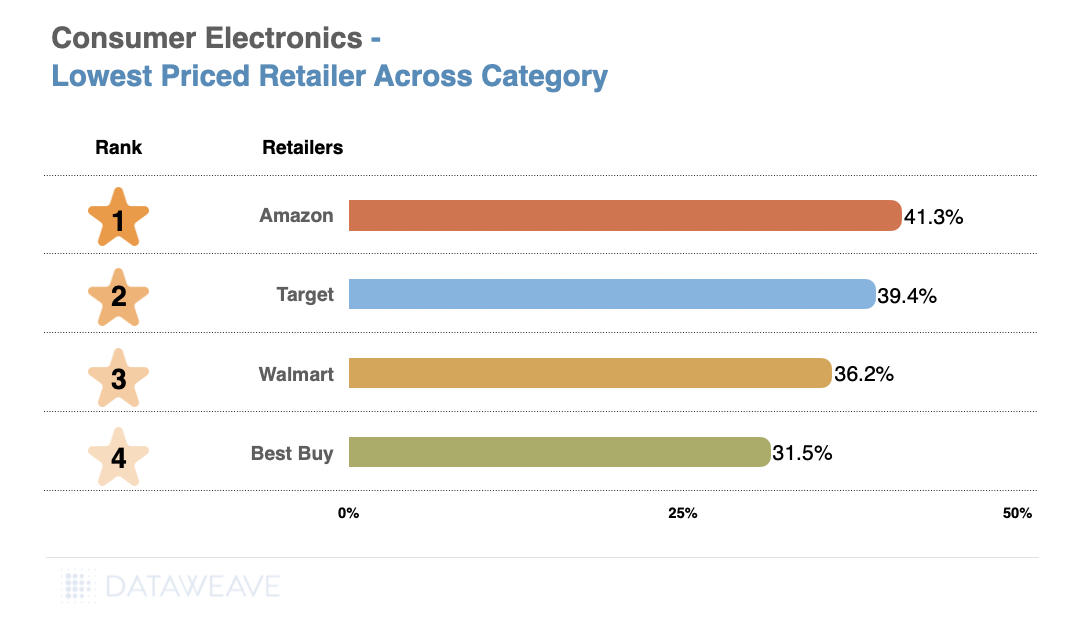
Category-Level Highlights
Amazon leads with the highest average discount (41.35%), offering the most value to consumers. It is followed by Target (39.37%) and Walmart (36.15%).
Best Buy, the specialist consumer electronics retailer, ranks last with an average discount of 31.53%, emphasizing a less aggressive pricing strategy compared to competitors.
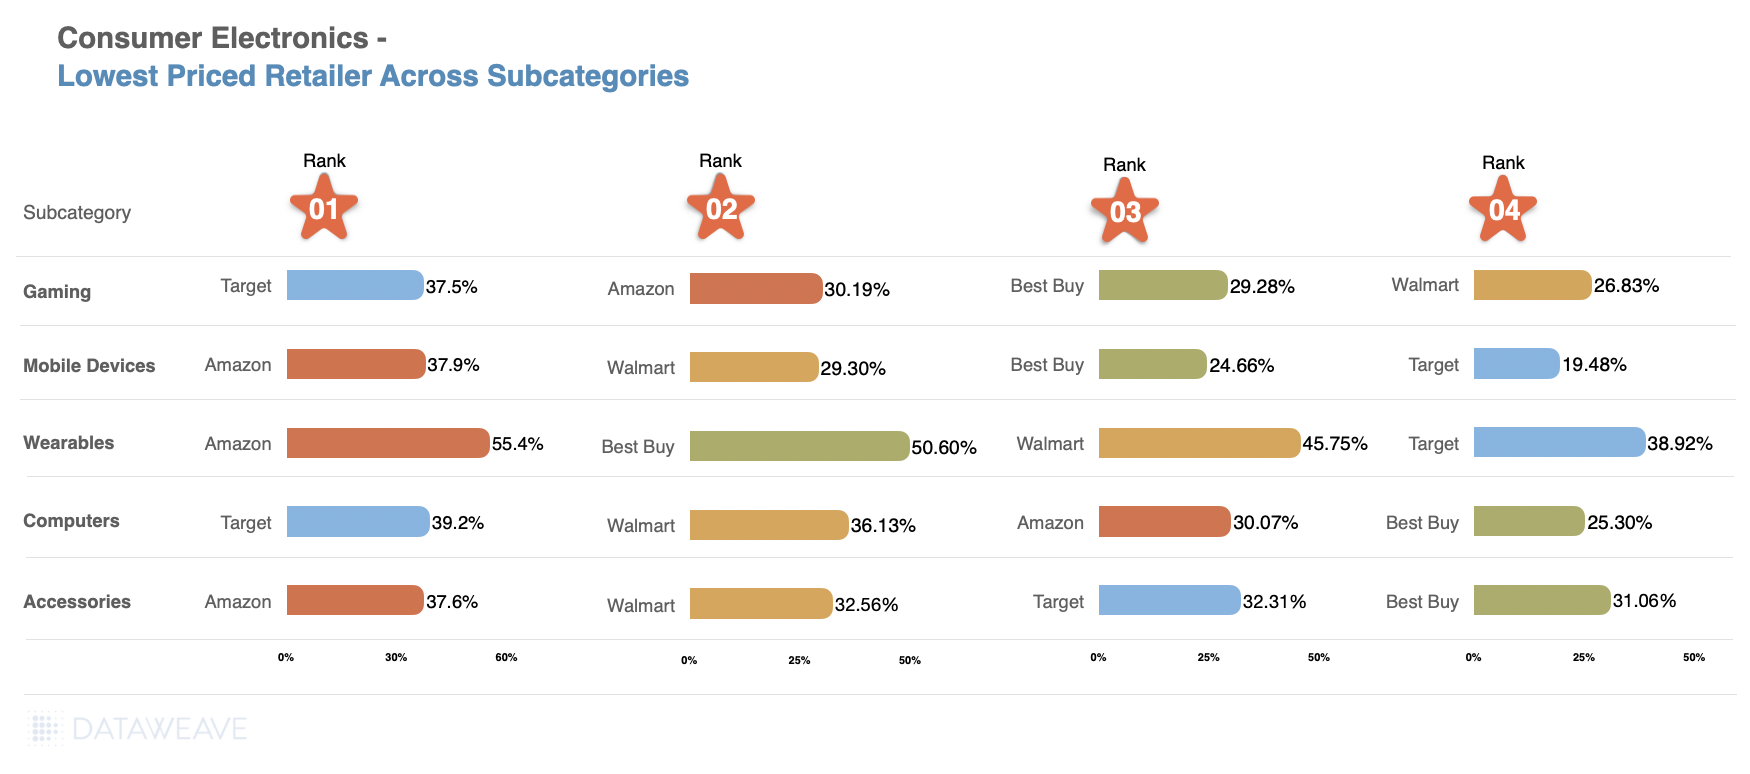
Subcategory Highlights
Wearables: Amazon offers the steepest discounts (55.40%), followed by Best Buy (50.60%) and Walmart (45.75%).
Mobile Devices: Amazon also leads (37.94%), with Walmart (29.30%) in second place and Target trailing at 19.48%.
Gaming: Target takes the lead (37.47%), with Amazon and Best Buy offering similar discounts around 30%.
Computers: Target again emerges as the leader (39.18%), narrowly surpassing Walmart (36.13%).
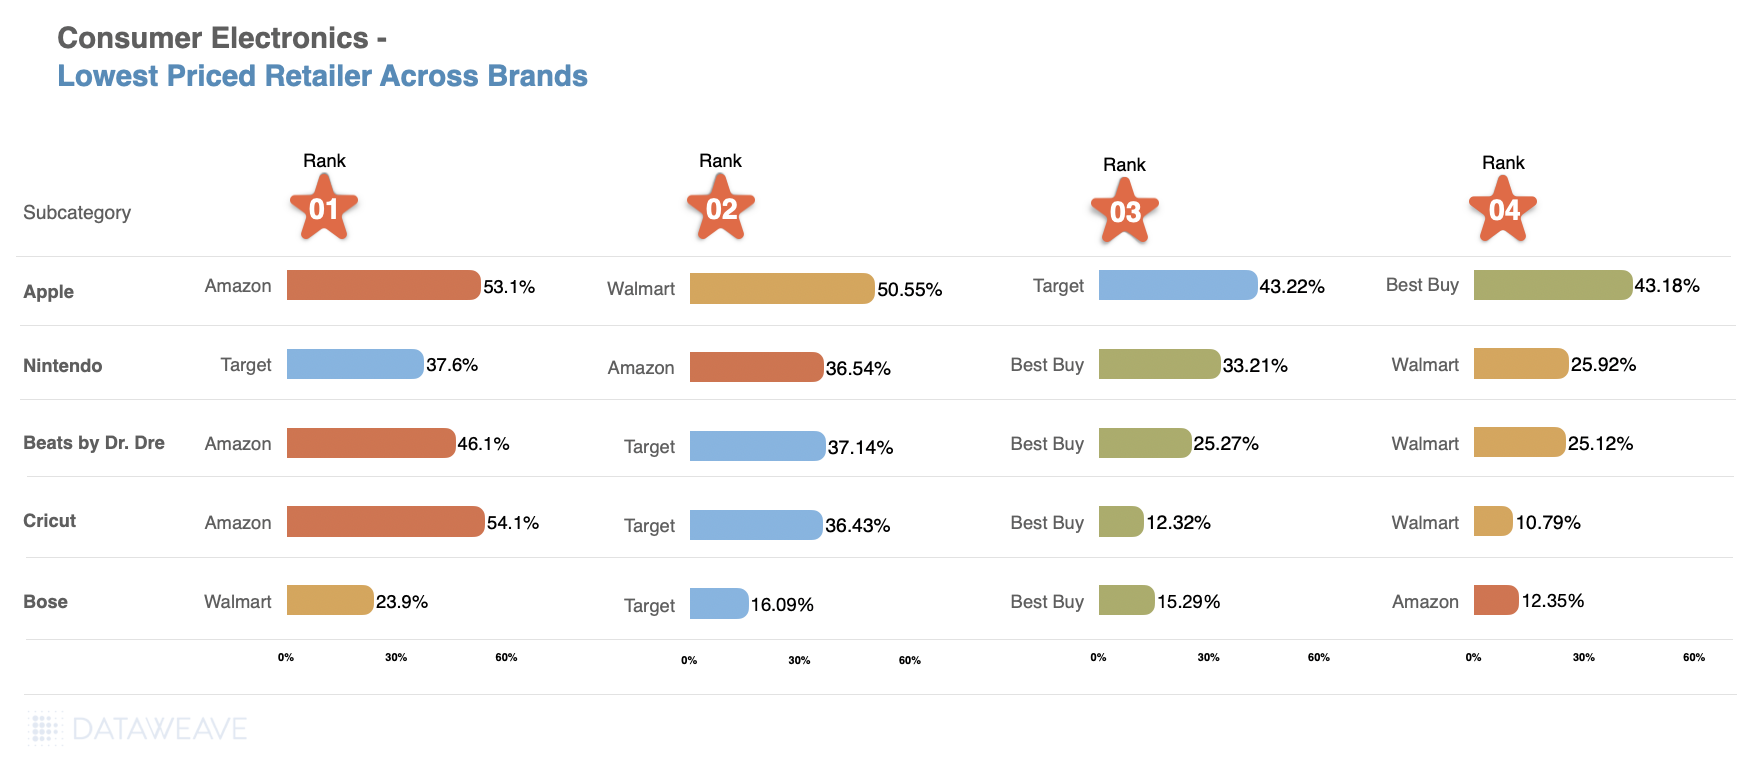
Brand Highlights
Apple: Amazon dominates with 53.06%, closely followed by Walmart (50.55%), while Target and Best Buy hover around 43%.
Nintendo: Target edges out Amazon (37.62% vs. 36.54%), with Best Buy (33.21%) and Walmart (25.92%) trailing.
Beats by Dr. Dre: Amazon leads (46.07%), with Target (37.14%) as the runner-up. Best Buy and Walmart offer comparatively modest discounts around 25%.
Bose: Walmart emerges as the value leader (23.90%), surpassing Target (16.09%) and Best Buy (15.29%).
Cricut: Amazon sets a high benchmark (54.13%), with Target far behind (36.43%) for this viral portable printer brand. Best Buy (12.32%) and Walmart (10.79%) offer significantly lower discounts.
What This Means for Retailers and Brands
Retailers looking to stay competitive should focus on strategic discounting and enhanced brand visibility. Brands must align with consumer expectations by:
Leveraging platforms like DataWeave to analyze discount trends.
Optimizing pricing and assortment strategies for seasonal demand.
For more insights into consumer electronics pricing, contact DataWeave to discover how our AI-powered solutions can drive success in today’s fast-paced market. Stay tuned for more category-specific analyses in the coming weeks!
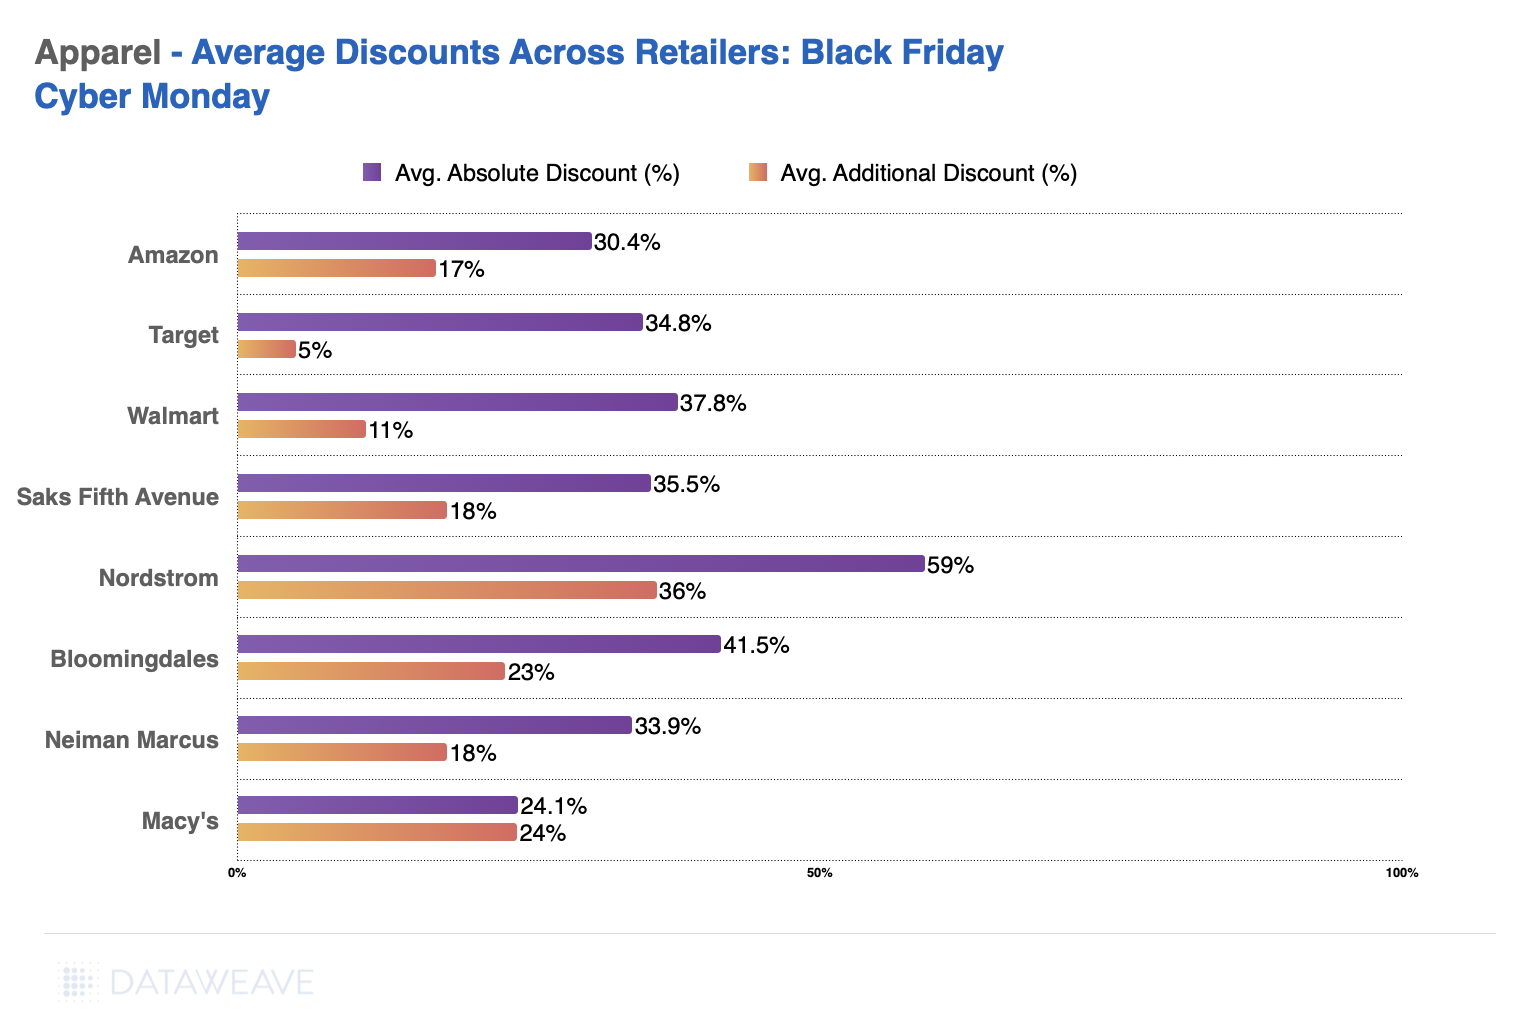
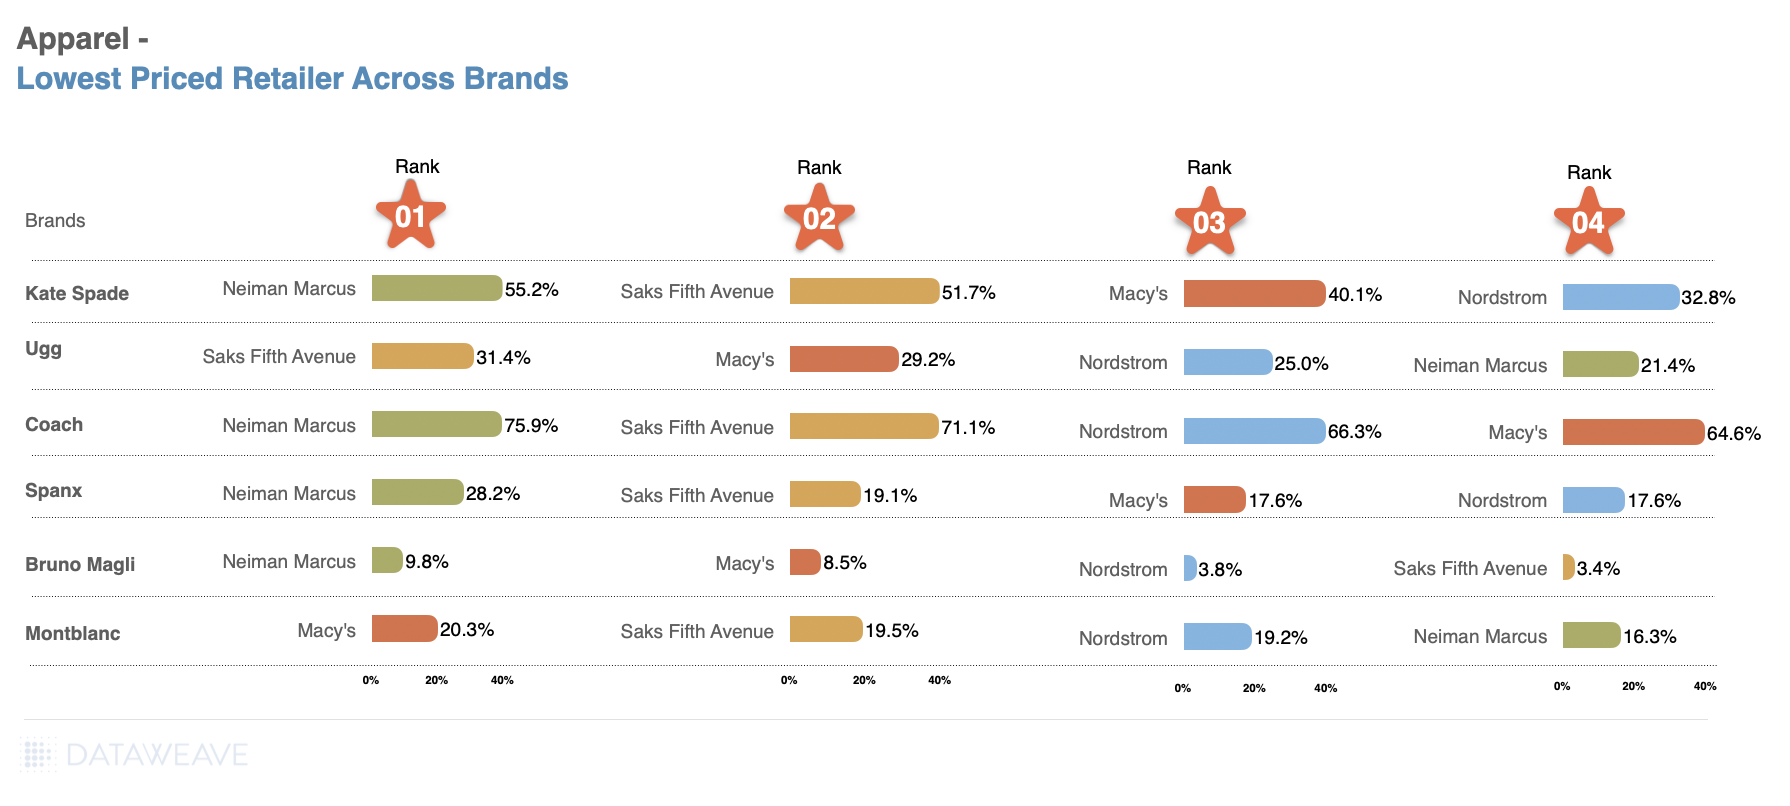
As the holiday shopping season kicked off, savvy shoppers embraced the spirit of the season, drawn by enticing deals. The apparel category is forecasted as the second highest earning category (Source: Statista), expected to generate revenues up to $43.9 billion, closely following consumer electronics. To understand the pricing strategies of top retailers amidst the sale season, DataWeave analyzed the pricing trends for the Apparel category this Black Friday.
We leveraged our AI-powered data platform to analyze the discounting across key retailers. Our analysis focused on the Apparel category, examining how Amazon, Walmart, Target, Saks Fifth Avenue, Nordstrom, Bloomingdales, Neiman Marcus and Macy’s differentiated themselves through their discounts.
For this analysis, we tracked the average discounts of apparel products among leading US retailers during the Thanksgiving weekend sale, including Black Friday. Our sample was chosen to encompass the top 500 ranked products in each product subcategory across during the sale.
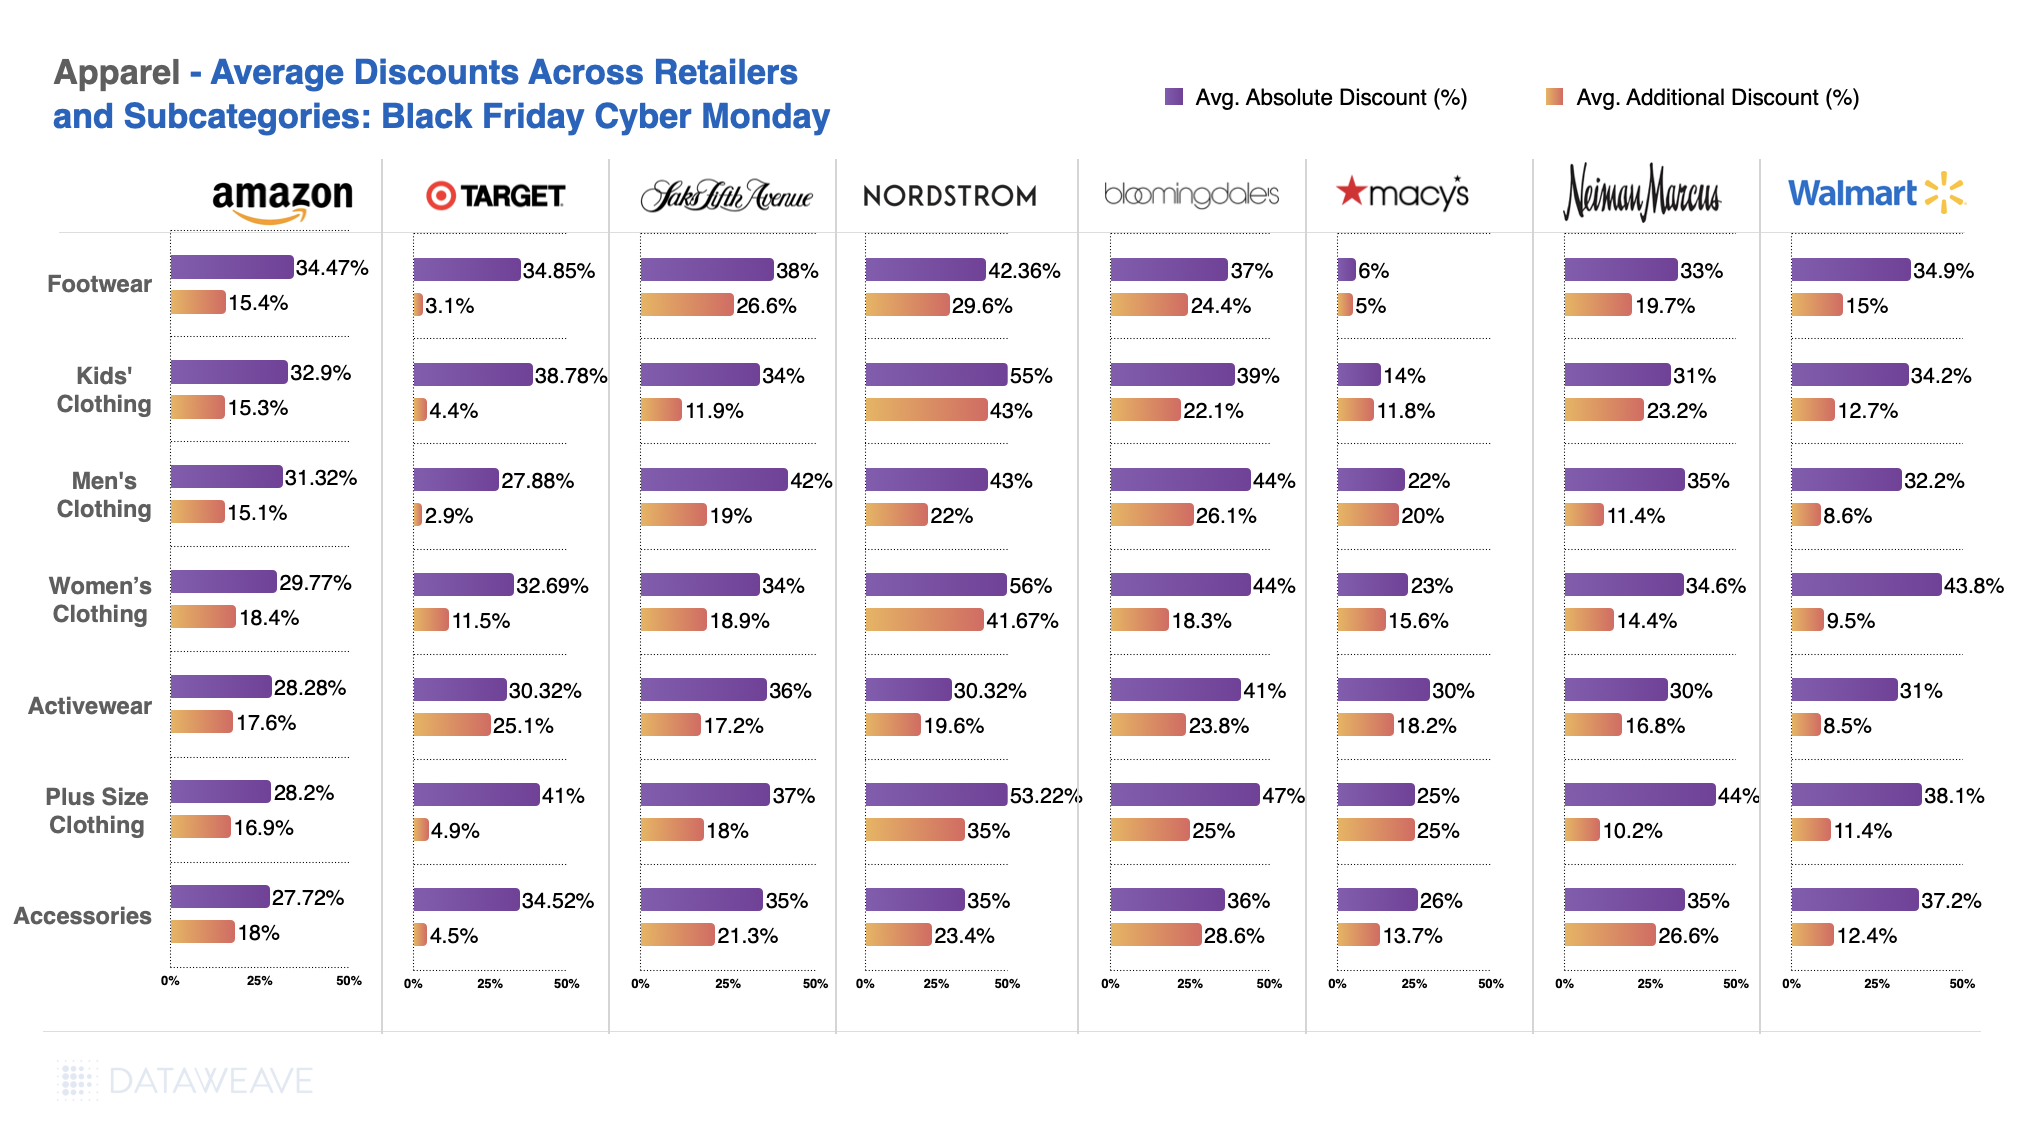
Subcategories reported on: Footwear, Kid’s Clothing, Men’s Clothing, Women’s Clothing, Activewear, Plus Size Clothing, Accessories
Timeline of analysis: 10 to 29 November 2024
We focused on the top 500 products ranked for each search keyword on each retail site, using targeted terms aligned with categories like “athleisure” and “plus size clothing”. Our methodology distinguished between standard discounts and Black Friday-specific ‘additional discounts’ or price reductions during the sale compared to the week before, to reveal true consumer value.
Key Findings
This year’s fashion discounts were unprecedented. Let’s take a look.
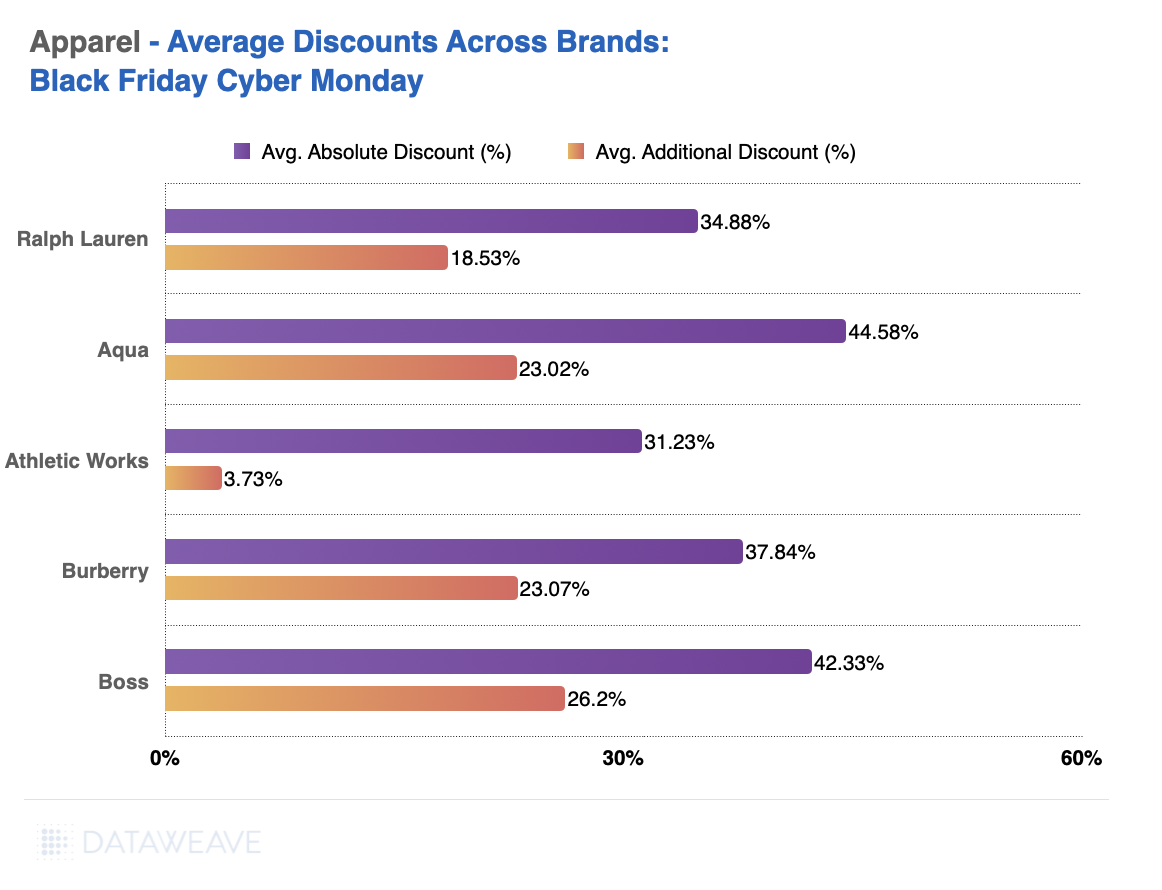
Retailer Level Insights
Nordstrom leads with the highest average absolute discount at 59%, followed by Saks Fifth Avenue at 35.5% and Bloomingdale’s at 41.5%. Macy’s shows the lowest average discount at 24.1%, while Amazon has an average discount of 30.4%.
Amazon ranks lower in both average absolute and additional discounts compared to competitors, indicating a more conservative discounting strategy.
Subcategory Analysis
Kids’ Clothing saw the deep discounts (up to 55% at Nordstrom), reflecting growing pressure on family budgets and heightened competition to attract budget-conscious parents.
Plus-Size Clothing emerged as a major focus, with Nordstrom leading at 53.22% average absolute discounts, signaling that retailers are increasingly prioritizing size inclusivity and appealing to a broader consumer base.
Footwear experienced robust discounting, particularly at Bloomingdale’s with 37% average absolute discounts, showing a competitive approach to attract customers looking for seasonal footwear deals.
Activewear displayed substantial discounts, with Walmart offering up to 41% on average, aligning with the trend of consumers looking for practical and comfortable attire during the winter season.
Brand Level Insights
Apparel brands, meanwhile, also offer telling insights.
Top Discounting Brands: Aqua leads with an average absolute discount of 44.58%, followed by Boss at 42.33% and Burberry at 37.84%.
Lowest Discounts: Athletic Works shows the lowest average absolute discount at 31.23%, with a minimal additional discount of 3.73%.
Competitive Advantage: Brands like Ralph Lauren and Boss show strong discounts, indicating aggressive marketing during the sale.
Share of Search Insights
Top Gainers: Adidas and Nike each saw an increase of 1.20% in their share of search during Black Friday/Cyber Monday, highlighting their strong brand presence and consumer interest.
Top Losers: Reebok experienced a sharp decline, losing 2.60% in its share of search, while Levi’s also dropped by 0.60%.
Search Trends: The data suggests a strong consumer preference for activewear brands like Nike and Adidas and a decline in interest for traditional apparel brands like Levi’s.
Who Offered Most Value This Black Friday
In the previous analysis, we focused on the top 500 products within each subcategory for each retailer, showcasing the discount strategies for their highlighted or featured items. However, to identify which retailer offered the lowest or highest prices for the same set of products, it’s necessary to match items across retailers. For this, we analyzed a separate dataset of 418 matched products across Apparel specific retailers to compare their pricing during Black Friday. This approach provides a clearer picture of price leadership and competitiveness across categories.
Here are the key takeaways from this analysis.
Category-Level Analysis
At the overall category level, Macy’s emerged as the lowest-priced retailer, offering the highest average discount of 28.72%, followed closely by Nordstrom (26.06%). The steep decline in average discounts from Saks Fifth Avenue (14.42%) and Neiman Marcus (7.93%) highlights a clear gap in discounting strategies.
Macy’s and Nordstrom are aggressively competitive on pricing in the overall apparel category, likely capturing consumer attention with substantial discounts.
Saks Fifth Avenue and Neiman Marcus may rely more on brand perception and luxury positioning rather than heavy discounting.
Subcategory-Level Analysis
Neiman Marcus tops the ranking with an impressive 60.85% average discount, outperforming Macy’s (52.86%) and Nordstrom (43.04%) for Men’s Clothing. We see a similar trend with Neiman Marcus offering more value across Women’s Clothing as well, compared to other retailers.
The competition in footwear was intense, with Neiman Marcus narrowly securing the top spot at 31.03%, slightly ahead of Saks Fifth Avenue (30.28%) and Macy’s (30.07%).
Saks Fifth Avenue led by a significant margin in the Activewear category, offering 39.89% average discounts, indicating a strong push in this growing segment.
Macy’s followed at 32.16% in Activewear, while Neiman Marcus and Nordstrom had comparatively lower discounts of 26.40% and 19.52%, respectively.
Brand-Level Analysis
Kate Spade New York: Neiman Marcus leads with the highest discount of 55.23%, reflecting strong price leadership in premium fashion, closely followed by Saks Fifth Avenue at 51.66%.
Coach: Neiman Marcus dominates with a significant 75.85% discount, showcasing an aggressive promotional strategy for this luxury brand.
Spanx: While Neiman Marcus leads with 28.22%, discounts across other retailers like Saks Fifth Avenue, Macy’s, and Nordstrom are clustered within a competitive range of 17–19%.
Montblanc: Macy’s takes the lead with 20.32%, signaling its competitiveness even in high-end accessories, with Saks Fifth Avenue and Nordstrom closely behind.
Ugg: Saks Fifth Avenue leads with 31.42%, focusing on maintaining price leadership for this popular brand, while other retailers remain competitive with discounts around 25–30%.
What’s Next
To win over price-conscious shoppers, retailers need to stay competitive and consistently offer the lowest prices.
For a deeper dive into the world of competitive pricing intelligence and to explore how our solutions can benefit apparel retailers and brands, reach out to us today!
Stay tuned to our blog for more insights on different categories this Black Friday and Cyber Monday.
As shoppers flocked online and to stores during Black Friday and Cyber Monday, the grocery category stood out as a key battleground for retailers. With inflation affecting consumer spending, discounted groceries have become a critical driver for both shopper savings and retailer competitiveness.
In fact, according to the NRF, one of the top shopping destinations during Thanksgiving weekend were department stores (42%), online (42%),and grocery stores and supermarkets (40%). Clearly, consumers are looking to stock up in bulk on their groceries to maximize their savings.
To understand the pricing dynamics in the grocery category, DataWeave analyzed grocery discounts across leading grocers, uncovering significant trends that shaped consumer choices during this holiday shopping period.
Our research encompassed retailers like Amazon, Target, and Walmart, examining their discounting strategies across subcategories, alongside trends in share of search for leading CPG companies.
Key Grocery Market Stats for Black Friday-Cyber Monday 2024
Retailer Discounts: Walmart offered the highest average absolute discount at 27.6%, followed by Amazon at 20.4% and Target at 14.0%
Subcategory Insights: Beverages Category at Walmart saw the deepest discounts, with an average of 33.4%
Top Gaining Brands: Cesar experienced the largest increase in share of search during the sales period (+3.89%)
This blog will dive deeper into grocery discount trends and brand-level strategies, offering insights for retailers looking to stay competitive in the grocery sector.
Our Methodology
For this analysis, we tracked the average discounts offered by major U.S. grocery retailers during the Thanksgiving weekend, including Black Friday and Cyber Monday. We focused on key subcategories within the grocery segment, capturing trends in discounting strategies.
In the following insights, the Absolute Discount represents the reduction of the selling price compared to the Manufacturer’s Suggested Retail Price (MSRP). The Additional Discount reflects how much lower the selling price is during Black Friday compared to its price a week before the sale. This metric reveals the actual or effective value of the sale event, beyond the standard discounts typically offered.
Key Findings
Retailer-Level Insights
Walmart emerged as the leader in grocery discounting, offering the highest average absolute (27.6%) and additional (18%) discounts.
Amazon adopted a mid-tier discounting strategy, with average absolute discounts of 20.4%.
Target, while more conservative, maintained competitiveness in select subcategories like baby products.
Subcategory Insights
Pantry Essentials saw Walmart leading with an average discount of 31.2%, appealing to budget-conscious consumers stocking up for the holidays.
Fresh Produce showed consistent discounting across retailers, with Amazon slightly ahead at 27%.
Beverages stood out for significant discounting at Walmart, with an impressive 33.4% average discount.
Brand-Level Insights
Lay’s led in absolute discounts (37.52%) and additional discounts (26.23%) showcasing aggressive pricing in the snacks subcategory.
Good & Gather maintained its competitive edge with strong discounts, appealing to price-conscious consumers seeking value.
Brands like Blue Buffalo (pet food brand) offered significant absolute discounts, but with a low additional discount of just 2%, the overall impact of the sale event on effective value was limited.
Share of Search Insights
Cesar (dog food brand), Tide (laundry staple) and Doritos saw significant gains in share of search, reflecting successful promotional strategies.
Brands like Pampers (baby diapers brand), Healthy Choice, (frozen foods brand) and Pedigree (pet food brand) experienced a decline, indicating less effective engagement during the sale period.
Who offered the lowest prices?
In the previous analysis, we focused on the top 500 products within each subcategory for each retailer, showcasing the discount strategies for their highlighted or featured items. However, to identify which retailer offered the lowest or highest prices for the same set of products, it’s necessary to match items across retailers. For this, we analyzed a separate dataset of 1433 matched products across retailers to compare their pricing during Black Friday. This approach provides a clearer picture of price leadership and competitiveness across categories.
Here are the key takeaways from this analysis.
Category-Level Analysis
Walmart is the lowest priced retailer overall for the grocery category, with an impressive average discount of 44.60%. This significant discount advantage makes Walmart a leading option for value-seeking consumers.
Target follows with strong discounts of 36.73%, indicating solid pricing in comparison but less aggressive than Walmart.
Interestingly, Amazon was the most expensive in Grocery, with an average discount of only 6.3%.
Subcategory-Level Analysis
Walmart leads in various subcategories such as Pet Products (21.12%), Dairy & Eggs (13.79%), Household Essentials (13.05%), Frozen Foods (15.07%), and Meat & Seafood (17.60%), showcasing its extensive value across the board.
Target excels in Beverages (14.58%) and Baby Products (15.00%) with competitive discounts, standing out in these specific subcategories.
Kroger provides notable value in Pantry Essentials (20.04%) and Fresh Produce (15.85%), although its overall average discount is lower than Walmart’s.
Amazon consistently ranks lower in terms of average discounts across most subcategories, highlighting it as less competitive for consumers seeking the lowest prices.
Brand-Level Analysis
Walmart also holds the top position for several key brands like Cheetos (14.92%) and Dannon (8.81%), making it the best option for consumers looking for budget-friendly choices across popular brands.
Target takes the lead for brands like Betty Crocker (25.20%) and Chobani (11.37%), showing that it can offer value for specific products.
Kroger maintains strong discounts for brands such as Delmonte (9.19%), but it does not outpace Walmart in the overall grocery brand comparison.
Amazon generally lags behind in average discounts for most brands, with Dannon (1.12%) and Chobani (2.43%) showing significantly lower discounts.
Walmart is the lowest priced retailer in the grocery category and provides substantial value across a wide range of subcategories and popular brands. This ties in with Walmart’s ELDP pricing strategy. The retailer leads in overall average discounts and maintains its position as the go-to for price-conscious consumers. Target offers strong value in certain subcategories and brands but falls short of Walmart’s broad value based pricing advantages.
What’s Next
For grocery retailers, competitive pricing and targeted promotions are critical to driving sales during key shopping events. As consumers continue to prioritize value, staying ahead in the discounting game can significantly impact market share.
For detailed insights into grocery discounting strategies and to explore how DataWeave’s solutions can help retailers optimize their pricing, contact us today!
Stay tuned to our blog for further analyses of other categories during Black Friday and Cyber Monday.
The Home & Furniture category continues to thrive, propelled by consumer interest in creating personalized and functional living spaces. In 2023, the U.S. furniture and home furnishings market was valued at approximately $641.7 billion in 2023 and is estimated to grow at a CAGR of 5.1% from 2024 to 2032. Black Friday and Cyber Monday play a crucial role in fueling this growth, offering consumers a mix of premium and affordable options across subcategories.
To better understand market trends and discount strategies this Black Friday, at DataWeave we tracked over 18,149 SKUs across major home & furniture retailers, including Amazon, Walmart, Target, Best Buy, Home Depot, and Overstock, from November 10 to 29, 2024. Using our AI-powered pricing intelligence platform, we focused on the top 500 products in subcategories like kitchenware, furniture, decor, lighting, outdoor items, and bedding.
In our analysis, the Absolute Discount represents the reduction of the selling price compared to the Manufacturer’s Suggested Retail Price (MSRP). The Additional Discount reflects how much lower the selling price is during Black Friday compared to its price a week before the Black Friday sale. This metric reveals the actual or effective value of the sale event, beyond the standard discounts typically offered.
Also check out our insights on discounts and pricing for the health & beauty category this Black Friday.
Retailer Performance: Who Led the Discount Race?
Retailers showed varying discount strategies for Home & Furniture products. Walmart emerged as the leader in absolute discounts (37.5%) while Amazon offered the highest additional discount of 14%. Best Buy maintained competitive pricing across all subcategories, while Overstock and Home Depot offered relatively modest discounts.
Subcategories in Focus
Breaking down the discounts by subcategory provides deeper insights into consumer priorities and retailer strategies:
Kitchenware saw strong competition, with Walmart (30.40% absolute discounts) and Amazon (29% absolute discounts) dominating.
Lighting became a discount hotspot, with Walmart offering up to 45.8% in absolute discounts and 25.3% additional markdowns.
Furniture remained a core focus for Target, delivering an impressive 34% average absolute discount.
Bedding stood out at Walmart, where discounts peaked at 49.6%.
Brand Spotlight: Who Stood Out?
Among top-performing brands, furniture brand Costway offered the highest discounts, with an average of 48.4%. Meanwhile, Adesso (lighting solutions), Mainstays and Safavieh (both home furnishings brands) balanced discounts and premium appeal.
Search Visibility: The Winners and Losers
Share of search dynamics revealed significant shifts in brand visibility during Black Friday:
Furniture brand Costway (+1.2%) and home improvement player Black+Decker (+1.5%) gained visibility.
On the flip side, premium brands like Safavieh known for rugs and home furnishings (-16.8%) and furniture brand Burrow ( -1.7%) saw declines.
Who Offers the Lowest Prices?
In the previous analysis, we focused on the top 500 products within each subcategory for each retailer, showcasing the discount strategies for their highlighted or featured items. However, to identify which retailer offered the lowest or highest prices for the same set of products, it’s necessary to match items across retailers. For this, we analyzed a separate dataset of 735 matched products across Home & Furniture specific retailers to compare their pricing during Black Friday. This approach provides a clearer picture of price leadership and competitiveness across categories.
Here are the key takeaways from this analysis.
Category-Level Highlights
Amazon emerges as the lowest-priced retailer across Home & Furniture categories, with the highest average discount of 27.50%, closely followed by Walmart (26.09%).
Overstock and Wayfair trail with average discounts of 22.93% and 20.71%, respectively, while Home Depot offers the least aggressive pricing at 18.14%. This is notable, as all 3 players are known specialists in the category.
Subcategory Highlights
Amazon stands out as the leader in multiple subcategories, including Appliances, Furniture, Decor, and Outdoor, offering competitive average discounts of around 26-29%.
Overstock leads in Bedding and Kitchenware, with strong average discounts of 24.26% and 20.72%, respectively.
Wayfair is notable for Lighting, with an average discount of 19.95%, and is also competitive in Outdoor and Furniture categories.
Walmart consistently ranks high in several subcategories like Appliances and Bedding, providing solid discounts of around 22-23%.
What’s Next
For home & furniture retailers, driving maximum value during mega sale events like Black Friday involves offering bundles and sets to meet customer demands and trend expectations. Gaining insights into competitor discounts and pricing can help furniture retailers get an edge amid this environment.
Want to know how DataWeave’s intelligence platform can empower your business during peak sales events? Contact us to discover more about competitive insights, price intelligence, and data-driven decision-making. Stay tuned to our blog to see more coverage on Black Friday 2024.
The U.S. health and beauty retail sector shows remarkable resilience amid economic uncertainties, with the skincare market projected to hit $21.83 billion in 2024. Black Friday data reinforces this trend, with health and beauty products seeing a 14.6% surge in web traffic compared to last year.
At DataWeave, we conducted an in-depth analysis of Black Friday discounting trends in the U.S. health and beauty sector. DataWeave’s AI-powered pricing intelligence platform was used to monitor pricing and discounts across Sephora, Ulta Beauty, Walmart, Target, and Amazon during Black Friday 2024. The study covered 19985 SKUs from November 10-29. We focused on the top 500 products ranked for each search keyword on each retail site, using targeted terms aligned with categories like “skincare” and “fragrance”.
The results? Beauty leads across categories in discount depth this year, with some retailers offering significant markdowns.
The Beauty Boom: More Than Just Looking Good
If there’s one thing the pandemic taught us, it’s that self-care isn’t just a luxury – it’s a necessity. This Black Friday proved that beauty has become an indispensable part of consumers’ lives, with retailers offering unprecedented discounts and crafting strategic promotions to capture the growing demand.
The Absolute Discount represents the reduction of the selling price compared to the Manufacturer’s Suggested Retail Price (MSRP). The Additional Discount reflects how much lower the selling price is during Black Friday compared to its price a week before the sale. This metric reveals the actual or effective value of the sale event, beyond the standard discounts typically offered.
Ulta Beauty led with 45% average discounts, followed by Sephora at 38.1% and Walmart at 35.2%. In terms of additional Black Friday discounts, Ulta maintained dominance at 35%, with Sephora following at 28%.
Hair care emerged as the standout category, with Ulta Beauty offering up to 56% discounts, reflecting sustained demand for at-home beauty routines. Skincare saw fierce competition, with Sephora emphasizing premium discounts (37%) while Walmart focused on value pricing (32.5%).
Fragrance and Makeup attracted consumers with targeted promotions from Walmart and Ulta Beauty, signaling strong demand for gifting items.
Major beauty brands echoed the sentiment. Premium skincare brand Clinique leads with 50.6% average discounts. Meanwhile, drugstore staples like Revlon (29.1%) and Maybelline (24.4%) balanced accessibility and affordability, driving mass-market appeal. Popular beauty and makeup brand L’Oreal Paris also offered a modest 22.8% average discount, reinforcing its position as a value-oriented brand.
The more interesting story? The massive shift in brand visibility, as our share of search rankings denote:
Shampoo and hair care brand Tresemmé saw an unexpected 5.5% jump in the share of search results
Beauty brand Herbal Essences gained 5.1% in share of search well
Declines in share of search were noted for brands like L’Oreal Paris (-1.8%) and Pantene (-0.6%), indicating missed opportunities in promotional visibility.
Insight: What’s driving this beauty boom? TikTok and social media continue to fuel beauty purchases, with viral products driving significant search and sales spikes. Plus, the “skinification” of hair care has turned basic shampoo shopping into a full-blown beauty ritual.
Who Offered the Lowest Prices?
In the previous analysis, we focused on the top 500 products within each subcategory for each retailer, showcasing the discount strategies for their highlighted or featured items. However, to identify which retailer offered the lowest or highest prices for the same set of products, it’s necessary to match items across retailers. For this, we analyzed a separate dataset of 1133 matched products across Health & Beauty specific retailers to compare their pricing during Black Friday. This approach provides a clearer picture of price leadership and competitiveness across categories.
Here are the key takeaways from this analysis.
Bloomingdale’s emerges as the overall leader, offering the highest average discount of 14.87%, closely followed by Bluemercury (12.41%).
Ulta Beauty ranks third (10.94%), demonstrating competitiveness across key subcategories, while Sephora trails with the lowest average discount (7.33%), reflecting a more premium positioning.
Ulta Beauty leads in Hair Care with the highest discount (22.62%), while Bluemercury dominates in Skin Care (13.81%), Makeup (22.98%), and Fragrance (10.6%).
Sephora consistently offers the lowest discounts across all subcategories, reflecting their premium positioning.
Bluemercury offers the lowest prices for luxury brands like Kiehl (27.02%) and Laura Mercier (34.87%), with Bloomingdale’s closely trailing.
Bloomingdale’s leads for Bumble and Bumble (13.59%) and Hourglass (23.41%), showcasing strong promotional efforts.
Sephora maintains a more restrained discount strategy, with notable leadership only for Estée Lauder (7.18%).
Ulta Beauty shines in offering the steepest discount for Briogeo (33.26%), emphasizing competitiveness in key brands.
What’s Next for Holiday Discounting?
For retailers, the message is clear: traditional holiday playbooks need a serious update. For shoppers, it means unprecedented opportunities to score deals in categories that traditionally held firm on pricing.
Want to stay ahead of retail trends and optimize your holiday shopping strategy? DataWeave’s commerce intelligence platform helps brands and retailers strategically navigate these shifts. Contact us to learn more about how we can help you make data-driven decisions in this rapidly evolving retail landscape.
Stay tuned to our blog for forthcoming analyses on pricing and discounting trends across a spectrum of shopping categories, as we continue to unravel the intricacies of consumer behavior and market dynamics.
Today, the first name that comes to anybody’s mind when they hear about online shopping is Amazon. In the US alone, Amazon accounted for over 37.6 percent of total online retail sales in 2023 with the second place Walmart not even managing to win double-digit numbers on the same scale.
With such a phenomenal market share, it is not surprising that any retail brand would want to have their products listed on Amazon for sale. However, as enticing as the potential exposure could be, the overwhelming presence of brands selling similar products on Amazon is so huge that getting fair visibility for your products may require some heavy-lifting support.
Will the Same SEO You Use for Google Work with Amazon?
Unfortunately, no, as Google and Amazon have different objectives when it comes to search rankings on their respective customer platforms. Google makes the lion’s share of its revenue from search advertising, whereas Amazon makes money when customers buy products listed on its platform by sellers.
Relying on traditional search engine optimization (SEO) techniques may not get the desired results as they are more optimized for search engines like Google. Amazon embraces its unique DNA when it comes to product display rankings on its search option.
How Does SEO Work in Amazon?
Over the years, Amazon amassed data about shopping experiences that billions of customers globally had on its platform. With this data, they developed their custom search algorithm named A9. Contrary to the gazillion objectives that Google has for its intelligent search algorithms, Amazon has tasked A9 with just a simple straightforward target—when a customer keys in a search query, provide the best choice of products that they will most probably purchase, as search results.
A9 works to fulfill the mission of guiding shoppers to the right product without worrying about semantics, context, intent, mind mapping, etc. of the search query in contrast to what Google does. As with Google search, Amazon does have paid advertising and sponsored results options such as Amazon PPC, Headline ads, etc. but their SEO algorithms are aware of how to support and boost search rankings of genuine products and brands that have taken an effort to follow best practices in Amazon SEO as well as have a great offering with attractive prices.
As additional knowledge, Amazon also has clear guidelines on what it prioritizes for search rankings. Known in the SEO world as Amazon ranking signals, these are core factors that influence how a product is ranked for search queries. Some of the top Amazon ranking signals that carry heavy influence on search rankings include on-page signals, off-page signals, sales rank, best sellers rank, etc.
What Brands Need to Strategize to Master the Amazon SEO Algorithms
From a broad perspective, we can classify the actions brands need to take in this regard in 3 core stages:
Pre-Optimization
This deals with getting first-hand knowledge about both customers who are likely to purchase your product and the competitors who are vying for sales from these very same customers. Filtering your target customer or audience is essential to ensure that you get the most ROI from marketing initiatives and that sales cycles are accelerated. For example, if your product is a premium scented candle, there is no point in wasting advertising dollars trying to win attention from customers who are not likely to ever spend on luxury home décor items.
Knowing how your competitors are performing on Amazon search, the keywords, and SEO strategies they have adapted is critical to ensure that you stay one step ahead.
Product Listing Page Optimization
This includes strategies that a brand can adopt so that its product description page gets the much-needed content optimizations to sync with Amazon’s A9 algorithm. It has a mix of keyword-integrated content, relevant images, descriptions in easy-to-understand language, localized content flavors to resonate with target buyers, etc. For example, a kitchen tool like a grater might be used for different kinds of food preparation techniques in different regions of the same country.
The brand must ensure that the description adequately localizes the linguistic or usage preference representation of the target audience. If the grater is used for grating coconut shells to extract the fibrous pulp in the Midlands and for grating ginger skin in the Far East, both use cases should be part of the product description if the target customers are from both regions.
Sales Optimization
This deals with options that have more sales strategies integrated into their core. For example, blogs on popular websites with the Amazon purchase link embedded in the content, collaboration with social media influencers, paid advertising on Amazon itself as well as on search engines, video ads, banner and display ads, etc.
The key intent here is to drive organic and inorganic traffic to the Amazon product listing page and ultimately win sales.
How Can Your Products Rank High in Amazon Search Results? Top 10 Tactics
Now that you have a clear understanding of the strategies that help in mastering Amazon’s ranking algorithms, here are some great tips to help achieve higher search rankings for your products on Amazon search:
1. Target Relevant Keywords
You need to figure out the best keywords that match what customers put as queries into the Amazon search bar. Your brand needs to clearly understand customer behavior when they arrive on Amazon to search for a product or category of products. The best place to begin looking for the same would be on competitor pages on Amazon. The keywords that helped them rank well on Amazon can help you as well. Manually investigating such a large pool of competitors is nearly impossible but with the right tools, you can easily embrace capabilities to know which keywords can help you in mimicking the success of your competitors.
2. Focus on Product Titles
Every single part of the content in your brand’s Amazon storefront or product page needs dedicated focus. Beginning with the product titles, effort needs to be made to ensure that they include the brand name, key product category or features, and other relevant keyword information.
In other words, product titles must be optimized for searchability. This searchability for product titles needs to be optimized for both mobile and desktop screens.
3. Create Product Descriptions that Resonate with the Audience
For product descriptions on your Amazon webpage, you need to figure out the optimal quality levels needed for the intended audience. Effective content can help achieve better search ranking visibility and convince the incoming traffic of shoppers to make a purchase. It is important to periodically review and modify your page content to suit the interests of visitors from both web and mobile devices.
Leveraging solutions like DataWeave can help with regular content audits to ensure you are putting out the best product content that will delight shoppers and deliver on sales conversion targets.
4. Use High-Quality Media Assets like Images and Videos
Promoting your product doesn’t have to be restricted to just textual content in Amazon product description sections. You can use other multimedia assets of high quality. These include images, videos, brochure images, etc. Every content asset must aim to educate shoppers on why your product should be their number one choice. For example, look at this detailed product description for the viral K-Beauty product COSRX Mucin Essence.
Moreover, images can help attract more attention span from visitors, thereby increasing the probability of purchases.
5. Strengthen the Backend Keywords As Well
Amazon also supports hidden backend keywords that sellers add to their product listings. They help add more relevance to products similar to meta descriptions and titles in traditional SEO for search engines like Google. A typical backend keyword may comprise synonyms, misspelled keywords, textual variations, etc. However, knowing how to pick the right ones is crucial. By analyzing your keyword rankings against competitors and higher-ranking product results in search, the platform can help you consistently optimize your content backend to help grow visibility.
6. Focus on Reviews and Ratings
Reviews and ratings on product pages are key insights that help customers with their purchasing decisions. So, it is natural for brands to keep a close eye on how their products are faring in this regard. Reviews and ratings are a direct indication of the trustworthiness of your product. When previous buyers rate you high and leave favorable reviews on your product, it will directly promote trust and help you secure a better rapport with new customers.
This upfront advantage can help boost sales conversions better. Leveraging solutions like DataWeave can help you understand the sentiments that customers have for your products by intelligently analyzing reviews and ratings.
7. Implement Competitive Pricing Strategies
The goal of most customers when shopping online is to get their desired product at the most affordable prices. The eCommerce price wars every year are growing in scale today and getting your product pricing right is crucial for sales. However, there is a need to gain comprehensive insights into how your competitors are pricing their offerings and how the market responds to specific price ranges. Solutions like DataWeave help your brand access specific insights into pricing. By analyzing competitor pricing, you can create a winning price model that is sustainable for your brand and favorable for target customers.
8. Track Share of Search
Content and other SEO activities will help improve your search rankings on Amazon. However, it is equally important to know how well your products are performing periodically against your competitors for the same set of specific keyword searches. You need to understand the share of search that your products are achieving to formulate improvement strategies. DataWeave’s Digital Shelf Analytics solution provides share of search insights helping you uncover deep knowledge on your discoverability on Amazon (and other marketplaces) for your vital search keywords.
9. Ensure Stock Availability
To achieve better ranking results, brands need to ensure that the relevant products matching the search keywords are available for quick delivery at the desired ZIP codes where users are more likely to search and order them. Out-of-stock items seldom show up high on search results. Certain products, especially if they’re popular, can get stocked out frequently in certain locations. Keeping a close eye on your stock availability across the map can help minimize these scenarios.
10. Optimize Your Brand Presence
While optimizing content and other key areas within the Amazon webpage for your product is critical, there are other avenues to help boost search rankings. One such option includes registering in the Amazon Brand Registry, which provides more beneficial features like protection against counterfeits and ensuring that your brand page is optimized according to Amazon storefront standards.
The Bottom Line
Winning the top spot in Amazon search ranking is crucial for brands that aim to capitalize on online sales revenue to grow their business. Knowing your workaround for Amazon’s proprietary SEO frameworks and algorithms is the first step to succeeding. The key element of success is your ability to gain granular insights into the areas we covered in this blog post such as competitor prices, sentiments of customers, market preferences, and content optimization requirements.
This is where DataWeave’s Digital Shelf Analytics solution becomes the biggest asset for your eCommerce business. Contact us to explore how we can empower your business to build the most visible and discoverable Amazon storefront that guarantees higher search rankings and ultimately increased sales. Talk to us for a demo today.
Brands are investing millions of dollars in digital retail media to make their products stand out amid unrelenting competition.
The ad spend on digital retail media worldwide was estimated at USD 114.4 billion in 2022, and the current projections indicate that it will grow to USD 176 billion by 2028. This amounts to a 54% increase in just six years.
The current surge in digital retail media advertising has led brands to find an effective way to monitor the efficacy of their ad spend. While Share of Search has long been used to measure brand visibility effectively, the metrics often missed tracking ads on retail sites.
DataWeave’s Share of Media solution helps solve this problem.
What is the Share of Media?
At DataWeave, Share of Media is a metric used to measure a brand’s presence in sponsored listings and banner ads on eCommerce platforms. It captures how often a brand appears in paid promotions compared to competitors, offering insights into advertising visibility and effectiveness.
These days most marketplaces seamlessly blend banner ads and sponsored listings into organic search results. Let’s take a closer look.
Banner Advertising
Banner advertising strategically places creative banners across websites—often at the top, bottom, or sides. Some eCommerce platforms also integrate these banners into product search listings.
What makes banner ads so special is the unique ability to allow marketers to use various types of media in a single ad, such as images, auto-play videos, and animations. Brands can also present curated collections of products. This flexibility provides marketers with creative opportunities to differentiate from competitors, capture customer interest, and encourage conversions.
Sponsored Listings
Sponsored listings are paid placements within search engine results or eCommerce platforms. They are usually marked as ‘sponsored’ or ‘ad,’ and they often appear at the top of search results and alongside organic product listing results.
Unlike organic search results, sponsored listings are prioritized based on the advertiser’s bid amount and relevance to users’ search queries.
Sponsored listings offer a strategic advantage by enabling businesses to connect directly with consumers who are actively searching for their products. This targeted approach ensures that marketing efforts are focused on individuals with high intent of making a purchase, maximizing the potential return on investment.
The Power of Banner Ads and Sponsored Listings
Banner ads and sponsored listings are great choices for boosting customer engagement and product sales. Here are four key advantages they offer:
Enhanced Visibility: Digital retail media strategically places your brand where it will stand out—outshining competitors and grabbing the attention of high-purchase-intent consumers.
Precision in Reach: These ads target specific keywords or categories, allowing for highly focused advertising based on demographics and search intent.
Minimal Conversion Friction: Smooth transitions from ads to a brand’s native store or product listing on the marketplace keep conversion friction to a minimum.
Brand Awareness and Recall: Consistent exposure to your brand through banner ads and sponsored product listings can leave lasting impressions and build brand recognition.
The bottom line is that it’s increasingly important for brands to monitor their Share of Media.
How to Monitor Your Brand’s Share of Media
DataWeave’s Digital Shelf Analytics (DSA) platform extends beyond the traditional Share of Search metrics and provides robust support for monitoring the Share of Media.
DataWeave monitors the Share of Media in two ways: keywords and product categories. Users can view Share of Media insights through aggregated views, trend charts, and detailed tables. The views are designed to show brand visibility and the overall competitive landscape. For example, the screenshot below, taken from DataWeave’s dashboard, showcases the Share of Media across keywords, categories, and retailers.
Share of Media by Keyword
The Share of Media metric captures a brand’s advertising presence within search listings for a designated keyword. This provides a comprehensive view of a brand’s visibility and promotional efforts across retail platforms, helping brands validate and gauge the effectiveness of their ad spend.
For example, the screenshot below shows the trend of manufacturer’s Share of Media by keyword—‘baby food.’
Share of Media by Category
The Share of Media metric measures the presence of brands’ banner ads and sponsored listings across product categories on retail sites. This helps brands see which product categories require more investment, making it easier for them to spend their ad budget wisely.
The screenshot below illustrates manufacturers’ Share of Media by category across retailers.
Share of Media: An Essential Ecommerce Metric
As retail media continues to evolve, our analytics must follow—after all, knowledge is a competitive advantage. In the dynamic world of eCommerce, where competition is fierce and consumer attention is scarce, understanding your share of media is crucial.
Analyzing the Share of Media can give brands a competitive edge. By regularly monitoring and analyzing this metric, you can make data-driven decisions to improve your brand’s visibility, attract more customers, and ultimately drive sales growth. With a deeper understanding of their target audience and market dynamics, brands can refine promotional efforts to drive more effective results and optimize return on ad spend (ROAS).
For more information on how Digital Shelf Analytics can enhance your brand’s digital shelf presence, request a demo or contact us at contact@dataweave.com.
As summer winds down, families across the US have been gearing up for the annual back-to-school shopping season. The back-to-school season has always been a significant event in the retail calendar, but its importance has grown in recent years. With inflation still impacting many households, parents and guardians are more discerning than ever about their purchases, seeking the best value for their money.
The National Retail Federation has forecasted that this season could see one of the highest levels of spending in recent years, reaching up to $86.6 billion. As shoppers eagerly stock up on back-to-school and back-to-college essentials, it’s crucial for retailers and brands to refine their pricing strategies in order to capture a larger share of the market.
To understand how retailers are responding to the back-to-school rush this season, our proprietary analysis delves into pricing trends, discount strategies, and brand visibility across major US retailers, including Amazon, Walmart, Kroger, and Target. By examining 1000 exactly matching products in popular back-to-school categories, our analysis provides valuable insights into the pricing strategies adopted by leading retailers and brands this year.
Price Changes: A Tale of Moderation
The most notable trend in our analysis is the much smaller annual price increases this year, in contrast to last year’s sharp price hikes. This shift is a reaction to growing consumer frustration about rising prices. After enduring persistent inflation and steep price growth, which peaked last year, consumers have become increasingly frustrated. As a result, retailers have had to scale back and implement more moderate price increases this year.
Kroger led the pack with the highest price increases, showing a 5.3% increase this year, which follows a staggering 19.9% rise last year. Walmart’s dramatic price increase of 14.9% is now followed by a muted 3.1% hike. Amazon and Target demonstrated a similar pattern of slowing price hikes, with increases of 2.3% and 2.7% respectively in the latest period. This trend indicates that retailers are still adjusting to increased costs but are also mindful of maintaining customer loyalty in a competitive market.
When examining specific product categories, we observe diverse pricing trends. Electronics and apparel saw the largest price increases between 2022 and 2023, likely due to supply chain disruptions and volatile demand. However, the pace of these increases slowed in 2024, indicating a gradual return to more stable market conditions. Notably, backpacks remain an outlier, with prices continuing to rise sharply by 22%.
Interestingly, some categories, such as office organization and planners, experienced a price decline in 2024. This could signal an oversupply or shifting consumer preferences, presenting potential opportunities for both retailers and shoppers.
Brand Visibility: The Search for Prominence
In the digital age, a brand’s visibility in online searches can significantly impact its success during the back-to-school season. Our analysis of the share of search across major retailers provides valuable insights into brand prominence and marketing effectiveness.
Sharpie and Crayola emerged as the strongest performers overall, with particularly high visibility on Target. This suggests strong consumer recognition and demand for these traditional school supply brands. BIC showed strength on Amazon and Target but lagged on Kroger, while Pilot maintained a more balanced presence across most retailers.
The variation in brand visibility across retailers also hints at potential partnerships or targeted marketing strategies. For instance, Sharpie’s notably high visibility on Target (5.16% share of search) could indicate a specific partnership.
Talk to us to get more insights on the most prominent brands broken down by specific product categories.
Navigating the 2024 Back-to-School Landscape
As we look ahead to the 2024 back-to-school shopping season, several key takeaways emerge for retailers and brands:
Price sensitivity remains high, but the rate of increase is moderating. Retailers should carefully balance the need to cover costs with maintaining competitive pricing.
Strategic discounting can be a powerful tool, especially for lesser-known brands looking to gain market share. However, established brands would need to rely more on quality, visibility, and brand loyalty.
Online visibility is crucial. Brands should invest in strong SEO and retail media strategies, tailored to different retail platforms.
Category-specific strategies are essential. What works for backpacks may not work for writing instruments, so a nuanced approach is key.
Retailers and brands should be prepared for potential shifts in consumer behavior, such as increased demand for value-priced items or changes in category preferences.
By staying attuned to these trends and remaining flexible in their strategies, businesses can position themselves for success in the competitive back-to-school retail landscape of 2024. As always, the key lies in understanding and responding to consumer needs while maintaining a keen eye on market dynamics.
Stay tuned to our blog to know more about how retailers can stay aware of changing pricing trends. Reach out to us today to learn more.
Our world is increasingly going online. We work online, socialize online, and shop online every day. As a consumer brand, you need to ensure complete awareness of your brand’s online presence across eCommerce platforms, search engines, and media.
Only by deeply understanding the customer journey can you ensure that your product is reaching your ideal customers and maximizing your brand’s market share. You need data to intrinsically understand your customer journey and make changes where you’re lacking.
As the old adage goes: ‘You can’t manage what you don’t measure.’
You need digital shelf metrics to measure and start benchmarking your buyer’s journey. To find several of these types of key performance indicators (KPIs), you need a digital shelf analytics solution. These platforms allow you to track various metrics along the path to purchase from the awareness stage to the post-purchase phase across the entire internet, helping to inform online and offline sales strategies.
Digital shelf analytics will help you gain insights into how your brand is doing versus the competition, which areas are lagging behind in historical performance, and what activities are driving sales. There are innumerable ways in which you can leverage these valuable insights. But how do you know which KPIs to start tracking with your digital shelf analytics solution?
Here, we’ve summarized the top metric types your peers report, track and base their decisions on.
With these KPIs in hand, consumer brands like yours can ensure that their products are consistently visible and appealing to their target audience across online marketplaces, ultimately enhancing conversion rates, market share, and profitability.
Read this guide to learn more about the top digital shelf metrics consumer brands are tracking and how to use them in your own strategy.
1. Share of Search
Share of Search (SoS) is a KPI in digital shelf analytics that measures how frequently a consumer brand’s products appear in search results on eCommerce platforms relative to the competition for specific keywords. A good digital shelf analytics solution will be able to show this metric across all the top marketplaces and retailers, such as Amazon and Walmart, but also more niche marketplaces for industry-specific selling.
This metric provides brands with a quantifiable way to measure how frequently their products are being “served up” to customers on online marketplaces. Essentially, it measures visibility and discoverability.
With Share of Search on DataWeave, you can slice and dice your data in innumerable ways. These are a few important views you can see:
Aggregated SoS
Organic and Sponsored SoS scores
SoS scores across brands, retailers, keywords, cities
Historical SoS score trends
Once you have benchmarked your SoS and category presence relative to your competition, you need to start interpreting the data. Here are some questions you can ask yourself to help interpret your findings:
Which of my key categories have the lowest SoS score?
Which products feature low on search results because they are out of stock?
Are my competitors’ products faring better due to sponsored searches?
Is my SoS low due to poor content quality?
With insights in hand, you will know which actions to take to drive the biggest impact. For example, you could increase sponsored search results or improve organic reach by optimizing product pages.
Understanding your SoS is essential to maximizing the awareness phase of your customer journey. It will help you improve your brand visibility and increase product conversions through better search and category presence.
2. Share of Media
Share of Media (SoM) is a KPI that is just as impactful, if not more so, than the SoS metric. However, only a limited number of brands track it or use it to drive strategic action. This makes it a perfect opportunity for brands looking to get an edge on the competition.
But what is SoM in digital shelf analytics? Essentially, it’s a way of measuring retail media advertising activities like brand-sponsored banners, listings, videos, ads, and promotions that sometimes blend into search results. The main types of retail media advertising exist in two categories: banner advertising and sponsored listings.
Banner advertising involves strategically placing designed banners within websites and search listings. These banners raise brand awareness and drive traffic to online storefronts.
Sponsored listings are paid placements within search results on search engines or eCommerce platforms. They are prioritized based on the total bid amount and the product’s relevance. These paid listings are marked with “sponsored” or “ad.”
These listings serve to enhance your brand’s overall visibility, help you gain more precise reach, increase conversions, and drive better brand awareness and recall with your customers.
These efforts aren’t free, however, so measuring their effectiveness is critical not only to gain all the listed benefits but to also not waste your valuable marketing budget. The SoM KPI can help a consumer brand answer questions like:
Where are the opportunities to increase paid ads?
Which categories could benefit from a promotional boost or a strategic and streamlined allocation of ad spend?
Which of my competitors have active banners and what is their share of media by keyword?
How has my ad spend trended historically in comparison to my competitor?
DataWeave’s digital shelf analytics (DSA) is among the first providers to offer Share of Media KPI tracking and analysis. This is because it requires advanced, multi-modal AI to gather, view, and aggregate listings that encompass text, images, and video. With Share of Media tracking facilitated by DataWeave, consumer brands can track and analyze the effectiveness of their own promotional investments as well as those of their competitors.
3. Content Quality
The content quality metric measures how well your product content adheres to the retailer’s specific guidelines, which are in place to steer traffic and sales on their sites.
With the help of a DSA platform’s AI and ML capabilities, you can measure different elements of your product detail pages (PDPs), such as titles, descriptions, images, videos, and even customer reviews. You need to know which elements are missing, where they are missing, and which ones are negatively affecting sales so you can take corrective action.
Did you know that the average cart abandonment rate is 69.99%? The quality of your content can significantly impact this number. Ensuring that your content is high-quality will help influence product discoverability, customer engagement, and conversion rates. It will also help position you ahead of the competition. If your content quality is poor, you may find yourself with lower search rankings, a higher return rate, and more abandoned carts.
Here are some questions you can answer with the help of the content quality digital shelf metric:
Is my product content at a retail site exactly what was syndicated?
Are there any retailer initiated changes to my product content?
Are my product content updates reflected on the retailer platforms?
How well does my product content comply with the retailer guidelines?
How do I optimize my product content for enhanced discoverability and conversion?
DataWeave’s content quality digital shelf analysis helps consumer brands ensure that product content on eCommerce platforms is high-quality and benchmark their product listings against the competition. It does this through a combination of AI-driven quality analysis and by presenting brands with actionable recommendations. These optimized suggestions are based on the top-performing products so you can focus your valuable time on the areas that will drive the biggest impact.
4. Pricing & Promotions
Your customers can easily shop around to find the best price for the product you’re selling. If your competitor is selling it cheaper, you’ll lose that sale.
That’s why it’s essential to understand the pricing and promotional landscape for each of your products and categories. This can be a challenge, especially if it’s a common product or comes in multiple pack sizes or variants.
It’s equally important to track pricing and promotions even at individual, physical stores. Doing so will allow you to remain competitive and responsive to local market dynamics by tailoring your pricing strategies based on regional competition. You don’t want your products to be overpriced (lost sales) or underpriced (lost profit) in specific markets.
Harmonizing insights when operating an omnichannel consumer brand is extremely difficult without the aid of a digital shelf analytics solution. Insights need to be aggregated between desktop sites, mobile sites, and mobile applications, as well as from physical storefronts.
Questions you can answer with the help of the pricing & promotions digital shelf metric include:
How do my product prices and promotions compare to my competitors?
How consistent is my product pricing across retail websites?
How does my product pricing vary across regions, ZIPs, and stores?
How do price changes influence my sales numbers?
Are there regional differences in pricing and promotion effectiveness?
DataWeave’s digital shelf analytics platform stands out with its sophisticated location-aware capabilities, which enable the aggregation and analysis of localized pricing and promotions. The platform defines locations based on a range of identifiers, such as latitudes and longitudes, regions, states, ZIP codes, or specific store numbers.
The platform can also extract promotional information, such as credit card-based or volume-based promotions. You can see variances across retailers, split by price groups, brands, and competitors. DataWeave specializes in enabling brands to conduct in-depth analyses across a wide array of attributes so you can answer just about any pricing or promotional question you have.
5. Availability
The availability KPI in digital shelf analytics measures the in-stock and availability rates for a brand’s products across eCommerce and physical locations. Similar to the pricing and promotions metric, it relies heavily on location awareness, down to individual stores. Measuring both online availability and offline in-stock rates will help you understand the big picture and take more informed replenishment action.
When you start leveraging the availability KPI with the help of digital shelf analytics, you can improve inventory management, boost product discoverability, increase the frequency with which your online product listings convert, and generally drive more sales. This KPI is essential for ensuring your customers can always find and buy the products they want.
With the availability KPI, you can start answering questions like:
What is my overall in-stock rate?
Which of my products frequently go out of stock?
How does product availability vary across different regions and stores?
What is the impact of availability on my conversion rates?
Are there any seasonal trends in product availability that I need to address?
How quickly are we resolving stockout issues across different locations?
What are my biggest opportunities to reduce stockouts?
DataWeave enables consumer brands to track their product availability metric through automated data collection from various eCommerce platforms in conjunction with physical in-stock rates. The platform provides granular, store-level insights so you can understand regional stock variations and optimize inventory distribution. By tracking historical availability data, you can identify seasonal patterns and predict future demand to pre-empt stockout issues. All of this can be configured with automatic notifications to alert you when there has been a stockout event or when a low stock threshold has been passed, facilitating timely replenishment.
6. Ratings & Reviews
The final KPI in our guide is the ratings & reviews digital shelf metric. Consumers rely heavily on genuine feedback from their peers and refer to star ratings, posted comments, and uploaded pictures to inform their buying decisions. This KPI analyzes the impact of customer feedback and reviews on your products’ performance across eCommerce platforms so you can measure overall brand perception and isolate areas of opportunity.
This metric does something other digital shelf metrics don’t; it can inform your product strategy. It can help you identify repeat complaints that your product team can address with the manufacturer or use for the design of future products.
Some questions you can answer with this powerful KPI include:
What is the overall customer sentiment towards my products based on ratings and reviews?
Which product features are frequently mentioned positively or negatively by customers?
How do my product ratings and reviews compare to those of my competitors?
Are there common issues or complaints that need to be addressed to improve customer satisfaction?
Which products have the highest and lowest ratings, and why?
With DataWeave’s digital ratings and reviews feature, you can keep a pulse on customer sentiment to take short-term action as well as decide long-term strategy. You can leverage reviews to influence product perception, refine products, and enhance overall customer satisfaction.
DataWeave’s Digital Shelf Metrics
Each one of these metrics is interconnected and collectively influences a brand’s success. For instance, improving content quality and earning higher ratings can significantly enhance your product’s visibility in search results, thereby boosting the Share of Search digital shelf metric. By focusing on a comprehensive approach that integrates these metrics, brands can ensure their products are consistently visible, competitively priced, well-reviewed, and readily available.
DataWeave gives consumer brands the means to execute a holistic digital shelf strategy. From a single portal, track and improve digital shelf metrics like Share of Search, Share of Media, Pricing and promotions, Availability, and Ratings and Reviews.
Our solutions help audit and optimize the most critical KPIs that drive sales and market share for brands so you can stay competitive in a dynamic digital landscape and foster long-term customer satisfaction.
As the dust settles on Amazon’s 8th Prime Day extravaganza in India, held on July 20-21, 2024, the eCommerce giant has once again shattered records. This year’s event saw unprecedented engagement, with 24% more Prime members participating compared to 2023, marking the highest-ever Prime member involvement in the sale’s history.
At DataWeave, we’ve conducted an extensive analysis of this landmark event, examining over 47,000 SKUs across major categories for Flipkart and Amazon to uncover compelling insights into pricing strategies, competitive positioning, and emerging trends in the Indian eCommerce space. This follows our comprehensive analysis of Prime Day in the USA across categories and brands, which readers can explore for a global perspective on Amazon’s strategies.
Key Highlights:
Tier-2 Cities Drive Growth: This year’s exponential growth was notably fueled by orders from tier-2 cities, highlighting the expanding reach of eCommerce in India.
Swift Deliveries: Most Prime members’ orders from metros were delivered the same day or the next, while tier-2 cities saw deliveries in less than 2 days, highlighting the importance of delivery time when it comes to purchase decisions.
Brand Participation: Over 450 top Indian and global brands participated, including Intel, Samsung, OnePlus, and Puma, alongside 3,200 new product launches from small and medium Indian businesses. This highlights Amazon’s policy to promote small, local businesses globally in 2024.
Premium Products in Demand: Despite modest discounts across electronics and similar offerings, consumers chose to purchase premium products during Prime Day. With financial flexibility and no-cost EMI options, Indian consumers, especially Gen Z and millennials, are now ready to invest in premium products and experiences.
Our analysis focused on both the Additional Discounts offered during Prime Day (calculated relative to prices the week prior to the event), highlighting the event’s genuine benefits, and the Absolute Discounts offered during Prime Day, representing the total markdown relative to the MRP.
Cross-Category Discount Strategy
Our analysis this year reveals that the Consumer Electronics category saw the highest Absolute Discounts with an average of 48.9%, closely followed by Apparel at 46.9%. The Health & Beauty category had the lowest Absolute Discount at 32.1%.
However, Amazon offered the highest Additional Discount in Health & Beauty at 9.3%. Electronics and Apparel had additional discounts of 8.6% and 7.7% respectively.
Overall, Flipkart chose to not compete aggressively with Amazon during Prime Day this year. Only in Electronics did Flipkart offer an additional discount of 3.2% during the sale. Price changes in Apparel and Health & Beauty were negligible.
Category Deep Dive
Consumer Electronics
In Electronics, Earbuds (14.7%) and Wireless Headphones (12.5%) saw the highest Additional Discounts on Amazon, likely due to high demand for personal audio devices. Smartwatches followed closely at 12.5%, indicating a strong push in the wearable technology sector.
Larger electronic appliances like TVs saw more modest Additional Discounts (5.2%), despite a significant Absolute Discount (42.3%).
Smartphones, interestingly, had the lowest Additional Discount (2.8%) among the subcategories, potentially due to their already competitive pricing or brand-specific strategies.
Brand-level Insights in Consumer Electronics
During the sale event, Soundcore (headphone and earphone brand from Anker) led with the highest Additional Discount of 10.3%, followed closely by OnePlus at 9.3%. These brands clearly leveraged Prime Day to drive sales and potentially gain market share.
Sennheiser and Sony also offered significant additional discounts, indicating aggressive promotional strategies during the event.
Notably, some well-known brands like Apple and HP offered more conservative discounts, possibly due to their established market positions or differing promotional strategies.
Despite modest discounts though, Amazon revealed that the iPhone 13 and OnePlus 12R were among the top premium smartphones customers bought this Prime Day. Prime members shopped from top brands such as LG, IFB, Bosch, and Haier and upgraded to premium appliances through affordability options of no cost EMI, Bank discounts and exchange offers, claims Amazon.
These learnings offer valuable insight into the mindset of the modern Indian consumer, who is ready to purchase premium products. Brands can leverage more detailed market intelligence to drive their positioning in India.
Share of Search Analysis
The Share of Search (SoS) for a brand represents the number of its products in the top 20 search results for relevant search keywords on Amazon, relative to that of its competitors. It provides insights into a brand’s visibility during the sale event.
HP saw the most significant improvement in its Share of Search during Prime Day, gaining 9.2%, with strong growth in both organic (7.5%) and sponsored (1.7%) listings. LG also made substantial gains of 8.2% and 5.3% respectively. Both brands offered significant markdowns on laptops and accessories.
Surprisingly, some popular brands like Apple (-0.6%) and Acer (-1.0%) experienced slight decreases in their SoS. Lenovo notably lost 7.2% of its visibility share, with a significant decline in organic listings (-7.6%). Samsung maintained its strong position with an increase in SoS (3.7%).
Key Takeaways:
While some brands like Soundcore and OnePlus used aggressive discounting to drive sales, others like HP and LG focused on improving their search visibility. The data suggests that a combination of attractive discounts and improved search visibility was key to success during the event. Brands that managed to balance these factors effectively, like HP and Samsung, seemed to perform particularly well. Interestingly, some brands with lower discounts (like HP) still managed to significantly increase their SoS, indicating that factors beyond pricing played a role in visibility during the event.
Apparel
Within the subcategories analyzed, Women’s Shoes (13.4%) and Men’s Shoes (11.6%) saw the highest Additional Discounts on Amazon, indicating a strong focus on footwear during the event. Men’s Shirts followed closely at 11.1%
Women’s Tops had a more modest Additional Discount of 7.9% despite a high Absolute Discount before the event. Similarly, Women’s Dresses showed substantial Additional Discounts (10.4%).
Swimwear for both men and women saw low Additional Discounts (3.7% and 3.0% respectively). Innerwear categories for both men and women had more conservative discounts, with Men’s Innerwear showing the lowest Absolute Discount (19.9%) among all subcategories.
Brand-level Insights in Apparel
During the sale event, Sangani (innerwear brand) led with the highest Additional Discount of 41%, followed by Louis Philippe at 25%. These brands clearly leveraged Prime Day to drive sales and gain market share.
Puma offered the highest Absolute Discount at 60% with a significant Additional Discount of 20%, indicating a consistently aggressive promotional strategy. Chromozome (men’s innerwear brand) and Bacca Bucci (homegrown shoe brand of Shark Tank India fame) also offered substantial Absolute Discounts (57% and 56% respectively), but their Additional Discounts varied significantly (16% and 6% respectively).
Again, some well-known brands like Adidas, and Pepe Jeans offered more moderate Additional Discounts, possibly due to their established market positions.
Share of Search Analysis
Biba (women’s ethnic wear brand) saw the most significant improvement in its SoS, gaining 3.60%, entirely through investments in sponsored listings. Allen Solly and New Balance (shoe brand) also made substantial gains of 3.3% and 3.2% respectively.
Surprisingly, some popular brands like Louis Philippe (-2.00%) and Sangani (-2.10%) experienced decreases in their SoS. Louis Philippe lost its share due to a roll back of its sponsored listings, while Sangini lost ground organically.
Key Takeaways:
While some brands like Sangani and Louis Philippe used aggressive discounting to drive sales, others like Biba and Allen Solly focused on improving their search visibility through sponsored listings.
Some brands with high discounts (like Sangani) saw a decrease in SoS, while others with more modest discounts (like Biba) significantly increased their visibility. This indicates that factors beyond pricing played a crucial role in brand performance during the event.
The significant use of sponsored listings by some brands highlights the importance of paid advertising in gaining visibility during competitive events like Prime Day.
Health & Beauty
Health & Beauty emerged as a standout category during Amazon Prime Day India 2024, with significant discounts and competitive strategies at play.
Within the subcategories we analyzed, Moisturizer (11.9%) and Sunscreen (11.8%) saw the highest additional price reductions on Amazon, likely due to seasonal demand during Prime Days. Make-up followed closely at 10.6%.
Electric Toothbrushes had the highest Absolute Discount at 47.1%, but a lower Additional Discount of 6.0%, highlighting that these products were already significantly discounted before the event. Similarly, Beard Care products showed high Absolute Discounts (43.7%) but lower Additional Discounts (5.7%) during Prime Day.
Everyday essentials like Toothpaste saw more modest discounts (19.9% Absolute, 8.4% Additional), reflecting steady demand for these products.
Brand-level Insights in Health & Beauty
Vaseline led with the highest Additional Discount of 13.1%, followed by Maybelline at 9.5%. These brands clearly leveraged Prime Day to drive sales and potentially gain market share.
Honest Amish (beard care brand) and Nivea also offered substantial Absolute Discounts (15.6% and 8.2% respectively), but their Additional Discounts were lower, indicating pre-existing promotional strategies.
Once again, some well-known brands like Colgate, Dove, and Neutrogena offered more conservative discounts, possibly due to their established market positions or differing promotional strategies.
Share of Search Analysis
Maybelline saw the most significant improvement, gaining 5.6% in SoS, all through organic listings. The brand has been aggressively increasing market share with several new product launches and influencer campaigns. Nivea and Vaseline also made substantial gains of 5.2% and 3.8% respectively.
In this category as well, some popular brands like Dove (-0.4%), Pond’s (-0.8%), and Honest Amish (-0.8%) experienced slight decreases in their SoS. Parodontax (toothpaste brand) notably lost 1.3% SoS, with most of the decline in sponsored listings. Colgate maintained its strong position with a slight increase in SoS (0.2%), reflecting its dominant market presence.
Key Takeaways:
While some brands like Vaseline and Maybelline used aggressive discounting and improved visibility to drive sales, others like Colgate and Dove relied more on their established market positions.
None of the brands made any significant strides in sponsored listings, revealing that brands in this category are not yet fully leveraging retail media to help manage and boost their visibility on online marketplaces.
Final Thoughts
Amazon Prime Day 2024 has redefined the eCommerce landscape in India, yet again, showcasing diverse strategies employed by brands to maximize their impact. By understanding and leveraging these insights, brands and retailers can better navigate future sales events, optimizing their eCommerce strategies to achieve sustained growth and success.
Stay tuned to our blog for more in-depth analyses of brand and retailer performance across various retail events.
Reach out to us today to learn how you can leverage data-driven insights to optimize your eCommerce strategy.
Amazon Prime Day 2024 saw U.S. shoppers spending a staggering $14.2 billion online during the two-day event—an 11% increase from last year. This surge in spending reflects a significant shift in consumer behavior and presents a wealth of insights for brands and retailers alike.
Unlike last year’s focus on essentials, Prime Day 2024 saw Americans enthusiastically embracing both necessities and discretionary purchases. The Consumer Electronics and Health & Beauty categories, for example, experienced a notable uptick in interest, driven by major retailers slashing prices across CPG and Grocery segments, amid other reasons. Check out our first article in the Prime Day series 2024, analyzing retail insights across categories during the event.
This year, small businesses gained unprecedented visibility on Amazon, pushing relatively new brands into visibility.
At DataWeave, we recognize the critical importance of understanding these market dynamics for brands navigating the competitive eCommerce landscape. To provide actionable insights, we conducted an extensive analysis of over 47,000 SKUs across key categories before and during Amazon during Prime Day 2024. Our study delves into:
Pricing strategies: How did brands adjust their discounts to capitalize on the Prime Day frenzy?
Share of Search: Which brands achieved the highest visibility for major search keywords?
Dive into these insights below to uncover how brands performed during Amazon Prime Day 2024, and learn how you can leverage these findings to enhance your brand’s digital shelf performance.
Our Findings
Most brands offered substantial discounts before Prime Day, then added smaller discounts during the event. This strategy creates a perception of value while still allowing room for Prime Day-specific deals. To understand the real value offered by brands, we conducted an extensive analysis of brand performance, examining both pricing strategies and visibility on the platform. Our approach focuses on two key metrics:
Discounts: We analyzed both the Absolute Discount (total markdown relative to MSRP a week before Prime Day) and the Additional Discount (the price reduction during Prime Day compared to the week before).
Share of Search (SoS): We examined the visibility of brands in the top 20 search results. We also separately tracked this metric for organic and sponsored search results.
Let’s dive into the category and brand specific insights:
Consumer Electronics
Once again, in 2024, the Consumer Electronics category dominated discounts. Amazon’s own brands lead with the highest average Absolute Discount (44.2%) and a significant Additional Discount (12.5%), showcasing its aggressive push for Prime Day.
In a surprising twist, Amazon’s homepage wasn’t dominated by its own brands. Instead, tech giants like Apple and Samsung took centre stage. Despite this, Amazon’s own brands offered significant discounts across electronics products, including Amazon Kindle, Fire TVs, Fire TV Sticks, Echo Dot, and more, aiming to capture market share via markdowns.
Soundcore (earphone audio products brand) offered the highest discount during Prime Day, at 30.10%. Other headphone, earbuds, and wireless headphone brands including Sony, Beats, JBL, and more also offered significant discounts.
Premium brands like Apple (17.90% Absolute, 9.00% Additional) and Bose (23.10% Absolute, 16.00% Additional) offered relatively modest discounts, aligning with their brand positioning, but also taking advantage of the Prime Day frenzy.
Share of Search Insights in Consumer Electronics
JBL emerged as the standout performer, with the most significant increase in SoS, jumping from 14.3% pre-event to 25.8% during Prime Day, driven entirely by organic growth. Beats also saw a remarkable rise, increasing from 2.8% to 12.8%, again through organic listings only. Samsung maintained its strong presence, growing from 18.6% to 26.8%, with most of its growth influenced by increased ad spend.
Apple, despite already having a high pre-event SoS, managed to increase its share further from 23.0% to 31.0%, with some contribution via sponsored ads. LG saw a substantial increase from 1.3% to 6.9%, primarily through sponsored listings, opting for an inorganic approach to drive visibility during the sale.
Amazon and its AmazonBasics brand both saw notable increases in SoS, relying solely on organic growth. This is, of course, not surprising since Amazon controls its organic ranking algorithm.
Interestingly, some brands experienced decreases in SoS. Sony, Motorola, and Hisense all saw reductions in their share, with Hisense’s decline coming entirely from a reduction in sponsored listings.
Key Takeaway: Prime Day 2024 saw a significant reshuffling of brand visibility in the Consumer Electronics category. While some established brands like JBL, Beats, Samsung, and Apple strengthened their positions through a mix of organic and sponsored growth, others faced increased competition for consumer attention. The event highlighted the importance of a balanced approach to visibility, with successful brands leveraging both organic search optimization and strategic use of sponsored listings to maximize their presence during this high-traffic period.
Apparel
In the Apparel category, Adidas led with the highest Absolute Discount (27.2%) and a significant Additional Discount (9.8%). Value brands like Hanes (innerwear brand) and Anrabess offered substantial discounts, while Amazon Essentials maintained high discounts across the board (16.5% Absolute, 15.3% Additional).
Some brands like Cupshe (swimwear and vacation apparel brand) offered relatively lower additional markdowns. Meanwhile CRZ Yoga (athleisure brand) did not offer additional markdowns on Prime Day.
Share of Search Insights in Apparel
Gildan (activewear brand) emerged as the top performer in terms of SoS growth, increasing from 8.1% pre-event to 12.1% during Prime Day, driven entirely by organic growth. CRZ Yoga (an athleisure apparel brand) and Dokotoo (women’s casualwear brand) also saw significant increases in their SoS, rising by 2.8 and 2.3 percentage points respectively, again through organic listings only.
Amazon Essentials continued to perform well, increasing its visibility from 7.0% to 9.1%, aligning with its competitive pricing strategy. Coofandy also saw a notable increase, growing from 7.8% to 9.9%.
Interestingly, some brands that were previously highlighted for growth actually experienced decreases in SoS. Automet (clothing & accessories brand) saw a slight decline from 12.5% to 12.1%, while Anrabess (women’s fashion brand) dropped from 15.8% to 14.5%. Cupshe (swimwear brand) experienced the most significant decrease, falling from 10.6% to 5.5%.
Adidas, despite leading in discounts, saw only a modest increase in SoS from 7.0% to 8.0%. Notably, none of the brands visible in the top search results utilized sponsored listings, with all changes in SoS coming from organic growth or decline. This indicates a lack of maturity in this category in leveraging retail media.
Key Takeaway: Prime Day 2024 in the apparel category showcased the importance of organic search optimization. While some brands like Gildan and CRZ Yoga significantly improved their visibility, others faced challenges in maintaining their pre-event positions. The absence of sponsored listings across all brands highlights a unique dynamic in the apparel category, where organic search performance appears to be the primary driver of visibility during high-traffic events like Prime Day.
This suggests that Apparel brands may need to focus more on SEO strategies and organic content optimization to maximize their presence during major shopping events, rather than relying on paid promotions. On the other hand, smartly leveraging retail media to boost visibility can give apparel brands a competitive edge.
Health & Beauty
The Health & Beauty category this year got a push thanks to Amazon’s subscription offering. Prime members who subscribed for regular usage products like toothpaste and health aids or medicines availed higher discounts.
Amid Health & Beauty brands, Neutrogena led with the highest Absolute Discount (32.7%) and a significant Additional Discount (11.7%). Sun Bum moisturizers & sunscreen (23.3%) and Viking Revolution (23.1%) offered the highest Additional Discounts, indicating a strong Prime Day focus.
Premium brands like L’Oreal Paris and Philips Sonicare offered moderate discounts, balancing promotions with their intended brand image.
Share of Search Insights in Health & Beauty
Banana Boat (sunscreen brand) emerged as the standout performer, seeing the largest increase in SoS from 6.5% to 13.4%, achieved entirely through organic growth. Nyx Professional Makeup also saw a significant jump, rising from 3.9% to 8.9%, again solely through organic listings.
Contrary to previous analysis, e.l.f. actually experienced substantial growth, increasing from 9.0% to 13.1% SoS, with a strong focus on organic growth (4.4%) slightly offset by a minor decrease in sponsored listings (-0.2%).
Neutrogena maintained its strong performance, aligning with its aggressive discounting strategy, as its SoS increased from 14.6% to 18.5% through organic growth. Colgate also saw a notable increase from 11.0% to 13.7% SoS.
Interestingly, some brands employed a mixed strategy. Dove and Garnier saw overall increases in SoS, but achieved this through different means. Dove relied heavily on sponsored growth, while Garnier offset a decrease in organic listings with strong sponsored content growth.
Contrary to previous observations, Oral-B experienced a decrease in SoS from 18.5% to 15.3%, entirely in organic listings. Without any additional spend on sponsored listings to compensate, it lost significant ground in its visibility. Other brands facing significant declines include Tresemme, OGX, Philips Sonicare, and most notably, Viking Revolution, which dropped from 17.2% to 10.7% in its SoS.
Key Takeaway: The Health & Beauty category during Prime Day 2024 showcased a diverse range of strategies and outcomes. While some brands like Banana Boat and Nyx Professional Makeup achieved significant visibility gains through organic growth, others like Dove and Garnier relied more on sponsored content.
The success of e.l.f. and Neutrogena in aligning discounting strategies with increased visibility stands in contrast to the challenges faced by previously strong performers like Oral-B and Viking Revolution. This varied landscape shows the fierce competition in the category and the need for brands to employ multi-faceted strategies that balance organic optimization, sponsored content, and competitive pricing to succeed in high-stakes events like Prime Day.
Brand Strategies and Future Implications
Our analysis reveals several key trends:
Brand Positioning Matters: Premium brands like Apple and Bose maintained their positioning with modest discounts, while value-oriented brands like Soundcore and Hanes offered deeper cuts to attract price-sensitive shoppers.
Visibility vs. Discounting: Some brands, particularly in the Consumer Electronics category, prioritized increasing their visibility (Share of Search) over offering steep discounts. This strategy suggests a focus on long-term visibility and brand perception rather than short-term sales boosts.
Category-Specific Approaches: Apparel brands uniquely relied on organic search visibility, eschewing sponsored listings entirely. In contrast, several Health & Beauty brands leveraged sponsored content significantly to boost their presence.
Emerging Brand Opportunities: Lesser-known brands, especially in the Apparel and Health & Beauty categories, used Prime Day as a launchpad to increase their visibility, often outpacing established names in Share of Search growth.
Amazon’s Dual Strategy: As both a platform and a brand, Amazon showcased its ability to offer deep discounts on its own products while also providing a stage for other brands to shine.
Stay tuned to our blog for more in-depth analyses of brand and retailer performance and strategies across various retail events. Reach out to us today to learn how you can leverage data-driven insights to optimize your brand’s eCommerce strategy and performance.
Consumer brands around the world increasingly recognize the vital role of tracking and optimizing their digital shelf KPIs, such as Content Quality, Share of Search, Availability, etc. These metrics play a crucial role in boosting eCommerce sales and securing a larger online market share. With the escalating requirements of brands, the sophistication of top Digital Shelf Analytics providers is also on the rise. Consequently, the adoption of digital shelf solutions has become an essential prerequisite for today’s leading brands.
As brands and vendors continue to delve further and deeper into the world of Digital Shelf Analytics, a significant and often overlooked aspect is the analysis of digital shelf data on mobile apps. The ability of solution providers to effectively track and analyze this mobile-specific data is crucial.
Why is this emphasis on mobile apps important?
Today, the battle for consumer attention unfolds not only on desktop web platforms but also within the palm of our hands – on mobile devices. As highlighted in a recent Insider Intelligence report, customers will buy more on mobile, exceeding 4 in 10 retail eCommerce dollars for the first time.
Moreover, thanks to the growth of delivery intermediaries like Instacart, DoorDash, Uber Eats, etc., shopping on mobile apps has received a tremendous organic boost. According to an eMarketer report, US grocery delivery intermediary sales are expected to reach $68.2 billion in 2025, from only $8.8 billion in 2019.
In essence, mobile is increasingly gaining share as the form factor of choice for consumers, especially in CPG. In fact, one of our customers, a leading multinational CPG company, revealed to us that it sees up to 70% of its online sales come through mobile apps. That’s a staggering number!
The surge in app usage reflects a fundamental change in consumer behavior, emphasizing the need for brands to adapt their digital shelf strategies accordingly.
Why Brands Need To Look at Apps and Desktop Data Differently
Conventionally, brands that leverage digital shelf analytics rely on data harnessed from desktop sites of online marketplaces. This is because capturing data reliably and accurately from mobile apps is inherently complex. Data aggregation systems designed to scrape data from web applications cannot easily be repurposed to capture data on mobile apps. It requires dedicated effort and exceptional tech prowess to pull off in a meaningful and consistent way.
In reality, it is extremely important for brands to track and optimize their mobile digital shelf. Several digital shelf metrics vary significantly between desktop sites and mobile apps. These differences are natural outcomes of differences in user behavior between the two form factors.
One of these metrics that has a huge impact on a brand’s performance on retail mobile apps is their search discoverability. Ecommerce teams are well aware of the adverse impact of the loss of even a few ranks on search results.
Anyone can easily test this. Searching something as simple as “running shoes” on the Amazon website and doing the same on its mobile app shows at least a few differences in product listings among the top 20-25 ranks. There are other variances too, such as the number of sponsored listings at the top, as well as the products being sponsored. These variations often result in significant differences in a brand’s Share of Search between desktop and mobile.
Share of Search is the share of a brand’s products among the top 20 ranked products in a category or subcategory, providing insight into a brand’s visibility on online marketplaces.
Picture a scenario in which a brand heavily depends on desktop digital shelf data, confidently assuming it holds a robust Share of Search based on reports from its Digital Shelf Analytics partner. However, unbeknownst to the team, the Share of Search on mobile is notably lower, causing a detrimental effect on sales.
To fully understand the scale of these differences, we decided to run a small experiment using our proprietary data analysis and aggregation platform. We restricted our analysis to just Amazon.com and Amazon’s mobile app. However, we did cover over 13,000 SKUs across several shopping categories to ensure the sample size is strong.
Below, we provide details of our key findings.
Share of Search on The Digital Shelf – App Versus Desktop
Our analysis focused on three popular consumer categories – Electronics, CPG, and Health & Beauty.
In the electronics category, brands like Apple, Motorola, and Samsung, known for their mobile phones, earbuds, headphones, and more, have a higher Share of Search on the Amazon mobile app compared to the desktop.
Meanwhile, Laptop brands like Dell, Acer, and Lenovo, as well as other leading brands like Google have a higher Share of Search on the desktop site compared to the app. This is the scenario that brands need to be careful about. When their Share of Search on mobile apps is lower, they might miss the chance to take corrective measures since they lack the necessary data from their provider.
In the CPG category, Ramen brand Samyang, with a lot of popularity on Tiktok and Instagram, shows a higher Share of Search on Amazon’s mobile app. Speciality brands like 365 By Whole Foods, pasta and Italian food brands La Moderna, Divinia, and Bauducco too have a significantly higher Share of Search on the app.
Cheese and dessert brands like Happy Belly, Atlanta Cheesecake Company, among others, have a lower Share of Search on the mobile app. Ramen brand Sapporo is also more easily discovered on Amazon’s desktop site. Here, we see a difference of more than 5% in the Share of Search of some brands, which is likely to have a huge impact on the brand’s mobile eCommerce sales levels and overall performance.
Lastly, in the Health & Beauty category, Shampoos and hair care brands like Olaplex, Dove, and Tresemme exhibited a higher Share of Search on the mobile app compared to the desktop.
On the other hand, body care brands like Neutrogena and Hawaiian Tropic, as well as Beardcare brand Viking Revolution displayed a higher Share of Search on Amazon’s desktop site.
Based on our data, it is clear that there are several examples of brands that do better in either one of Amazon’s desktop sites or mobile apps. In many cases, the difference is stark.
So What Must Brands Do?
Our findings emphasize the imperative for brands to move beyond a one-size-fits-all approach to digital shelf analytics. The striking variations in Share of Search between mobile apps and desktops conclusively demonstrate that relying solely on desktop data for digital shelf optimization is inadequate.
If brands see that they’re falling behind on the mobile digital shelf, there are a few things they can do to help boost their performance:
If a brand’s Share of Search is lower on the mobile app, they can divert their retail spend to mobile in order to inorganically compensate for this difference. This way, any short-term impact due to lower discoverability is mitigated. This is also likely to result in optimized budget allocation and ROAS.
Brands also need to ensure their content is optimized for the mobile form factor, with images that are easy to view on smaller screens, and tailored product titles that are shorter than on desktops, highlighting the most important product attributes from the consumer’s perspective. Not only will this help brands gain more clicks from mobile shoppers, but this will also gradually lead to a boost in their organic Share of Search on mobile.
CPG brands, specifically, need to optimize their digital shelf for delivery intermediary apps (along with marketplaces). The grocery delivery ecosystem is booming with companies like DoorDash, Delivery Hero, Uber Eats, Swiggy, etc. leading the way. Using Digital Shelf Analytics to optimize performance on delivery apps is quite an involved process with a lot of bells and whistles to consider. Read our recently published whitepaper that specifically details how brands can successfully boost their visibility and conversions on delivery apps.
But first, brands need to identify and work with a Digital Shelf Analytics partner that is able to capture and analyze mobile app data, enabling tailored optimization approaches for all eCommerce platforms.
DataWeave leads the way here, providing the world’s most comprehensive and sophisticated digital shelf analytics solution, rising above all other providers to provide digital shelf insights for both web applications and mobile apps. Our data aggregation platform successfully navigates the intricacies of capturing public data accurately and reliably from mobile apps, thereby delivering a comprehensive cross-device view of digital shelf KPIs to our brand customers.
So reach out to us today to find out more about our digital shelf solutions for mobile apps!
India’s homegrown eCommerce giant Flipkart, now backed by Walmart, reported a record 1.4 Billion customer visits during the early access phase and throughout the seven days of its premier shopping event, the Big Billion Days, launched on 8th October 2023. Competing with Flipkart, Amazon’s Great Indian Festival sale event started on October 8th as well and saw a whopping 95 Million customer visits to the website within the first 48 hours of the event.
For consumers, the most pressing question was, “Who offered more attractive deals and lower prices during these sale events?”
To answer this question, we leveraged our proprietary data aggregation and analysis platform and analyzed the prices and discounts on Amazon and Flipkart across key product categories..
The details of our sample are mentioned below:
Number of SKUs Analyzed: 30,000+
Websites: Amazon.com and Flipkart.com
Categories: Apparel, Home & Furniture, Electronics, Health & Beauty
Dates: 7th Oct 2023 to 22nd Oct 2023
Key Findings
Based on our analysis, the Big Billion Days by Flipkart showcased relatively higher price reductions across categories compared to the Great Indian Festival sale by Amazon. The Apparel category on Flipkart saw the highest average discount at 50.6%. The Health & Beauty category had the lowest discount across Flipkart at 39.4% and Amazon at 33%.
Overall, Flipkart offered higher discounts in each product category. It is clear that the retailer invested heavily in leveraging its supplier partnerships with key brands or sellers to enable them to offer higher discounts, thereby attracting more customers.
Next, let’s take a closer look at each product category.
Apparel
While a majority of retailers expected demand for apparel and clothing to dip this festive season in India, eCommerce giants like Amazon and Flipkart are likely to recognize the strong consumer inclination towards apparel during this period.
In the detailed assessment of Apparel sub-categories, Women’s Dresses, Women’s Tops, Men’s Shirts, Men’s Shoes, and Women’s Innerwear emerged as the segments showcasing the most substantial discounts during the sale events. While Flipkart offered higher average discounts across all sub-categories, Amazon offered competitive discounts as well.
We observed significant differences in the average discounts across brands between Flipkart’s Big Billion Days and Amazon’s Great Indian Festival. Reinforcing the significant discounts on the Shoes subcategory, brands like Red Tape, Arrow, Adidas, Reebok, Nike, and more offered extensive discounts on both Flipkart and Amazon. Notably, Adidas and Reebok offered better deals on Amazon’s Great Indian Festival as compared to Flipkart.
One8 by Virat Kohli had a significantly lower discount on Amazon compared to Flipkart, indicating an exclusive partnership.
For brands, however, reducing prices is just one approach to entice shoppers. They must also guarantee their prominent presence and easy discoverability within Amazon and Flipkart search results. To gain insight into this, we monitored brands’ Share of Search across various frequently used search terms in addition to the discounts they provided. The Share of Search denotes the portion of a brand’s products within the top 20 search results for a specific search query.
Our data indicates that Jockey and Speedo gained in Share of Search on Flipkart, but reduced discoverability on Amazon. Van Heusen fell behind in search results on Flipkart but showed a higher Share of Search on Amazon.
Discounts on both Amazon and Flipkart hovered around 50%. Across a few subcategories, Flipkart offered slightly lower discounts compared to Amazon. Only Luggage, Rugs, Sofas, and Entertainment Units saw lower markdowns on Flipkart during the Big Billion Days.
Dishwashers and Washer/ Dryers saw higher discounts on Amazon compared to Flipkart. The significant discounts on these products on Amazon possibly point to changing consumer preferences, as demand for these products is traditionally low in India, but seems to be growing.
When it comes to Home & Furniture brands, Nasher Miles, Safari, Aristocrat, VIP, and American Tourister, luggage brands mostly, offered higher discounts on Flipkart, followed closely by Amazon.
In terms of Share of Search, Skybags had high discoverability on both Flipkart and Amazon. The brand leveraged a strategy of offering big discounts this festive season as well as ensuring prominent placement in search results. Wildcraft lost out on its discoverability on Flipkart in contrast to its prominence on Amazon. Duroflex saw lower searchability on Amazon compared to Flipkart’s Big Billion Days.
Consumer Electronics
The Consumer Electronics and Appliances Manufacturers Association (CEAMA) expected an uptick in sales of consumer electronics products this festive season in India. With more consumers buying premium products using credit cards and EMIs, demand for expensive, high-end electronics was expected to increase.
Again, average discounts in this category hovered around 50% on Flipkart and Amazon.
Across electronics subcategories, Smartwatches, Earbuds, and Drones had the highest markdowns with Flipkart leading the pack during the Big Billion Days. Amazon offered relatively higher discounts at 44.9% on the TV subcategory, compared to Flipkart’s 40.6%.
Speakers, Laptops, Smartphones, and Tablets also saw lower markdowns on Amazon compared to Flipkart. Amazon was the official partner for the launch of many high-level smartphones and products in September-October, contributing to the higher markdowns in the subcategory.
Across brands, Lenovo’s discounts were the most differentiated between the two sites, with the brand offering higher discounts on Amazon (45.4%) compared to Flipkart (24.7%). Noise offered the highest discounts at 72.5% on Amazon and 52.8% on Flipkart. Brands like Boat and Zebronics, also saw lower discounts on Flipkart.
Mi and JBL offered deeper discounts on Flipkart’s Big Billion Days. Apple meanwhile stands out with only 11.83% discounts on Amazon, but the brand offered impressive 31.4% discounts on Flipkart.
Samsung dominated the Share of Search on Amazon at 15.7%, compared to only 2.6% on Flipkart. Apple and Lenovo also saw higher discoverability on Amazon. On Flipkart, JBL and Skullcandy stand out as brands with high search visibility.
Health & Beauty
The Health & Beauty category saw the lowest markdowns with only 39.4% discounts on Flipkart and 33% on Amazon.
In the subcategories analyzed, Electric Toothbrushes had relatively high markdowns across both sites. Staple and lower priced subcategories like Toothpaste had the lowest markdowns across both sale events, with Amazon offering only 17.4% average discounts.
Across brands, Beardo, a leading beard care brand, offered significantly higher discounts on Amazon compared to Flipkart. Most other well-known brands, including Nivea and Vaseline, saw higher discounts on Amazon compared to Flipkart. Only Tresmme and Dove were exceptions with higher discounts on Flipkart.
In terms of Share of Search, once again, Beardo was the most discoverable brand in this category. Brands like Dove, Pond’s, Swiss Beauty, and Tresemme saw a lower Share of Search on Flipkart compared to Amazon.
Navigating the Competitive Landscape: How To Thrive During Sale Events
Amazon and Flipkart’s strategic pricing during the Big Billion Days and the Great Indian Festival Sale reflects a balance of profitability, inventory, and competition. Competitive pricing insights empower retailers to make informed decisions, optimize strategies, and thrive during high-stakes sale events with timely and relevant insights at a massive scale.
To learn more about how you can leverage competitive pricing insights to stay ahead of the game during sale events, reach out to us today!