Category: Promotion

  • Bridging the Gap: How Digital Shelf Impact Modeling Empowers Smarter Marketing Investments

    Bridging the Gap: How Digital Shelf Impact Modeling Empowers Smarter Marketing Investments

    Marketing analytics has evolved dramatically over the past decade, yet many brands still struggle to connect their marketing investments to real business outcomes. While traditional analytics platforms provide valuable historical insights, they often miss the critical external factors that drive consumer behavior in today’s fast-moving digital marketplace.

    The challenge isn’t just about measuring what happened. It’s about understanding why it happened and predicting what comes next. This is where Digital Shelf Impact Modeling becomes essential for smarter marketing investments.

    The Critical Data Gap In Marketing Analytics

    Traditional marketing analytics expose brands to considerable risk, especially in the CPG and retail space. The fundamental challenge lies in their reliance on lagging indicators for essential metrics like historical sales and ad spend. Data inputs may be months or quarters old before they’re used for strategic decision-making.

    That’s like making million-dollar marketing decisions while only looking in the rearview mirror when you need to watch the road ahead simultaneously.

    Most marketing analytics tools also typically overlook external market factors that can dramatically impact performance. In today’s retail landscape, where market conditions change rapidly, being blind to real-time competitive dynamics creates significant vulnerability. Key external factors that traditional analytics fail to capture include:

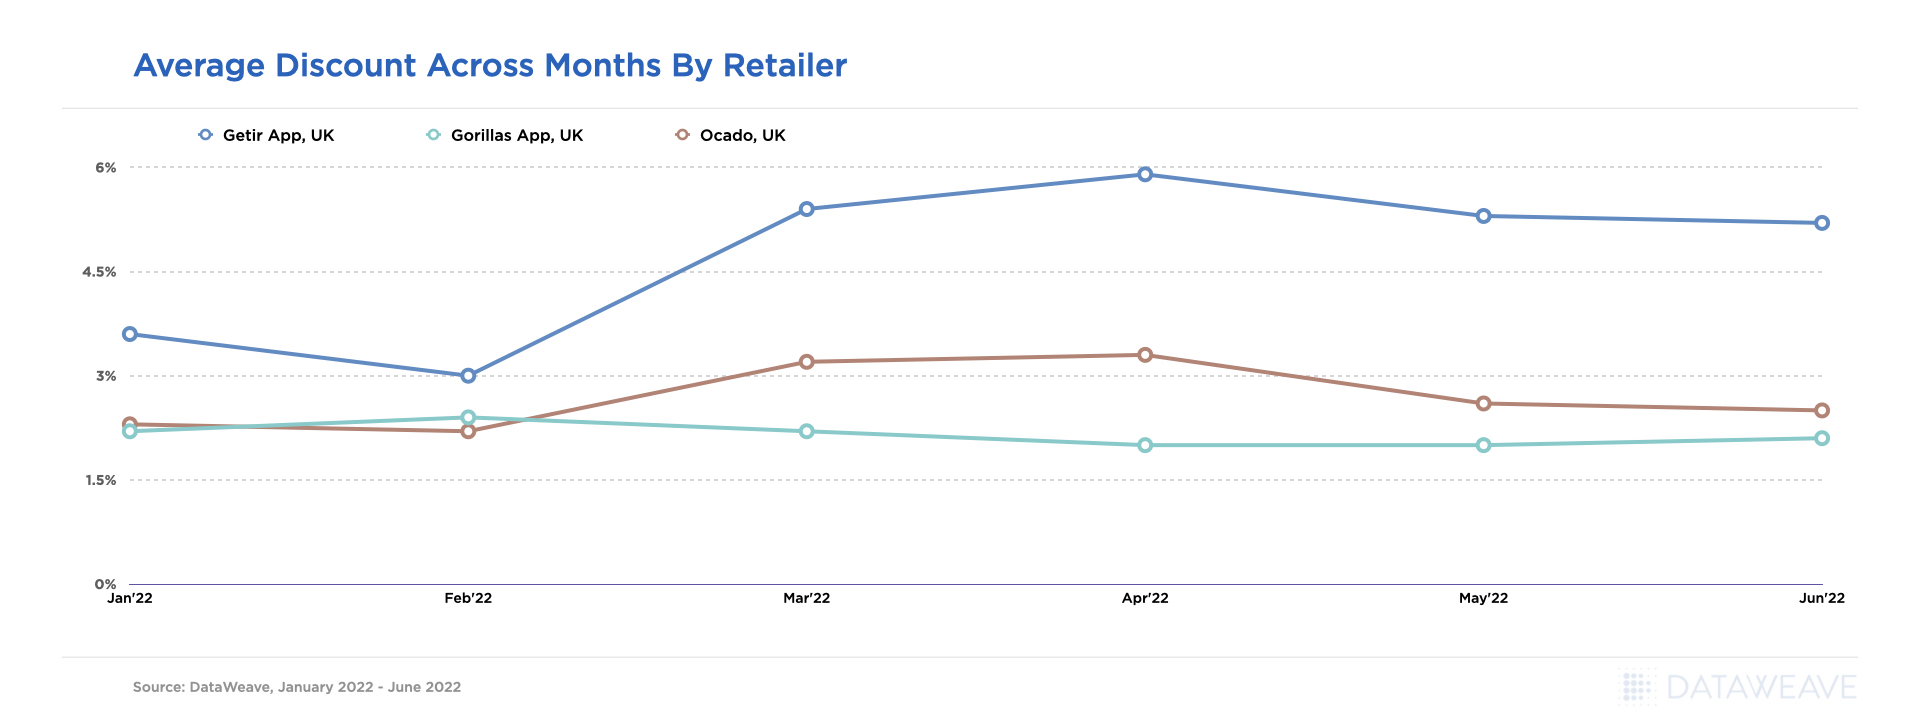
    • Competitor moves: Price changes, promotions, content updates
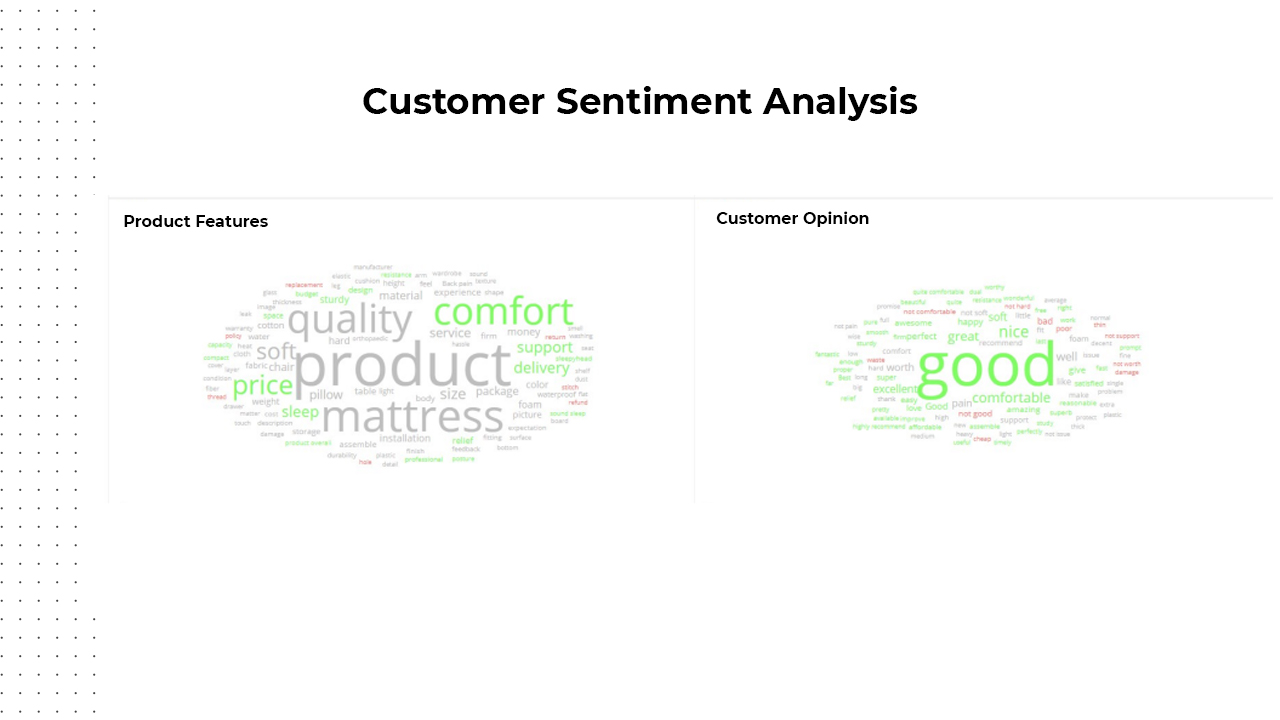
    • Consumer sentiment: Review trends, ratings, social engagement
    • Market dynamics: Stockouts, search ranking shifts, category growth

    In fact, opaque data integration and siloed insights remain substantial barriers to actionable intelligence from marketing analytics tools. Most critically, old school approaches often miss vital such variables influencing consumer behavior.

    These blind spots must be addressed to unlock the full value of marketing analytics investments and make truly informed marketing decisions.

    How Digital Shelf Impact Modeling Completes The Picture

    This is where Digital Shelf Impact Modeling plays a complementary role. Brands leveraging digital shelf analytics gain insights into actual market dynamics that traditional analytics alone cannot provide. However, brands using digital shelf insights in isolation often struggle to quantify how digital shelf improvements directly impact revenue. Answering questions like “Did better product content drive sales, or was it the influencer campaign?” remains challenging.

    Bridging these disconnected platforms requires intentional integration and a solution that can feed intensively cleaned and organized data into existing analytics frameworks. With the right data inputs, companies establish a powerful feedback loop for agile, data-driven decisions.

    A comprehensive DSA solution like DataWeave provides granular, actionable data on critical external variables such as:

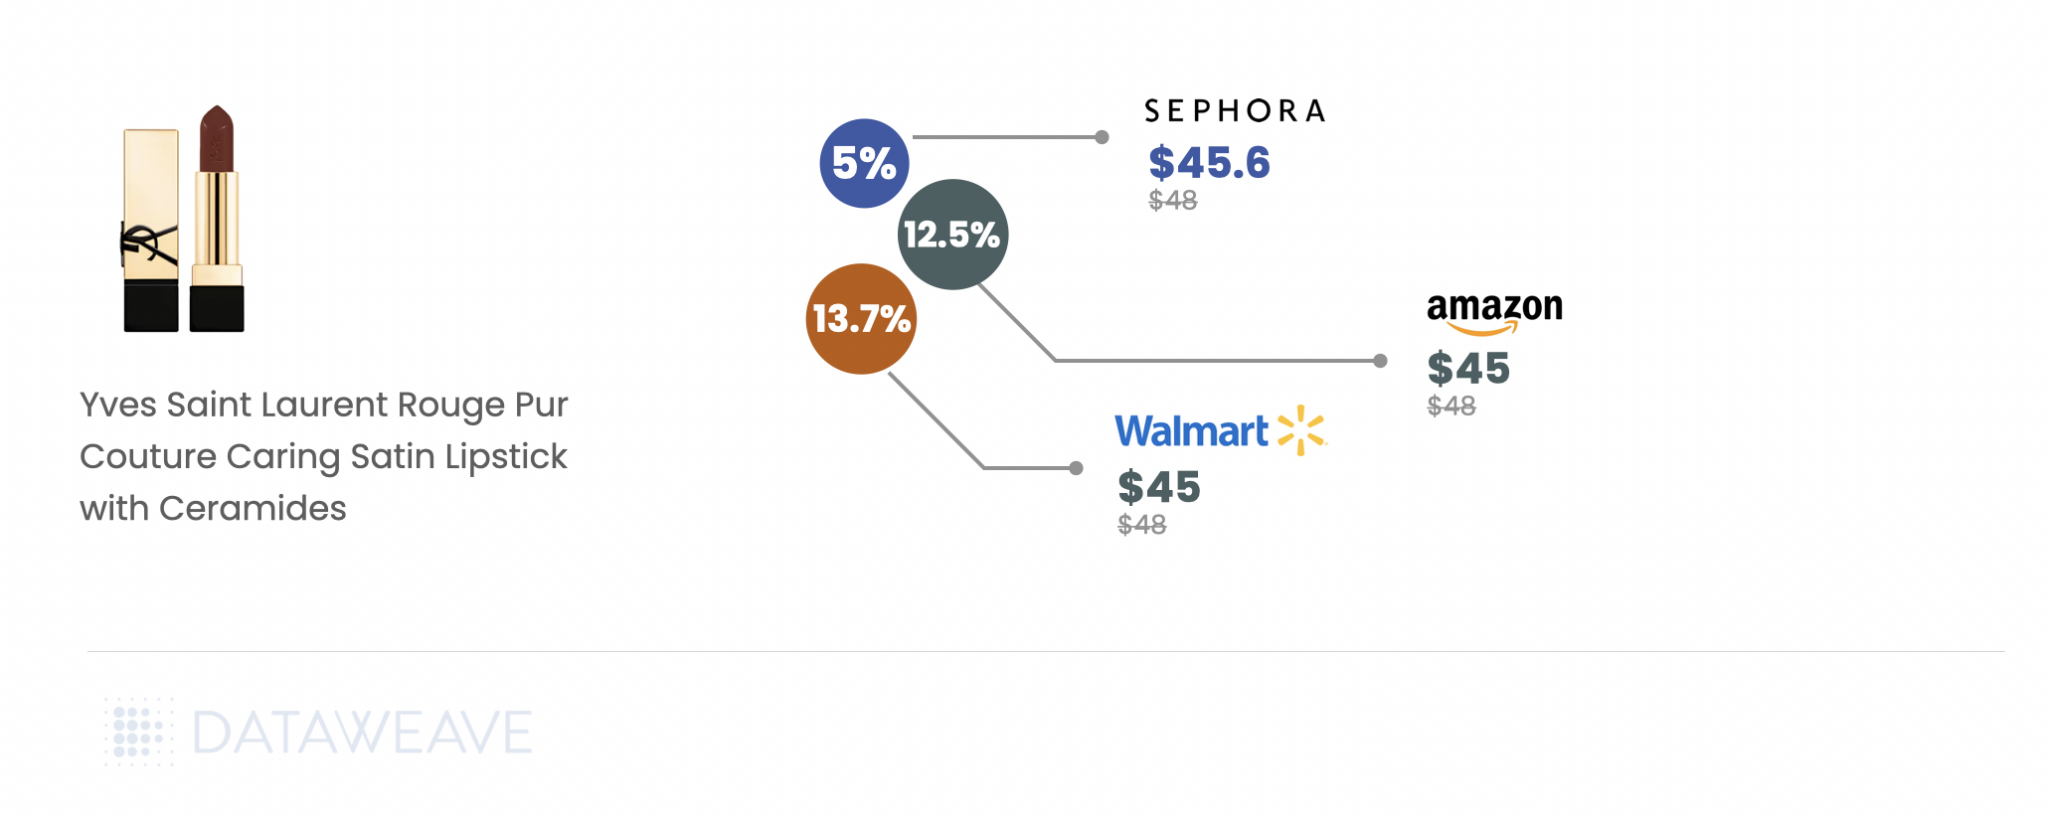
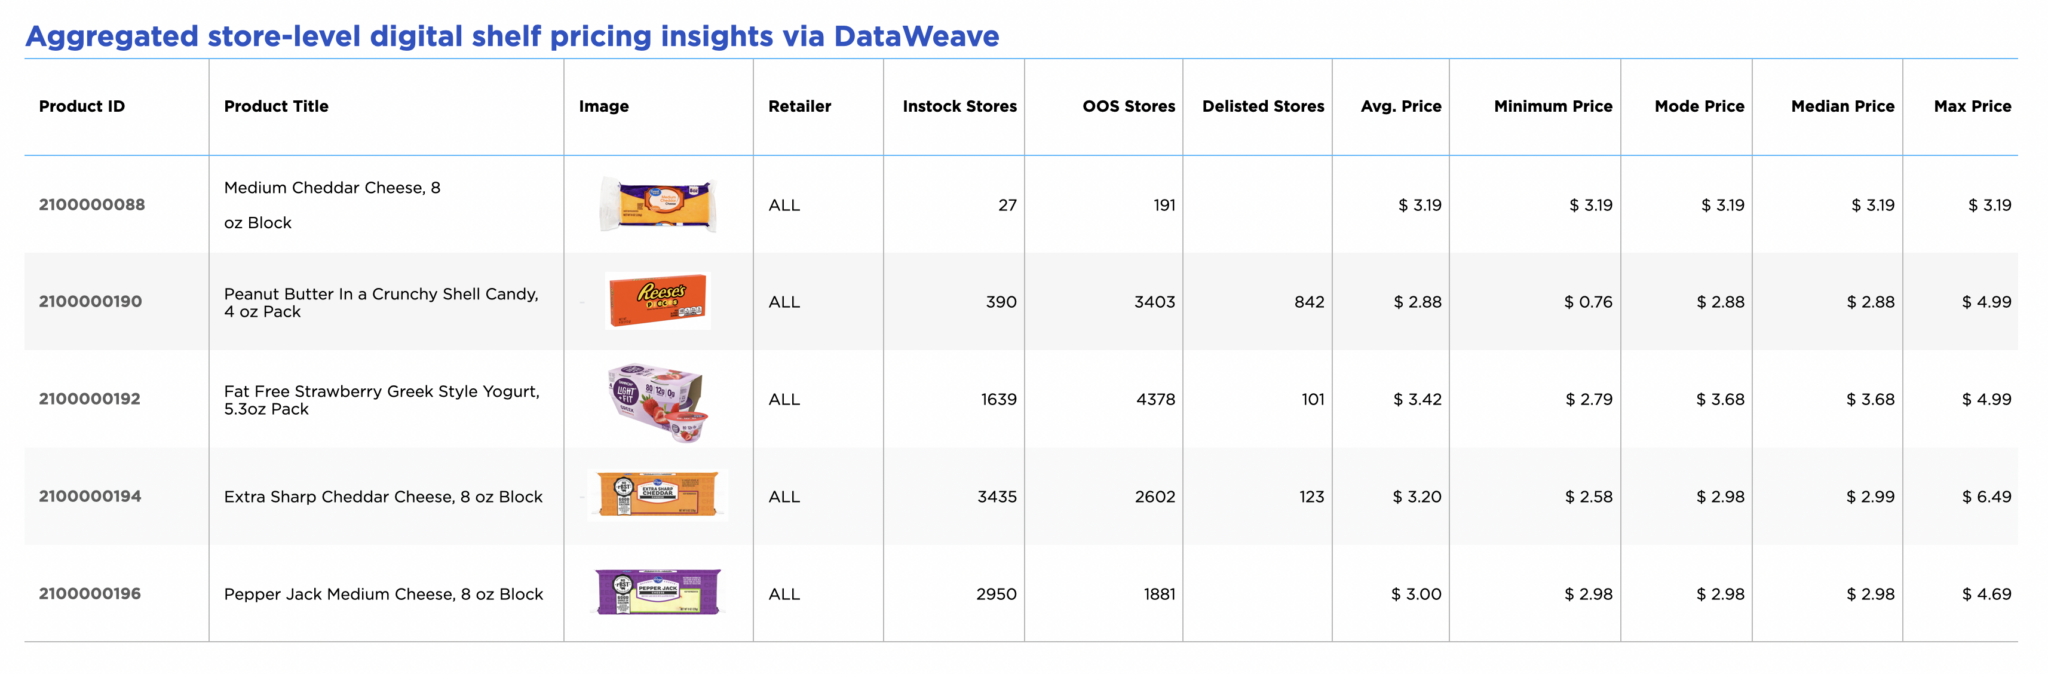
    • Daily or weekly competitor pricing movements and promotional activity
    • Product content standardization and optimization across retailers
    • Review sentiment trends and potential reputation issues
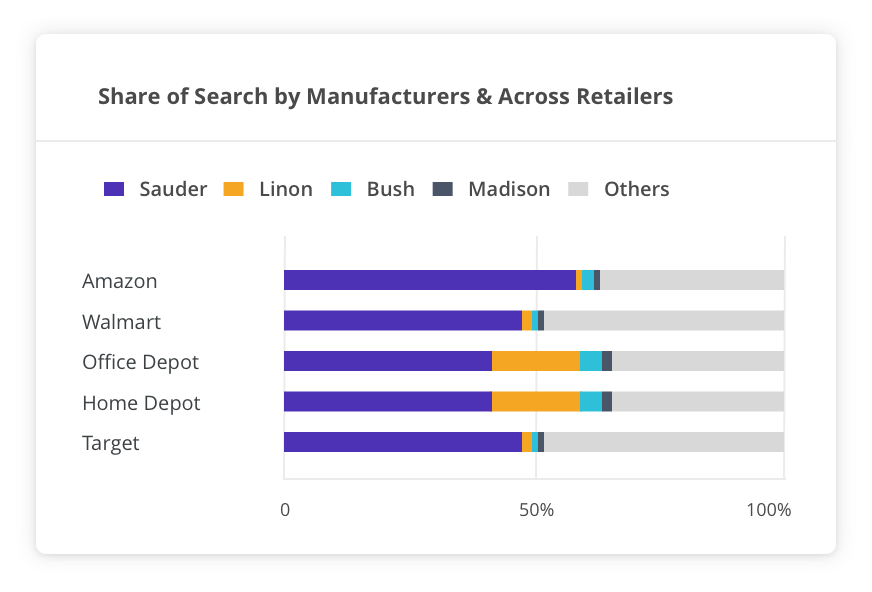
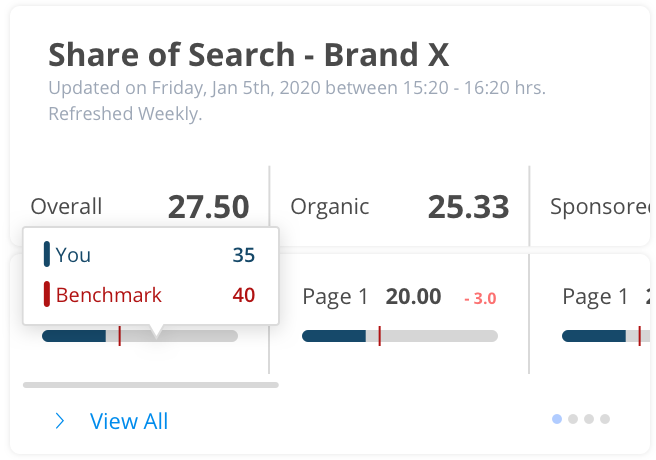
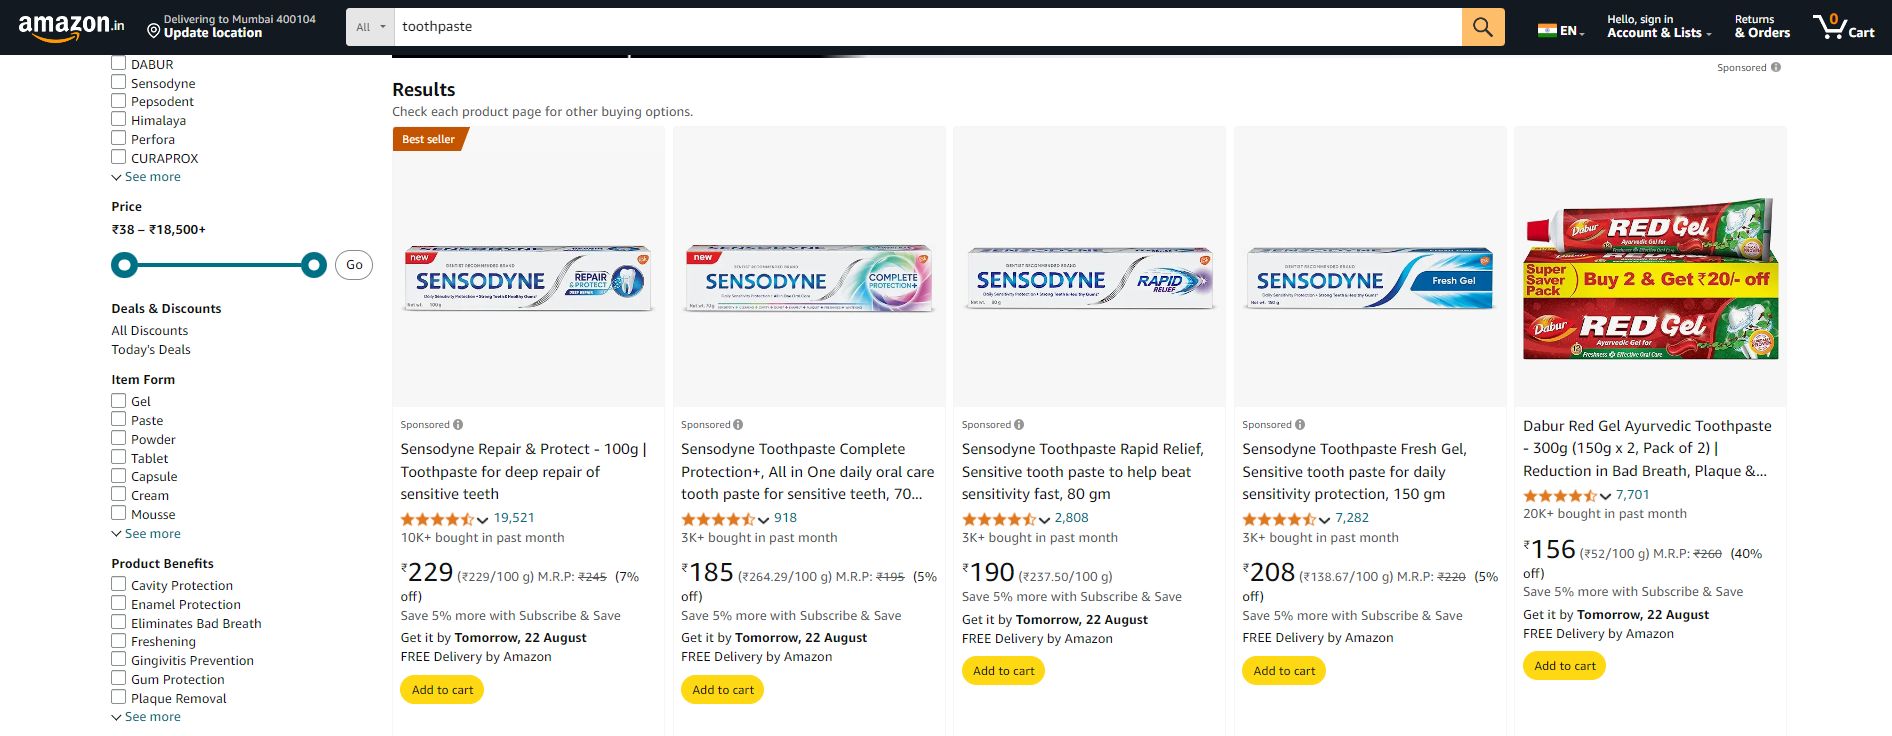
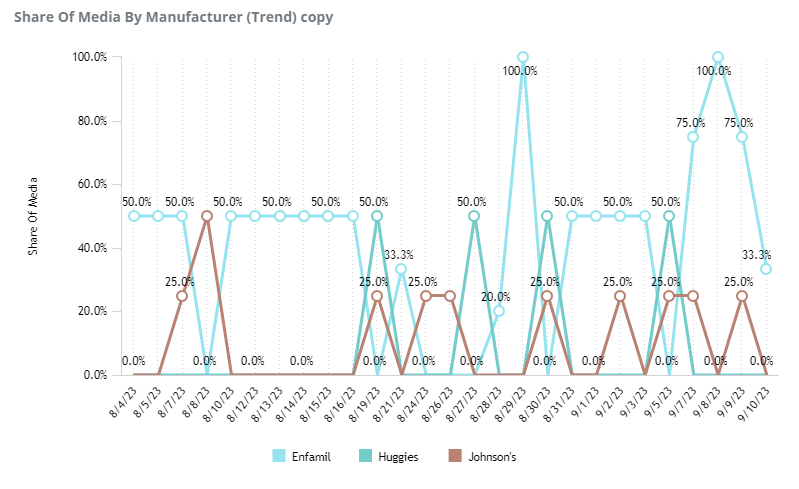
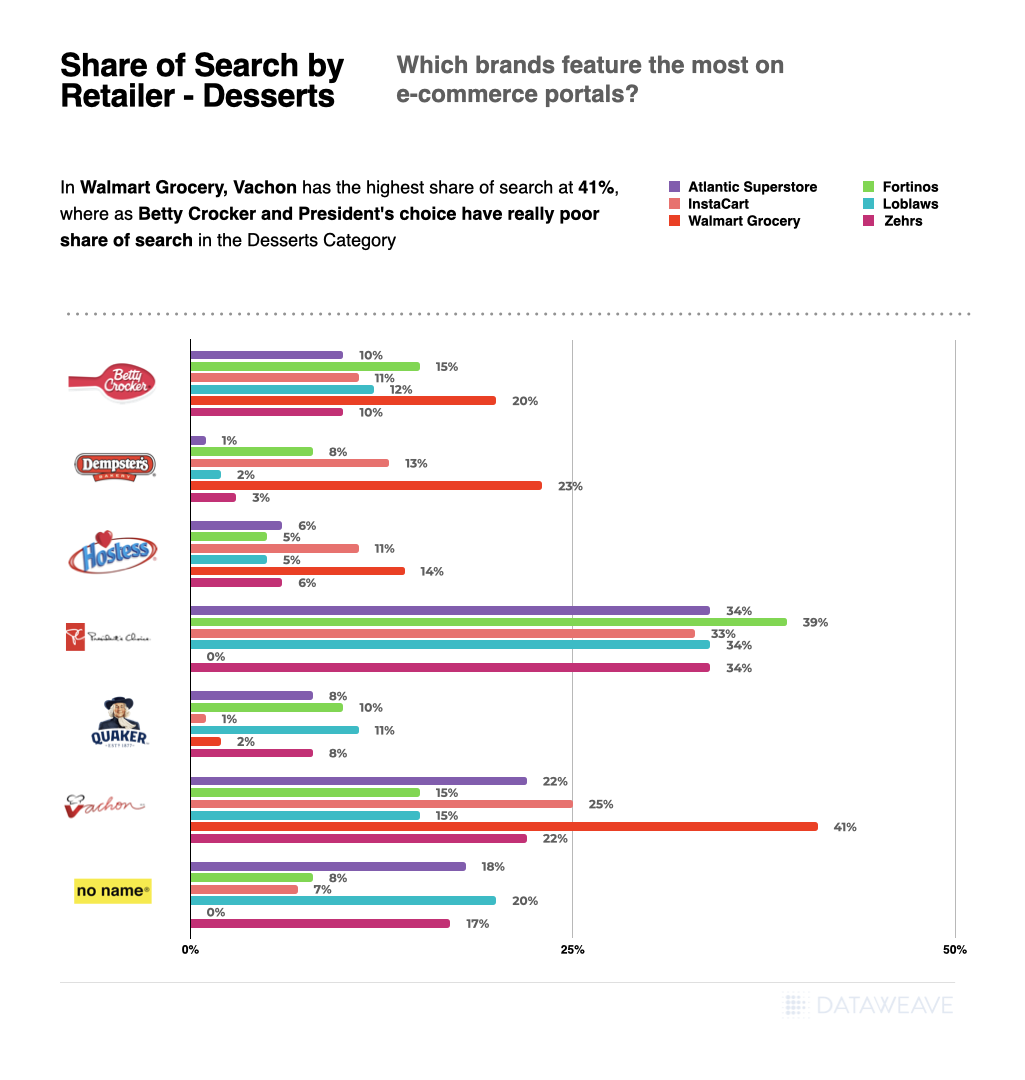
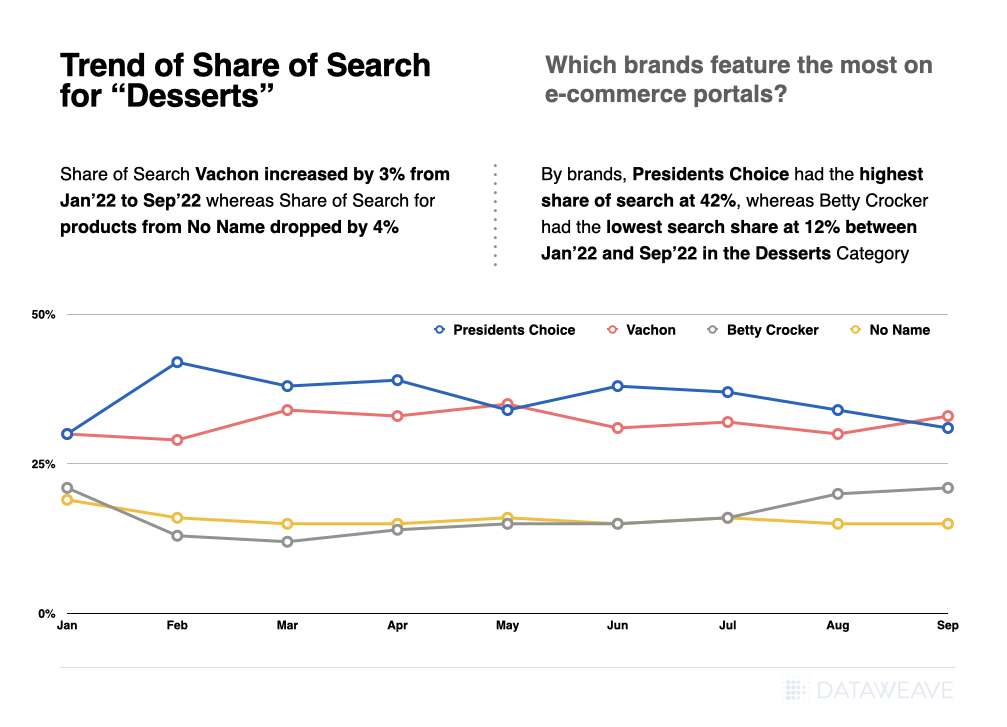
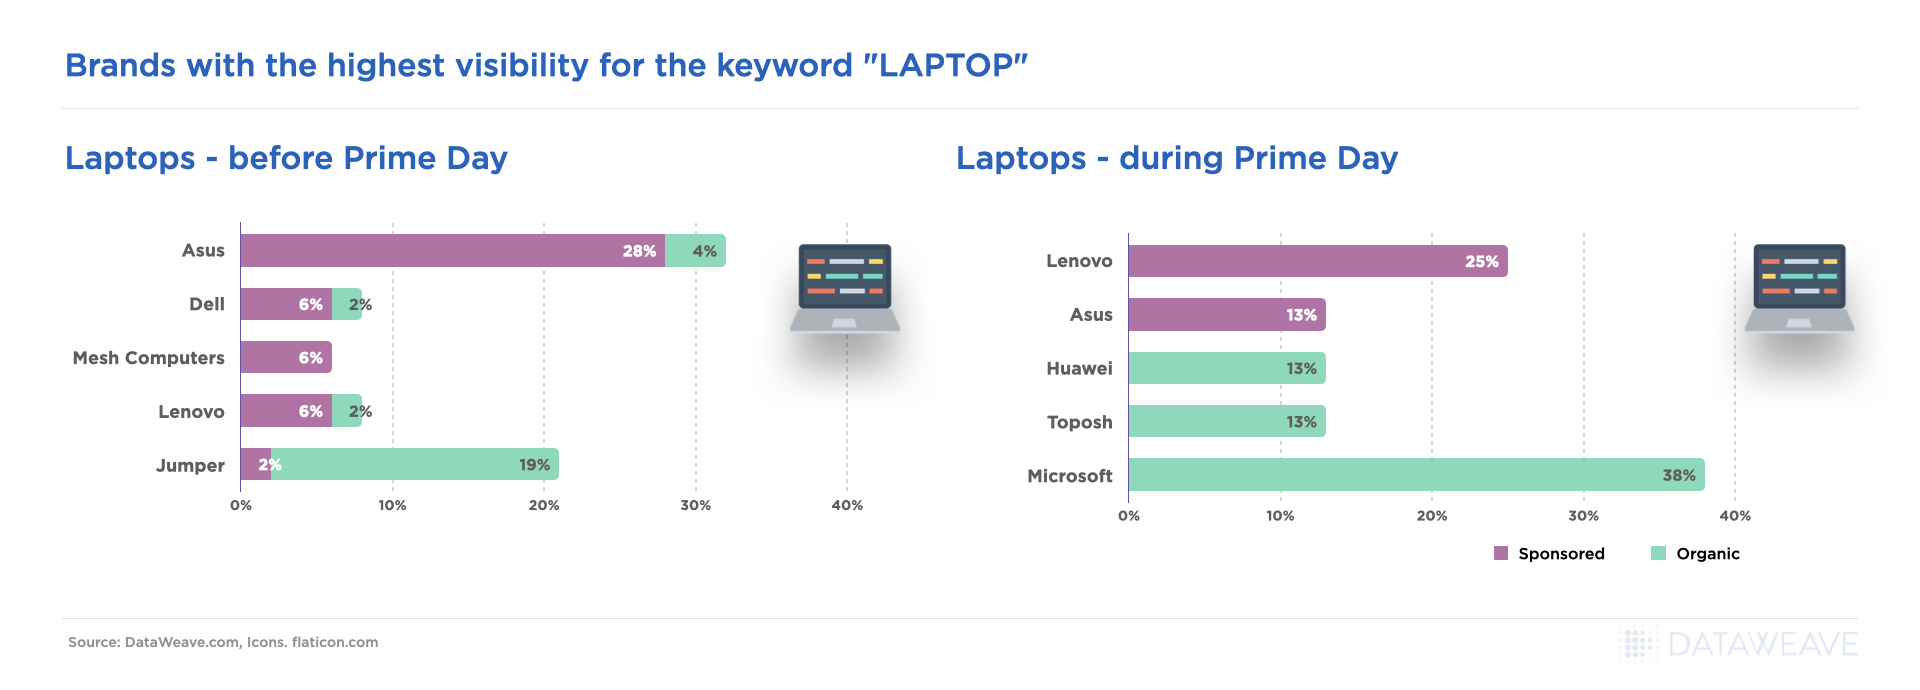
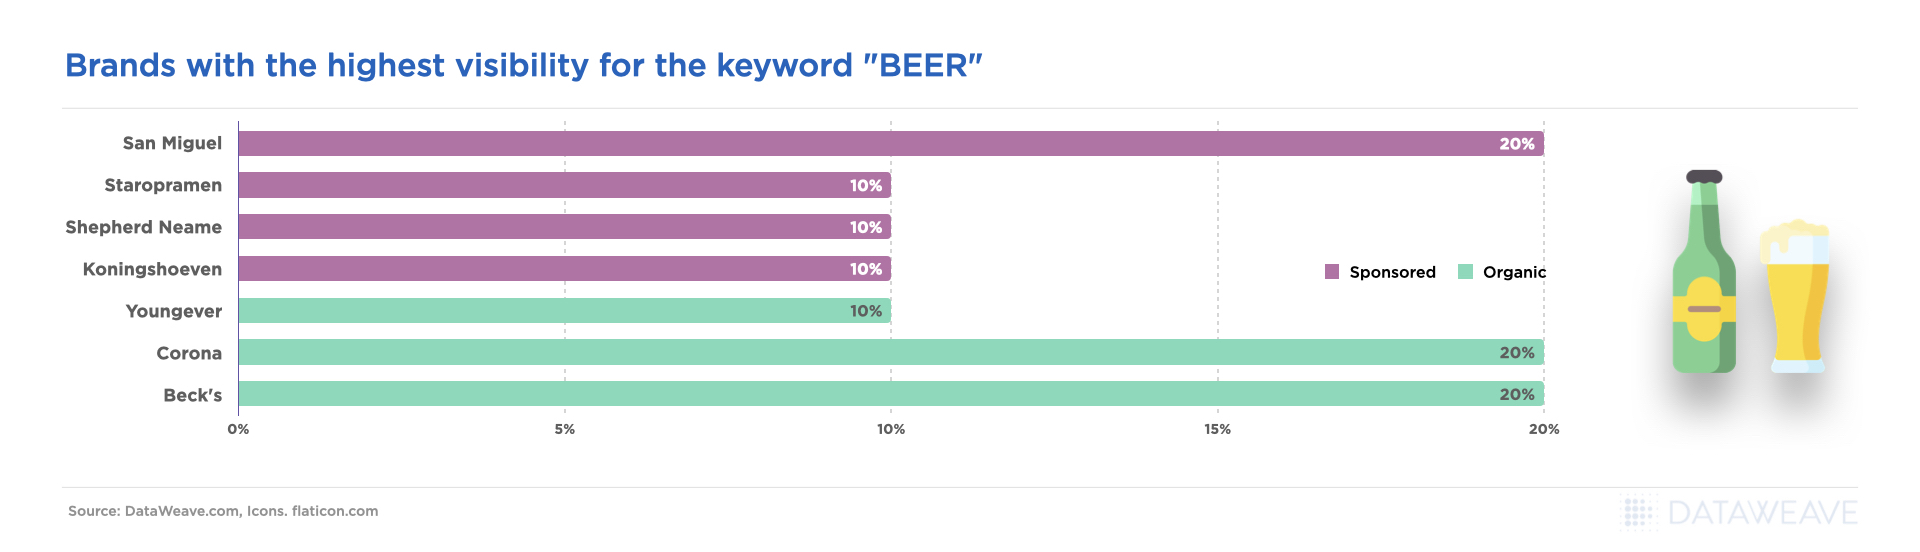
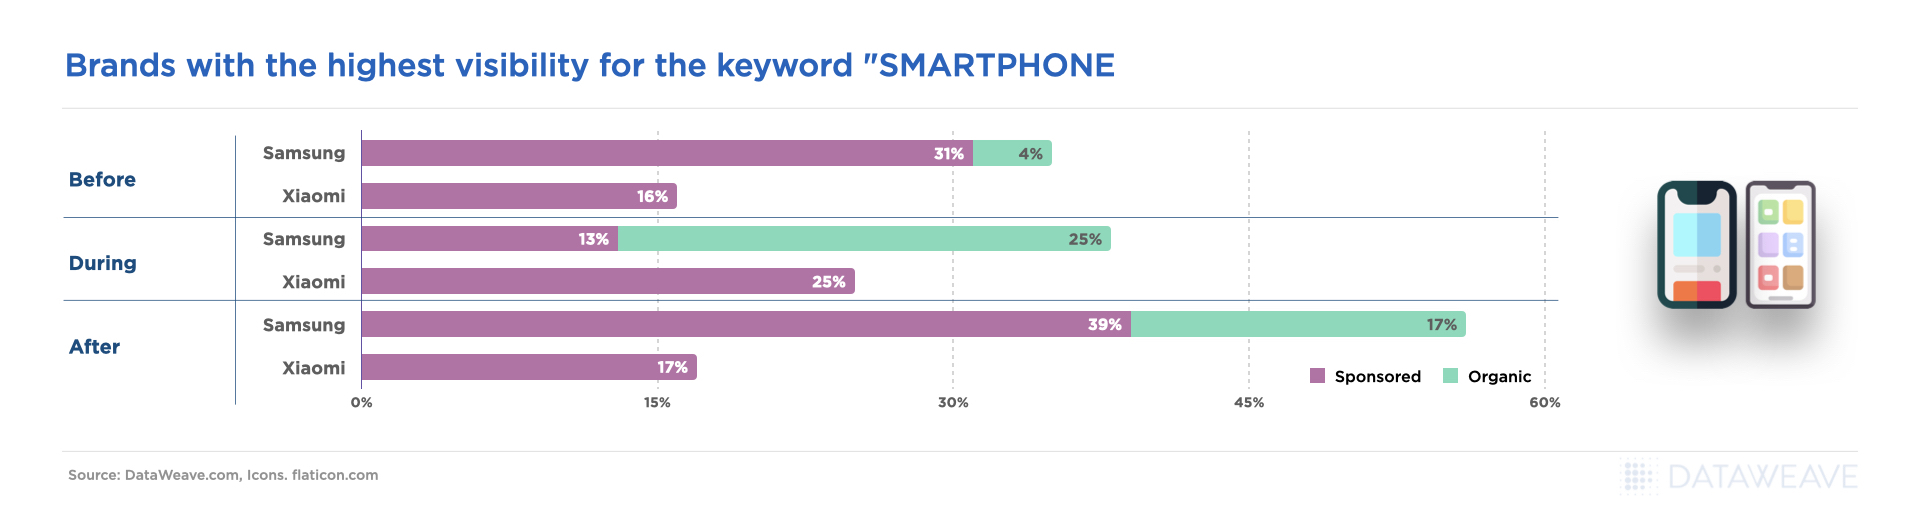
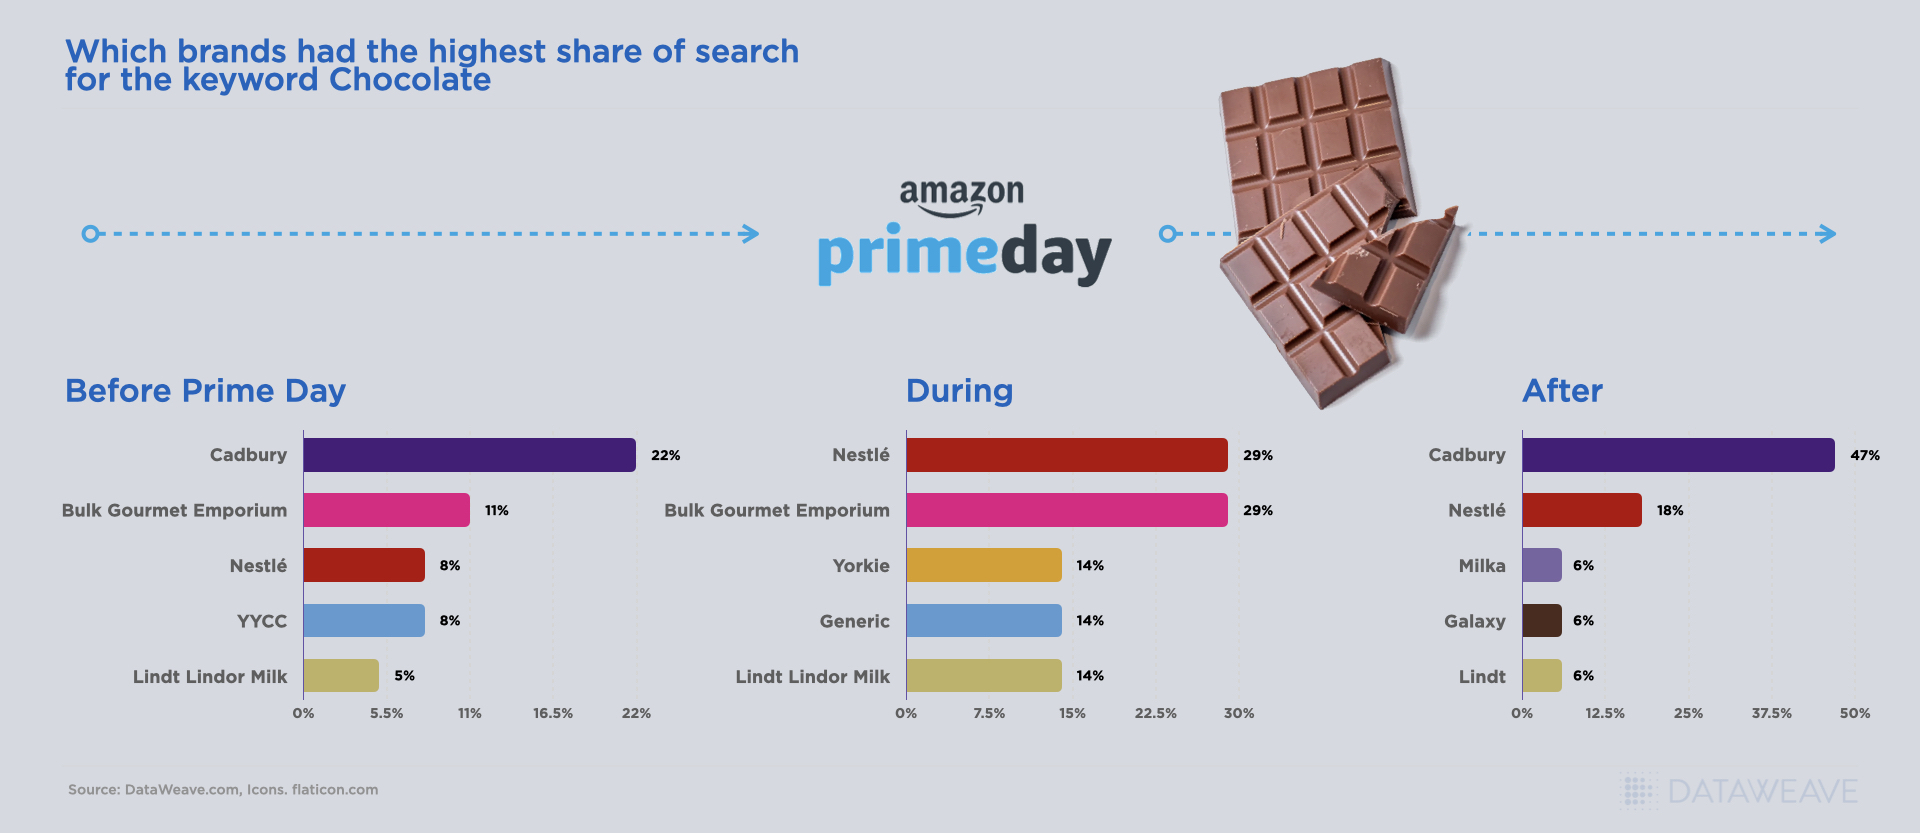
    • Share of search/shelf performance relative to competitors

    When merged with established analytics capabilities, digital shelf impact modeling creates a complete picture that fills the blind spots holding marketing teams back from maximizing ROI.

    The Digital Shelf Advantage in Retail Media

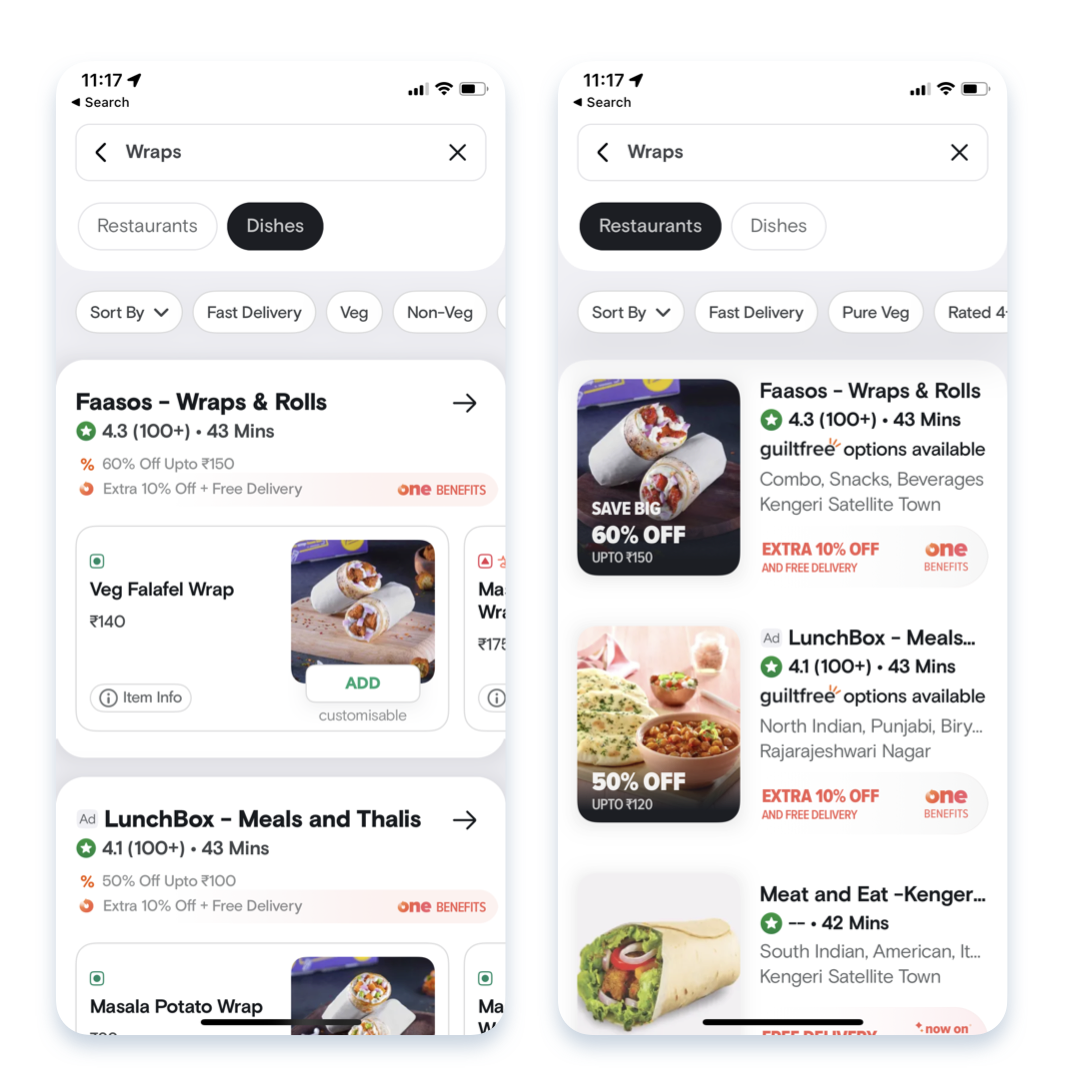
    The popularity of retail media networks has further amplified the need for integrated digital shelf analytics approaches. These advertising platforms, operated by retailers, allow brands to display targeted ads to shoppers across digital properties based on first-party customer data and purchase insights.

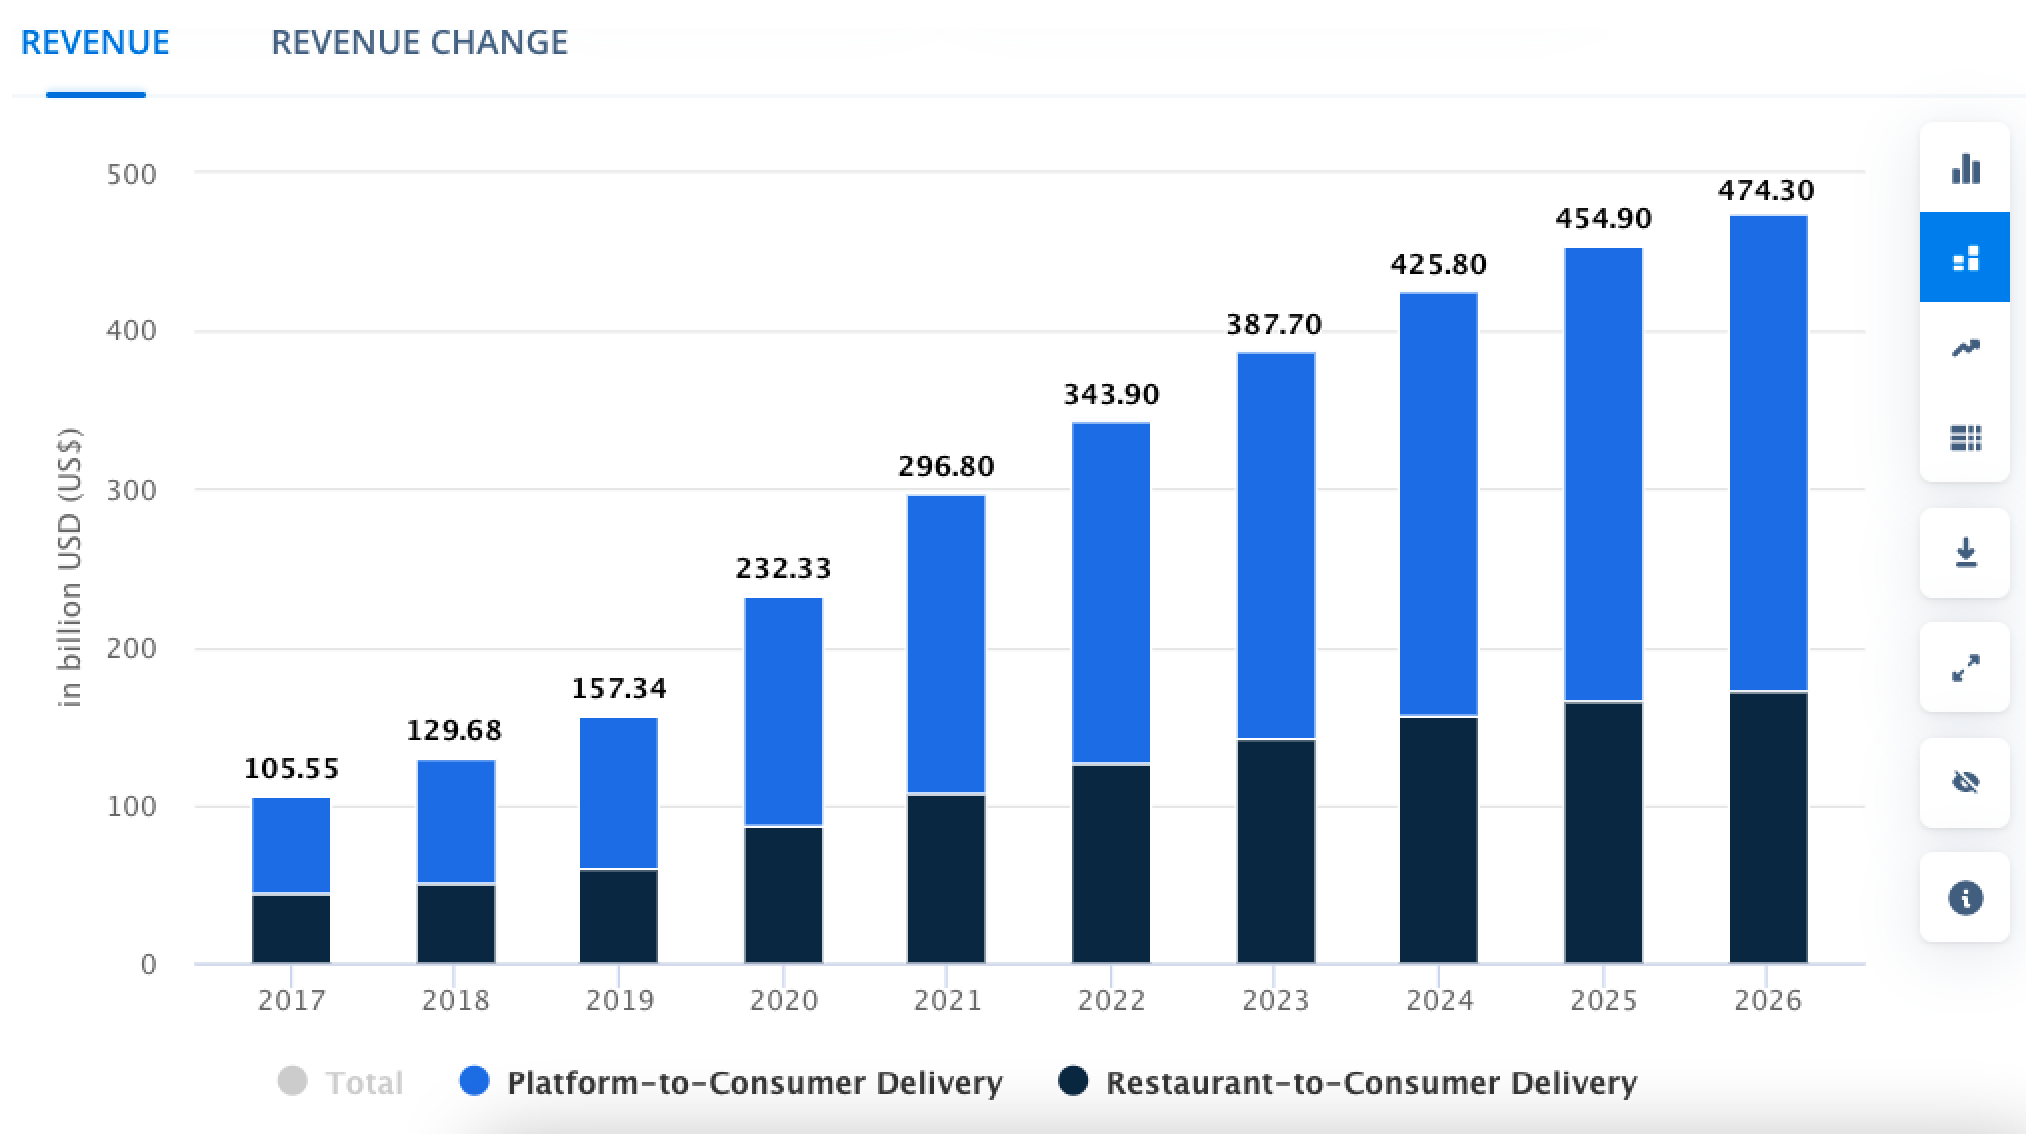
    The retail media revolution has transformed e-commerce pages into sophisticated search engines for product discovery. This evolution has been so impactful that retail media ad revenue surged 16.3% in 2023, reaching $43.7B in the U.S., with continued growth projected.

    Major platforms like Walmart have expanded their retail media networks to capitalize on closed-loop attribution. Since retailers own the entire customer journey, they can track everything from ad impression to purchase on their e-commerce sites. This creates a significant advantage through accurate ROI measurement, unlike traditional advertising where attribution remains challenging.

    How Digital Shelf Impact Modeling Enhances Retail Media Optimization

    With retail media emerging as a top-performing sales channel, brands need sophisticated optimization strategies. Every brand wants to maximize visibility and performance across individual eCommerce sites, just as they optimize for Google or emerging AI platforms.

    Integrating digital shelf analytics into marketing mix models enables brands to:

    • Allocate ad spend more intelligently using real-time competitive insights
    • Identify timely campaign activation opportunities in response to market changes
    • Monitor organic ranking trends to strategically time paid promotional activities
    • Measure true campaign impact on digital shelf performance metrics

    For example, when a competitor launches an aggressive price drop in your category, Digital Shelf Impact Modeling provides immediate visibility into this change. This intelligence can trigger recommended campaign adjustments, such as increased sponsored ad bidding in affected categories. Traditional analytics alone cannot deliver this level of responsive optimization.

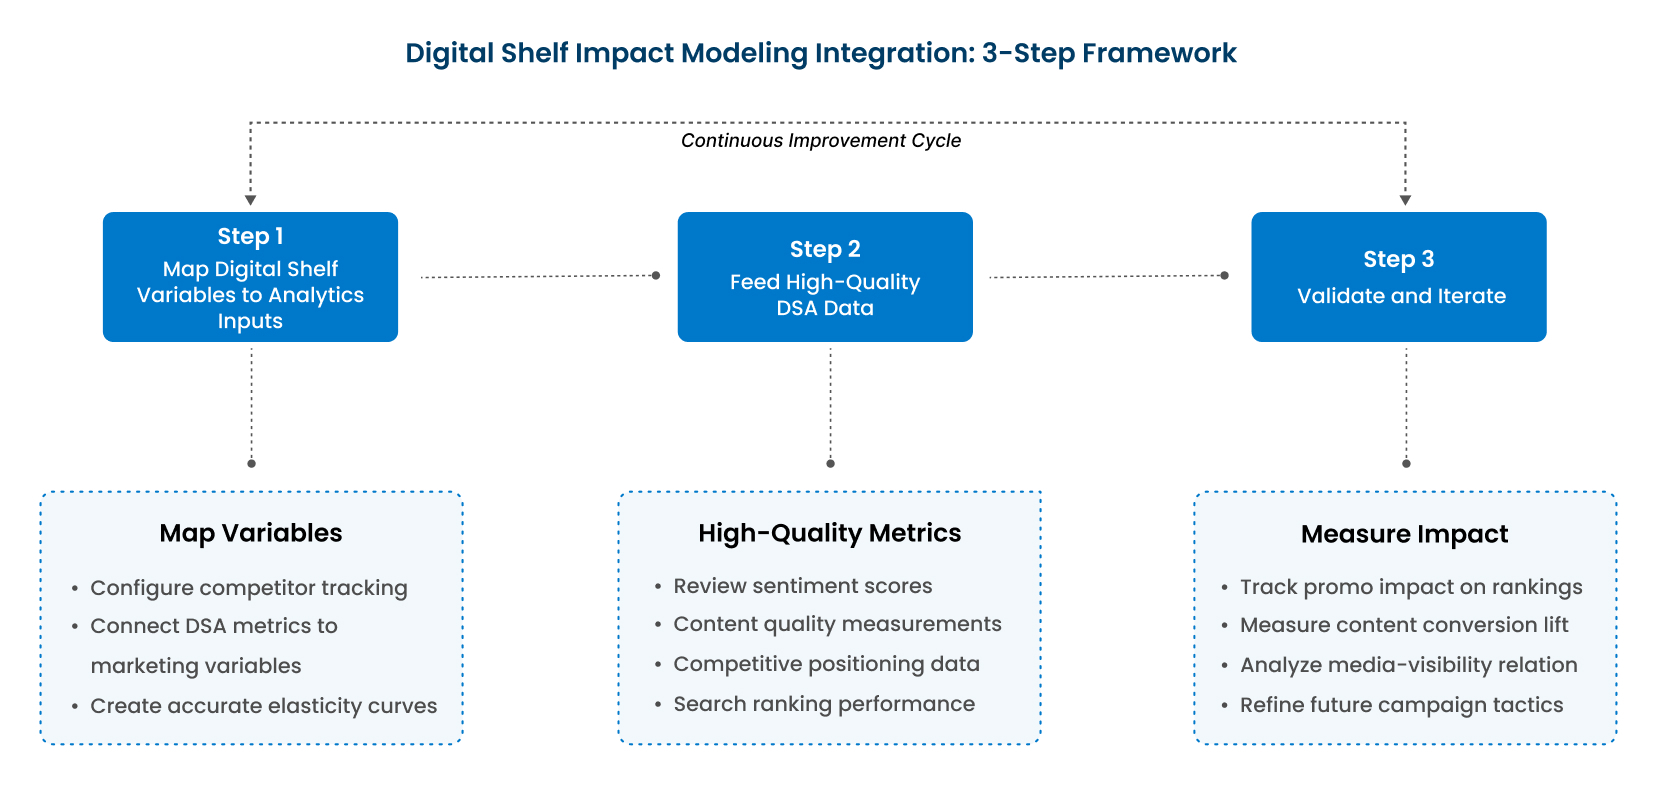
    How to Integrate Digital Shelf Impact Modeling: A 3-Step Framework

    Digital Shelf Impact Modeling for Marketing Investments

    Here’s how to integrate Digital Shelf Impact Modeling into your marketing strategy to start making better data-driven decisions for your brand.

    Step 1: Map Digital Shelf Variables to Analytics Inputs

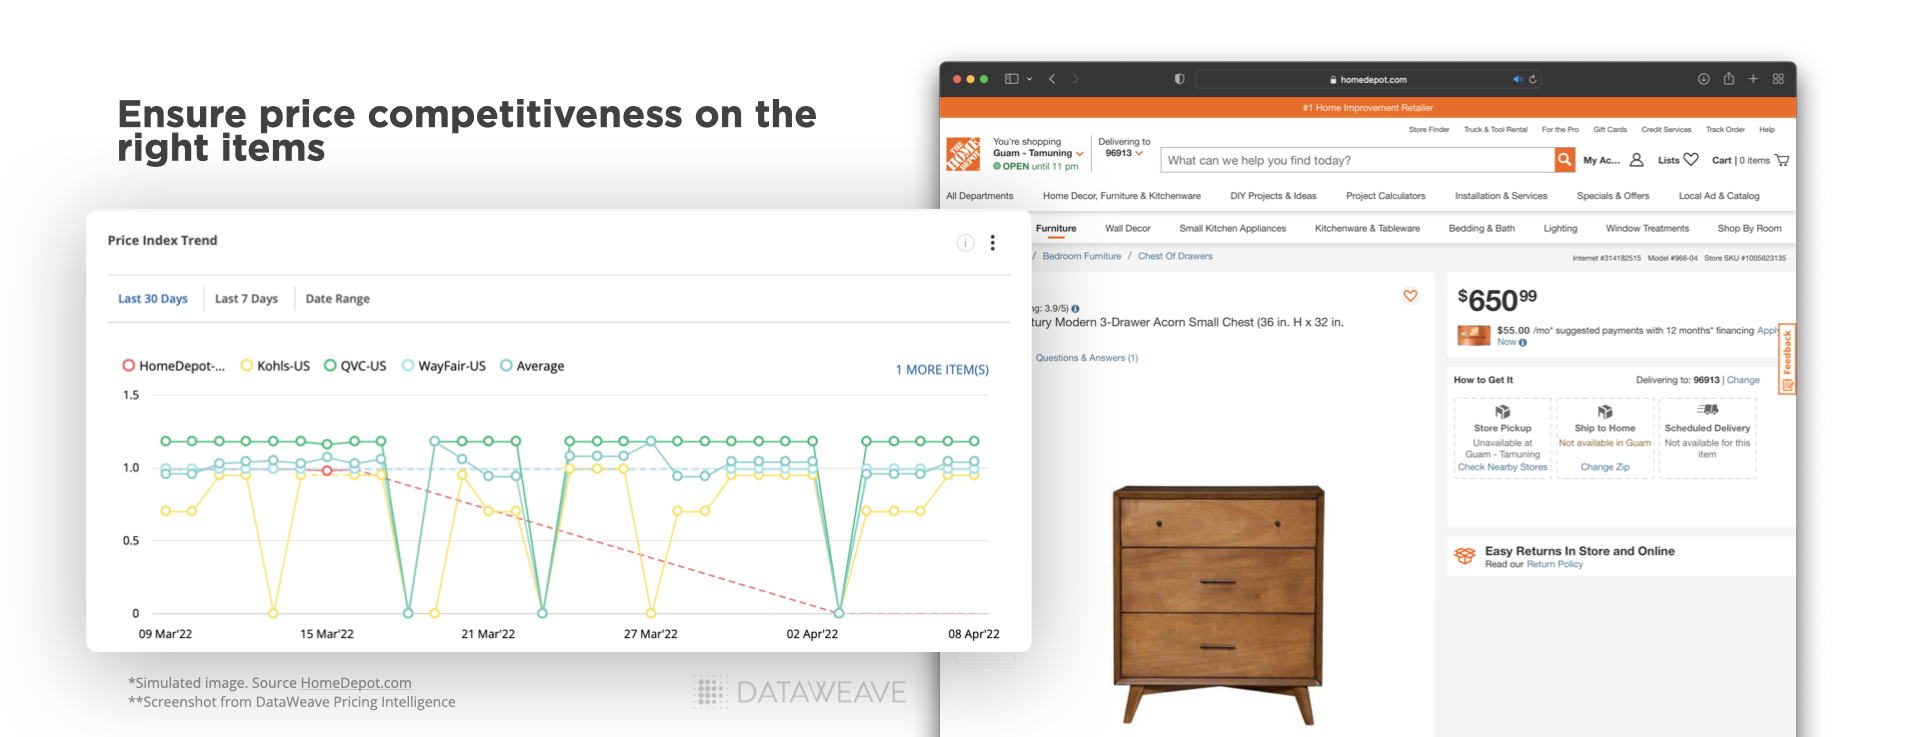
    Begin by mapping specific digital shelf variables to your existing analytics inputs. Ensure that competitors are properly configured for monitoring in your digital shelf platform and that timely metrics like price changes and search ranking positions are linked with your marketing measurement systems.

    This integration is crucial because traditional analytics rely exclusively on historical data for forecasting. Adding real-time inputs delivers several benefits:

    • More accurate elasticity curves reflecting current market conditions
    • Better understanding of root causes behind demand shifts
    • Prevention of misattributing sales changes to your marketing activities when external factors may be responsible

    At DataWeave, our comprehensive coverage spans 500+ billion data points, 400,000 brands, and 1,500+ websites, ensuring brands never miss a competitor move and maintain complete visibility across the connected e-commerce landscape.

    Step 2: Feed High-Quality Digital Shelf Data into Analytics Platforms

    Next, integrate critical digital shelf metrics into your measurement framework:

    • Review and sentiment scores and trends
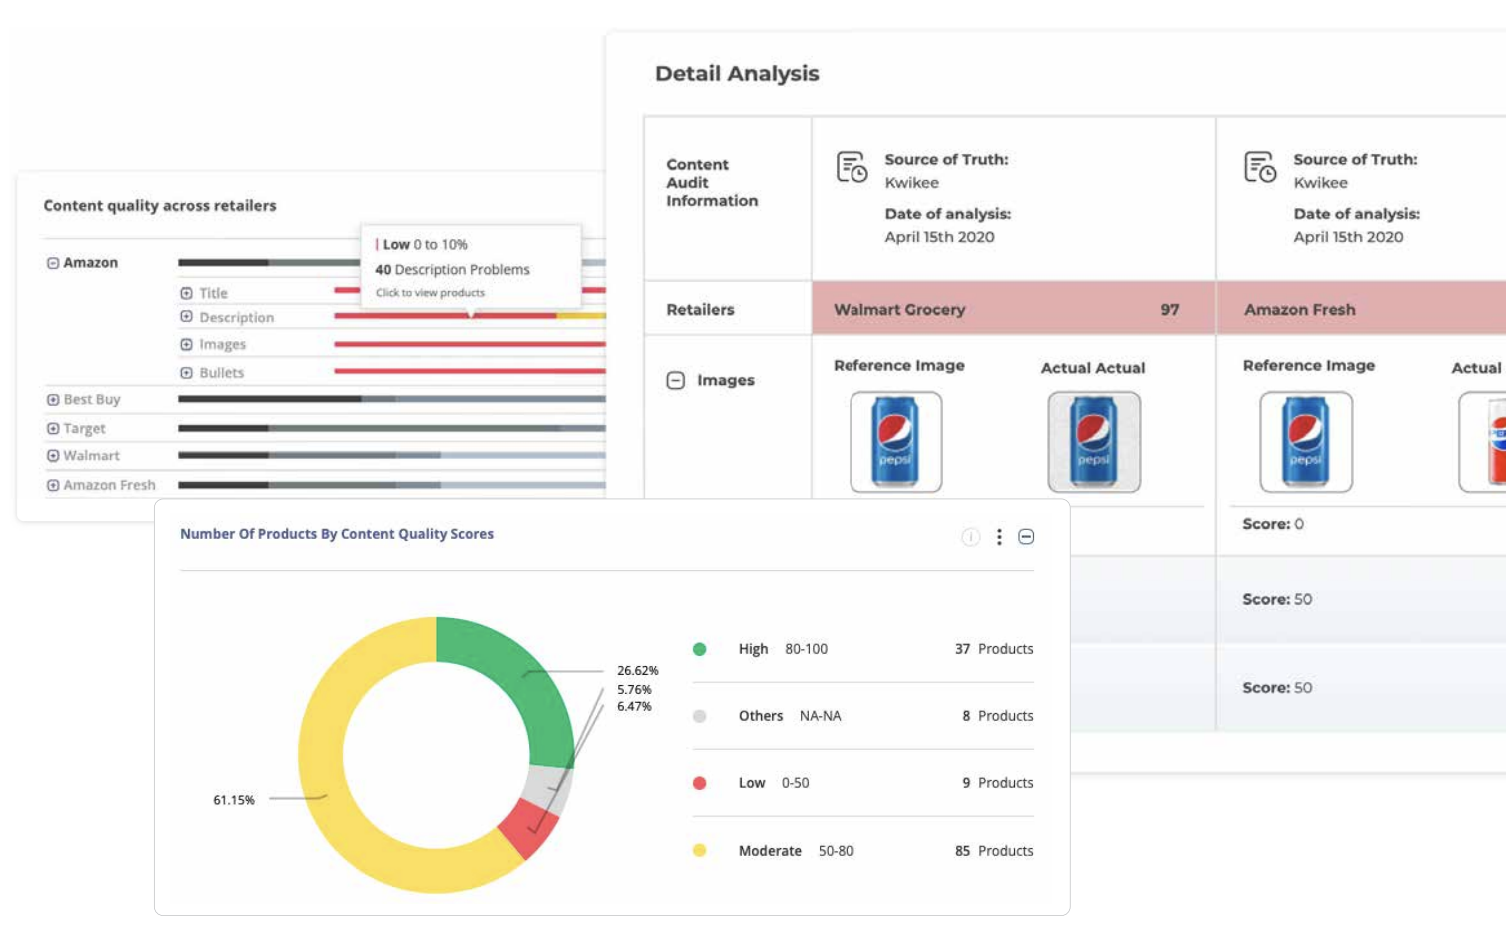
    • Content quality measurements
    • Competitive positioning data
    • Price gap analytics
    • Search ranking performance

    DataWeave employs a rigorous data accuracy validation process to ensure teams work with the cleanest, most reliable data possible. Our sophisticated processing pipeline removes anomalies and standardizes information across retailers, providing the consistent, high-integrity data foundation that robust marketing mix modeling demands.

    Step 3: Validate and Iterate

    A powerful Digital Shelf Impact Modeling solution helps measure whether your marketing efforts achieved their intended impact on the digital shelf. Use your digital shelf platform to assess your campaigns’ actual effect on key performance indicators:

    • Do promo-driven sales lifts correlate with improved search rankings?
    • How do content improvements impact conversion rates?
    • What is the relationship between paid media and organic visibility?

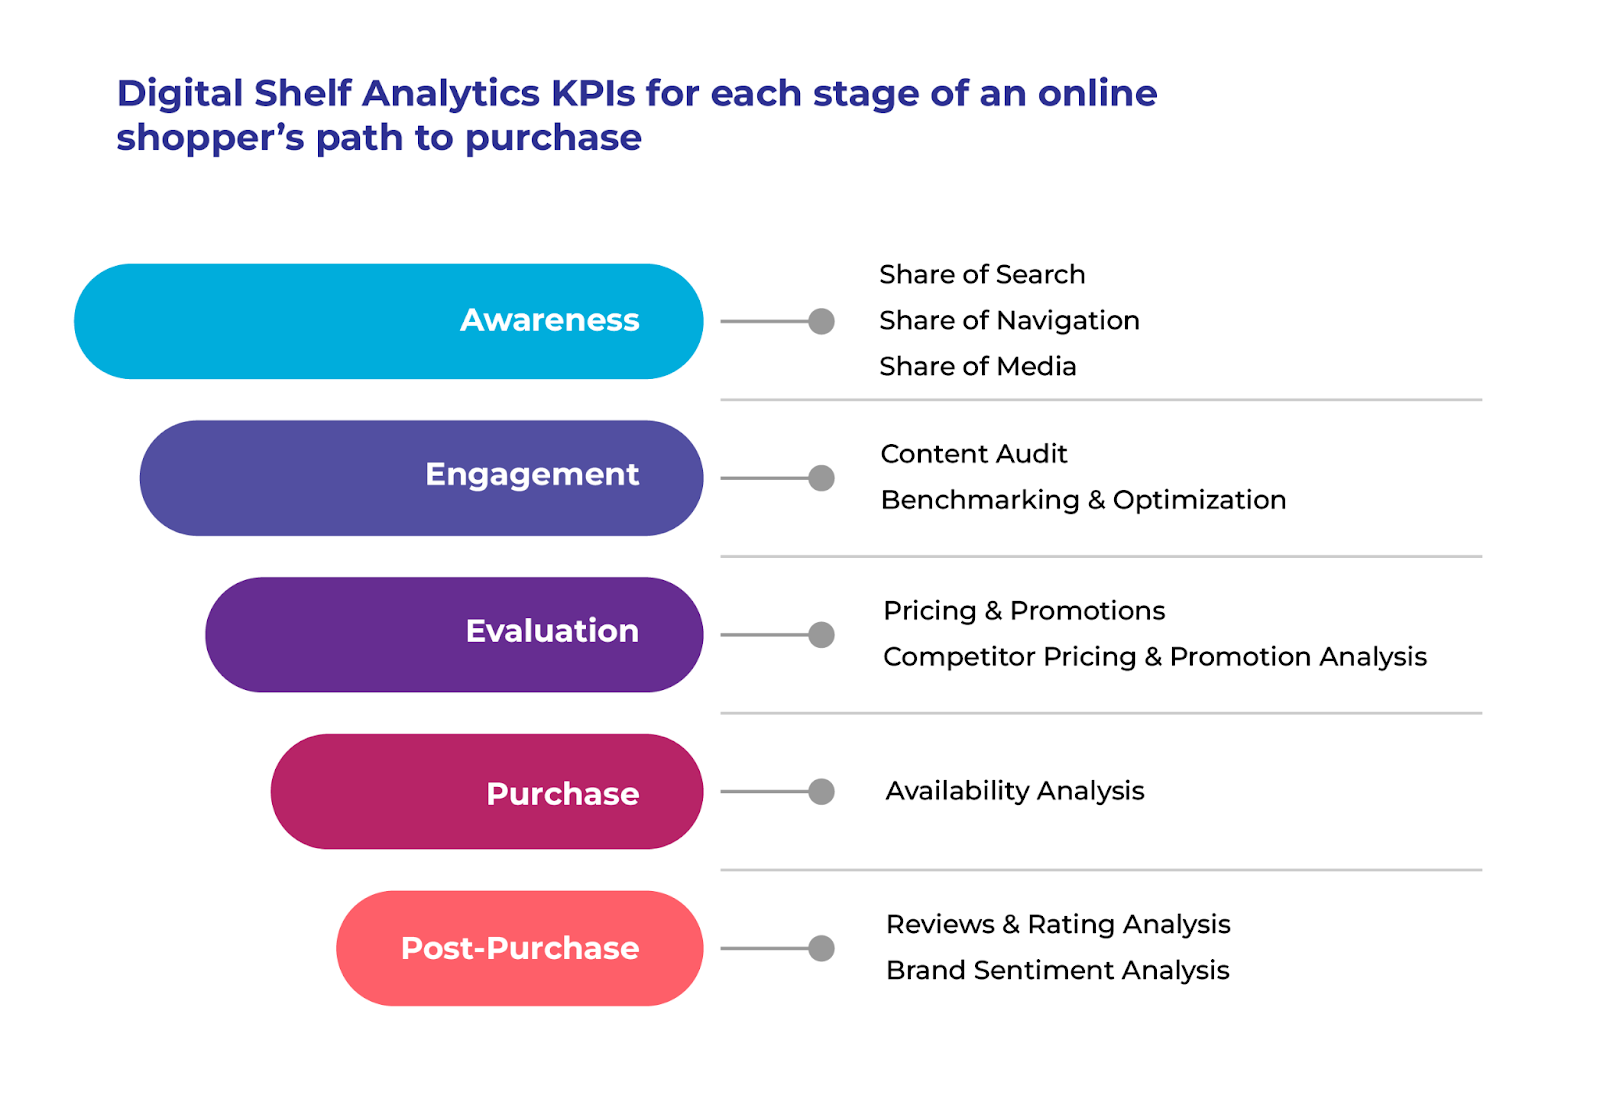
    DataWeave enables users to correlate metrics across the entire consumer journey, from awareness through post-purchase. Rather than focusing solely on short-term spikes, brands can measure lasting impacts on digital shelf health. This end-to-end visibility empowers teams to make increasingly informed decisions with each campaign cycle.

    Executive Decision Support in Uncertain Times

    It is no surprise to anyone that we are living through volatile times. Executives may be uncomfortable if they cannot provide their teams with strategic direction based on data or the tools they need to accelerate their workdays.

    By integrating Digital Shelf Impact Modeling with existing analytics, companies gain early warning signals about market shifts, enabling smarter resource allocation during budget constraints. This integration helps organizations move from tactical execution to strategic direction by:

    • Providing cross-channel impact analysis to understand the full marketing ecosystem
    • Equipping category managers with tactical optimization tools that support broader strategic objectives
    • Identifying competitive threats before they impact sales
    • Forecasting potential ROI impacts across various spending scenarios

    These capabilities help prevent wasted ad spend, missed opportunities, and lost sales.

    Future-Proofing Your Marketing Strategy with Digital Shelf Impact Modeling

    Several emerging trends highlight the growing importance of digital shelf-enhanced marketing analytics:

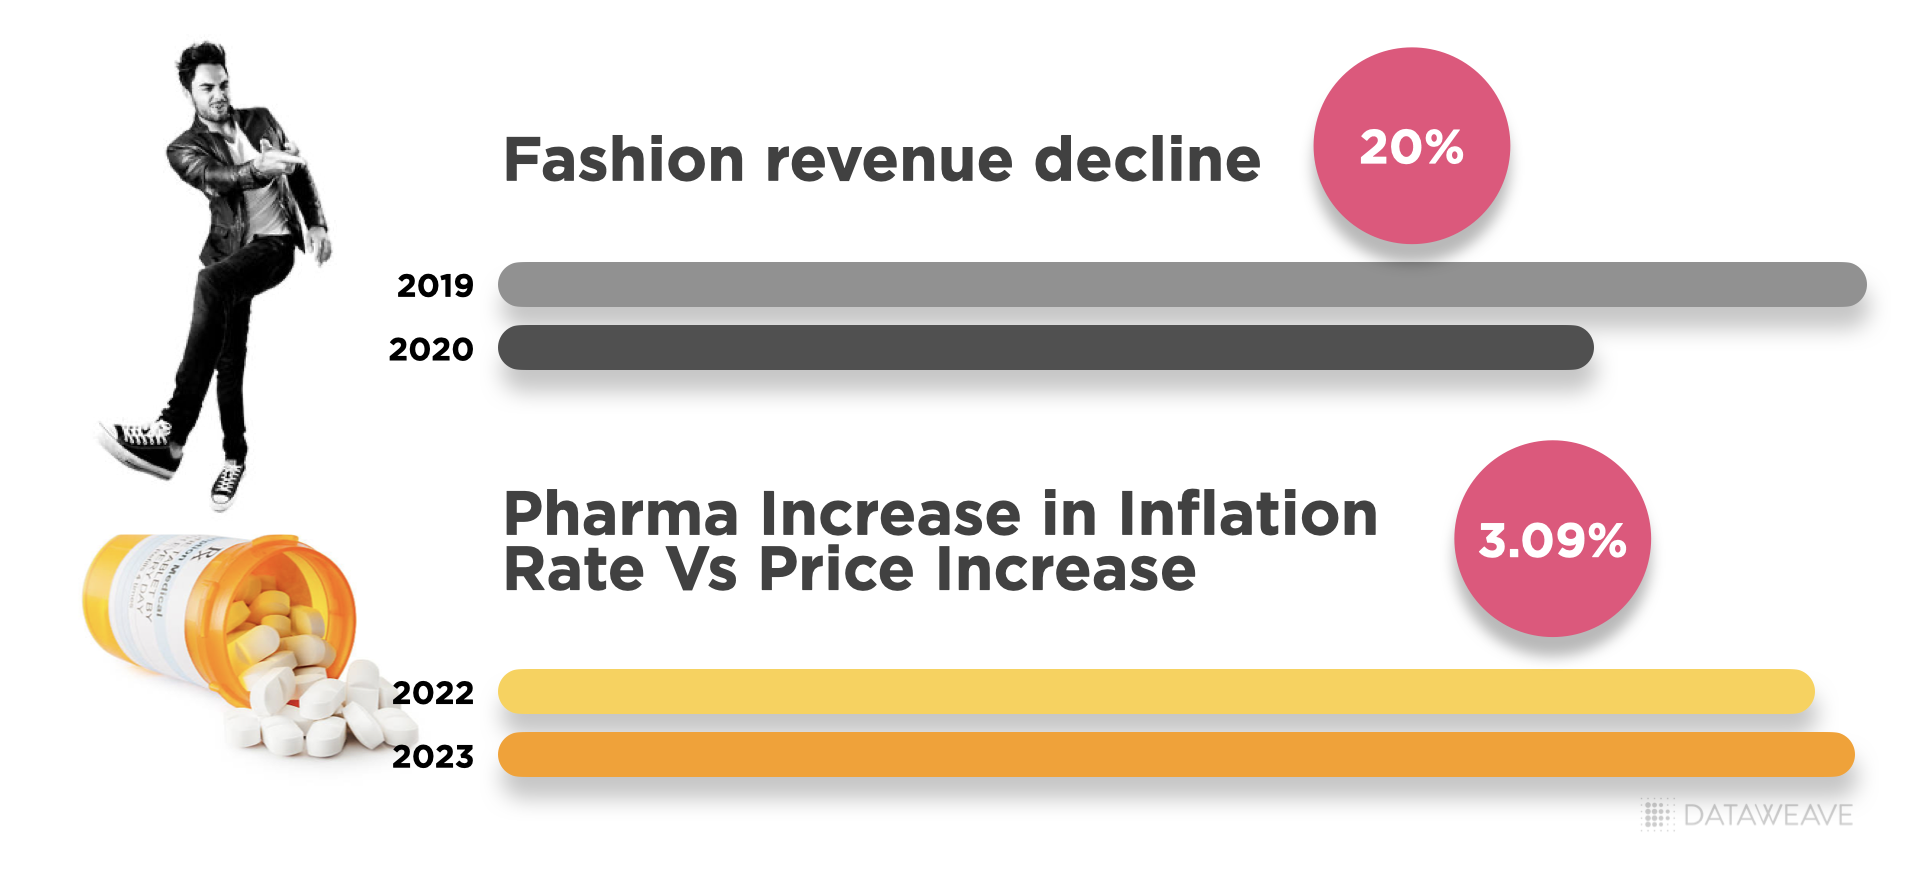
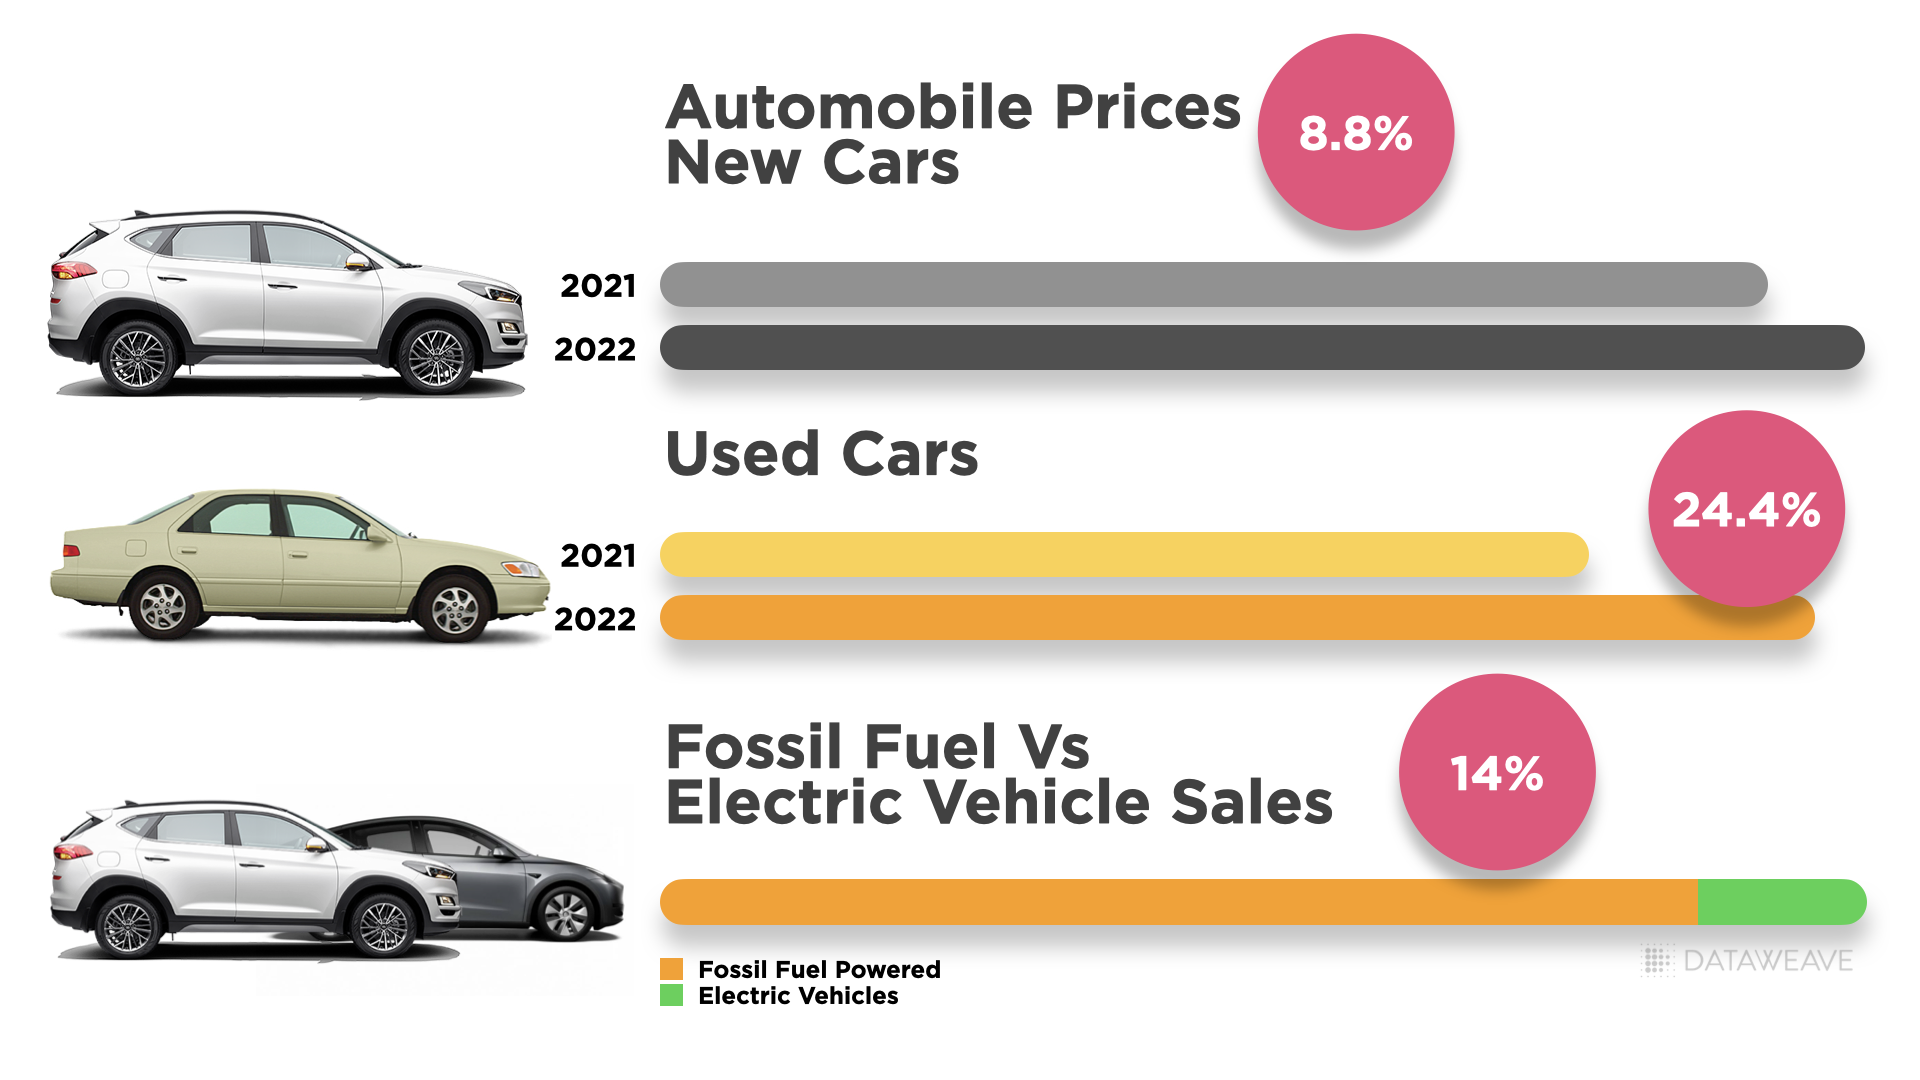
    • Trend 1: Navigating Economic Volatility – Brands can use Digital Shelf Impact Modeling to track how competitors adjust pricing in response to cost shocks like tariffs and inflation. This real-time intelligence directly improves demand forecasting accuracy.
    • Trend 2: AI-Powered Predictive Insights – Combining digital shelf trend detection (such as viral product reviews or sudden inventory fluctuations) with marketing performance metrics helps forecast demand spikes from otherwise unforeseen events.
    • Trend 3: Automated Optimization – Smart campaign activations and adjustments based on real-time digital shelf triggers drive efficiency. DataWeave’s vision includes an automated retail media intelligence layer that optimizes spend across channels based on integrated insights.

    DataWeave’s Unique Advantage

    At DataWeave, we’ve seen our digital shelf analytics customers significantly improve their organic search rankings because of better-sponsored ad campaigns. What makes DataWeave’s approach to Digital Shelf Impact Modeling uniquely powerful? Our platform is specifically designed to address the challenges of modern marketing measurement:

    • Superior data refresh rates ensure timely insights when they matter most
    • Unmatched marketplace coverage across more than 1,500 eCommerce sites globally
    • Advanced data normalization that standardizes metrics across disparate categories and retailers
    • API-first architecture enabling flexible data access and utilization

    Conclusion – From Hindsight to Foresight

    In the past, companies relied primarily on historical data for their marketing analytics. Today’s market leaders are incorporating Digital Shelf Impact Modeling to unlock superior insights, improve decision accuracy, and drive measurable ROI.

    DataWeave serves as the essential bridge between traditional analytics systems and real-time, comprehensive market intelligence. When digital shelf analytics and marketing measurement work together, brands gain a complete picture: traditional analytics show precisely what happened, while Digital Shelf Impact Modeling explains why it happened. Together, they reveal what’s coming next.

    Ready to transform your marketing analytics from hindsight to foresight? Contact us today to discover how our Digital Shelf Analytics can enhance your existing marketing investments and drive measurable business results.

  • Black Friday 2024 in Canada: Insights on Consumer Electronics and Home & Furniture

    Black Friday 2024 in Canada: Insights on Consumer Electronics and Home & Furniture

    Black Friday and Cyber Monday are major retail events in Canada, with 43% and 29% of the population making purchases during these sales respectively, according to a YouGov report. Consumer electronics continue to lead the Canadian retail market during these events, with 55% of surveyed shoppers choosing to buy tech products on Black Friday. Household appliances come in second, with 25% of shoppers opting for these items, while 18% prefer to shop for furniture deals.

    These statistics highlight the importance of delivering value during the Thanksgiving sales week. Retailers must cater to shoppers’ expectations with competitive pricing, attractive deals, and a seamless shopping experience. So, what unique offerings did Canadian retailers present to shoppers this season?

    To understand the pricing and discount dynamics during BFCM 2024 in Canada, DataWeave analyzed discounts across leading consumer electronics and home & furniture retailers. Using our AI-powered pricing intelligence platform, we analyzed 37,108 SKUs across these categories for major retailers including Amazon, Walmart, Best Buy, Home Depot, and Canadian Tire from the 10th to 29th November. We focused on the top 500 products ranked for each search keyword on each retail site, using targeted terms aligned with categories like “sofa” and “wearables”.

    In the following insights, the Absolute Discount represents the reduction of the selling price compared to the Manufacturer’s Suggested Retail Price (MSRP). The Additional Discount reflects how much lower the selling price is during Black Friday compared to its price a week before the sale. This metric reveals the actual or effective value of the sale event, beyond the standard discounts typically offered.

    Also check out our detailed analysis of discounts and pricing for the consumer electronics, apparel, health & beauty, grocery, and home & furniture categories across major US retailers this Black Friday.

    Consumer Electronics

    Retailers in Focus

    Consumer electronics saw robust participation from major retailers, with Amazon, Best Buy, and Walmart leading the charge. Here’s how they stacked up in terms of discounts:

    Pricing Trends Across Leading Consumer Electronics Retailers in Canada - Black Friday Cyber Monday 2024
    • Best Buy emerged as the frontrunner in absolute discounts at 31.2%, while Amazon impressed with a notable 19.7% additional discount, indicating a strong Black Friday-specific markdown strategy.
    • Walmart offered steady competition, particularly in audio and video products, which reached an average absolute discount of 37.2%. However, it’s average additional discount was only 3.1%, indicating muted BFCM-specific price reductions in this category.

    Subcategory Insights

    Diving deeper into consumer electronics subcategories, we observed varied discounting strategies.

    Pricing Trends Across Leading Canadian Consumer Electronics Retailer Subcategories - Black Friday Cyber Monday 2024
    • Audio & Video stood out as the most discounted subcategory, with Walmart leading at 37.2%.
    • In Wearables, Walmart again took the top spot with 36.4%, while Amazon offered higher additional discounts (22.4%).
    • Discounting for computers and gaming was less aggressive, highlighting strategic pricing to maintain profitability in these high-demand segments.

    Brand Performance

    Brand-level data highlighted how key players used Black Friday to drive visibility and sales.

    Pricing Trends Across Leading Canadian Consumer Electronics Brands - Black Friday Cyber Monday 2024
    • Dell led in average absolute discounts (36.7%) followed by Samsung at 36.68%
    • Audio brand JBL offered significant absolute discounts at 35.9%.
    • Apple and Lenovo offered comparatively fewer discounts but maintained strong visibility, as seen in their increase in the Share of Search during the sale period.
    Visibility Trends Across Leading Canadian Consumer Electronics Brands - Share of Search - Black Friday Cyber Monday 2024
    • MSI (laptop brand) and Bose (audio and earphone brand) experienced significant increases in visibility, with Share of Search increases of 5% and 3.6%, respectively.
    • Notably, HP faced a decline (-3.2%) in the Share of Search, suggesting missed opportunities to align promotions with consumer interest.

    Home & Furniture

    Retailers in Focus

    The home and furniture category saw competitive discounting, with Walmart, Canadian Tire, and Home Depot vying for consumer attention.

    Black Friday - Cyber Monday Trends Across Leading Canadian Home & Furniture Retailers
    • Walmart took the lead with the highest absolute discounts at 36.8%. The retailer’s additional discounts were more conservative at 3.6%. This is similar to their discount levels in Consumer Electronics.
    • Canadian Tire offered stiff competition, providing 31.6% absolute discounts and 25% additional discounts.
    • Home Depot matched its absolute and additional discounts, maintaining consistency at 24.1%.

    Subcategory Insights

    Home and furniture subcategories revealed targeted discount strategies.

    Black Friday - Cyber Monday Trends Across Leading Home & Furniture Subcategories - Canada
    • Bedding emerged as the most discounted subcategory at Walmart (50.6%) and Canadian Tire (35.3%).
    • Kitchenware saw competitive pricing, with Walmart leading at 42.9%, followed by Canadian Tire at 33.9%.
    • Canadian Tire focused on lighting, offering the highest absolute discounts in this subcategory (38.2%)

    Brand Performance

    Brand-level analysis revealed stark contrasts in discounting approaches.

    Black Friday - Cyber Monday Trends Across Leading Home & Furniture Brands - Canada
    • Furniture brands Homcom led in absolute discounts (36.4%), while South Shore stood out with the highest additional discounts (30.2%).
    • Value-oriented brands like furnishings brand Mainstays and mattress and bedding brand Zinus offered more modest discounts, focusing on consistent affordability.
    Black Friday - Cyber Monday Trends Across Leading Canadian Home & Furniture Brands - Share of Search and Visibility
    • Zinus (mattresses and sofa brand) experienced a significant 7.9% increase in the Share of Search, driven by aggressive promotions.
    • Home furnishings brands like Costway and Safavieh faced declines, reflecting the importance of aligning promotional strategies with consumer expectations.

    Insights for Retailers and Brands

    This Black Friday, Canadian retailers effectively balanced deep discounts with category-specific strategies to maximize sales. However, the fluctuating Share of Search highlights the critical need for brands to align promotions with consumer interest.

    For brands and retailers looking to stay ahead of the competition, DataWeave’s pricing intelligence platform offers unparalleled insights to refine discounting strategies and boost visibility. Contact us to learn how we can help you stay competitive in this dynamic retail landscape.

  • Early Black Friday Deals Analyzed: How Top Retailers Stack Up on Discounts

    Early Black Friday Deals Analyzed: How Top Retailers Stack Up on Discounts

    Black Friday, once confined to a single weekend, has evolved into a shopping season that now stretches well before Thanksgiving. With inflation hovering around 3% and consumer confidence showing signs of recovery, retailers are adapting their promotional calendars to capture early-bird shoppers and maintain a competitive edge.

    Major retailers, including Amazon, Walmart, Target, and Best Buy, have capitalized on this trend by launching promotions weeks in advance, signaling the traditional holiday rush is now a month-long event. At DataWeave, we put these deals under a microscope.

    Our Methodology

    Using DataWeave’s advanced, AI-powered pricing intelligence platform, we tracked early Black Friday deals across Consumer Electronics, Home & Furniture, Health & Beauty, and Apparel categories. We monitored dedicated Black Friday deal pages on Amazon, Walmart, Target, Best Buy, Nordstrom, Neiman Marcus, and Sephora to gather and analyze discount data a week prior to Black Friday weekend.

    Who’s Offering the Best Deals Across Categories?

    Our pre- Black Friday analysis reveals a clear pattern of premium brands offering deeper discounts across categories ahead of the holiday. Here are some key findings around retail players:

    • Walmart emerges as the most aggressive discounter across categories, leading in Health & Beauty (57.07%), Apparel (48.97%), and Consumer Electronics (43.35%).
    • Amazon maintains consistent but lower discounts (28-29%) across categories, suggesting potential deeper cuts ahead.
    • Best Buy and Sephora, both category specialists, play it conservative compared to mass retail players.

    Let’s look at each category more closely to get a detailed snapshot of the deals this Thanksgiving week:

    Health & Beauty

    Our analysis reveals that it’s not electronics, but the health & beauty category that leads with the widest discount range pre Black Friday, making it the category to watch out for.

    • Walmart takes the lead with an aggressive 57.1% average discount in this category, capitalizing on its value-oriented reputation.
    • Beauty specialist Sephora holds modest beauty discounts (32.81%) compared to other retailers.
    • Amazon offers the broadest range of SKUs (571) in the category.
    Avg. Discounts Across Retailers Pre Black Friday 2024 - Health & Beauty

    Among the health & beauty brands we analyzed, cosmetics brand Tarte and viral K-Beauty skincare brand COSRX stand out with discounts above 40%, appealing to cost-conscious beauty enthusiasts.

    Brands with Highest Avg. Discounts Before Black Friday 2024 - Health & Beauty

    Consumer Electronics

    Our pre- Black Friday analysis reveals interesting insights about consumer electronics deals this season.

    • Walmart, once again, emerges as the frontrunner in the category with 43.4% average discounts.
    • Best Buy plays it conservative in electronics (30.75%), despite being a category specialist, but offers the most extensive SKU coverage (3030).
    • Amazon’s consistent 29.7% discount across 1,749 SKUs suggests they’re probably holding back their best deals for Prime members during Black Friday.
    Avg. Discounts Across Retailers Pre Black Friday 2024 - Consumer Electronics

    Brand-specific data for the category reveals significant deals on Speck (48.07%) and smart TV brand Insignia (39.22%), making accessories and mid-tier electronics attractive for early shoppers. Core computing (HP at 32.14%) and electronics brands maintain more conservative discounts. It remains to be seen if this changes on Black Friday or Cyber Monday.

    Brands with Highest Avg. Discounts Before Black Friday 2024 - Consumer Electronics

    Apparel

    Our analysis of the apparel category reveals several highlights:

    • In the apparel category too, Walmart dominates with an impressive 49% average discount, effectively targeting price-sensitive shoppers in the fashion segment.
    • Nordstrom and Neiman Marcus, both known for apparel, offer significant discounts at 43.2% and 37.8% respectively.
    • Amazon’s expansive SKU coverage (1344) is countered by a modest 29.5% discount, showing its focus on variety over depth of discounts.
    Avg. Discounts Across Retailers Pre Black Friday 2024 - Apparel

    Premium fashion brands dominate the highest discounts this Black Friday in the apparel category. Vince Camuto leads with over 45.1% average discount. Notably, Levi and Nike’s aggressive 44.43% and 43.50% discounts suggests significant inventory positions or intent to capture market share.

    Brands with Highest Avg. Discounts Before Black Friday 2024 - Apparel

    Home & Furniture

    Our analysis reveals an interesting trend across the category.

    • In the home & furniture category too, Walmart leads at 41.8% average discounts. Target follows closely, but with significantly lesser SKUs on offer.
    • Amazon’s 28.1% discount, though the lowest among major players, spans a substantial 1,982 SKUs, reinforcing its position as a marketplace for diverse needs.
    Avg. Discounts Across Retailers Pre Black Friday 2024 - Home & Furniture

    Top 3 Products With the Highest Discounts Across Retailers

    To provide a clearer picture of the early Black Friday landscape, we analyzed the top 3 products with the most substantial discounts in consumer electronics and health & beauty categories. These insights highlight how retailers are leveraging strategic discounts on high-value items to attract early shoppers.

    Top Discounted Products in Consumer Electronics

    Premium TVs dominate the discount scene, with LG’s 83″ OLED offering up to 44.5% off on Amazon, closely followed by a 44.4% discount on Best Buy, showcasing aggressive competition. The same product has much lower discounting on Walmart, but notably, the product is retailed at $3999.9, at least $1000 less than other retailers, highlighting Walmart’s commitment to offering lowest prices.

    Products With Highest Discounts Pre Black Friday 2024 - Consumer Electronics - TVs
    Products With Highest Discounts Pre Black Friday 2024 - Consumer Electronics - Playstation
    Products With Highest Discounts Pre Black Friday 2024 - Consumer Electronics - Digital Cameras

    Gaming consoles, like the PlayStation 5 Slim Bundle, show moderate discounts (ranging from 15% on Walmart and Target to 25% at Best Buy), appealing to tech-savvy shoppers.

    Notable competition is evident in price matching across major retailers, particularly in TVs and high-value electronics like the Nikon Z 8 camera, where Walmart offers the deepest discount at 13.75%, edging past Amazon and Best Buy.

    Top Discounted Products in Health & Beauty

    Viral skincare staples like Tatcha’s Water Cream show tight discounting consistency, with Walmart offering 19.47% off compared to Amazon’s 20% and Sephora’s 20.83%.

    Products With Highest Discounts Pre Black Friday 2024 - Health & Beauty - Tatcha Water Cream
    Products With Highest Discounts Pre Black Friday 2024 - Health & Beauty - Olaplex Hair Oil
    Products With Highest Discounts Pre Black Friday 2024 - Health & Beauty - Yves Saint Laurent Satin Lipstick

    Trending haircare brand Olaplex displays greater disparity, with Walmart leading with a 33.33% discount, surpassing Amazon and Sephora. Luxury brand, Yves Saint Laurent’s Satin Lipstick is one of the highest discounted items across retailers.

    Looking Ahead

    Our analysis suggests that while some early deals offer genuine value, particularly in premium beauty and high-end electronics, many retailers might be holding their best discounts for Black Friday.

    For shoppers, the key is being selective: jump on premium brand discounts now (since they’re likely to remain the same though the weekend), but wait on mid-range electronics and home goods where better deals are likely to emerge on Black Friday or Cyber Monday.

    For retailers, the imperative is clear: dynamic pricing intelligence is crucial for maintaining a competitive edge while protecting margins. Competitive insights will be critical as the holiday season progresses to balance market share against profitability.

    Stay tuned for our Black Friday Cyber Monday analysis next week, where we’ll track how these early discounts compare to the main event’s deals!

  • A Guide to Digital Shelf Metrics for Consumer Brands

    A Guide to Digital Shelf Metrics for Consumer Brands

    Our world is increasingly going online. We work online, socialize online, and shop online every day. As a consumer brand, you need to ensure complete awareness of your brand’s online presence across eCommerce platforms, search engines, and media.

    Only by deeply understanding the customer journey can you ensure that your product is reaching your ideal customers and maximizing your brand’s market share. You need data to intrinsically understand your customer journey and make changes where you’re lacking.

    As the old adage goes: ‘You can’t manage what you don’t measure.’

    You need digital shelf metrics to measure and start benchmarking your buyer’s journey. To find several of these types of key performance indicators (KPIs), you need a digital shelf analytics solution. These platforms allow you to track various metrics along the path to purchase from the awareness stage to the post-purchase phase across the entire internet, helping to inform online and offline sales strategies.

    Digital shelf analytics will help you gain insights into how your brand is doing versus the competition, which areas are lagging behind in historical performance, and what activities are driving sales. There are innumerable ways in which you can leverage these valuable insights. But how do you know which KPIs to start tracking with your digital shelf analytics solution?

    Here, we’ve summarized the top metric types your peers report, track and base their decisions on.

    With these KPIs in hand, consumer brands like yours can ensure that their products are consistently visible and appealing to their target audience across online marketplaces, ultimately enhancing conversion rates, market share, and profitability.

    Read this guide to learn more about the top digital shelf metrics consumer brands are tracking and how to use them in your own strategy.

    1. Share of Search

    Share of Search (SoS) is a KPI in digital shelf analytics that measures how frequently a consumer brand’s products appear in search results on eCommerce platforms relative to the competition for specific keywords. A good digital shelf analytics solution will be able to show this metric across all the top marketplaces and retailers, such as Amazon and Walmart, but also more niche marketplaces for industry-specific selling.

    This metric provides brands with a quantifiable way to measure how frequently their products are being “served up” to customers on online marketplaces. Essentially, it measures visibility and discoverability.

    Share of Search exmple_Digital Shelf Metrics

    With Share of Search on DataWeave, you can slice and dice your data in innumerable ways. These are a few important views you can see:

    • Aggregated SoS
    • Organic and Sponsored SoS scores
    • SoS scores across brands, retailers, keywords, cities
    • Historical SoS score trends

    Once you have benchmarked your SoS and category presence relative to your competition, you need to start interpreting the data. Here are some questions you can ask yourself to help interpret your findings:

    Share of Search exmple_Digital Shelf Metrics
    • Which of my key categories have the lowest SoS score?
    • Which products feature low on search results because they are out of stock?
    • Are my competitors’ products faring better due to sponsored searches?
    • Is my SoS low due to poor content quality?

    With insights in hand, you will know which actions to take to drive the biggest impact. For example, you could increase sponsored search results or improve organic reach by optimizing product pages.

    Understanding your SoS is essential to maximizing the awareness phase of your customer journey. It will help you improve your brand visibility and increase product conversions through better search and category presence.

    2. Share of Media

    Share of Media (SoM) is a KPI that is just as impactful, if not more so, than the SoS metric. However, only a limited number of brands track it or use it to drive strategic action. This makes it a perfect opportunity for brands looking to get an edge on the competition.

    But what is SoM in digital shelf analytics? Essentially, it’s a way of measuring retail media advertising activities like brand-sponsored banners, listings, videos, ads, and promotions that sometimes blend into search results. The main types of retail media advertising exist in two categories: banner advertising and sponsored listings.

    Banner advertising involves strategically placing designed banners within websites and search listings. These banners raise brand awareness and drive traffic to online storefronts.

    Sponsored listings are paid placements within search results on search engines or eCommerce platforms. They are prioritized based on the total bid amount and the product’s relevance. These paid listings are marked with “sponsored” or “ad.”

    Sponsored listings on an Amazon webpage

    It’s important to run these types of advertising campaigns on eCommerce platforms to gain customer visibility. In fact, “some 57% of US consumers started their online shopping searches on Amazon as of Q2 2023.” If you aren’t showing up, paying for placement can help.

    These listings serve to enhance your brand’s overall visibility, help you gain more precise reach, increase conversions, and drive better brand awareness and recall with your customers.

    These efforts aren’t free, however, so measuring their effectiveness is critical not only to gain all the listed benefits but to also not waste your valuable marketing budget. The SoM KPI can help a consumer brand answer questions like:

    • Where are the opportunities to increase paid ads?
    • Which categories could benefit from a promotional boost or a strategic and streamlined allocation of ad spend?
    • Which of my competitors have active banners and what is their share of media by keyword?
    • How has my ad spend trended historically in comparison to my competitor?
    Analytics Dashboard on Dataweave

    DataWeave’s digital shelf analytics (DSA) is among the first providers to offer Share of Media KPI tracking and analysis. This is because it requires advanced, multi-modal AI to gather, view, and aggregate listings that encompass text, images, and video. With Share of Media tracking facilitated by DataWeave, consumer brands can track and analyze the effectiveness of their own promotional investments as well as those of their competitors.

    3. Content Quality

    The content quality metric measures how well your product content adheres to the retailer’s specific guidelines, which are in place to steer traffic and sales on their sites.

    With the help of a DSA platform’s AI and ML capabilities, you can measure different elements of your product detail pages (PDPs), such as titles, descriptions, images, videos, and even customer reviews. You need to know which elements are missing, where they are missing, and which ones are negatively affecting sales so you can take corrective action.

    Did you know that the average cart abandonment rate is 69.99%? The quality of your content can significantly impact this number. Ensuring that your content is high-quality will help influence product discoverability, customer engagement, and conversion rates. It will also help position you ahead of the competition. If your content quality is poor, you may find yourself with lower search rankings, a higher return rate, and more abandoned carts.

    Here are some questions you can answer with the help of the content quality digital shelf metric:

    • Is my product content at a retail site exactly what was syndicated?
    • Are there any retailer initiated changes to my product content?
    • Are my product content updates reflected on the retailer platforms?
    • How well does my product content comply with the retailer guidelines?
    • How do I optimize my product content for enhanced discoverability and conversion?

    DataWeave’s content quality digital shelf analysis helps consumer brands ensure that product content on eCommerce platforms is high-quality and benchmark their product listings against the competition. It does this through a combination of AI-driven quality analysis and by presenting brands with actionable recommendations. These optimized suggestions are based on the top-performing products so you can focus your valuable time on the areas that will drive the biggest impact.

    4. Pricing & Promotions

    Your customers can easily shop around to find the best price for the product you’re selling. If your competitor is selling it cheaper, you’ll lose that sale.

    That’s why it’s essential to understand the pricing and promotional landscape for each of your products and categories. This can be a challenge, especially if it’s a common product or comes in multiple pack sizes or variants.

    It’s equally important to track pricing and promotions even at individual, physical stores. Doing so will allow you to remain competitive and responsive to local market dynamics by tailoring your pricing strategies based on regional competition. You don’t want your products to be overpriced (lost sales) or underpriced (lost profit) in specific markets.

    Harmonizing insights when operating an omnichannel consumer brand is extremely difficult without the aid of a digital shelf analytics solution. Insights need to be aggregated between desktop sites, mobile sites, and mobile applications, as well as from physical storefronts.

    Questions you can answer with the help of the pricing & promotions digital shelf metric include:

    • How do my product prices and promotions compare to my competitors?
    • How consistent is my product pricing across retail websites?
    • How does my product pricing vary across regions, ZIPs, and stores?
    • How do price changes influence my sales numbers?
    • Are there regional differences in pricing and promotion effectiveness?

    DataWeave’s digital shelf analytics platform stands out with its sophisticated location-aware capabilities, which enable the aggregation and analysis of localized pricing and promotions. The platform defines locations based on a range of identifiers, such as latitudes and longitudes, regions, states, ZIP codes, or specific store numbers.

    The platform can also extract promotional information, such as credit card-based or volume-based promotions. You can see variances across retailers, split by price groups, brands, and competitors. DataWeave specializes in enabling brands to conduct in-depth analyses across a wide array of attributes so you can answer just about any pricing or promotional question you have.

    Digital shelf pricing insights via Dataweave

    5. Availability

    The availability KPI in digital shelf analytics measures the in-stock and availability rates for a brand’s products across eCommerce and physical locations. Similar to the pricing and promotions metric, it relies heavily on location awareness, down to individual stores. Measuring both online availability and offline in-stock rates will help you understand the big picture and take more informed replenishment action.

    When you start leveraging the availability KPI with the help of digital shelf analytics, you can improve inventory management, boost product discoverability, increase the frequency with which your online product listings convert, and generally drive more sales. This KPI is essential for ensuring your customers can always find and buy the products they want.

    With the availability KPI, you can start answering questions like:

    • What is my overall in-stock rate?
    • Which of my products frequently go out of stock?
    • How does product availability vary across different regions and stores?
    • What is the impact of availability on my conversion rates?
    • Are there any seasonal trends in product availability that I need to address?
    • How quickly are we resolving stockout issues across different locations?
    • What are my biggest opportunities to reduce stockouts?

    DataWeave enables consumer brands to track their product availability metric through automated data collection from various eCommerce platforms in conjunction with physical in-stock rates. The platform provides granular, store-level insights so you can understand regional stock variations and optimize inventory distribution. By tracking historical availability data, you can identify seasonal patterns and predict future demand to pre-empt stockout issues. All of this can be configured with automatic notifications to alert you when there has been a stockout event or when a low stock threshold has been passed, facilitating timely replenishment.

    Graph showing availability across locations

    6. Ratings & Reviews

    The final KPI in our guide is the ratings & reviews digital shelf metric. Consumers rely heavily on genuine feedback from their peers and refer to star ratings, posted comments, and uploaded pictures to inform their buying decisions. This KPI analyzes the impact of customer feedback and reviews on your products’ performance across eCommerce platforms so you can measure overall brand perception and isolate areas of opportunity.

    This metric does something other digital shelf metrics don’t; it can inform your product strategy. It can help you identify repeat complaints that your product team can address with the manufacturer or use for the design of future products.

    Some questions you can answer with this powerful KPI include:

    • What is the overall customer sentiment towards my products based on ratings and reviews?
    • Which product features are frequently mentioned positively or negatively by customers?
    • How do my product ratings and reviews compare to those of my competitors?
    • Are there common issues or complaints that need to be addressed to improve customer satisfaction?
    • Which products have the highest and lowest ratings, and why?

    With DataWeave’s digital ratings and reviews feature, you can keep a pulse on customer sentiment to take short-term action as well as decide long-term strategy. You can leverage reviews to influence product perception, refine products, and enhance overall customer satisfaction.

    DataWeave’s Digital Shelf Metrics

    Each one of these metrics is interconnected and collectively influences a brand’s success. For instance, improving content quality and earning higher ratings can significantly enhance your product’s visibility in search results, thereby boosting the Share of Search digital shelf metric. By focusing on a comprehensive approach that integrates these metrics, brands can ensure their products are consistently visible, competitively priced, well-reviewed, and readily available.

    DataWeave gives consumer brands the means to execute a holistic digital shelf strategy. From a single portal, track and improve digital shelf metrics like Share of Search, Share of Media, Pricing and promotions, Availability, and Ratings and Reviews.

    Our solutions help audit and optimize the most critical KPIs that drive sales and market share for brands so you can stay competitive in a dynamic digital landscape and foster long-term customer satisfaction.

    Ready to get started? Schedule a call with a specialist to see how it can work for your brand.

  • Amazon US Prime Day 2023: Insights on Pricing and Discounts Across Popular Categories and Brands

    Amazon US Prime Day 2023: Insights on Pricing and Discounts Across Popular Categories and Brands

    Amazon’s Prime Day this year proved to be a record-breaking success, becoming the largest Prime Day event in the company’s history. Over the two-day extravaganza, shoppers in the US spent a staggering $12.7 billion, a 6.1% increase from the previous year. Amid inflationary pressures and supply chain disruptions, Amazon adopted a bold discounting strategy, offering steeper discounts compared to Prime Day 2022.

    An interesting aspect of Amazon’s approach is their loyalty based offerings. In the weeks leading to Prime Day on July 11-12, members of the loyalty program were given access to “invite-only deals” where shoppers could request invites to specific products that they were looking to purchase on deals. Overall, Amazon’s pricing and discount strategies during Prime Day were carefully designed to create a buzz among shoppers, generate increased sales, and maintain a competitive advantage in the market.

    While Prime Day is Amazon’s showstopper, it’s interesting to also see how other leading retailers respond to such a massive sale by their biggest competitor. Do they also lower their prices during the event, or are they happy to take a backseat? To answer these questions, we leveraged our proprietary data aggregation and analysis platform to analyze the prices and discounts of Amazon and its leading competitors across key product categories – Apparel, Home & Furniture, Consumer Electronics, and Health & Beauty – during Prime Day.

    Since products on Amazon and other eCommerce websites are often sold at discounts even on normal days not linked to a sale event, we delved into the real value that Prime Day offers to shoppers by focusing on price reductions or additional discounts during the sale compared to the week before. As a result, our approach highlights the genuine benefits of the event for shoppers who count on lower prices during the sale.

    Research & Methodology

    For our analysis, we tracked the prices of a large number of products across several leading retailers during Prime Day as well as the week prior to the event. The details of our sample are mentioned below:

    • Number of SKUs: 110,000+
    • Websites: Amazon, Walmart, Target, Overstock, The Home Depot, Wayfair, Ulta Beauty, Sephora
    • Categories: Apparel, Home & Furniture, Electronics, Health & Beauty
    • Pre-event Analysis: 4-10 July 2023
    • Prime Day Analysis: 11-12 July 2023

    Our Key Findings

    Our data reveals that Amazon’s price reductions were most aggressive in the Consumer Electronics category, with an average price reduction of 10.4% on Prime Day, due to the category’s popularity and high demand.

    The Health & Beauty (6.7%), Apparel (5.9%), and Home & Furniture (4.8%) categories offered relatively modest deals during the sale event.

    The Health & Beauty (6.7%), Apparel (5.9%), and Home & Furniture (4.8%) categories offered relatively modest deals during the sale event.

    Below, we delve deeper into our analysis of each category to better understand how price reductions were distributed across key subcategories on Amazon as well as the discounting strategies of Amazon’s leading competitors.

    Apparel

    As Amazon grappled with surplus inventory, heightened storage costs, and reduced profit margins in apparel (like most other retailers), its average discount before Prime Day was already as high as 13.3%. Then, on Prime Day, Amazon’s apparel deals were tempered at around 5.9% across an impressive 33.1% of its assortment, while Target and Walmart chose not to compete in a meaningful way.

    Unlike Prime Day 2022, when Target competed with Amazon with high discounts, the retailer offered only 0.8% additional discount across 4.4% of its assortment in this category. Walmart, too, reduced its prices by only 1.4% on 8.5% of its assortment during Prime Day.

    Check out our latest analysis on fashion pricing trends across 2022-23 to better understand the pricing dynamics in this category in greater detail.

    Across all the apparel subcategories we analyzed, Women’s Athleisure (8.7%), Men’s Swimwear (8%), and Women’s Tops (7.6%) were among the ones with the highest price reductions. On the other hand, Men’s Athleisure (2.5%), Women’s Shoes (3.5%), and Men’s Innerwear (4.1%) had conservative markdowns.

    Pricing decisions across the various subcategories are likely to have been influenced by several factors like inventory levels, demand patterns, and the need to balance competitive offers with maintaining reasonable profit margins, as Amazon tried to cater to a more price-sensitive consumer.

    Across all apparel subcategories, leading brands that offered the highest markdowns were Tommy Hilfiger (11.5%), Amazon Essentials (9.4%), Adidas (8.6%), and Calvin Klein (8.6%).

    For brands, however, lowering prices is only one lever to attract and convert shoppers. They also need to ensure they’re highly visible and discoverable on Amazon’s search listings. This exponentially improves their chances of driving more clicks and conversions. In our analysis, we tracked the Share of Search of brands across several popular search keywords. Share of Search for a brand is defined as the proportion of the brand’s products in the top 20 search results for a search query.

    Our data indicates that several brands gained impressive ground in their discoverability during Prime Day, while others fell behind. Gildan in Men’s Innerwear, Adidas in Men’s and Women’s Shoes, Anrabess in Women’s Athleisure, and Lululemon in Men’s Athleisure, among others, improved their Share of Search by significant levels during Prime Day.

    On the other hand, brands like Hanes in Men’s and Women’s Innerwear, Kanu Surf in Men’s Swimwear, Cupshe in Women’s Swimwear, and others lost around 10% in their Share of Search during the event. This is likely to have impacted their sales volumes adversely.

    Home & Furniture

    The Home & Furniture industry has been challenged with reduced demand due to inflationary pressures over the past year or so. Leading retailers in the category overestimated the demand, leading to overstocking of inventory. As a result, Home & Furniture is one of the few categories that saw Amazon’s competitors participate at a significant level on Prime Day in order to ensure they don’t fall behind on liquidating their stock.

    Amazon’s additional discounts averaged 4.8% across 30.2% of its assortment. Wayfair and Overstock too reduced their prices by 4.8% and 4.3% on around 44% of their respective assortments. Wayfair’s move is likely a part of their strategy to attract new customers and expand their market share, in response to a decline in their consumer base. Last year, Wayfair experienced a loss of 5 million out of its 1.3 billion consumers due to weakening demand.

    Target and Walmart did offer additional discounts, but they were not at a competitive level. The Home Depot effectively opted not to compete at all during the sale event. Overall, the pricing actions of these retailers are in stark contrast to the highly conservative pricing strategies observed on Prime Day last year.

    Our recent pricing analysis of the Home & Furniture category revealed more interesting insights and pricing dynamics over the past year.

    Across all the subcategories we analyzed, Bookcases (8.2%), Rugs (7.8%), Mattresses (6.5%), and Luggage (6.2%) were among the ones with high price reductions.

    Meanwhile, Sofas (2.4%), Washer / Dryers (2.4%), and Entertainment Units (2.7%) had lower markdowns. These are large and substantial purchases, making retailers more cautious about deeply discounting them while still ensuring profitability.

    The brands that stepped up and offered the highest markdowns in this category include Zinus (20.2%), Comfee (10.8%), Sauder (9.9%), and Best Choice Products (8.7%).

    In terms of Share of Search, Rockland in Luggage gained the highest (21%), followed by Farberware in Dishwasher, Olee Sleep in Mattresses, and Homeguave in Mattresses gained significant ground in their respective categories as shown in the image below.

    Brands like Best Choice Products in Coffee Tables, Molblly in Mattresses, and Black+Decker in Washer/Dryers and Dishwashers lost a good portion of their Share of Search during the event. Due to high competition for visibility during sale events, brands that fail to keep an eye on their Share of Search stand to take a hit in their sales, especially in categories like Home & Furniture that tend to have low brand loyalty.

    Consumer Electronics

    2023 was the year of consumer electronics on Amazon Prime Day. Amazon’s price reduction during the sale averaged 10.4% across 54.5% of its assortment in the category. Target and Walmart, on the other hand, offered significantly lower additional discounts of 1.9% and 2.7% on 10.4% and 19.1% of their assortment, respectively.

    The consumer electronics category often witnesses aggressive price reductions during Prime Day and other sale events due to its popularity and high demand. In addition, since retailer margins are usually low in this category, shoppers often have to wait for sale events like Prime Day (when brands markdown their wholesale rates) to have several attractive deals to choose from.

    Across all the subcategories we analyzed, Smartwatches (15.4%), Wireless Headphones (15.4%), Earbuds (14.9%), Headphones (12.5%), and Tablets (12.0%), were among the ones with the highest price reductions. All of these subcategories are quite popular that tend to sell in large volumes during sale events.

    Meanwhile, Laptops (2.1%), TVs (3.1%), and Smartphones (7.6%) had lower markdowns. A lower markdown on smartphones may reflect steady demand throughout the year, reducing the urgency to offer significant discounts during the short Prime Day window.

    Amazon (22%), Tozo (12.5%), Lenovo (10.8%), JBL (8.3%), and Apple (5%) offered the highest price reductions in Consumer Electronics as a whole. Clearly, Amazon didn’t hold back on offering attractive deals on its own private label products in this category.

    Consumer Electronics as a category tends to have a brand loyal shopper base. However, Share of Search generic search keywords are still very important for keywords like earbuds, headphones, and tablets that result in relatively lower priced products. HP in Laptops, Samsung in Tablets and TVs, and Oneplus in Smartphones all made strong strides in building their discoverability on Amazon during Prime Day. Beyond just driving more sales, this also has the intended effect of boosting brand awareness among high-intent shoppers.

    Sony in Headphones, Asus in Laptops, and Insignia in TVs lost out to other brands in terms of their discoverability during the sale. Sony and Asus, especially would be hurting as they are prominent brands in their respective categories.

    Health & Beauty

    The Health & Beauty category is a favorite among consumers during Prime Day, as it encompasses a wide range of products like skincare, cosmetics, and grooming items. As shoppers often tend to stock up during the sale, brands and retailers are willing to offer competitive discounts and gain an edge over their competitors.

    Our data reveals that the average additional discount on Amazon was 6.7%, offered on a little over a third of its assortment. Walmart reduced its prices sizably as well, by an average of 3.1% on 13.4% of its assortment.

    Interestingly, Sephora and Ulta Beauty, leading retailers in the Health & Beauty category did not compete on price at all this Prime Day. It is likely they are confident their loyal customer base will not be influenced by Amazon’s Prime Day deals and be driven away merely by lower prices. In addition, keeping their prices steady during Prime Day might have been a strategic choice to protect their brand reputation and premium positioning.

    Relatively premium subcategories like Electric Toothbrushes (10%), Moisturizer (8.3%), Beardcare (7.3%), and Make Up (6.7%) saw the highest price reductions on Amazon.

    In contrast, staple items like Toothpaste (3.7%), Shampoos (5.4%), and Conditioners (5.7%) had lower markdowns.

    Among the leading brands in this category, Oral-B (10.3%), Philips Sonicare (8.7%), Neutrogena (8.4%), and Colgate (5.6%) offered the most attractive deals during the sale event.

    In terms of significant gains in Share of Search for brands, Oral-B in Electric Toothbrushes led the pack again. Neutrogena in Sunscreens and Somall in Toothpastes also gained more than 10% in their Share of Search during the sale event, followed by Tresemme in Shampoos and Airspun in Make-Up products.

    Other popular brands like Crest in Toothpastes, e.l.f in Make-Up, Philips Sonicare in Electric Toothbrushes, and Sheamoisture in Beradcare surprisingly had reduced visibility among the top search results for relevant subcategories.

    Staying Ahead of the Curve During Sale Events

    This Prime Day, Amazon leveraged its scale to offer aggressive discounts across key product categories, while several competing retailers chose to sit back and let the sale play out. Others chose a selective discounting strategy that focused their modest price reductions on a small set of items.

    At DataWeave, we understand the pivotal role competitive pricing insights play in empowering retailers and brands to gain a competitive edge, especially during crucial events like Prime Day. For retailers, the ability to track competitor prices accurately, at scale, in a timely manner is essential to plotting and acting on impactful pricing strategies and staying ahead of the curve.

    To learn more about how this can be done, reach out to us today!

  • It’s not easy being a Bakery Brand: Insights from Digital Shelf

    It’s not easy being a Bakery Brand: Insights from Digital Shelf

    By 2028, Fortune Business Insights projects that the global bakery products market will reach USD 590 billion. The CAGR (Compounded annual growth rate) for 2021-28 is estimated at 5.12%. Products in this segment include bread, buns, cookies, tortillas, salted snacks, English muffins, bagels, confectionery food, hot dogs, cakes, popcorn, and so on.

    Due to disruptions in the global supply chain caused by lockdowns and border closures, the pandemic has had a negative impact on the demand for bakery products and snacks worldwide. However, the market is not only changing, but consumer demand is increasing. Post-pandemic, health, food, and safety have gained renewed attention.

    People across the world are making healthier choices with a focus on wellness. 

    A growing number of people are interested in plant-based foods and beverages, reducing sugar consumption, and understanding the link between lifestyle and health, including obesity and diabetes. As a result of these trends, food producers are reshaping their product strategies to meet new consumer demands.

    In this article, we take a look at the ways companies can leverage data to inform their e-commerce strategy.

    What’s driving up the demand for bakery products?

    More people are choosing easy-to-use bakery products and snacks over other foods due to urbanization, convenience, western diets, and women’s participation in the workforce. Additionally, innovations in baking systems, food technologies, ingredients, formulations, and product ideas are providing customers with a greater level of choice, flexibility, and freedom.

    How is e-commerce changing the game for bakery product companies?

    To optimize their supply chains, bakery food and snack companies must better understand e-commerce metrics given the wide variety of products available and eventually convert sales. There are several measures that companies need to pay attention to. 

    Stock availability metrics, discounts across locations, and share of search results – are all critical metrics companies need to track. In addition to providing manufacturers and retailers with an insight into the trends, DataWeave’s tools also allow them to make better business decisions and ultimately improve their bottom line. 

    Grocery Retailers and Bakery Brands tracked

    Methodology

    • Data Scrape period: February 2022 to September 2022
    • Country: Canada
    • Grocery Retailers tracked: Atlantic Superstore, Fortinos, InstaCart, Loblaws, Voila, Walmart Grocery, Zehrs.
    • Bakery brands: Betty Crocker, Dempsters, Hostess, No Name, Presidents Choice, Quaker, Vachon, Doritos.
    • Category tracked: Bread and Bakery, Chips, Crackers, Deserts, Snacks.

    Share of Search Analysis

    Which brands feature the most on e-commerce portals?

    When listing items on e-commerce platforms, share of search is crucial. The highest share of the top ten or top twenty items available on these platforms is correlated with how many times the item may be viewed. As a result, it would have a greater chance of being selected by the customer.

    By Retailer for Category “Desserts”

    Share of Search for Brands in each retailer
    • In Walmart Grocery, Vachon has the highest share of search at 41%, whereas Betty Crocker, Presidents Choice and No Name had the lowest share of search at 0%, in the Desserts Category.
    • In Loblaws, Presidents Choice had the highest share of search of 34%, whereas Dempsters had the lowest share of search of 2%  in the Desserts Category. 
    • The brand Presidents Choice consistently ranks high in the share of search results for Desserts across multiple retailers, including Atlantic Superstore, Fortinos, Instacart, Loblaws, and Zehrs – except at two retailers, Voila and Watlmart Grocery, where its share is zero.

    Trend of Share of Search for “Desserts”

    Share of Search analysis by Brands over Time in category “Desserts”
    • Share of search had dropped by around 4% for No Name, whereas for Vachon, it increased by 3% from Jan’-22 to Sep’ 22
    • By brands, Presidents Choice had the highest share of search at 42%, whereas Betty Crocker had the lowest share of search at 12% between Jan’ 22 and Sep’ 22 in the Desserts Category.

    Availability Analysis

    Which products are widely available across e-commerce portals?

    The availability of the product on the e-commerce portal is one of the key indicators of meeting customer demand. Brands can use insights from DataWeave to strategize how to restock their inventory and ease customer demand. Based on data analysis, brands can also determine which products to prioritize on which platforms.

    By Category

    Availability analysis by Category over Time
    • Availability of all five categories was around 52% in Feb’ 22, which steadily increased to 61% until Aug’ 22 and has reduced to reach 55% availability in Sep’ 22
    • Sliced Bread category has seen the most drop in availability by 12% between Jun’ 22 and Sep’ 22
    • The tortilla category has the most rise in availability. It has increased by 16% between Feb-22 and May-22. It also showed an overall rise in availability of 5% from Feb-22 to Sep-22

    By Location

    Availability analysis by Location and Category
    • Across categories, Snacks & Candy had better availability at 73% than Bread & Bakery, with 56% availability.
    • By Location, New Brunswick had more than 65% availability across all three categories; the closest Location is Nova Scotia, with 63% availability.
    • Alberta had the highest availability of 100% in the Snacks & Candy category and the lowest availability of 21% overall in all three categories (weighted aggregate)

    Discounts Analysis

    Several discount-based insights can be studied on e-commerce platforms. From location-based trends, retailer-based trends, and manufacturer-based insights. These insights can help companies make the most of the revenue opportunity while creating an attractive value proposition for the retail consumer.

    By Category

    Discount analysis by Category
    • Discounts of all three categories were around 24% in Feb’ 22, which steadily reduced to reach 15% in Sep’ 22
    • Snacks, cookies & chips category has contributed the most to the drop in discounting, which dropped by 17% between Apr’ 22 and Sep’ 22
    • The Tortilla Category does not have any discount in the month of Jul’ 22

    By Retailer

    • Discount on Bread & Bakery category in Walmart Grocery was around 9% in Feb’ 22. It steadily increased to 13% by Jun’ 22 and thereon reduced to reach 11% availability in Sep’ 22.

    By Location

    • Across Retailers, Nova Scotia had the highest availability of discounts at 22%, whereas New Brunswick had the lowest with discounts at 9% in Bread & Bakery category.
    Discount analysis by Retailers and Locations – Alberta, Ontario, New Brunswick, Nova Scotia
    Note: Analysis does not cover all locations

    Bakery and snack product manufacturers on e-commerce platforms have access to a rich trove of insights they can leverage to benchmark their strategies. They can better understand customer demands, align their supply chain and critically understand the trends impacting their bottom line. Engaging with a third-party platform like DataWeave’s Digital Shelf Analytics  can help brands unlock tremendous value. 

  • The Rapid Rise of Alcohol eCommerce in the UK

    The Rapid Rise of Alcohol eCommerce in the UK

    Alcohol eCommerce has been rapidly growing over the years, and like a lot of other industries, the pandemic accelerated its growth. Convenience, safety & home delivery became important criteria for customers in the post pandemic era and so the sale of alcohol via eCommerce went up. Kantar reported that UK booze sales were up £261m & online and convenience stores were the biggest winners. The latest IWSR Drinks Market Analysis Report 2022 reported on another interesting trend – when ordering alcohol online, consumers prefer using websites v/s apps in most parts of the world except China and Brazil. In the UK the largest chunk of online alcohol purchases happens on a retailer website instead of an app. 

    Platform used for last online alcohol purchase. Source

    To get a better understanding of this, we tracked 2 grocery retailers and 3 grocery Q-Commerce apps in the UK to get insights into Alcohol sales, pricing, trends & more! 

    Methodology

    • Data Scrape time period: Feb 2022 – June 2022
    • Grocery Retailers tracked: Tesco & Ocado
    • Grocery Apps trackedGorillasWeezy & Getir
    • Category tracked: Alcohol

    Which retailer was the Price Leader in the alcohol category? 

    Before the pandemic Tesco was the only Big 4 retailer to increase their alcohol market share & Waitrose was the biggest loser, with its share of booze sales falling from 5.4% to 4.7%. Maintaining Price Leadership is a critical element and plays a big role in increasing sales & market share because consumers will buy the most competitively priced product. We wanted to track and see which retailer was the Price Leader in the alcohol category – i.e., had the most number of lower-priced items in the alcohol category. We also wanted to see if & how Tesco’s position had changed post pandemic. 

    Price Leadership
    • Tesco enjoyed price leadership in the Alcohol category from Feb – June 2022 with 38.9% products priced the lowest. This, followed by Ocado at 33.8%. Gorillas had price leadership for the least amount of products in the alcohol category at 5.6%. Tesco was the clear winner! 
    • Tesco’s Price Leadership kept declining through the months though – at the beginning of the year in Feb, Tesco had 44% products priced the lowest but by June, that number fell to a little over 36%. Ocado showed a reverse trend – in Feb they had price leadership on 32% items and by June that number rose to 35.3%.
    • One player Tesco could’ve potentially lost price leadership to was Getir. In Feb, Getir had price leadership on only 8.2% products but that increased gradually over the months to land on 14.5% in June. 

    Which retailers focused on Discounts to perk up alcohol sales? 

    Discounts are a great way to draw in inflation-hit shoppers. Loyalty card discounts, reward vouchers, and other promotional strategies retailers offer help make their products more competitive & attractive to customers. To stay competitive, retailers need to be aware of the discounts their competition is offering. They also need to understand the risk of deep discounting and the impact on margins. We wanted an insight into alcohol related discounts in the UK so we dug into our data. Here’s what we saw. 

    Average discounts across months by retailers
    • A host of European and UK based startups like Jiffy, Dija, Weezy, Zapp, Getir & Gorillas launched with the promise of delivering groceries the fastest & cheapest
    • Our data showed that Gorillas offered discounts in line with the competition, however, Getir likely went the deep discounting route. 
    • Getir offered the highest discounts across all months. And in the month of April they offered almost 9% more discount than Ocado – the retailer with the 2nd highest discounts. 
      Like we discussed above, Getir gained price Leadership from Feb to June. Deep discounting could have potentially played a role. 
    • Gorillas on the other hand had the lowest, almost non-existent discounts.

    Let’s look at Price Index trends across 5 months 

    We tracked the Price Index (PI) across these 5 retailers to measure how alcohol prices changed over a 5 month period from Feb – June 2022. 

    Note: Retailers selling at the 100% mark were selling at an optimal price & did not undercut the market. The pricing sweet spot is 95% – 105%. Anything lower would compromise margins, and higher would mean the retailer was not competitive. 

    Price Index across months by retailers
    • Weezy had a Price Index that was the most optimal, sitting in the 100% – 102% range.
    • Gorillas had the lowest Price Index, between 89% – 91%.
    • Getir had a low price index in Feb (96.1%) but slowly kept increasing to cross 110% in April, May & June.
    • What was interesting to see was the competition between the 2 retail giants Ocado & Tesco. Ocado had a lower price index at the start of the year at 105.1%, while Tesco was at 109.8%. In the subsequent months, Ocado kept increasing prices to be competitive with Tesco and Tesco decreased prices to likely match Ocado’s pricing. By June BOTH Tesco & Ocado had the exactly the same price index – 108.7%

    Which retailers were the quickest to make price changes?

    Competitive pricing is critical to eCommerce success. Competitive pricing involves tracking your competitor’s pricing & strategically tweaking your own prices without hurting margins. We tracked the month-wise average Price change from Feb – June across all 5 retailers to see which retailer was making price changes and at what frequency. 

    Average price change across months by retailers
    • Most retailers did not make massive prices changes, they were ballpark competitive with each other from a pricing standpoint. 
    • However, Gorillas made significant changes in the month of March when they dropped prices by 3.8% and in May when they increased prices by 5.5%!
    • In May, the same month Gorillas made a big price hike, Weezy dropped their prices significantly by 10% widening the gap between the 2 retailers. 

    Which retailers avoided lost sales by maintaining stock availability?

    Having a near real time view on stock availability is crucial to driving sales. Customers can buy products only when they’re available! So, we went ahead, looked into our data to see how each of these retailers managed stock availability from Feb to June.

    Average availability across months by retailers
    • Our data showed varying availability levels across retailers with Ocado having the highest availability across all 5 months. They had a robust stock at the beginning of the year at 100% but kept dwindling through the months to land at 95.8% by June. 
    • Tesco had a sharp drop in availability in May & June – from 97% at the beginning of the year to the 92-93% range.
    • Gorillas had the lowest availability across months between 90 & 94%.
    • Weezy consistently maintained availability at 95% across all 5 months.

    Conclusion

    For the most part, the UK market has a positive outlook towards buying alcohol online thanks to changes to shopper behavior arising from the pandemic. As per the IWSR Drinks Market Analysis Report 2022 in website-led markets, such as the UK, breadth of product range is important to customers along with price. These 2 play a key factor in purchase decisions. By contrast, consumers in app-driven markets have different preferences. While price matters, it is less important than convenience and speed. 

    As an alcohol retailer, if you need help tracking your competitor prices, discounts and product assortment, reach out to the team at DataWeave to learn how we can help!

  • 5 Ways DataWeave Helps Brands Drive Growth With Amazon Ads

    5 Ways DataWeave Helps Brands Drive Growth With Amazon Ads

    Consumers are discovering and trialing new eCommerce marketplaces, brands and products at a faster rate than ever before, given the vast amount of choices encountered browsing for products online. A recent analysis shows how events like Amazon Prime Day, Black Friday, and Cyber Monday are especially fruitful for new-to-brand customer advertising, encouraging B2C marketers to increase their digital advertising spend to fuel product discovery, sales and market share for their brands.

    Amazon advertisers grow market share and brand loyalty with ecommerce intelligence
    DataWeave joins Amazon Advertising partner network

    The majority of eCommerce consumers are discovering products via relevant keywords attributable to their needs, with most clicks happening on page one results for the first few products listed. Simplifying the digital shopping experience is critical for brands to be in the consideration set for the majority of consumers who won’t venture past page one results. 

    An internal analysis conducted shows getting a product to page one on retailer websites can improve sales by as much as 50 percent, but figuring out the right levers to pull to get there organically—without paid advertising—is a real challenge, especially given fast-changing algorithms. While more than half of all retail related online browsing sessions are “organic”, sometimes brands need to boost their product visibility by investing in sponsored (paid) opportunities to improve a product’s rank.

    Data analytics can equip brands with intelligence to help them decide when, where, and how to make digital advertising investments profitably, while simultaneously acting on insights that help drive organic growth. Considering a majority of U.S. consumers begin their product discovery on marketplaces like Amazon, it makes sense for brands to prioritize digital advertising opportunities with Amazon.

    Maximize Return on Ad Spend (ROAS) with Amazon Ads

    Brands use Amazon Ads to drive brand awareness, acquire new customers, drive sales and gain market share, with the goal of furthering their marketing return on investment. Top performing advertisers average 40 percent greater year-on-year (YoY) sales growth, 50 percent greater YoY growth in customer product page viewership on Amazon, and 30 percent higher returns on ad spend (ROAS) with Amazon Ads, according to a recent analysis. Sponsored Products, Sponsored Brands, Amazon DSP and Sponsored Display are among the types of Amazon Ads options cited that produce maximum return.

    Ensuring your product listings appear at the top of page one results on Amazon for the most relevant discovery keywords is therefore the most important determinant for maximizing ROAS. DataWeave has become a vetted partner and measurement provider in the Amazon Advertising Partner Network, with the goal of supporting brands to optimize digital advertising campaigns by providing visibility to Digital Shelf Analytics (DSA) key performance indicators (KPIs), like Share of Search, Pricing and Product Availability, Content Audits, Ratings and Reviews, and Sales Performance and Market Share.

    Below is a summary of how our Digital Shelf solutions, in partnership with Amazon Ads, can improve the performance of your Amazon Ads campaigns

    1. Keyword Recommendations Improve Share of Search

    With the DataWeave Share of Search solution, brands can monitor their placement of both organic and paid discovery keywords relative to their competition. Once your keywords are determined, you are also provided a weighted Share of Search score that helps measure how well each keyword performs relative to product discoverability. Below is an example of insights you’d gain.

    Share of Keyword Search

    Brands can provide their own list of keywords to monitor, or through our Amazon Ads collaborative solution, learn which keywords are the “best” for them to measure in the realm of Amazon. Performance results are based on data that shows which keywords consumers are actually using when browsing online alongside other keywords brands request to measure. Users are able to see exactly which keywords are most popular, competitive (and even unexpected), and relevant at an Amazon Standard Identification Number (ASIN) level of granularity. 

    We can also estimate the degree of relevance and estimated traffic for the recommended keywords. Brands can then use these insights to adjust campaign strategies based on these parameters, which can boost product discoverability and rank visibility. A brand could assume people find its products by brand name, yet traffic insights may reveal a majority of people look for a generic product type before they end up buying that particular brand. 

    2. Content Audits Increase Discovery Relevancy Scores

    Strong product content is critical to succeeding on Amazon. Thorough, accurate, and descriptive content leads to better click through rates (CTR), conversion rates, more positive reviews, and fewer returns, which results in increased discoverability. DataWeave’s Content Audit solution reviews existing copy and images on a per-attribute basis to highlight any gaps essential to improving visibility, as seen in the example below.

    Content Analysis

    To further growth, it is equally as important that your product content aligns with your advertising strategy. With Amazon Ads partner add-on, our solution can also audit your content to measure how effectively you are incorporating Amazon Ads keywords into your product content to enhance discovery relevancy.

    3. Discover More Opportunities with Pricing and Product Availability Insights

    Quality content and keyword updates will only get you so far if your products are not consistently available and priced competitively. With DataWeave’s Pricing and Promotions and Product Availability modules, advertisers can monitor their selling prices and availability trends alongside their competitors to uncover more opportunities to incorporate into advertising campaigns, as seen in the Pricing and Promotions dashboard example below.

    Promotion Analysis

    Additionally, product targeting recommendations can be utilized to target a competitor’s ASIN that may be overpriced or that is having issues staying in stock. Alternatively, broaden your strategy to target specific brands, complementary products, or category listing pages.

    You can also create alerts on your own products to monitor when items are low on inventory or out of stock to ensure key products are consistently available when customers are shopping.

    4. Leverage Ratings and Reviews to Increase Conversion

    Product ratings and reviews are also a critical component to running a successful Amazon Ads campaign. A large number of reviews and a positive star rating will provide customers with the confidence to purchase, resulting in higher conversion rates. Conversely, negative feedback can have a detrimental impact, resulting in lost sales and wasted ad spend. DataWeave’s Ratings and Reviews module can help you monitor your reviews and extract attribute-level insights on your products. This information can then be utilized to further optimize your advertising strategy.

    If you see consistent feedback in your reviews on aspects of a product not meeting customer expectations, address them in your product content to prevent potential misplaced expectations. Alternatively, if customer reviews are raving about certain product features, ensure these are promoted and relevant keywords are populated throughout your descriptions and feature bullets. Below is an example of insights seen within the DSA Ratings & Reviews dashboard.

    Ratings and Reviews

    5. Correlate Digital Shelf KPIs to Sales Performance and Market Share

    The newest DSA module, Sales Performance and Market Share, provides SKU, sub-category, and brand-level sales and market share estimates on Amazon for brands and their competitors, via customer defined taxonomies, to easily benchmark performance results.

    This data can also be correlated with other Digital Shelf KPIs, like Content Audit and Product Availability, giving brands an easy way to check the effect of attribute changes and how they impact sales and market share. Similarly, brands can see how search rank, both organic and sponsored, affects sales and market share estimates.

    Understanding the correlation between your advertising campaigns and your Digital Shelf brand visibility will help you identify which areas to prioritize to drive sales and win more market share.

    Digital Shelf Insights Help Brands Win with Amazon Ads

    The need for access to flexible, actionable eCommerce insights is growing exponentially as a way to help brands drive growth, increase their Share of Voice, and to gain a competitive edge. As a result, more global brands are seeking Digital Shelf Analytics for access to near real-time marketplace changes and to develop data-driven growth strategies that leverage pricing, merchandising, and competitive insights at scale.

    By monitoring, measuring and analyzing key performance indicators (KPIs) like Sales Performance and Market Share, Share of Search, Content Audits, Product Availability, Pricing and Promotions and Ratings and Reviews alongside competitors, brands will know what actions to take to boost brand visibility, customer satisfaction, and online sales. 

    DataWeave’s acceptance into the Amazon Advertising Partner Network enables Amazon advertisers to effectively build their Amazon growth strategies and determine systems that enable faster and smarter advertising and marketing decision-making to optimize product discoverability and overall results.

    Connect with us now to learn how we can scale with your brand’s analytical needs, or for access to more details regarding our Amazon Ads Partnership or Digital Shelf solutions.

    UPDATED: Read the full press release here

  • Prime Day India 2022 – highlights from the 2 day annual shopping festival!

    Prime Day India 2022 – highlights from the 2 day annual shopping festival!

    Amazon India’s much-awaited annual two-day shopping event, Prime Day, kicked off with a bang on July 23rd & 24th this year & was one of the most successful Prime Day events yet! Amazon reported that more than 32,000 sellers saw their highest ever sales day during the event. Interestingly 70% of these sellers who received orders during Prime Day were based in Tier 2 cities in India, further validating how the post-pandemic eCommerce boom has spread across the country. Also, Indian exporters saw 50% business growth on Amazon on Prime Day as customers across markets like North America, Europe, Australia, and Japan continued to purchase Made In India products.
    It was a great 2 days for Indian sellers, but what about customers who were waiting in anticipation for the great deals typically offered on Prime Day? We dug into our data to take a look at the deals, discounts, and brands that shone bright on Prime Day in India.

    Methodology

    • In addition to Amazon IN, we also tracked Flipkart on 23 & 24th July 2022, on Prime Day.
    • Categories tracked – Electronics, Grocery, Fashion & Beauty.
    • We looked at Additional Discounts offered on Prime Day: Additional Discount is the extra discount on an item during Prime Day when compared to the Pre-Prime Day price. 
    • We also looked at Post Prime Day Discounts, which were the discounts offered after the 2-day event ended.

    Amazon v/s Flipkart – who offered better discounts?

    Prime Day discounts are legendary. And across the globe, during Prime Day retailers try and compete to see if they can offer better deals than Amazon. Forbes even published an article on the 36 Prime Day competitor sales that were way more enticing than what Amazon had to offer. In India, we wanted to see if Amazon’s homegrown rival Flipkart might give it a tough fight, so we tracked the volume of discounts across categories on both retailers. 

    Discounts on Amazon & Flipkart across categories
    Discounts on Amazon & Flipkart across categories
    • Out of the 4 categories we tracked, in spite of Prime Day, Amazon offered discounts higher than Flipkart in only 2 categories – Electronics & Beauty. 
    • … while Flipkart offered higher discounts than Amazon in the Grocery & Fashion category. For groceries, Flipkart offered a 3.2% additional discount v/s 2.2% on Amazon. However, in the Fashion category, the difference was marginal – 8.1% on Amazon v/s 8.6% on Flipkart
    • Post-event, both Amazon & Flipkart went back to the original pre-event prices. This made it clear that Flipkart was tracking and making price changes based on their closest competitor. It’s what smart eCommerce businesses do to stay ahead in the race. 
    • Interestingly, post-event, in the fashion category, not only did Amazon revert to the original pre-event price, they even increased prices by close to 2%.

    Let’s take a look at discounts across 4 categories & the Brands that WON in each category.

    From Electronics to Fashion, Beauty & Groceries, let’s deep dive into the data to see which products were highly discounted within each category and brands that sprinted ahead to win the race on Amazon on Prime Day 2022.

    ELECTRONICS

    Tech publication Gadgets360 reported on the biggest Smartphone deals right from Brands like Samsung, Redmi, Oppo, and more. There were some fab deals on earphones too with Boat taking the lead. We wanted to take a look at electronics on Amazon and see which products had the heaviest discounts & if discounts were more lucrative than Prime Day 2021

    Discounts on Electronics on Prime Day
    Discounts on Electronics on Prime Day
    • Amazon India released highlights from Prime Day and reported that Smartphones & Electronics were among the categories that saw the most success in terms of units sold.
    • From the 6 product categories we tracked within electronics, we saw the highest additional discounts on Smartwatches (13.4%), followed by Bluetooth headphones (10.5%)
    • TV, Smartphones, cameras, and laptops had an additional discount of between 3 – 5.5%

    ELECTRONICS Brands that had the highest Share of Search on Amazon during Prime Day

    Research shows that on Amazon, the first 3 products garner 64% of business generated. This is why it is critical for brands to appear in the top few listings when consumers are searching for products. Being on top helps shoppers find your brand with ease & increases the chances of a sale. 

    On Prime Day 2022, Amazon India reported that the top-selling consumer electronics brands were HP, Lenovo, Asus, and Boat to name a few. Our assumption is, these brands must’ve had a high Share of Search (SoS), which played a massive role in increasing sales, so we looked into our data to see which brands had the highest SoS against specific keywords related to electronics. 

    Brand Visibility against the Keywords
    Brand Visibility against the Keywords
    • Our data aligned with what Amazon reported. HP had high sales, perhaps because they occupied the premium #1 spot in the laptop category with a 44% SoS! Simply put, this means of the 100 laptops that appeared on a page, against a search for the keyword laptop, 44 products were listed by HP! Consumers always gravitate towards buying products they can find with ease
    • Lenovo had a 32% SoS for Laptops. Asus at 14% 
    • The top selling smartphone brands reported by Amazon included OnePlus, Redmi, Samsung, Realme & iQOO – our data showed that 3 out of these 5 brands were in the top 5 listings on Prime Day! Redmi had a whopping 30% SoS against the keyword smartphone, Samsung at 15%, and iQOO at 5% – clear validation that a high SoS can positively impact sales.

    BEAUTY & GROOMING

    Now let’s look at discounts in the beauty & grooming category. 

    Discounts on Beauty Products on Prime Day
    Discounts on Beauty Products on Prime Day
    • The highest additional discounts were given on shampoos (9.3%), followed by Lipsticks (6.6%)
    • Shaving kits for men were at an additional discount of 3.4%. Hair gel at 4.9% & Face Masks at 4.3%

    BEAUTY Brands that had the highest Share of Search on Amazon during Prime Day

    Brand Visibility against the Keywords
    Brand Visibility against the Keywords

    In the beauty category, Amazon India reported that top-selling brands included Head & Shoulders, Dove, Biotique, L’Oreal, Sugar Cosmetics, and Mamaearth to name a few. Once again, we looked into our data to see the sort of brand visibility & SoS each of these brands had.

    • All the top-selling brand’s Amazon reported on we noticed appeared in the top 5 search results. 
    • Head & Shoulders & Dove were the top 2 listings against the keyword Shampoo at 26% & 16% SoS respectively. Biotique came in at #5 with a 7% SoS
    • Bombay Shaving Company, Gillette, and Axe were the top grooming brands for men in the Shaving Kit category. 
    • Lakme made a clean sweep with a 19% SoS against the keyword lipstick, which speaks volumes, considering the aggressive competition from D2C beauty brands in India today.

    GROCERY

    According to the New eCommerce in India report by consulting firm Redseer, grocery has been a major contributor to the growth of ecommerce in India & Amazon Fresh used Prime Day to grab a larger piece of that pie! As part of the Prime Day sale, Amazon Fresh also pushed discounts on groceries, as well as fruits and vegetables. We tracked products that fell into the “snack” category, and here’s what we saw.

    Discounts on Snacks on Prime Day
    Discounts on Snacks on Prime Day
    • Given changing lifestyles & healthy food fads, it was no surprise that we saw the highest additional discounts were given on Healthy Snacks (3.2%) & Diet Food (2.7%)
    • Chocolates and chips saw much lower additional discounts at 1.2% each.
    • Drinks were additionally discounted by 2.5% during Prime Day.

    SNACK Brands that had the highest Share of Search on Amazon during Prime Day

    Brand Visibility against the Keywords
    Brand Visibility against the Keywords
    • Cadbury had a 69% share of search against the keyword Chocolate, leaving some of its key competitors way behind. Amul had a 20% SoS, while Hershey’s was at just 4%. 
    • According to an article in the Economic times, YogaBar tripled sales in FY22, which is why we were not surprised to see the brand at #1 when users were searching for “Healthy Snacks” during Prime Day. YogaBar products typically enjoy high visibility year-round, which clearly helped with brand awareness on Amazon & sales.

    FASHION

    Amazon reported that Men’s t-shirts and polos, denims, Kurtis, tops, and dresses for women, designer wear, and clothing for kids were some of the most-loved fashion categories on Prime Day. We looked into our data to see the trends that emerged.

    Discounts on Fashion on Prime Day
    Discounts on Fashion on Prime Day
    • From the categories we tracked, women’s handbags had the highest additional discount (11.8%), followed by watches (9.1%)
    • Sneakers & jeans had additional discounts in the ballpark of 7% and sunglasses at 4.4%

    FASHION Brands that had the highest Share of Search on Amazon during Prime Day

    Brand Visibility against the Keywords
    Brand Visibility against the Keywords
    • Some of the usual suspects made it to the top 5, but what really stood out for us were brands that popped up against the keyword Jeans. While Levi’s came in at #2 with an 11% SoS, 2 Private Label Amazon brands featured in the top 5! Symbol at 27% SoS and Inkast Denim at 9%
    • Against the keyword Handbag, Lavie had a massive lead at 38% v/s the #2 brand – Caprese, at 13%
    • Boat found a #2 spot against the keyword watches, racing way ahead of the age-old popular brand Fastrack at #5 with a 4% SoS.

    Conclusion

    Amazon Prime Day 2022 in India came to a successful close as shoppers across India discovered the joy of the 2 day celebration with the best deals, savings, new launches, and more. Prime members from 95% of pin codes in India made purchases, there were 1000’s of deals and 500+ new product launches from brand partners & sellers. Nearly 18% more sellers grossed sales over INR 1 crore, and close to 38% more sellers grossed sales of over 1 lakh vs Prime Day 2021. Local neighborhood shops that sell on Amazon witnessed 4x sales growth. And start-ups and brands under the Amazon Launchpad program witnessed a growth of 3x. All in all, a successful event for everyone involved! 

  • Prime Day Germany 2022 – highlights from the 2 day annual shopping festival!

    Prime Day Germany 2022 – highlights from the 2 day annual shopping festival!

    In 2022, Amazon sold 300 million products during Prime Day – selling roughly 100,000 items per minute. Since Amazon started Prime Day in 2015 to celebrate its 20th birthday, the shopping festival has grown into a holiday and rivals Black Friday and Cyber Monday in the U.S. and Singles’ Day in China. 

    According to RetailDetail, the leading B2B retail community in Benelux, Amazon is planning a 2nd Prime Day shopping festival in the autumn, just a few months after its annual Prime Day event. The retailer has asked its sales partners to prepare for a promotional event in the autumn where they have until the beginning of September to propose attractive discounts, with at least 20% discounts. This year’s second Prime Day may occur in October, with or without the same name. 

    But before that, let’s examine what happened in Germany this year on Prime Day 2022.

    Methodology

    • We tracked Amazon.de both before & on 12 & 13th July 2022, on Prime Day.
    • Categories Tracked – Electronics, Wine & Spirits, Grocery, Furniture, Fashion, and Beauty. 
    • We looked at Additional Discounts offered on Prime Day: Additional Discount is the extra discount on an item during Prime Day when compared to the Pre-Prime day price.
    • We also looked at Post Prime Day Discounts, which were the discounts offered after the 2-day event ended.

    What kind of Discounts did Amazon.de offer?

    Amazon Prime Day will be significant, especially for customers hoping to get discounts amid soaring inflation. Both Amazon as well as other sources reported that electrical and electronic items were the most popular purchases, followed by general retail products. Electrical and electronics saw the value of transactions soar 90% on the first day. Mobile phones and accessories were the most popular, with transaction values almost doubling to 96% on day one.

    Discounts across Categories on Amazon.de
    Discounts across Categories on Amazon.de
    • Based on trends from past events, Amazon likely knew electronic items were going to be best sellers. Keeping this in mind, they made sure to offer high discounts in the electronics category. They offered a 6.5% additional discount on electronics on Prime Day. And once the sale ended, they continued to discount electronics by 1.3%.
    • The Fashion category also had a fair bit of discounts and came in at a close second at 5.9%
    • Looks like Amazon discounted everyday use items minimally. Groceries had an additional discount of just 1.8% on Prime Day, and wine and spirits had 2% extra discount.  
    Discounts on Electronics Category on Amazon.de
    Discounts on Electronics Category on Amazon.de
    • Within Electronics, in the four categories we tracked, we saw the highest additional discounts were offered on Bluetooth earphones (10.6%) and Smartwatches (9%)
    Discounts on Fashion Category on Amazon.de
    Discounts on Fashion Category on Amazon.de
    • Jeans and Sunglasses had the highest discounts at 8.6% & 7.6% respectively.
    • Sneakers & Watches too had additional discounts of 6.6% on Prime Day.
    • Post the Prime Day event, Amazon retained an average of 1.5% discount across all products in the fashion category instead of pricing them at the original price. 
    • However, in the case of women’s T-Shirts, they increased the price by 1.7% from the pre-event price.

    Discounts across Price Tiers

    Retailers must consider several factors when making strategic discounting decisions, including customer buying behavior, the type of discount offered & the volume of discount offered. The best discounting approach will vary depending on the product and other factors like the original selling price of the product.

    Now let’s compare the discounting strategy Amazon used in the Electronics v/s Fashion category on Prime Day.

    Discounts across Price Ranges
    Discounts across Price Ranges
    • Interestingly, in both the Electronics and Fashion categories, Amazon increased prices for the lowest-end products between the €0-10 range by 3.6% and 13.2%, respectively, during the sale instead of discounting them! Maybe this was a strategy to drive consumers to higher-value products with greater discounts? 
    • Another similarity in strategy was that most of the mid-priced items had maximum discounts. In electronics & fashion both, the maximum discounts were given to products between the € 30-100 range. 
    • Here’s a difference that stood out – for Electronics in the higher price range between €100 – 500, the volume of discounts dropped a bit which meant Amazon gave moderate discounts on high-end electronics. But the trend flipped for Fashion as luxury fashion items were made to look more attractive with higher discounts.

    Monitoring stock availability during key sales days is critical

    Brands need to have the right stock availability, especially during sale events, because more customers shop online during sales. What’s worse, non-availability of products may drive customers to competitors that are stocking the same product.  Out-of-stock situations lead to missed opportunities & lost sales! Let’s take a look at our data and see how Amazon planned product availability across categories on Prime Day. 

    Availability Analysis across Categories on Prime Day
    Availability Analysis across Categories on Prime Day
    • Amazon was betting big on 2 categories – Electronics & Home. This meant they needed to keep a keen eye on availability in these categories, especially since they forecasted the highest sales to be generated here.
      … it was no surprise that the Furniture category had almost 100% availability during Prime Day! Electronics too had a high availability at 94% during the event.
    • Generally, our data showed that availability across multiple categories we tracked seemed robust and above 80% in more cases. Only Beauty & Grocery had 79% availability.

    Conclusion

    Prime Day sales reached an estimated 12 billion U.S. dollars worldwide, 9.8% higher than last year, making it the most successful shopping event in Amazon’s history. If you’re a brand selling on Amazon or a retailer trying to compete with Amazon, reach out to us at DataWeave to know how we can help!

  • Prime Day UK 2022 – highlights from the 2 day annual shopping festival!

    Prime Day UK 2022 – highlights from the 2 day annual shopping festival!

    Prime Day launched in 2015 as a celebration of the 20th anniversary of Amazon’s founding & has quickly become the biggest shopping event of the year for Amazon. Prime Day is a great opportunity for customers to snag fantastic deals on products they might not otherwise consider buying. Last year, Amazon Prime Day was a tremendous success, with Prime members spending billions of dollars on discounted items. In 2022 alone, global sales during the event reached a new record high of $12 Bn.

    18 countries participated in Prime Day this year, including the US. We did a deep dive into what happened in the UK – the discounts Amazon offered and categories with the highest discounts as well as checked to see if other retailers tweaked their pricing strategy to compete with Amazon on Prime Day.

    Methodology

    • In addition to Amazon UK, we tracked some key retailers on 12 & 13th July 2022, on Prime Day.
      Retailers tracked – eBay UK, OnBuy, Selfridges, ASOS.com, Net-A-Porter 
    • Categories tracked – Electronics, Wine & Spirits, Grocery, Furniture, Fashion, Beauty. 
    • We looked at Additional Discounts offered on Prime Day: Additional Discount is the extra discount on an item during Prime Day when compared to the Pre-Prime day price. 
    • We also looked at Post Prime Day Discounts, which were the discounts offered after the 2-day event ended.

    Did other retailers compete with Amazon on Prime Day?

    Traditionally, as Amazon’s Prime Day sale approaches, other retailers adjust their prices by offering summer deals or getting creative with offers. However, we did not see aggressive strategies from other retailers this year. In the US, Walmart always has a sale during Amazon’s Prime Day. The Wall Street Journal reported that Walmart announced there wouldn’t be an annual promotional event on Prime Day 2022 this year.

    Another report published by Forrester stated that major retailers scaled back their promotions, and overall offers from other retailers were less than impressive. We took a look at the data we gathered in the UK to see if this trend aligned. 

    Discounts offered on Prime Day on Amazon v/s other retailers
    Discounts offered on Prime Day on Amazon v/s other retailers
    • Our data showed that most retailers we tracked offered negligible discounts (in the range of 0.1 – 1.5%) and did not really try and compete or match the discounts Amazon was offering. 
    • However, ASOS was the one retailer that competed heavily with Amazon in the Fashion & Beauty category. While Amazon offered an average additional discount of 7.7% in the Fashion category, ASOS offered 13.2%. And in the beauty category, Amazon offered 6.7%, while ASOS offered 15.2%.
    • When we looked at post-prime day discounts, we saw that as soon as Prime Day ended, ASOS went back to the original price and stopped offering a discount which clearly shows they were keeping an active eye on out their competitors pricing. In fact, ASOS was offering up to 80% off almost everything on the site until Prime Day.

    Which were the popular categories that offered the most discounts?

    During Prime Day, shoppers saw tons of deals on essential gadgets. Tech deals were a massive hit and saw big discounts on everything from TVs, laptops, smartwatches, phones, and tablets. We look at the data we collected to see if we saw a similar trend. 

    Discounts on Amazon UK across categories
    Discounts on Amazon UK across categories
    • Amazon offered discounts across categories and reported that some of the best-selling categories were Consumer Electronics & Home. 
    • Our data too showed that the highest additional discounts were offered in electronics – Bluetooth Earphones at 18.4%, followed by Smartwatches at 14.9% and Laptops as well as Cameras, both at 12%.
    • Low discounts were offered on Alcohol, with Beer at 0.9% and Wine at 1.3%, respectively.
    • Relatively attractive discounts were seen in the Fashion & Beauty category – Sunglasses (9.1%), Shampoo (9.7%), & Watches (9.4%)
    Discounts on Amazon UK in the Electronics category
    Discounts on Amazon UK in the Electronics category

    Electronics being the hot favorite – we wanted to deep dive into the data and get more insights on Amazon’s pricing & discounting strategy here. Discounts can entice customers to buy more, encourage customer loyalty, or clear out old inventory. However, businesses must be careful since too much discounting can eat into profits. They also have to be mindful of which products should be discounted and by how much. 

    • Our data showed that the highest discounts (between 13 – 18%) were given on electronics priced between the £ 20-100 price range.
    • Electronics priced higher, between the £ 100 – 500 pound price range, were discounted less than 10%
    • However, high-value premium electronics over £ 500 were discounted slightly above 10%

    How did Amazon manage stock availability during Prime Day?

    Keeping track of inventory is especially important during big sales like Prime Day when thousands of customers are actively looking for deals.  There’s nothing worse than them finding the item they wanted is out of stock (OOS). OOS leads to lost sales, a situation that must be avoided at all costs. Read about how a small short term stock out on Amazon led to long term negative impacts for one of our customers. And let’s also look at the data and see what product availability looked like on Prime Day.

    • Overall, Amazon maintained robust availability across categories, and re-stocking was constant both before, during & after the event. 
    • Furniture, Fashion & Electronics had the highest availability. No surprise there since Amazon estimated that Home/ Furniture would be one of the best-selling categories.
    • Grocery saw average availability – perhaps cause some of these products are perishables, so it’s best to be mindful about overstocking.

    Which Brands Won on Prime Day?

    If there is one thing to remember about improving your product visibility on Amazon, it’s that it all boils down to the usage of the right keywords. Using relevant keywords makes your product appear higher up in search when customers are running searches on Amazon for those products. And the higher up a product appears in search, the higher the chances of a sale! 

    Let’s take a look at some popular categories and which brands had the highest Share of Search (SoS) during Prime Day.

    • Corona, San Miguel, and Becks were the top 3 brands optimized for the keyword Beer. However, what’s really important to note is both Corona & Becks had 20% SoS that was completely organic. San Miguel had a 20% SoS too, but it was sponsored ads that gave them this artificial boost. 
    • While a whole bunch of other brands had a 10% SoS most of them achieved this via Sponsored Ads. Youngever was the only brand that achieved this completely organically. They must have made sure they optimized key KPIs like content, ratings & reviews & product availability to achieve this result.
    • There were deep discounts on a wide range of Lenovo laptops. For example, the Lenovo IdeaPad duet Chromebook and Lenovo IdeaPad Flex 3 Chromebook were available at £100 off. Our data, too saw Lenovo & Asus fight for the top spot.
    • Asus sponsored 28% of products before Prime Day, hoping to capitalize on the pre-sale frenzy. During the event, they sponsored only 13% of products, bringing down their total SoS from 31% before the event to 13% during the event. 
    • Lenovo followed the opposite strategy; they sponsored just 6% of products before the event and during the event sponsored a whopping 25% which made them “almost” dominate the Laptop category during Prime Day.
    • Then there was Microsoft, with the highest SoS at 38%, of which all of it was organic!
    • The Smartphone SoS battle was clearly between Samsung & Xiaomi. Samsung was a consistent #1 at all 3 time periods (Before, During & After Prime Day) with the highest total SoS. Xiaomi came in at a close second. 
    • Samsung had an exciting strategy – they went heavy on sponsorships before and after the event. Their sponsored SoS was 31% & 39% respectively. And SoS of 13% during the event. 
    • Xiaomi’s strategy was just the opposite. Their sponsored SoS was 16% before the event. And 17% after the event, which was moderate compared to their Sponsored SoS during the event at 25%, which was much higher than Samsung’s 13%
    • Critical to note, Xiaomi’s organic search visibility before, during, and after the event was 0%. It definitely should be a concern area for any brand.
    Share of search
    Share of search
    • Both before & after the event, Cadbury had the highest visibility for the keyword Chocolate. During the event, they were not in the top 5 brands.
    • During Prime Day, Nestle won the top spot and had a 29% SoS. However, before the event, they were at #3 and after at #2. Artificially boosting visibility might’ve had something to do with this.

    Conclusion

    Prime Day sales reached an estimated 12 billion U.S. dollars worldwide, 9.8% higher than last year, making it the most successful shopping event in Amazon’s history. If you’re a brand selling on Amazon or a retailer trying to compete with Amazon, reach out to us at DataWeave to know how we can help!

  • UK Grocery Pricing Wars in 2022! A quick look at Pricing Data we gathered from 5 Grocery retailers in the UK

    UK Grocery Pricing Wars in 2022! A quick look at Pricing Data we gathered from 5 Grocery retailers in the UK

    Grocery sales in the UK are dominated by the “big four” – Tesco, Asda, Sainsbury’s, and Morrisons. A Statista report on these Grocery Giants as of May 2022 indicates that Tesco, Sainsbury’s, and Asda own approximately 27%, 15%, and 13% market share of grocery stores in the UK. Whereas Ocado and Symbols & Independent have the lowest market share, 1.8% each.

    However, the grocery delivery market is seeing a major shift because of new-age Quick Commerce companies that have swooped into the already crowded grocery space offering super-speedy home delivery! These new entrants added to the already competitive Grocery market & price wars intensified. Customers today rely on ultra-fast delivery services for their grocery requirements. For example, Berlin-based Gorillas charges £1.80 to deliver anything from a £7 pizza to a 30p apple — with no minimum order value. 

    Investors funded over £5B in grocery delivery apps such as Getir, Gorillas, Zapp, Fancy, Dija, Weezy, Jiffy, and Beelivery, in the UK. These rapid grocery delivery apps offer shorter delivery times, as low as 10 minutes, along with deep discounts to attract customers. For example, Gorillas, Weezy, and Getir all claim a 10-minute delivery time and offer promotional codes for the first couple of orders. Customers also get discounts for inviting friends and family.  

    To get more insight into the Grocery space in the UK, we tracked 5 Grocery retailers & Q-Commerce companies to try and understand trends wrt pricing in this competitive environment. Let’s take a look at what our data found & which retailer won the competitive pricing tug of war. 

    Methodology

    • Data Scrape time period: January 2022 – June 2022
    • Grocery Retailers tracked: Tesco & Ocado
    • Grocery Apps tracked: Gorillas, Weezy & Getir
    • Categories tracked: Alcohol, Drinks & Beverages, Fresh & Frozen, Grocery, Health & Wellness, Home Care, Packed Food & Snacks, and Smoke shop.

    Grocery Giants v/s Grocery Delivery apps – who was the Price Leader?

    Price leadership by category
    Price leadership by category
    Price leadership across months by Retailer
    Price leadership across months by Retailer

    We wanted to track and see which retailer was the Price Leader – i.e., had the most number of lower-priced items in a particular category. Our data clearly showed that the Grocery Giants Ocado & Tesco won hands down! Interestingly, Ocado launched a new Ad Campaign earlier in Jan this year about bringing value to the table for customers with quality products at affordable prices – seems like they’re taking this new promise very seriously! 

    • Tesco and Ocado were price leaders in maximum categories when compared to Gorillas, Weezy, and Getir. 
    • Between Tesco & Ocado, Ocado enjoyed price leadership across all these categories for 4 out of the 6 months we tracked pricing for. Tesco occupied the top slot for just the balance 2 months. 
    • Tesco was the price leader in the Alcohol category, with close to 40% of products priced the lowest compared to other retailers. They were also price leaders in the Smoke Shop category.
    • Ocado won price leadership for the remaining 6 categories, with a marginal gap between both retailers. 

    Watching Price Index Trends as inflation soars!

    Price index across monthsby Retailer
    Price index across months by Retailer

    The Guardian reports that Grocery inflation has hit a 13-year high in the UK, and food price rises could hit 15% by this summer – the highest level in more than 20 years. Meats, cereals, dairy, fruit & vegetables are likely to be the worst affected. Keeping this in mind, we tracked the Price Index (PI) across these 5 retailers to measure how prices changed over a 6 month period from Jan – June 2022. 

    Note: Retailers selling at the 100% mark were selling at an optimal price & did not undercut the market. The pricing sweet spot is 95% – 105%. Anything lower would compromise margins, and higher would mean the retailer was not competitive. 

    • Getir & Ocado had a Price Index that was the most optimal, sitting in the 95% – 105% range.
    • Gorillas had the lowest Price Index, between 88% – 90%.
    • Weezy has the highest Price Index – they were selling at a minimum 30% – 40% premium over other retailers! Perhaps it’s their quick delivery service that justified these super high prices? Unlike other apps with a lower delivery fee but longer delivery times, Weezy offers a 15-minute delivery service & customers seem to be willing to pay for convenience! Wheezy also has a delivery fee of £2.95, which is at least £1 more than other platforms.
      Supermarkets like Ocado are now playing catch up to compete with Q-Commerce and quick delivery services. Ocado has launched a new “Zoom” service promising delivery in 60 minutes, and Amazon is now delivering “same day” groceries (but both have a minimum spend of £15)

    Which Retailers were the quickest to make price changes?

    Average price change across months by Retailer
    Average price change across months by Retailer

    Competitive pricing is critical to winning the eCommerce race. Competitive pricing involves tracking your competitor’s pricing & strategically tweaking your own prices without hurting margins. We tracked the month-wise average Price change from Jan – June across all 5 retailers to see which retailer was making price changes and at what frequency. 

    • The main observation was – across all 6 months, all retailers were likely tracking each other’s prices and making minor price changes accordingly – the need of the hour in this hyper-competitive environment. 
    • Gorillas made significant changes to prices between Jan & Feb. And Getir in the May/ June time period. 

    Discounts & Promos in a turbulent UK Grocery Market

    Average discount across months by Retailer

    Although customer acquisition starts with building awareness, discounts are a proven way to attract customers quickly. When approached with the right strategy, promotional discounts can promote long-term customer loyalty, drive customer acquisition, and improve customer lifetime value. However, deep discounting can risk margins and create more problems than benefits. We wanted an insight into discounting trends in the Grocery space, so we looked at our data. Here’s what we saw:

    • Getir offered by far the highest discounts compared to Ocado & Gorillas. In fact, in most cases, they offered discounts close to 2-3% higher than the retailer with the 2nd highest discounts! 
    • Our data showed that Gorillas offered the lowest discounts. As reported in The Sun & other sources, newer Q-Commerce players like Gorillas have been showering users with discount codes, and that is why this data surprised us! 

    We went & looked back at the Price Index earlier in this blog, we noticed that Gorillas had a low price index overall, with most products priced at a 90%, way below other retailers. Perhaps this already lower price is why they’re offered very few discounts?

    Conclusion

    The UK grocery delivery market saw a huge rise in new retailers who are currently fighting for better discounts, competitive prices, and quick delivery. Although Tesco and Ocado were the price leaders in our findings, new players like Gorillas, Weezy, and Getir are attracting customers with quicker delivery times and low delivery costs. 

  • The Role of eCommerce in Sustainable Fashion

    The Role of eCommerce in Sustainable Fashion

    Today, environmental damage is rapidly occurring on a global scale. And there are many reasons and causes for this. Global warming is one, deforestation, over population are some others. The list is long. In a small way, the retail & clothing industry contributes to environmental damage too. The good news is that sustainable fashion addresses this issue. Sustainable clothing is designed using sustainable fabrics like organic cotton, hemp, and Pima cotton that have less of a negative impact on the planet. 

    sustainable clothing and its benefits
    Sustainable clothing and its benefits

    In this blog, we will discuss the rise of sustainable clothing and its benefits. We will also discuss marketplaces for sustainable fashion.

    Benefits of Sustainable Fashion

    a. Reduces carbon footprint

    The fashion industry emits numerous greenhouse gases annually. Most clothes are made from fossil fuels and require significantly more energy in production. Sustainable brands often use natural or recycled fabrics that require less chemical treatment, water, and energy. Organic fabrics such as linen, hemp, and organic cotton are biodegradable and environmentally sound.

    b. Saves animal lives

    Leather isn’t a by-product of the meat industry, and it’s estimated that it alone is slaughtering and killing over 430 million animals annually. Sustainable fashion brands are increasingly embracing the use of cruelty-free alternatives. Various alternatives include polyester made with ocean trash, plant-based compostable sneakers, bags from recycled seatbelts, silk created from yeast, and bio-fabricated vegan wool. Another interesting leather alternative comes from pineapples, where the fabric is produced using the leaves of pineapples.

    c. Requires less water

    Water is used in the dyeing and finishing process for nearly all items in the fashion industry. It takes 2,700 liters of water to produce a single T-shirt. Cotton is highly dependent on water but is usually grown in hot and dry areas. Linen, hemp, Refibra, and recycled fibers are some other sustainable fabrics that require little to no water during production.

    d. Supports safer working conditions

    Endless working hours, unacceptable health & safety conditions, and minimum wages, are the reality for most garment workers in the fast fashion sector. A few informative documentaries like “The True Cost” or “Fashion Factories Undercover” document the social injustices of the fast fashion industry. Eco-ethical brands advocate for sustainable fashion, health care, humane working conditions, and fair wages for their workers. 

    e. Healthy for people and the environment

    Fast fashion products often undergo an intense chemical process where 8,000 types of chemicals are used to bleach, dye, and wet process garments. Those chemicals often lead to diseases or fatal accidents for workers and inflict serious congenital disabilities on their children. These chemicals harm our health, as our skin absorbs anything we put on it.

    5 Sustainable & Ethical Online Marketplaces

    Here is a list of five earth-minded and socially responsible marketplaces that have sustainable and fair trade brands for the discerning and mindful shopper:

    1. thegreenlabels

    Netherlands-based webshop thegreenlabels is a sustainable fashion retailer that sells sneakers, womenswear, and accessories from various “green labels” brands. Founded in 2018, this is a marketplace where people can buy products from brands that care about a positive impact on the environment. All brands featured here guarantee fair working conditions and represent at least one of these 4 values – “CLEAN PROCESS” environmentally friendly production, clothes that support “LOCAL” communities, “VEGAN” brands to assure no animals were harmed and “WASTE REDUCTION”

    2. LVRSustainable

    LVRSustainable
    LVRSustainable

    Luisa Via Roma started as a family-owned boutique in the early 1900s. They have grown into a luxury e-retailer and created an LVRSustainable section for people trying to insert sustainability into their wardrobes. They have brands rated ‘Good’ or ‘Great.’ The site offers a wide range of products like bags, accessories, sports, shoes, lingerie, and much more for men, women, and kids. You can find organic, vegan, eco-friendly, ethical, and recycled & upcycled items here.

    3. Brothers We Stand

    Brothers We Stand
    Brothers We Stand

    Brothers We Stand is a retailer set up in solidarity with the people who make our clothes. This retailer conducts rigorous research to ensure that every product in their collection meets the following three standards: designed to please, ethical production, and created to last. It’s a great platform to shop for ethical and sustainable menswear. They also have their private clothing line along with other brands.

    4. Labell-D 

    Labell-D was launched with a clear mission to reduce the negative impact of fast fashion on the planet. This retailer wants to make Responsible Fashion the new norm. They intend to make sustainable clothing and fashion easy for both brands and consumers. Labell-D has a transparent accreditation process where they evaluate the brand’s carbon footprint and environmental impact. Their verification assessment includes animal welfare, emissions, materials, production processes, chemical usage, waste management, and traceability.

    5. Cerqular

    Cerqular wants to make sustainable shopping affordable and accessible for all. The retailer promises that every product and seller is verified as organic, recycled, sustainable, carbon-neutral, eco-friendly, vegan, or circular. They have a wide range of sellers and do not limit products only from luxury brands, so sustainable shopping is no longer expensive or inconvenient.

    Conclusion

    The fashion industry is a contributor to worldwide carbon emissions. Sustainable fashion is the new big thing giving rise to more and more sustainable brands and marketplaces. 

    To stand out and shine in the crowded eCommerce space is not easy. Having a robust Digital Shelf becomes critical for brands. A brand’s Digital Shelf is all of the ways their customers digitally interact with the brand, not only on marketplaces but on the brand’s DTC website & shoppable social media. This is why brands need to closely track & optimize their Digital Shelf KPIs like assortment, availability, pricing, ratings & reviews, product discoverability & product content to increase their online sales.

    Want to learn how DataWeave can help you win the Digital Shelf? Sign up for a demo with our team to know more.

  • U.S. Prime Day Deals 2022: Promotion Intelligence First Look

    U.S. Prime Day Deals 2022: Promotion Intelligence First Look

    As inflation hits another 40-year high at 9.1 percent, U.S. consumers geared up for their first sign of hope and relief in the form of anticipated discount buys – 2022 Amazon Prime Days, or so we thought. While Prime Days have grown to become a promotional period almost as important as Black Friday to digital shoppers, the combination of economic uncertainty, inflationary pressures, and supply chain challenges seemed to alter the discount strategy expected given activity seen during 2021 Prime Days.

    Our analyst team has been hard at work aiming to provide a ‘first look’ at 2022 Prime Day Promotional Insights, tracking discounts offered across 46,000+ SKUs within key categories like Electronics, Clothing, Health & Beauty and Home, on seven major retailer websites – Amazon, Target, Best Buy, Sephora, Ulta, Lowe’s and Home Depot. Our analysis compares prices seen during Amazon Prime Day 2022 on July 12th, to pre-Prime Day maximum value prices seen in the ten days leading up to Prime Days, to determine the average change in discounts offered during the promotional period. Below is a summary of our findings.

    Competitive Promotions Give Amazon a Run for their Money

    Amazon offered the greatest average discount enhancements for Electronics at 5.6 percent followed by Health & Beauty items at 5.1 percent, and Home products at 4.2 percent versus pre-Prime Day discounts seen across the categories considered within our analysis. The only category reviewed where average discounts were greater on a competitor’s website was on Target.com within the Clothing category. As seen below, Clothing on Target.com average discounts were 6.8 percent greater than pre-Prime Day offers, which was 2.6 percent higher than the average discounts offered for Clothing on Amazon.

    Target Capitalizes on Growth Opportunity in Clothing Category

    Diving deeper into the details of where Target won within the Clothing category, you can see a majority of their promotional activity took place within Women’s Accessories where discounts offered were 18.5 percent greater than those seen pre-Prime Day 2022, which was almost 15 percent greater than the discount enhancements seen on Amazon for Women’s Accessories. In fact, Women’s Shoes and Sneakers were the only two categories where the average discounts offered were greater on Amazon than on Target.com.

    Overall, the discounts offered on Target.com within the Clothing category were primarily concentrated within items priced $40 and lower, but what was most interesting is that within the $10 and under price bucket, Target offered average discounts of over 11 percent whereas Amazon increased prices for these items on average by over 9 percent.

    While most of the Clothing available on both Amazon and Target.com during Prime Days 2022 were offered without a price change, the greatest discount percentages tracked were within the range of 10-25 percent off on Amazon whereas Target chose to offer the bulk of their promotions at 25 percent off an up.

    Strategic Promotional Strategies Defined at the Electronics Subcategory Level

    When it comes to the Electronics category on Prime Day, the big question is always who will win the battle of the brands. Below shows the difference in average pricing and promotions discounts offered between products manufactured by Samsung versus Apple across each retailer platform, noting discounts were almost 3 percent greater on average for Apple versus Samsung products on Amazon, and Apple discounts were almost 5 percent greater on Amazon versus than those seen on Target.com.

    Amazon wasn’t going all in on Apple however, as we saw ‘Alexa’ devices (Amazon products) available on Best Buy and Target websites also, but the discounts were almost 4 percent greater on Amazon versus Target and over 7 percent greater than the discounts seen on BestBuy.com.

    While the average discounts offered within the Electronics category were greatest on Amazon (5.6 percent) versus Best Buy (3.9 percent) and Target (3.4 percent) as noted within the first chart of this blog and across brands and technologies considered above, the discounts offered on Amazon were strategically focused between 10-25 percent as seen below.

    Amazon’s Electronics promotions were also targeted at smaller price points, items priced between $20-500, whereas Best Buy and Target offered greater promotions for electronics priced $500 and up than Amazon.

    Below is a snapshot of price buckets tracked for Electronics available on BestBuy.com, highlighting where most of the promotional activity was targeted at products priced $50 and up during Prime Days 2022, with discounts ranging from 10 percent up to greater than 25 percent greater than pre-Prime day prices.

    The standout categories were TVs on Target.com with discounts averaging nearly 12 percent greater than those seen pre-Prime day, and smartphones on BestBuy.com with discounts averaging just over 11 percent greater than those seen pre-Prime Day. The category with the greatest average discount enhancements seen on Amazon during Prime Days 2022 was for Wireless Headphones with an average discount of 8.7 percent.

    Home is Where Amazon’s Heart Was on Prime Day

    Amazon dominated offers within the Home categories, especially for products within mid ($40-100) and higher price ranges (items priced $200-500), with the bulk of the discounts offered between 10-25 percent. There was little to no promotional activity seen across all price points on Lowe’s or Home Depot’s websites within the categories we tracked, and most other competitive offers on Home products were seen on BestBuy.com for products priced from $50-500. Even a subcategory like Tools offered deeper average discounts on Amazon (4.7 percent) than discounts seen on HomeDepot.com (1.1 percent) or Lowes.com (0 percent).

    For Large Appliances, Amazon was the only retailer to off any significant discount across each major subcategory with the greatest average discount being on Ovens at 6 percent, followed by Refrigerators at 4 percent. One caveat with this category, when we reviewed Large Appliance prices two weeks prior to Prime Days, we saw average price increases around 16.7 percent occurring on Amazon.

    During Prime Days 2022 however, Amazon also offered top average discounts for small appliances, except for on Instant Pots which appeared to have greater average discounts on Target.com (5.9 percent versus 4.2 percent on Amazon), and Vacuum Cleaners which appeared to have the best promotion of appliances small and large at 13.8 percent average discount on BestBuy.com. Another subcategory deeply discounted on BestBuy.com was weighted blankets, which averaged discounts around 18.5 percent versus Amazon’s average discount at only 6.2 percent.

    Health & Beauty Retailer Pricing Strategies Revealed

    Given the importance Health & Beauty Brands placed on Prime Day sales last year, we had anticipated to see more offers, especially within pure-play beauty retail channels, than we did for this booming category.

    Amazon drove most of the Health & Beauty offers seen averaging 5.1% discounts versus other retailers only offering less than 1% on average, but discounts were aimed at a targeted group of SKUs on Amazon, bringing the average discount lower overall. Most of the promotions offered on Amazon fell within mid-range price points ($20-50) and were discounted between 10-25 percent versus pre-Prime Day prices.

    Target.com offered the most comparable discounts to Amazon for Health & Beauty products on average, but their strategy primarily focused on items within the $20 and lower price range with discounts ranging primarily between 10-25 percent.

    More 2022 Prime Day Insights Coming Soon

    We know the significance visibility to critical pricing and promotional insights play in enabling retailers and brands to offer the right discounts to stay competitive, especially during promotional periods like Prime Days. While this blog is intended to provide a ‘sneak peek’ into 2022 Prime Day insights for the U.S. market, we will be providing more extensive, global coverage and will proactively share new insights with the marketplace as they become available throughout the month of July.

    Be sure to also check out our Press page for access to the latest media coverage on Prime Day insights and more. Don’t hesitate to reach out to our team if there is any particular category you are interested in seeing in more detail, or for access to more information on our Commerce Intelligence and Digital Shelf solutions.

  • 7 Key Metrics that QSRs want (but may not get) from Food Delivery Apps

    7 Key Metrics that QSRs want (but may not get) from Food Delivery Apps

    The Quick Service Restaurant market is projected to be valued at $691 billion by 2022. As the QSR industry grows and the market becomes even more competitive, restaurant chains continuously seek ways to increase sales via food aggregators to market their business. To improve ROI and sales, having data and insights into key metrics could help QSRs to boost their success rate.

    QSRs would like to know how they stack up against their competition regarding discoverability on cluttered food aggregator apps. Restaurants want to know the gaps in their product assortment to understand what drives customers to their competitors. Getting insights into delivery time and competitors’ delivery fees will help QSR improve delivery ETAs and optimize fees. They can also set competitive pricing with insights into their competitors’ pricing. In addition, they can use data to optimize their ad spending on food apps and improve marketing ROI.

    In this blog, we will discuss the relationship between QSRs and food aggregators and how getting data about key metrics from these food delivery platforms can help QSRs scale their revenue. 

    Data: The Key Ingredient to increasing sales

    According to Statista, online food ordering revenue is expected to grow at a robust CAGR of 10.39% between 2021 and 2025. Food Aggregators apps like Uber Eats, DoorDash, and GrubHub offer convenient meal delivery options from various QSRs within a single app. Food aggregators provide a multitude of benefits for QSRs. They give access to a huge customer base, quick delivery, and an easy entry into quick commerce, helping QSRs increase visibility. Although QSRs rely on food aggregator platforms for hassle-free ordering, tracking, and delivery, they can’t always rely on them to share critical data that could help them optimize their operations & increase sales. 

    Online food ordering revenue
    Online food ordering revenue

    1. Data on Product Assortment

    QSRs need assortment insights to understand their competitor’s menu assortment. Assortment analytics plays a crucial role in ensuring that QSRs aren’t losing sales because their competitors are offering cuisines and dishes that they aren’t. Understanding gaps in menus helps QSRs to better plan their menu. However, food aggregator apps can’t share competitors’ assortment data with QSRs for a multitude of reasons, guidelines, and privacy laws. Thankfully, at DataWeave, our QSR intelligence solution can! We help restaurants improve their assortment by sharing insights into the dishes and cuisines their competitors’ have on display.

    Menu Assortment
    Menu Assortment

    2. Data on QSR Discoverability

    QSRs would love to know how to increase discoverability on food aggregators, as it will help them to appear ahead in search results and beat the competition. Improving visibility on these apps directly impacts sales and drives more orders for restaurants. Some aggregators offer discoverability information but give it on demand, usually after 20-30 days, making it irrelevant due to the enormous time gap. They also don’t provide information about the change in the discoverability of your competition. All these data points are so critical, and understandably so, Food Apps can’t share this level of information with restaurants. However, DataWeave’s QSR Intelligence solution can! It provides real-time discoverability insights into your restaurant and competitor’s visibility so that the data is actionable, and QSRs can use insights to improve visibility

    Read how DataWeave’s QSR Intelligence helped an American QSR Chain and how their ranking on search results page on Ube rEats, DoorDash & Grubhub impacted outlet discoverability & sales!

    3. Data on Pricing & Promotions

    Pricing a QSR’s menu is tricky. If you price too high, you’ll turn off new customers. If you price too low, you’ll cut margins & may even come off as low-qualify. Customer Price Perception is greatly influenced by the Price-Quality relationship. To add to this, restaurants are often up against stiff competition from restaurants with similar cuisine offerings so it’s critical that prices are competitive. Understanding competitor pricing doesn’t imply that you have to beat their prices. You can compensate for any price differences by offering higher quality cuisines, better customer service, and quicker delivery. Once again, food apps can’t share competitors’ pricing data with QSRs. But DataWeave’s QSR & Pricing Intelligence solution can! QSRs can use these insights to drive more revenue & margins by pricing their menu right.

    4. Data on Delivery Time

    QSRs must be able to deliver hot meals, in a timely manner to customers because customers want to quickly dig into the delicious food they ordered. Quicker deliveries within the ETA will also help earn the trust and loyalty of customers. However, food aggregators don’t share information on the delivery times with restaurants – not their own delivery time or their competitors. DataWeave can help QSRs to understand their peak hours and optimize their service to ensure quick ETAs. They can also get detailed insights into competitors’ delivery times to make sure they’re competitive. This is important because customers will often pick restaurants with quicker ETAs.


    Read how DataWeave’s QSR Intelligence helped an American QSR Chain understand the correlation between delivery time & sales volumes

    Delivery time trend by urbanity
    Delivery time trend by urbanity

    5. Data on Delivery Fee

    As a thumb rule, customers will always compare delivery fees across apps. They’re conscious of delivery dollars included in their bill and often choose a restaurant with lesser delivery fees. This makes it even more critical for restaurants to understand how they stack up against their competitors. Understanding competitors’ delivery fees could potentially help QSRs to optimize their rates. And once again, food aggregators can’t share information on competitors’ delivery fees with restaurants. However, DataWeave’s QSR Intelligence can provide all delivery-related insights – be it Delivery etas or fees. 

    Delivery fee trend by urbanity
    Delivery fee trend by urbanity

    6. Data on Ad Performance & ROI

    Getting ad analytics will help QSRs better manage their budgets & increase the ROI on their Ad spends. For example, wouldn’t it be great if QSRs were able to understand which ad formats or promotions led to the most sales? Or which carousal ads had the most visibility in key zip codes where your QSR is expected to do maximum business? Or even insights into a competitor’s ads and promotions on food apps. Knowing this information will help restaurants spend sensibly when buying media on Food Apps & get the most bang for their advertising buck. Food apps do provide standard ad analytics – a number of clicks, CTR, and so on, but for more complex, insightful & actionable insights, there’s DataWeave’s QSR Intelligence

    Read how DataWeave’s QSR Intelligence helped an American QSR Chain understand the ROI delivered on ad spends across Food Delivery apps.

    Insightful & actionable insights for QSR Chains
    Insightful & actionable insights for QSR Chains
    Insightful & actionable insights for QSR Chains
    Insightful & actionable insights for QSR Chains

    7. Data on Outlet Availability / Availability Audit

    To avoid lost sales, being available & “open for business” on Food Apps during peak lunch & dinner hours is critical. Also on weekends, when order volumes are usually high. Sometimes because of technical glitches, QSR outlets appear unavailable on Food Apps. A glitch like that can lead to lost business, and the longer the glitch stays undiscovered, the greater the impact on revenue. While Food Aggregators do their best to make sure all QSRs are up and running on their app, using DataWeave’s QSR Intelligence, restaurants can now do an outlet audit to make sure that’s the case. With just a mere 2.8% unavailability, we saw a 28% drop in the sales for one of our QSR customers! That’s how critical Availability insights are. 

    Conclusion

    Analyzing and optimizing sales, delivery, discoverability, availability & customer data is one of the fastest ways to help grow your QSRs revenue. However, the biggest challenge QSRs face is that it isn’t always easy to get this information. With DataWeave’s QSR Intelligence now some of that data is a little more accessible as we discussed in this blog. And additionally, here are the 7 Tricks we recommend QSRs to use to win on Food Apps

  • eCommerce in South Africa: Data-Driven approach to getting ahead

    eCommerce in South Africa: Data-Driven approach to getting ahead

    What an exciting month we’ve had at DataWeave! Our team flew down to gorgeous Cape Town, South Africa to attend the 8th edition of #EcomAfrica! After months of Zoom calls and virtual events, it was a refreshing change to see our customers in person and meet some of the movers and shakers in eCommerce and some of the top South African brands. 

    Top eCommerce Companies in South Africa
    Top eCommerce Companies in South Africa

    My last visit to South Africa was before the pandemic. Things have changed since then, & the difference was stark! The eCommerce landscape had a paradigm shift during Covid-19 and grew exponentially. My customers spoke to me about the new opportunities, growth potential as well as challenges that came in because of this boom. For one, eCommerce in South Africa has become more competitive than ever – from online retail to grocery and food delivery to even alcohol delivery! All retail businesses seem to have jumped onto the eCommerce bandwagon.

    A recent Deloitte report found that over 70% of South Africans shop online at least once a month & 2 out of 3 respondents said they plan to increase their frequency of online shopping. 65% said they know what they want, search online & check all stores that stock the product to compare prices. Price is one of the key factors that influence consumer purchase decisions. Other critical factors include delivery fee, delivery time, promotions & discounts & product assortment to name a few. In order to stay ahead in this highly competitive arena, both retailers and brands need to make data-driven decisions about critical KPIs like pricing to stay ahead of the competition.

    Increased Online Shopping & Online Shopping Frequency
    Increased Online Shopping & Online Shopping Frequency

    We’ve been working with customers in South Africa for over 4 years now, even before the pandemic. So on Day 2 of the event – S.Krishnan Thyagarajan “Krish”, President & COO, Dataweave had a chance to share our learnings and experience from all these years and how user data is critical to getting ahead & winning the eCommerce race in South Africa.

    For the purpose of Krish’s keynote address, we tracked pricing insights for a finite set of categories across key South African retailers like Checkers, Pick n Pay, EveryShop, Incredible, Makro, Waltons, Shoprite & Dis-Chem to name a few over a period of 16 months from Dec 2020 to April 2022. We highlighted price increase and decrease opportunities and how each retailer reacted in order to stay competitive, increase sales and protect margins. 

    BATTLE of the eCommerce GIANTS!

    Key Highlights from the Keynote

    • Increasing prices where an opportunity exists helps retailers increase their margins exponentially. Pick n Pay had the highest action rate (73%) when it came to capitalizing on price increase opportunities v/s Dis-Chem at 11%. 
    • When it came to price decrease opportunities (in order to stay competitive with rival brands) Takealot was the most responsive retailer – they capitalized on 30% of the opportunities, followed by Pick n Pay at a close second (28%) and Shoprite & Dis-Chem at just 4%.
    • Most retailers took between 1 – 5 days maximum to make price changes which means responsiveness to the market among all retailers is high making it more important for online retailers to always be on their toes.  
    • The 2 categories where most retailers capitalized on Price Increase Opportunities were Sauces & Condiments and Crackers & Biscuits.

    Want to watch the Keynote video on Demand? Click here to register & watch.

    Price Increase & Decrease Opportunities
    Price Increase & Decrease Opportunities

    Bonus video content! 

    • Watch the Impact of price increase & decrease opportunities on Private Label brands! 
    • See how product stock availability impacts price changes over a 16-month period. 
    • Find out which brands are in the lead in the Skin Care, Pet, Baby, Laundry & Cleaning Aid categories 

    If you’re an online retailer in South Africa & need insights on staying competitive with the right pricing, product assortment, delivery time, delivery rates, and the other key influencers that affect customers’ choice of online retailers, sign up for a demo with our team at DataWeave to know how we can help!  

  • How Inflation has hit the Retail Industry

    How Inflation has hit the Retail Industry

    Inflation has resurfaced after a decade of tranquil price increases. The persistent COVID-related supply chain disruptions have been a driving factor in increasing consumer costs since some commodities are harder to come by. While inflation is a normal economic phenomenon, the current 3.81% inflation rate has increased the cost of living for families across the globe.

    Global Inflation Rate
    Global Inflation Rate. Source: Statista

    Worldwide inflation is expected to remain near 5.0% in early 2022 before gradually easing in response to industrial and agricultural commodity price declines. Additionally, the global consumer price inflation peaked from 2.2% in 2020 to 3.8% in 2021 and will average 4.1% in 2022 before subsiding to 2.8% in 2023.

    In this blog, you’ll learn about the impact of inflation on the Retail Industry. 

    What is Inflation?

    Inflation is an economic term that describes an overall increase in the price of goods and services in an economy, and a by-product of inflation is the devaluation of the currency used within that economy. For example, a clothing retailer that used to pay $8 for a t-shirt two years ago will now have to pay $10 for that exact product. The t-shirt hasn’t changed at all. However, it has become 25% more expensive. Inflation and the devaluation of currency are part of the reasons why they’d now pay $2 more for that same T-shirt.

    Also Read: Top 7 strategies to sell effectively on Amazon

    Impact of inflation on Retail

    FMCG

    The Fast-moving consumer goods (FMCG) sector will continue to grow because there is growth in household goods spending despite the Russia-Ukrainian crisis, global interest rate, and rising fuel prices. In fact, the demand for consumer packaged goods rose sharply in countries heavily affected by the pandemic. However, the FMCG sector will see a rise in prices of commodities because crucial resources such as cooking oil, tea, cocoa, etc., become scarce. The persistent shock to the supply chain has forced various FMCG companies to increase their prices. For instance, Mondelez, a Fortune 500–listed snack and beverage company, announced a 6-7% price increase. 

    Inflation for Fashion & Pharma Industry
    Inflation for Fashion & Pharma Industry

    Fashion

    The global fashion industry posted a 20% decline in revenues in 2019–20. Inflation in fashion is caused by transportation bottlenecks, material shortages, rising shipping costs, and straining supply and demand. The global fashion industry will see complete recovery in 2022. COVID-caused supply and demand constraints have eased, but shoppers will have to reconcile to price jumps in everything from bags to shoes.

    Pharma

    Pharmaceuticals are recognized as an essential commodity and therefore have a massive impact on the household budget. Vizient has projected a 3.09% increase in the inflation rate in drug prices from July 1, 2022 – June 30, 2023. It shows how inflation has a direct impact on prescription drug costs. Notably, retail prices for some of the most widely used prescription drugs are expected to increase 2x as much as inflation. The demand for pharmaceutical drugs has been higher post-pandemic, ensuring that consumers’ total demand and spending in this vertical will remain unchanged. 

    Comparison of New, Used & Electric cars
    Comparison of New, Used & Electric cars
    Highest & Lowest Inflation in Beauty category. Source: nielseniq.com

    Automotive

    The rise of both new and used cars has been steeply increasing partly because of the shortage of semiconductors and the backlog from the closure of factories during COVID-19. According to the Bureau of Labor Statistics, there has been a 24.4% inflation in the used car purchase prices and an 8.8% increase in the new car purchase price. Rising oil prices across the globe and the historical oil crisis fuelled by the Ukraine-Russia war have strained many people’s budgets. However, the automobile market is seeing an uptake in demand for electrical vehicles (EVs). EVs represented 14% of car sales between January and June 2021. 

    Beauty

    COVID-19 brought new challenges to the cosmetics industry, chief among this being face-covering required by law. In light of social distancing and lockdowns across the globe, consumers were buying less makeup. The rising cost of labor, energy, and raw materials used in beauty products have resulted in a “once-in-two-decade” backdrop for price hikes. The cost of palm oil, a common material in beauty products, has soared 82% in two years due to Indonesian labor shortages. Nevertheless, consumers will spend more time outside the house. Beauty price per unit changes shot up 17% in-store and online in 2021.

    5 Things that will help retailers during inflationary times

    1. Observe Competition

    Retailers should follow their competitors closely—when they start to raise/lower prices, consider following suit. Using competitive data to gauge price changes will help in managing price parity. However, excessive discounts and lower prices to gain an advantage over your competitor could backfire in various ways. For example, low pricing may convey that your products aren’t as good as your competitors’, impacting your long-term brand image. Moreover, lowering prices to sell more doesn’t necessarily mean higher profits, especially during high inflation. To leverage this strategy effectively, retailers must first identify SKUs that have the highest impact on their pricing.

    2. Build a structured and targeted pricing strategy

    An effective pricing strategy that leverages differences in product, channels, and customers will help retailers to maintain long-term value for their business and customers. However, customers might react differently to a steep price increase. Broad price increases will demonstrate insensitivity and erode customer trust. Instead, retailers can thoughtfully tailor their inflationary price increases for each customer and product segment with a competitive pricing strategy. With a competitive and historical pricing strategy, brands can examine their customers’ end-to-end profitability and willingness to pay relative to a comparable peer set. 

    Price  Competitiveness for the right items
    Price Competitiveness for the right items

    3. Rethink commercial positioning

    The pandemic and rise of inflation during 2020–2021 have profoundly impacted how consumers live and what they value. Understanding how your consumer’s needs have shifted and used a promotion strategy to manage today’s inflationary pressures is crucial. As new behaviors emerge post-pandemic, retailers must prepare for the potential top-line impact of demand shifts. Rethink commercial positioning and review marketing and packaging strategies, including the potential use of nonuniform and, in some cases, nonprice mechanisms.

    4. Ensure price competitiveness on the right items

    The Key-Value Item (KVIs) list should be reviewed again, considering changing shopper needs and habits during the pandemic, plus the supply and demand shock that the industry is currently experiencing. Price-sensitive and vulnerable shoppers are finding this inflationary period particularly tough, so brands might require an even deeper investment in KVI pricing. Reinvest base prices on essential products to drive volume for your best price-sensitive (PS) customers. Compete only where you need to be without overspending. Online channels should continue to reflect in-store prices and diverge during this time. Pricing Optimisation software enables best practices to simultaneously manage a high number of price increase requests.

    5. Revisit promotions to conserve costs and preserve stock availability

    Increasing the number of promoted products is a reflexive response to inflation, but it’s not the right response for building sustainable sales or longer-term loyalty. Inflationary times offer an excellent opportunity to reset promotional strategies to save money and margin. Retailers can increase sales and seize opportunities with a promotional pricing strategy. Increased promotional activity has a knock-on effect vs pricing position in high-low strategies and erodes overall value perception, creating a vicious circle of more promotions equals poorer value.

    Conclusion

    Today’s economic climate and associated pricing pressures are challenging for retailers and customers. Some companies have responded by announcing an increase in prices across product categories. Companies can manage pricing margins responsibly and profitably during inflation. Determining how and where new opportunities exist can help companies control inflation, drive growth, and remain profitable.

    Need help to arrive at the right pricing & discounting strategies to counter inflation? Sign up for a demo with our team to know how we can help!  

  • What is Customer Price Perception  and why it is important

    What is Customer Price Perception and why it is important

    Finding the right price often requires a trade-off between margin and price perception. Brands may want to defeat competitors’ prices on all their products, but that can often lead to losses because sales directly link to price perception. Instead of trying to stay competitive across the board on all products, brands must identify key value categories (KVCs) and key-value items (KPIs) whose prices buyers tend to remember and price those products competitively. In this scenario, they can make up for lowered prices on key products by fixing higher prices on other products. 

    Consumers’ perception of price fairness largely determines their experience with a brand. Brands selling online can often have a disconnect between their prices and what customers expect their prices to be. However, that does not mean spiraling downwards by getting trapped in discounting cycles and heavy promotions that can harm your bottom line. Instead, brands require real-time monitoring across thousands of stock-keeping units (SKUs) to identify key categories and items they need to price with care. In this blog, you’ll learn about price perception and the factors that influence it. 

    What is Price Perception?

    Price perception is the perceived worth of a product or service in the consumer’s mind. It is one of the leading variables in the consumer’s buying process. Buyers are unaware of the true cost of production for the products they buy. Instead, they make buying decisions based on an internal feeling about how much certain products are worth and which brand offers them the best value. To offer competitive prices and yet obtain a higher price for products, brands often pursue marketing strategies to improve the price perception of their brand and products.

    Price Perception
    Price Perception

    However, brands should not fall into the trap of assuming that price perception is a competitor’s price index. It’s not about offering the lowest price on certain SKUs. Not every brand strives to offer the lowest prices. Some brands take a slightly different approach to ensure the right value for their products. For example, take a look at Trader Joe’s, a grocery chain that has never claimed low costs. They’ve always taken a holistic approach to their pricing and customers to build a loyal following. And it worked well for them. Trader Joe’s can boast one of a high-value perception score, despite not having rock-bottom prices. 

    Marketplaces such as Walmart and Amazon may not have the best prices on every item. Still, customer perception is that they will have the lowest prices and will often shift the share of sales towards such platforms over businesses that offer the same or even lower prices. 

    Some things to consider:

    • What do your customers think of your brand?
    • What are the key factors that are driving your customers’ price perceptions?
    • Is your product mix properly aligned with your brand perception?
    • Are you communicating the most important and relevant information to your customers?
    • Is your message being received and understood?
    • Who do your customers see as your competitors, and why?

    Also Read: 11 Reasons why your eCommerce Business is fail 

    What is Price Positioning?

    Price positioning is pricing products or services within a certain price range. It indicates where certain services or products lie in relation to competitors’ pricing and in the mind of different customers. A brand’s price positioning has a huge impact on whether the products are seen as priced low or not. The following is a great way to understand the price-value matrix:

    Price Positioning
    Price Positioning

    Your brand’s position in this matrix will depend on your pricing objectives, competition, and customer loyalty. Price positioning helps the marketing and operating teams understand customers’ perceptions of your brand and convince customers to buy your products. Brands need a holistic approach toward setting prices for their products in order to drive conversions through intelligent pricing and competitive insights. 

    Factors that influence Price Perception

    Price-Quality Relationship

    Price is often an indicator of product quality. The general rule is that the higher-priced products are perceived to have better quality, implying that brands should consider a rational quality-price relationship in their pricing or promo strategy. For example, it might not be best practice to have similar prices for both good and low-quality products because customers will perceive low-quality products as overpriced and might not purchase from you.

    Price-Consciousness

    Customers aren’t price conscious about every product. Instead, they are only price conscious about certain products under the best price guarantee or BGP. For instance, if buyers find your BGP products more expensive than your competitors, the cheaper products in your assortment will still be perceived as expensive. 

    Value-Consciousness

    During markdown periods, ensure that you are not undermining the efforts to shape and maintain price perception by offering extreme or complex discounts. In an attempt to clear stocks, promotions simply confuse the shopping experience for customers and further deteriorate trust in your brand. Your promotional offers should keep price perception during the holiday season or clearance sales by offering a simplified promotional program. Start by understanding which price mechanics and SKUs work best for your target customer segment. You should also reduce over-communication on hero deals else buyers will assume that you incorrectly price products during new seasonal launches. 

    Prestige Sensitivity

    Gerald Zaltman, a Harvard professor, argues that 95% of all purchasing decisions are subconscious. Luxury brands are a great example of how psychology directly links to price perception. Customers buy premium or luxury products to demonstrate their social status. In this scenario, buyers don’t hesitate to buy expensive products from certain brands even if they are explicitly overpriced. Thus, brands selling premium products will have to ensure pricing is coherent with buyers’ expectations. 

    Every customer wants to know they’re getting the best value. They use the highest and lowest prices in a range to understand how expensive a product or brand is. So, by removing high price point lines with low volume, customers will see more minor price points around the store. Brands must merchandise entry price points to help customers identify the lowest prices and improve the perception of their product ranges. 

    Product Range
    Product Range

    How to adjust Price Perception

    Here are three ways for brands to improve price parity:

    • Marketing to influence Price Perception

    An efficient pricing management strategy will focus on competitiveness and establishing the right price perception among your customers. You can influence customers’ price perception by improving the look and feel of your online stores since simpler designs are often reflections of lower prices. Another great way to influence price perception is to offer loyalty and reward programs that also improve brand loyalty and reinforces the vision of an economy store irrespective of the prices of your products.

    • Competitive Analysis

    Brands can understand price differences after a competitive analysis. Customers often search for similar products across brands to find the best deals, and you will be able to understand customer opinion through competitor analysis.

    • Price Management Automation

    A price monitoring platform can help brands to stay on top of promotions and discounts offered by their competitors. A price intelligence software will help brands associate products by similarity criteria and compare the pricing of their products with those of competitors. It offers a detailed view of the market and ensures that brands take care of their bottom line.

    Conclusion

    When a consumer comes across a similar low-priced product or service from a different brand, they may see it as a good deal or might perceive it not worthy of their time or money. What consumers think about your brand’s price is just as important as the actual price of that product. A buyer may sense a company as “upscale” and assume that they have high prices, or they may see a brand as a discount retailer whose prices are too high for its reputation. At times, consumers might also see cheaper alternatives as inferior. It’s not easy for a brand to understand its customers’ perception of price vs. value it offers. Brands need a long-term, dynamic pricing strategy that matches the demands and trends of a global, competitive market. And in order to drive sustainable growth, they need to make smarter pricing and promotion decisions with insights into competitive pricing. 

    Learn how DataWeave can help make sense of your and your competitor’s pricing & promotional strategies and help your brand build the right Price Perception. Sign up for a demo with our team to know more.

  • 9 Things to Build a Thriving Fashion eCommerce Brand

    9 Things to Build a Thriving Fashion eCommerce Brand

    According to the Statista Fashion eCommerce report 2021, the compound annual growth rate (CAGR) for online fashion is predicted to be 10.3% between 2018-2023. The widespread need for trendy fashion presents a challenge for fashion brands to succeed in a highly crowded and competitive space. With eCommerce shopping becoming more prevalent, fashion brands aren’t just competing for brick-and-mortar sales. Instead, they’re also competing for those late-night or impulse purchases from online customers.

    Looking to 2022 and beyond, this blog will highlight 9 things to build a thriving fashion eCommerce brand:

    1. Allow shopping on multiple channels

    Breakdown of Shopping journeys in Apparel
    Breakdown of Shopping journeys in Apparel

    Typically buyers from diverse age groups prefer different sales channels. Some prefer large retailers, and some choose web stores. If you know where your customers like to purchase your products, you can leverage the power of search engines and marketplaces to improve your sales. Multi-channel retailing helps fashion eCommerce brands to sell and promote products on a platform and device of the audience’s choice. 

    A brand should offer support and access to its products across all platforms, channels, and devices. It helps fashion brands to reach customers where they prefer to shop. If your customers prefer to shop on a computer or an app, your brand can offer a seamless customer experience. 

    2. Don’t sell on the Homepage

    Your online fashion store homepage is more about increasing credibility and trust among potential buyers. Your ideal home page shouldn’t display products or their prices. Instead, it would be best to integrate promotional and marketing strategies on the landing page to encourage visitors to explore your product categories and the rest of the website. You should have an intuitive interface that makes navigating the pages easier. You can also use the homepage to promote seasonal offers and new launches. Fashion brands can also display customer reviews, awards, brand achievements, and web security trust seals to increase the conversion rate.

    Don't sell on homepage
    Don’t sell on the homepage

    3. Product Descriptions with Unique Stories

    Product descriptions often get overlooked or underutilized even though they are important for eCommerce businesses. Your products won’t sell with spammy and same product descriptions. The modern product description is all about communicating a product’s worth and value with a story that captivates your buyer’s attention. Identify areas where your content & images don’t align with your product or represent it in the best light. Make sure to deliver an enhanced consistent brand experience across all online channels to improve your conversions.

    4. Focus on Review and Ratings

    Rating & Review of a fashion brand
    Rating & Review of a fashion brand

    Customer reviews have a huge influence on a buyer’s purchase decision, especially in the fashion industry. Encourage your consumers to leave reviews on your brand website. Reviews help fashion brands to build trust for their products and convert customers. Legitimate customer reviews help your shoppers to get crucial insights into what previous buyers liked or disliked about a particular product. 

    However, you should stay away from paid-for or false reviews usually encouraged by unscrupulous sellers as they are easy to spot and hurt your rankings. You must remember that receiving reviews also includes dealing with negative comments. They should be used to improve your upcoming product offerings. 

    5. Sell Looks

    Product can be combined with in the detail page
    The product can be combined with in the detail page

    Successful fashion brands don’t simply sell individual products. Instead, they sell complete looks that inspire shoppers to purchase the entire stylish look. As an online fashion brand, you’re not selling clothes; you’re selling an elegant collection of wearable art. When visitors reach your online store, you should appeal to their fantasies and sentiments through aesthetic look books that are both pleasing and congruent with your brand. Most successful online fashion shops are inspirational and visual. Look books help brands pair their previous season items or dead stock with new stock and increase sales. Brands can also share these look books on social media or in their monthly newsletters to increase reach. 

    6. Provide Promotions and Offers

    Fashion brands can take advantage of plenty of sales throughout the year, from New Year celebrations to Black Friday, Cyber Monday, and Christmas. Brands can leverage these high sales periods to sell looks and gift items to boost sales. Just make sure you’re measuring the effectiveness of your online promotions. Holiday and festive sales also offer an excellent opportunity to plan strategic discounts to get rid of old stock. Since trends in the fashion industry have been changing rapidly, you can use discounts to get rid of dead-stock or out-of-trend items each season. 

    7. Be active on social media

    Social media is a way to promote your brand, increase trust among your audience, and entertain your audience with exciting content. You can also engage the audience by providing gift coupons or giveaways. Brands can promote products while keeping their audience engaged with engaging content and promotional offers. 

    Social media is a great way to get influencer support, either organically or through a paid partnership. Brands have to focus on every element of social media marketing strategy, right from choosing a platform, creating Instagram/Facebook shops, jumping on trends/events, and tracking customer sentiment

    8. High-quality product photography

    Capture every detail of your product
    Capture every detail of your product

    Nothing is worse than ordering a piece of clothing online and not getting what you saw on the website. Not being able to accurately convey fashion products will hurt your bottom line. Fashion brands must use top-notch product photography that includes high-quality visuals, such as multiple angle views, 360-degree images of each product, accurate depictions of all color options, and the option to zoom in on product attributes.  

    High-quality product photography
    High-quality product photography

    A recent game-changer in the fashion industry has been including different sets of models to accurately feature clothes of various shapes, heights, and weights. Instead of displaying a dress in only one size, fashion brands can have multiple models wearing various sizes for the same article of clothing.  

    9. Stay up to date with new trends

    Fashion eCommerce brands have to be particularly careful of continuously updating their product offering with the latest fashion trends for each season. They can boost sales with an in-demand product assortment. Continuously updated fashion inventory signifies that the brand is up-to-date with the latest fashion trends in the market and has unique products to offer. You can always get creative with new styling, better looks, and personalized product recommendations. 

    Conclusion

    Fashion eCommerce is rapidly growing and transforming at a staggering rate as technologies continue to advance. Traditional fashion brands can now expand their reach from brick-and-mortar shops to digital and eCommerce platforms to reach shoppers across the globe. The new digital selling opportunities also come with considerable challenges – from staying up to date with ever-evolving trends to managing dead stock. 
    Are you a fashion brand that needs help monitoring your product content? Or measuring the effectiveness of your online promotions? Or decoding customer sentiment from reviews they’ve left for your products? Sign up for a demo with our team to know how DataWeave can help!

  • How VCs and Brand Rollups are using Data for faster Acquisitions

    How VCs and Brand Rollups are using Data for faster Acquisitions

    When it comes to brands – the biggest story of 2021 was the astronomical growth of Brand Roll-ups. For the uninitiated, Brand Roll-ups are companies that acquire multiple digital consumer brands and then scale these brands 100x by leveraging their own operational expertise across eCommerce platforms, Supply Chain, Warehousing, Marketing, and so on.

    Thrasio is the poster boy for the Brand roll-ups and is valued at over 10 Bn USD.

    Brand rollups have raised over $12 billion in 2021 and the trend only seems to be accelerating in 2022. Not only Brand Roll ups, but VCs too have been pouring money into digital brands. In India, 77+ brands have raised more than 2B USD in 2021. In the US this number is estimated to be north of $10 billion.

    Cumulative capital raised by Amazon Aggregators
    Cumulative capital raised by Amazon Aggregators

    Scaling fast doesn’t come easy. It comes with its own set of challenges. So even with ample experience in running and scaling brands, Brand roll-ups are posed with unique challenges.

    Challenge of Scouting the right brand

    There are 1000s of online consumer brands and new ones are launching every day. Every Brand roll-up wants to be the first one to scout a brand – but this is not easy.

    The challenge here is to identify & pick the right brands without having access to any sales or financial data. Every Brand Rollup has a wishlist with regards to the number of SKUs, price points, reviews, and ratings as well – but don’t have tools in place to scout brands with these criteria in mind. And across multiple platforms and categories, the problem gets more complicated.

    This is an ongoing problem since a brand that was not selling well yesterday may start hitting higher sales numbers a week down the line – and that is why Brand scouting has to be a continuous process.

    One way these aggregators have solved this challenge is by offering mouth-watering referral fees for referring a brand. But this is not a sustainable long-term solution.

    Data Comes to the Rescue

    What Brand Roll-ups need is a continuous and automated data first Brand Scouting solution to enable them to scout the right brands.

    • What are all the brands in a category of interest?
    • Which of these brands is within the filters of Number of SKUs, Price Range, etc.?
    • Which brands have shown an exceptional rise in search rankings?
    • Which brands have shown the most increase in the number of ratings and reviews?
    • Which brands have the highest gain in the customer ratings?
    • What are the estimated sales and market share of the brands?

    DataWeave’s Brand Scouting solution solves exactly this.

    DataWeave’s Brand Scouting Solution

    DataWeave’s Brand Scouting Solution is a comprehensive solution to help Brand Rollups and VCs scout for the ideal brand that fits their acquisition profile. We leverage public data collected from multiple eCommerce platforms to get them the desired information on brands they’re looking for.

    For all the focused categories (Typically 30-40) – we collect data of all the SKUs (Typically 15,000-20,000) and aggregate that at a Brand level:

    • Ranking – Usually Brand Rollups are not interested in the Brands which are on the first page. But, they are interested in the brands which might be b/w 500 to 10,000 ranks but are showing an exceptional gain in ranking week on week.
    Brand Discoverability & Ranking on Amazon
    Brand Discoverability & Ranking on Amazon
    • Ratings – It’s important to look at brands that are showing high improvement in ratings or have consistently shown high ratings. The proportion of 5 stars vs. 1 star is an important metric here.
    • Number of Reviews and Ratings We enable you to find brands that have both high ratings as well as a high number of reviews. This is a very good metric to find the brands in a category that are getting exceptional customer love.
    Brand Popularity Tracker
    Brand Popularity Tracker
    • Filters – We enable filtering in terms of – No. of SKUs, Price Range, Rating and Reviews and even can eliminate established brands so that you only see the brands which qualify your criteria. We also enable you to separately analyze brands that are buying sponsored ads in a category, so you have a clear distinction between organic and sponsored growth of these brands.
    • Trends – What is important is not just the static performance on the day of analysis – but a trend analysis over a period of time to find the brands which are growing exceptionally.
    Brand Score Trend, Average Rating trend & No of Reviews Trend
    Brand Score Trend, Average Rating trend & No of Reviews Trend

    … but, wait there’s more.

    We compliment Brand Scouting with three more solutions to provide the right context and further analysis needed to provide comprehensive insights into the category and platforms where you are scouting for brands:

    Category Analytics: When you are looking at a category and the brands in that category, it is often important to understand how dynamic that category is. We can help analyze:

    • If the category is crowded with more brands per product.
    • Does it have space for new brands?
    • What is the number of new brands entering that category?
    • What is the number of new SKUs entering that category?
    Category & Subcategory Evaluation
    Category & Subcategory Evaluation

    We can also help with benchmarking the category – to help understand how the brand that you are scouting is doing when compared to its category peers.

    Rank Group versus Price, Rating & No of Reviews
    Rank Group versus Price, Rating & No of Reviews

    Sales & Share: We can also provide a good directional estimate of the sales and market share of all the SKUs in the category wherein you are scouting for brands. These are estimates powered by our proprietary machine learning algorithms and can help you solidify your hypothesis around a blog or a category.

    Revenue by Price Points
    Revenue by Price Points

    Sentiment Analysis of Reviews: Customer reviews tell more about the qualitative aspects of the SKU and the brand itself. Our algorithms can help understand what features of a brand or a product do customers really care about. We can answer questions such as:

    • Which features are mentioned most commonly?
    • Which features are mentioned positively or negatively?
    • What adjective is used to describe that particular feature?
    Customer Sentiment Analysis
    Customer Sentiment Analysis

    The suite of Brand Scouting and complementary solutions is evolving rapidly as the space is evolving rapidly. We are supporting several VCs and Brand Roll-ups globally to scout for brands.

    The best aspect about DataWeave is our ability to scout brands across 2,000+ eCommerce platforms globally across geographies. We are super stoked to be playing an enabler in the Brand Rollup revolution.

    Beyond Brand Scouting – Digital Shelf Analytics

    The challenge for Brand roll-ups is not over by just scouting and acquiring a brand. The journey is just about starting – the next challenge that the Brand Rollup faces now is to scale up these brands.

    The challenge the Brand Rollup face is unique and very different from a single brand operator or even traditional CPG conglomerates.

    DataWeave’s flexible product philosophy enables Brand Roll-ups to diagnose and measure the performance of multiple brands across multiple platforms in one dashboard.