Category: Pricing

  • Analysis of Target’s Discount Strategy

    Analysis of Target’s Discount Strategy

    Earlier this year, we witnessed Amazon and Walmart going head to head in a CPG goods price war of fluctuating intensity that soon rippled out to embrace the entire grocery industry.

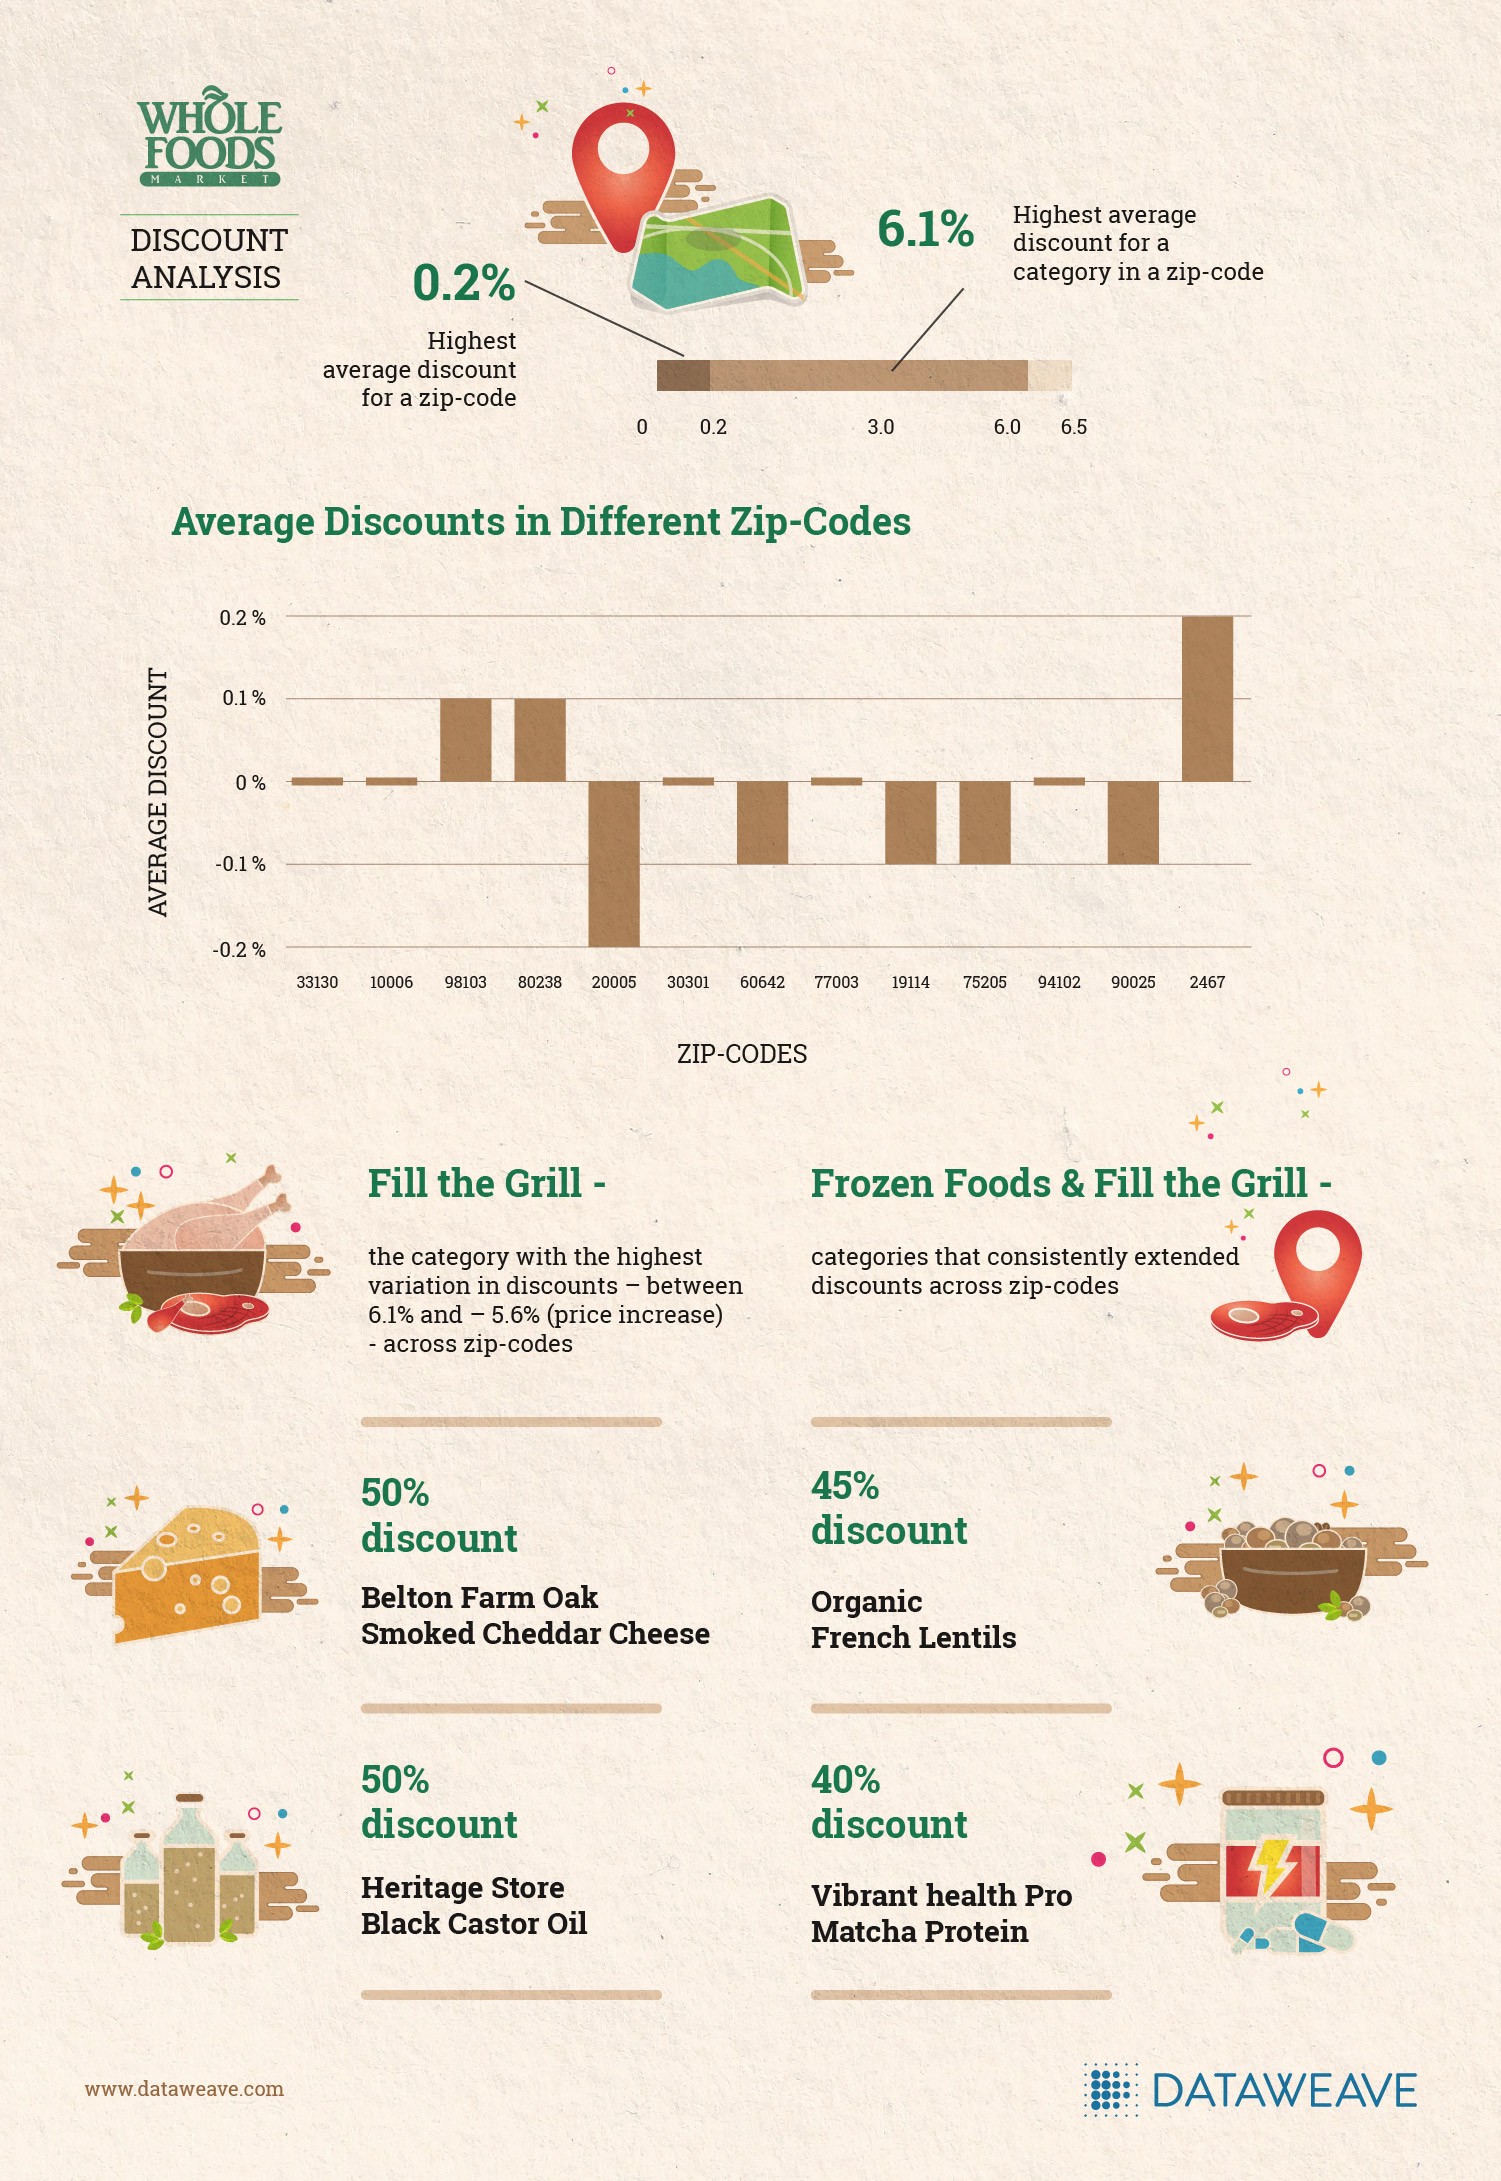
    This further intensified with Amazon’s takeover of Whole Foods and the Whole Foods’ subsequent announcement hinting at significant discounts toward the end of August.

    (Read Also: Amazon’s Whole Foods Pricing Strategy Revealed)

    Soon, Target announced it was lowering prices on literally “thousands of items.” As Mark Tritton, Target executive vice president and the chief merchandising officer put it, “We want our guests to feel a sense of satisfaction every time they shop at Target.”

    To drive home the seriousness of their intent, Target nominated grocery staples such as cereal, paper towels, milk, eggs, baby formula, razors and bath tissue and vowed to, “eliminate more than two-thirds of their price.”

    At DataWeave, we focused our proprietary data aggregation and analysis platform on Target’s reported price reduction. Our team acquired data on the prices of over 160,000 products listed by Target across 12 zip-codes selected at random. The platform then took two snapshots. Firstly, between 23rd August and 30th August which included the Whole Foods’ price reduction (to study any possible reactions on price) and, secondly, between the 6th September and 13th September, which included Target’s discount strategy announcement.

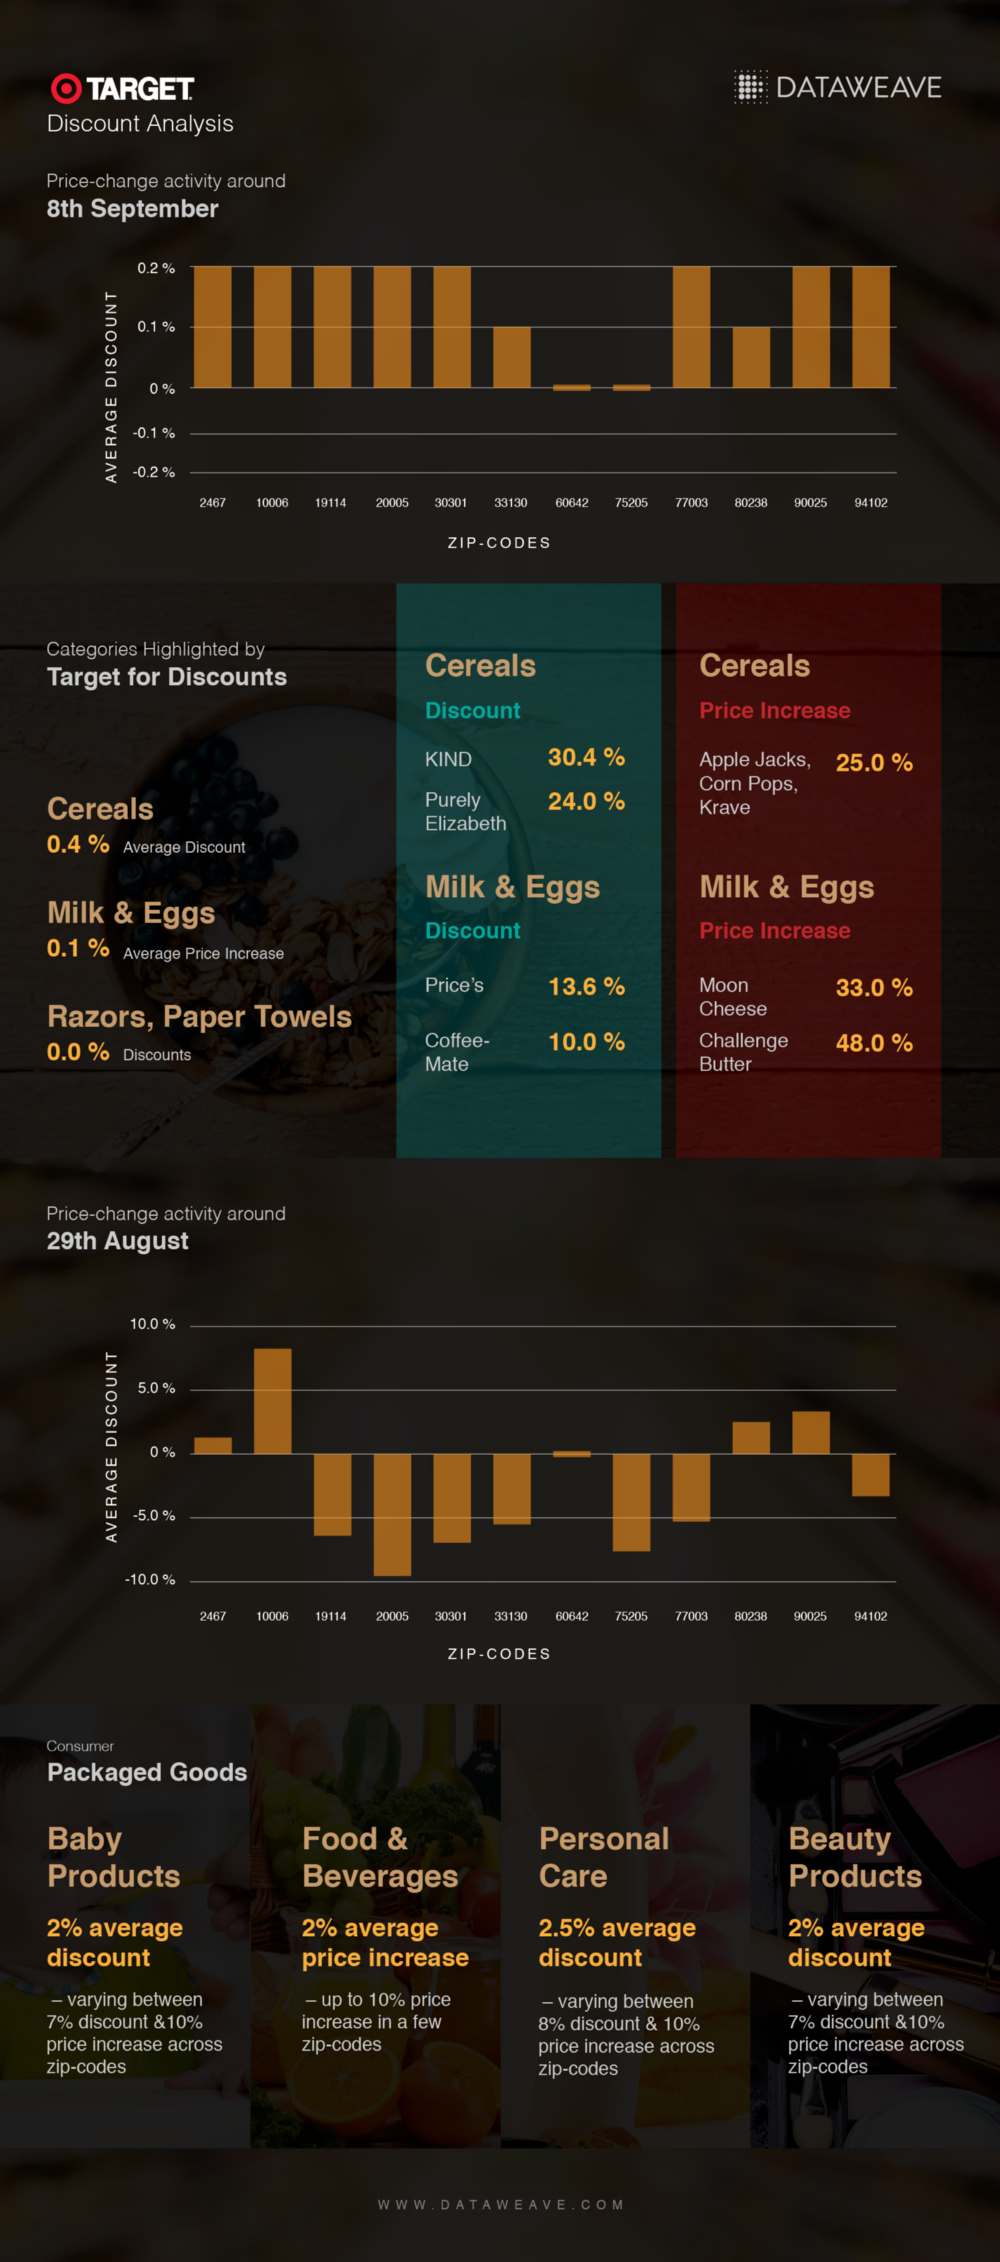
    Of the categories Target identified as priorities for its discount strategy, only baby products, cereals, and Milk & Eggs displayed significant price drops. This price discounting effect varies, however, across brands in each category. In cereals, while KIND (30.4%) and Purely Elizabeth (24%) displayed high discounts, Apple Jacks, Corn Pops, and Krave more surprisingly increased their prices by up to 25% each.

    Similarly, in the Milk & Eggs category, Price’s (13.6%) and Coffee-Mate (10%) exemplified hefty discounts, while Moon Cheese and Challenge Butter increased their prices by 33% and 48% respectively in the same time period. By comparison, Razors and Paper Towels showed no price changes whatsoever across the review period.

    Interestingly, we observed greater price-change activity coinciding with the time of the Whole Foods’ announcement (between 23rd and 30th of August) than the later time period. Once again, however, no definite price discounting pattern emerged from the study, indeed the team found discount rates fluctuated significantly across categories.

    Looking across the spectrum of CPG categories pricing, we saw significant, sustained variation across both categories and zip-codes.

    Beauty products showed a 2 percent discount on average although this varied by zip-code, fluctuating between a 7 percent discount and an actual 10 percent price increase. F&B showed a 2 percent price increase, which jumped to 10 percent in some zip-codes. Personal care displayed a 2.5 percent increase on average, varying anywhere between an 8 percent discount and a 10 percent price increase. Baby products surprisingly recorded a 4 percent price increase on average during the study.

    So, What Does This All Mean?

    Based on our analysis, Target’s pricing strategy appears to be a combination of very closely concentrated discounting, complemented by selective price increases. Is discounting more a perception than a reality at this stage of the CPG cycle?

    Aggressive price discounting has never been a decisive factor in successfully building Target’s consumer franchise. However, given the current trading environment and the continued pressure applied by competitive omni-channel strategies, which has seen a host of new entrants elbowing their way into the market, we anticipate price will continue to play a prominent role in retailing.

    We suspect, based on evidence we gathered, that price discounts are more a highly targeted weapon in the fight for market share than a broadsword slashing of prices across the board. As Target’s CEO Brian Cornell noted during an earnings call, the company experienced “a meaningful increase in the percent of our business done at regular price and a meaningful decline in the percent on promotion.”

    If you’re interested in DataWeave’s data aggregation and analysis technology, and would like to learn more about how we help retailers and brands build and maintain a competitive edge, visit our website.

  • Amazon’s Whole Foods Pricing Strategy Analysis | DataWeave

    Amazon’s Whole Foods Pricing Strategy Analysis | DataWeave

    Amazon.com, America’s retail behemoth, dominated headlines in August when it completed its acquisition of Whole Foods in early August 2017. Having officially taken control of the up-market grocer, which focuses on premium quality produce, market observers and consumers alike are eagerly awaiting Amazon’s pricing strategy analysis.

    At the heart of Amazon.com’s seemingly unstoppable growth trajectory is the company’s ability to understand consumers, complemented by deep insights into buying cycles and purchase decisions and preferences. It also helps that Amazon.com boasts one of the planet’s mightiest marketing and publicity machines.

    Is Amazon.com About To Launch A Grocery Price War?

    Reports of Amazon.com dropping Whole Foods prices by up to 43 percent quickly made splashes across the news media. Given Jeff Bezos has been quoted in the past as saying, “your margin is our opportunity”, an aggressive promotional campaign to achieve dominance for its new Whole Foods acquisition was anticipated by some commentators.

    These sentiments ignited fears of a profit-sapping price war, immediately hit stock prices in the cutthroat grocery industry, which survives on famously thin margins. Memories of Amazon.com’s impact on US department store profitability quickly surfaced with analysts pointing to Walmart’s revenue/market share plunge from 26 percent in 2005 to just 11 percent in 2016 when the sector came under sustained pressure from Amazon.com.

    How Deep Are Amazon.com’s Price Cuts Really?

    At DataWeave, a Competitive Intelligence as a Service provider for retailers and brands, we put Amazon.com’s actual Whole Foods discounts under the microscope. The resulting careful analysis of price discounts revealed quite a different story to the one initially featured in the media. Scrutiny by our proprietary data aggregation and analysis platform showed the drop in retail grocery prices was minimal to almost negligible, depending on the category.

    In delivering near-real-time competitive insights to retailers and brands, we acquire and compile large volumes of data from the Web on an ongoing basis. A key differentiator is our ability to aggregate data down to a zip-code level.

    Our analysis of Amazon.com’s reported drop in prices was based on data acquired for 13 zip-codes distributed across the country and selected at random. Our platform compared market prices by zip code valid between 23rd August and 30th August.

    Each zip code indicated the overall average discount offered varied between 0.20 percent and -0.20 percent. When the discounts at a category-level were separated out, the discounts available to customers per category varied between -6.8 percent (an actual price increase) and 6.1 percent.

    Moving on to the “Fill the Grill” category, discounts again were modest, varying between -5.6 percent (another price increase) and 6.1 percent across the zip codes analyzed.

    This aligns with Amazon.com’s recognized preference for basing its strategy on competing on breadth and depth of product assortment rather than pure pricing discounts at the checkout.

    Some Sunshine For Foodies

    There was some good news for shoppers looking for higher discounts. Amongst those products attracting a higher discount were:

    • Belton Farm Oak Smoked Cheddar Cheese: 50 percent
    • Beemster Premium Dutch Cheese: 50 percent
    • Heritage Store Black Castor Oil: 50 percent
    • Organic French Lentils: 45 percent
    • Vibrant Health Pro Matcha Protein: 40 percent
    • Hass Avocado: 50 percent (confined to one zip-code).

    Final Word

    Amazon.com’s marketing engine is renowned for skillfully nurturing consumer price perceptions of the giant retail website as being the lowest priced retailer. We kept a keen eye on Amazon’s pricing these past weeks, and unearthed a carefully conceived and executed Whole Foods pricing campaign, which is yet another example of their market shaping expertise at work.

    If you’re intrigued by DataWeave’s technology and would like to learn more about how we help retailers and brands build and maintain a competitive edge, please visit our website!

  • Was Amazon’s Prime Day Sale Really That Big a Deal?

    Was Amazon’s Prime Day Sale Really That Big a Deal?

    Hint: Only in some product categories

    Amazon’s Prime Day sale, the first-of-its-kind in India, made a conspicuous splash across the media a couple of weeks ago, with several stories of the sale’s dramatic success doing the rounds. For 30 hours spread over 10th and 11th of July, the online retail giant rolled out deals as frequently as every five minutes, exclusively for Amazon Prime subscribers. And online shoppers lapped it up.

    According to Amazon India, more customers signed up for Prime on the day of the sale and in the week leading up to it, than on any other month since Prime’s launch in India last year. To boot, Prime subscribers shopped three-times more during the sale compared to other days.

    The discounts offered on several products were quite frequently in the range of 60–70% and beyond, with some products reaching absurd discount levels of up to 85%. However, for a retailer as competitively priced as Amazon, what’s interesting to explore is how much additional discount was offered during the sale. After all, even on normal days, Amazon discounts aggressively on its top 20% selling SKUs, in order to reinforce the commonly held perception that the company is the lowest priced retailer around.

    More Than Meets the Eye

    At DataWeave, our AI-based technology platform aggregates and analyzes publicly accessible data on the Web, at large scale, to deliver insights on competitors to retailers and consumer brands. We collected pricing and discount information for the Electronics and Fashion categories on Amazon during the sale, and compared it to numbers from before the sale. Thus, we evaluated just how much additional value Prime subscribers could’ve potentially drawn from this sale.

    We performed a similar analysis on Flipkart as well, to examine how competing e-commerce websites react to big-ticket sale events.

    The infographic below lists out some of the more interesting bits of our analysis.

    Unsurprisingly, Amazon strengthened its grip in the electronics category by offering, on average, 3.9% higher discount than Flipkart, even with a higher-value assortment mix. Subsequently, Amazon reported a 5X increase in sales of smartphones and an 8X increase in sales of televisions during Prime Day.

    While Apple discounted its phones by 8.5% during the sale, Sanyo was among the top discounting brands (10%) in Televisions, with the company reporting a 4X jump in television sales. TCL offered 20% additional discount, the highest for televisions.

    What stands out from this analysis, though, is that Flipkart beat Amazon on price definitively in the fashion for women category, by extending 6.8% more discount than Amazon on a significantly higher-value assortment mix.

    It’s not uncommon to see e-commerce companies lowering their prices across the board to take advantage of the hype surrounding a competing e-commerce website’s promotional activity. Clearly, it’s a good idea for shoppers to always compare prices across websites before buying any product online.

    The New Age of Retail

    That shoppers today can easily compare products and prices across different e-commerce websites has brought about greater competition among online retailers. With the consequent margin pressure, comes the need for retailers to be able to react to price changes by their competitors in near-real-time.

    And it’s no mean task. Amazon has been found to effect over 80 million price changes a day during holiday season, and retailer-driven sale events like the Prime Day Sale are here to stay. Consequently, retailers look to Competitive Intelligence providers like DataWeave for easily consumable competitive information that enables them to react effectively and compete profitably.

    DataWeave’s AI-powered technology platform aggregates, compiles, and presents millions of data points to provide e-commerce companies with actionable competitive insights. With our solutions, retailers can effect profitable price changes, implement high-value assortment expansion, and proactively monitor and respond to promotional campaigns by competitors.

    Find what we do interesting? Visit our website to find out more about how modern retailers benefit from using DataWeave’s Competitive Intelligence as a Service.

  • Smart Practices for Pricing Products

    Smart Practices for Pricing Products

    Top pricing strategies for online retailers

    “When it comes to retail markets, law of one price is no law at all” — Hal Varian

    Hal Varian, in his seminal paper “A Model of Sales”, further remarks that most retail markets are instead characterized by a rather large degree of price dispersion.

    Do you know how much your products are worth? How low are you willing to price an item to compete with another ecommerce retailer?

    Today, online retail has become increasingly competitive. If you are priced higher than your competitors, you may end up losing customers who are sensitive to prices. With the advent of highly competitive pricing tools, winning the online pricing war is an uphill task. Having a differentiated competitive strategy is critical to your e-commerce success.

    We bring to you a list of smart practices that we have seen being played out across online retailers in 10 countries that we actively monitor and analyze.

    Analyzing Competitor Prices And Stock Availability

    Product pricing is one of the largest driver of profitability. So you know who your main competitors are, but do you know how they are priced? Compare prices and stock availability of products that are popular across all your competitors and do the same for products that are popular at your store. If you know that certain products are “not in stock”, you know you need not discount. Look at products that are popular across competition and know your price position. Try for an opportunity to increase prices without losing your price position. However, for products popular on your store, you may want to stay competitive.

    Knowing Price Variations

    You get the right price, and then it’s not right anymore. That’s the story of online retail. But when you are equipped with the knowledge of price variations on popular marketplaces, it gives you an idea of where the market is heading. This, in turn, will help you adjust your prices to get the consumers. For instance, Amazon changed prices of more than 50% of their products in Hair Care category more than once in a week including ~20% of the products at least 4 times in the same week.

    Product Bundling

    A marketer of a successful product may bundle a new or less successful product with its stronger product to edge its way into a new market. This allows you to charge a unique, competitive price that can’t be copied by others. If you realize that you may not be able to compete on direct discounts, bundle products together and offer them at a lower price. You can either bundle in multiples of the same product or pack different products together. One of the more famous examples of this is Microsoft’s bundling of various software applications. In the onsite retail space, for example, on a particular day we noticed ~400+ combo offers from SnapDeal in the camera & accessories category whereas PayTM has ~200+ combo offers and Amazon has ~3000+ combo offers in the same category. Similarly, in hair care category we observed significant variance in combo offers across marketplaces (~900+ by Amazon, ~250+ by PayTM and ~100 by SnapDeal on a specific day). We also noticed that marketplaces have varied number of products sold in packs across different brands (~2500 in Amazon, ~800+ in PayTM and ~500 in Snapdeal on a specific day).

    Shipping Fees & Delivery Time

    Free shipping attracts customers to e-commerce platforms like a moth to a flame. Monitor shipping fees across competition for products you are interested in. There will be cases where your competitor is pricing a product at a lower price than you, but does not offer free shipping. That is your signal to promote your platform.

    Price Match Guarantees

    Price match is an easy way for customers to save money on their day-to-day purchases. During Black Friday sales in the US, a lot of popular stores go for the price match guarantee feature to drive sales. It’s a smart trick to let your customers show you the lowest price and then match them accordingly.

    No Discounts On Unique Products

    No matter how much you dress it up, cutting prices hurts. It might be unavoidable, but you can get rid of discounts on unique products. When you analyze gaps and strengths of your catalog and realize that there are products that are available only on your store, why would you need to provide discounts? So, for instance, it seems that only Flipkart is carrying Icon LaserJet Pro Black Toner currently and it is being sold at 75% discount. Unless the objective is to get rid of the inventory, this product could be priced higher. Another example is, Nikon Coolpix S1100PJ Point & Shoot Camera is out of stock with most of the key marketplaces. Hence if anyone gets this replenished, this should not be discounted. Similarly, unique brands in hair care category, say LeModish, is sold primarily on PayTM. So, PayTM could look at reducing discount for this brand.

    Don’t Price Above Market Rate

    Some retailers price products above the market rate (MRP / MSRP) so that they can show substantial discounts. But your customers are smart and research well. If they realize that this is not really ‘low price’, you may end up losing them.

    Dynamic Pricing

    This is one trend you should definitely follow. Constantly monitor competitor prices and drop or increase prices whenever you see an opportunity. This process is highly tech-driven, so ensure that you work with a vendor who provides the same or you have the in-house capability to do this in a sustained and scalable manner.

    There are multiple product strategies that have to be considered, including cross-border commerce and highly spread out markets like SEA where there exists a lot more C2C marketplaces. However, as with many things in ecommerce, one size does not fit all. Combine the powers of your service and price to drive your bottom line and emerge as an undisputed leader in the retail space.

    Note: This article has been previously published on Inc42 and on Indian Retailer.

    DataWeave Retail Intelligence provides competitive intelligence solution to retailers. DataWeave’s solution is both language and geography agnostic and is built for significant scale

  • Introducing the new PriceWeave

    Introducing the new PriceWeave

    PriceWeave provides Competive Intelligence for eRetailers, brands, and manufacturers. Competitive Intelligence helps businesses understand their competition better, take timely decisions, and increase sales. Our retail pricing intelligence tool serves the following major purposes:

    Compare: PriceWeave lets you access products from across any number of sources and organize them for a straightforward apples-to-apples comparison.

    Monitor: Our intuitive dashboards help you monitor prices, assortments, products, brands, and deals across competition on a daily basis.

    Discover: Discover gaps in your product catalog. Discover products that are unique to you. Discover new brands and categories your competitors have introduced. Find new competitors.

    Analyze: Get customized alerts and reports on anything that you want to track. Access historical pricing data to understand pricing strategies. Visualize data across facets at different levels of granularity.

    If you are an eRetailer, PriceWeave powers your sales, marketing, and analytics team with actionable data–for both day to day operations, as well as long term strategy. With retail pricing intelligence, an eRetailer can:

    • understand pricing opportunitiesand implement an effective pricing strategy
    • get pricing variation for the products you are tracking across competition
    • get apples-to-apples product comparison and historical pricing data
    • optimize assortment planningthrough assortment intelligence
    • continuously monitor product assortment width and depth
    • understand gaps in your (and your competition’s) product catalog
    • manage featured products and promotions
    • develop overall sales and marketing strategy
    • big picture as well multi-dimensional faceted views: price bands, discount bands, categories, brands, and features

    If you are a brand or a manufacturer who sell your products through retailers, PriceWeave helps you as well. A Brand (or a Manufacturer) can:

    • ensure brand equity
    • monitor MOP violations and discover unauthorized resellers
    • increase market penetration
    • track retailer assortment across competing brand products.
    • discover new retailers — new distribution channels
    • increase engagement with retailers as well as customers
    • get regular reports on availability, pricing, offers, and discounts

    In short, PriceWeave is a product that gives you all the data and tools to help you gain and sustain an edge over your competition.

    For a demo of the product do reach out to us at (contact@dataweave.com). You can sign up for a free evaluation at dataweave.com.

  • Tips on How to Price Your Products | DataWeave

    Tips on How to Price Your Products | DataWeave

    Picture this. You’re approaching the biggest sale of the year for your business, the number of offerings are ever growing and your competitors are inching in on your turf. How then are you to tackle the complex & challenging task of pricing your offerings? In short how do you know if the price is right?

    Here’s how we think it’s possible:

    1. Prioritize your objectives

    Pricing can be modified based on your priorities. A good pricing intelligence tool lets you understand pricing opportunities across different dimensions (categories/brands, etc.). Which categories do you want to score on? Which price battles do you choose to fight? Once you have decided your focus areas, you can make pricing decisions accordingly.

    2. Trading off margins for market share (or vice versa)

    Trading off profits for larger market shares often decreases overhead and increases profits due to network effects. This means that the value of your offerings increases as more people use them (e.g., the iOS or the Windows platform). If margins are crucial do not hesitate to make smart and aggressive pricing decisions using inputs from pricing intelligence tools.

    3. Avoiding underpricing and overpricing

    Underpricing brings down the bottom line and overpricing alienates customers. Walking the thin line between these is both an art and a science. An effective path to a balanced pricing is employing a pricing intelligence tool. A pricing intelligence tool helps you in getting the price right with ease for any number of your products.

    4. Understanding consumers and balancing costs

    Who IS your buyer? How much is she willing to shell out for the products you are selling? How much should you mark up your products to recuperate your costs? What can you do retain your consumers and attract new ones? What steps are my competitors taking to achieve this (discounts/combos/coupons/loyalty points)? Answer these questions and you are closer to the ideal price.

    5. Monitor competition

    The simplest and the most effective way to price your product right is to monitor your competitors. Every pricing win contributes to your profits and boosts your bottom line. Competitive Intelligence products let you monitor your products across any of your competitors.

    Conclusion

    There are many tips on how to price your products. An effective pricing tool goes a long way in helping you determine the right price for your products. It augments your experience, intuition, and your internal analytics with solid competitive pricing data.

    Why not give pricing intelligence a test ride then? Email us today at contact@dataweave.in to get started.

    About PriceWeave

    PriceWeave provides Competitive Intelligence for retailers, brands, and manufacturers. We’re built on top of huge amounts of products data to provide features such as: pricing opportunities (and changes), assortment intelligence, gaps in catalogs, reporting and analytics, and tracking promotions, and product launches. PriceWeave lets you track any number of products across any number of categories against your competitors. If you’d like to try us out request for a demo.

    Originally published at blog.priceweave.com.

  • Of broken pumpkins and wasted lemonade

    Of broken pumpkins and wasted lemonade

    [The idea for this post was given by Mahesh B. L., who is a friend of DataWeave. We are going to have some fun with data below.]

    Ayudha Puje (ಆಯುಧ ಪೂಜೆ) or Ayudha Puja marks the end of Navaratri. It is the day before Dasara. Ayudha Puje is essentially the worship of implements (or tools/weapons) that we use. While this is practiced in all southern states, since Dasara is Karnataka’s nADa habba (ನಾಡ ಹಬ್ಬ) or “the festival of the land” it is done so with added fervour in Karnataka. At least it does seem so if you see the roads for the next few days!

    As part of Ayudha Puje, everybody washes and decorates their vehicles (well, they are our major weapons in more than one sense) and worships them by squashing a suitable amount of nice and juicy lemons with great vengeance. Ash gourds (Winter Melons) are also shattered with furious anger.

    Just how many lemons got squashed on the last Ayudha Puje in and around Bangalore? We dug up some data from a few sources (Praja, Bangalore City Traffic Police, RTO, a Hindu article), and came with a quick and dirty estimate on the number of vehicles in Bangalore. We estimate that there are about 55 lac vehicles in and around Bangalore. You can download the data we used and our approximations here.


    So, assuming one lemon per wheel, upwards of 13 million lemons got squashed on October 12, 2013 that could otherwise have been put to some good use such as preventing cauliflowers from turning brown, or serving Gin Fizz to an entire country. (Of course, we know that not everyone performs Ayudha Puje. But let’s not be insensitive to the plight of our victims by digressing.)

    We don’t have an estimate on how many Ash Gourds were broken, but we are sure the quantity would have been at least enough to serve tasty Halwa to every person in Karnataka.

    Do you want to do some serious analysis on Lemons and Pumpkins yourself? Take a look at our Commodity Prices API. Register to get an API key and start using it. Like this:

    http://api.dataweave.in/v1/commodities/findByCommodity/?api_key=b20a79e582ee4953ceccf41ac28aa08d&commodity=Lemon&start_date=20131009&end_date=20131015&page=1&per_page=10

    DataWeave helps businesses make data-driven decisions by providing relevant actionable data. The company aggregates and organizes data from the web, such that businesses can access millions of data points through APIs, dashboards, and visualizations.


    Originally published at blog.dataweave.in.