Category: Pricing

  • Prime Day 2021 Reflected the Global Health & Beauty Category

    Prime Day 2021 Reflected the Global Health & Beauty Category

    As consumers socialize more this year, retailers around the world are competing for sales in the torrid health & beauty category.

    That’s why we at DataWeave wanted to know how Prime Day 2021 discounts played a role in the pricing strategies for health & beauty products. We focused our analysis on how global retailers adapted their Prime Day pricing strategies to distinguish their offerings across seven health & beauty subcategories, including makeup, health care and baby care.

    Our Methodology
    We tracked the pricing of products among 16 leading retailers in nine countries across five regions, including:

    ● The US (Amazon US, Sephora, Target, Ulta and Walmart)
    ● The UK (Amazon UK, Ebay, Etsy and OnBuy)
    ● Europe (Amazon France, Amazon Germany and Amazon Italy)
    ● The Middle East (Amazon Saudi Arabia and Amazon UAE)
    ● Asia (Amazon Japan and Amazon Singapore)

    The results showed some surprising differences among retailers and regions. See how retailers used pricing as a competitive strategy to win Prime Day sales in the health & beauty category, as well as international health & beauty brands that stood out for the discounts on their products.

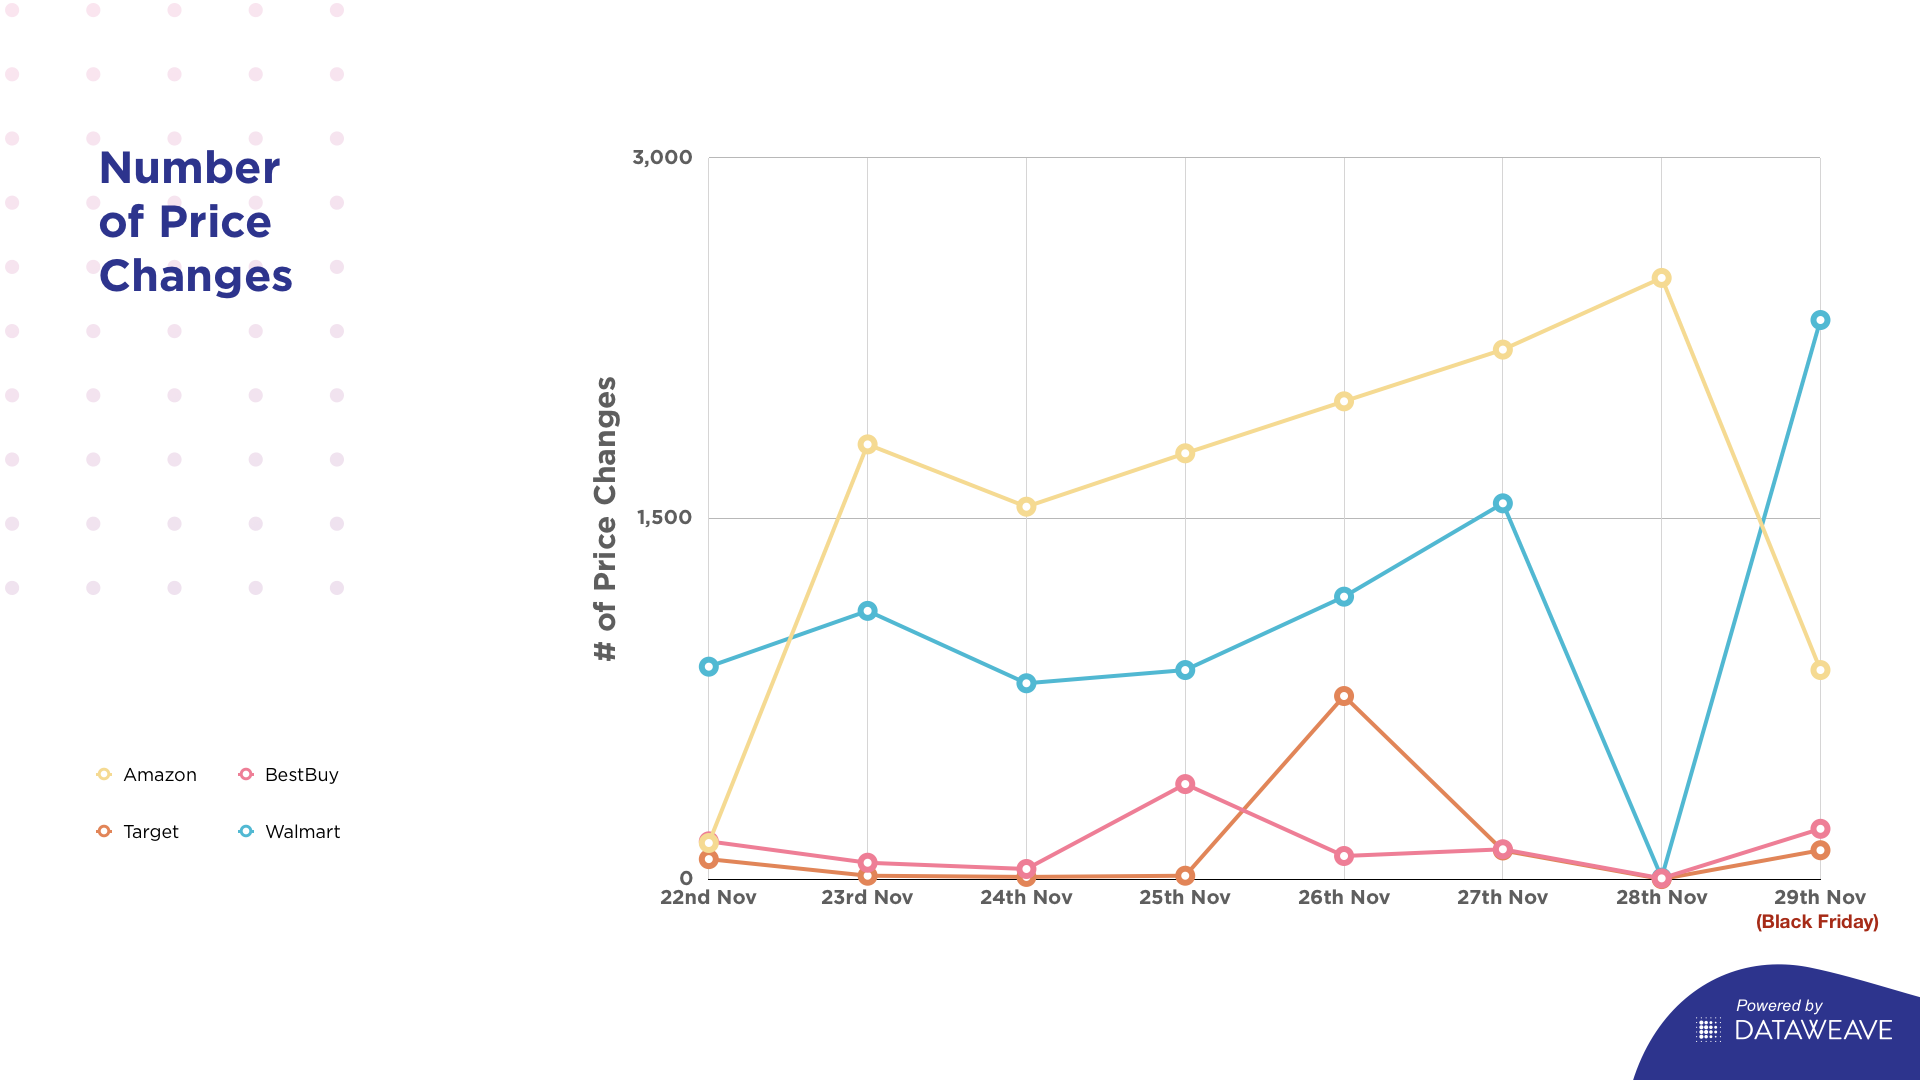
    Percentage of items with a price decrease

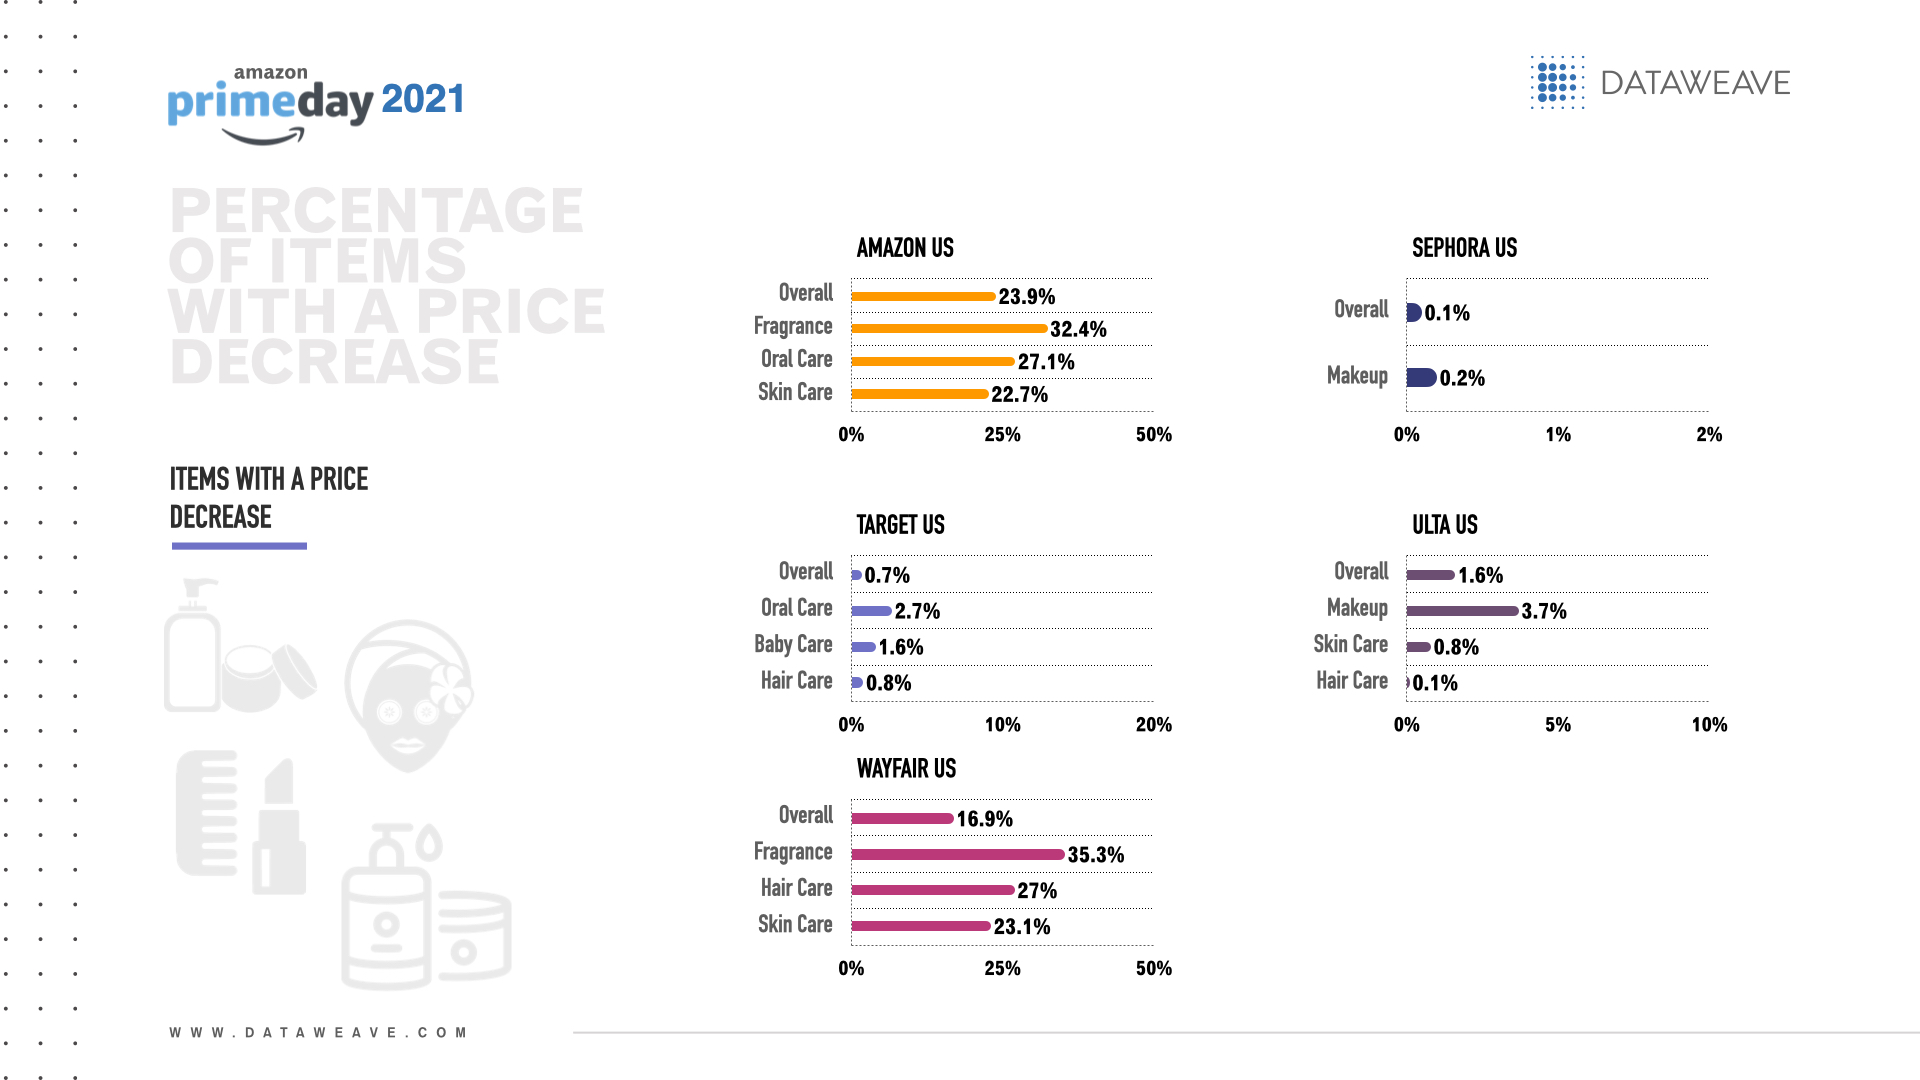
    The US retailer with the overall highest percentage of health & beauty products with a price decrease for Prime Day was Amazon US (23.9%).

    Health & beauty subcategories with the highest percentage of items with a price decrease per US retailer were:

    Amazon US: Fragrance (32.4%), oral care (27.1%) and skin care (22.7%)
    Sephora: Makeup (0.2%)
    Target: Oral care (2.7%), baby care (1.6%) and hair care (0.8%)
    Ulta: Makeup (3.7%), skin care (0.8%) and hair care (0.1%)
    Walmart: Fragrance (35.3%), hair care (27.0%) and skin care (23.1%)

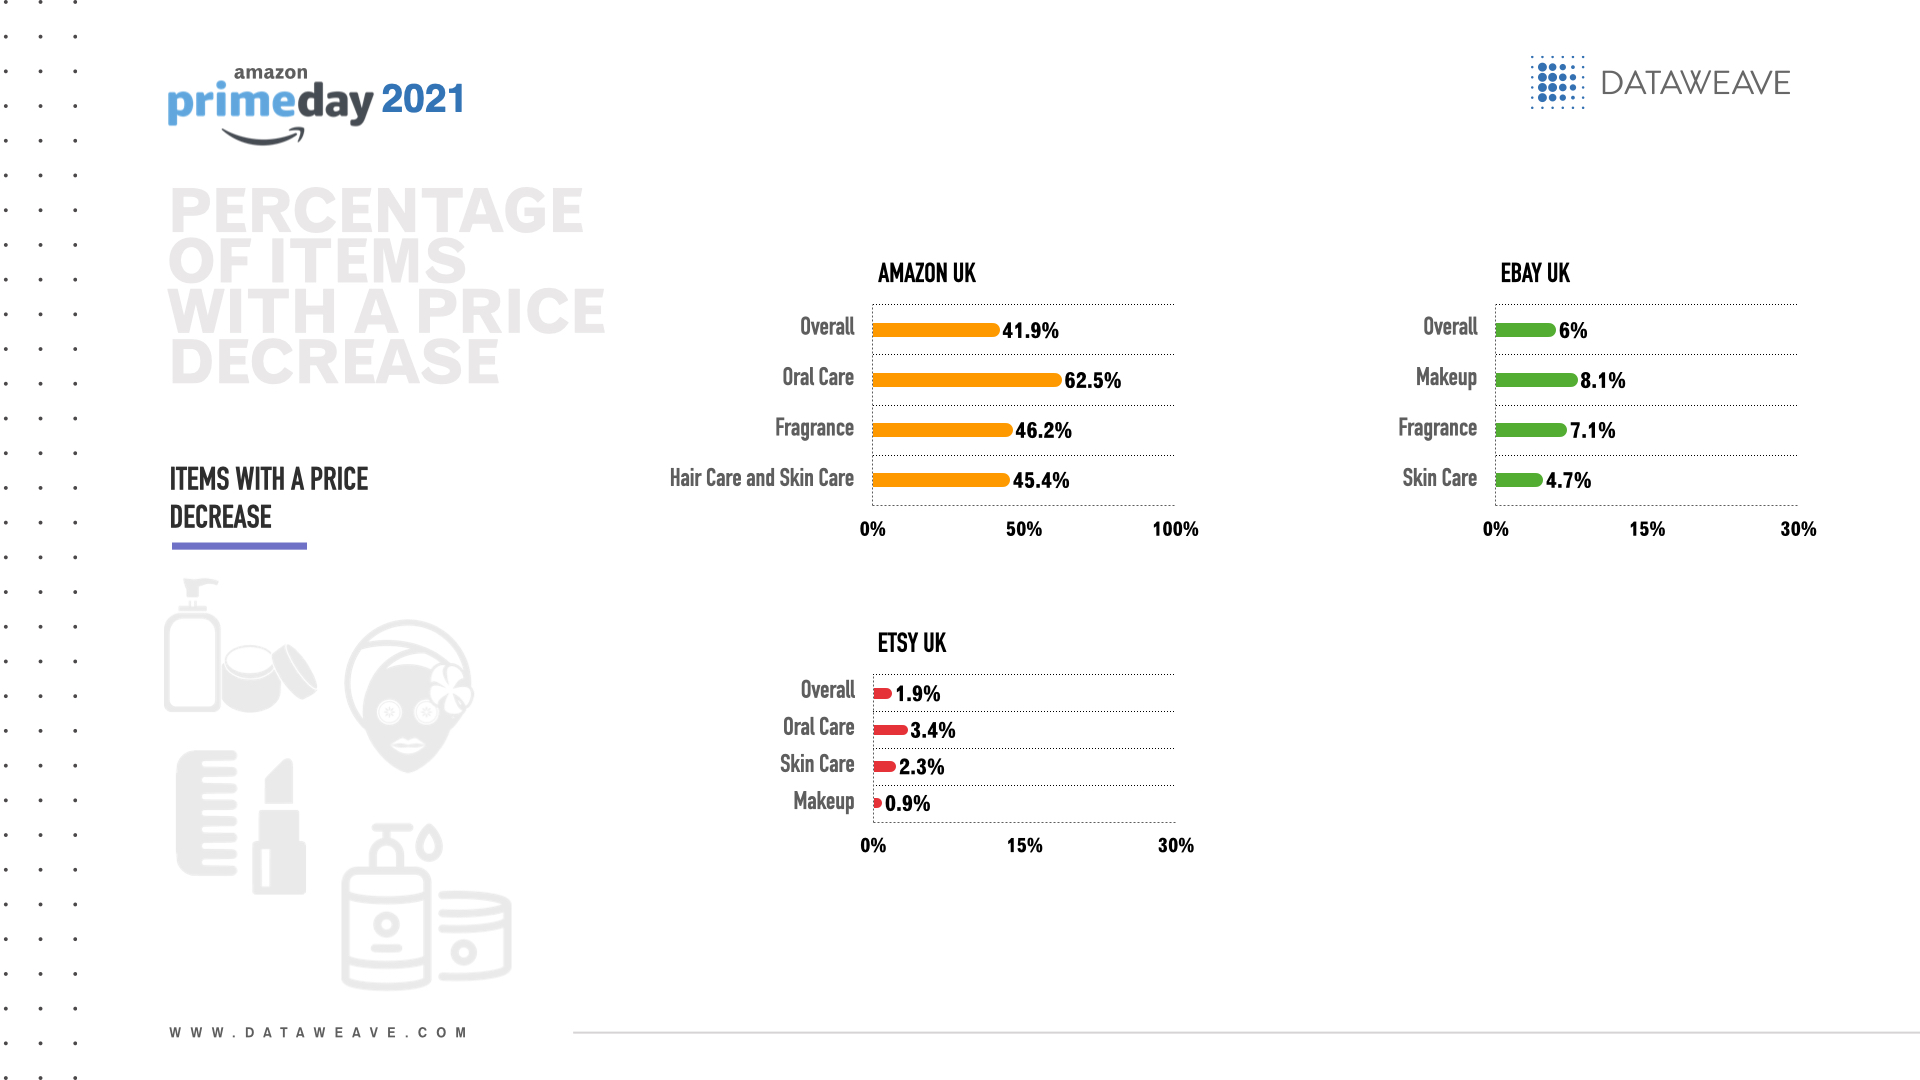
    By far, the UK retailer with the overall highest percentage of items with a price decrease for Prime Day was Amazon UK (41.9%).

    Health & beauty subcategories with the highest percentage of items with a price decrease per UK retailer were:

    Amazon UK: Oral care (62.5%), fragrance (46.2%) and hair care and skin care (both 45.4%)
    Ebay: Makeup (8.1%), fragrance (7.1%) and skin care (4.7%)
    Etsy: Oral care (3.4%), skin care (2.3%) and makeup (0.9%)

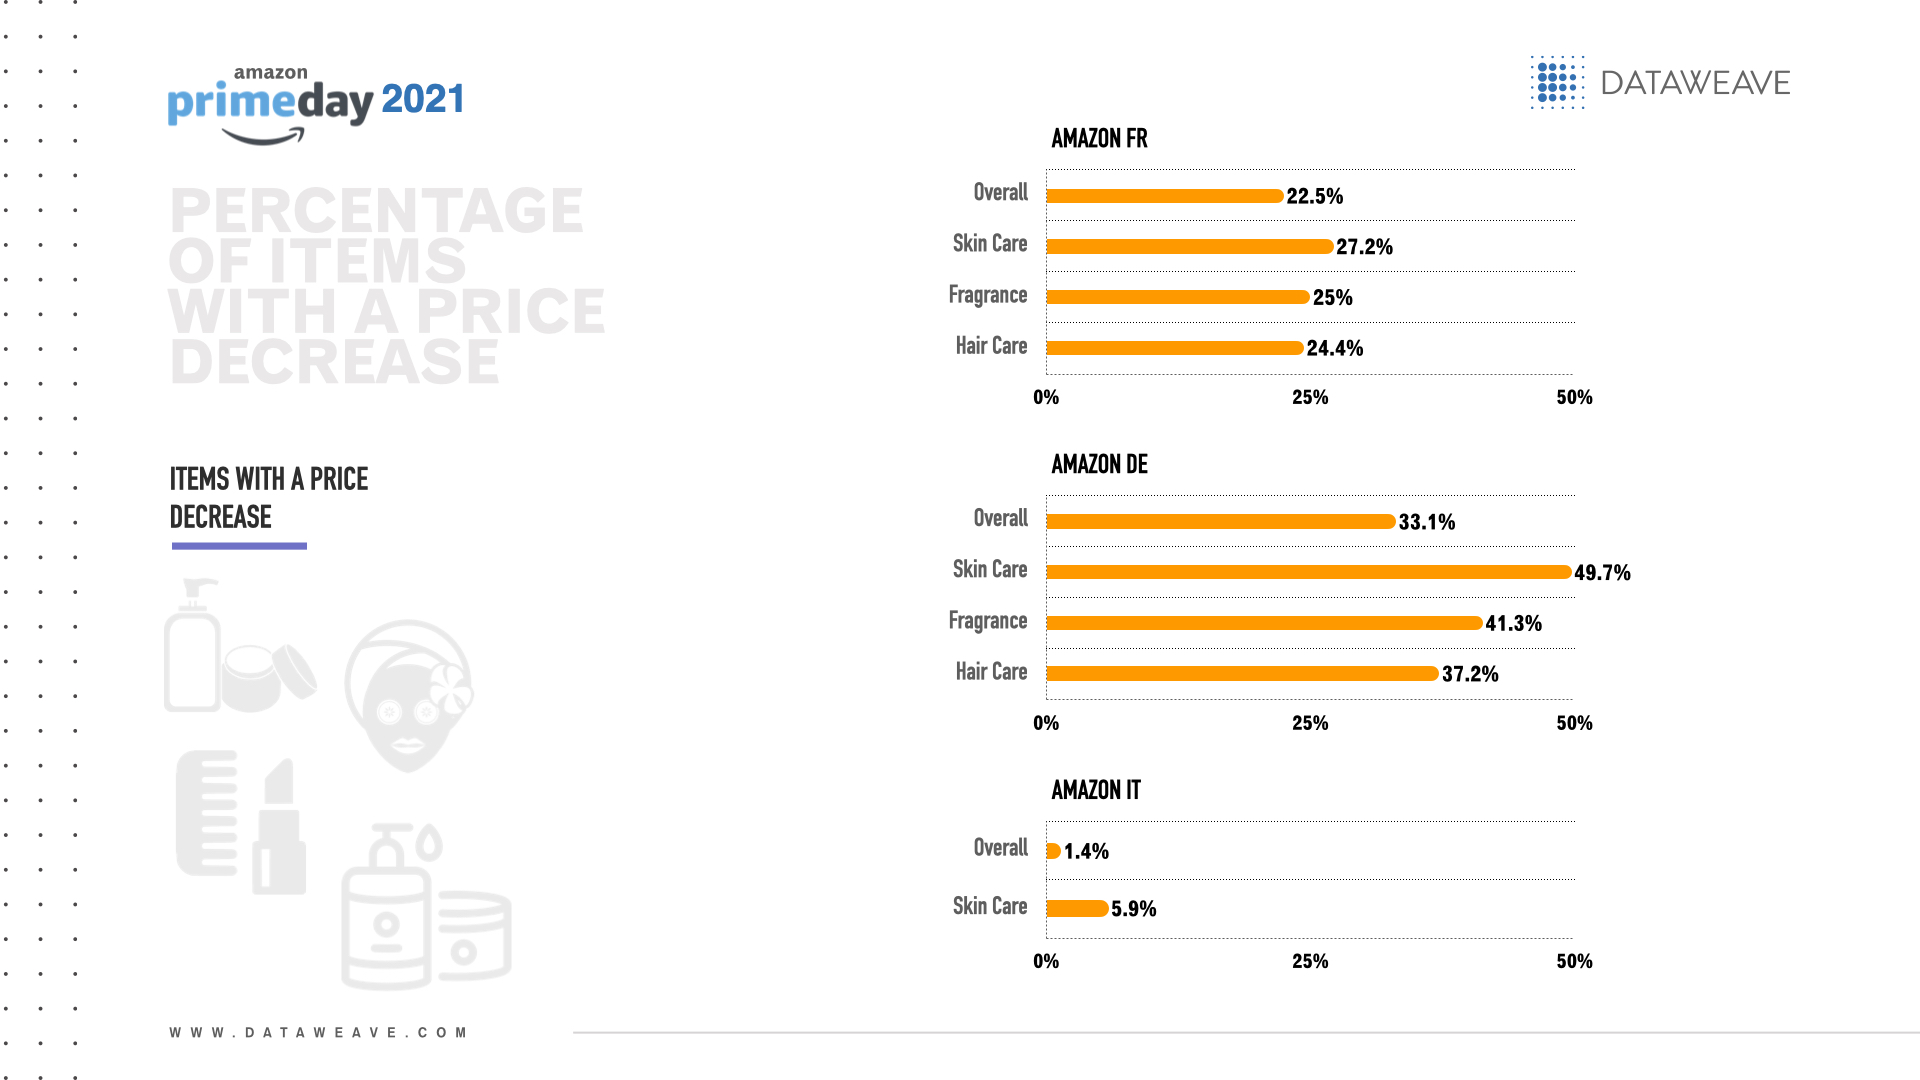
    In Europe, Amazon Germany had the overall highest percentage of items with a price decrease for Prime Day (33.1%).

    Health & beauty subcategories with the highest percentage of items with a price decrease per European retailer were:

    Amazon France: Skin care (27.2%), fragrance (25.0%) and hair care (24.4%)
    Amazon Germany: Skin care (49.7%), fragrance (41.3%) and hair care (37.2%)
    Amazon Italy: Skin care (5.9%)

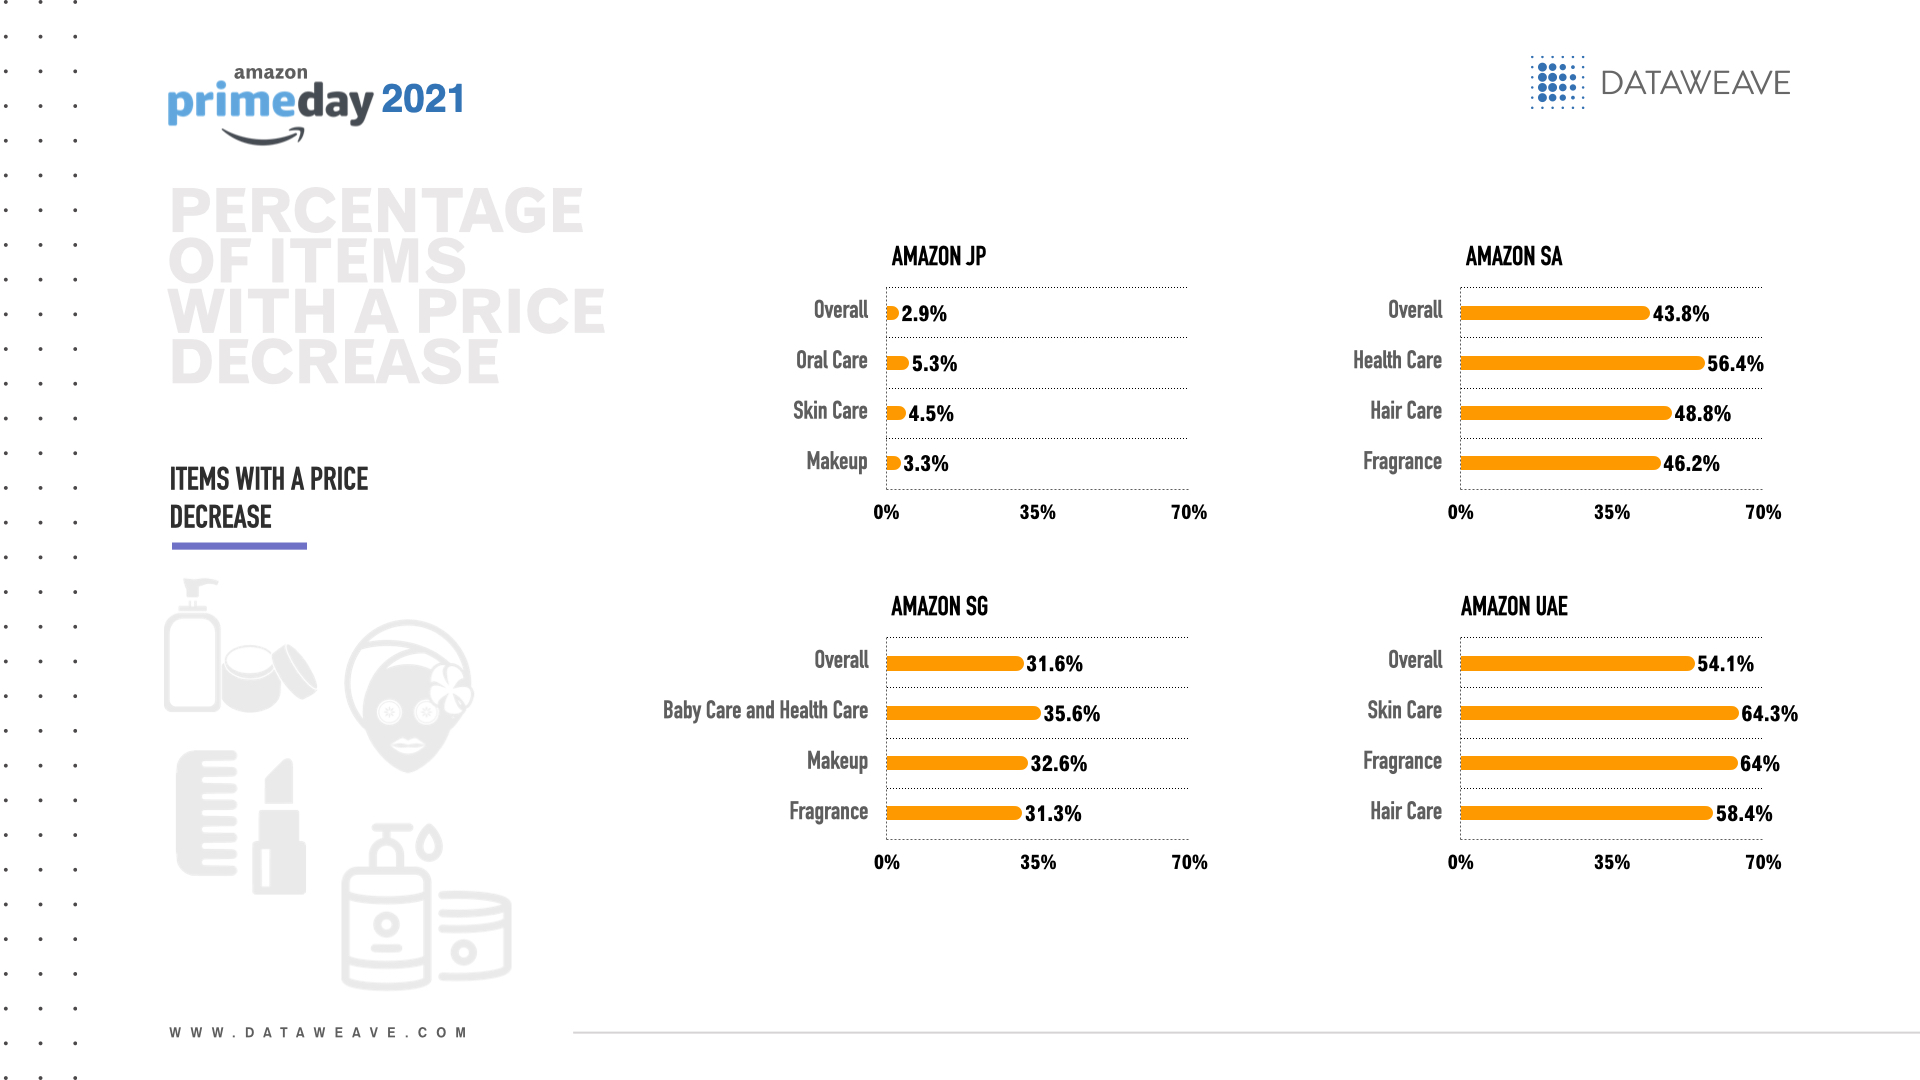
    Across the Middle East & Asia, Amazon UAE had the overall highest percentage of health & beauty items with a price decrease for Prime Day (54.1%).

    Health & beauty subcategories with the highest percentage of items with a price decrease per retailer were:

    Amazon Saudi Arabia: Health care (56.4%), hair care (48.8%) and fragrance (46.2%)
    Amazon UAE: Skin care (64.3%), fragrance (64.0%), and hair care (58.4%)
    Amazon Japan: Oral care (5.3%), skin care (4.5%) and makeup (3.3%)
    Amazon Singapore: Baby care and health care (both 35.6%), makeup (32.6%) and fragrance (31.3%)

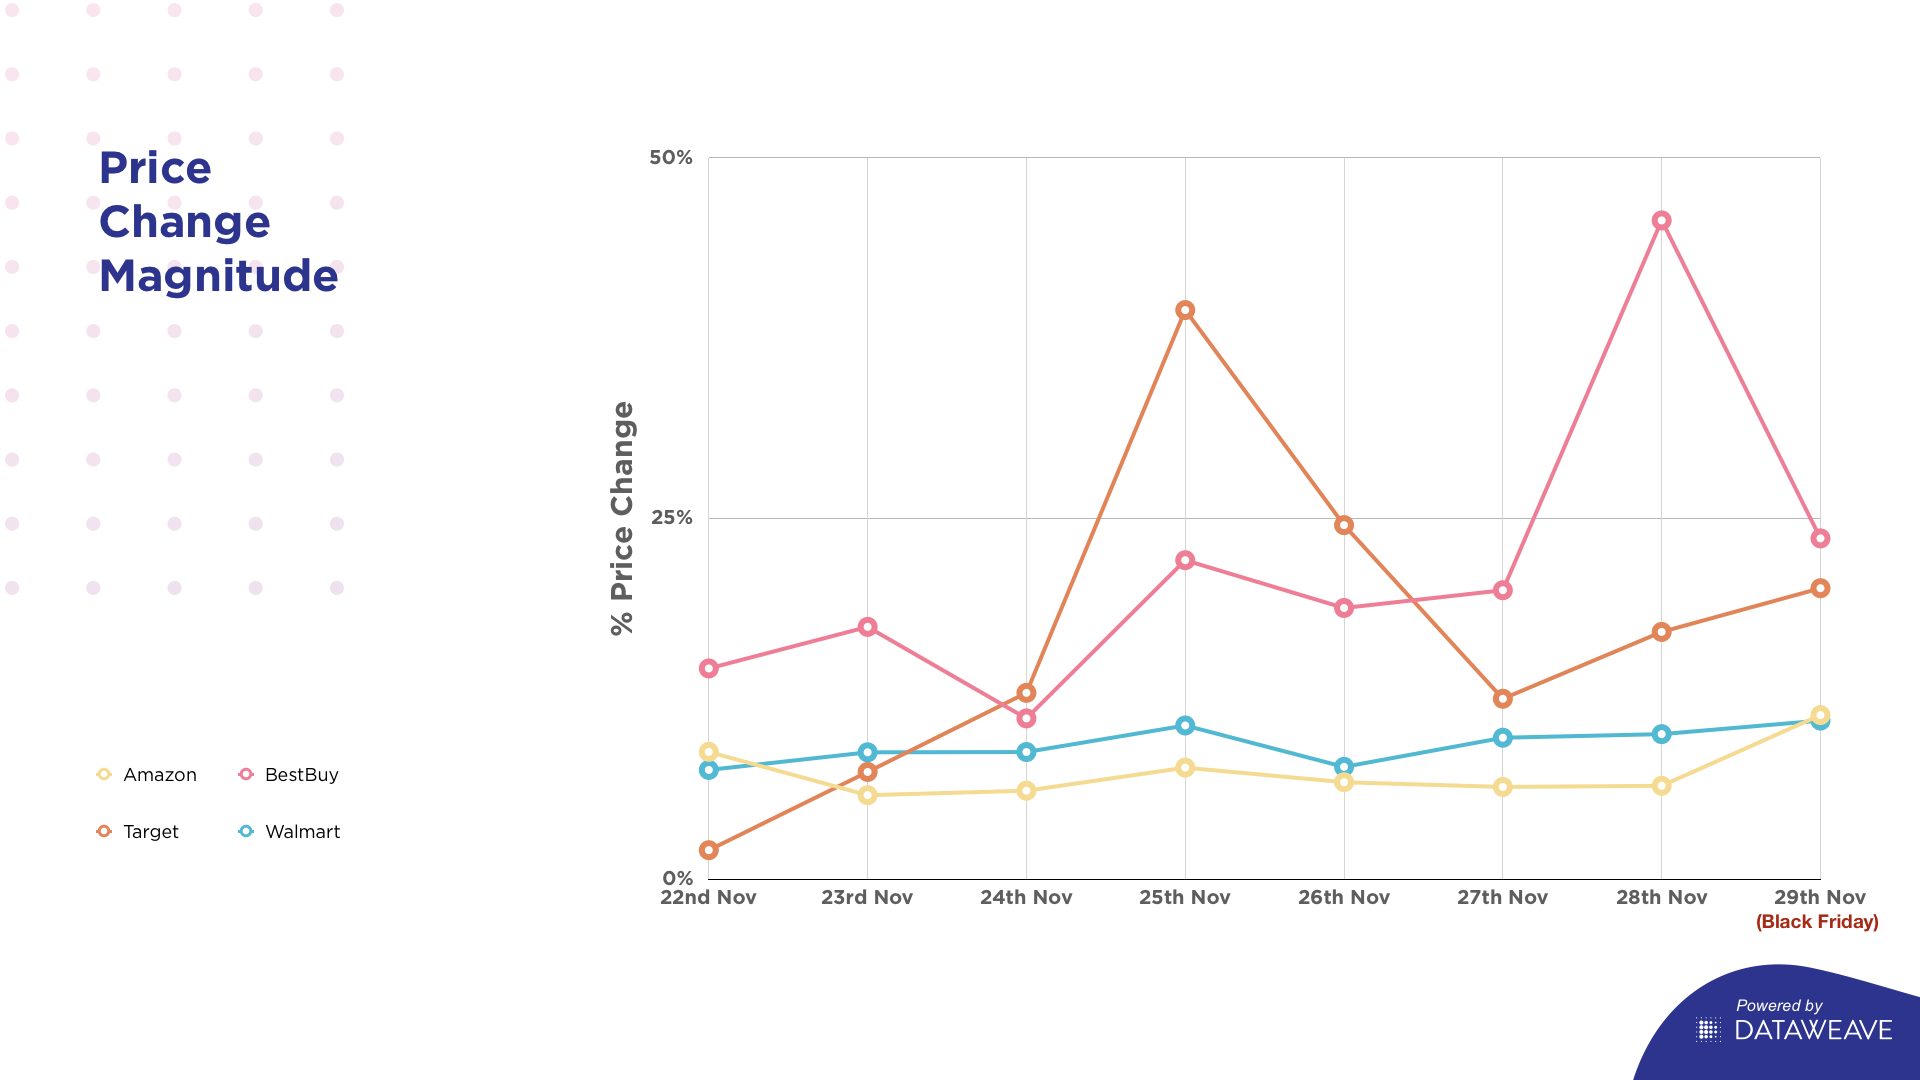
    Magnitude of price decrease

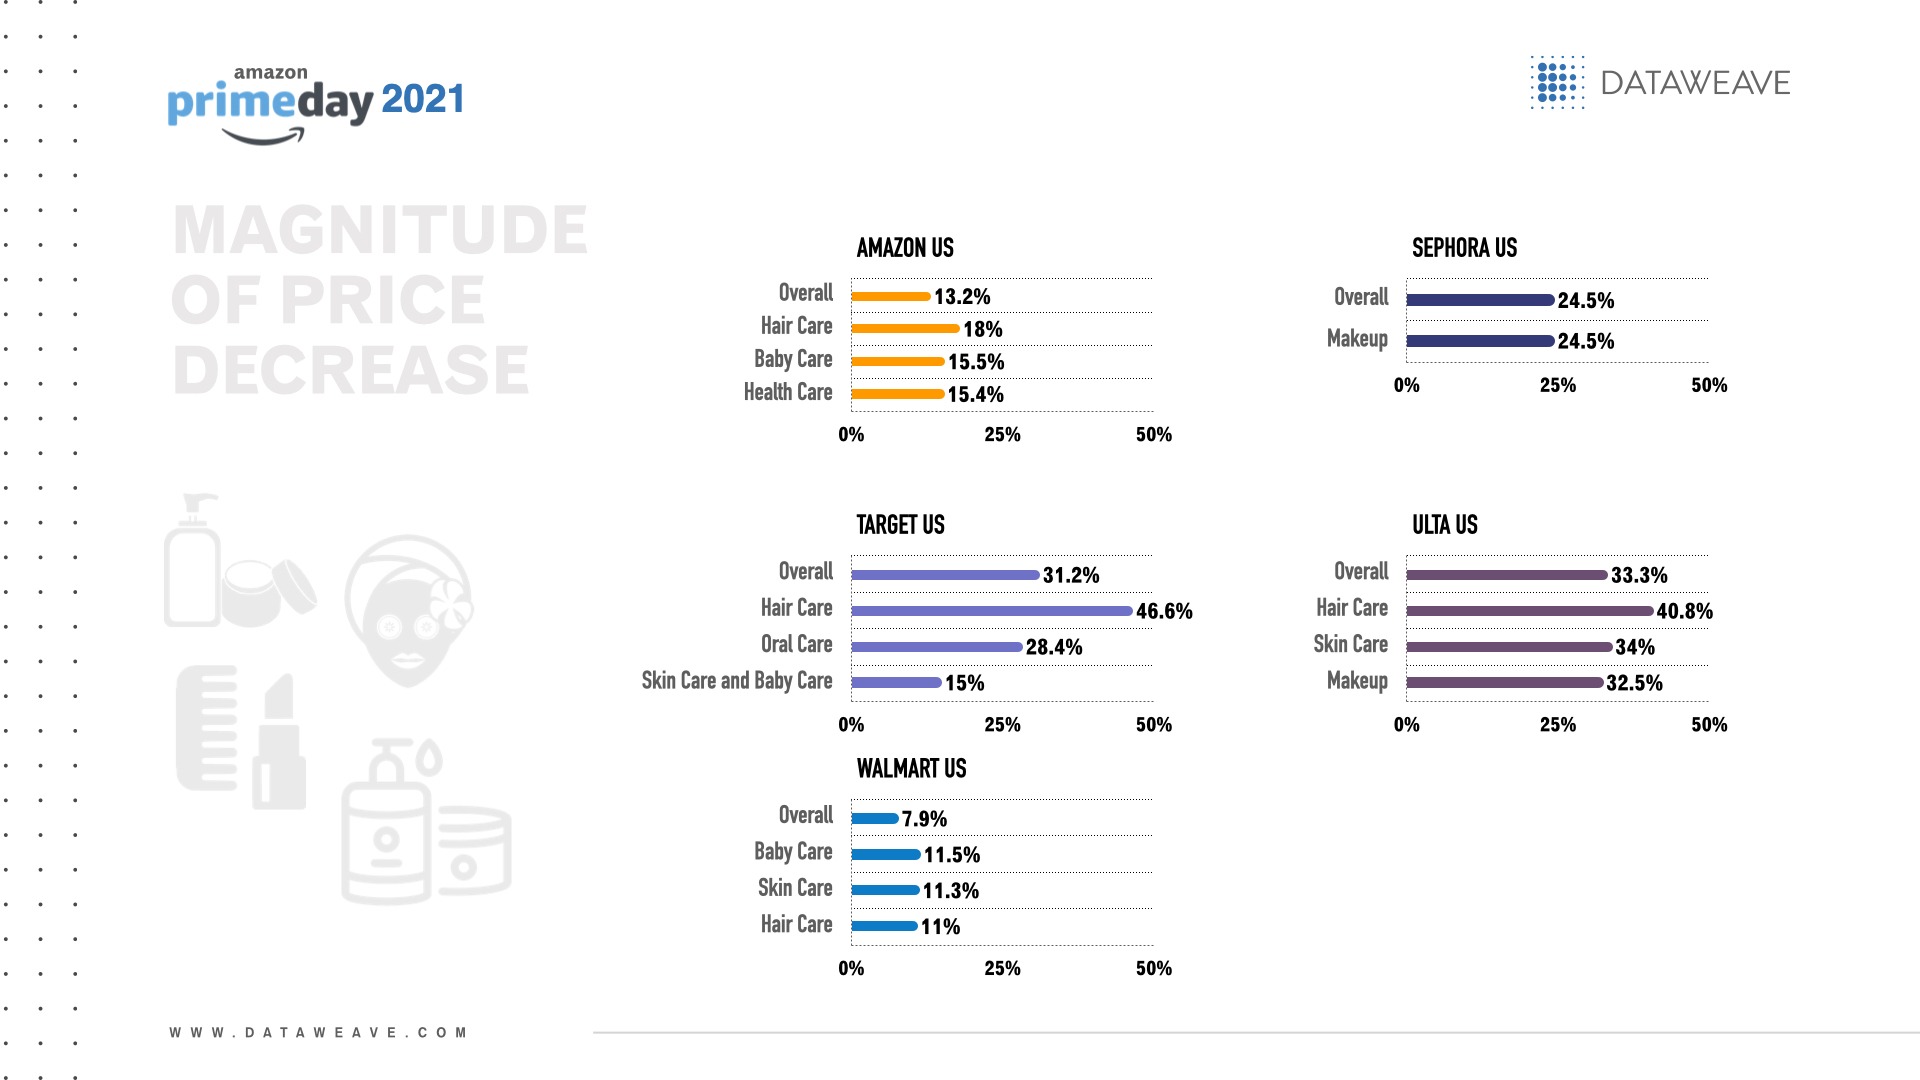
    The US retailer with the greatest overall magnitude of price decrease for Prime Day was Ulta (33.3%).

    The health & beauty subcategories with the greatest magnitude of price decrease per US retailer were:

    Amazon US: Hair care (18.0%), baby care (15.5%) and health care (15.4%)
    Sephora: Makeup (24.5%)
    Target: Hair care (46.6%), oral care (28.4%) and skin care and baby care (both 15.0%)
    Ulta: Hair care (40.8%), skin care (34.0%) and makeup (32.5%)
    Walmart: Baby care (11.5%), skin care (11.3%) and hair care (11.0%)

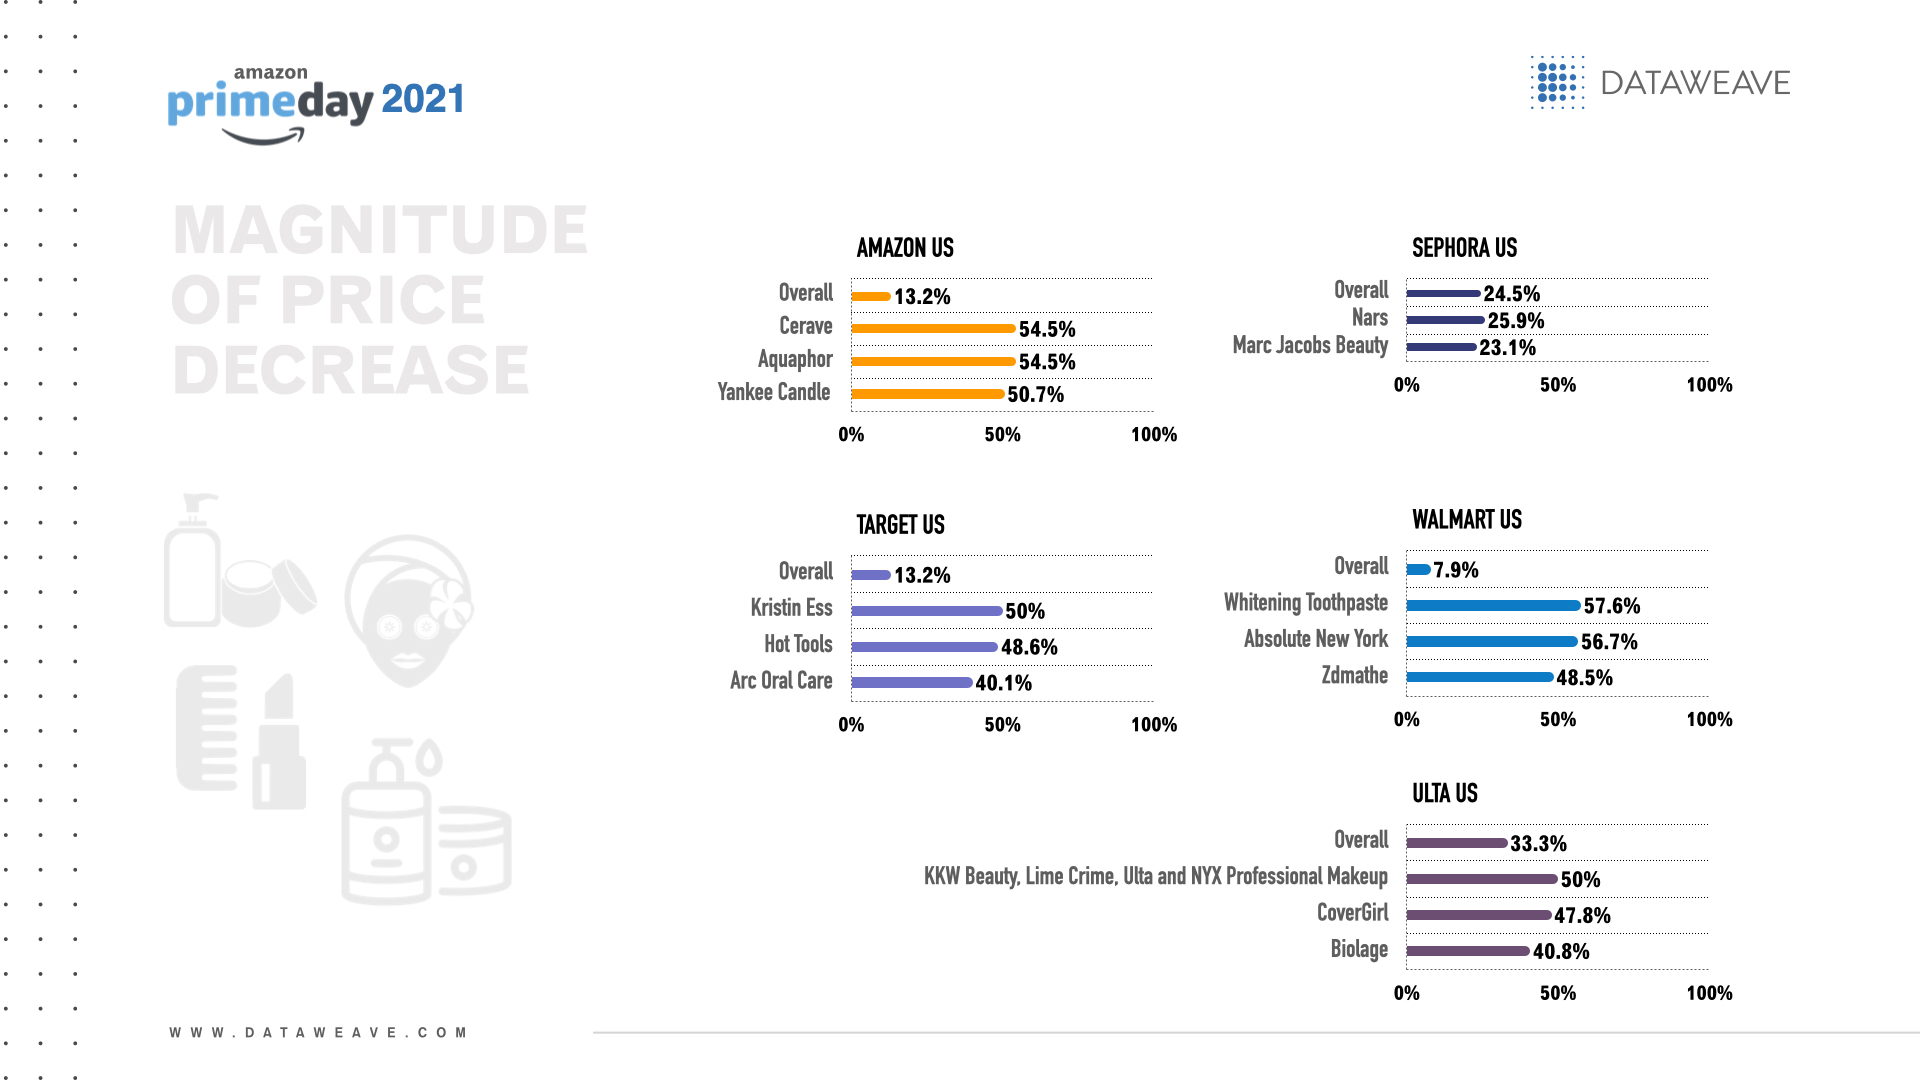
    Brands with the greatest magnitude of price decreases per US retailer included:

    Amazon US: Cerave (54.5%), Aquaphor (54.4%) and Yankee Candle (50.7%)
    Sephora: Nars (25.9%) and Marc Jacobs Beauty (23.1%)
    Target: Kristin Ess (50.0%), Hot Tools (48.6%) and Arc Oral Care (both 40.1%)
    Ulta: KKW Beauty, Lime Crime, Ulta and NYX Professional Makeup (all 50.0%), CoverGirl (47.8%) and Biolage (40.8%)
    Walmart: Whitening Toothpaste (57.6%), Absolute New York (56.7%) and Zdmathe (48.5%)

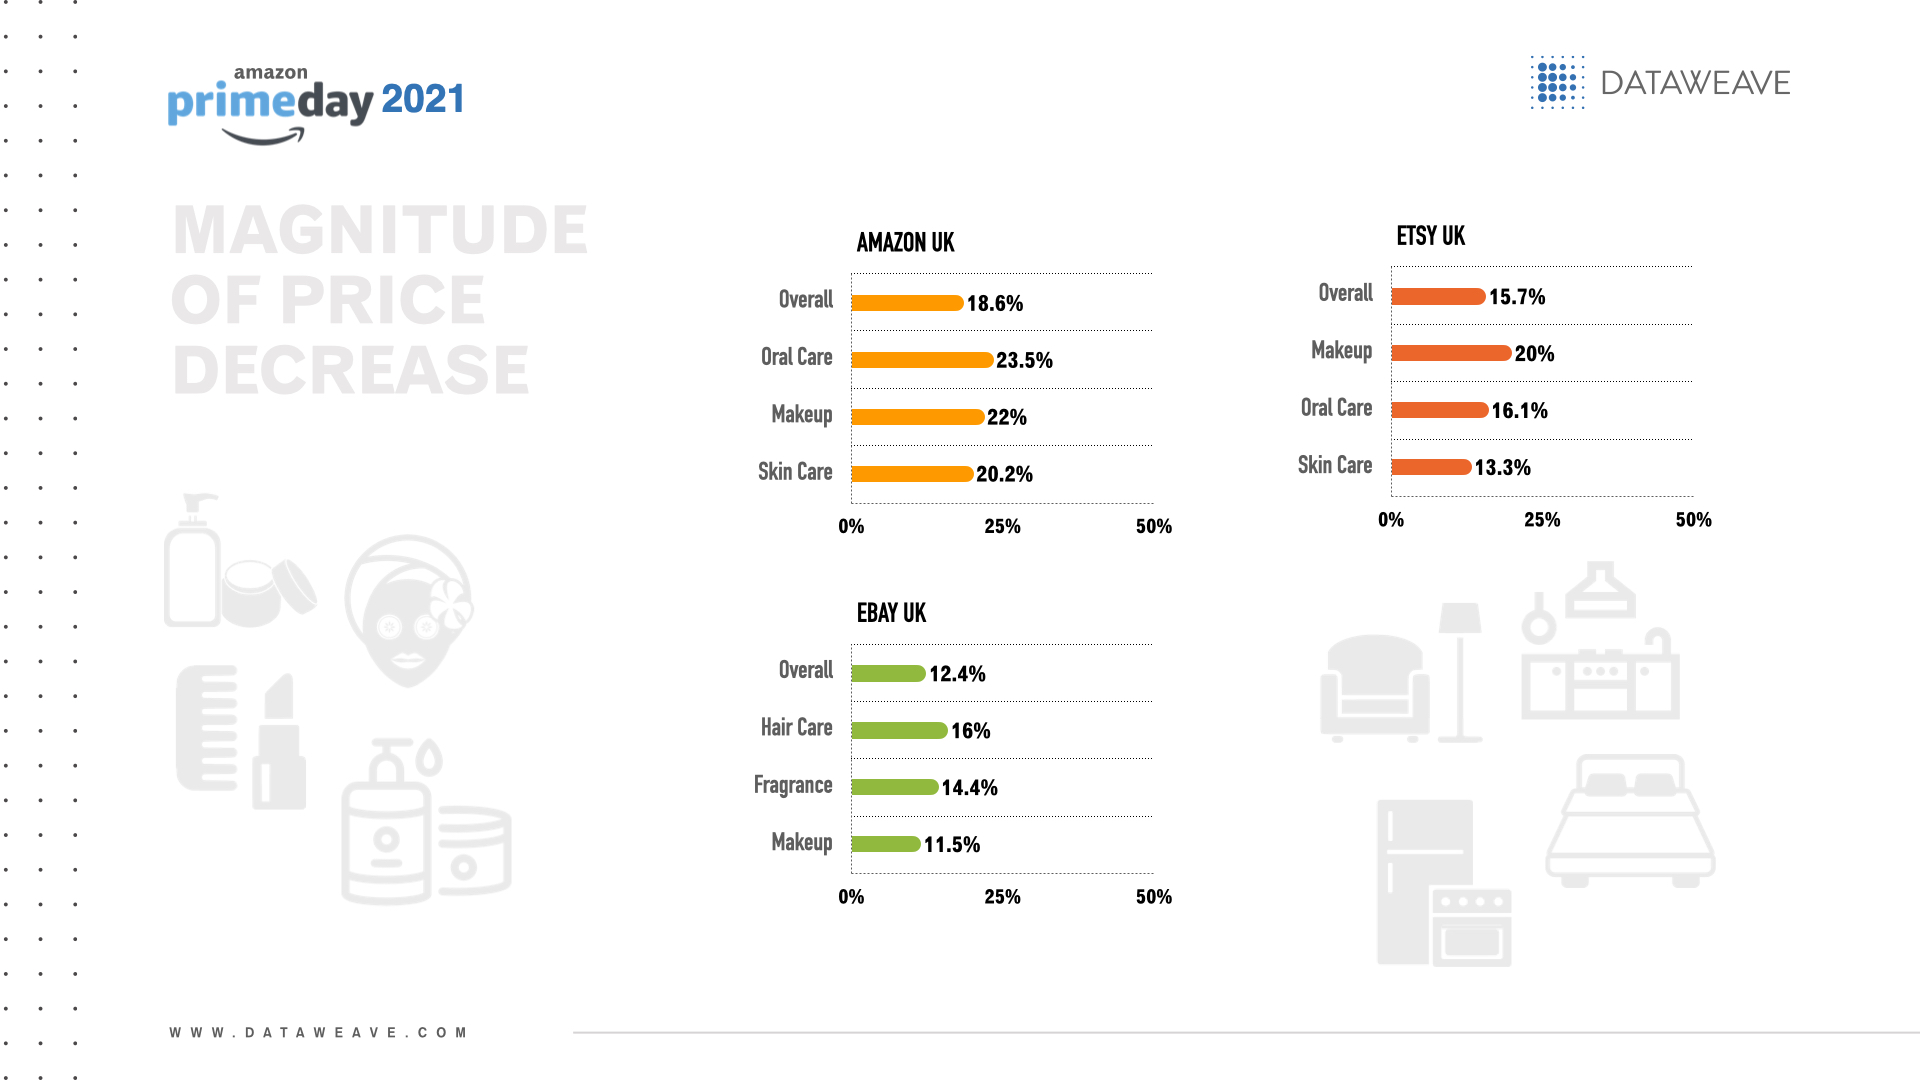
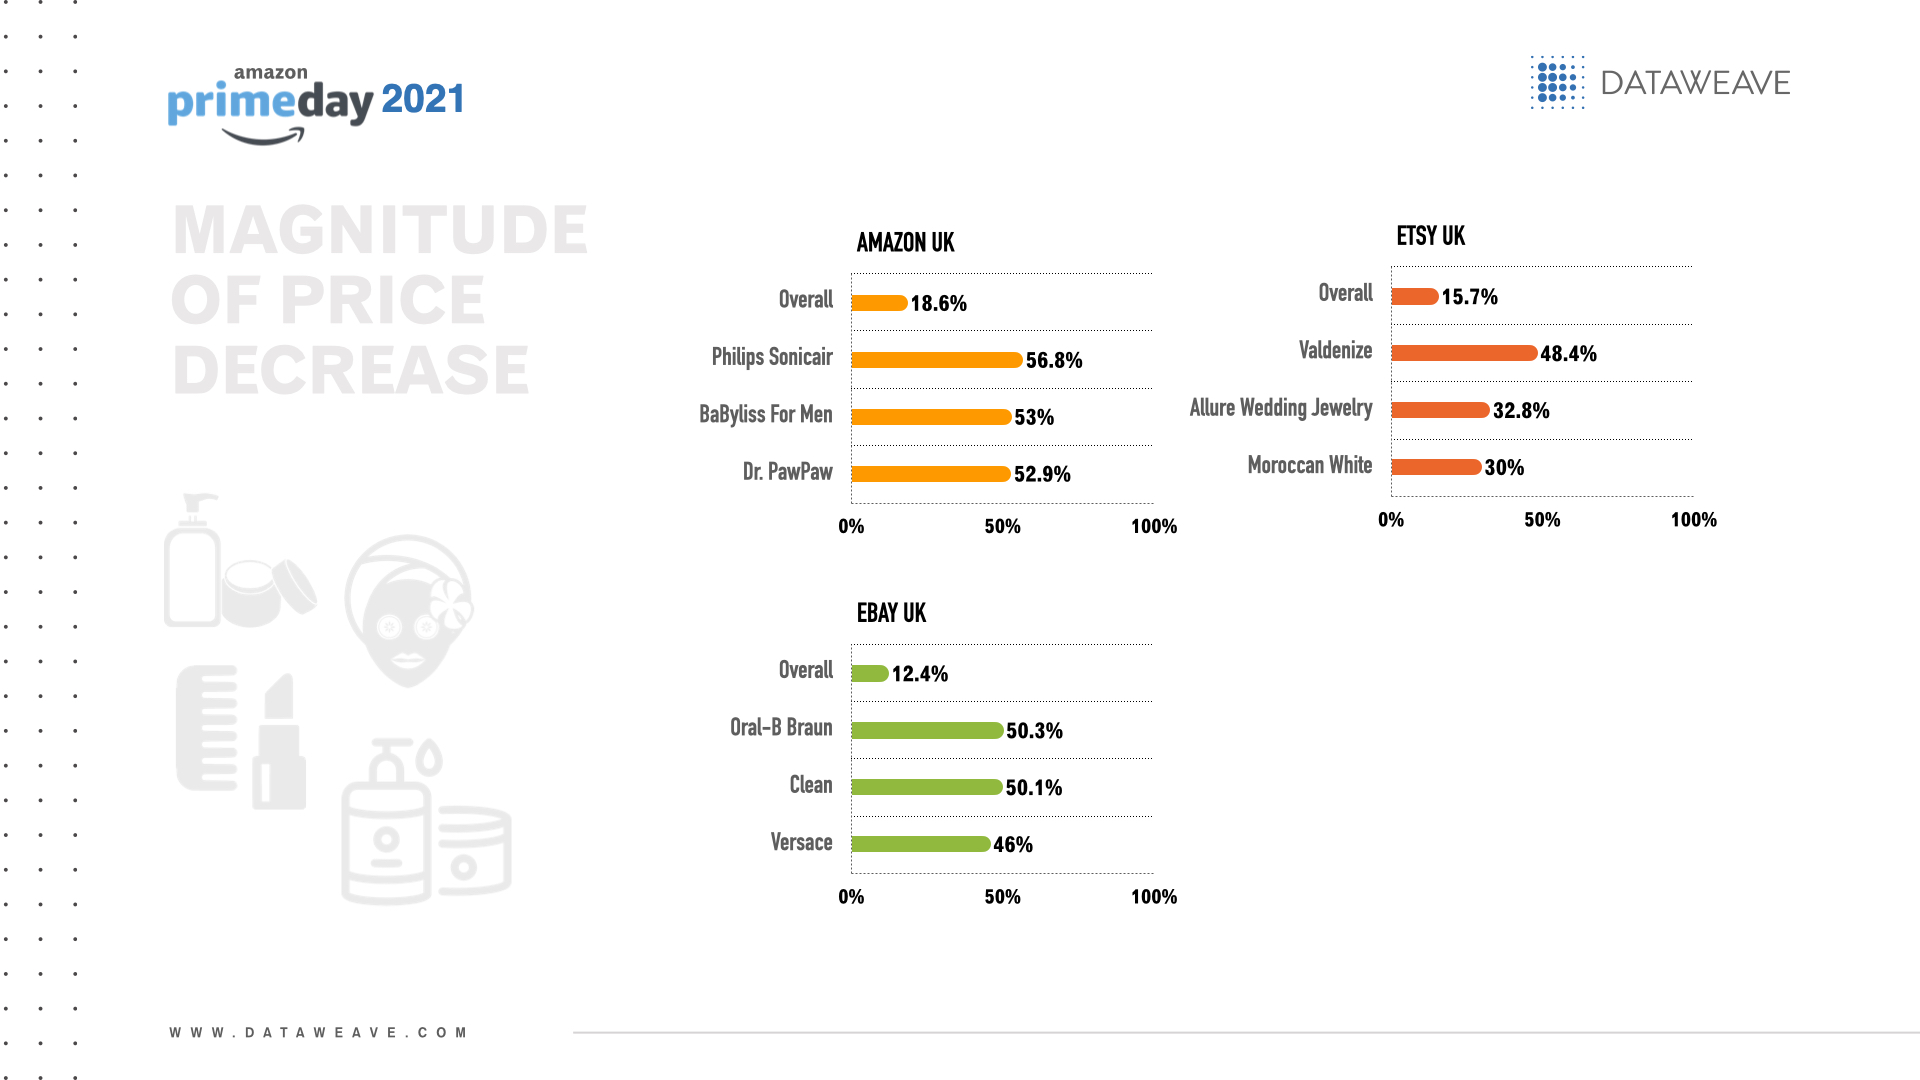
    The UK retailer with the greatest overall magnitude of price decrease on health & beauty products for Prime Day was Amazon UK (18.6%).

    The health & beauty subcategories with the greatest magnitude of price decrease per UK retailer were:

    Amazon UK: Oral care (23.5%), makeup (22.0%) and skin care (20.2%)
    Ebay: Hair care (16.0%), fragrance (14.4%) and makeup (11.5%)
    Etsy: Makeup (20.0%), oral care (16.1%) and skin care (13.3%)

    Brands with the greatest magnitude of price decreases across health & beauty sub-categories per UK retailer included:

    Amazon UK: Philips Sonicair (56.8%), BaByliss For Men (53.0%) and Dr. PawPaw (52.9%)
    Ebay: Oral-B Braun (50.3%), Clean (50.1%) and Versace (46.0%)
    Etsy: Valdenize (both 48.4%), Allure Wedding Jewelry (32.8%) and Moroccan White (30.0%)

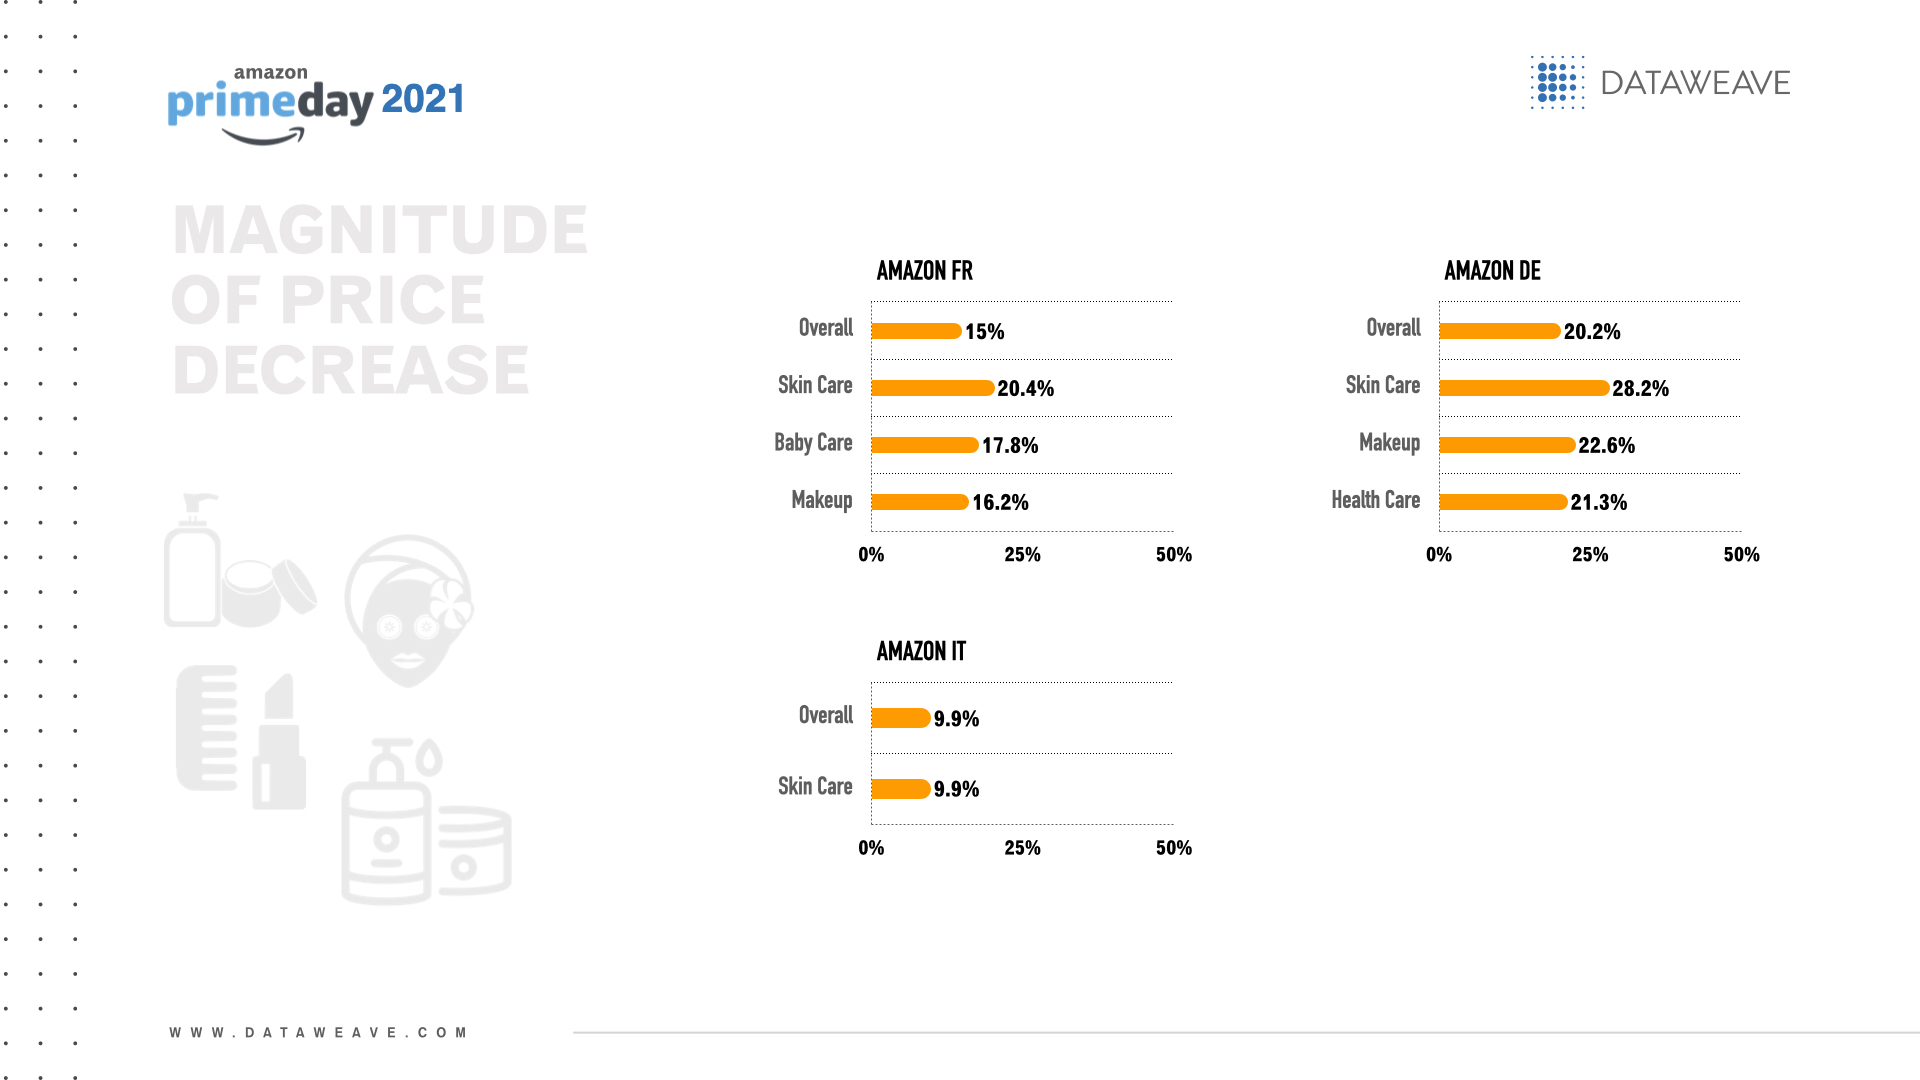
    Among European retailers, Amazon Germany offered the greatest overall magnitude of price decrease on health & beauty products for Prime Day (20.2%).

    The health & beauty subcategories with the greatest magnitude of price decrease per European retailer were:

    Amazon France: Skin care (20.4%), baby care (17.8%) and makeup (16.2%)
    Amazon Germany: Skin care (28.2%), makeup (22.6%) and health care (21.3%)
    Amazon Italy: Skin care (9.9%)

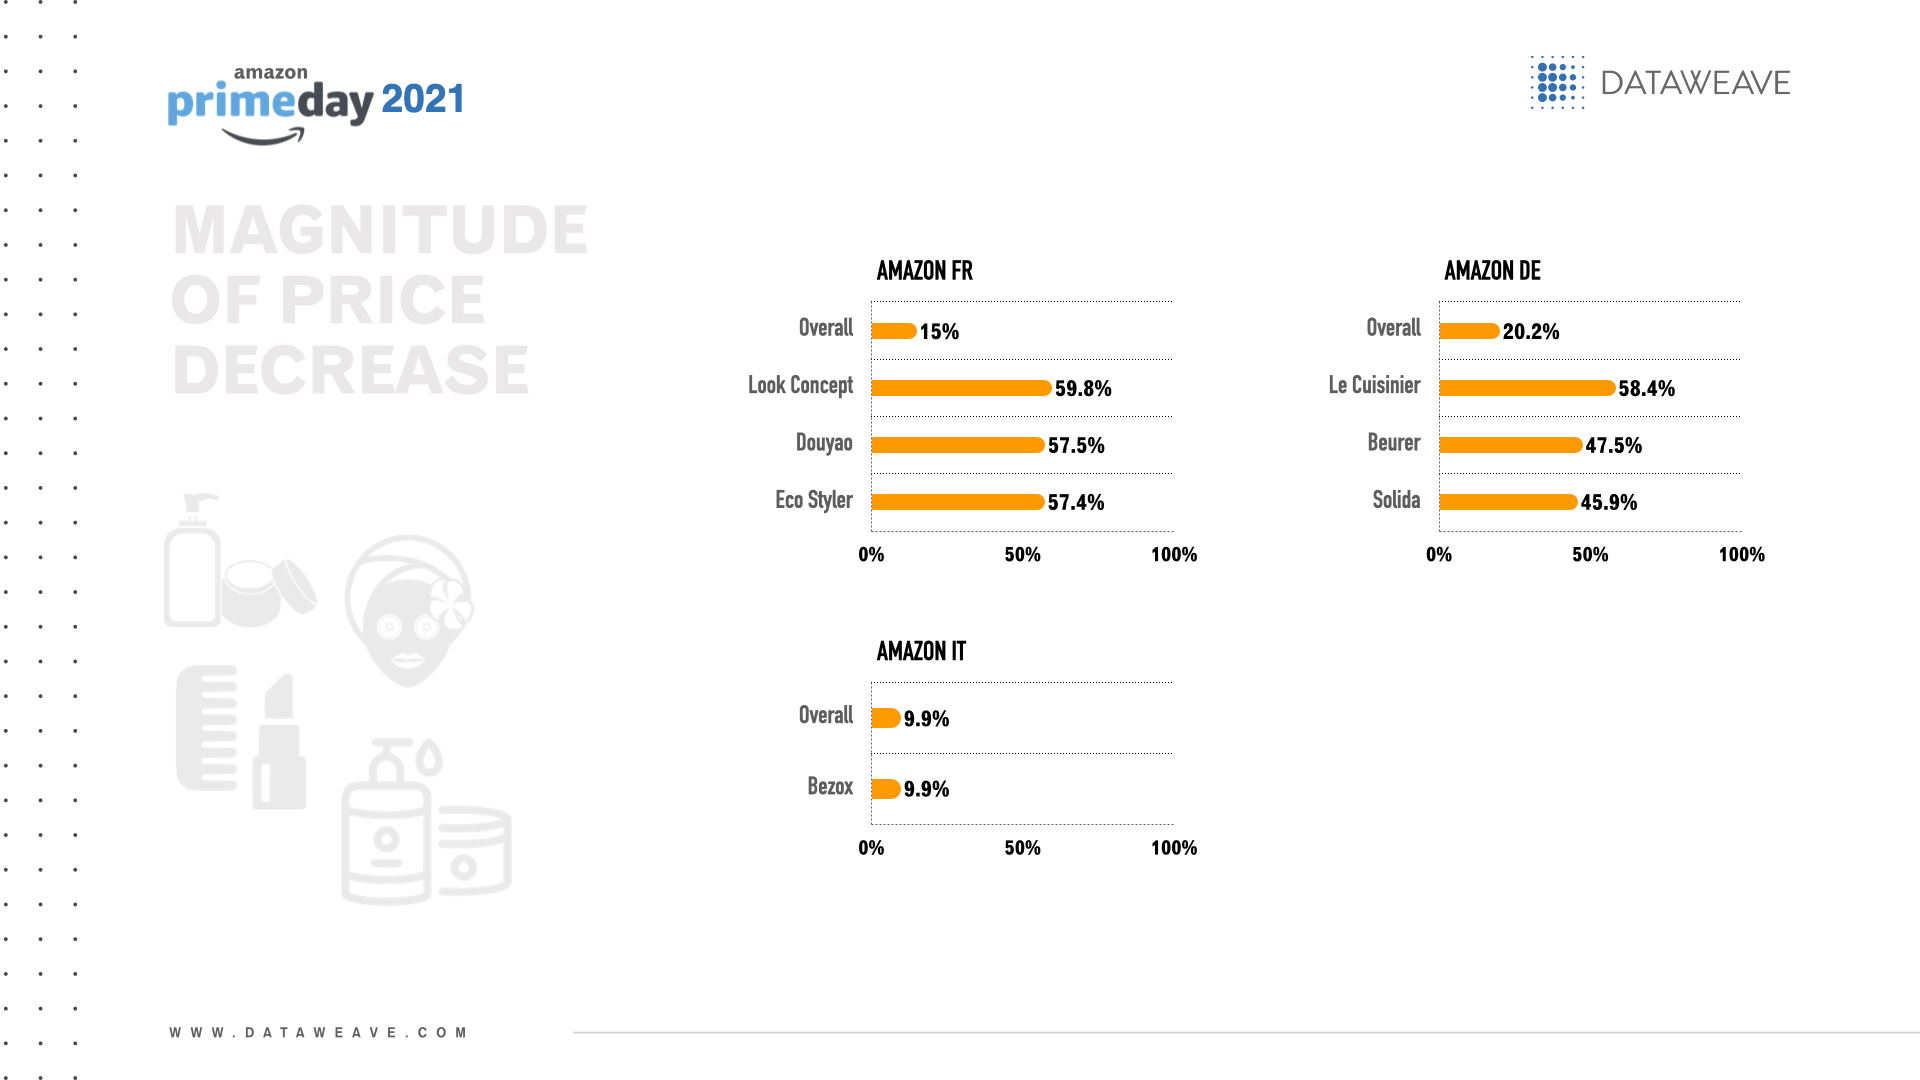
    Brands with the greatest magnitude of price decreases per European retailer included:

    Amazon France: Look Concept (59.8%), Douyao (57.5%) and Eco Styler (57.4% for both hair care and health care)
    Amazon Germany: Le Cuisinier (58.4%), Beurer (47.5%) and Solida (45.9%)
    Amazon Italy: Bezox (9.9%)

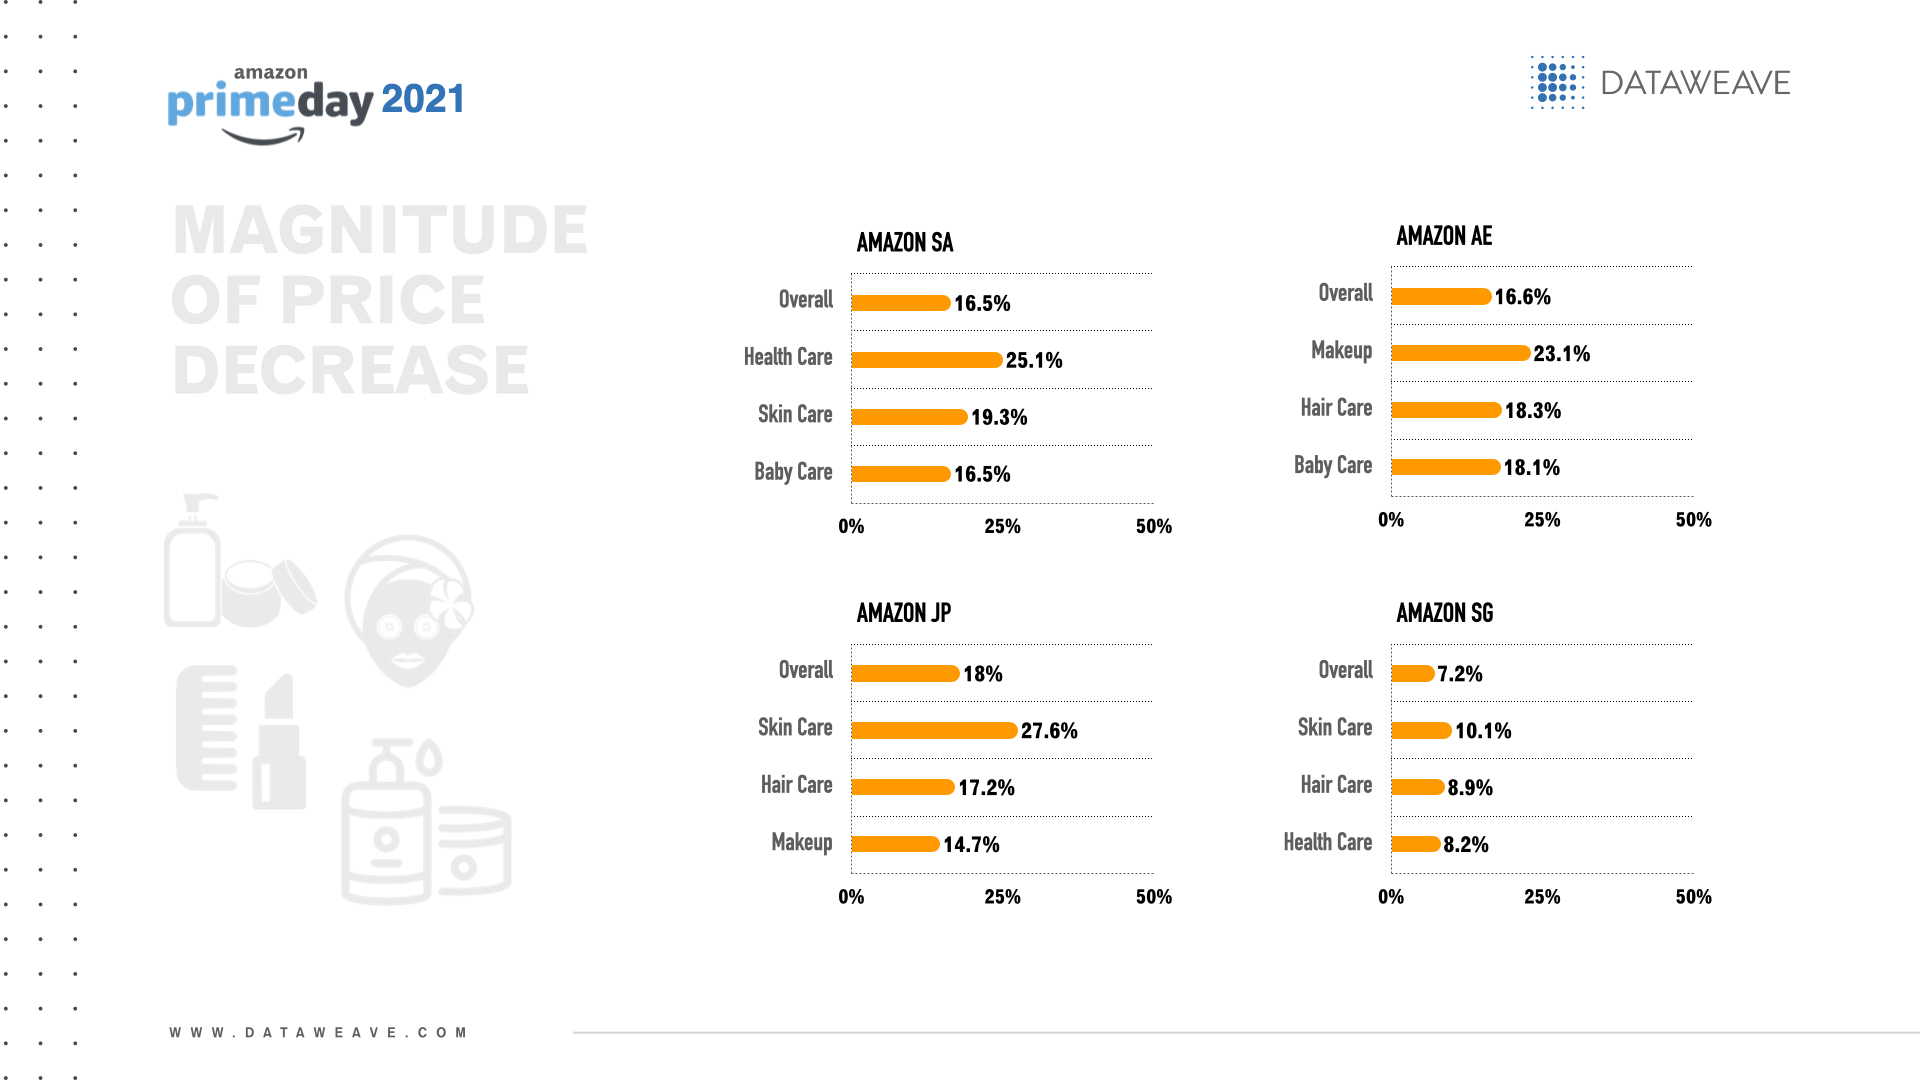
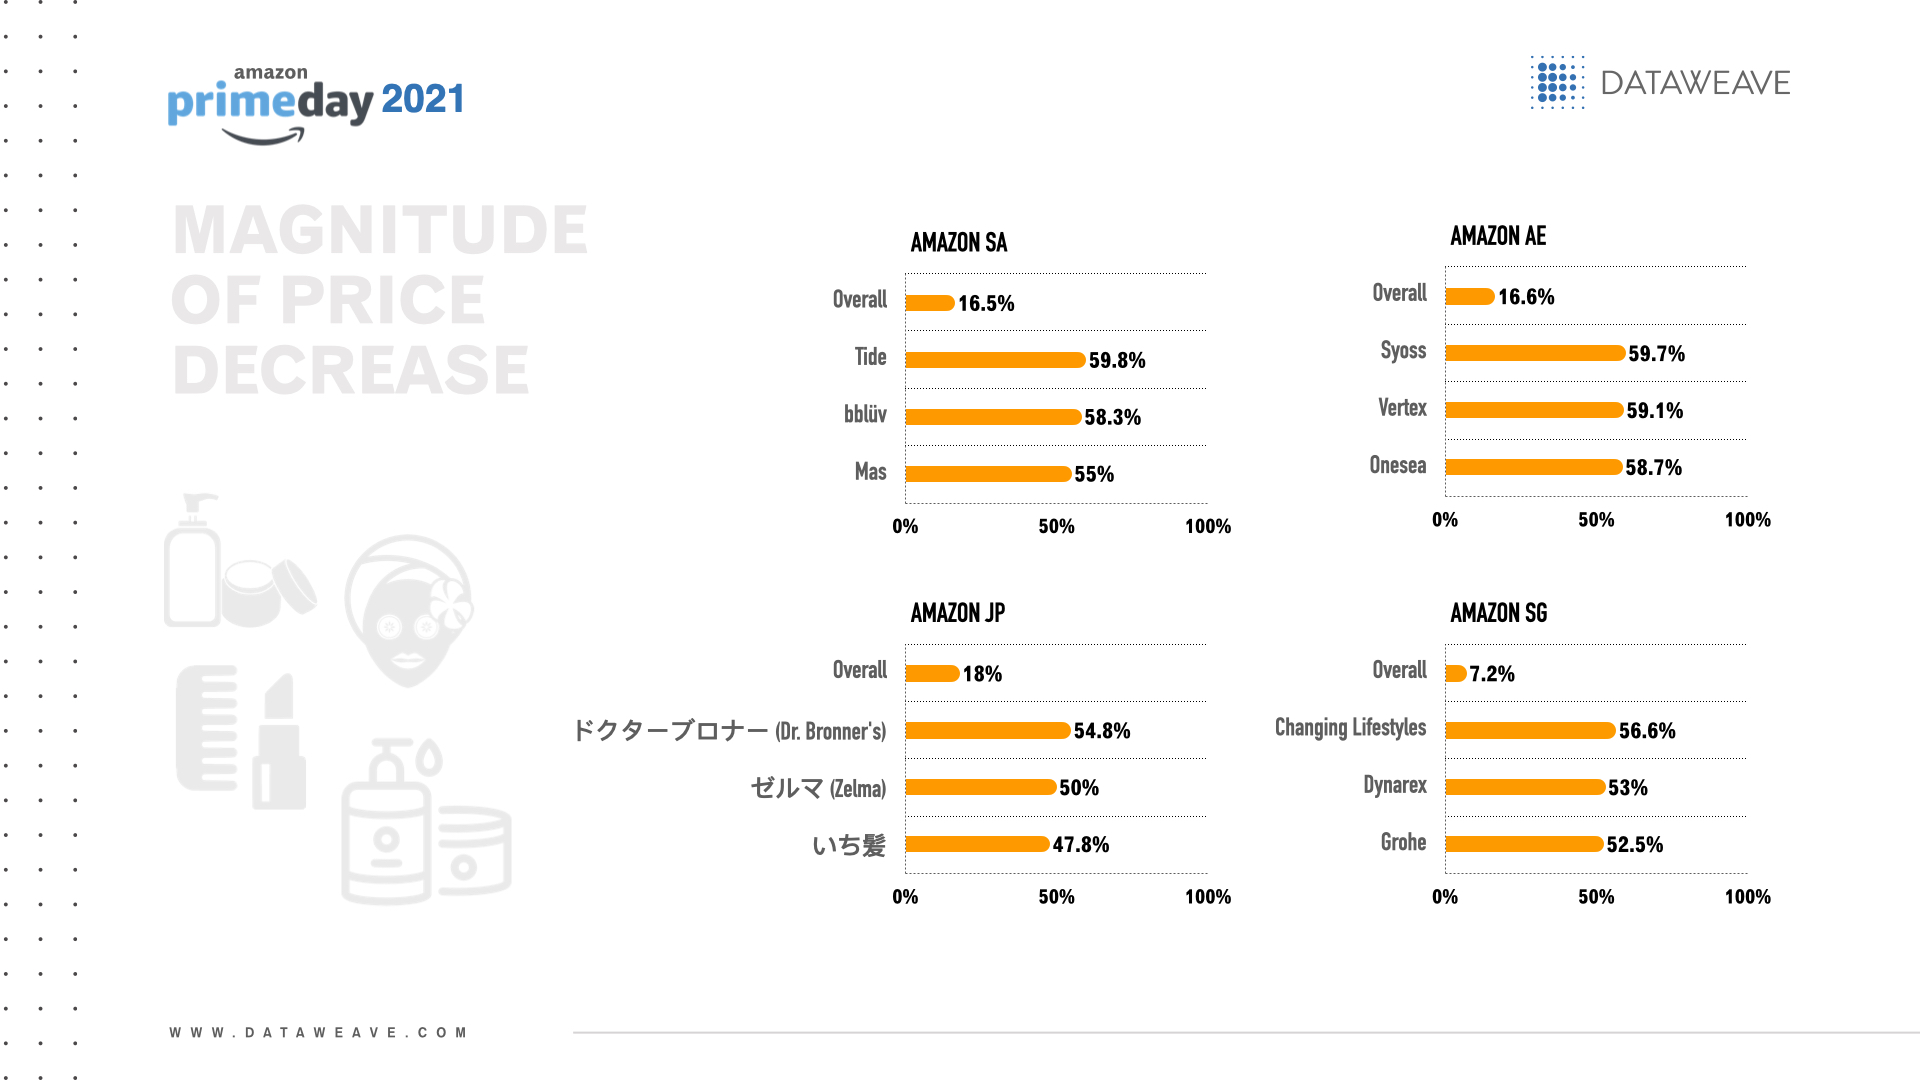
    Across the Middle East and Asia, Amazon Japan offered the greatest overall magnitude of price decrease on health & beauty products for Prime Day (18.0%).

    The health & beauty subcategories with the greatest magnitude of price decrease per retailer were:

    Amazon Saudi Arabia: Health care (25.1%), skin care (19.3%) and baby care (16.5%)
    Amazon UAE: Makeup (23.1%), hair care (18.3%) and baby care (18.1%)
    Amazon Japan: Skin care (27.6%), hair care (17.2%) and makeup (14.7%)
    Amazon Singapore: Skin care (10.1%), hair care (8.9%) and health care (8.2%)

    Brands with the greatest magnitude of price decreases per retailer in the Middle East and Asia included:

    Amazon Saudi Arabia: Tide (59.8%), bblüv (58.3%) and Mas (55.0%)
    Amazon UAE: Syoss (59.7%), Vertex (59.1%) and Onesea (58.7%)
    Amazon Japan: ドクターブロナー (Dr. Bronner’s) (54.8%), ゼルマ (Zelma) (50.0%) and いち髪 (47.8%)
    Amazon Singapore: Changing Lifestyles (56.6%), Dynarex (53.0%) and Grohe (52.5%)

    Discounts before, during and after the event

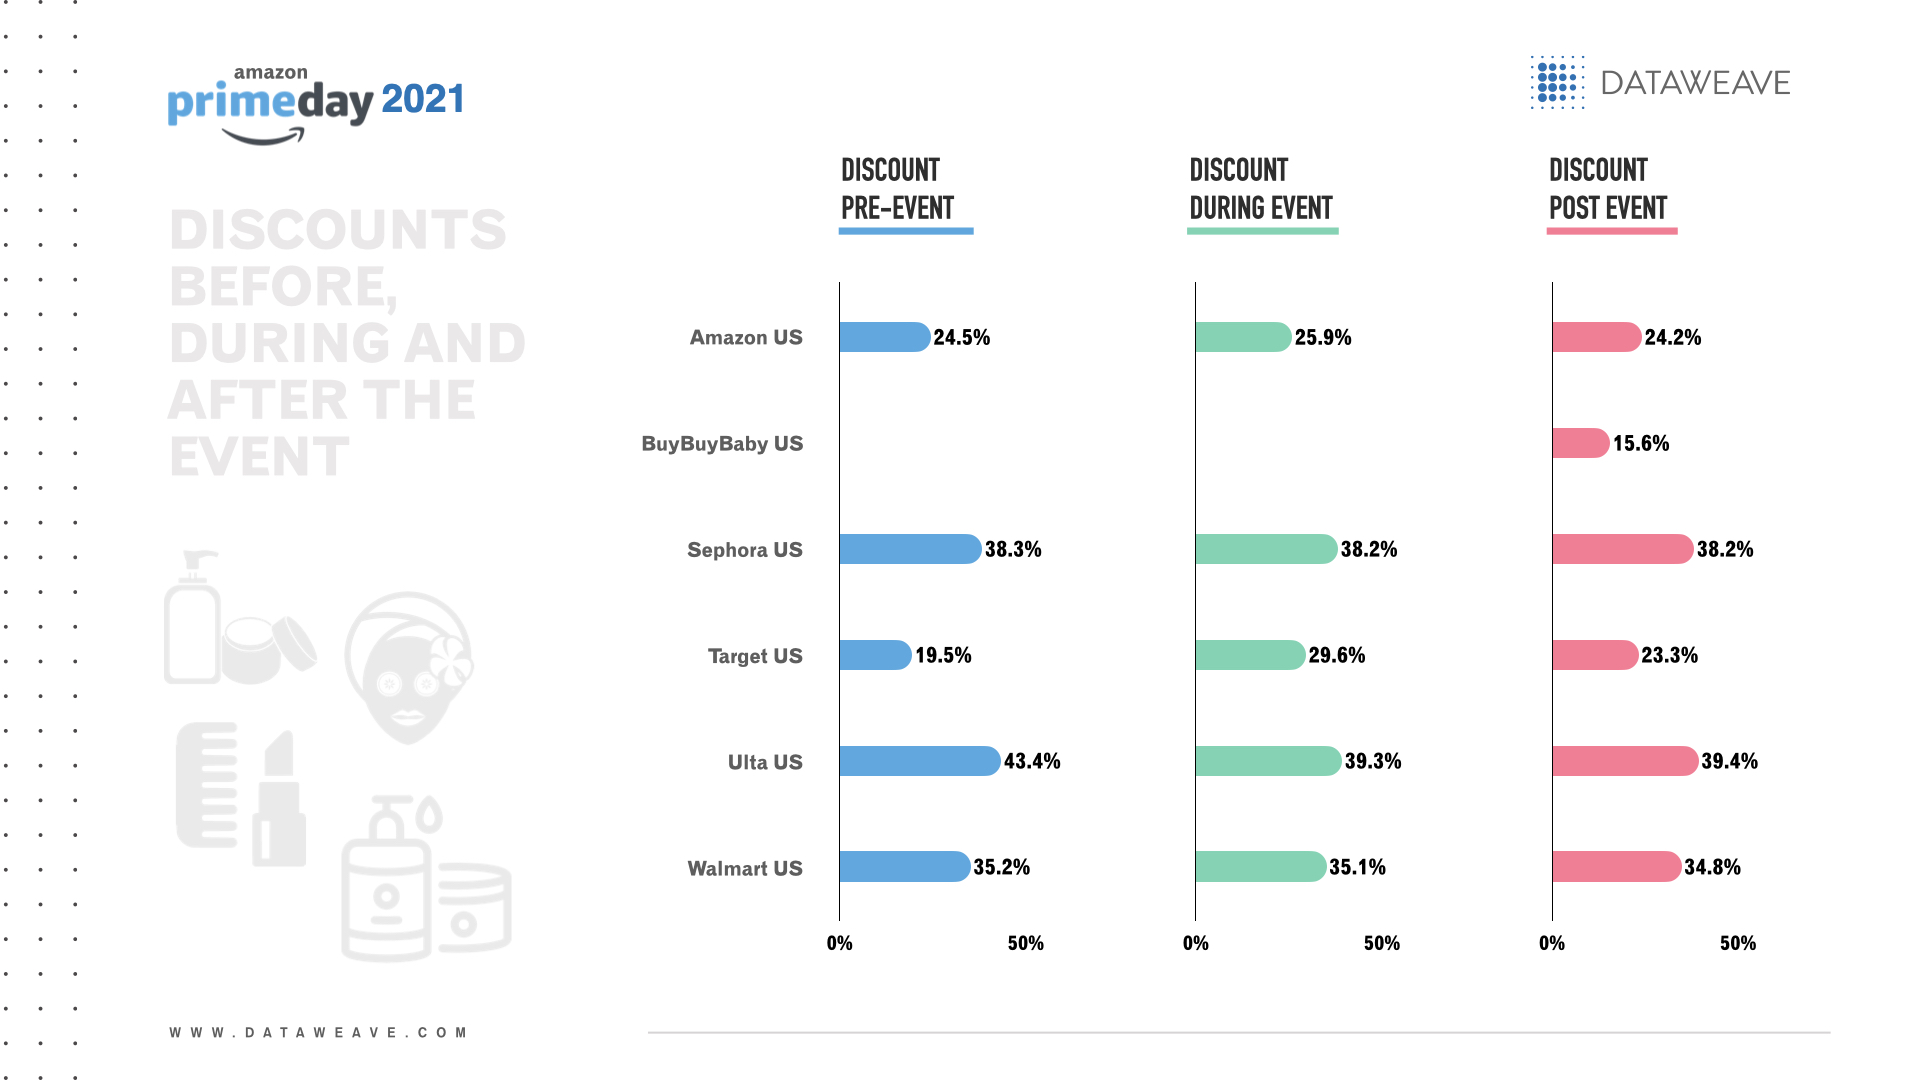
    In the US, specialty beauty retailers’ discounts stood out during Prime Day sales. The US retailer with the biggest overall health & beauty discount before (43.4%), during (39.3%) and after (39.4%) Prime Day was Ulta. During and after Prime Day, Sephora was a close second at 38.2% for both periods.

    Ulta’s biggest pre-event discounts were on makeup (44.2%) and skin care (33.0%). Hair care (40.8%). makeup (39.5%) and skin care (36.0%) were the leading subcategories for Ulta’s discounts during Prime Day. After the event, Ulta’s biggest discounts were for hair care (40.8%), makeup (39.6%) and skin care (37.3%)

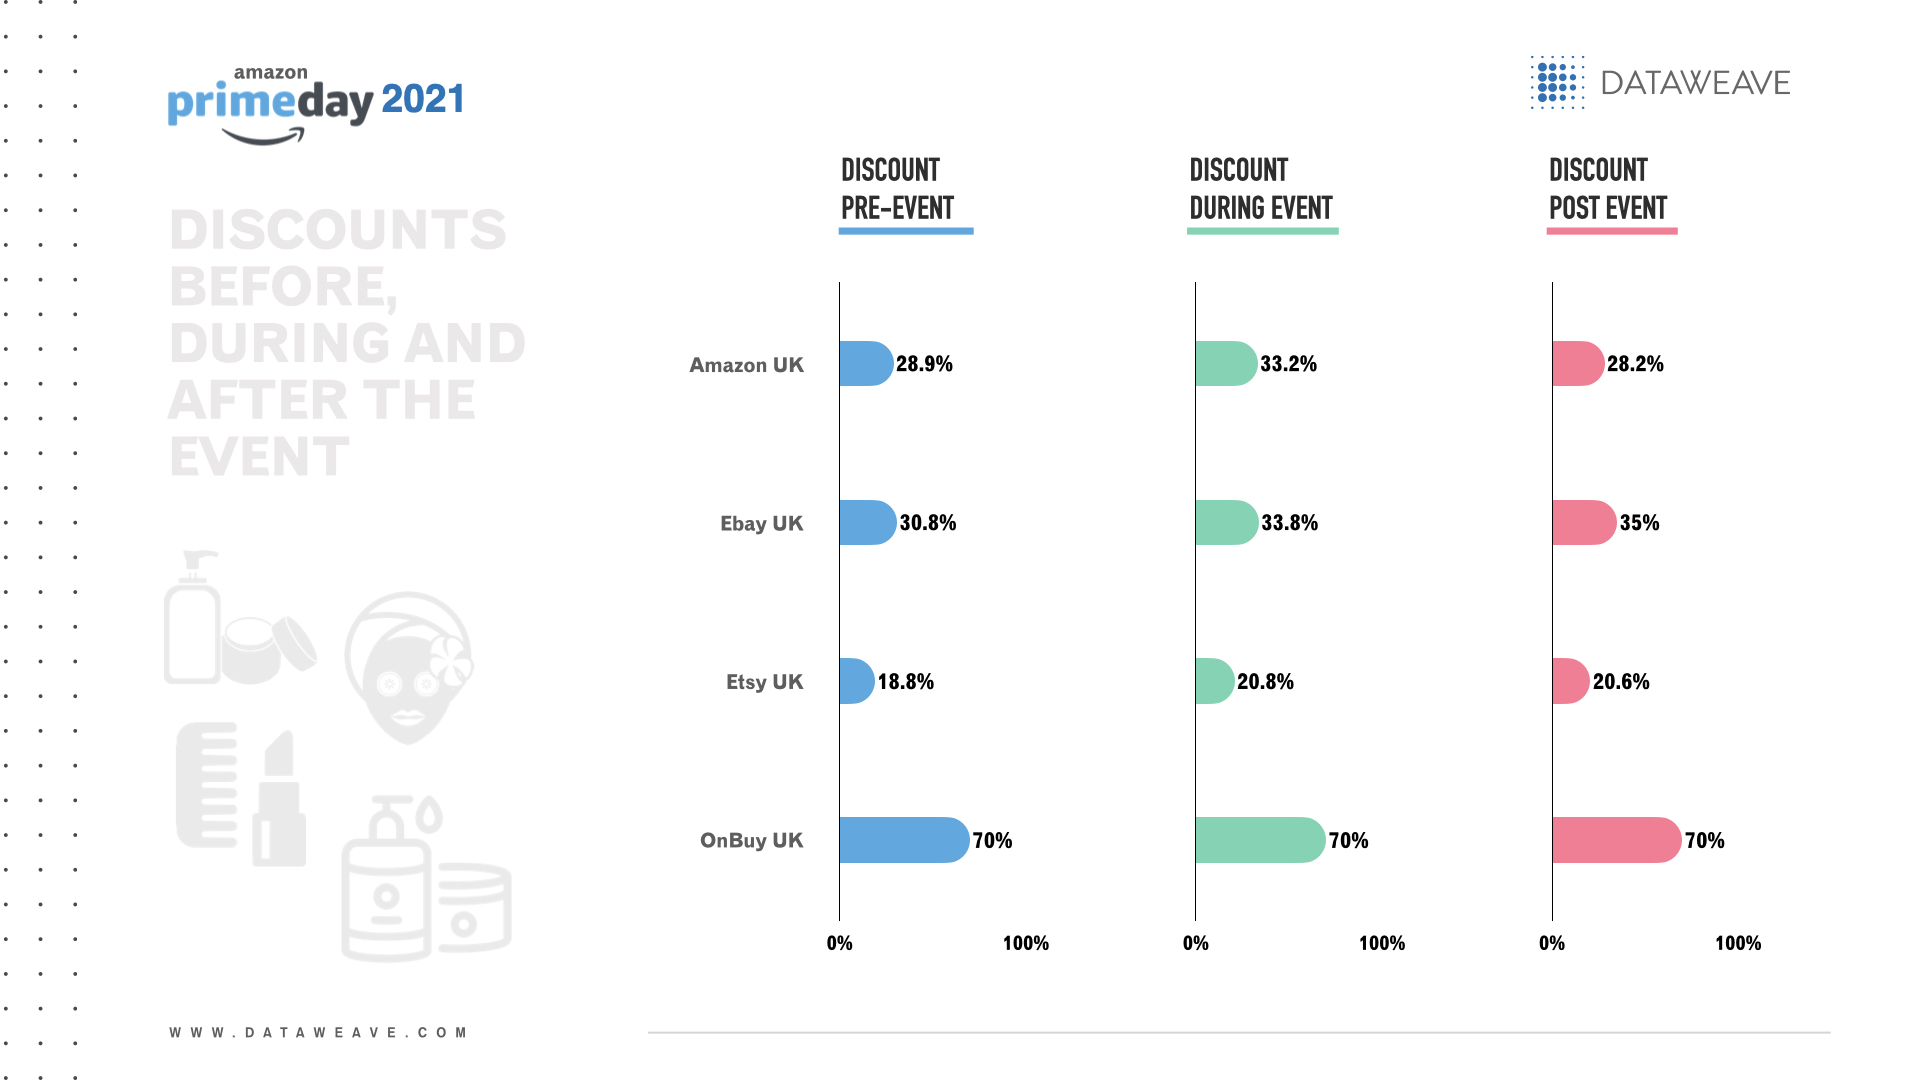
    In the UK, OnBuy offered the highest discounts before, during and after Prime Day at 70.0% off baby care products. Yet the total product count was only 2.

    Among the remaining rivals, all of whom had a product count above 1000, Ebay had the highest discounts before (30.8%), during (33.8%) and after (35.0%) Prime Day.

    Before Prime Day, Ebay biggest discounts were on hair care (48.9%), fragrance (23.9%) and makeup (23.4%). Ebay’s top discounts during Prime Day were on hair care (50.3%), makeup (24.9%) and fragrance (24.8%). Similarly, after the event, Ebay had the biggest discounts on hair care (49.9%), makeup (26.7%) and fragrance (26.2%).

    Across retailers in the Middle East & Asia, Amazon UAE offered the biggest overall health & beauty discounts before (26.0%), during (30.7%) and after (26.0%) Prime Day.

    In the pre-sales event, Amazon UAE offered the most generous discounts on makeup (30.7%), fragrance (29.9%) and health care (29.2%).

    During Prime Day, Amazon UAE’s biggest discounts were on makeup (37.2%), fragrance (31.6%) and health care (31.3%).

    During Prime Day, Amazon UAE offered the biggest discounts on fragrance (30.5%), makeup (30.0%) and health care and baby care (both 26.8%).
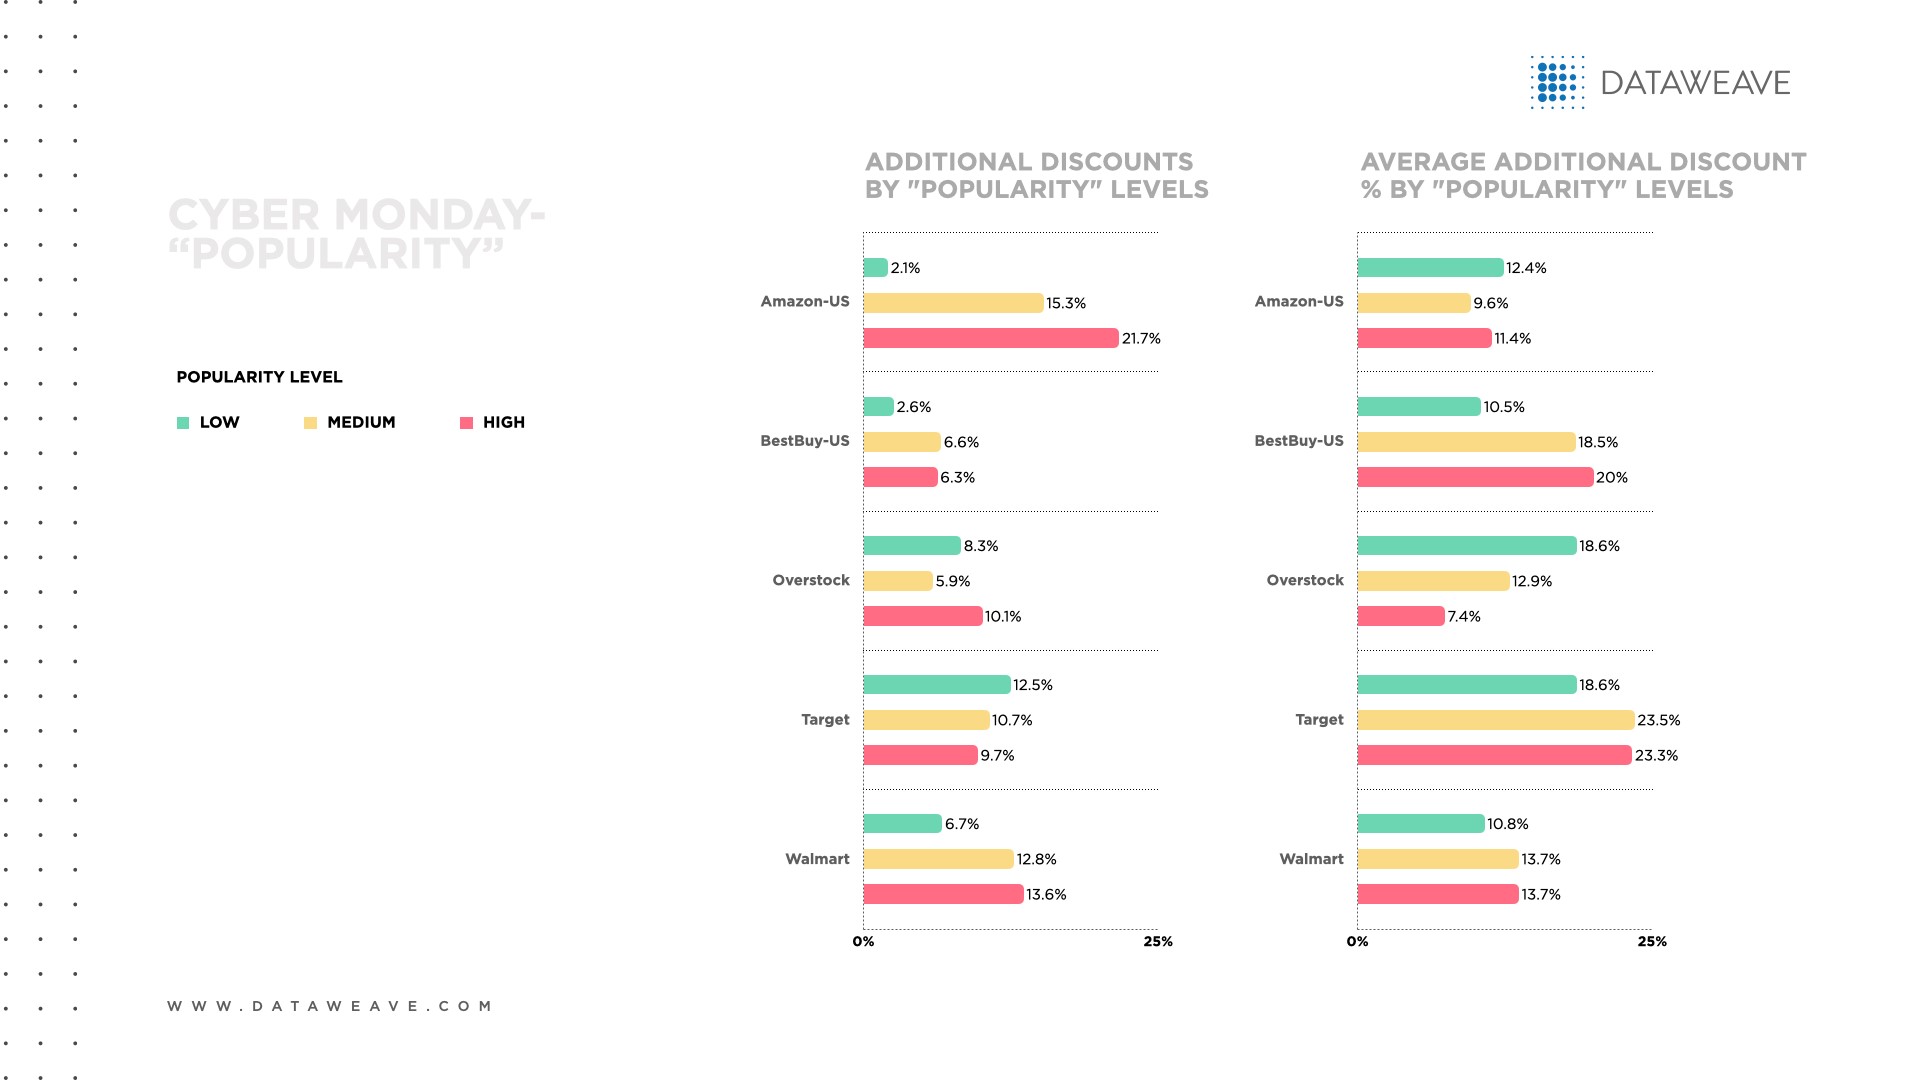
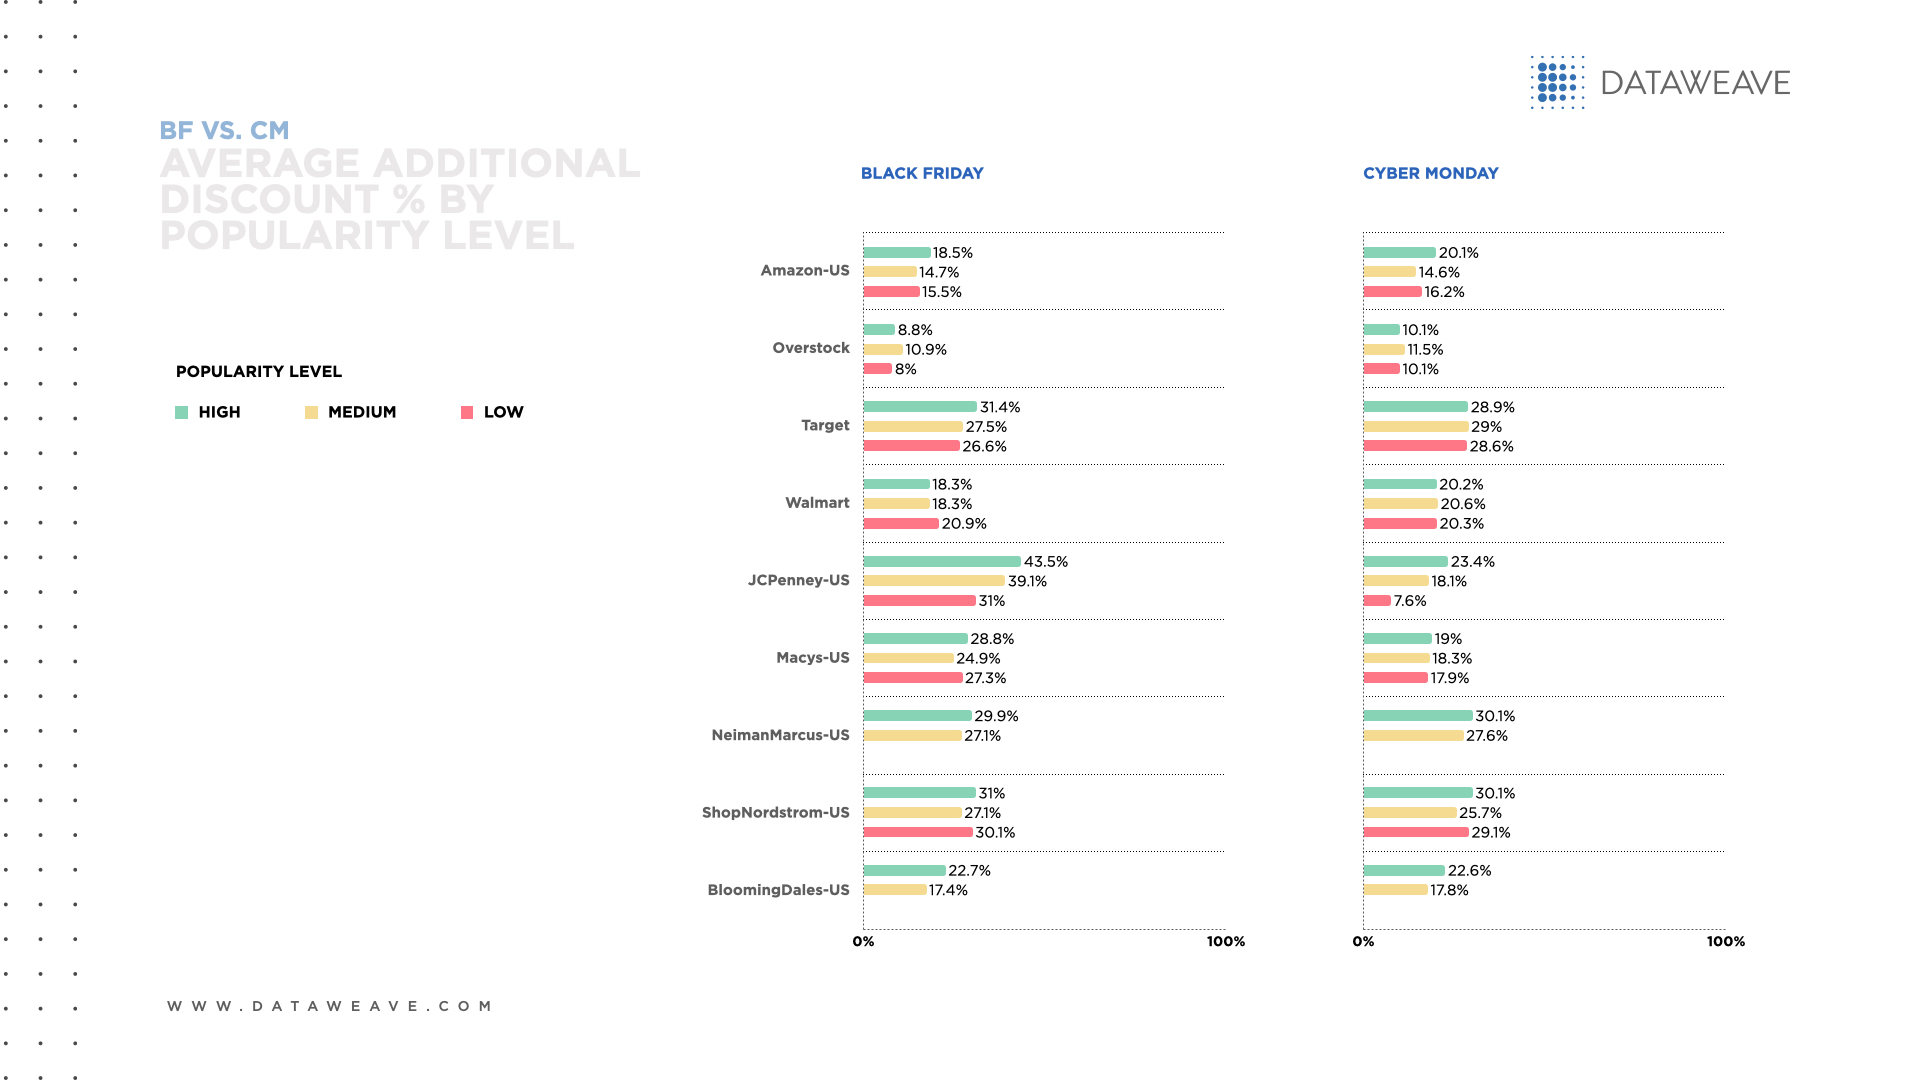
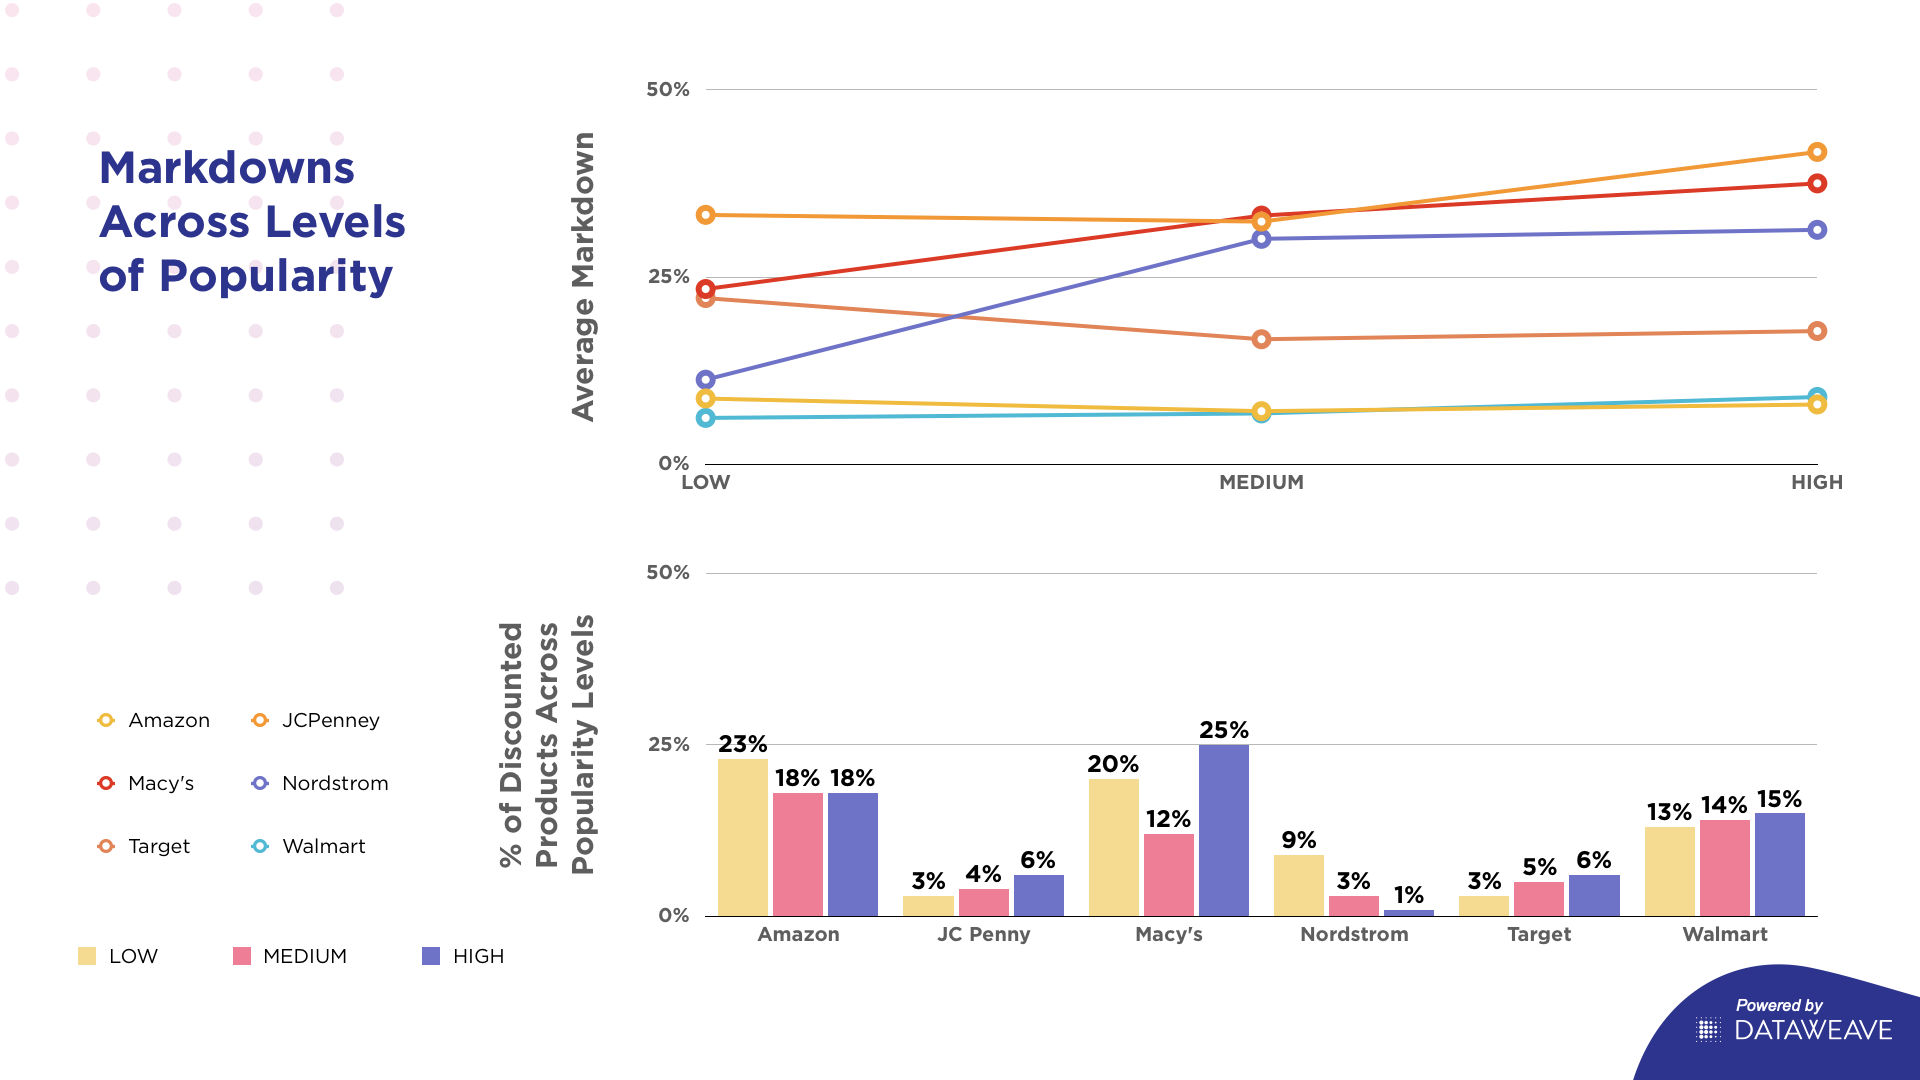
    Popularity

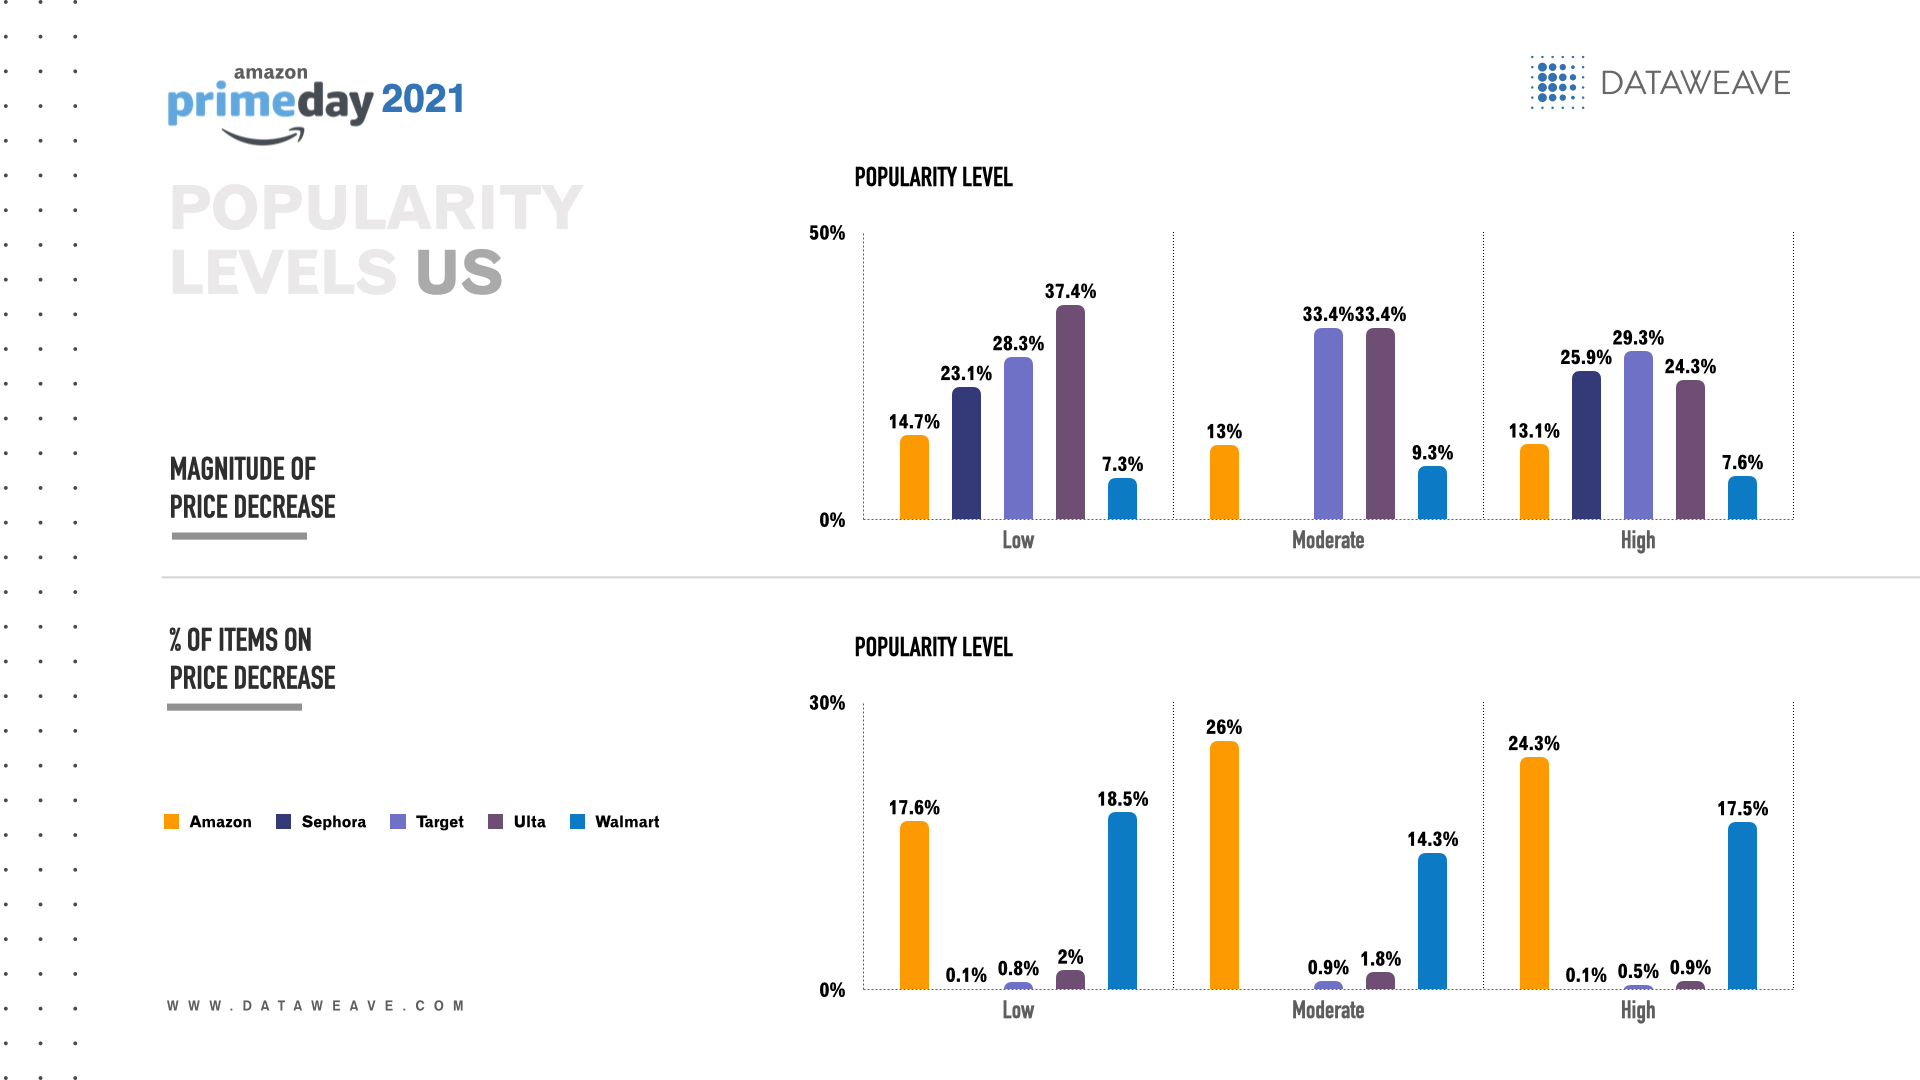
    In the US, among health & beauty products with high popularity, Amazon US offered the highest percentage of items with a price decrease (24.3%) and Target offered the greatest magnitude of price decrease (29.3%).

    For health & beauty items with medium popularity, Amazon US offered the highest percentage of items with a price decrease (26.0%), and strategic partners Target and Ulta both offered the greatest magnitude of price decrease (33.4%).

    Among health & beauty merchandise with low popularity, Walmart offered the highest percentage of items with a price decrease (18.5%) and Ulta offered the greatest magnitude of price decrease (37.4%).

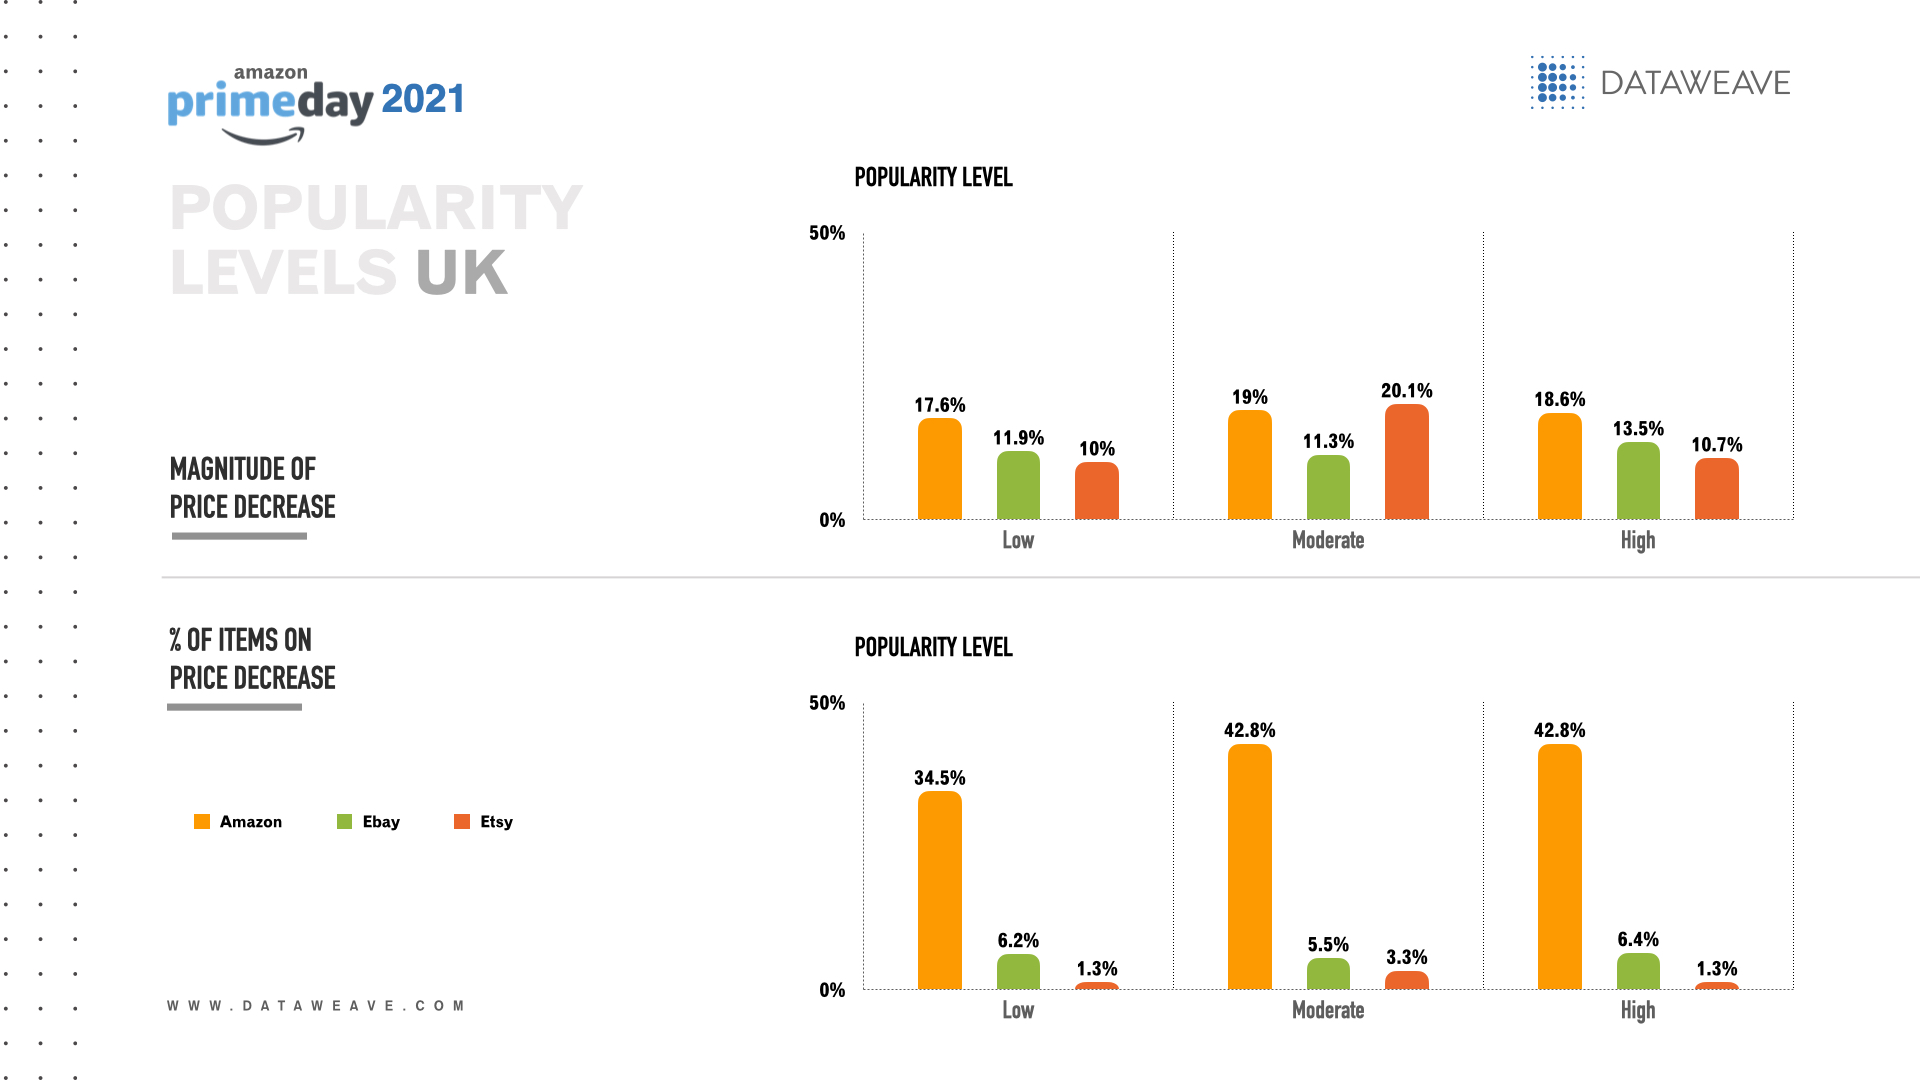
    Amazon UK stood out among all levels of health & beauty product popularity.

    In the UK, among health & beauty products with high popularity, Amazon UK offered both the highest percentage of items with a price decrease (42.8%) and the greatest magnitude of price decrease (18.6%).

    For health & beauty items with medium popularity, Amazon UK offered the highest percentage of items with a price decrease (42.8%) and Etsy offered the greatest magnitude of price decrease (20.1%).

    Among health & beauty merchandise with low popularity, Amazon UK offered both the highest percentage of items with a price decrease (35.4%) and the greatest magnitude of price decrease (17.6%).

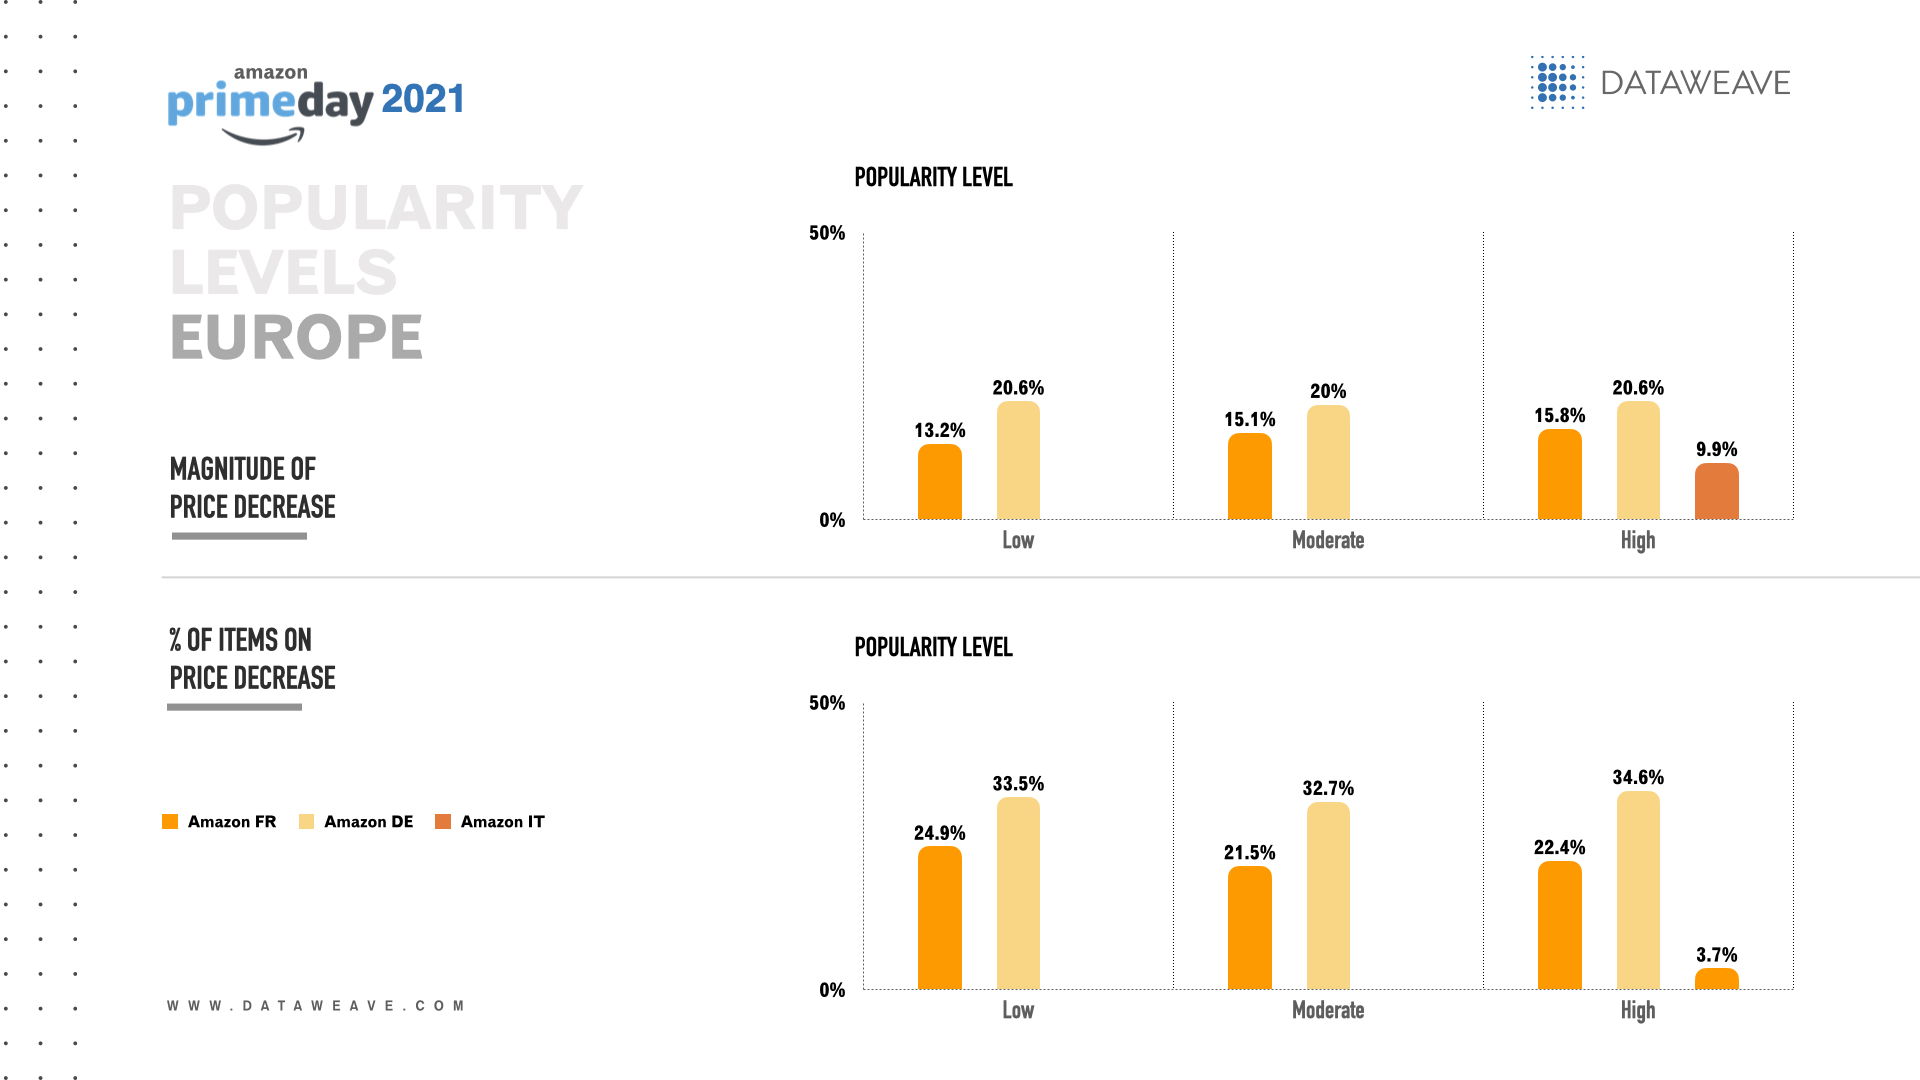
    In Europe, Amazon Germany dominated discounts for health & beauty products across all levels of popularity.

    Among health & beauty goods with high popularity, Amazon Germany offered both the highest overall percentage of items with a price decrease (34.6%) and the greatest overall magnitude of price decrease (20.6%).

    For health & beauty items with medium popularity, Amazon Germany offered both the highest percentage of items with a price decrease (32.7%) and the greatest magnitude of price decrease (20.0%).

    Among health & beauty merchandise with low popularity, Amazon Germany offered the highest percentage of items with a price decrease (33.5%) and the greatest magnitude of price decrease (20.6%).

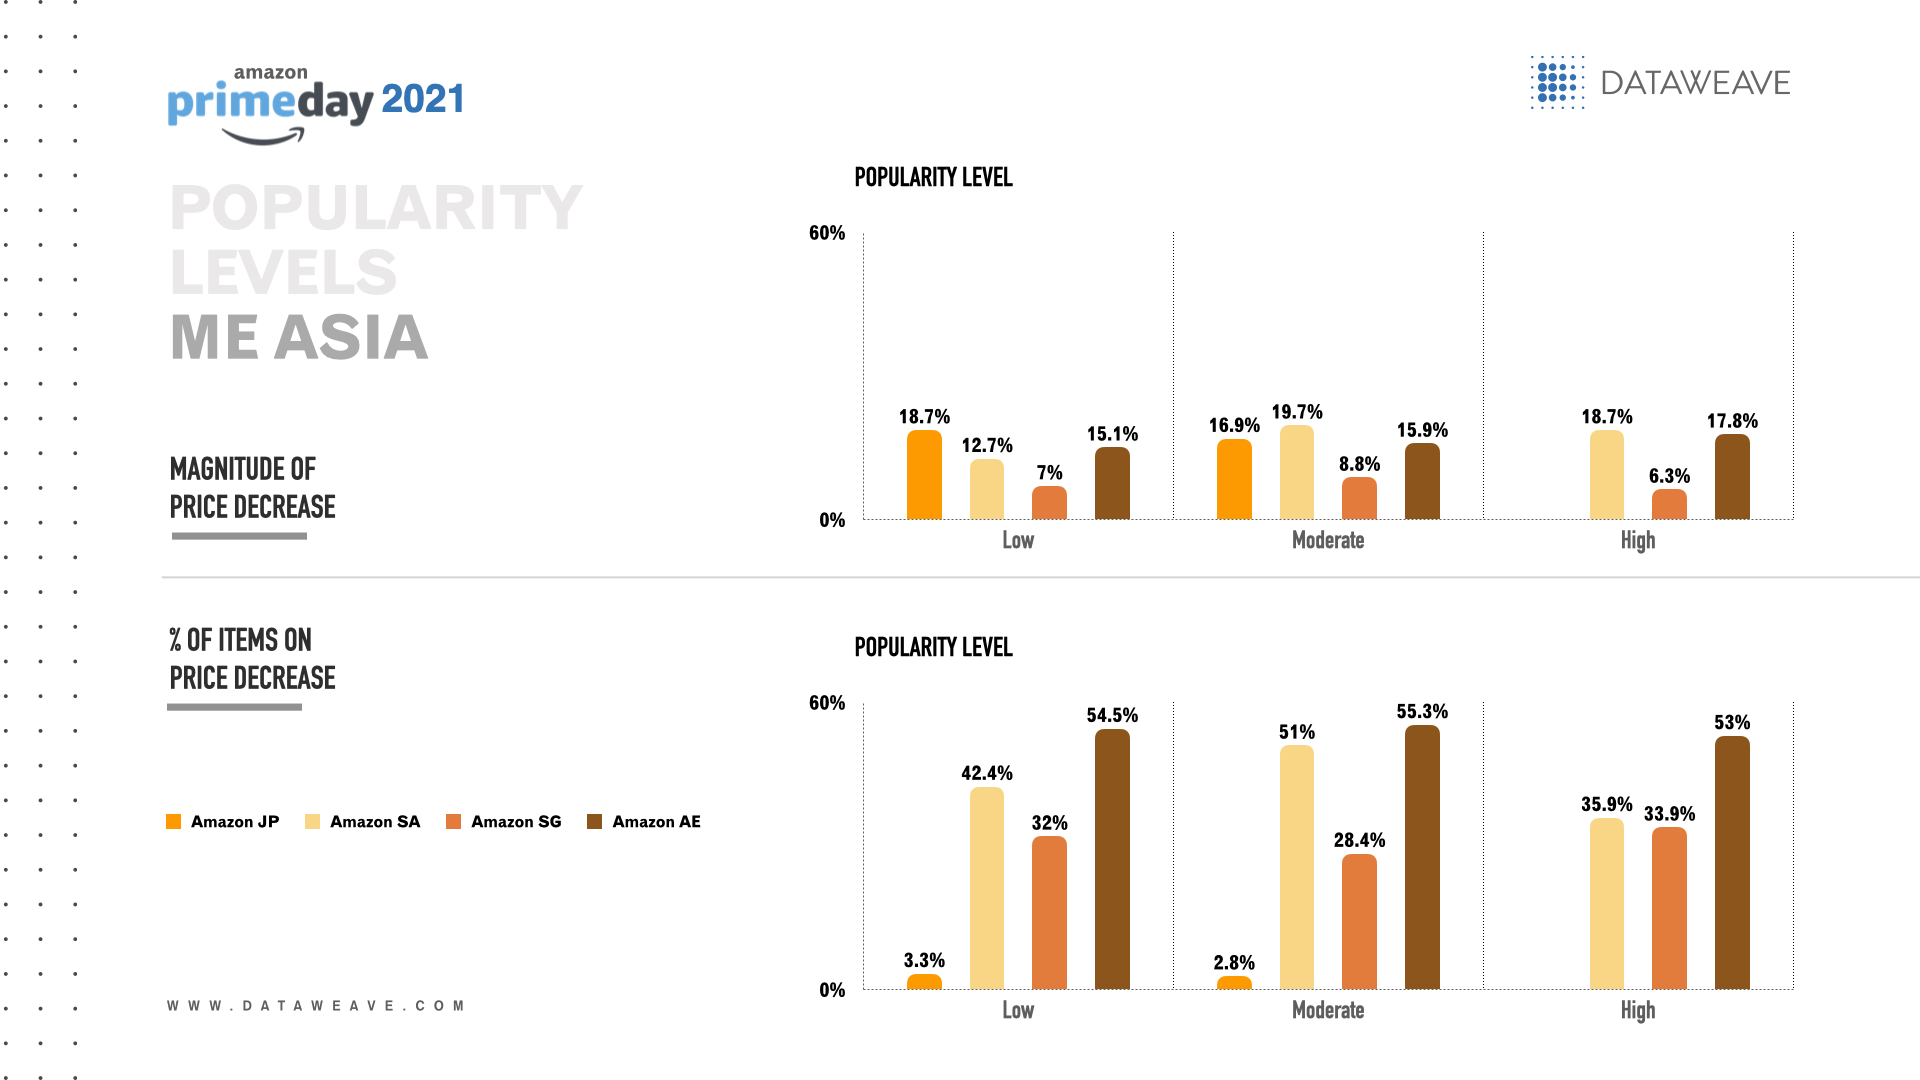
    In Middle East & Asia, among health & beauty items with high popularity, Amazon UAE offered the highest overall percentage of items with a price decrease (53.0%) and Amazon Saudi Arabia had the greatest overall magnitude of price decrease (18.7%).

    For health & beauty products with medium popularity, Amazon UAE offered the highest overall percentage of items with a price decrease (55.3%) and Amazon Saudi Arabia had the greatest overall magnitude of price decrease (19.7%).

    Among health & beauty goods with low popularity, Amazon UAE offered the highest percentage of items with a price decrease (54.5%) and Amazon Japan had the greatest magnitude of price decrease (18.7%).

    Health & beauty’s stunning Prime Day deals

    Overall, Prime Day 2021 gave shoppers around the world the opportunity to score generous discounts on health & beauty products.

    According to our analysis, the retailers whose Prime Day pricing stood out the most were Amazon US and Ulta in the US, Amazon UK and Ebay in the UK, Amazon Germany in Europe, Amazon UAE in the Middle East and Amazon Japan in Asia.

    Stay tuned for Prime Day 2021 international fashion and home goods pricing insights.

  • As Value Shopping Soars, Pricing Matters More

    As Value Shopping Soars, Pricing Matters More

    The pandemic’s profound economic impact sparked a surge in value shopping.

    Between February and December 2020, 10 million Americans lost their jobs.1 Due to the pandemic, 36% of lower-income adults and 28% of middle-income adults lost a job or took a pay cut (vs. 22% of upper-income adults). In addition, less than a quarter of lower-income adults have three months’ worth of emergency funds (vs. 48% of middle-income adults and 75% of upper-income adults).2

    These financial shifts matter to retailers, as lower- and middle-income households account for 81% (29% and 52%, respectively) of the total U.S. population.3 Reduced disposable income among households like these has led more consumers to embrace bargain-hunting as a shopping habit.

    We’ll see why price sensitive consumers are influencing retailers to adjust their e-commerce pricing strategies to stay competitive and responsive.

    Consumers seek value across retail categories


    Recent research shows 50% of U.S. adults are more sensitive to product prices now than before the pandemic. Also, 80% of U.S. shoppers are taking at least one action to seek more value when they shop for groceries, prioritizing value for money over speed.4

    According to McKinsey, 65% of consumers cited value as one of their top three reasons they switched brands during the pandemic. Also, 40% of shoppers cited a desire for better value and 38% cited better prices or promotions as reasons for choosing new products.5

    Value-oriented pricing influences purchases, as 70% of consumers said product discounts are more important today compared to a year ago. In addition, 54% of consumers said better online deals and discounts are a leading factor that persuades them to choose a specific retailer.6

    As e-commerce explodes, consumers have greater access to information. They can find the best price across online sites and receive notifications when a product’s price drops before they buy.

    Retailers face intense pricing pressure

    Similar to the aftermath of the 2008 recession, discounters and dollar chain retailers are now thriving as consumers seek superior value for money. Consumers need new products yet they no longer want to spend as much as before.

    That’s why bargain retail is poised to be among the biggest winners in 2021 as consumers get out and socialize more. 7

    Dollar General continues to aggressively expand its omnichannel reach as value shopping soars.8 To stay competitive, Family Dollar has partnered with Instacart on same-day delivery.9 In the fierce grocery sector, hard discounter Aldi’s omnichannel expansion includes a focus on private labels and efficient operational processes that improve cost effectiveness and competitive pricing.10

    Across retail categories, a remarkable 50 million price changes take place online every day. Given consumers’ shift to value shopping, more retailers are changing their pricing to offer discounts both online and in-store.11 However, to avoid costly price wars, more retailers are now taking a renewed approach to their pricing strategies to protect their margins as they compete.

    Specifically, to optimize their e-commerce business for profitable growth, more retailers are modernizing their pricing strategies with data insights.

    Pricing intelligence is retailers’ secret weapon 

    As e-commerce rivalry heats up, retailers must evaluate pricing across more online websites to keep their own prices competitive. This process is becoming increasingly complex and time consuming. Meanwhile, retailers may consider adopting aggressive pricing tactics to win online sales. Yet this pricing strategy is unsustainable over the longer term, as it erodes profit margins.

    Today’s heated e-commerce rivalry means retailers can no longer afford to guess at price points or use the same pricing tactics that relied on before the pandemic.

    That’s why leading retailers turn to data insights for their pricing strategies to stay agile and flexible while rapidly adapting to fluctuations in consumer demand and competitors’ pricing.

    Now more retailers turn to DataWeave’s Pricing Intelligence to drive more revenue and margin.

    To optimize profit margins, retailers use our actionable insights to make pricing decisions according to data-driven recommendations. They also make decisions to protect their desired price perception.

    Monitoring competitors’ pricing moves helps retailers benchmark their own performance, identify gaps and respond to market trends faster. They can also refer to historic pricing data analytics to accurately anticipate and counter rivals’ next moves to gain an edge.

    Retailers that apply data insights to optimize their pricing can drive more online revenue by finding the ideal price consumers are willing to pay while still maintaining profitability. Pricing intelligence can make customer acquisition more efficient, and help retailers grow online sales and market share. 

    Amid greater price sensitivity, retailers’ pricing strategies are evolving to use data to adapt to consumers’ needs and drive e-commerce sales and profitability. DataWeave’s Pricing Intelligence gives retailers an edge so they stay agile and competitive, and maximize e-commerce sales across consumers of all economic levels.


    1. Howland, Daphne. The middle class is stressed and the pandemic isn’t helping. Retail Dive. January 20, 2021.
    2. Howland, Daphne. The middle class is stressed and the pandemic isn’t helping. Retail Dive. January 20, 2021.
    3. Bennett, Jesse, Richard Fry and Rakesh Kochhar. Are you in the American middle class? Find out with our income calculator. Pew Research Center. July 23, 2020.
    4. Maake, Katishi. DoorDash, Instacart Eye Launching Credit Cards. The Harris Poll. April 9, 2021.
    5. Charm, Tamara, Harrison Gillis, Anne Grimmelt, Grace Hua, Kelsey Robinson and Ramiro Sanchez Caballero.Survey: US consumer sentiment during the coronavirus crisis. McKinsey & Company. May 13, 2021.
    6. Berthiaume, Dan. Survey: Deals drive purchases during pandemic. Chain Store Age. March 18, 2021.
    7. Thomas, Lauren. Beauty and bargain retail could be the biggest winners in 2021, Wells Fargo predicts. CNBC. March 25, 2021.
    8. Unglesbee, Ben. Dollar General ramps up expansion of Popshelf concept. Retail Dive. March 19, 2021.
    9. Ryan, Tom. Will same-day delivery pay off for dollar stores? RetailWire. February 8, 2021.
    10. Anderson, George. Should Aldi’s growing store count and digital progress keep rivals up at night? RetailWire. February 11, 2021.
    11. Berthiaume, Dan. Survey: Deals drive purchases during pandemic. Chain Store Age. March 18, 2021

  • Similarity matching keeps retailers competitive: Know your rivals

    Similarity matching keeps retailers competitive: Know your rivals

    Soaring e-commerce growth has made retail more crowded, complex and competitive. Now retailers face an urgent need to keep an eye on more rivals with potential substitute products to maximize their own e-commerce growth.

    Consider these recent figures, which illustrate online shoppers’ abundance of product choices:
     

    • 24% year-over-year increase in direct-to-consumer (DTC) brands in the U.S. alone was estimated for 2020 as more brands bypass retailers1
    • 55% of shoppers have purchased private label in the past year and many retailers are investing more in their own brands2
    • 110% average increase in small retailers’ 2020 online holiday sales, as more players launched new e-commerce shops during the pandemic3
    • 39% of U.S. consumers have changed brands, with the level of brand switching doubling in 2020 compared to 2019, especially among Gen Z and Millennial consumers, as loyalty declines4

    These statistics prove that in 2021 retailers need to navigate more online players and products. Now retailers need a new approach to stay on top of market trends to keep their e-commerce strategies competitive, profitable and attractive to discerning online shoppers. 


    Retailers reduce the risk of substitutes with similarity matching

    In response to online crowding, more leading retailers are turning to similarity matching. Similarity matching is a type of retail analytics that scour global e-commerce sites to find products that exactly match a specific item as well as products that closely match it. Similarity matching insights have grown in strategic significance because they increase retailers’ visibility into potential substitute products, so they can respond to all rivals’ moves with greater agility and efficiency to stay competitive.


    In terms of e-commerce applications, similarity matching helps retailers gather insights on potential substitute products so they can adjust their pricing and assortment strategies accordingly. Retailers can align their pricing with rivals’ pricing moves for similar items to protect their margins and maximize profitability. They can also make informed assortment decisions, including which product mix of bestsellers, unique items and private labels could optimize their online sales performance.

    Online shoppers search for products differently across different categories

    Consumer behavior plays a role, as online search habits differ across product categories, which influences the type of similarity matching retailers need. For example, categories like fashion, toys, home and kitchen work best with similarity matching based on text and images. In these highly-visual categories, consumers can quickly determine whether a product fits the design and aesthetic they are looking for. As a result, e-commerce product titles, descriptions and product images play a big role in consumers’ purchase decisions.

    By contrast, consumer electronics and furniture are categories in which consumers tend to seek specific product attributes, such as a certain level of resolution for their high-definition TV or a couch with particular dimensions so it fits their living room. For these types of products, consumer purchases are driven by product specifications, so similarity matching takes into account their specific needs as well as a degree of tolerance for exact or near-similar attributes across online competitors.

    Expect intense e-commerce rivalry in 2021

    As more consumers shop online, they are increasingly informed by online product comparison information. A wide variety of product choices means consumers can substitute similar goods with ease, especially if a particular item is out-of-stock. Perceived product differentiation, price sensitivity and private labels can also influence consumers’ purchase decisions.

    Across categories, e-commerce growth is outpacing total retail growth. When competition is this fierce, there is an increased risk that numerous and aggressive players will drive down profit margins. Leading retailers are now seizing opportunities to earn consumer loyalty. Using similarity matching helps retailers by offering in-demand products that consumers will actually buy and deliver exceptional online experiences to prevent shoppers from switching to rivals and their comparable products.

    Similarity matching lets you stay competitive

    As e-commerce traffic and rivalry increase, similarity matching helps retailers stand out and serve online shoppers more effectively.

    Retailers gain visibility into their entire competitive landscape to keep their e-commerce strategy responsive to shifts among consumers and rivals. By knowing the full scope of potential substitute products available online, retailers can keep their pricing and assortment strategies in line with rivals’ to reduce their risk of losing sales to rivals, and boost their top line, profitability and cost savings.

    The data insights give retailers the flexibility they need to align with online shoppers’ different needs across categories. As a result, retailers can use similarity matching to boost agility and gain a competitive advantage by adapting to online shoppers’ needs, winning their sales and fueling e-commerce growth.DataWeave’s similarity matching capability lets clients


    1 US Direct-to-Consumer Ecommerce Sales Will Rise to Nearly $18 Billion in 2020. eMarketer. April 2, 2020.

    2 Ochwat, Dan. Shopper study: Private brands purchased because they’re preferred. Store Brands. February 24, 2021
    3 Miranda, Leticia. Small businesses who pivoted to e-commerce saw record sales during Black Friday weekend. December 1, 2020.
    4 Charm, Tamara, Harrison Gillis, Anne Grimmelt, Grace Hua, Kelsey Robinson and Ramiro Sanchez Caballero. Survey: US consumer sentiment during the coronavirus crisis. McKinsey & Company. March 24, 2021.

  • Black Friday Prices Tempt Health & Beauty Shoppers

    Black Friday Prices Tempt Health & Beauty Shoppers

    Black Friday looked downright sultry with desirable discounts on health and beauty products.

    This year, health and beauty sales faced the threat of declining demand, as the pandemic keeps many consumers cooped up at home and in-store product testers no longer allowed. Yet consumers’ enduring desire to look and feel their best means this category will remain resilient. (Plus, we want to look smokin’ hot on Zoom.)

    That’s why we were curious to know how retail rivals, ranging from discounters to department stores, are battling it out to become bodacious beauty destinations to win the hearts, wallets and fake lashes of online shoppers.

    To calculate which retailers’ prices offered the broadest and most generous discounts, we examined health and beauty products’ pricing at Amazon, JC Penney, Macy’s, Neiman Marcus, Overstock, Nordstrom, Target and Walmart. We compared the pre-sale period (November 24-26) to the holiday sales period (Black Friday on November 27 through Cyber Monday on November 30) for a glimpse of retailers’ pricing strategies in this fiercely competitive category.

    BlackFriday_Health_Beauty_img1

    To gain insights into retailers’ competitive pricing strategies, we tracked three scenarios: whether prices decreased, increased or remained the same during the last week of November 2020. The vast majority of health and beauty products (91.0%) maintained the same prices during the pre-sale and sales periods. An astounding 99.7% of Target’s health and beauty prices stayed the same during the period.

    Amazon had the highest proportion of health and beauty products that offered a price decrease (18.1%), particularly on men’s fragrance, women’s fragrance and men’s hair care. Offering discounts on more items hints that Amazon wants to attract more health and beauty consumers, including men, by making more items affordable. Target offered the lowest proportion of health and beauty products with price decreases (0.8%).

    Amazon also had the greatest proportion of health and beauty products with a price increase (7.0%) with 15.3% of men’s fragrance earning a price hike.

    BlackFriday_Health_Beauty_img2

    On Black Friday, among health and beauty products with price decreases, Target gave the most generous average discount (37.6% vs. 7.2% for Overstock). However, Target’s discounts applied to only 12 products compared to 798 for Overstock.

    Common types of health and beauty products with the highest average discount on Black Friday have included face makeup, men’s fragrance, men’s hair care, and shampoo and conditioner.

    Among health and beauty products with price increases on Black Friday, Nordstrom had the highest average price hike (43.8% on one women’s fragrance) and Walmart offered the lowest (10.3% on 250 products).

    These findings suggest that Target was willing to create aggressive loss leaders in this category and Amazon wanted to boost health and beauty sales among male shoppers.

    Black Friday vs. Cyber Monday

    BlackFriday_Health_Beauty_img3

    This year, most retailers offered more additional discounts on health and beauty products on Cyber Monday than on Black Friday, possibly to prioritize clearing out their inventory before year-end. JC Penney and Macy’s were the exception. Overall, the top product types that received additional discounts included shave and hair removal, women’s fragrance and face makeup.

    On Cyber Monday, Amazon offered additional discounts on the greatest proportion of health and beauty products (21.1% vs. 2.1% for Target). Amazon focused on men’s hair care, shampoo and conditioner and face makeup.

    BlackFriday_Health_Beauty_img4

    Half the retailers (Amazon, JC Penney, Nordstrom and Overstock) offered deeper additional discounts on health & beauty on Cyber Monday than Black Friday, possibly to clear out their inventory before the end of the year. Cyber Monday discounts ranged from 35.0% for Nordstrom to 7.8% for Overstock.

    Meanwhile, both Neiman Marcus and Walmart offered the same levels of discounts on both Black Friday and Cyber Monday.

    Overall, the types of health and beauty products with the deepest discounts on both Black Friday and Cyber Monday were shampoo and conditioner, men’s hair care and face makeup.

    Additional discounts across products by “premiumness” level

    For almost all the retailers, the percentage of health and beauty products with additional discounts was higher on Cyber Monday than on Black Friday. Overstock had the highest proportion (20.2%), slightly more than Amazon (20.0%).

    JC Penney had a higher percentage of products with additional discounts on Black Friday. Neiman Marcus had the same percentage of products on both sales days.

    All the retailers except JC Penney and  Neiman Marcus allocated the greatest percentage of their additional discounts to health and beauty products at the high level of premium. The retailers may have wanted to appeal to upscale shoppers and make high premium goods more accessible to a broader audience of consumers.

    Half of the retailers (JC Penney, Nordstrom, Target and Walmart) offered deeper discounts on Black Friday than Cyber Monday.

    Target offered the most generous discounts on Black Friday with an average additional discount of 39.7%, which ranged from 50.1% on moderately premium health and beauty products to 28.6% for products at a high premium level. Target appeared to make more beauty items, including high premium items, affordable to more consumers to stay competitive as a beauty destination.

    Conversely, Amazon, Overstock and Macy’s were more generous with additional discounts on Cyber Monday. Among the high premium level of health and beauty products on Cyber Monday, Macy’s offered the deepest discounts (31.3%), edging out department store rival JC Penney (30.4%) in competing for upscale shoppers.

    Health & Beauty’s Ravishing Holiday Prices

    This year’s Black Friday and Cyber Monday pricing strategies showed retailers’ attempts to stand out, expand their market reach to stay competitive. Appealing to a broader audience included spanning upscale and value tiers, and wooing more male online shoppers to grow their top line and boost loyalty in an intense category amid a pandemic.

    Stay tuned for more Black Friday and Cyber Monday 2020 analysis to discover how retailers strategically price their products to win in leading e-commerce categories.


  • Who Won Black Friday’s Electronics Price War?

    Who Won Black Friday’s Electronics Price War?

    Electronics have never been hotter.

    This year’s COVID-19 pandemic created a seismic shift towards tech, directly affecting retailers’ Black Friday and Cyber Monday pricing strategies for electronics. Prime Day 2020’s new fall date also inevitably influenced pricing and purchasing patterns. If consumers pampered themselves with a 75-inch TV in October, what are the odds they’re in the market for another big-screen TV in late November?

    Consumer electronics are perennial holiday bestsellers because they make gift-giving easy, whether we buy them for others or for personal indulgence. Continuous innovation also means a comparatively shorter product lifecycle, making electronics an exciting, progressive retail category.

    To determine which retailers’ pricing strategies offered the most generous discounts on electronic products, we examined electronics pricing at Amazon, Best Buy, Overstock, Target and Walmart. We compared during the pre-sale period (November 24-26) to the holiday sales period (Black Friday on November 27 through Cyber Monday on November 30) for a glimpse of retailers’ pricing strategies to stay competitive in 2020.

    For competitive pricing insights, we tracked three scenarios before and during 2020’s traditional holiday sales season: whether prices decreased, increased or remained the same. Most strikingly, the overwhelming majority of electronics products (89.8%) maintained the same prices during the pre-sale and sales periods. For instance, Target kept a whopping 98.0% of its electronics prices the same during the period.

    Amazon had the greatest proportion of electronics products that offered a price decrease (11.7%), particularly on laptops, mobiles and wearable technology. These results also suggest Amazon wants to reach more consumers by making more electronics affordable with discounts. Target offered the lowest proportion of electronics with price decreases (2.5%).

    Overstock had the greatest proportion of electronics products that offered a price increase (10.7%) with 30.3% of TVs increasing in price. Best Buy offered the lowest proportion of electronics with price increases (1.2%).

    Among electronics products with price decreases on Black Friday, Best Buy offered the highest average discount (16.6%) and Amazon offered the lowest (10.2%). Among all the retailers, the types of electronics with the highest average discount included tablets, headphones, laptops and TVs.

    Among electronics products with price increases on Black Friday, Best Buy had the highest average price hike (30.2%) and Amazon offered the lowest (9.8%). That said, Best Buy increased the price of one laptop by 73.1% whereas Amazon increased the price of 44 laptops by an average of 4.2%.

    These findings show that Best Buy aggressively protected its market share in this competitive category by offering the most generous discounts.

    Black Friday vs. Cyber Monday

    Without exception, the retailers offered more additional discounts across the electronics category on Cyber Monday than on Black Friday. Retailers may have wanted to clear out their inventory to make room for new, innovative products in their assortments.

    Amazon had the greatest proportion of electronics with additional discounts on Cyber Monday (15.7%, which is more than double the 7.3% each for Overstock and Target). Amazon’s additional discounts focused on mobiles, laptops and wearable technology.

    Overall, the greatest proportion of additional discounts on electronics on Cyber Monday focused on laptops, desktops and USB flash drives.

    While most retailers offered deeper discounts on electronics on Cyber Monday than Black Friday, Overstock was the sole exception.

    On Cyber Monday, Target offered the most generous average additional discounts (19.6% vs. 10.2% for Amazon); however, Target’s discounts applied to 260 electronics products compared to 924 for Amazon.

    Overall, the types of electronics with the deepest discounts on Cyber Monday on electronics were USB flash drives, tablets and headphones.

    Additional discounts across products by “premiumness” level

    When we examine electronics’ additional discounts according to the products’ premium level, several patterns stand out.

    Most apparent is that every retailer offered a higher proportion of additional discounts on Cyber Monday compared to Black Friday, ranging from 15.9% for Amazon to 6.4% for Best Buy.

    With only one exception, Amazon offered the greatest proportion of additional discounts across all premium levels. Only Target offered a slightly higher proportion among low premium electronics (11.9% vs. 11.3% for Amazon). This approach could help Amazon make more electronics products more affordable to more consumers and boost its reach in this competitive category.

    Among electronic items at the high premium level, Amazon was most aggressive in allocating additional discounts (21.0% vs. 5.4% for Target), which could help the e-commerce giant earn top-of-mind status among affluent shoppers in the market for big-ticket electronics.

    Most retailers (Amazon, Best Buy and Walmart) offered deeper discounts on Cyber Monday than Black Friday. By contrast, Overstock and Target were more generous on Black Friday.

    Interestingly, Target’s average additional discount on Cyber Monday (18.8%) was still more generous than those of the other retailers.

    Among moderately premium items, Target’s average additional discount was 22.3%, more than double Amazon’s 10.3%. Target may have tried to make mid-market electronics more affordable to its core audience of value-seeking shoppers.

    Additional discounts across products by “popularity” level

    A review of retailers’ additional discounts by electronics’ popularity level reveals that most retailers allocated a bigger proportion of discounts on Cyber Monday than on Black Friday. Overstock was the exception. Again, clearing out 2020 inventory before year-end likely influenced retailers’ pricing strategies.

    Overall, on Cyber Monday retailers showed a direct relationship between additional discounts and electronics’ popularity levels. For instance, Amazon offered additional discounts on 21.7% of highly popular electronics and 15.3% on moderately popular electronics. Since Amazon strives to be “The Everything Store,” it makes sense to make more products more appealing and affordable to more consumers. Meanwhile, Target offered nearly double the proportion of additional discounts of less popular electronics than discount rival Walmart (12.5% vs. 6.7%) to tempt value-seekers with deals.

    Most retailers (Amazon, Best Buy, Target and Walmart) offered deeper discounts on Cyber Monday than Black Friday. Overstock was more generous on Black Friday.

    On Cyber Monday, Target’s average additional discount (21.8%) was the most generous of all the retailers, nearly double that of Amazon (11.1%). However, Target’s discounts applied to 259 electronics products. vs. 903 for Amazon.

    Both Amazon and Overstock gave their most generous discounts to less-popular electronics, possibly to clear out their inventory to make room for more popular or higher-margin items.

    Black Friday & Cyber Monday 2020 Electronics Pricing Strategies

    This year, the pandemic jolted consumers to focus on digital technology to stay connected to work, school and retail, which heightened demand for electronics.

    In response, retailers’ 2020 pricing strategies for Black Friday and Cyber Monday suggest a desire to extend their reach beyond their core audience to maximize their brand appeal and steal rivals’ market share.

    The Cyber Monday findings, in particular, suggest retailers decluttered their assortments to make space for the latest and highest-margin tech gadgets in time for Christmas.

    Click here for more Black Friday and Cyber Monday 2020 analysis for greater clarity on the evolving pricing positions of retail rivals across top e-commerce categories.


  • Black Friday Prices Wowed Fashionistas

    Black Friday Prices Wowed Fashionistas

    Retailers really wanted to dress us up this holiday season.

    This year’s Black Friday and Cyber Monday fashion pricing trends reflect how retailers have responded to the pandemic’s influence on apparel shopping to boost their resilience and competitiveness.

    For instance, since most consumers now cocoon at home, few of us are likely to splurge on fancy gowns or suits as holiday gifts for ourselves or others. That’s why we wanted to know which retailers doubled down on Black Friday fashion discounts and which ones used Cyber Monday discounts to make room for in-demand merchandise.

    To calculate which retailers’ prices offered the greatest proportion of discounts and the deepest discounts, we analyzed men’s and women’s fashions at Amazon, Bloomingdale’s, JC Penney, Macy’s, Neiman Marcus, Overstock, Nordstrom, Target and Walmart. We compared the pre-sale period (November 24-26) to the holiday sales period (Black Friday on November 27 through Cyber Monday on November 30) to gain insights into retailers’ pricing strategies in fashion.

    Top product types by additional discounts- Men’s fashion

    To review retailers’ holiday pricing strategies, we tracked three scenarios: whether prices decreased, increased or remained the same during the last week of November 2020.

    The overall proportion of men’s fashion items that maintained the same prices during the pre-sale and sales periods was 88.6%, ranging from 99.5% for JC Penney to 75.0% for Neiman Marcus.

    Neiman Marcus had the highest proportion of men’s fashions with a price decrease (25.0% vs. 1.4% for JC Penney). Top types of men’s fashions that had discounts were formal shoes, jackets and coats, and sports shoes. These findings seem to reflect how we rarely go out during the pandemic yet we’re exercising more.

    In addition, Amazon and Walmart were most active in offering discounts across all men’s fashion subcategories with Amazon offering more than double Walmart’s percentage of products discounted (15.9% vs. 7.1%).


    On Black Friday, JC Penney offered the most generous average discounts (35.6% vs. 9.4% for Overstock). While that contrast seems dramatic, it’s important to note JC Penney’s discounts applied to only 8 products compared to 929 for Overstock.

    Men’s fashions with the highest average discount on Black Friday included formal shoes, jackets and coats and jeans.

    Top product types by additional discounts- Women’s fashion

    For women’s fashions we also tracked whether prices decreased, increased or remained the same during the last week of November 2020. The vast majority of women’s fashions (89.3%) maintained the same prices during the pre-sale and sales periods. A whopping 99.3% of Target’s women’s fashion prices stayed the same.

    Neiman Marcus had the highest proportion of women’s fashions with a price decrease (33.4%), particularly on casual shoes, t-shirts and lingerie. JC Penney and Target offered the lowest proportion of price decreases on women’s fashions (1.9%).

    Similar to men’s fashions, Amazon and Walmart offered price discounts across all the women’s fashion subcategories with Amazon offering a higher proportion of products with discounts. (10.7% vs. 7.7% for Walmart)

    On Black Friday, JC Penney offered the most generous average discounts (45.0% vs. 12.2% for Overstock) yet JC Penney’s discounts applied to only 28 products compared to 1952 for Overstock.

    The types of women’s fashions with the highest average discount on Black Friday included tops, casual shoes and handbags. Perhaps women pampered themselves with a new purse and new tops to look chic on Zoom calls.

    Black Friday Vs Cyber Monday

    During this year’s holiday sales events, almost all retailers offered more additional discounts on men’s and women’s fashion on Cyber Monday than on Black Friday, possibly to sell off seasonal inventory before year-end. Nordstrom was the only exception, offering more discounts on Black Friday.

    On Cyber Monday, Target offered additional discounts on the greatest proportion of men’s fashions (63.3% vs. 10.6% for Walmart). Top types of men’s fashions with discounts included underwear, jeans, jackets and coats.

    Similarly, Target offered additional discounts on the greatest proportion of women’s fashions on Cyber Monday (79.4% vs. 3.2% for JC Penney). The most common types of discounted women’s fashions were dresses and jumpsuits, t-shirts and casual shoes.

    These findings suggest Target is aggressively pursuing value shoppers and positioning the chain as a convenient source for all the whole family’s apparel needs.

    Most retailers (Amazon, Nordstrom, Overstock, Target and Walmart) offered deeper additional discounts on men’s fashions on Cyber Monday than Black Friday, possibly to maximize year-end sales and clear out seasonal inventory. Cyber Monday discounts for men’s fashions ranged from 29.8% for Nordstrom to 11.0% for Overstock. Top types of men’s fashions that received Cyber Monday discounts included jackets and coats, formal shoes, sunglasses and t-shirts, which reflect how men are going out less.

    Conversely, most retailers (JC Penney, Macy’s, Neiman Marcus, Nordstrom and Walmart) offered deeper additional discounts on women’s fashions on Black Friday than Cyber Monday, possibly to entice women to get a jumpstart on the holiday sales weekend to maximize top line performance in this competitive category. Black Friday discounts for women’s fashions ranged from 45.0% for JC Penney to 12.2% for Overstock. Top types of women’s fashions with Black Friday discounts included swimwear, lingerie and t-shirts, which reflect seasonal merchandise.

    Additional discounts across products by “premiumness” level

    For almost every retailer, the percentage of fashions with additional discounts was higher on Cyber Monday than on Black Friday. Target had the highest proportion (62.7% vs. 5.7% for JC Penney). It appears Target really wants to win value-seeking apparel shoppers, by offering additional discounts on 93.3% of fashions at the low premium level (vs. 4.6% for Walmart).

    By contrast, Nordstrom had a higher percentage of fashions with additional discounts on Black Friday.

    Most retailers (Amazon, Bloomingdale’s, Neiman Marcus, Overstock, Target and Walmart) offered deeper discounts on Cyber Monday than Black Friday, likely make room for new seasonal merchandise.

    Neiman Marcus offered the most generous fashion discounts on Cyber Monday with an average additional discount of 30.1%, which ranged from 31.7% at the high premium level to 28.9% at the low premium level. This aggressive discounting could help Neiman Marcus stand out among department stores, and extend its reach and appeal by making fashions more affordable across price points.

    Conversely, JC Penney, Macy’s and Nordstrom offered deeper discounts on Black Friday. All three department stores were most generous at the low premium level for fashions, with JC Penney offering the deepest discounts (47.8%) to turn low premium fashions into irresistible Black Friday bargains.

    Additional discounts across products by “popularity” level

    Almost all retailers offered a greater proportion of additional fashion discounts on Cyber Monday than on Black Friday, ranging from 69.2% for Target to 5.2% for JC Penney, with a direct relationship between product popularity and additional discount percentage. Across all levels of popularity for fashions, Target was by far the most aggressive with discounts to appeal to the broadest variety of fashion shoppers.

    Only Nordstrom offered a higher proportion of additional discounts on fashions on Black Friday, focusing on both high and low levels of popularity.

    Most retailers (Amazon, Neiman Marcus, Overstock, Target and Walmart) offered deeper fashion discounts on Cyber Monday than on Black Friday, with both Neiman Marcus and Target being the most generous (28.8%). Amazon and Neiman Marcus were most generous with discounts among less popular items, while Overstock, Target and Walmart were most generous among moderately popular fashions.

    Conversely, JC Penney, Macy’s and Nordstrom offered more generous fashion discounts on Black Friday, with JC Penney being the most generous (39.2%). All three retailers offered the deepest discounts at the low level of popularity, possibly to make room for in-demand fashion items.

    2020’s Fashionable Holiday Prices

    As this year’s Black Friday and Cyber Monday fashion pricing results show, we prioritized comfort and basics over debonair formalwear. Since staying at home is in style, many retailers discounted dressier attire.

    In terms of competitive pricing strategies, Target’s aggressive discounts could boost the chain’s appeal among diverse fashion shoppers. Also, Neiman Marcus stood out among department stores by extending its reach and affordability across pricing tiers. 

    Click here for more Black Friday and Cyber Monday analysis to learn about retailers’ holiday pricing strategies during 2020’s e-commerce boom.


  • Amazon’s losing its pricing advantage this holiday season

    Amazon’s losing its pricing advantage this holiday season

    Amazon’s pricing advantage has declined in key categories, compared to last year as we enter 2020’s holiday season.

    The holidays are here and the retail industry is gearing up for the yearly stampede. In a report published by Bain & Company, in partnership with DataWeave, it was observed that, “When it comes to pricing, Amazon’s historical advantage is also deteriorating. The research shows that in October and November 2019, Amazon matched or beat competitors’ prices 81% of the time in the categories studied. By November of 2020, that rate dropped to 74%”. This was based on the four key categories where we had pricing data for Amazon and at least one other competitor.

    Amazon’s pricing advantage has declined in key categories

    Amazon_product_pricing

    Aggressive pricing, which was once Amazon’s forte, seems to be on a downward trend this year. All but one category saw an increase in the percentage of products where they beat the lowest price, ‘movies, music, video games’ – by a small margin of one percentage point.

    What could this shift be attributed to? The obvious would be the repercussions of COVID but there perhaps is more at work here. As observed last year, the behemoth that Amazon is, does not deter its competitors from constantly biting at the heels, with a steely determination to rope in market share. Everything from increased and specific customer demands, to government legislation, there are a lot of moving parts.

    One thing is for sure, this is surely just the beginning of the great e-commerce battle. For access to the full article that was published in the Retail Holiday Newsletter by Bain & Company and powered by DataWeave, click here.

  • Amazon Great Indian Festival Vs Big Billion Day- Who offered better discounts?

    Amazon Great Indian Festival Vs Big Billion Day- Who offered better discounts?

    The Great Indian Festival finally arrived and it coincided with Flipkart’s Big Billion Day Sale. The pandemic has pushed consumers to shop online and both, the Great Indian Festival and the Big Billion Day sales had been eagerly anticipated. Flipkart’s sale lasted between 16-21 October, while Amazon’s (in India) took started on 17th October.

    It is claimed that Amazon and Flipkart have hit $3.5 billion in sales in just four days. On the last day of its Sale, Flipkart claimed to have achieved 10 times growth as compared to last year’s Big Billion Day sale. Clearly, the sales have surpassed all the forecasts made for this year’s sale. We at DataWeave took a closer look to analyze the discounts that were offered across popular categories, to see if customers really had access to better deals and discounts. 

    Our Methodology:

    We looked at the top 500 products across categories like Fashion – men and women, electronics, Amazon devices, baby products, grocery and personal care. The pricing offered on these products across the sale period was compared with the pre-sale price, to understand the trend in discounts across the popular categories and brands.

    The Verdict:

    We segmented the products we were tracking into the following:

    Type 1: Products were either priced the same or were discounted over the sale compared to pre-sale 

    Type 2: Products were either priced the same or witnessed price increase during the sale compared to pre-sale 

    Type 3: Products which saw both price increase and decrease during sale compared to pre-sale

    Type 4: Products whose price continued to be the same even during the sale 

    flipkart_big_billion_day_2020_chart_1

    Flipkart clearly provided the better deals to customers for the categories we looked at during their Big Billion Day sale compared to Amazon. Flipkart discounted 54% of its products during the sale period compared to Amazon, and 26% of the products were discounted. 

    It is also interesting to note that in addition to offering more discounted products, Flipkart also offered additional discounts than Amazon.

    Amazon offered 13.2% additional discount and most of this average discounting can be attributed to a 33.8% discount on Amazon devices. It also ended up increasing the pricing for 16% of the products during the sale period, while Flipkart hiked the pricing for 6% products. 56% of products on Amazon continued being sold at the same price even during the sale. 

    Additional discounts across product premiumness levels

    Premiumness was based on the actual price of a product before the sale event. This was divided into low, medium and high premiumness levels, with high indicating higher selling prices.

    flipkart_big_billion_day_2020_chart_2
    big_billion_day_great_indian_sale_2020

    In Amazon devices, baby products, electronics and grocery-cooking essentials, Amazon showed a direct relationship between its additional discounts and the level of premiumness. While Flipkart did not seem to follow a particular pattern with respect to product premiumness. 

    Flipkart offered the highest discounts for premium products in the Fashion category (for both men and women) compared to the rest. 

    Top brands by additional discounts:

    We looked at popular brands across categories to arrive at brands that were being sold at the maximum discount. These brands appeared at least twenty times in the top 500 ranks we considered.

    amazon_great_indian_sale_2020_electronics

    Acer, Philips, Samsung, Lenovo, Bajaj, Asus which were common brands across both Flipkart and Amazon in the electronics category, were being sold at much deeper discounts on Flipkart (almost double), compared to that on Amazon.

    Avita was extremely popular under the laptop sub-category on Flipkart and was observed to be discounted the highest during the sale.

    In Fashion, Titan was the most discounted brand with 53.9% additional discount but only 4% and 2% of the products offered discounting in mens’ and womens’ fashion respectively. Reebok in mens’ fashion and Fastrack, Sonata and Puma in womens’ wear on Flipkart, had discounts across almost all the products. 

    amazon_great_indian_sale_2020_baby_care
    flipkart_big_billion_day_2020_baby_care

    In the baby care category, Hasbro gaming on Flipkart had the highest additional discount followed by Funskool. Both the brands had more than 85% of their products discounted. 

    Johnson’s, which was common on both Amazon and Flipkart, was offered at higher discounts on Amazon compared to Flipkart. However, only 31% products were discounted vs 72% on Flipkart.

    Most Visible Brands

    We looked at the top 200 ranks across each sub-category to narrow down on the most visible brands across the sale period.

    amazon_great_indian_sale_top_brands
    flipkart_big_billion_day_2020_top_brands

    Across all categories and their sub-categories, the sub-category laptop had distinct brands that hold the majority of the products. This is observed both in Amazon and Flipkart where brands like Lenovo, HP, Asus hold more than 33% share of the first 200 products. 

    “Mobile” category was dominated by brands like Redmi and Boat on Amazon, and Realme and OPPO on Flipkart. These brands occur at least 24% of the time in the top 200 ranks.

    Who Won?

    There are many ways to look at this. To begin with, the combined sales of Flipkart and Amazon during the festive season in India accounted for more than 90% of the e-commerce industry’s gross sales. That amounts to a 55% year-on-year growth. Delving further, we see that Flipkart was far more aggressive with their offerings.

    They discounted 56.8% additional products at an overall discount of 15%. On the other hand, Amazon retained their typical cautious approach to discounting, with only 28.4% of the products, at an overall discount of 12.8%.

    If we adopt a more macro view of the sales, we have to take into account that this year is somewhat of an anomaly. Given the social distancing norms and other SOPs governing the common man, more people have been ushered into the world of online shopping. The penetration extended far into the Tier 2 and Tier 3 cities as well, thus potentially benefiting Flipkart, owing to their interior reach.

    Going by the numbers, Flipkart seems to have taken this round without a doubt. As we observed though, there are many ways to look at this and what seems to stand out from these two giants, is the consumer. At the end of the day, it’s the consumer that in spite of these strange times, has shopped more than before, indicating that the situation is getting back to a semblance of normalcy.

    So Flipkart’s got the sales numbers but the consumer got deeper discounts on more products. As the old adage goes, ‘consumer is king’.

  • Prime Day 2020: Home categories fuel retail rivalry & desirable discounts

    Prime Day 2020: Home categories fuel retail rivalry & desirable discounts

    According to our preliminary analysis of Prime Day 2020, Amazon’s rivals offered more generous discounts within Home categories to stay competitive as more consumers invest in their homes this year.

    This year the COVID-19 pandemic has transformed consumers into homebodies who increasingly work, learn and shop from home. This year also marks the first time Prime Day took place in the Fall, jumpstarting the holiday sales season.

    At DataWeave, we wanted to know whether Prime Day 2020 lived up to the hype and how Amazon’s deals compared to other retailers’ discounts. Our analysis examines products across four popular Home categories: Bed & Bath, Furniture, Kitchen and Pet Care.

    Our Methodology

    We tracked the pricing of several leading retailers (Home Depot, Target, Walmart and Amazon) selling the Home categories of Bed & Bath, Furniture, Kitchen and Pet Care to assess their pricing and assortment strategies during this annual sales event. Our analysis focused on additional discounts offered during the sale to estimate the true value that the sale represented to consumers. Our calculations compared product prices on Prime Day versus the prices prior to the sale. The sample consisted of up to the top 750 ranked products across 16 popular product types for the home.

    The Verdict 

    Overall, Amazon reported the lowest price reduction in all Home categories (12.4%), compared to Target (22.1%), Home Depot (16.5%), and Walmart (15.1%). Yet Amazon reported the second-highest percentage of additionally discounted products (9.6% vs. 11.0% for Target).

    After Prime Day ended, certain retailers’ Home assortments saw more significant price increases than others. For instance, 88% of Target’s 760 products in Bed & Bath, Furniture, Kitchen and Pet Care received a price increase during the post-sale period, compared to 47% of Walmart’s 1005 products. Walmart’s everyday low price strategy helps to explain the difference between the two big box retailers.

    These results suggest that Prime Day 2020 may boost Amazon’s marketing and PR engagement yet its rivals offered the most generous deals in Home categories. As home-related categories’ sales soared during the pandemic, Amazon’s competitors offered deep discounts to stand out online and grow their market share. As such, consumers may want to embrace the habit of comparing multiple retailers’ websites to discover the best Prime Day deals in Home categories.

    Top product types by additional discount

    In Bed & Bath, Target offered the biggest average additional discount (27.4%) and Amazon offered the lowest (13.3%). Bed sheets and pillowcases were a popular product category for additional discounts across all four retailers, with Target offering the best average additional discount at 31.3%. Other popular product types among rival retailers included blankets, comforters and bathroom furniture.


    In Furniture, Home Depot (20.5%) offered the biggest overall additional discount, closely followed by and Target (19.2%). Living room furniture was a popular subcategory for all four retailers, with Home Depot offering the highest additional discount (29.1%). Other popular product types included furniture for the bedroom, home office, kitchen and dining room.

    In the Kitchen category, Target offered the biggest average additional discount for small appliances (21.8%), a subcategory in which all four retailers offered discounts. Within the large appliance subcategory, Walmart’s additional discounts were nearly triple Amazon’s (15.7% vs. 5.6%).

    Within the Pet Care category, Target offered the biggest average additional discount (18.5%). Cat food was a popular product category, with Target offering the best average additional discount (50.0%). Other popular product types across all four retailers included dog collars, leashes and dry dog food.

    Additional discounts across product “premiumness” levels

    Premiumness was calculated as the average selling price before the sale event. This was divided into low, medium and high premiumness levels, with high indicating higher selling prices.

    In Bed & Bath, most retailers showed an inverse relationship between their additional discounts and the products’ level of premiumness. Target offered the biggest additional discounts across all levels of premiumness, more than double Amazon’s discounts (27.2% vs. 12.3%). Target’s bold discounting strategy shows a commitment to protecting its competitive position across the entire Bed & Bath category.

    By far, Amazon offered the greatest percentage of additional discounts in Bed & Bath compared to its rivals across all levels of premiumness. Comparatively pervasive discounts help the e-commerce giant offer a greater variety of appealing deals within this category.

    In Furniture, most retailers showed a direct relationship between their additional discounts and the level of premiumness. Notably, Home Depot offered massive additional discounts at the high premium level, nearly triple Amazon and Walmart (34.5% vs. 12.7%). This move suggests Home Depot is serious about winning the business of upscale consumers in the Furniture category.

    Target differentiated its assortment by discounting by far the greatest portion of its Furniture at all premiumness levels (22.4%) and Home Depot discounted the least (4.4%). Amazon and Walmart distributed the greatest portion of their additional discounts to the moderate level of premiumness. Target’s strategy tries to attract all Furniture shoppers while Amazon and Walmart try to make their mid-market offerings affordable to more consumers.

    Across all levels of premiumness for Kitchen products, Target offered the biggest additional discounts, including almost double Amazon’s discounts at the medium level (22.5% vs. 13.4%). Target’s aggressive discounting shows a desire to be more competitive by attracting consumers at all levels of the Kitchen category.

    In the Kitchen category, most retailers offered a direct relationship between the proportion of additional discounts and the level of premiumness, yet Home Depot showed an inverse relationship. Amazon’s proportion of additional discounts across all levels of premiumness nearly tripled Home Depot’s (10.1% vs. 3.7%). This discount strategy shows Amazon’s willingness to offer shoppers deals across a broader variety of Kitchen items.

    In Pet Care, Walmart offered the highest overall additional discounts (16.2%), which could fortify its low-cost leadership position for pet lovers at all price points.


    While Target offered the greatest overall percentage of additional discounts in Pet Care, Amazon applied more discounts to the higher end of the premium spectrum and Target focused on the lower end.

    Additional discounts across visibility levels

    In Bed & Bath, Target offered the highest overall additional discounts across all levels of visibility (27.3%) and Amazon offered the lowest (12.4%). Amazon focused its additional discounts on the most visible Bed & Bath products to help online shoppers discover those items with ease and make them appealing enough to add to their cart.


    Amazon offered the lowest additional discounts in the Furniture category across all levels of product visibility. Yet, among the Furniture category’s most visible items, Amazon offered its highest additional discounts. Home Depot’s additional discounts approach was the most aggressive except among the lowest product visibility levels. Home Depot’s discount strategy shows a desire to compete for Furniture’s most visible items.

    In the Kitchen category, Home Depot consistently offered the lowest additional discounts among products at the higher visibility levels. Conversely, Target was the most aggressive in this category, offering additional discounts of up to 43.2% at moderate levels of visibility and double Home Depot’s discounts (26.3% vs. 13.4%) among the most visible items. Amazon may feel confident that men already choose Amazon for their apparel needs.

    In Pet Care, the retailers generally offered the most additional discounts for items in the middle of the visibility spectrum. Walmart offered the most aggressive additional discounts among the most visible Pet Care items, more than double Target’s discounts (13.5% vs. 6.5%).

    Overall, Prime Day 2020 offered an ideal time for Amazon to attract homebound consumers to invest in domestic products, yet its rivals offer much higher additional discounts in Bed & Bath, Furniture, Kitchen and Pet Care. How about other categories? Watch this space for more insights!

  • Introducing the CPG Brand Monitor by DataWeave

    Introducing the CPG Brand Monitor by DataWeave

    As DataWeave continues to engage with brands and manufacturers of all sizes, a consistent theme keeps emerging, “click and collect tracking”. Right now, brands rely on manual-store checks or waiting upwards of two weeks for a retailer to report sales data, which reveals low sales because a product is out of stock. In addition, there are always questions about the local price of your products compared to top competitors in the category. This is where DataWeave’s CPG Brand Monitor solution can help. 

    Click here for a quick tour of our dashboard.

    What we cover?

    On a daily basis, we track over 13,000 variant level SKUs across 100 stores, via seven of the top grocery retailers. We have selected the largest grocers in each region of the US, to allow for the widest coverage. These grocers include Albertsons/ Safeway in the west, HEB in Texas, Kroger in the upper mid-west, Wegmans in the Mid-Atlantic and Publix in the Southeast. 

    How does it work?

    In the application, you will see the list of all the SKUs we’re covering, with filters on the left side of the page to help with navigation. You can sort by Brand, Category, Store/ City, State, etc. After the filters are applied, the SKU list will be displayed based on these filters.  On the right side of the screen, you will see all the product level details including a 7-day price history, individual store level pricing/ stock availability and exportable charts and graphs. 

    How do I get access?

    Simply access the CPG Brand Monitor page, fill in your credentials via “Start Free Trial” and your login will be sent directly to your inbox. No commitments or phone calls are needed to test out the data. After a few days, our team will be in touch to make sure you understand how to navigate the tool and take you through our subscription options.   

    What else do we offer?

    DataWeave also offers a full Digital Shelf Analytics suite that covers Share of Voice (keyword, navigation and banner audits), Content Audit/ Optimization, Ratings/ Review Sentiment Analysis, Promotional Analysis, and much more. 

  • Coronavirus Outbreak: Impact on E-Commerce Retailers and Consumer Brands

    Coronavirus Outbreak: Impact on E-Commerce Retailers and Consumer Brands

    The Coronavirus, otherwise known as COVID-19, has made landfall on U.S. shores. At the time of writing this article, there are over 230 confirmed cases in the country and 12 deaths. The growing unease about the virus, which has quickly accumulated 95,000+ confirmed cases globally, has, among other things, adversely affected businesses and stock markets the world over.

    In the wake of this outbreak, U.S. based retailers and brands would be prudent to brace themselves and plan ahead to minimize disruptions as much as possible.

    Businesses and consumers in China, the global epicenter of the epidemic, have been dealing with these challenges over the last couple of months. It’s likely that some of the trends observed in China would be mimicked in the U.S. as well, something that domestic retailers and brands would do well to study and prepare for.

    The Inadvertent E-commerce Wave

    When the outbreak happened in China, it caused an uptick in e-commerce adoption as shoppers were reluctant to step out of their homes and instead, opted to shop for their goods online.

    Reports indicate that Chinese online retailer JD.com’s online grocery sales grew 215% YoY over a 10-day period between late January and early February. Similarly, Carrefour’s vegetable deliveries grew by 600% YoY during the Lunar New Year period. Online sales of Dettol, a disinfectant produced by Reckitt Benckiser, rose 643% YoY between 10 February and 13 February on China’s Suning.com.

    In Singapore, another region affected by the virus more recently than in China, Lazada’s grocery arm, RedMart, and Supermarket chain, NTUC FairPrice, both reported an unprecedented surge in demand, which tested their delivery capabilities to the limit.

    This bump in online sales isn’t just restricted to grocery, but other categories as well. Jean-Paul Agon, CEO of L’Oréal, recently said that online sales of the brand’s beauty products increased in China in February.

    Given such a consistent shift in shopping behavior across coronavirus-affected regions, it’s logical to expect that a similar trend would be followed in the U.S. – in fact, it might already be underway.

    A recent survey by Coresight Research indicated that 27.5% of U.S. respondents are avoiding public areas at least to some extent, and 58% plan to if the outbreak worsens. Of those who have altered their routines, more than 40% say they are “avoiding or limiting visits to shopping centers/ malls” and more than 30% are avoiding stores in general. The survey also found consumers will likely begin to avoid restaurants, movie theaters, sporting events and other entertainment venues.

    Therefore, it’s essential for U.S. retailers and brands to swiftly energize their e-commerce readiness and be fully prepared to cater to the circumstances-induced shift in shopping behavior, inclined toward online.

    A Logistical Nightmare

    The most obvious area of impact for retailers and brands is in their supply chain and order fulfilment operations.

    A large portion of consumer product manufacturers rely to some extent on China, and the potential impact of the virus on supply chain processes is inescapable. Chinese factories have been operating at partial capacity, impacting supply chains globally. This has largely affected highly popular e-commerce categories like consumer electronics, fashion and furniture.

    Shares in the U.S. of furniture e-commerce retailer, Wayfair, fell as much as 26% toward the end of February, according to a Bloomberg report. The is particularly revealing, as the online retailer reportedly relies on China for half of its merchandise.

    Retailers struggling to cope with this stress in their supply chain systems would do well to warn their customers beforehand about delays in deliveries, like AliExpress has just done.

    For categories like CPG, as consumers increasingly shop online, retailers that offer Buy Online Pick Up In Store (BOPIS), should expect a surge in its adoption, and reinforce their online infrastructure and in-store operations to cater to the rising demand.

    In addition to disruptions in the supply chain, several other mission-critical areas are likely to get affected too.

    Keeping Up With The Online Surge

    As with any event of this magnitude, the business implications reach far and wide. The following are a few areas that we’ve identified as critical, based on our experience working with retailers and brands. Being aware of and focusing on these issues are likely to alleviate some of the issues faced by consumers today.

    Fair pricing: There have been several reports of price gouging on e-commerce platforms. Examples include 2-ounce Purell bottles being sold for $400 and face masks for up to $20. While these prices have mostly been set by third party merchants, brands are likely to face the flak from consumers. A recent Bloomberg article reported that online retailers still rely partly on employees to manually monitor these items. This approach has obvious limitations, such as products quickly reappearing on the website after being de-listed. Brands and e-commerce platforms will need to explore automated ways of controlling their online pricing practices at large scale.

    3P merchant and counterfeit management: Often, unauthorized third-party merchants selling an original manufacturer’s goods are the ones who unreasonably inflate prices. These merchants tend to test the markets on online marketplaces with their pricing, which adversely affects the brand image of the manufacturer. Further still, they sometimes list counterfeit or fake goods that make incorrect or extravagant claims. Brands will need to swiftly identify and de-list these merchants from online marketplaces.

    Ensuring stock availability: During times like these, it’s a common sight to see empty aisles at supermarkets selling items like canned food, water, paper products and personal care products. Consumers will benefit from brands monitoring their stock availability at stores, which will help them better align their supply chain operations to the rapidly changing demand patterns across the U.S. map. This way, efforts can be more targeted at regions with severe shortages.

    Content compliance: Helium 10, a technology provider for Amazon sellers, reported that since 26 February, 90% of searches on Amazon are coronavirus related, and searches for hand sanitizers spiked to 1.5 million searches in February compared to 90,000 in November. As a result, to arrest exploitative practices, some online marketplaces have announced policy guidelines on product content claiming health benefits. Words like ‘Coronavirus‘, ‘COVID-19‘, ‘Virus‘ and ‘epidemic’ are, in fact, prohibited.  Amazon has already de-listed several merchants claiming fraudulent cures. Ebay has gone as far as to ban all new listings for face masks, hand sanitizers, and disinfecting wipes, due to regulatory restrictions. In this context, retailers and brands will benefit from deploying tracking mechanisms that quickly identify offenders.

    The areas of business presented above are by no means a comprehensive list for retailers and brands to rely on during this time. Still, these are critical impact areas for them to address, even as huge efforts are made toward managing highly stressed supply chains.

    DataWeave Offers Support

    The coronavirus outbreak is likely to get worse before it gets better. As we enter unchartered territories, DataWeave is offering to contribute in small ways, pro bono, by leveraging our expert talent and competitive intelligence technology platform, to address some of the challenges faced by retailers and brands.

    We’re announcing a limited-time, no-cost offer to detect and report on price gouging, the presence of unauthorized third-party merchants, as well as stock availability across U.S. ZIP-codes. This offer will be valid for 4-6 weeks (timeline will be flexible based on how the outbreak develops) and limited to monitoring the top 10 U.S. online marketplaces, as well as critical product categories such as medicinal and hygiene-related products, emergency food items, survival-related products, fuel, etc.

    Reach out to us for further details.

  • Black Friday 2019 Pricing for Online Furniture

    Black Friday 2019 Pricing for Online Furniture

    For today’s shoppers, instant gratification is the need of the hour. It’s, therefore, no surprise that furniture e-retail has been picking up steam over the last decade. What was once a norm to physically touch and feel before making a purchase, is now just a few clicks away. Retailers have bridged the gap by making the purchase process as seamless as possible – easy finance options, hassle-free returns and variety.

    While several factors play a role in driving consumers to shop furniture goods online, price is the primary motivator, as is the case with most popular product categories sold online.

    During Black Friday 2019, DataWeave performed an analysis on a sample of 23,000+ products across six of the top furniture retailers – Amazon, Home Depot, JCPenney, Target, Walmart and Wayfair. Ten product types were covered in the furniture category (such as Beds, Bookcases, Mattresses, Sofas, etc.) and the analysis focused on the top 500 ranked products of each product type.

    To get an accurate depiction of the additional markdowns during the sale, we took the mode of the prices for the preceding week and compared them with that during the sale.

    Additional markdowns

    Target (25%) and Home Depot (21%) marked down their prices most aggressively during the sale.  JCPenney and Wayfair stood out for offering additional markdowns on the highest portions of their ranges (67% and 46% respectively), even though the average markdown percentage was fairly conservative. Amazon and Walmart were steady as usual, with additional markdowns of 8% and 10% on 15% and 17% of their assortment, respectively.

    Premiumness

    To further understand the furniture pricing strategies of these retailers, we categorized their products into buckets of how expensive or cheap the product is (High, Medium, and Low in terms of price), relative to the rest of the products hosted by the retailer, and studied how the additional markdowns varied across these buckets. Where the MRP was not displayed, the most expensive price of the product during the holiday period prior to Black Friday was considered to define the “premiumness” of the product.

    Two patterns clearly stand out from this analysis. Most of the retailers remained relatively equitable between their premium categories with nothing significant to report in terms of varying markdowns. Home Depot and and JCPenney are the only exceptions here, but not by much.  The other interesting insight is that the percentage of marked-down products had a near unanimous pattern of the high level being the most covered, followed by the medium and then low.

    Therefore, while there wasn’t a significant variation in the average markdown across premiumness levels, a larger portion of the high-premium goods were consistently offered at a discount across all retailers.

    Popularity

    Much like our premiumness categorization, we investigated products based on their popularity levels as well. We’ve defined popularity using a combination of the average review rating and the number of reviews for each product, condensed to a scale of low, medium and high.

    We observe slightly different furniture pricing strategies adopted by retailers across popularity levels. While Home Depot, Amazon, and Wayfair chose to provide higher markdowns on their more popular products, Target, JCPenney, Walmart chose to provide higher markdowns on their least popular products. In addition, a larger portion of the least popular products were consistently offered on discount by almost all retailers.

    In combination with our findings across premiumness levels, we can surmise that part of the strategy of most retailers was to liquidate their stock of expensive and unpopular products during the sale.

    Price Change Activity

    As part of our analysis, we also tracked the level of pricing activity across retailers over the last week of November, in terms of the number of price changes made as well as the average price variation for each retailer.

    In general, we can see that Amazon and Walmart  consistently made several price changes through the week, though the average magnitudes of these price changes were relatively low. This echoes the pattern we’ve observed through our analysis of other product categories during the sale event, as well.

    Also, we see an almost coordinated increase in the number of price changes and the average magnitude across the 27th and 28th of November. This is likely an attempt by the retailers to get a head start on Black Friday deals.

    An unusual and interesting pattern was observed with Wayfair, which started out the week with the most changes at 2500. It then tanked the next day and hovered around 500 till the 28th, only to spike to 2500 again. All these changes though, had their variation in and around 5%.

    In summary, its interesting to observe how different retailers approached the much-anticipated holiday season sale events differently. As one might expect, there are significant variations among retailers in the aggressiveness of discounting activity as they approached Black Friday, and on Black Friday itself. Contrasting pricing strategies for popular and premium goods were also observed.

    If you would like to learn more about the pricing of top U.S. retailers across other product categories like consumer electronics, fashion, and beauty & health, check out our series of articles on Black Friday 2019.

  • Health & Beauty on Black Friday: Analyzing Pricing Strategies of Top U.S. Retailers

    Health & Beauty on Black Friday: Analyzing Pricing Strategies of Top U.S. Retailers

    We’ve come a long way from face paint and medicinal herbs to multi-billion dollar industries revolving around health and beauty. Customers are getting increasingly bombarded with variety that promises something for everyone. In fact, a recent DataWeave study identified Health & Beauty as one of the most popular CPG categories in the U.S., both in terms of assortment strength and brand concentration. As with most other categories, pricing activity around Health & Beauty is especially abuzz when Thanksgiving weekend comes around.

    As part of our series of articles analyzing the pricing of leading retailers across categories on Black Friday, the DataWeave team performed an analysis on a sample of 14,000+ products across six top retailers – Amazon, JC Penney, Macy’s, Nordstrom, Target and Walmart. Seven product types were covered across the category, such as Fragrance, Hair Care, Makeup, etc. and the analysis focused on the top 500 ranked products of each product type.

    Additional markdowns

    For this analysis, we considered the mode of the prices for the week before and compared it with that during the sale. This painted a picture of the additional markdowns for the duration of the sale.

    Similar to our prior coverage of the Fashion category during Black Friday, Macy’s had the broadest reach in terms of the marked down products at 25.6%. The average percentage of the markdowns was 22% and was only eclipsed by JC Penney with an average of 34.7%, though this was only offered on 3% of its range. At the other end of the spectrum, Amazon and Walmart had the lowest markdowns at 8.9% and 8.4% respectively but were among the top three in products covered (18% & 12%). Target and Nordstrom offered mid-range markdowns across the board but on a rather conservative selection of products of 5% and 3%, respectively.

    Additional markdowns by product types

    When we delved further into the product types, we noticed that a majority of the retailers heavily marked down makeup, shampoo & conditioner and men’s hair care products. The table illustrates the top three discounted categories for each retailer we analyzed.

    Premiumness

    We categorized the products across retailers into buckets of how expensive or cheap a product is, relative to the rest of the products hosted by the retailer in the respective product type. Where the MRP was not displayed, the most expensive price of the product during the holiday period prior to Black Friday was considered for this categorization. We then tagged products as High, Medium and Low in terms of product premiumness, with High referring to the more expensive products.

    In line with previous trends, Macy’s had the highest markdown on its high level products at 32.8%. It also had the widest coverage for the category at 20%. Amazon, Macy’s, Target, Walmart followed the expected approach of providing higher markdowns on the more premium products, and also on a higher portion of these products. This would be consistent with their goal of providing attractive offers on premium goods while also protecting their margins.

    JC Penney and Nordstrom were exceptions here, with JC Penney providing higher markdowns on its cheaper goods, while Nordstrom focused its markdowns on the medium bucket.  That being said, it should be reiterated that the portion of products with markdowns for both thee retailers was relatively small.

    Popularity

    Similar to categorizing the products at levels of product premiumness, we categorized them into levels of popularity as well. Here, popularity is defined using a combination of the average review rating and number of reviews obtained for each product.

    Interestingly, no consistent pattern has emerged that indicates a strategic focus on factoring product popularity into their pricing strategies for Black Friday.

    Macy’s, JC Penney, and Nordstrom chose to provide higher markdowns on their highly popular products, of which only JC Penney and Macy’s chose to also markdown a higher portion of their highly popular products. It was just as common though to see retailers (including Amazon) marking down the prices of their least popular products. This is likely an attempt by the retailers to liquidate their excessive stock of less popular products during the sale.

    Price Change Activity

    As documented quite often in recent years, the Black Friday sale is no longer limited only to a single day, but attractive offers are often seen right through November, especially over the last week of the month. We tracked the level of pricing activity across retailers over the last week of November, in terms of number of price changes as well as the average price variation for each retailer.


    In typical fashion, we observed that Amazon had the most number of pricing changes by a large margin, peaking at 2500 for the set of products tracked. The next in line was Walmart a long way down at 618 changes on the 27th. Even after the multiple changes, their average price change variation remained at the lower end of the scale – in and around 10%.

    The rest of the retailers exercised fewer price changes, with the slight exception of Macy’s in the days leading up to Black Friday. However, the changes almost ceased from the day before only to marginally rise on the 29th.

    While all the retailers tended to follow a predictable pattern of decreasing variation on the 28th and sharply increasing it the next day, Nordstrom and Walmart did the exact opposite, having likely chosen to jump the gun in offering discounts during Black Friday.

    Conclusion

    To conclude, we deduced that Macy’s had relatively higher markdowns on more of its products than the rest. JC Penney, Nordstrom and Target offered high markdowns on the face of it but on a very small section of products. Unsurprisingly, Amazon and Walmart stayed true to their past patterns and remained conservative in their additional markdowns during the sale but generous in their reach.

    Have a look here at our other observations regarding the Black Friday sale and stay tuned for more insights from our analysis of other product categories!

  • Fashion on Black Friday: Decoding Pricing Strategies of Top U.S. Retailers

    Fashion on Black Friday: Decoding Pricing Strategies of Top U.S. Retailers

    Over the last few Thanksgiving Weekend sales, fashion, what was a category once typically reserved for offline purchases, has evolved into a regularly marked down and popular category as shoppers get more comfortable making these purchases online. This can be credited to the ease of purchase that retailers offer – trials, returns, etc. combined with the desire for shoppers to refresh their wardrobe for the new year ahead.

    At DataWeave, we performed an analysis on a sample of 40,000+ products across six of the top fashion retailers – Amazon, Bloomingdale’s, Macy’s, Nordstrom, Target and Walmart. . Twenty product types were covered across both men’s and women’s fashion and the analysis focused on the top 500 ranked products of each product type.

    Additional Markdowns

    For the sake of this analysis, we compared the prices during the sale with the mode of the prices the week before. This gave us a clear picture of the additional markdowns during the sale period and therefore, the additional value to shoppers.

    Dominating the fashion space, Nordstrom and Macy’s came in hot with the most aggressive discounts on the largest share of their product range, 36% and 27% respectively, on more than a quarter of their range. In the women’s lineup, Target offered a 36% markdown, compared to ~22% for its men’s lineup. Across both categories though, this was only on 1% of Target’s range. In what seems to be an expected trend, Amazon and Walmart remained relatively conservative with their additional markdowns, as they tend to be competitively priced even during non-sale periods.

    Drilling down into the product types, we noticed that very aggressive markdowns were being offered on t-shirts and skirts (over 40%). Swimwear, hosiery, handbags, and sunglasses were other product types that were featured with attractive prices across websites.

    Product Premiumness

    We categorized the products across retailers into buckets of how expensive or cheap the product is, relative to the rest of the products hosted by the retailer. Where the MRP was not displayed, the most expensive price of the product during the holiday period prior to Black Friday was considered. We then bucketed products in categories of High, Medium and Low of product premiumness, with High containing the more expensive products by price.

    Amazon, Bloomingdale’s, Macy’s and Nordstrom chose to markdown the more expensive products in their range higher than the rest of their assortment. This aligns well with what one would expect retailers to do as shoppers tend to expect attractive offers on the more expensive range of products. Also, with the more expensive products, retailers and brands likely have more room to be flexible with margins. Amazon shows a consistent strategy here, having provided higher markdowns on a relatively higher portion of its most premium products and vice versa. This trend can only otherwise partially be seen with Macy’s.

    Walmart though, chose to go the other route and provided higher markdowns on its least premium products. This might have been a targeted effort to maintain their perception among shoppers as a destination for affordable goods. Though it’s important to note here that these markdowns were seen only on a small set of cheap goods – just over 5%.

    Price Change Activity

    Walmart, Nordstrom and to an extent, Bloomingdale’s, had an almost consistent number of price changes throughout the week. Nordstrom recorded the most significant dip in the magnitude of the markdowns over time.

    Amazon and to a smaller degree, Macy’s, had more price changes during the week. However, Amazon’s average price variation remained among the lowest whereas Macy’s clocked in the highest by Black Friday at just under 40%.

    Across the board, the price changes dipped on the 28th and then rose again on the 29th. This can be seen as a conscious effort to have more aggressive activity on Black Friday.

    In summary, fashion-first retailers like Macy’s and Bloomingdale’s went all-in during the sale, while Nordstrom, a multi-category retailer, stood out for its aggressive focus on fashion.

    Amazon and Walmart continued to operate within the competitive space that they’ve carved out for themselves as the leading retailers in the US. We observed a similar trend even in the other product categories we’ve analyzed for the sale. Check out our analysis of the Electronics category during Black Friday here.

  • Black Friday Sale: Breaking Down Pricing Strategies in Consumer Electronics

    Black Friday Sale: Breaking Down Pricing Strategies in Consumer Electronics

    Online holiday shopping (Nov-Dec) in the US for 2019 is projected to be $143.7B, a 14.1% increase from 2018. This sets a rather exciting stage for retail giants in the battle to claim market share. Interesting patterns emerge as each one tries to out-smart the other. Black Friday, in particular, is when most of the activity was expected to be concentrated.

    Inevitably, consumer electronics had strong representation, according to research by Coresight. As traffic steers more towards online shopping, there’s an increased sense of comfort in purchasing big ticket items on an ecommerce platform. There are multiple reasons why electronics lead the race during the holiday season – easy to gift, personal indulgence, comparatively shorter shelf life and well, because who among us can really resist a gadget on sale.

    In line with expectations during the season, there’s been a slew of generous discounts across the board. According to prior trends, Amazon was on course to be the lowest priced. In order to assess this, we decided to study a sample of 1000 products on Amazon and match them against its competitors like Walmart, Target, Best Buy and New Egg. Doing this gave us an accurate picture of the comparative pricing across retailers during this season, right up to Black Friday.

    Competitive Pricing Analysis

    There is a commonly held assumption that Amazon is the lowest priced retailer in most cases. How true is that? Here are our findings:

    We tracked the split across three scenarios during the holiday period – Amazon being exclusively the lowest priced, Amazon sharing the lowest priced spot and Amazon not being the lowest priced.

    Clearly, Amazon monopolized the share of lowest priced products during the entire period – with its share of lowest priced products ranging between 86% and 60%. The dip from 86% to 60% was immediate on the 27th, as Amazon’s competitors caught up. In general, Amazon’s share of lowest priced products fell from 76% to 62% on Black Friday, as its competitors launched their most aggressive promotional campaigns for the holiday season. As shown in the next chart below, a large portion of this can be attributed to Target’s pricing activity.

    Relative Price Index

    From 21 November until Black Friday, we calculated the price index across retailers, which indicates the relative pricing levels each day for the set of matched products – the lower the price index, the lower the average relative price.

    Unsurprisingly, Amazon has been consistently the lowest priced by a fair margin. A few rungs down, New Egg and Fry’s have been going head-to-head with their price positions. Target on the other hand, underwent a spike in relative pricing from 26-28 November. To sum up, in order of lowest pricing, it’s Amazon, Best Buy, Walmart, New Egg, Fry’s and Target.

    Additional Markdowns

    While the insights above were unearthed by comparing the products of retailers against a sample of 1000 Amazon products, we went further and performed a separate analysis on a different sample of 15,000+ products across retailers, which focussed on the top 500 ranked products of each product type for Amazon, Best Buy, Target and Walmart. The product types considered include Digital Cameras, DSLRs, Headphones, Laptops, Mobile Phones, Refrigerators, Tablets, Televisions, USB Flash Drives and Wearables.

    Here, we compared the prices during the sale with the mode of the prices of the same retailer the week before. This put into perspective the level of additional markdowns during the sale period, enabling us to better understand the additional value to shoppers during the sale period (since discounts are often offered during non-sale periods too).

    Looking at opposite ends of the spectrum, we find Amazon with the least drastic markdowns during the sale as it tends to consistently have lower prices across the board. At the other end, there’s Best Buy and Target with the most aggressive markdowns; Target taking the lead, 25.5% on 35% of its products, which is also consistent with the activity we observed in the previous sample of matched products.

    Going further, we’ve broken down the markdown activity by the top product types for each retailer. Across the board, we observe attractive discounts on Headphones, USB Flash Drives and Mobile Phones.

    Price Change Activity

    With the proliferation of pricing intelligence tools (often driven by algorithms), dynamic pricing is a commonly observed behavior among retailers. We analyzed this trend during the holiday period to identify the retailers that are most aggressive in their price change activity. The following charts reveal the number of price changes performed by retailers in our sample as well as the average price variation during this holiday period.

    Amazon made several price changes during the week but with a relatively low magnitude, since it was the lowest priced anyway through the week. The only other player with similar activity was Walmart. Target and Best Buy had significantly fewer price changes but when they did make the changes, the magnitude was much larger. Their focus was solely on a smaller, select set of products where they went all in.

    In conclusion

    As the years advance, the duration of holiday sales is no longer restricted to the actual holiday, but the days preceding and following them as well. With more and more people getting increasingly comfortable with online shopping (14.1% increase from 2018), buying habits are evolving too. Big retailers are cashing in on this and driving their pricing strategies to keep up with the evolution.

    One of the clear cut findings from our research is that there are two primary paths they take: smaller additional markdowns over a longer period and larger additional markdowns over a shorter period. Whichever path they choose, retailers need to be on top of the game with valuable insights, that give them a competitive edge. For accurate and large scale competitive intelligence, reach out to us.

  • Amazon on course for an aggressive Black Friday

    Amazon on course for an aggressive Black Friday

    The holidays are around the corner and that much awaited holiday cheer, has now become directly proportional to the arrival of an Amazon package. According to a new report, in partnership with Bain & Company, DataWeave has observed that early in November, Amazon had the lowest price 30%-50% of the time and matched the lowest price 35%-60% of the remaining cases, based on an analysis performed on a sample of over 16,000 products across 10 websites and 5 product categories.

    Aggressive pricing strategies have been Amazon’s modus operandi for a while now and it’s not about to change this season. In the build up to the Black Friday promotions this year, they even slashed their prices of the rarely discounted Apple products, such as the iPad Pro. This sets the tone for what shoppers can expect as the holiday season comes upon us.

    Results of a recent survey, published as part of the Bain report, revealed that ‘value for money’ was the primary concern that influence purchasing decisions, across categories. In the same breath, the respondents went on to say that they perceive Amazon as a ‘value leader’, sans womens’ clothing and pet supplies.

    Although this season might continue to see Amazon rake in the most market share, competitors are not far behind. There’s heavy investment from the likes of Walmart and others in order to negate the effects of the undercut. If these competitive responses become louder, the dent on customer perception could begin to tilt to more neutral ground.

    Stay tuned as we follow this pattern during the season and release our findings over the next few weeks.

    For access to the full article that was published in the Retail Holiday Newsletter by Bain & Company and powered by DataWeave, click here.

  • Prime Day 2019 Fashion: Were the Deals as Attractive as the Merchandise?

    Prime Day 2019 Fashion: Were the Deals as Attractive as the Merchandise?

    Target and Walmart offered more appealing discounts than Amazon during Prime Day 2019.

    Statista estimates that e-commerce fashion accounted for approximately 20.4% of overall fashion retail sales in the United States in 2018, which amounted to about $103 billion in absolute terms. According to Internet Retailer, apparel is the largest and among the most competitive retail categories in e-commerce. Moreover, as a share of total apparel and accessories sales, online apparel sales is growing at a faster rate than US e-commerce as a whole.

    Given the high-growth and competitive nature of the category, we at DataWeave were interested to find out how high the stakes got during the fifth annual Prime Day earlier this month.

    Our Methodology

    Since Prime Day is no longer necessarily an Amazon event (since competing websites often offer attractive discounts as well), we tracked the pricing of several leading retailers selling fashion apparel, footwear, and accessories to assess their pricing and product strategies during the sale event. Our analysis was focused on additional discounts offered during the sale to estimate the true value that the sale represented to its customers. We calculated this by comparing product prices on Prime Day versus the same prices prior to the sale.

    Our sample consisted of 20 product types across women’s as well as men’s fashion categories. While we did monitor exclusive fashion retailers Macy’s, Bloomingdales, Nordstrom, and Neiman Marcus, we did not find them offering any additional discounts – an interesting insight all on its own since they’ve clearly chosen not to compete with Amazon during the two days of the Prime Day sale. We therefore restricted the rest of our study to Amazon, Target, and Walmart – the latter two of which interestingly offered immensely aggressive discounts in their apparel categories.

    The Verdict

    Despite owning the day at least in name, Amazon was found to offer the lowest additional discounts among the retailers studied. Target and Walmart, on the other hand, ensured that they didn’t lose out on market share this Prime Day by offering substantially high discounts of their own. While Target was the most aggressive with a steep average markdown of 26.5%, Amazon closed out the bottom at 8.4%.

    Walmart and Target didn’t seem particularly focused on compensating their sharp discounts with price increases in other products – their focus seems to have been solely only on offering timely discounts during the sale. Amazon, on the other hand, marked up just about as many products as it marked down, with the markup margin being close to double that of the markdown in an effort to protect margins during the sale.

    Top product types by additional discount

    Target and Walmart both offered aggressive discounts across their top product categories. Walmart ended up with a marginally higher overall average additional discounts on product types like Shirts, T-shirts, and Tops.

    Interestingly, though Amazon offered moderate discounts across its top categories (Lingerie, Swimwear, and Underwear), the volume of marked down products was very limited.

    Additional discounts across popularity levels

    We determined popularity using a combination of average review rating and number of reviews, and the resulting scores were categorized as low, moderate, and high.

    When it came to discounting popular products, there were clear differences in strategy among all the three retailers. Amazon, which interestingly had close to 60% of its products in the low popularity bucket, chose to offer the highest discounts in the same category – indicating an effort to clear its stock of unpopular products. Target and Walmart, on the other hand, focused their discounts on moderate rated products.

    Additional discounts across product “premiumness” levels

    Premiumness was calculated as the average selling price before the sale event. This was divided into four percentile blocks, with higher percentile blocks indicating higher selling prices.

    As found in the electronics and furniture categories that were analyzed previously, most of the discounting activity was focused on the lower end of the premium spectrum with a view to protect margin – despite a largely equitable distribution of discounted products across percentile ranges (with the exception of Target, which had a discounted assortment heavily dominated by its least premium products).

    This indicates a clear strategy to protect margins, while still maintaining the perception of promoting attractive offers to draw traffic. Target and Walmart both offered substantial additional discounts of close to 30% on their least premium products, while at 12%, Amazon offered less than half that discount.

    Additional discounts across visibility levels

    Given the fairly large number of SKUs across the fashion category in general, the discounts across visibility levels understandably didn’t vary much when compared to the more pronounced fluctuations observed in the electronics and furniture categories. This is also largely because consumers tend to explore lower ranked products more so in the fashion category than in other categories.

    Across product categories, we’re seeing lower-than-expected additional discounts on Amazon this Prime Day, coupled with more aggressive pricing activity by Amazon’s competitors. While this puts more pressure on Amazon, this also is a strong validation of Prime Day as a key annual sale event on the US shopper’s calendar.

    Curious to know how Amazon and its competitors performed in other product categories this Prime Day? Watch this space for more!

  • Online Furniture Pricing Strategies on 2019 Prime Day

    Online Furniture Pricing Strategies on 2019 Prime Day

    Just as with electronics, other retailers actually offered far better discounts than Amazon during Prime Day 2019.

    Online furniture sales have risen significantly since the 2000s, driven largely by a growing array of products, and even more so by the convenience of avoiding travel and crowded stores. According to Statista, online furniture and homeware sales were estimated to reach approximately $190 billion in 2018, with China and the United States accounting for over $60 billion in revenue each.

    Thus, furniture has quickly become a key product category during sale events globally – and Prime Day was no different. At DataWeave, we got down to figuring out exactly how plum those deals were this year.

    Our Methodology

    We tracked the pricing of several leading retailers selling home and furniture products to assess their pricing and product strategies during the sale events. Our analysis was focused on additional discounts offered during the sale to estimate the true value that the sale represented to its customers. We calculated this by comparing product prices on Prime Day versus the same prices prior to the sale. Our sample consisted of the top 1,000 ranked products across 10 popular product types, including beds, dining table sets, sofas, entertainment units, and coffee tables – analyzed for five retailers (Amazon, Home Depot, Target, Walmart, and Wayfair).

    The Verdict

    As we found in the electronics category, there were surprising price spikes in this category too – with Target reporting an average increase as high as 14.7%, and Amazon clocking a still moderately high 9.4%. Target also reported the highest distribution of products with price markups. Home Depot indicated the lowest price increase at 4.6%.

    When it came to additional discounts, Amazon fell short of expectations – at 4.7%, it offered the lowest average among its competitors. Target, on the other hand, was extremely aggressive both in terms of additional discounts and volume of discounted products.

    To conclude, all the retailers observed seemed to be keeping a close watch on their margins by countering price reductions with nearly equivalent surges elsewhere in their assortment.

    While there was no single product type that was found to be popular across all five retailers, it was clear that Target was again the most aggressive at offering discounts. It also had among the largest product ranges on discount.

    Amazon chose to follow a very moderate route both in terms of average discount and discounted product volume.

    Additional discounts across popularity levels

    We determined popularity using a combination of average review rating and number of reviews, and the resulting scores were categorized as low, moderate, and high.

    There doesn’t seem to have been much of a focus on low-popularity products in terms of additional discounts. Most of the attention was focused on products with moderate popularity, since there isn’t much of a need to be aggressive on price for highly popular products, and products with lower popularity aren’t really worth promoting.

    The only retailer that offered a higher discount on its most popular products was Home Depot. Walmart, too, seemed reluctant to let go of the opportunity to capitalize on popularity – it chose to offer the same discount on moderately as well as highly popular products.

    Interestingly, Walmart seems to have a disproportionately large share of products in its low popularity category – something it should possibly evaluate in the future in terms of brand quality, products, and service.

    The percentage distribution of products mostly indicated a linear relationship, with the highest distribution usually being offered for highly popular products. The exception was Wayfair, which offered a much larger array in its moderately popular category.

    Additional discounts across product “premiumness” levels

    Premiumness was calculated as the average selling price before the sale event. This was divided into four percentile blocks, with higher percentile blocks indicating higher selling prices.

    Most of the discounting activity seems to have occurred in the lower end of the premium spectrum, with a view to protect margin – despite a largely healthy distribution of products across percentile ranges. This indicates a clear strategy to protect margins, while also promoting attractive offers to draw traffic.

    However, there are a couple of exceptions – Target was consistent throughout the “premiumness” spectrum, resulting in the highest overall discounting activity. Home Depot too was aggressive, but selectively so – it chose attractive pricing for the lower and higher ends of its assortment.

    As expected, many retailers showed higher discounting activity in the higher ranks of their listing pages. As usual, though, there are a few exceptions here too. Home Depot and Wayfair indicated unusual patterns – perhaps relying on search results as opposed to organic listing page results. On the other hand, Target again indicated a consistent pattern, with mostly similar discounts across visibility levels.

    Overall, across all parameters analyzed, both the Electronics and Furniture categories have been treated quite similarly in terms of pricing activity by most retailers. Is Prime Day really all about its marketing hype, or will it live up to its promise in at least one segment? Stay with us to find out as we follow through with our series of articles analyzing various product categories on this year’s Prime Day.

  • A Study of Deals on Amazon Prime Day 2019 | DataWeave

    A Study of Deals on Amazon Prime Day 2019 | DataWeave

    Our preliminary analysis reveals that Prime Day 2019 had other retailers offering better deals than Amazon in many cases.

    As Prime Day extended into an additional day this year, Amazon seems to be hitting the right note with its customers, going by the revenue it’s raking in. This year, the longest Prime Day event ever witnessed a sales increase of 72%overtaking Black Friday and Cyber Monday combined.

    At DataWeave, we were curious to find out how prime these deals were, and if in fact other retailers were offering better discounts. We started with the electronics category, which remains among the most popular categories year on year.

    Our Methodology

    We tracked the pricing of several leading retailers selling consumer electronics to assess their pricing and product strategies during the sale event. Our analysis was focused on additional discounts offered during the sale to estimate the true value that the sale represented to its customers. We calculated this by comparing product prices on Prime Day versus the prices prior to the sale. Our sample consisted of up to the top 1,000 ranked products across 10 popular product types in consumer electronics on Amazon, Best Buy, Target, and Walmart.

    The Verdict


    What we found most surprising was that across retailers, some portions of the assortment underwent price increases as well. While Amazon indicated the lowest increase at 9.1%, Best Buy indicated an increase as high as 27.1%. However, Amazon reported the highest percentage of products (6.9%) that showed a price increase.

    Equally surprising was that Amazon reported the lowest price reduction at 6.3% – Walmart, Target, and Best Buy in fact reduced their prices by much larger margins than Amazon did. A point to note here, however, is that Amazon did report the highest percentage of additionally discounted products – with Best Buy coming in at a close second.

    This goes to show that Prime Day, for all its hype, does not in truth offer the best deals to Amazon shoppers. This, of course, is expected based on the competitors’ perspective of wanting to avoid losing market share. As a result, shoppers would be well advised to compare prices across websites to find the best deal.

    Top product types by additional discount


    USB flash drives were a popular product category across all four retailers analyzed, with Best Buy offering the best average additional discount at 40.7%. Other popular product types ranged from the usual personal devices such as mobile phones, tablets, and smartwatches to home appliances such as refrigerators and TVs.

    Additional discounts across popularity levels

    We determined popularity using a combination of average review rating and number of reviews, and the resulting scores were categorized as low, moderate, and high.

    Interestingly, discounts were not found to be directly proportional to popularity. Except Walmart, all the retailers tended to offer the best discounts on products that enjoyed moderate popularity. This makes sense, since there isn’t a strong need to be aggressive on price for highly popular products in any case. On the other hand, products with lower popularity aren’t really worth promoting. Walmart, which was the exception, reported a higher discount on low- and high-popularity products than it did on moderately popular products.

    The percentage distribution of products did mostly show a directly proportional relationship, with the highest distribution usually being offered for highly popular products. The exception in this case was Best Buy, which evidenced a much higher distribution in its moderately popular goods.

    Additional discounts across product “premiumness” levels

    Premiumness was calculated as the average selling price before the sale event. This was divided into four percentile blocks, with higher percentile blocks indicating higher selling prices.

    In general, all retailers were found to have slightly higher additional discounts in the lower end of the “premiumness” spectrum. This is still a smart move, as it enables sellers to save on margin while still promoting attractive discount percentages. Interestingly, Amazon offered the lowest additional discount – a flat 5% – across all categories, despite offering more or less competitive product distributions compared to other retailers.

    Additional discounts across visibility levels

    Here, too, the lower end of the spectrum mostly witnessed higher additional discounts. This tactic actually offers double benefits – one, the most attractive discounts are offered in the higher realms of visibility, thus effectively enticing consumers to buy these products, and two, it helps build a low price perception (despite this not holding good as one delves deeper into the higher ranks). Again, it’s interesting to note that Amazon didn’t offer the highest discounts here either – in fact, it mostly offered the lowest additional discounts.

    All in all, it seems that Prime Day isn’t all it’s hyped up to be, at least not in the Electronics segment. How about other categories? Watch this space for more insights!

  • The Importance of Pricing Parity for Brands

    The Importance of Pricing Parity for Brands

    With bricks-and-mortar stores steadily increasing their online presence, the balancing act of pricing online and in-store is now more important and complex than ever. Companies spend years building brands and brand equity. Yet, a misplaced or poorly executed pricing strategy to handle both online and offline pricing can erode that equity with consumers very quickly.

    This problem is not new. It first started when Clubs like Costco and Sam’s started popping up in the 80’s. Suddenly, brands had to figure out a way to balance Club and Grocery pricing while taking advantage of a new, fast-growing channel. The biggest difference between now and then is that consumers now can check prices within seconds on their phone.

    So, how do you avoid losing your brand equity while ensuring price parity across online and offline channels?

    The key areas to consider are:

    1. Product Mix

    Do you have a broad enough mix of product sizes and case configurations for each channel? To maximize your sales and minimize your price disruption, reviewing your supply chain and product mix to ensure you are able to deliver value to both online and offline retailers is critical. Each channel is looking for ways to improve and maximize your brand sales. If you do not give them the right size and case configuration to enable them to increase margins, you will end up relying disproportionately on trade spend (dollars a brand spends with a retailer to promote products) to do so, or find your product on page 212 of every search.

    Examples of this strategy can be seen with companies offering only “bundled” items such as 12 cans or a large case on online marketplaces, while other retailers offer individual cans for purchase. This allows your online partners to make up margin by shipping a full case and not going through the process of breaking down a case and shipping single units. Also, this allows bricks-and-mortar retailers to have a sharper price point to lure consumers into the store. This strategy has played out well for many brands as they dealt with the rise of Club stores and can be played successfully in e-commerce as well, benefiting all parties.

    2. Price Lists

    Do you have harmonized price lists that do not favor one channel over another? If you do not, you are likely subsidizing the higher list cost in a channel with trade spend, which is highly inefficient. A single price list that provides an adequate price slope between the various sizes across your product range will maximize your ability to manage both channel pricing and brand equity.

    The single largest mistake brands tend to make is thinking that offering “net price” price lists to online marketplaces will benefit them while they use trade dollars in bricks-and-mortar stores to cater to EDLP (Everyday low price) customers. This approach is quite inefficient in many ways, and consumes valuable time and resources that can otherwise be better utilized. Having a single price list with the same price offered to all retailers allows for a more manageable and equitable pricing environment. It also enables a more profitable distribution of trade spend across the most effective areas to invest in for each retailer.

    I have worked with two brands in the past – one that managed two separate price lists and one that we implemented as a single-standard. While the one with the single price list saw sales grow and trade spend remain constant, the other saw trade spend double in just two years as it got caught in a scenario of always having to placate one side of the equation or the other.

    3. Trade Spend

    Today’s brands need to focus on a balanced trade spend strategy to address each channel’s unique needs. Using trade spend with online retailers can be tricky, as the channel is usually assumed to be the lowest priced anyway. Still, it can be used to drive traffic and offset supply chain costs, in order to ensure sufficient margins for the retailer, which will keep you off the CRAP (Can’t Realize A Profit) lists. Meanwhile, as JC Penny quickly learned when it made the disastrous shift to EDLP, consumers still want in-store discounts and sales.

    The best approach I have worked with is to set a single dead net price inclusive of all trade. For example, if your product’s standard list cost is $6.80 and you have a dead net price for promotions (or EDLP) of $5.40, then all retailers – online and bricks-and-mortar – are on equal footing. The only variance in the price for consumers will be the margin each operator chooses to take. This approach is not without issues, as you have to apply all elements of trade spend (such as ad fees, etc.) to the promotional unit costs to ensure you are truly capturing the dead net cost of the retailer.

    Still, the advantage of utilizing this approach is that when a retailer complains about the price another is offering to consumers, the conversation turns to margins being taken and not the cost of the product. At the very least, this approach provides a common ground on which to have a constructive conversation with all retailers.

    So why does this all matter so much to a brand?

    The road to selling online is littered with disaster and missed expectations for sales. Most manufacturers that jumped to online sales without considering pricing quickly learned that abandoning one channel for another does not lead to increased sales. Conversely, we have seen a few brands go from online only to in-store as well. These brands seem to have learned from the others’ mistakes and rarely will you find price variances between the online and offline channels. Instead, you tend to see these brands growing, as online consumers start experiencing the brand in-store.

    A Business To Community study by Larisa Bedgood in 2019 showed that “lower price” was second to only “convenience” for why consumers shop online, while 51% of consumers said that the biggest drawback to shopping online was not being able to touch and feel the product. Brands that are able to bridge the gap and provide consumers with the convenience of online while also showing up well in-store at the right price point will be able to break out of the stagnate 1-2% (if they are lucky) growth most CPG companies are experiencing. If online selling is growing 40-50% a year, why are these companies only managing brand declines and flat growth? I believe it is mainly due to the lack of a proper pricing parity strategy for the two channels along with a lack of actionable e-commerce data.

    Brands that do not focus on all three areas listed above often find themselves in a constant churn of conversations with retailers on all sides, which will typically lead to either online marketplaces or bricks-and-mortar stores deprioritizing the brand in promotions or search. Finding and setting a level playing field will allow for a balanced trade spend and growth for brands on both platforms, while also enabling a brand to break out of the net 1% growth that is plaguing a lot of CPG brands today.

    Outside of deploying basic pricing principles for your brand, I would also suggest early and strong investments in data, systems and people to monitor your brand’s health and pricing. Many brands jumped online without any way to monitor the consumer conversation around the brand or the pricing of the brand online. Not having the tools and resources in place to do this can lead to a quick and long-lasting erosion of brand equity and sales. Most, if not all, large manufacturers have subscribed to POS data for years and fully understand how to analyze this data. But the world has shifted. If your organization has not invested in digital shelf analytics, you may be driving blind and unaware that your brand is losing equity, which equals losing consumers and sales.

    Using a combination of pricing principles and e-commerce data mining tools will help you maintain price parity and brand relevance, while keeping you from becoming the last brand of choice for consumers, regardless of where they shop.