Another year, another round of media frenzy, and another set of records broken.
In only three years, Amazon’s Prime Day has evolved into one of the landmark sale events of the shopper’s calendar. Reports indicate that this year’s sale made a major splash, raking in over $4.2 billion in sales — a 33% increase compared to last year. Also, the retail behemoth shipped over 100 million products during the 36-hour sale. Amazon stated that they “welcomed more new Prime members on July 16 than on any other previous day in Prime history.”
The much talked about website outage added some spice and drama to the proceedings during the first hour. However, this was fixed quickly.
This year is also the first Prime Day with Whole Foods, Amazon’s most expensive acquisition, giving US shoppers unprecedented incentives to shop at the physical stores of the grocery retailer.
However, Prime Day is not just about the US, but a truly global event. In India, as part of its promotions for Prime Day, Amazon leveraged VR to have people experience the products in their true form factor at select malls.
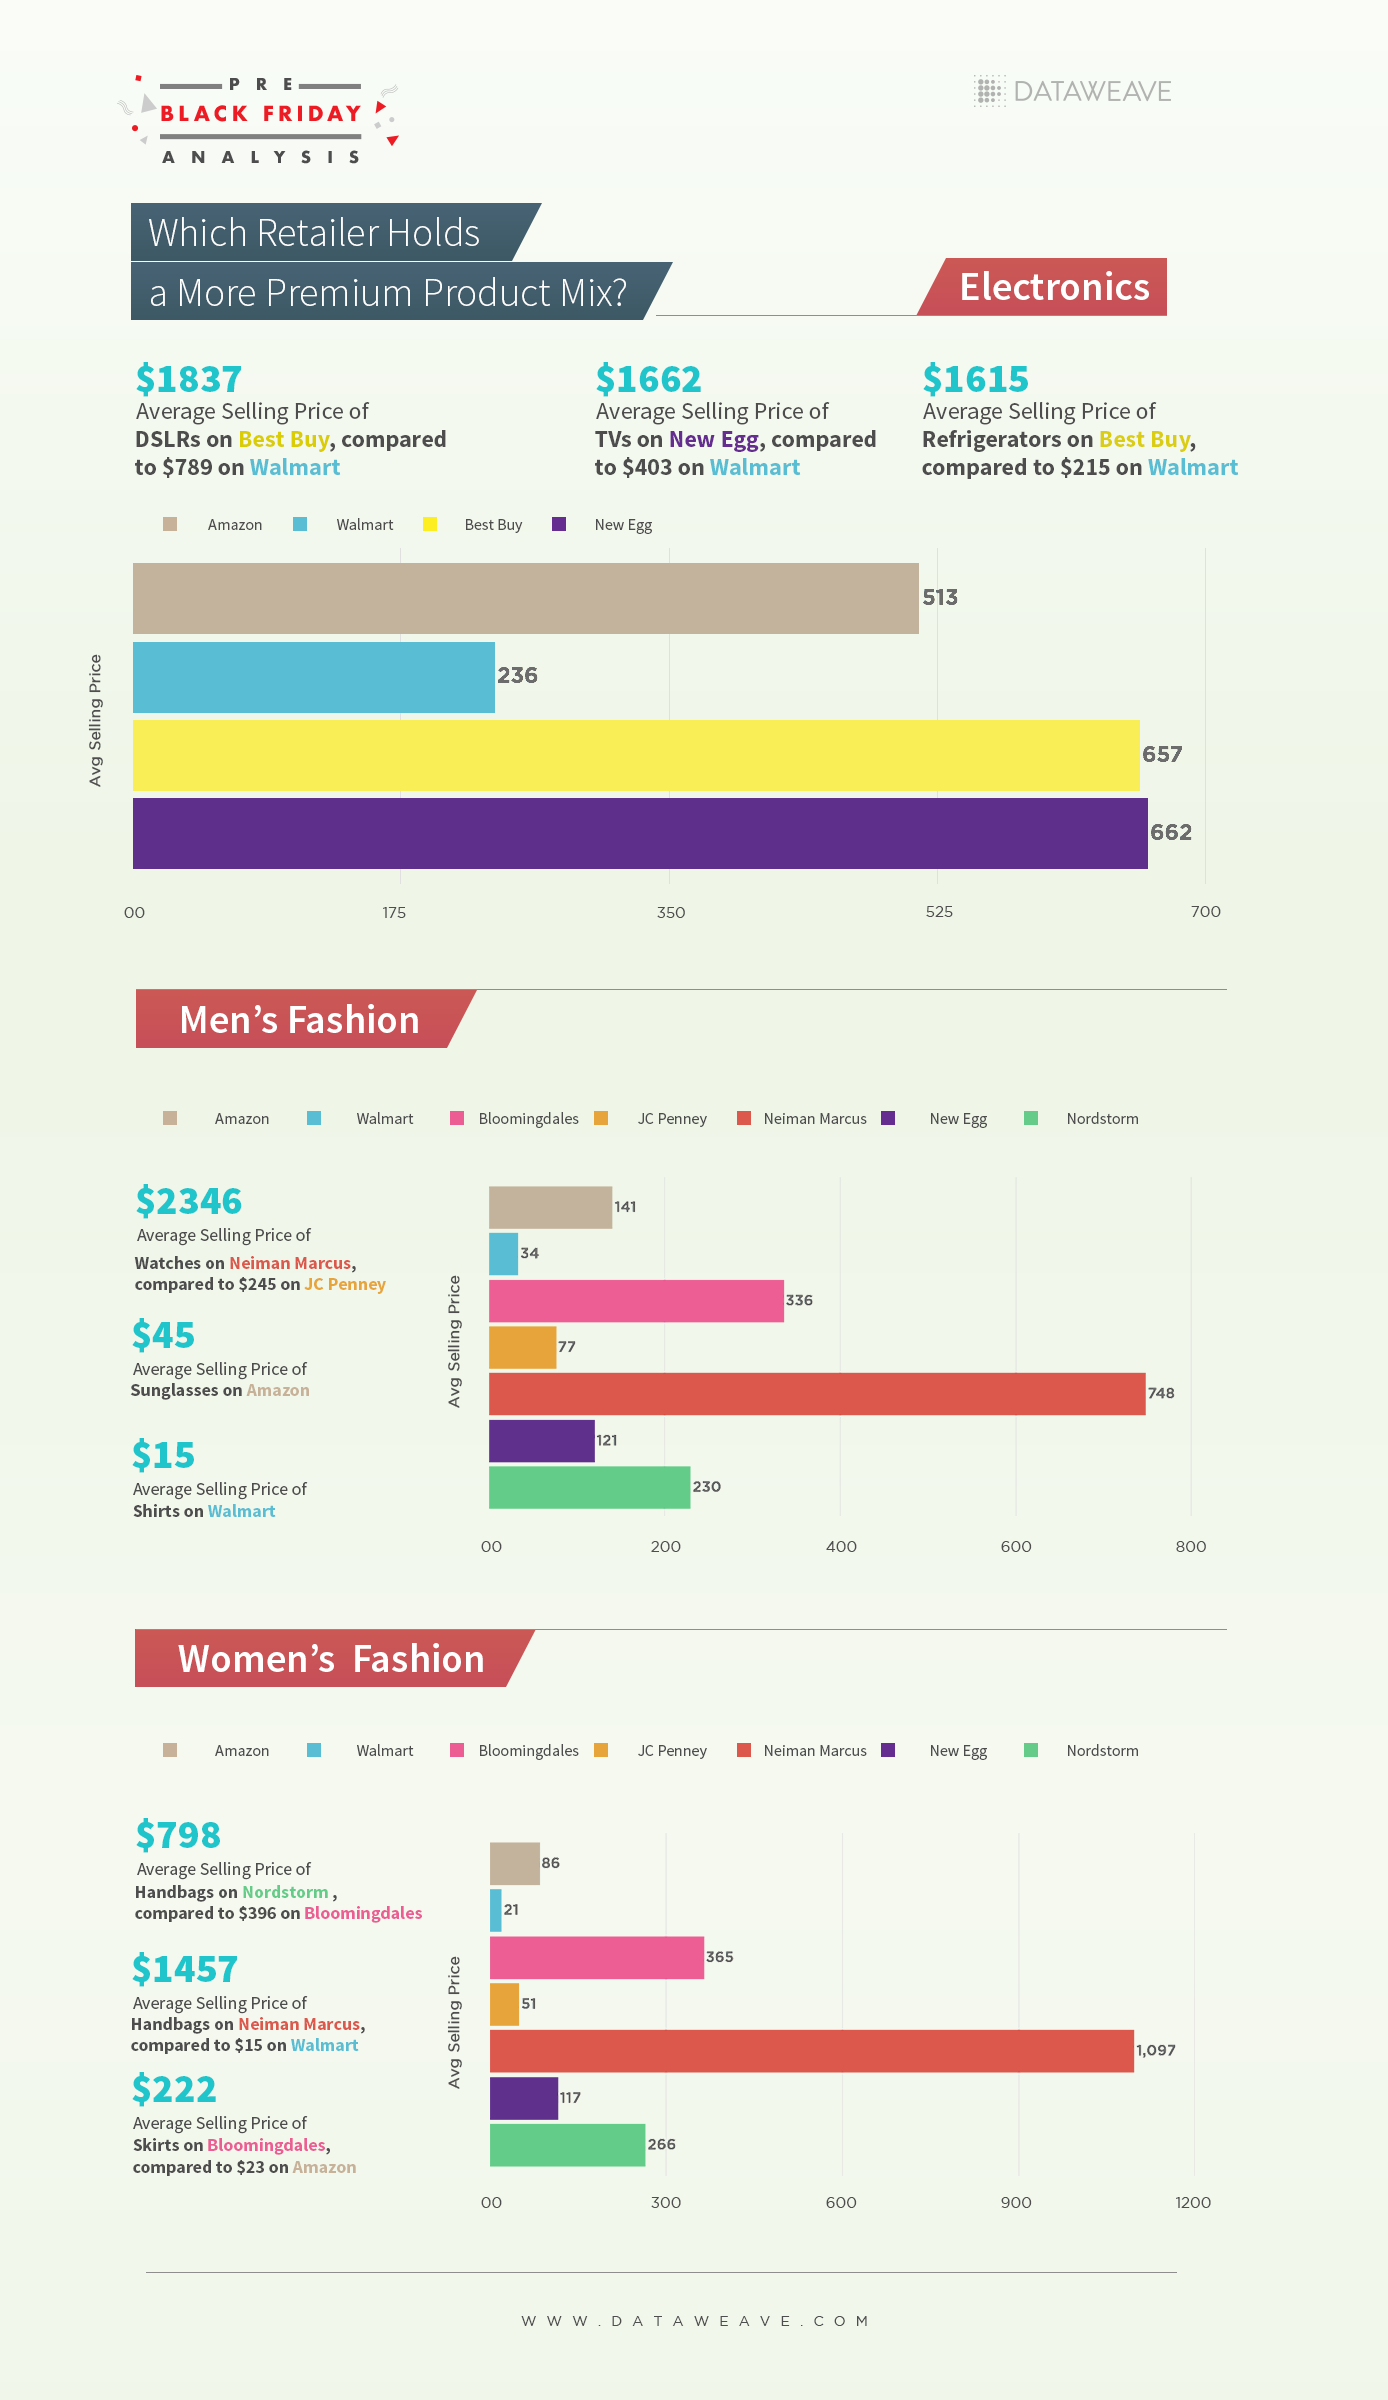
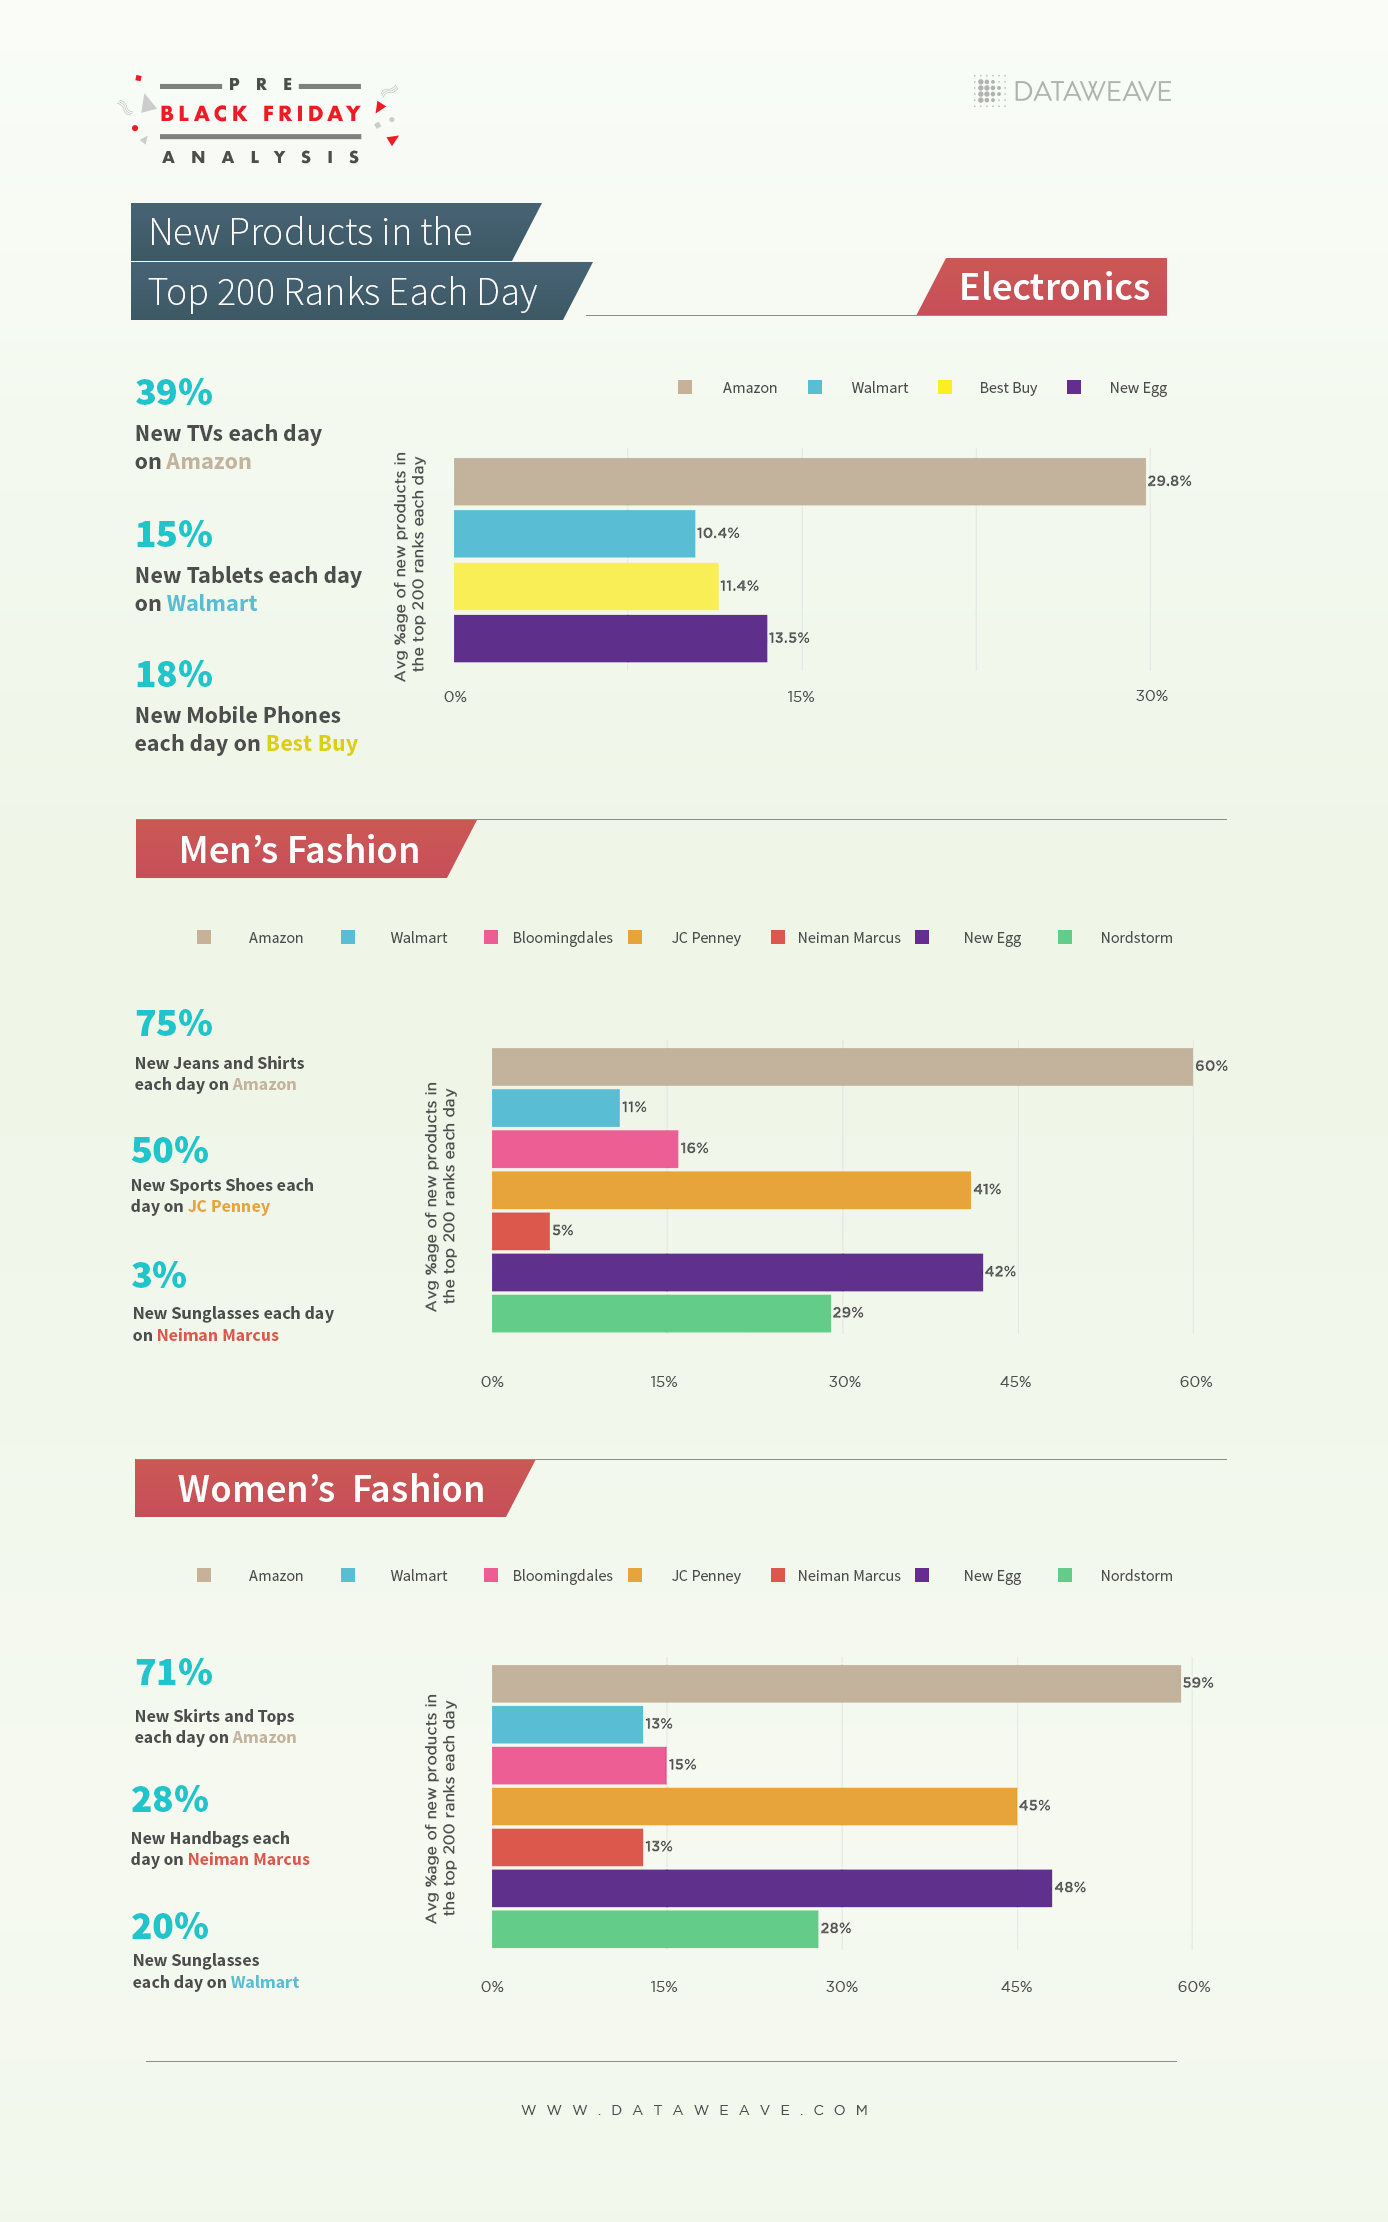
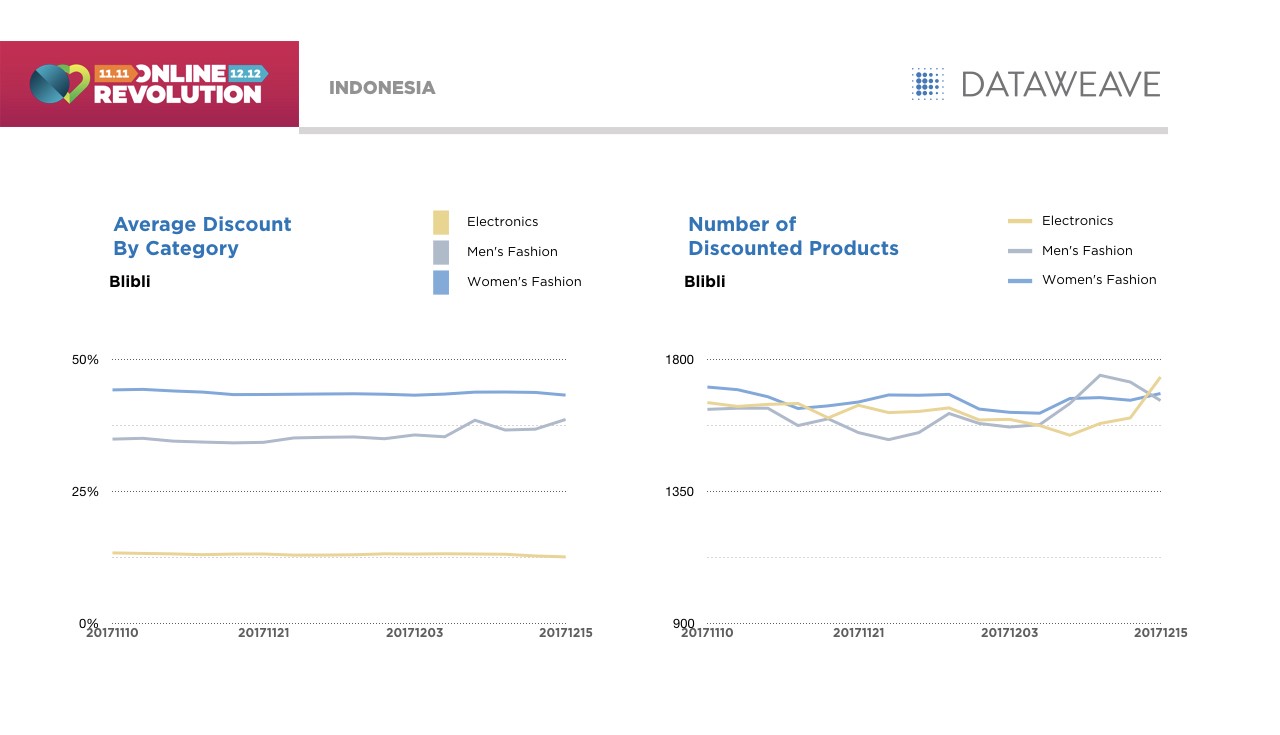
At DataWeave, our proprietary data aggregation and analysis platform enabled us to keep an eye on the pricing and discounts of products during the sale. We tracked Amazon.com, Amazon.co.uk, and Amazon.in before (14th July) and during the sale (16th July) and monitored several product types in Electronics, Men’s Fashion, Women’s Fashion and Furniture categories. We captured information on the price, brand, rank on the category page, whether Prime was offered or not, etc. and analyzed the top 200 ranks in each product type listing page. To best indicate the additional value to shoppers during the sale, we focused our analysis only on additional discounts on products between the 14th and 16th of July.
Scrutinizing the data yielded some rather interesting insights:
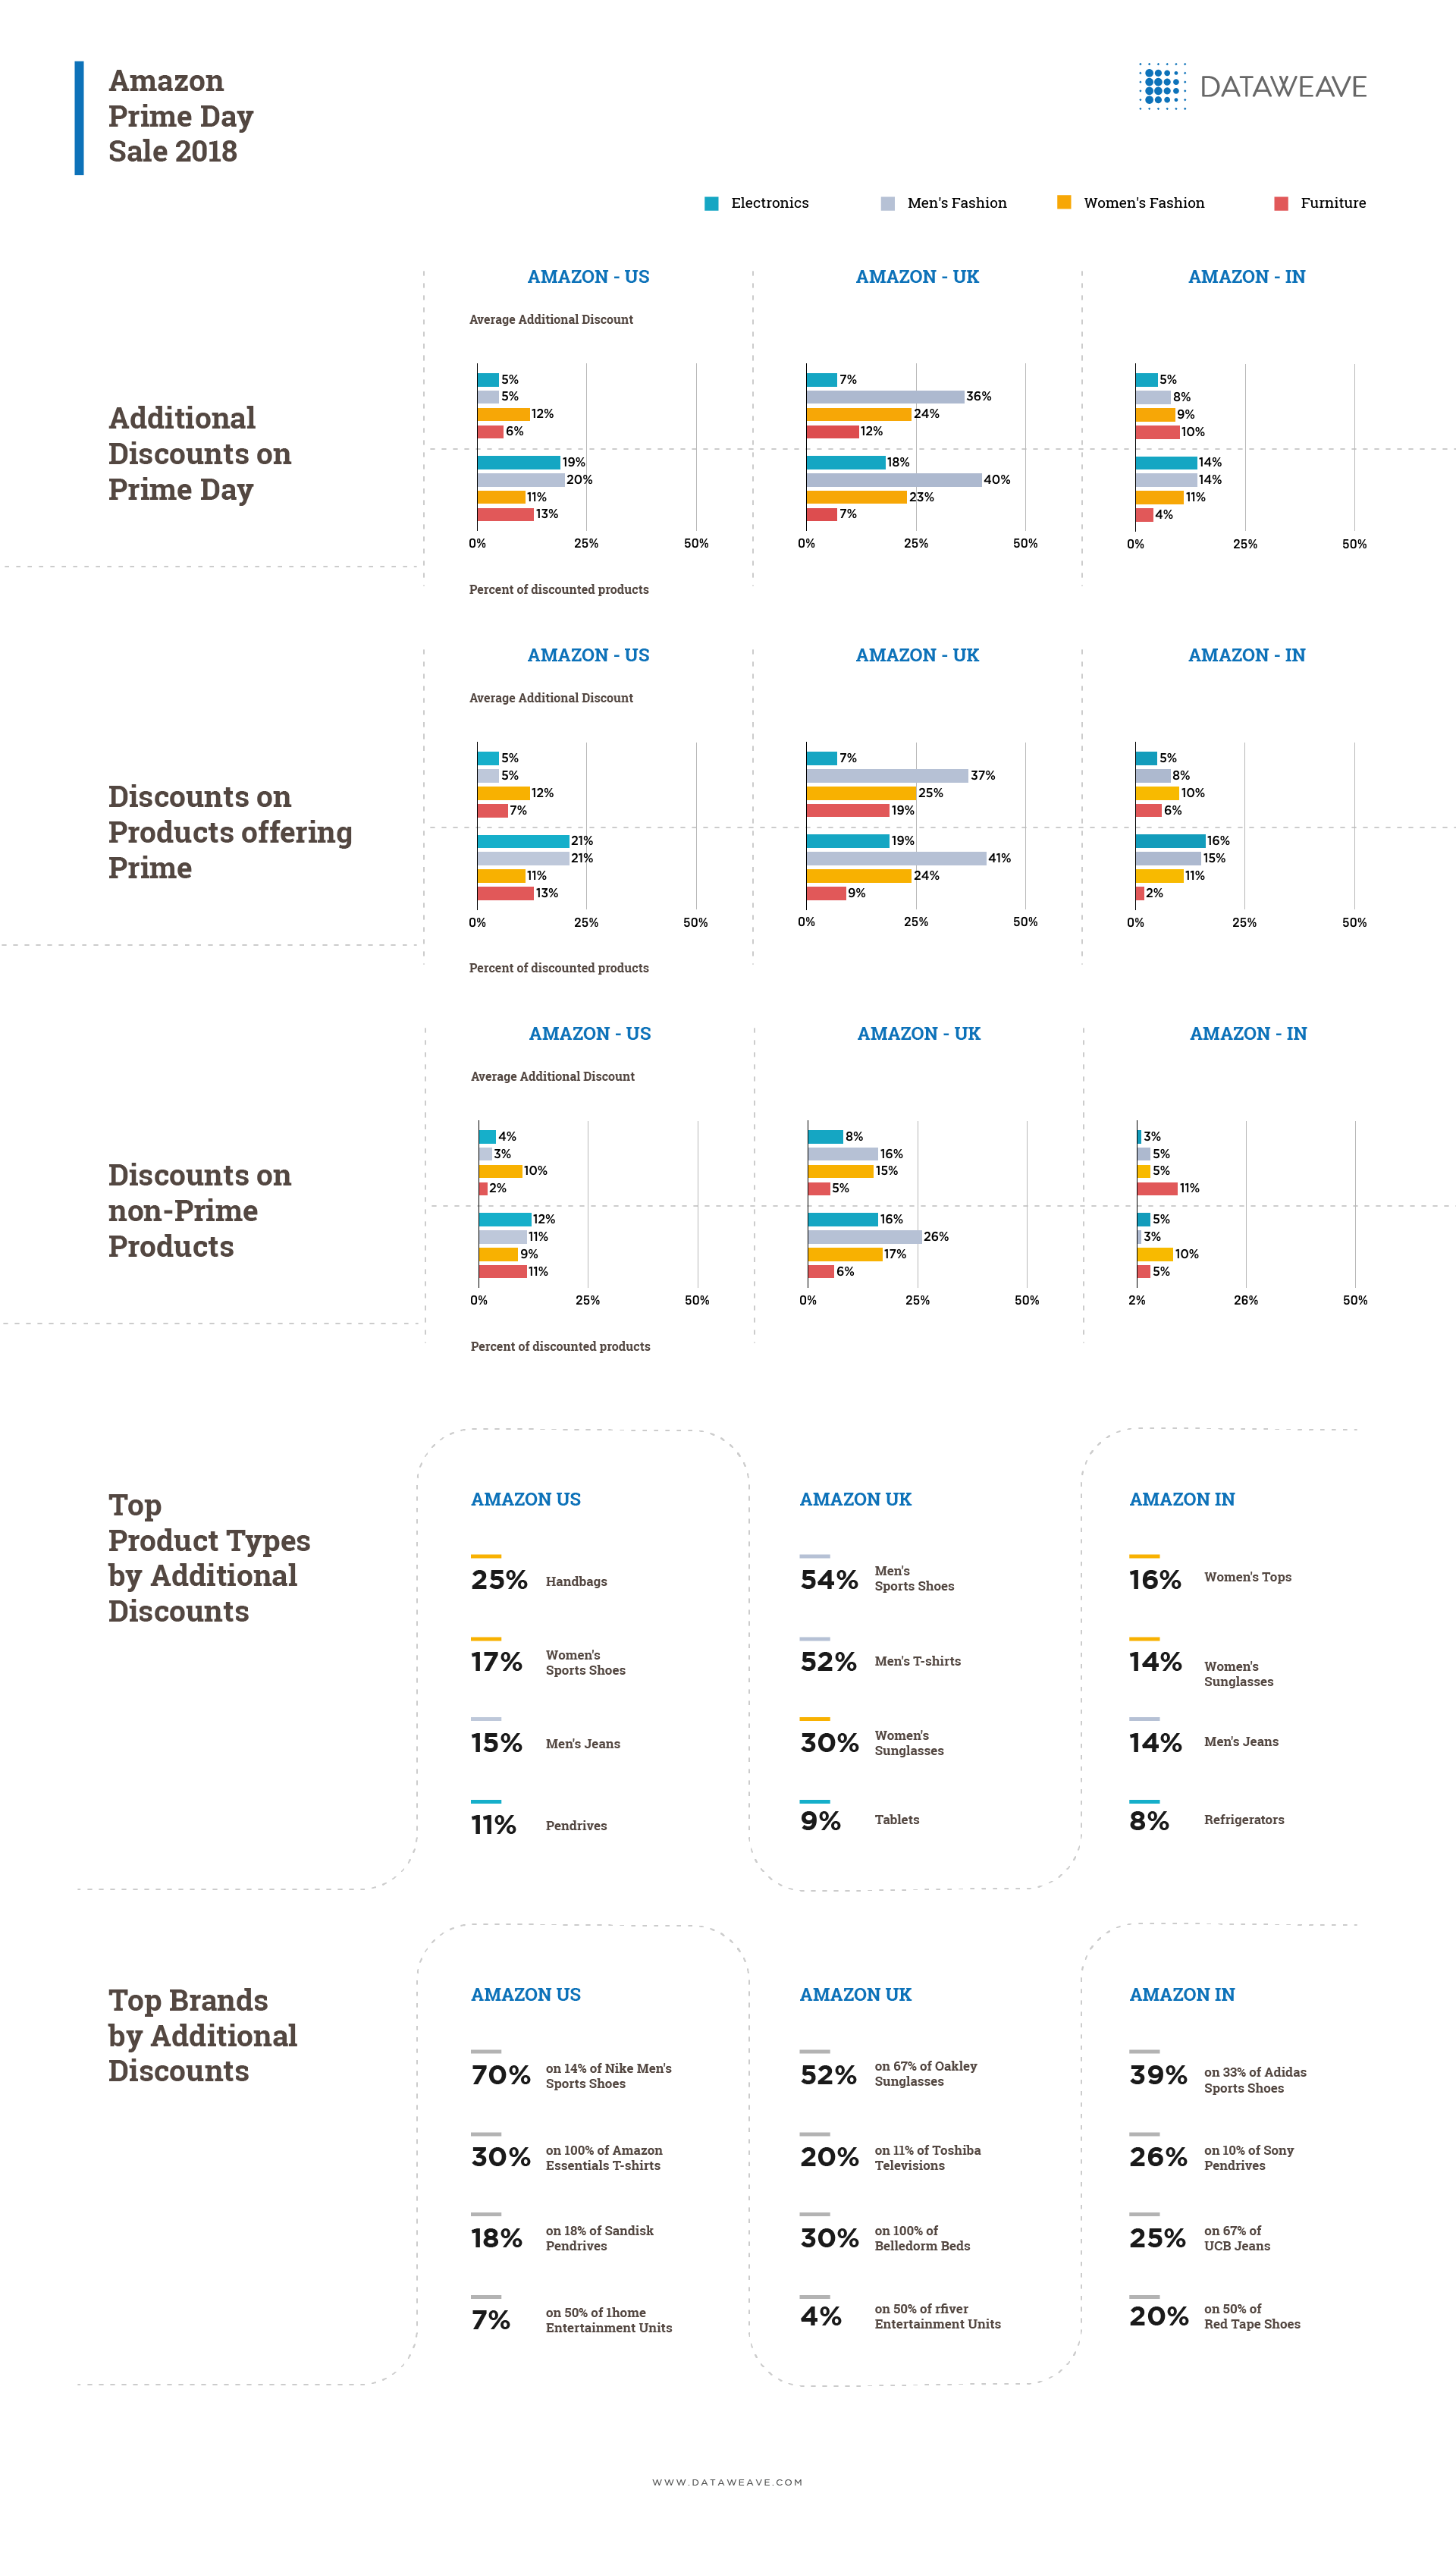
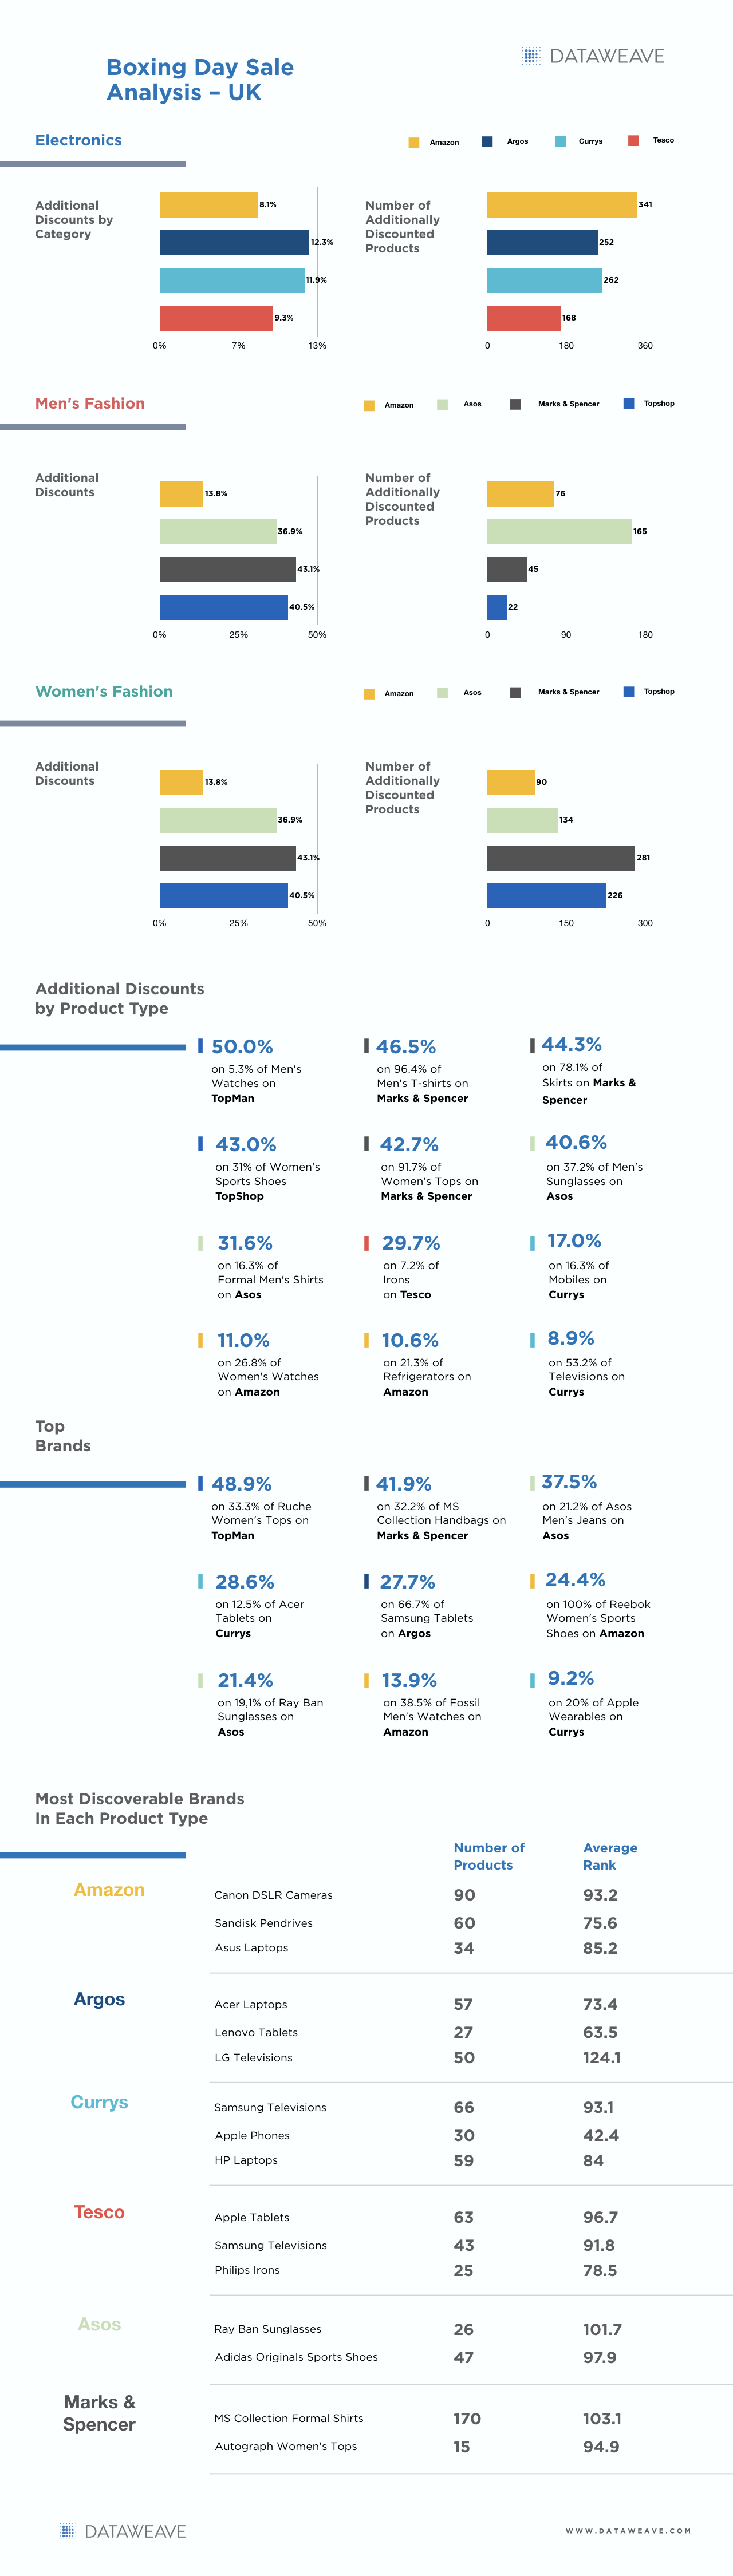
Amazon UK was more aggressive with its discounts than the US and India across most categories, with Furniture being the only exception (highest discounts in the US).
In the US, Women’s Fashion observed the steepest discounts (12%), though there were discounts available on a larger number of Men’s Fashion products (5% additional discount on 20% of products).
While disparity between discounts on Prime products vs non-Prime was quite evident, it was surprisingly low for many categories. In fact, the Electronics category in the UK and the Furniture category in India witnessed sharper discounts for non-Prime products than Prime.
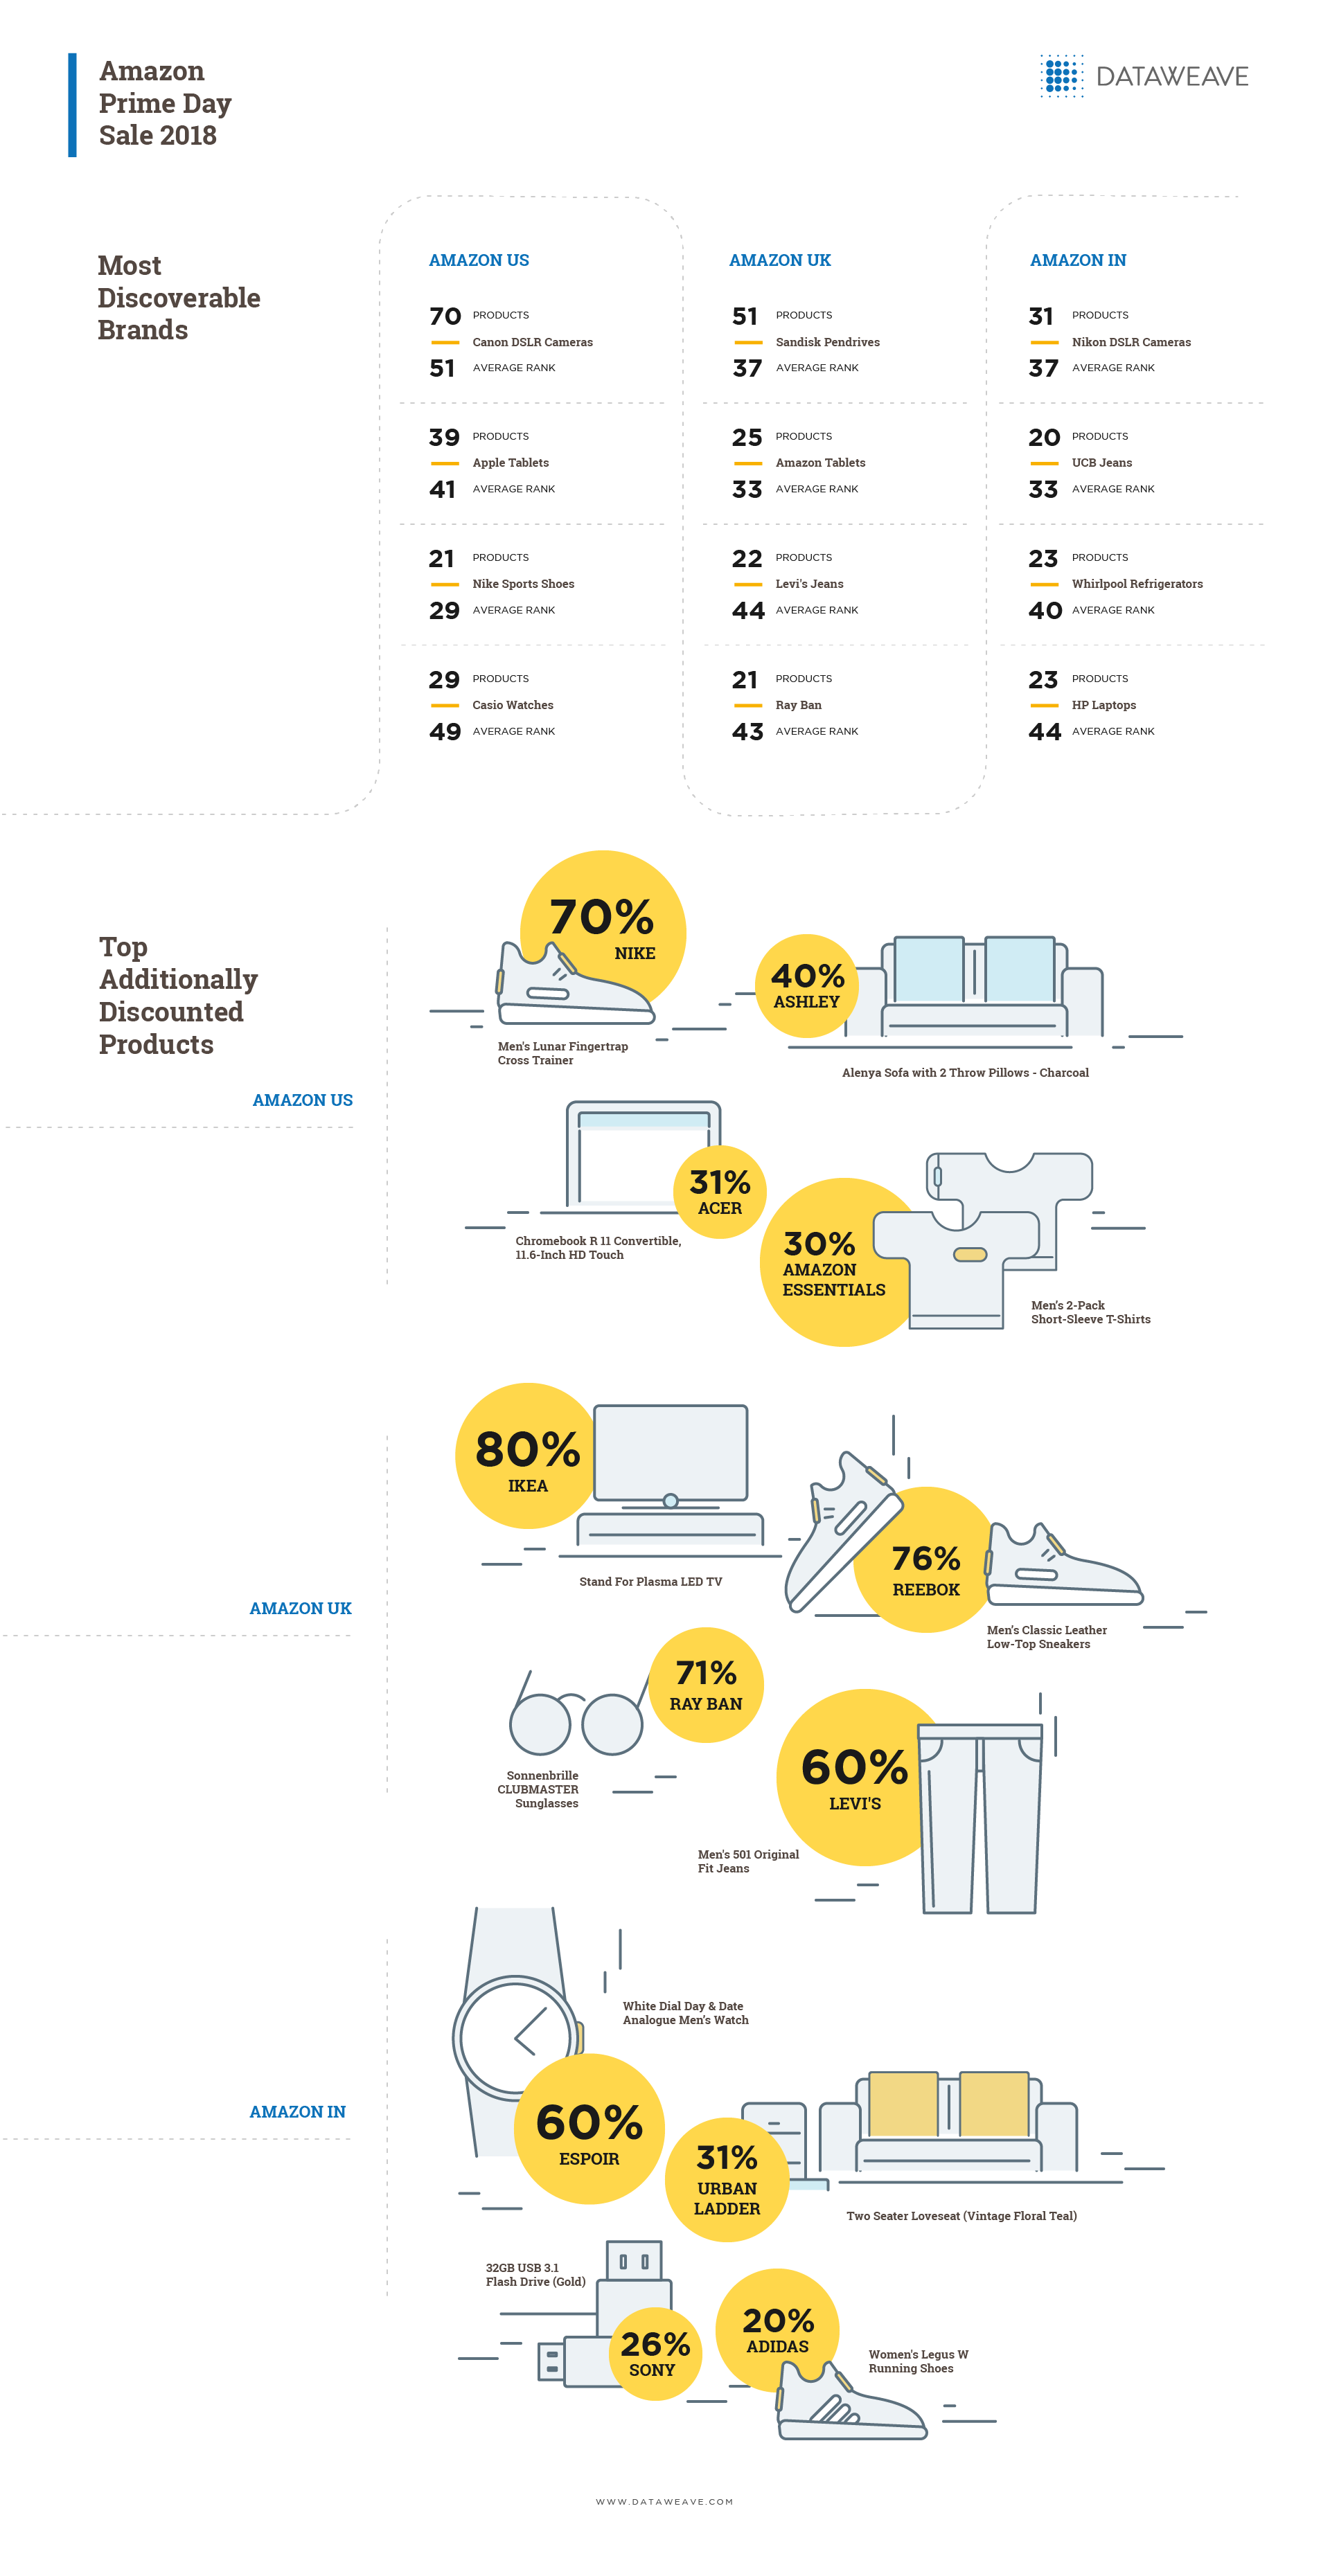
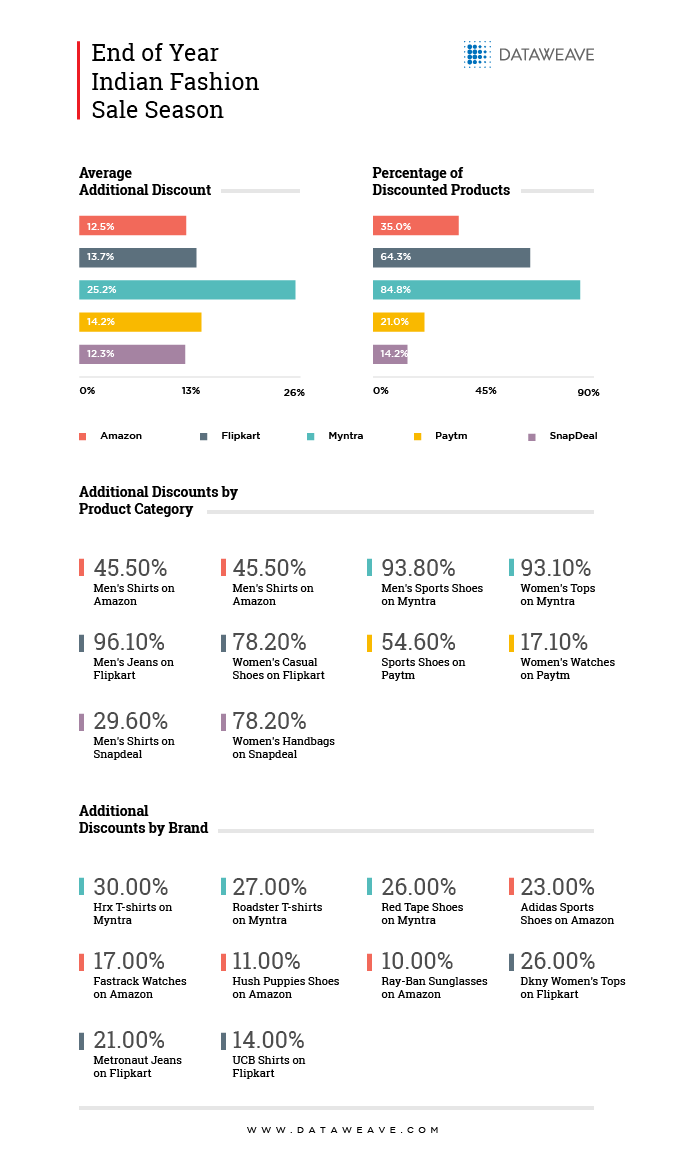
Top categories by additional discount include Women’s Handbags, Sports Shoes, and Pendrives in the US, Sunglasses and Tablets in the UK, and Women’s Tops, Men’s Jeans, Women’s Sunglasses, and Refrigerators in India. Top brands include Nike, Amazon Essentials, Sandisk, and 1home in the US, Oakley, Toshiba, Belledorm, and rfiver in the UK, and Adidas, Sony, UCB, and Red Tape in India.
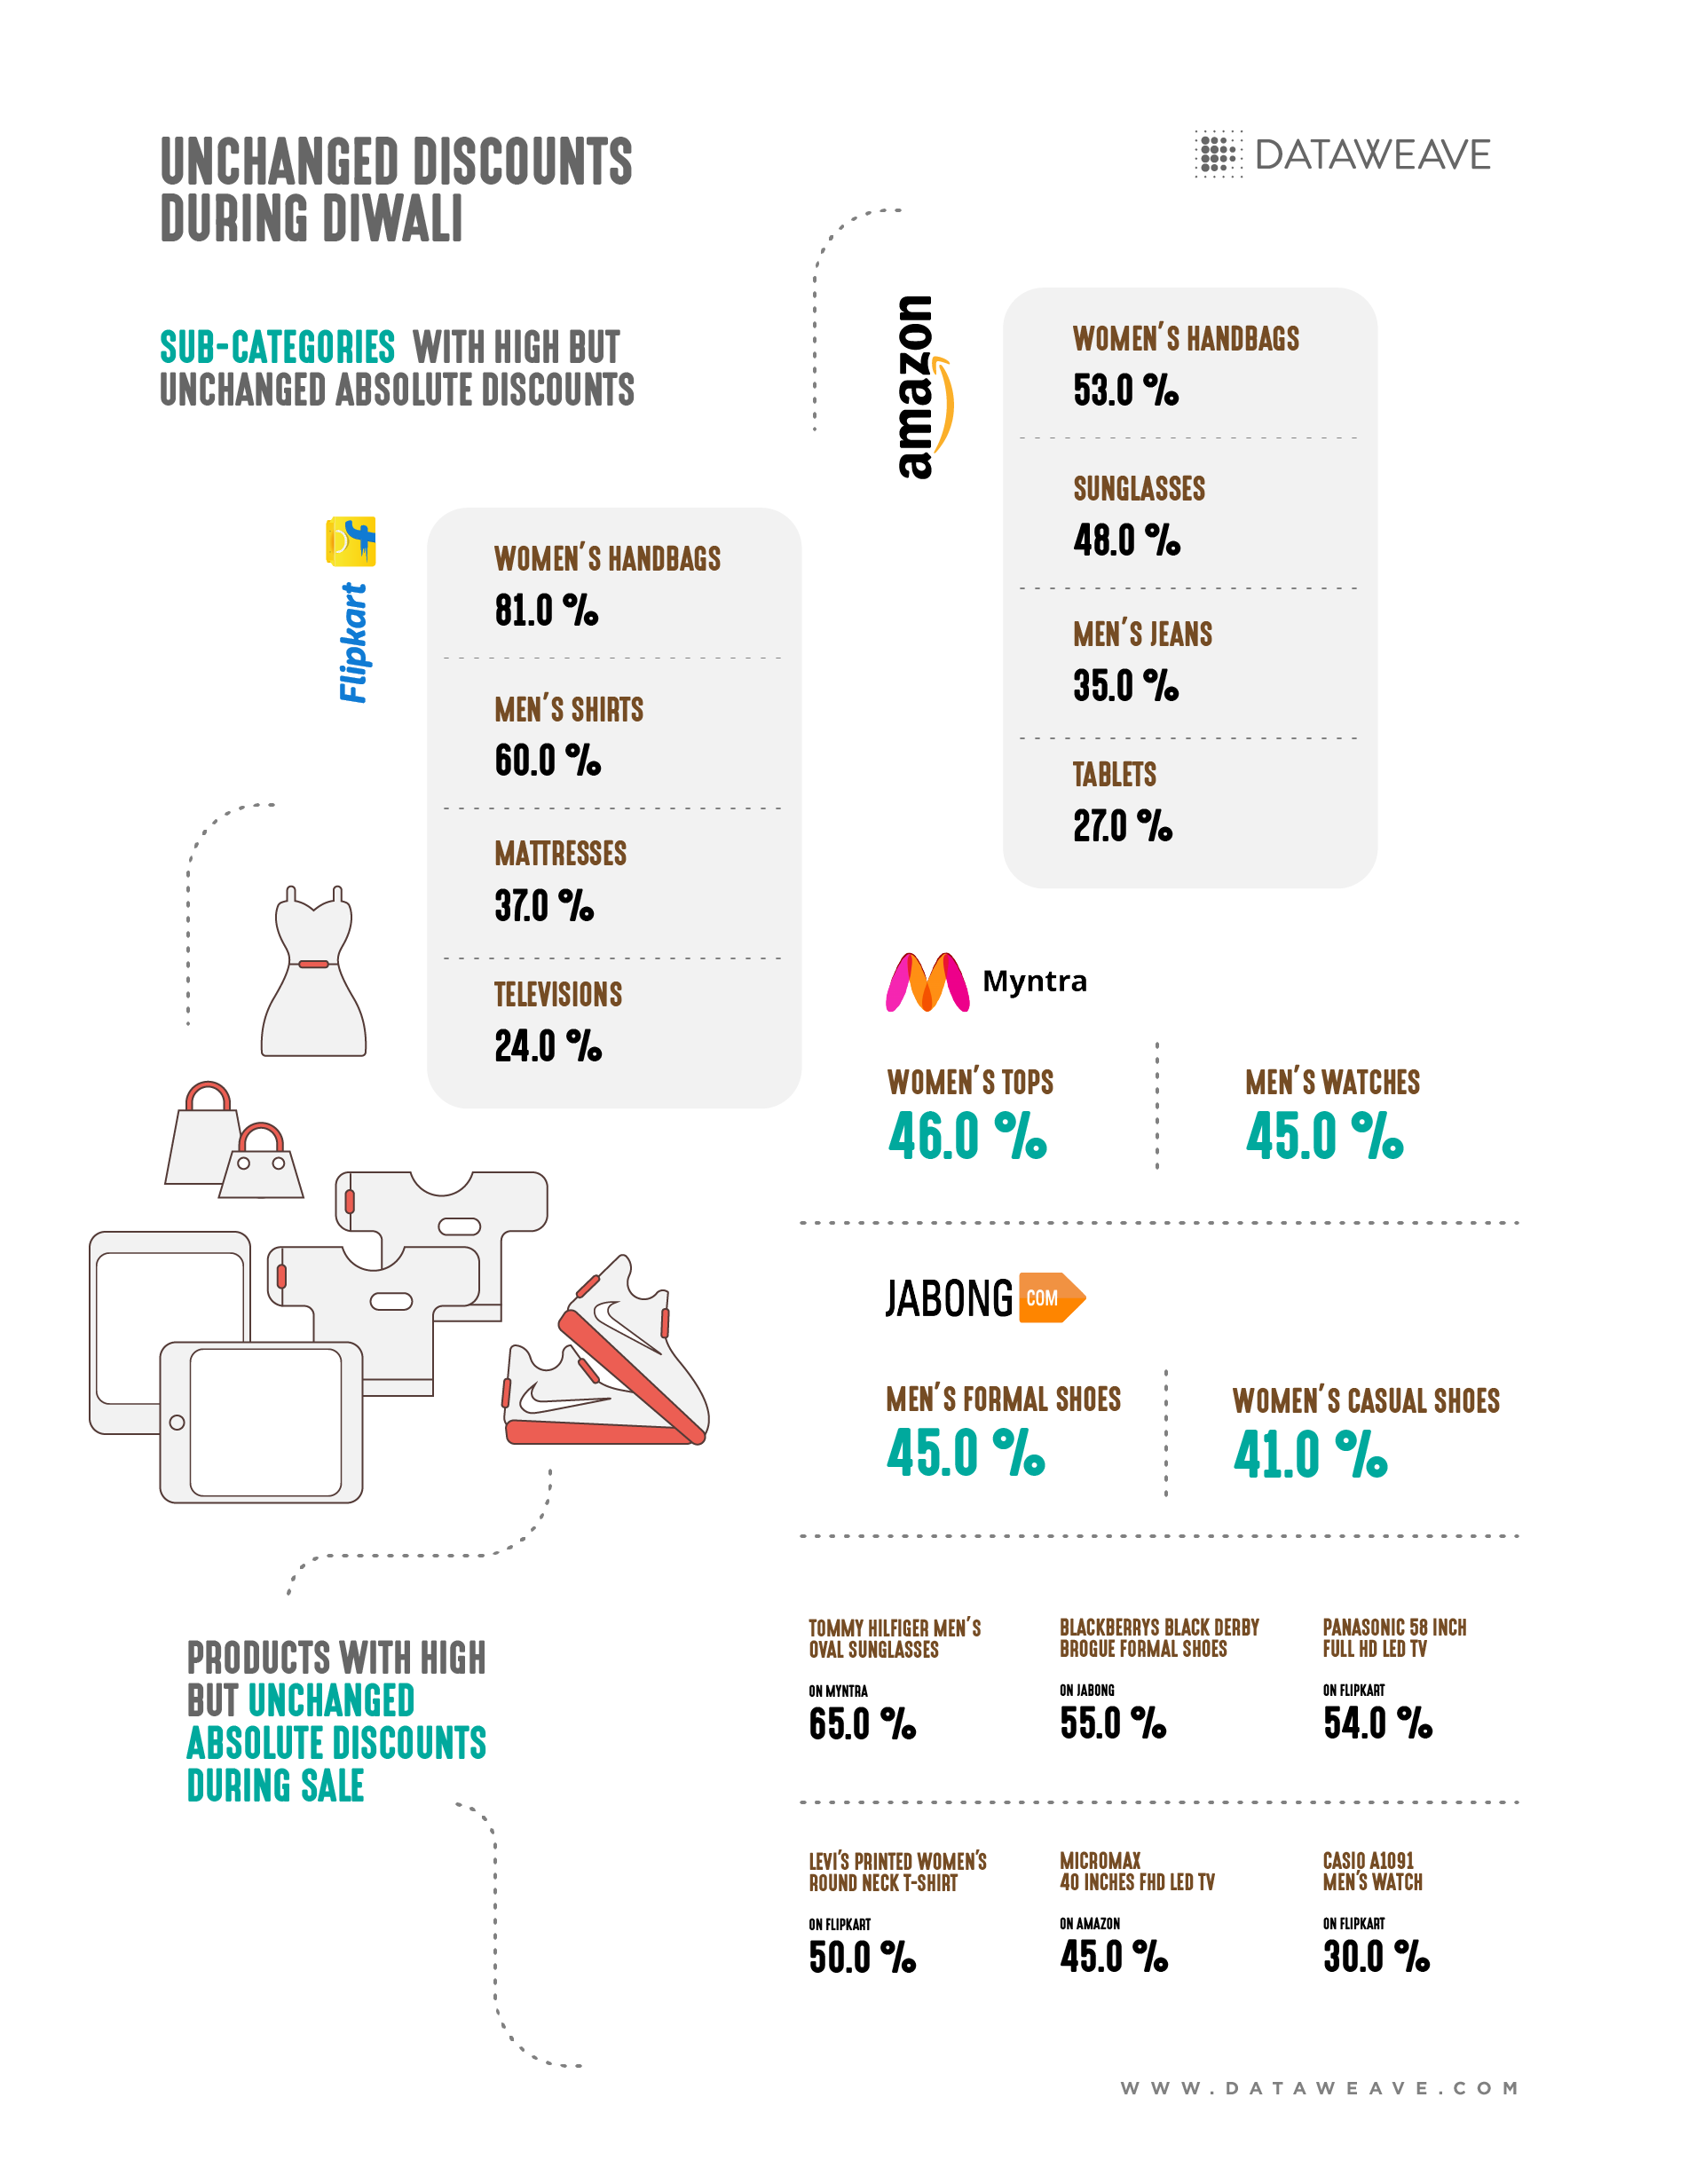
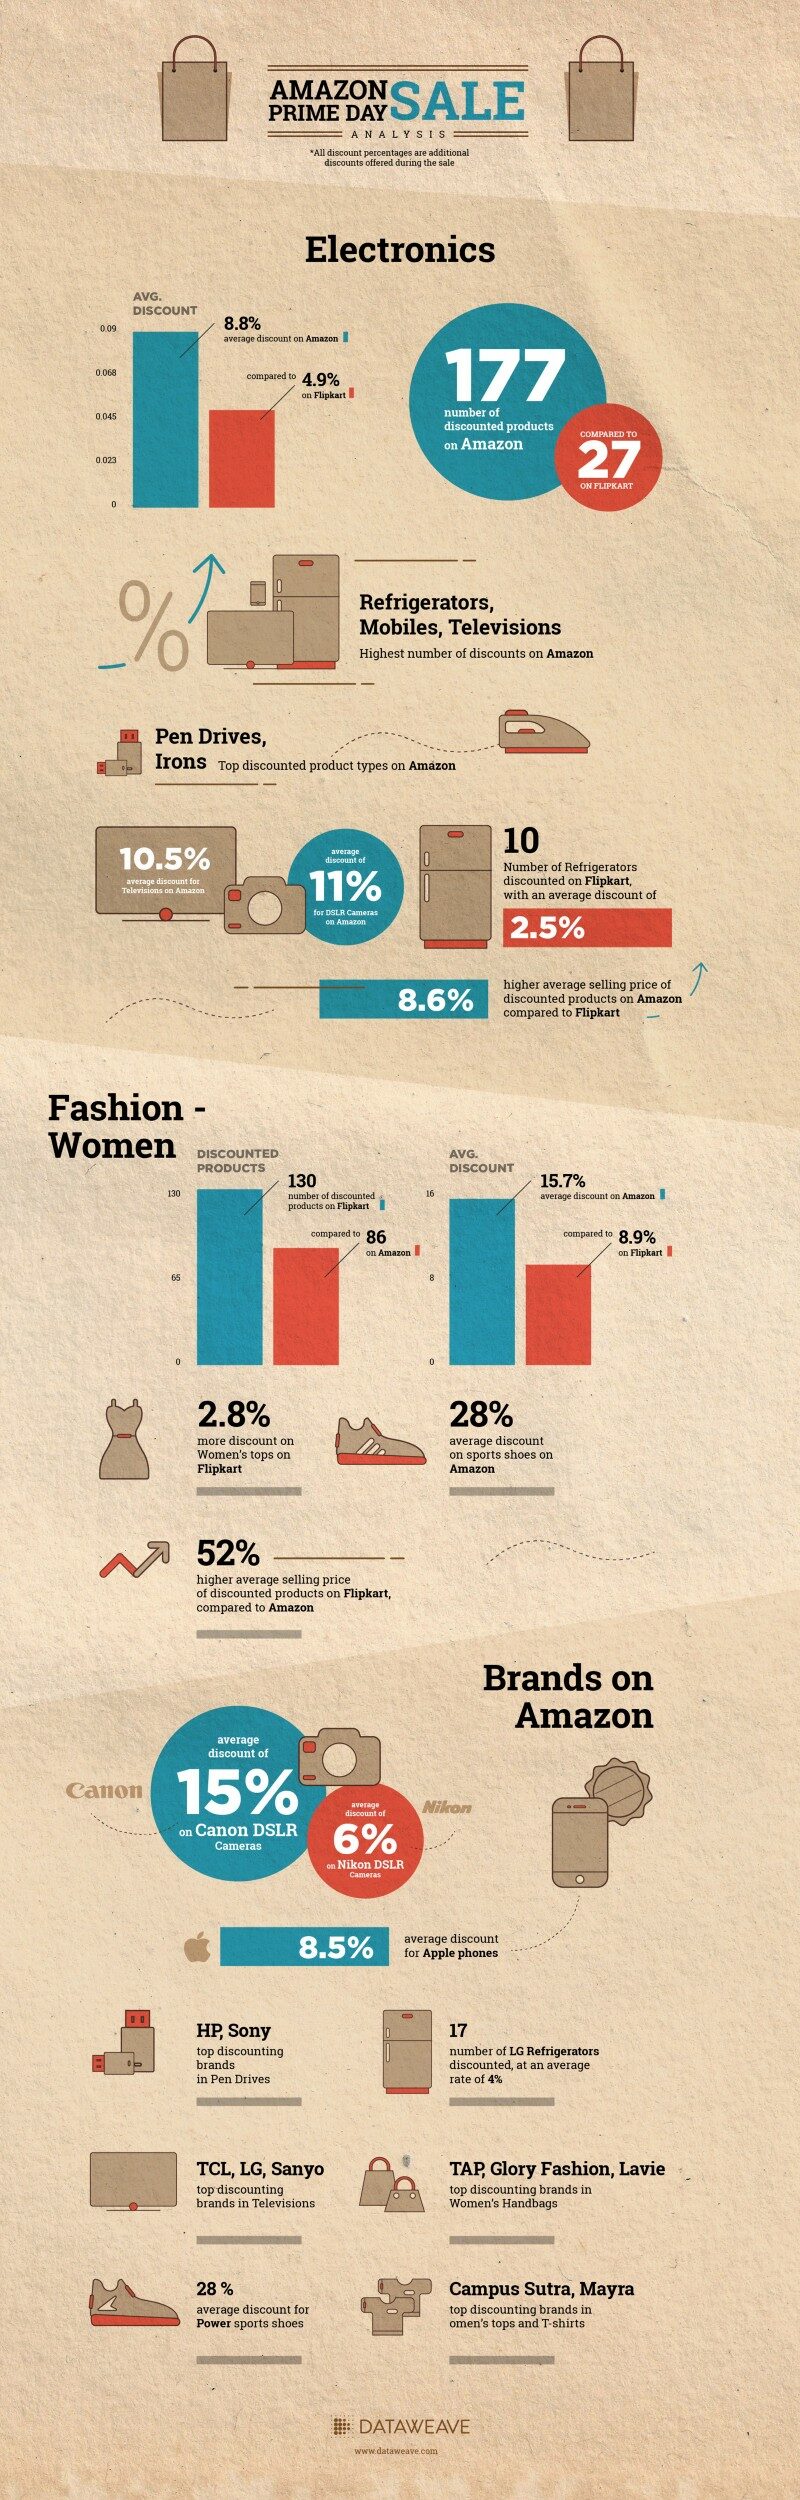
As indicated in the following infographic, some of the most discoverable brands during the sale include Canon, Apple, Nike and Casio in the US, Sandisk, Amazon, Levi’s, and Ray Ban in the UK, and Nikon, UCB, Whirlpool, and HP in India. Discoverability here is measured as a combination of the number of the brand’s products in the top 100 ranks and the average rank of all products of the brand. Also in the infographic, is a set of products with high additional discounts during the sale.
Amazon’s competitors though aren’t ones that simply roll with the punches.
Flipkart, Amazon’s largest competitor in India (recently acquired by Walmart), announced its own Big Shopping Days sale between July 16 and July 19. On Prime Day, the company joined in with some attractive offers:
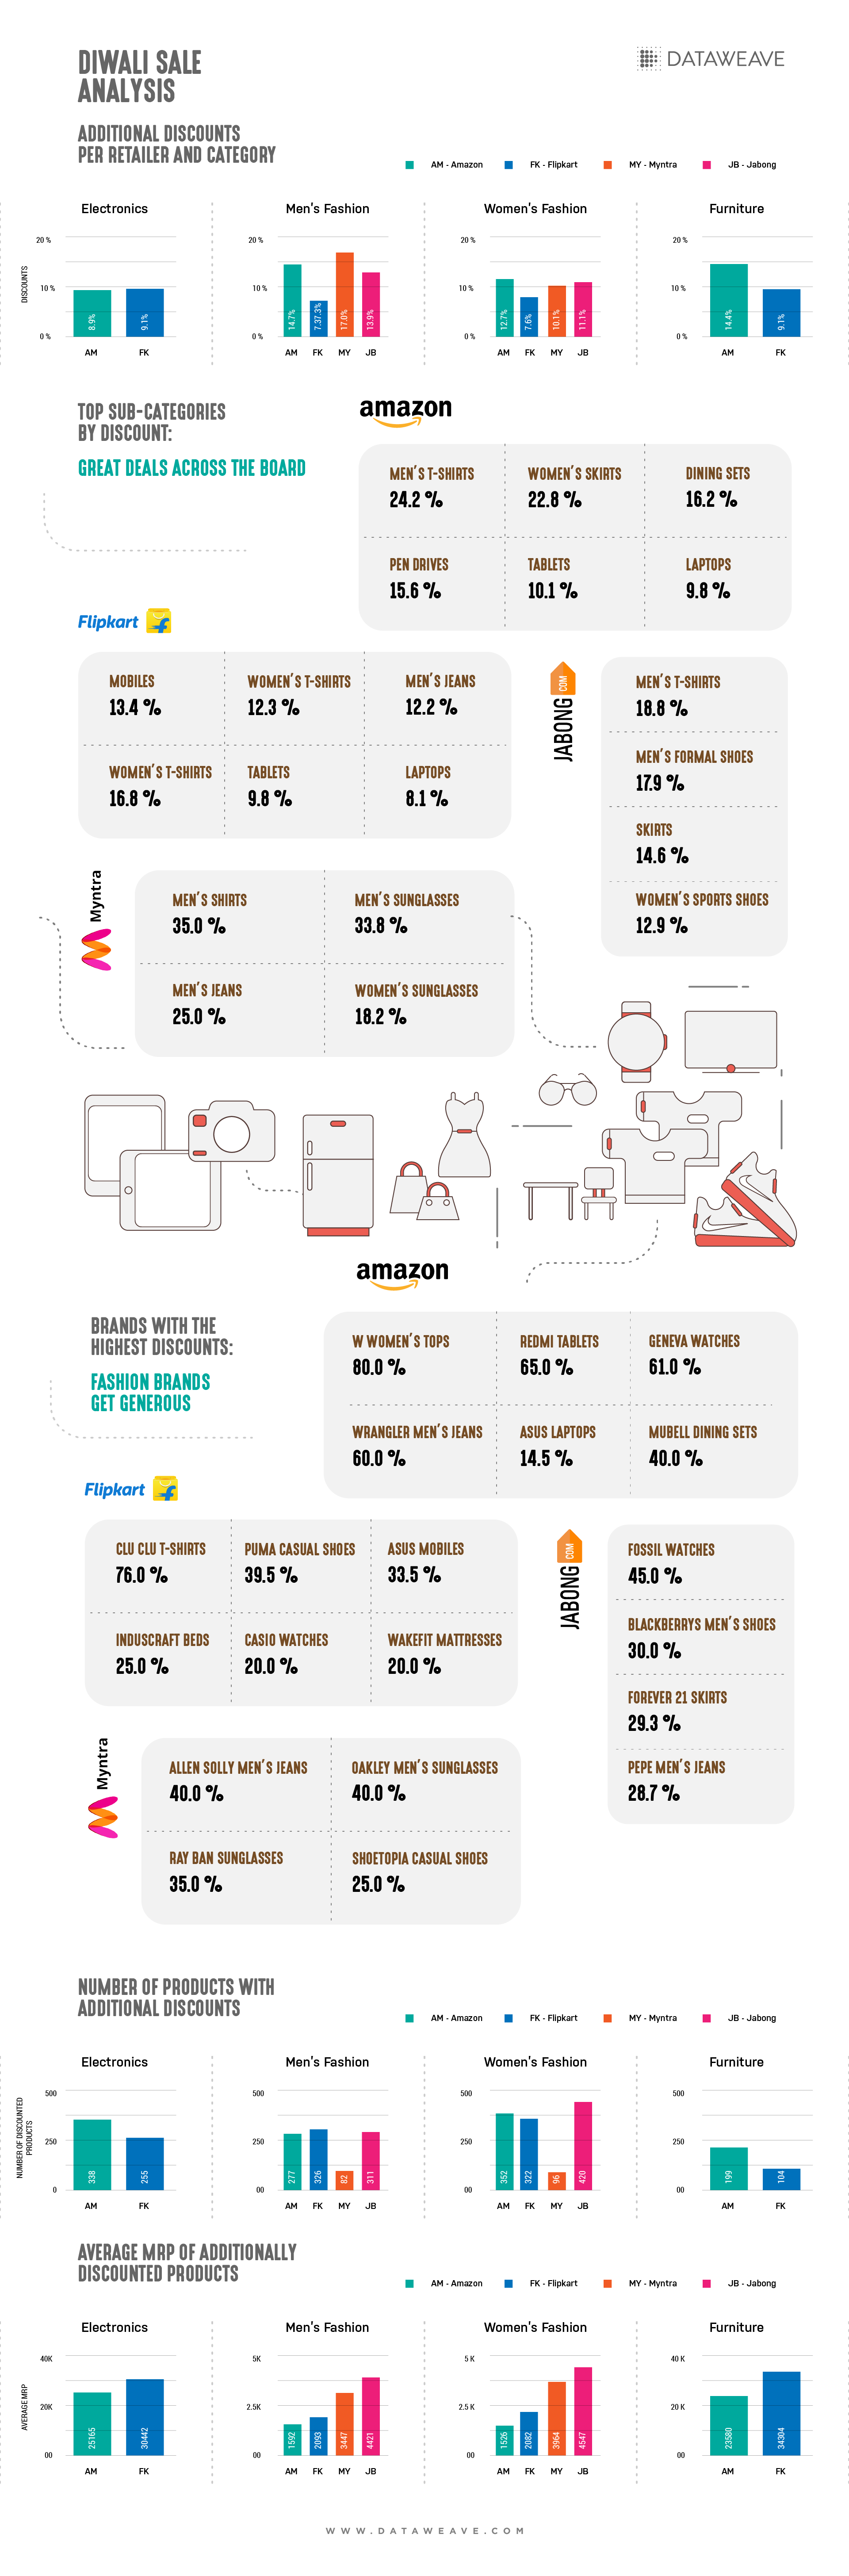
- 8%, 10%, and 7% additional discounts on 11%, 29%, and 16% of Electronics, Men’s Fashion, and Women’s Fashion categories, respectively.
- 35% off on Perfect Homes 3-seater Sofa
- 27% additional discount on Acer Predator Helios Gaming Laptop
- 25% additional discount on Sandisk 16GB Pen Drive
Propelling the Amazon Flywheel
While Amazon clearly benefits in the short-term with this sale, the long-term effect of feeding its famous flywheel is evident as well.
Amazon’s flywheel is a framework through which the company looks to build a self-feeding platform that accelerates growth over time. Attractive discounts and a broad selection of products improves customer experience, which increases traffic to the website, which attracts more merchants on its platform, who in turn broaden the selection of available products.
Sale events like Prime Day create the sort of hype needed to draw a lot of traffic to Amazon’s website, generating momentum that has a compounding effect on Amazon’s growth. Not surprisingly, more than half of the people surveyed in the US by Cowen last December said they lived in a household with at least one Prime subscription.
As Amazon’s stock traded at an all time high following Prime Day, it’s only a matter of time before the company becomes the world’s first trillion dollar company.
Check us out, if you’re interested in learning more about our technology and how we provide Competitive Intelligence as a Service to retailers and consumer brands.


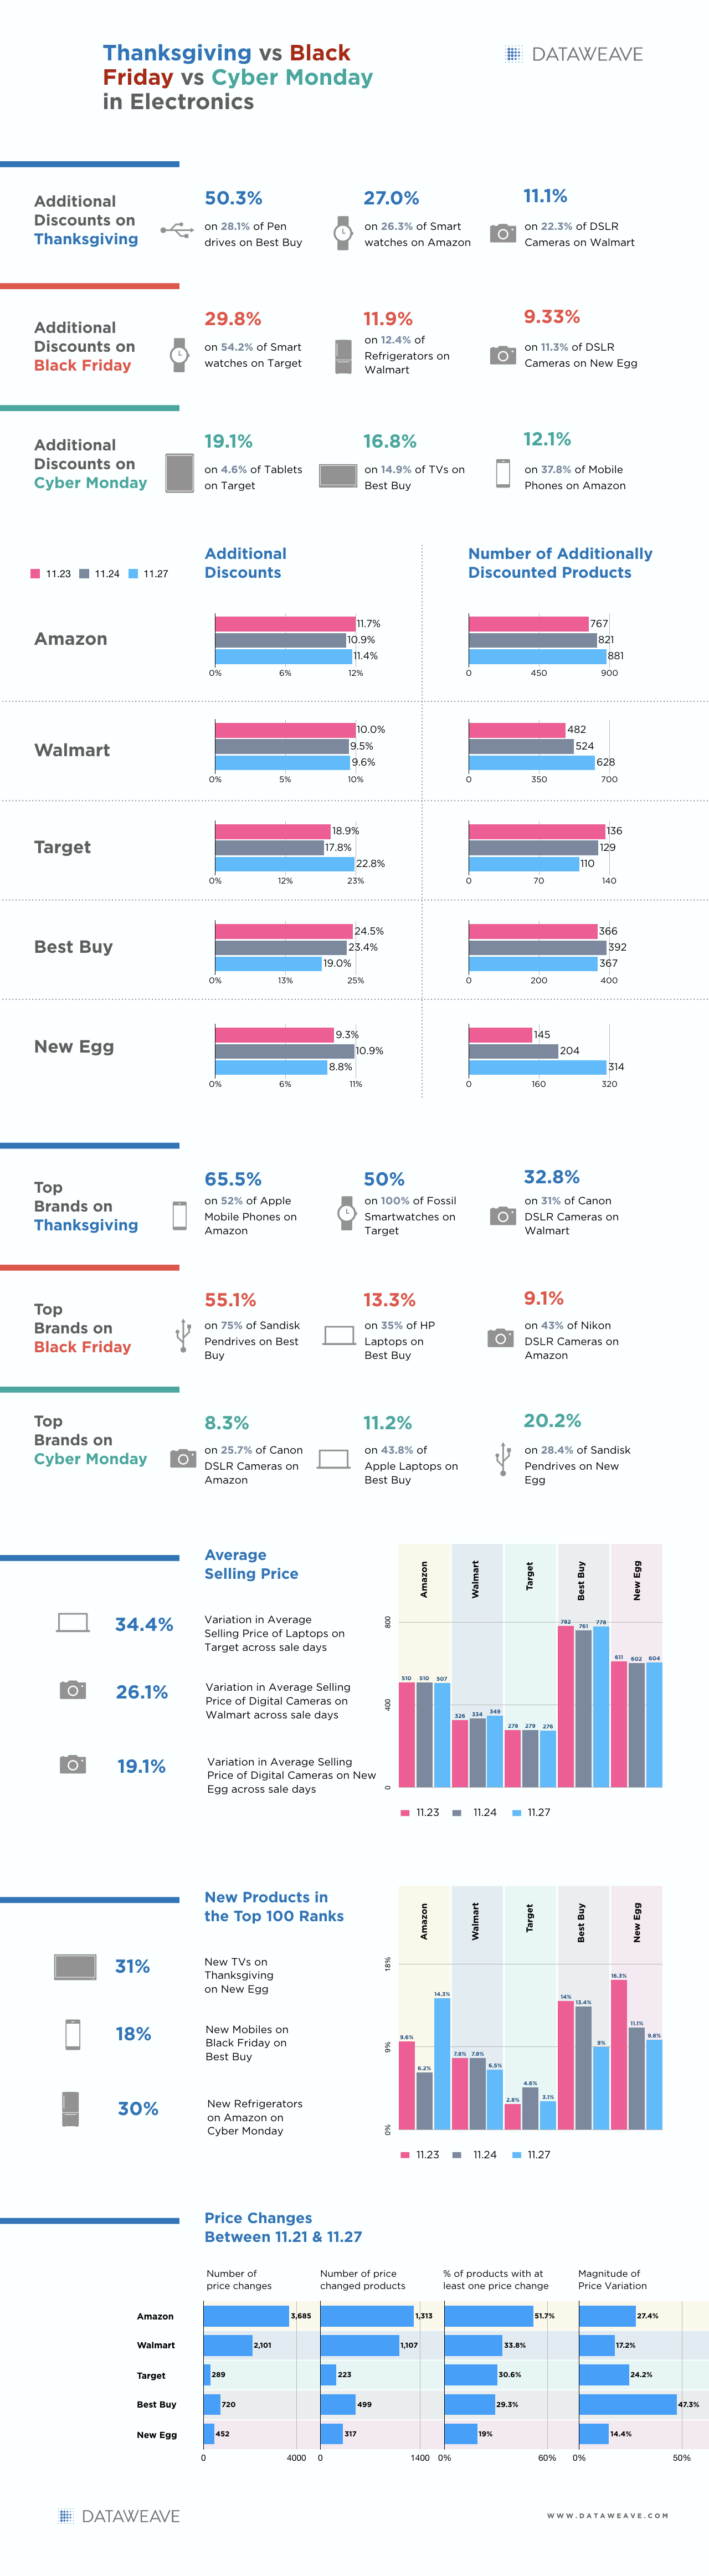
![[INFOGRAPHIC] Thanksgiving vs Black Friday vs Cyber Monday: The Electronics Price War Heats Up](https://stage-cdnblog.dataweave.com/wp-content/uploads/2018/09/a4-e1688041211819.jpeg)