Black Friday, once confined to a single weekend, has evolved into a shopping season that now stretches well before Thanksgiving. With inflation hovering around 3% and consumer confidence showing signs of recovery, retailers are adapting their promotional calendars to capture early-bird shoppers and maintain a competitive edge.
Major retailers, including Amazon, Walmart, Target, and Best Buy, have capitalized on this trend by launching promotions weeks in advance, signaling the traditional holiday rush is now a month-long event. At DataWeave, we put these deals under a microscope.
Our Methodology
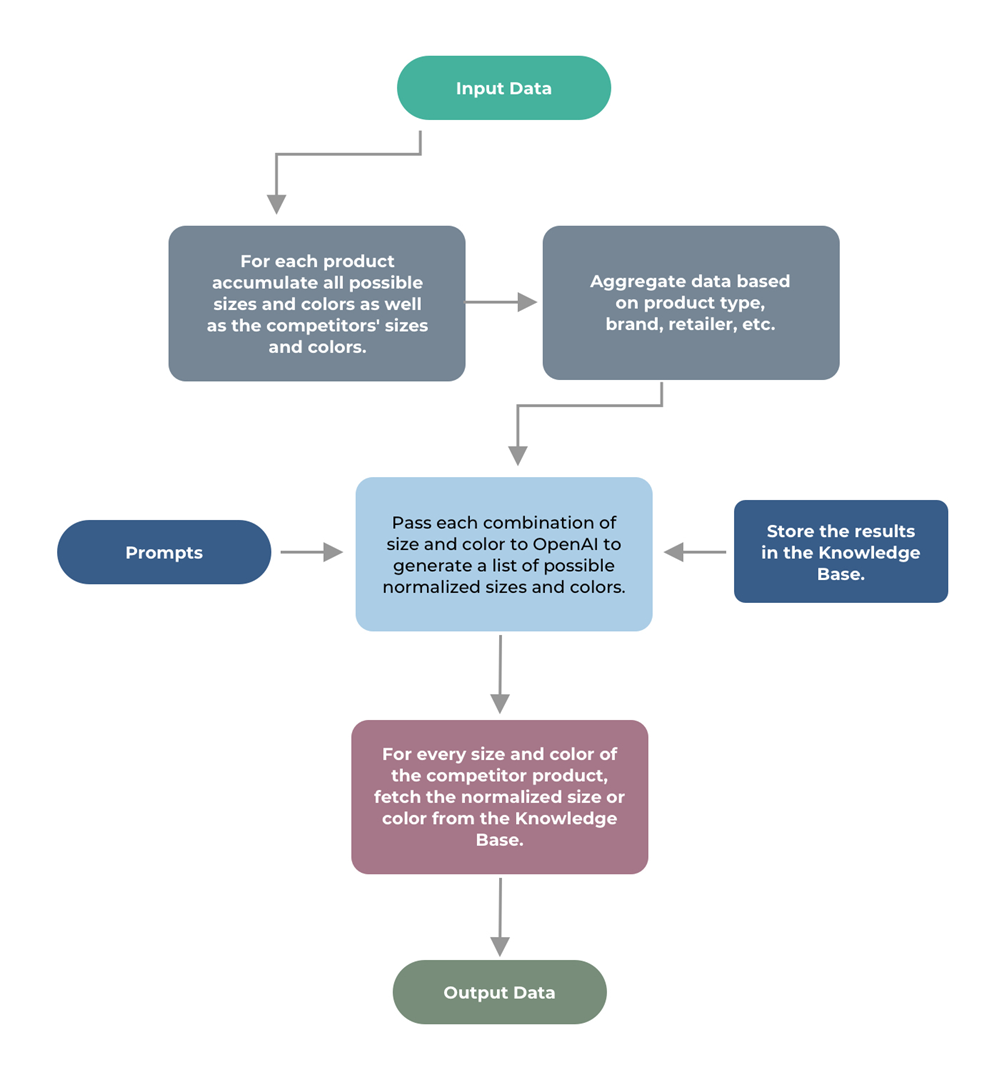
Using DataWeave’s advanced, AI-powered pricing intelligence platform, we tracked early Black Friday deals across Consumer Electronics, Home & Furniture, Health & Beauty, and Apparel categories. We monitored dedicated Black Friday deal pages on Amazon, Walmart, Target, Best Buy, Nordstrom, Neiman Marcus, and Sephora to gather and analyze discount data a week prior to Black Friday weekend.
Who’s Offering the Best Deals Across Categories?
Our pre- Black Friday analysis reveals a clear pattern of premium brands offering deeper discounts across categories ahead of the holiday. Here are some key findings around retail players:
- Walmart emerges as the most aggressive discounter across categories, leading in Health & Beauty (57.07%), Apparel (48.97%), and Consumer Electronics (43.35%).
- Amazon maintains consistent but lower discounts (28-29%) across categories, suggesting potential deeper cuts ahead.
- Best Buy and Sephora, both category specialists, play it conservative compared to mass retail players.
Let’s look at each category more closely to get a detailed snapshot of the deals this Thanksgiving week:
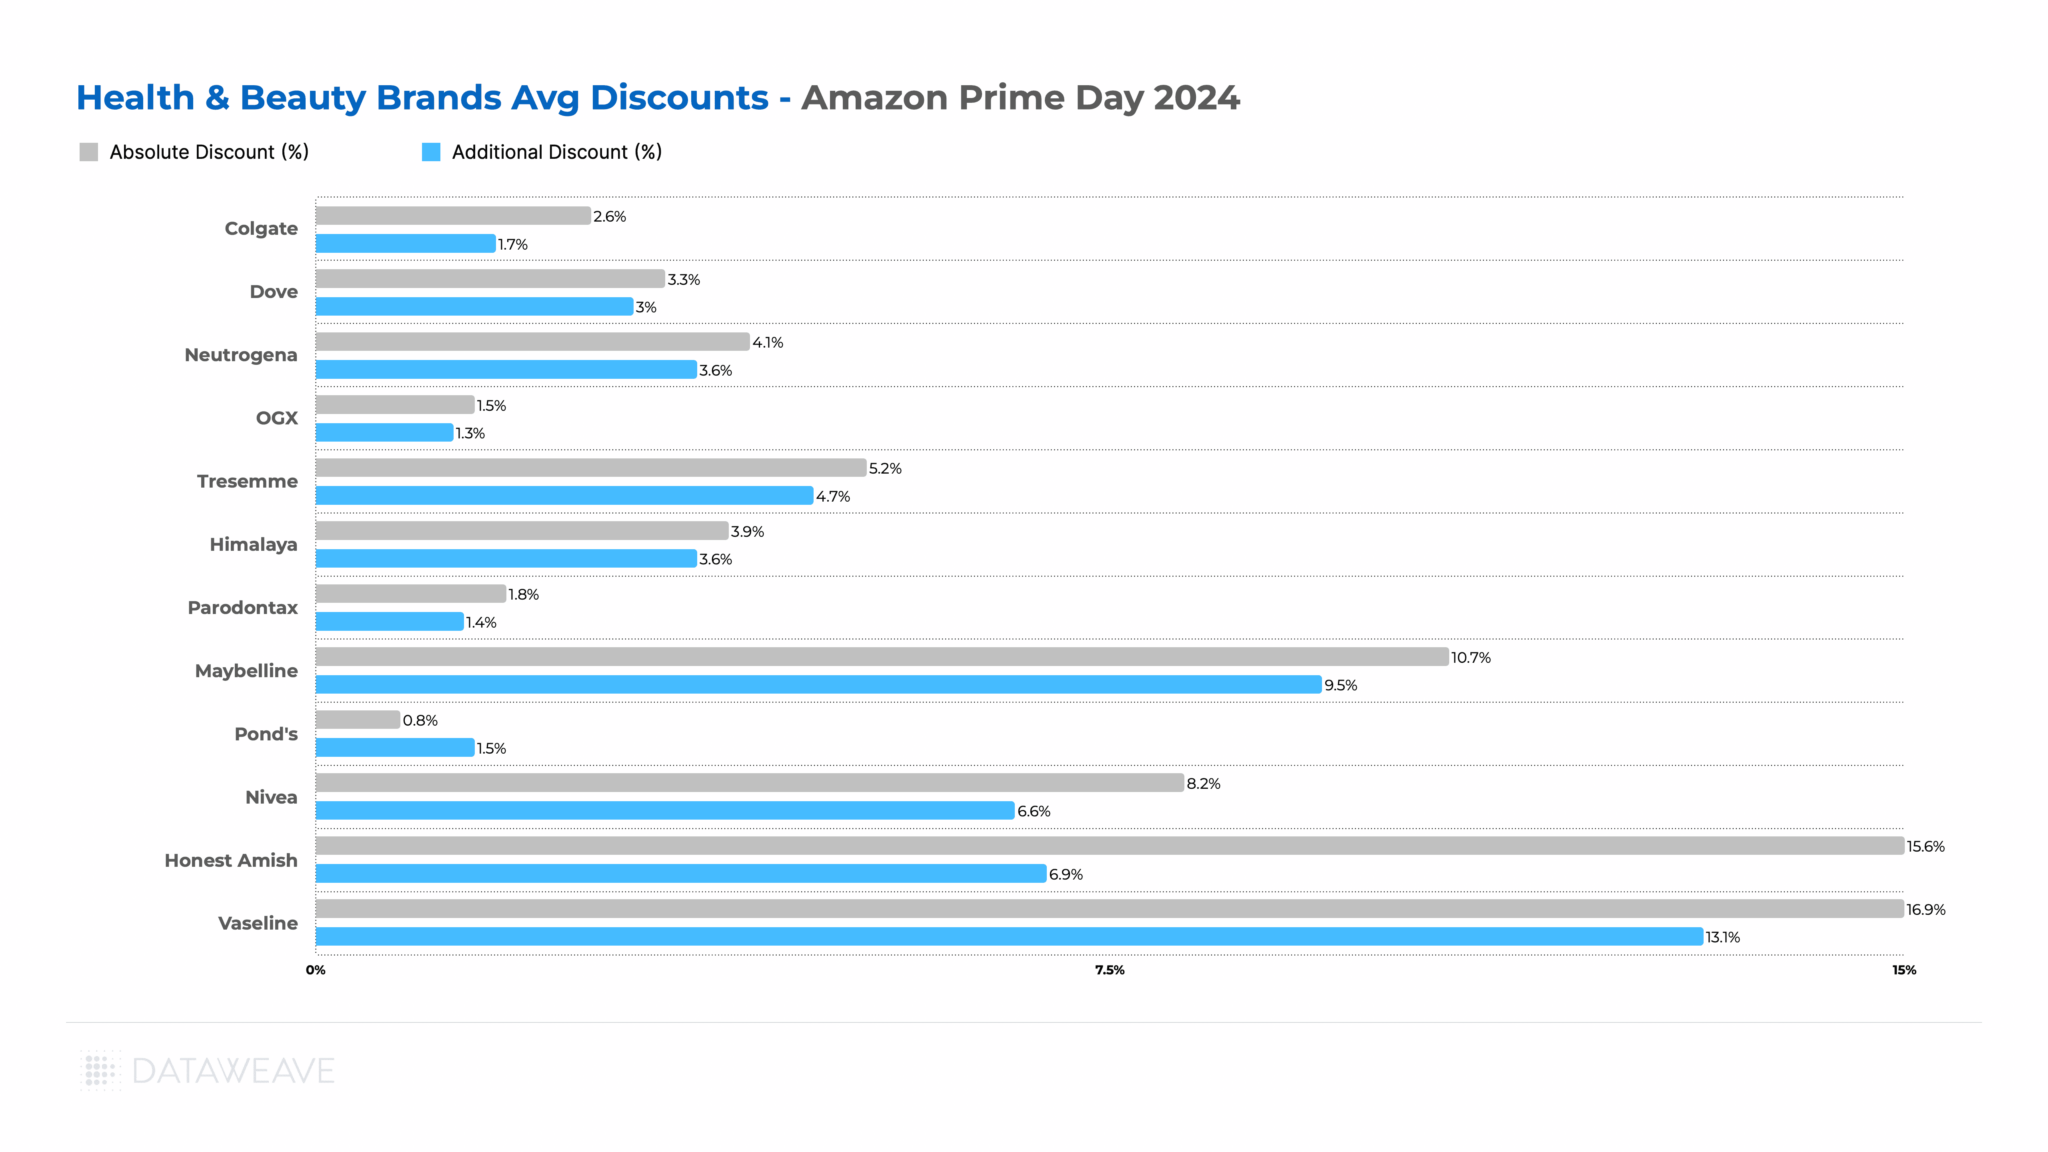
Health & Beauty
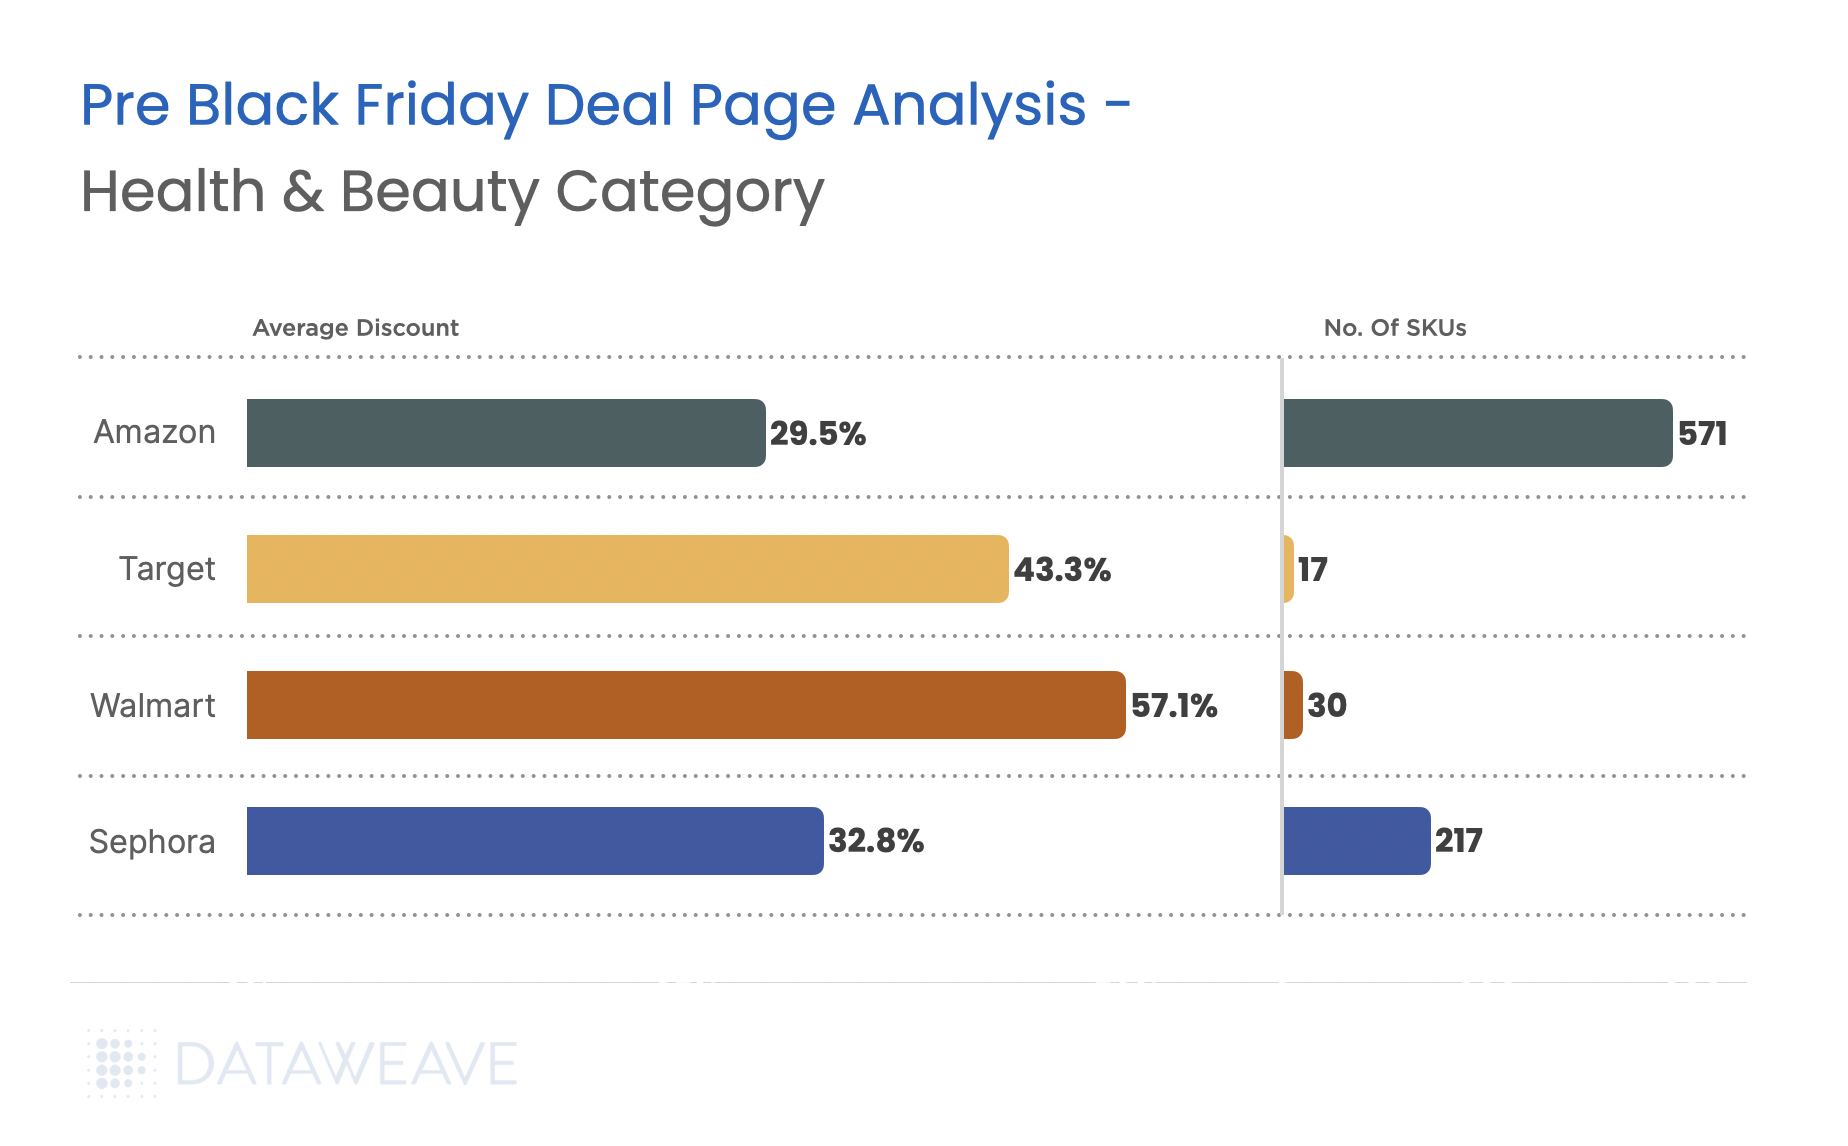
Our analysis reveals that it’s not electronics, but the health & beauty category that leads with the widest discount range pre Black Friday, making it the category to watch out for.
- Walmart takes the lead with an aggressive 57.1% average discount in this category, capitalizing on its value-oriented reputation.
- Beauty specialist Sephora holds modest beauty discounts (32.81%) compared to other retailers.
- Amazon offers the broadest range of SKUs (571) in the category.
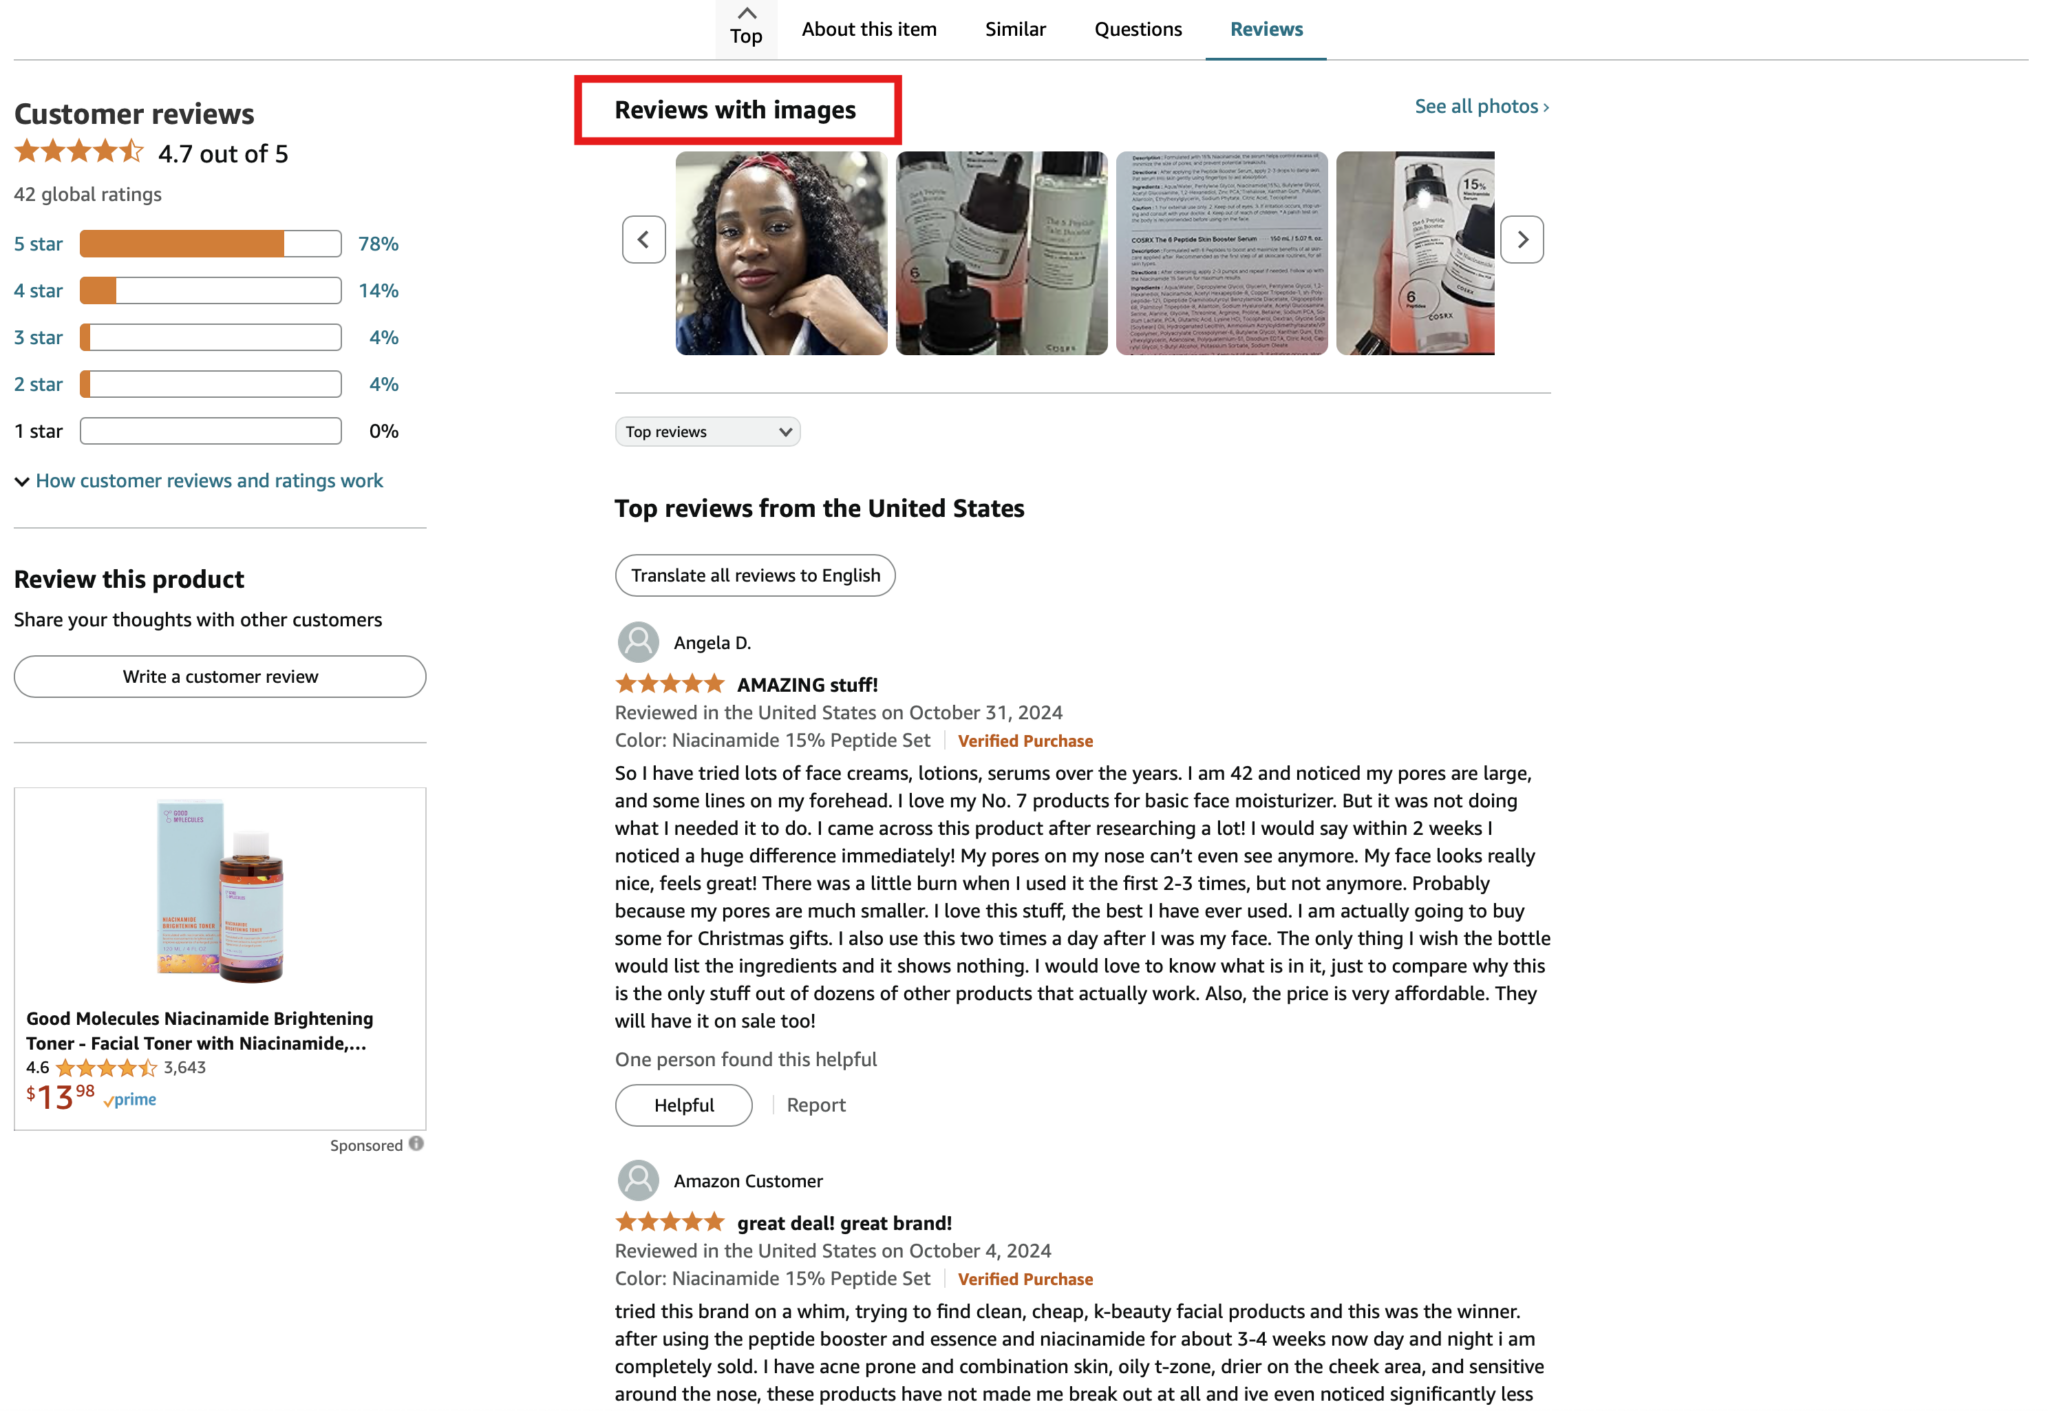
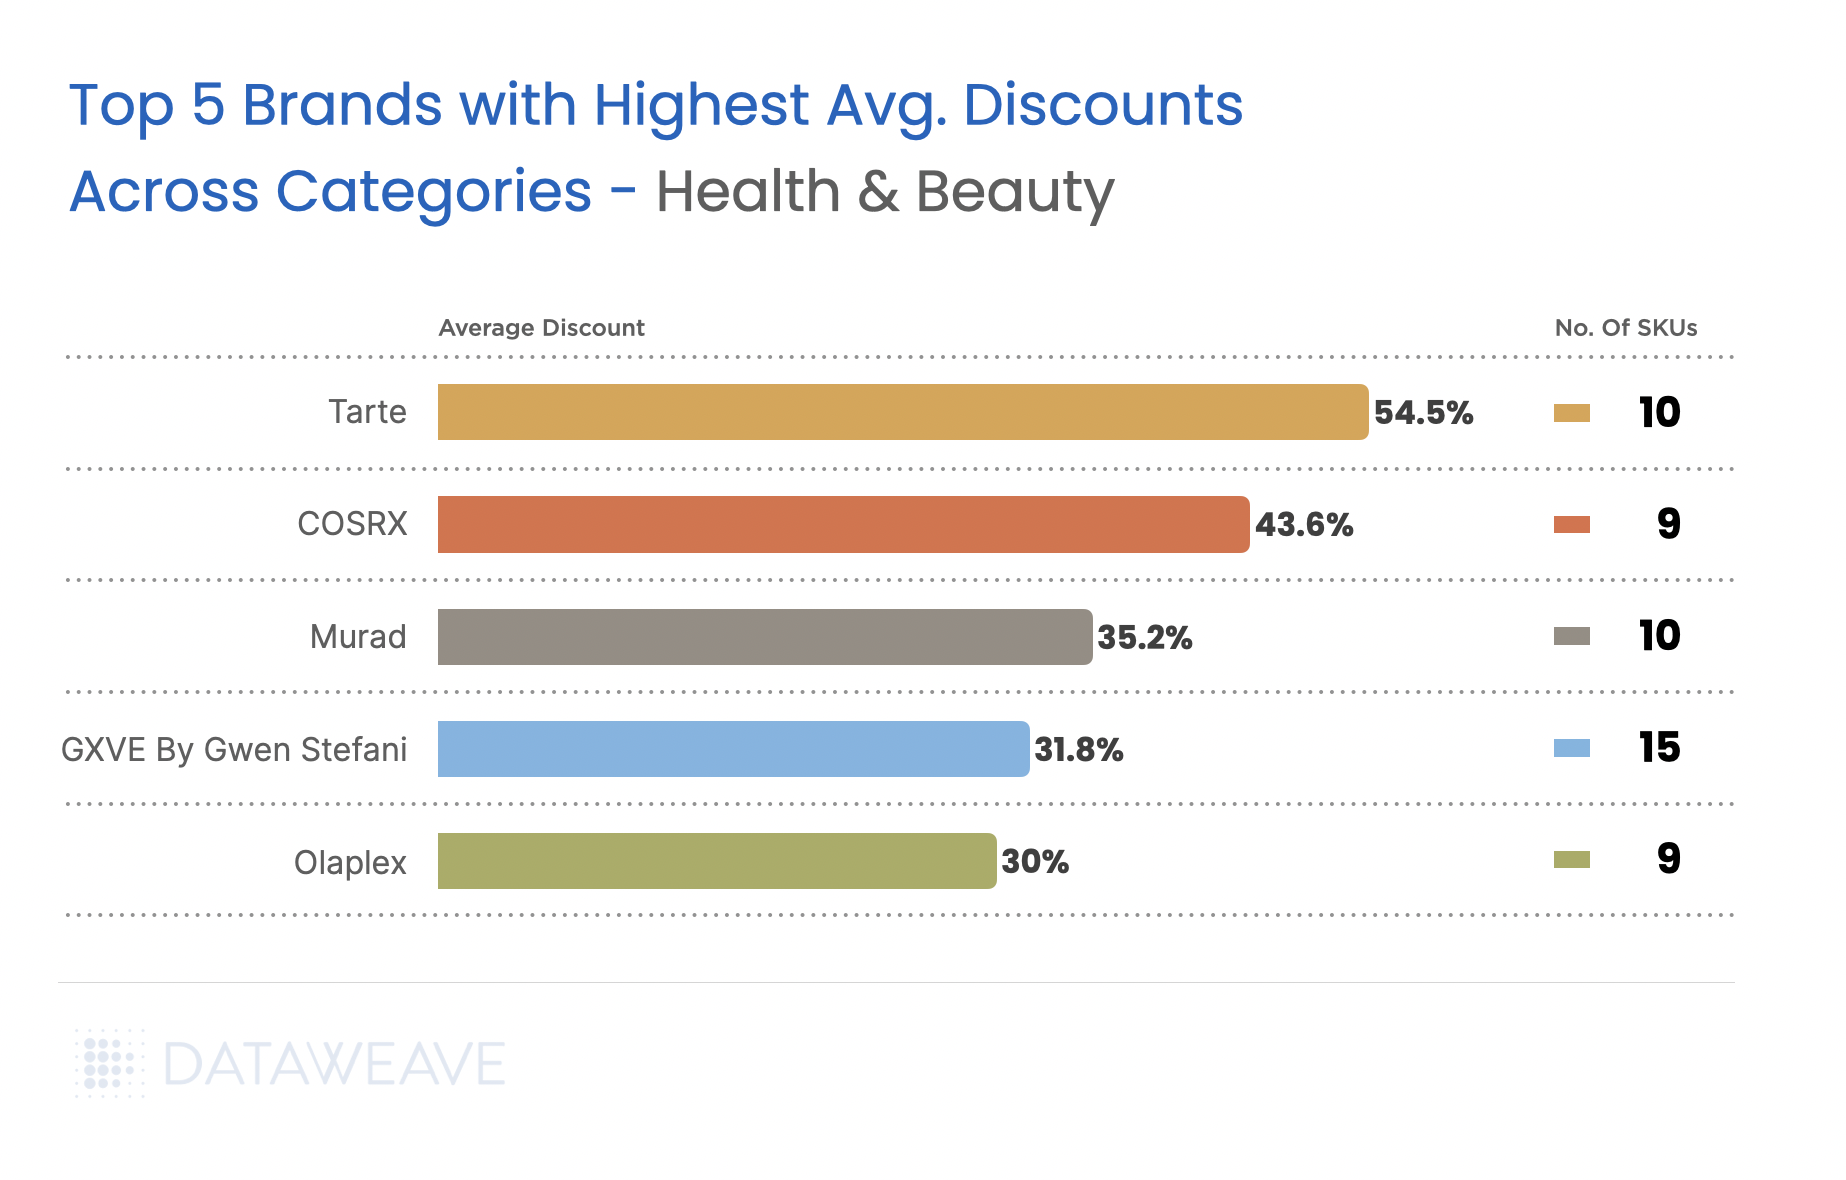
Among the health & beauty brands we analyzed, cosmetics brand Tarte and viral K-Beauty skincare brand COSRX stand out with discounts above 40%, appealing to cost-conscious beauty enthusiasts.
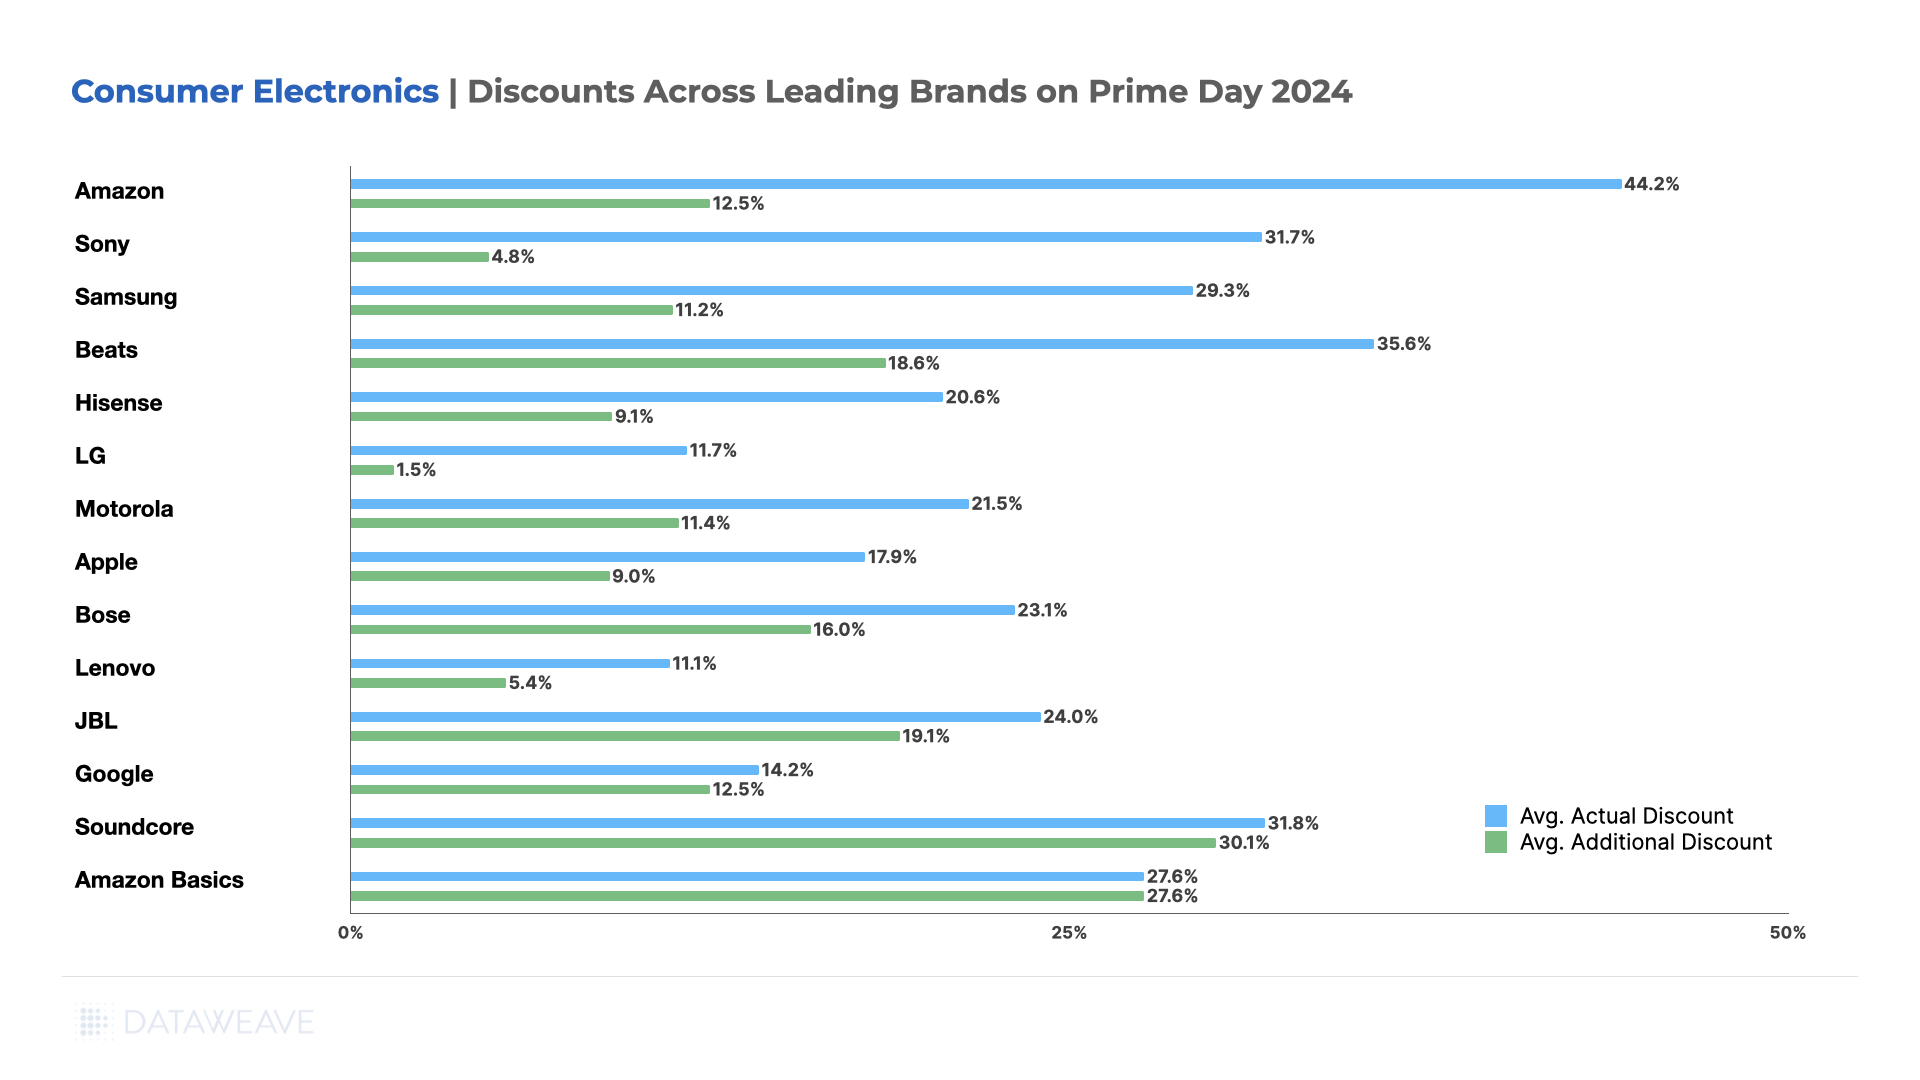
Consumer Electronics
Our pre- Black Friday analysis reveals interesting insights about consumer electronics deals this season.
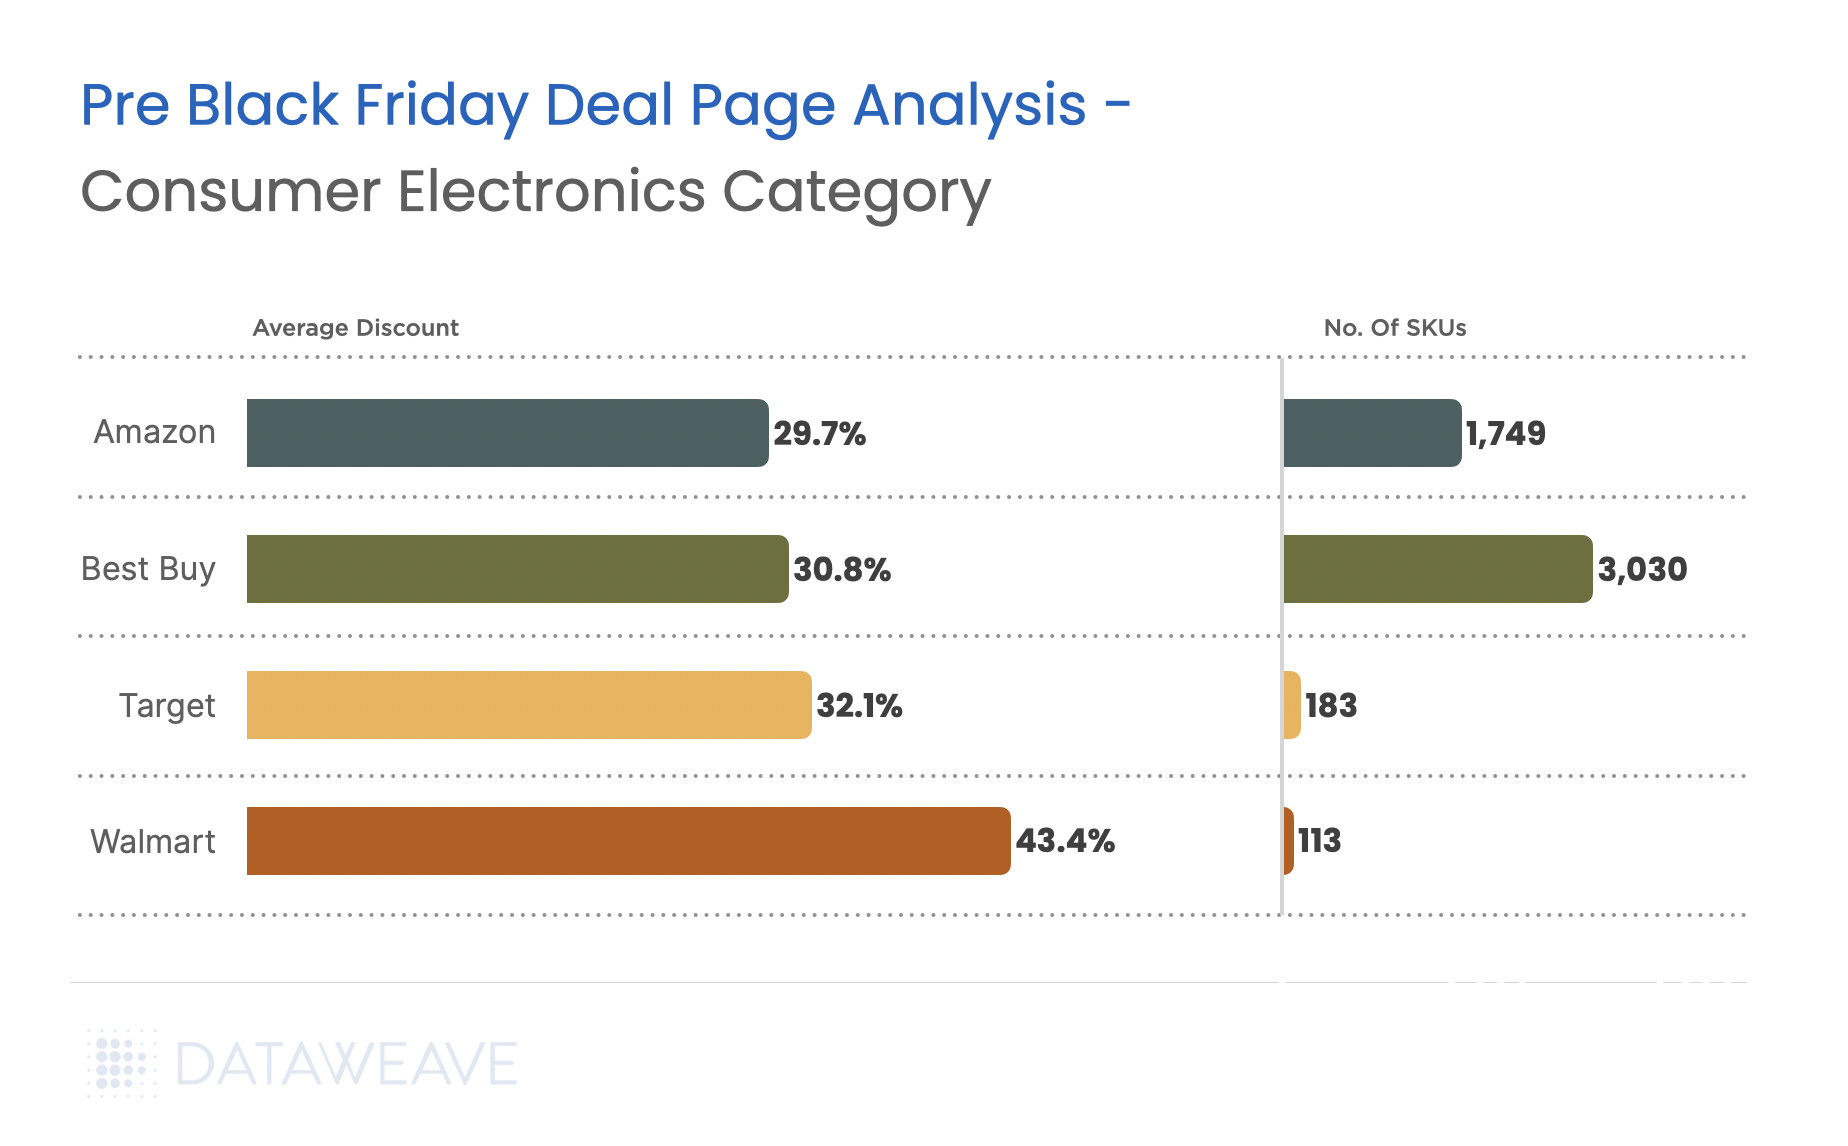
- Walmart, once again, emerges as the frontrunner in the category with 43.4% average discounts.
- Best Buy plays it conservative in electronics (30.75%), despite being a category specialist, but offers the most extensive SKU coverage (3030).
- Amazon’s consistent 29.7% discount across 1,749 SKUs suggests they’re probably holding back their best deals for Prime members during Black Friday.
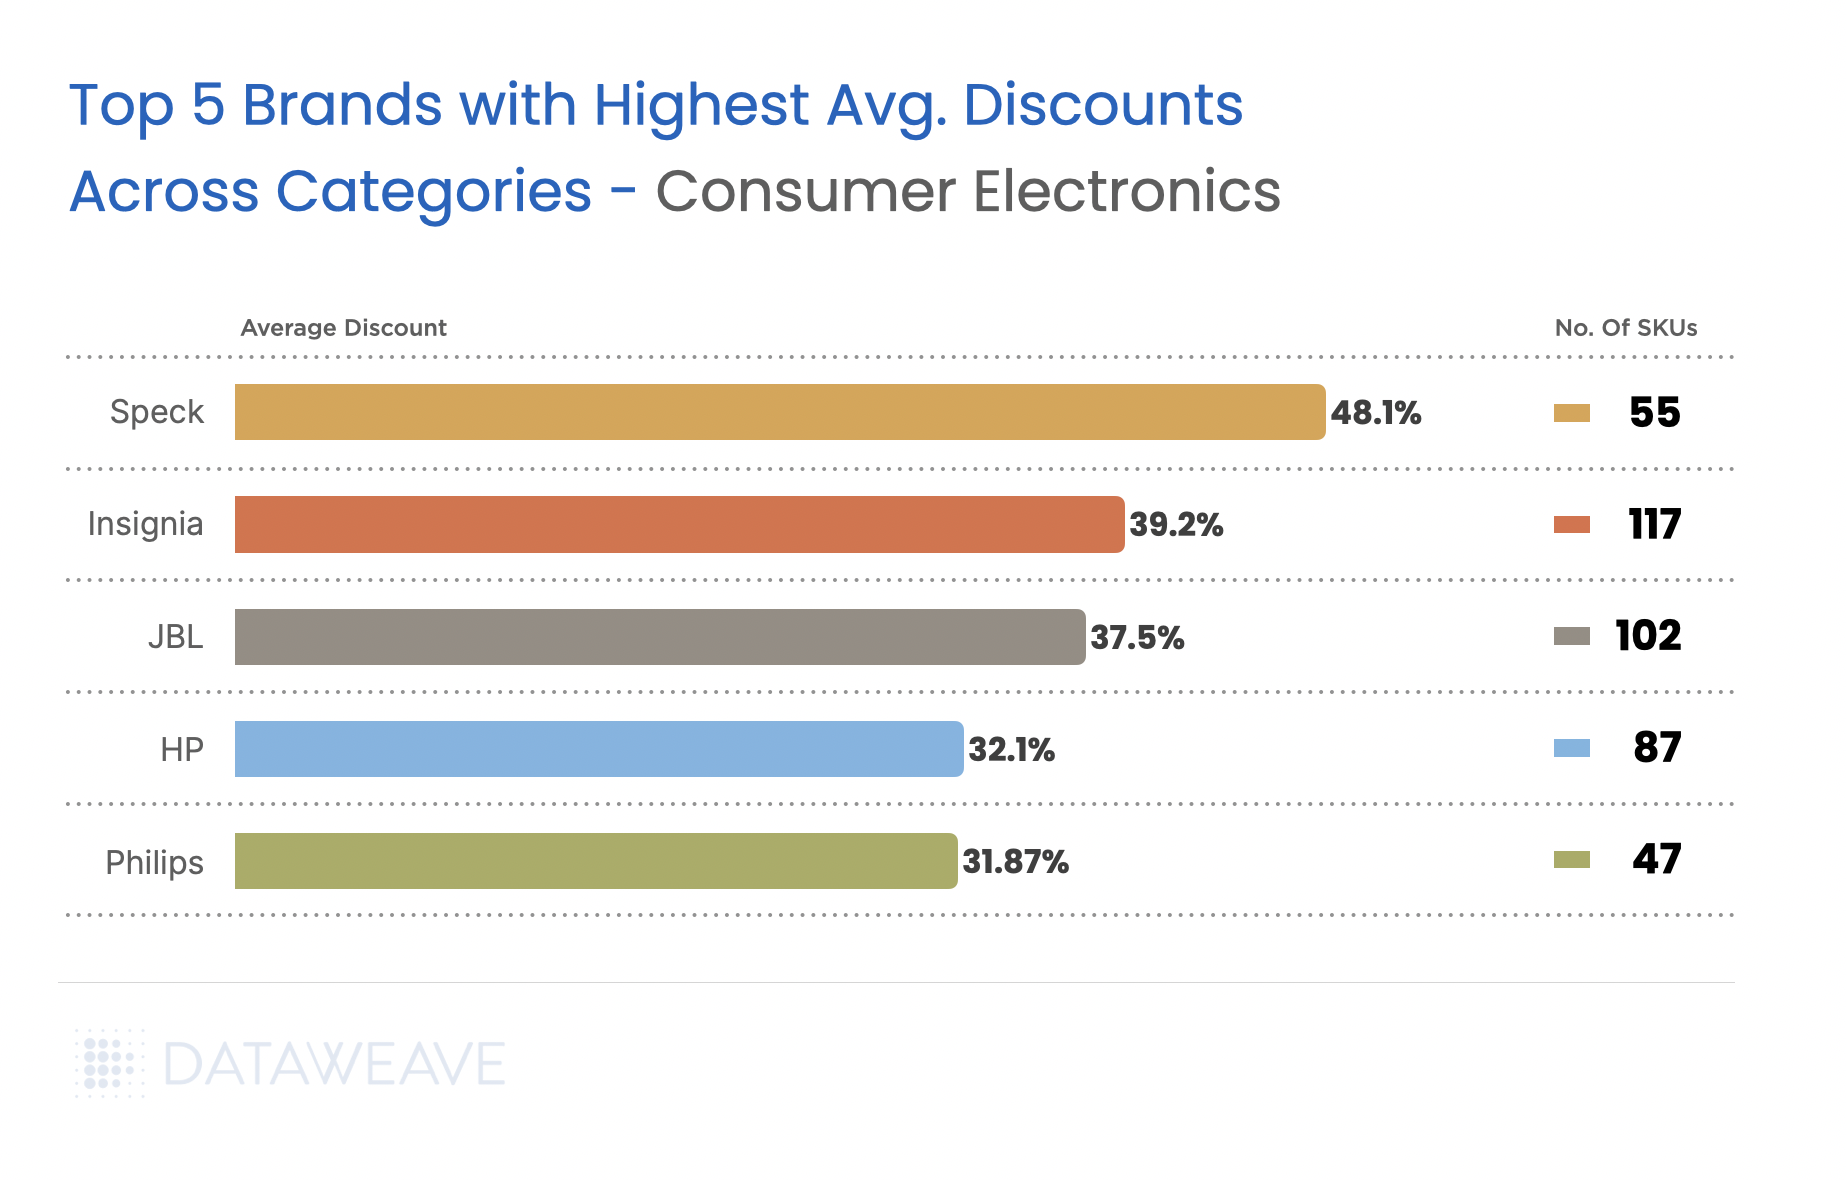
Brand-specific data for the category reveals significant deals on Speck (48.07%) and smart TV brand Insignia (39.22%), making accessories and mid-tier electronics attractive for early shoppers. Core computing (HP at 32.14%) and electronics brands maintain more conservative discounts. It remains to be seen if this changes on Black Friday or Cyber Monday.
Apparel
Our analysis of the apparel category reveals several highlights:
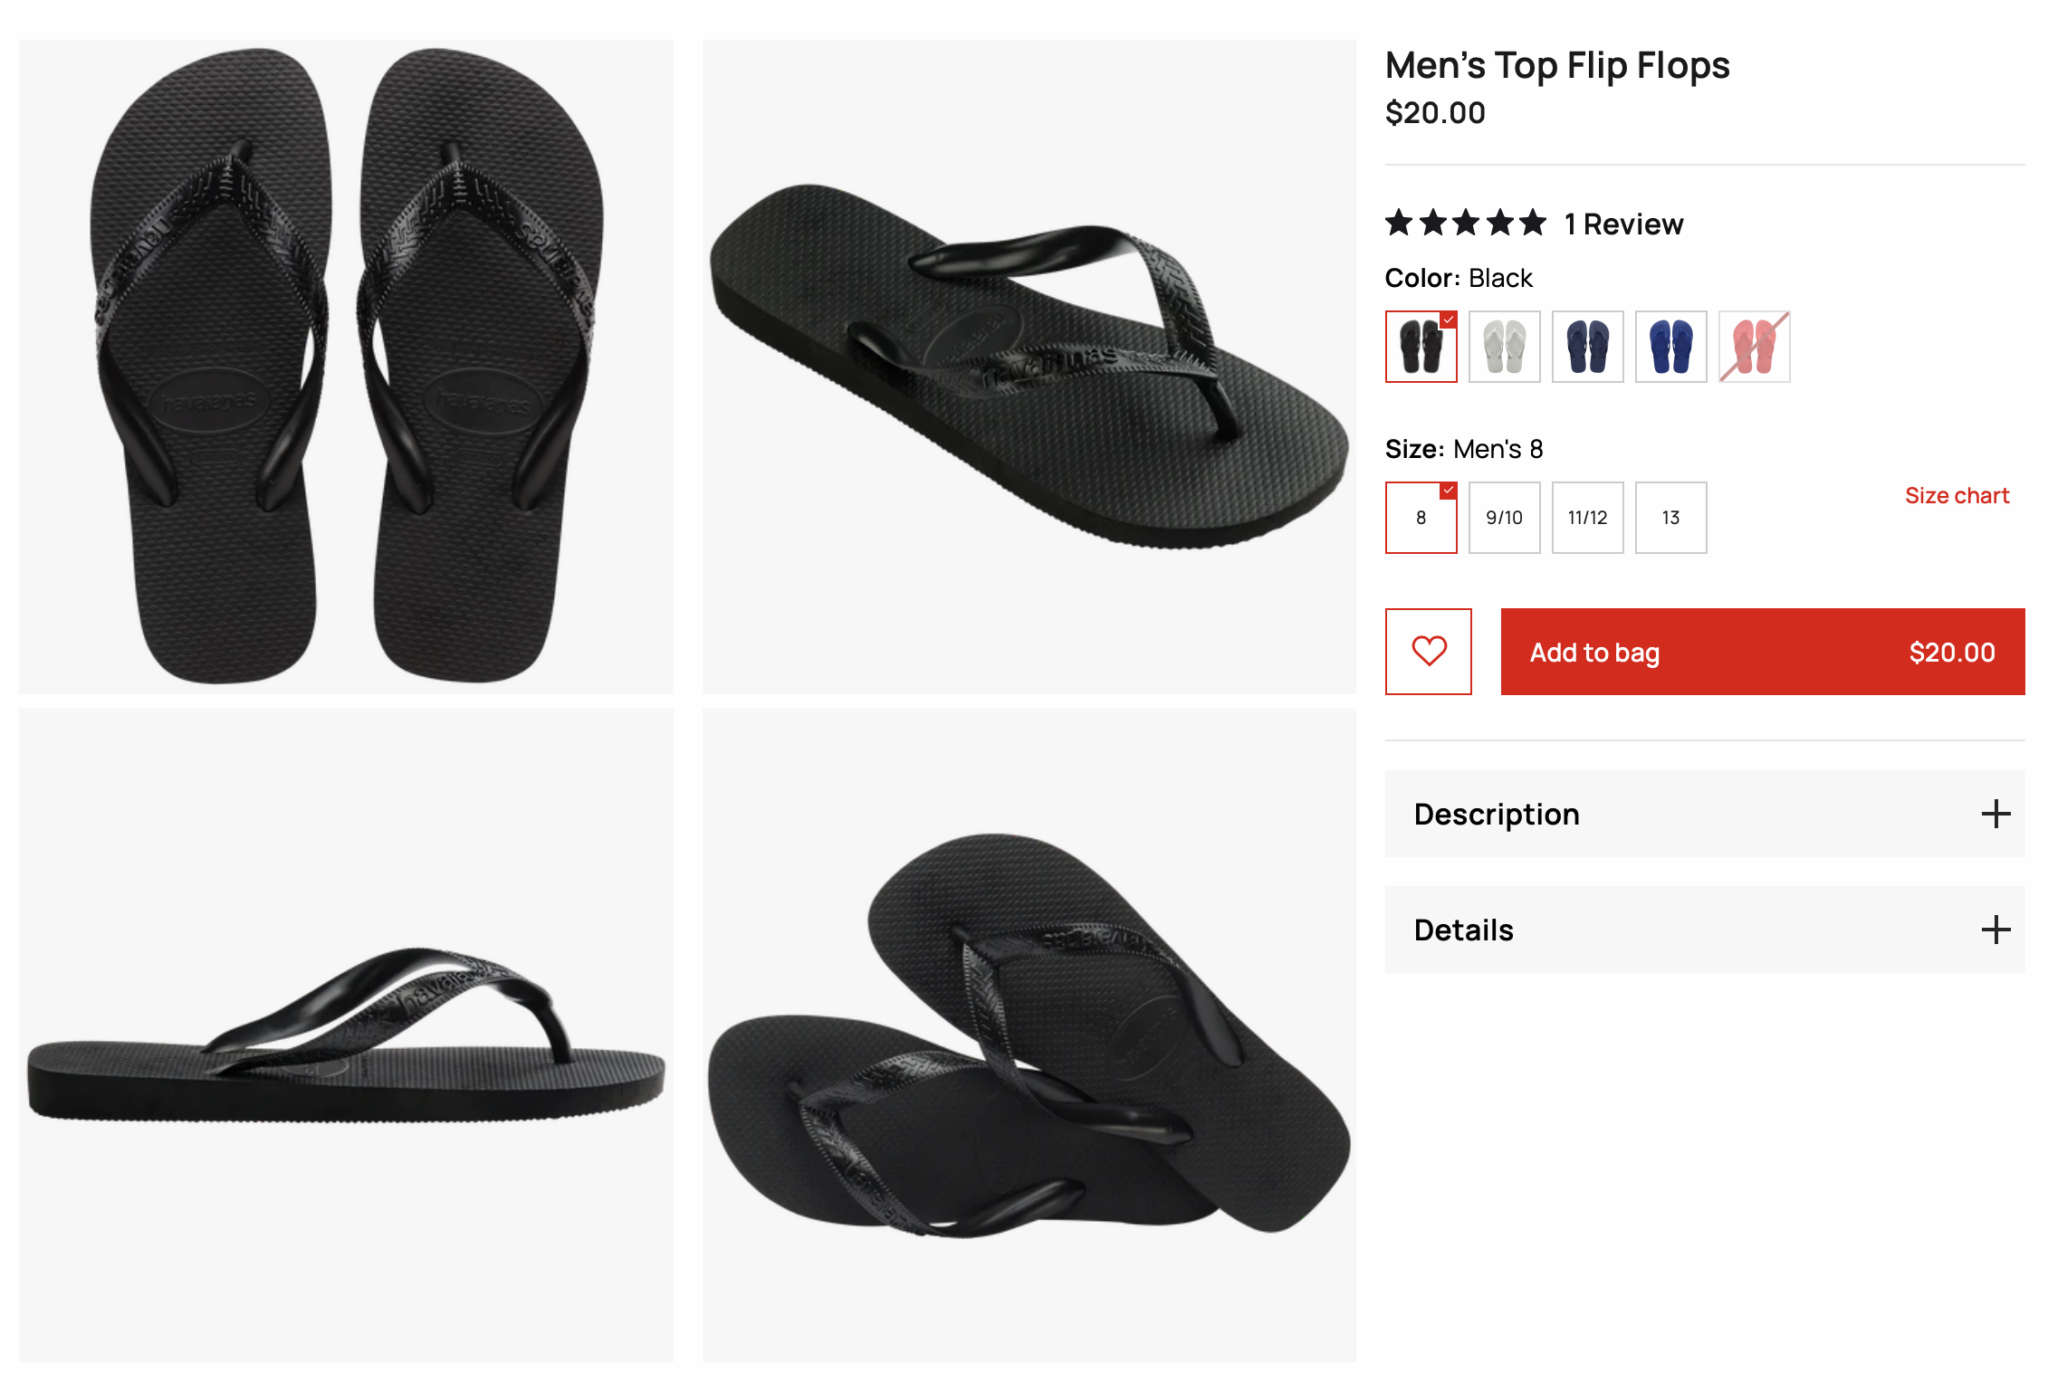
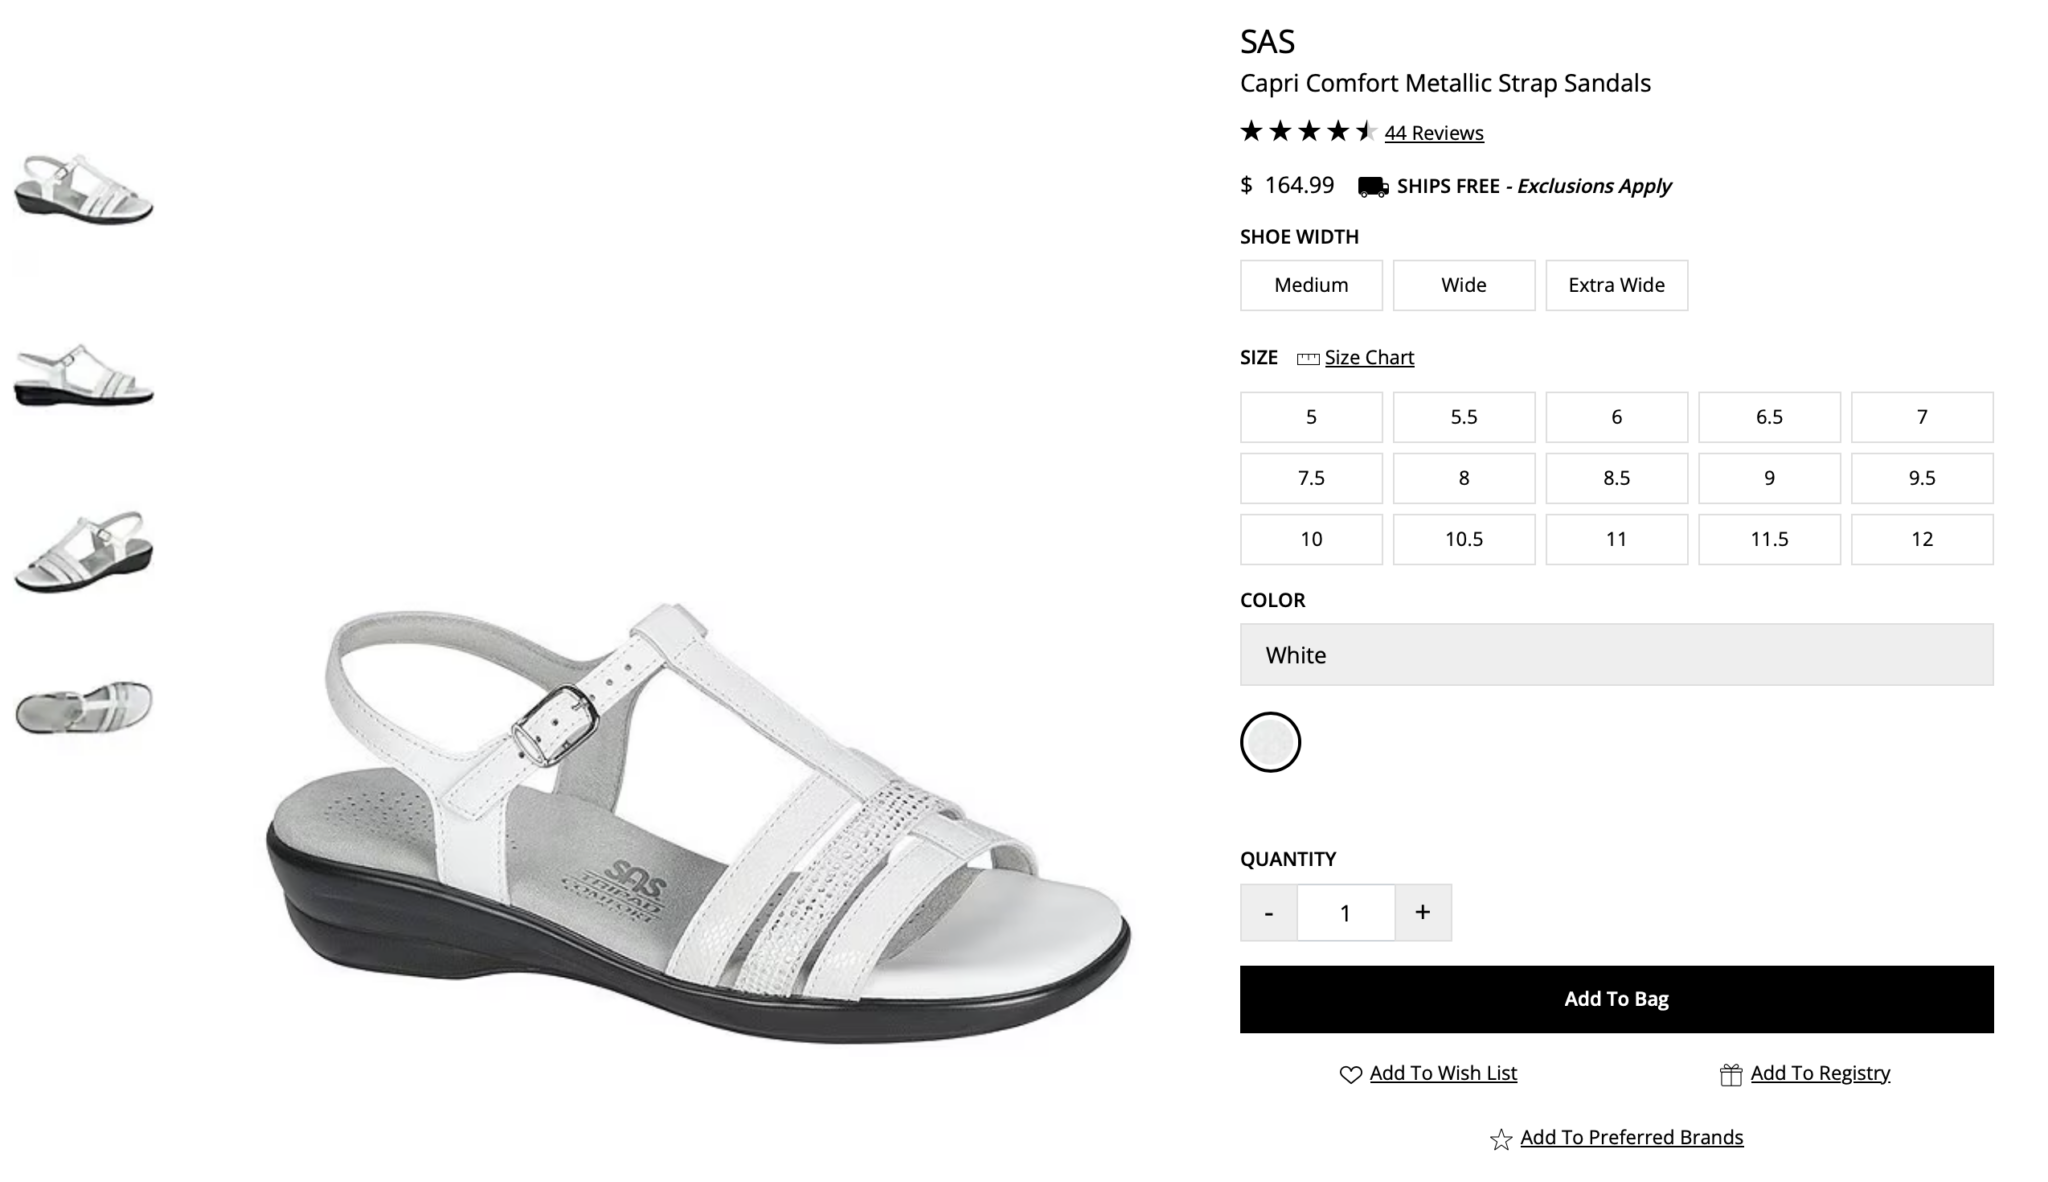
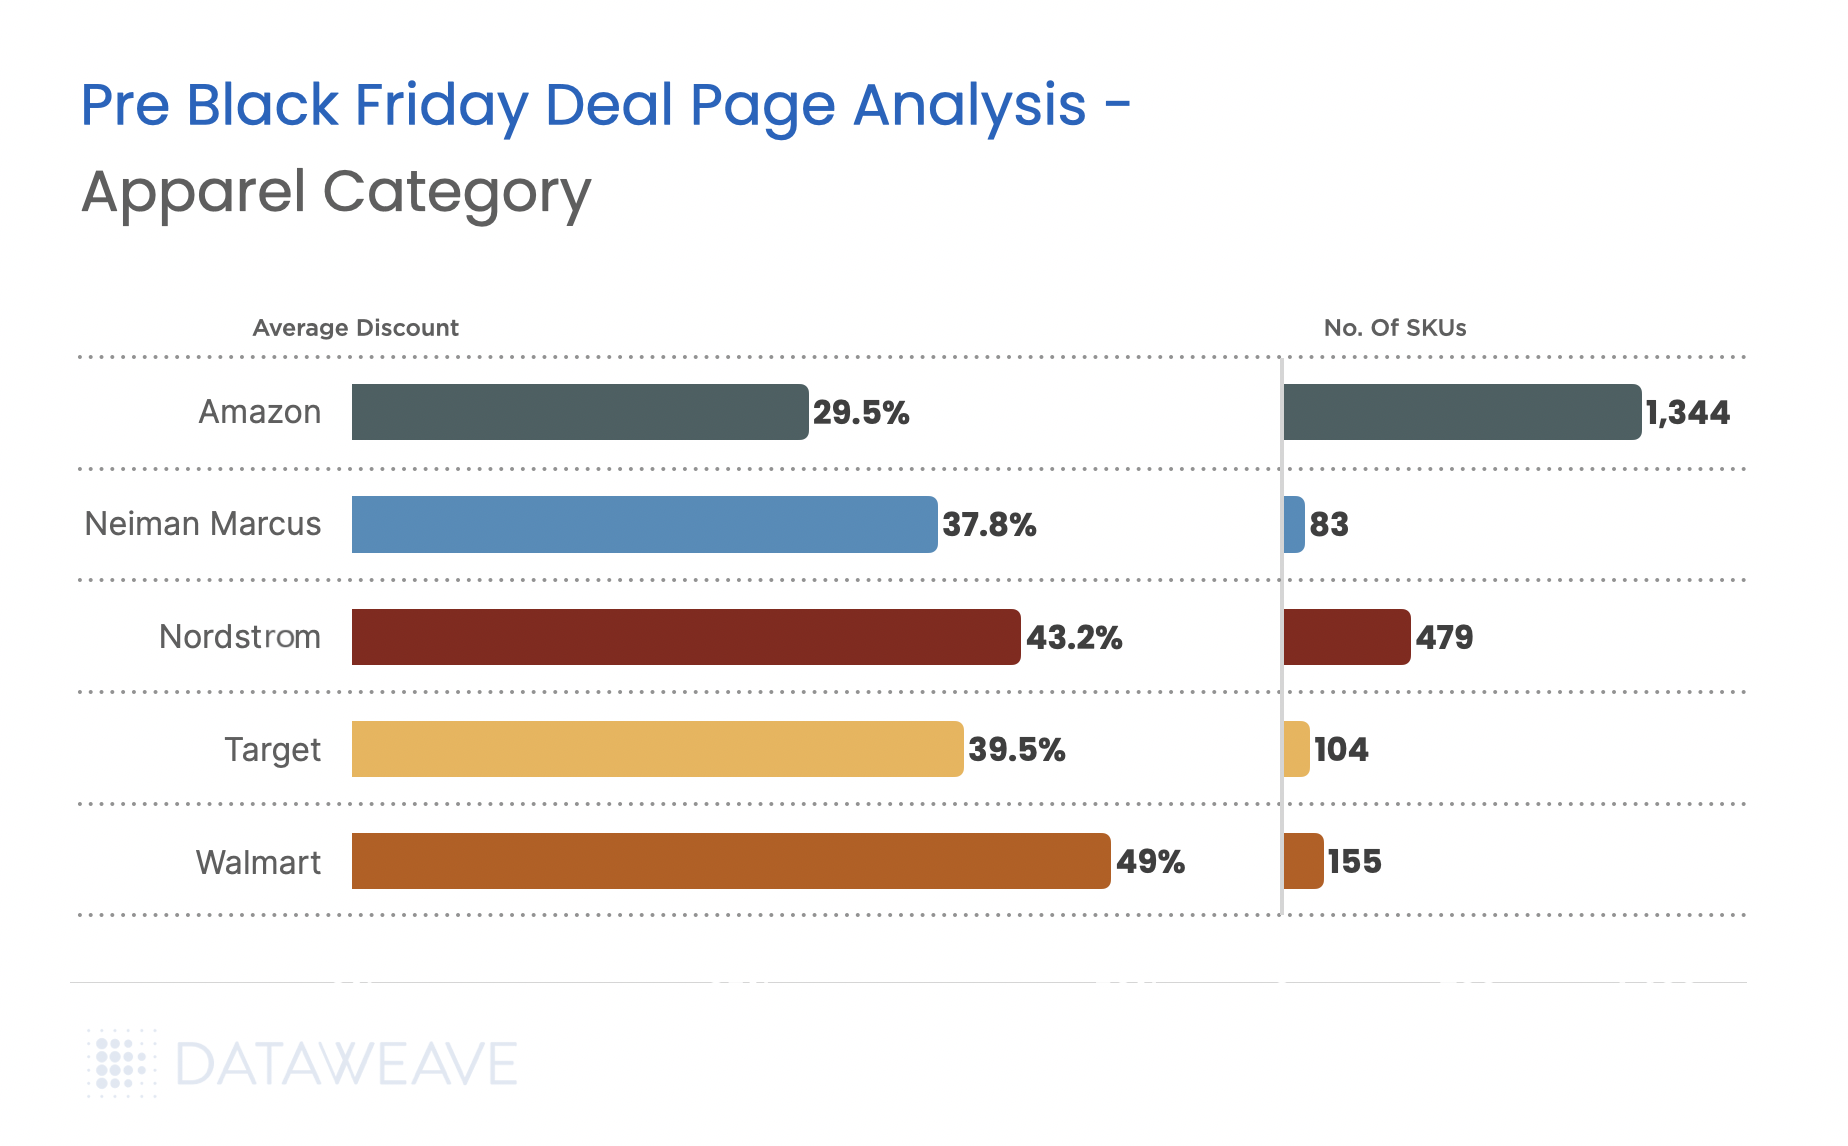
- In the apparel category too, Walmart dominates with an impressive 49% average discount, effectively targeting price-sensitive shoppers in the fashion segment.
- Nordstrom and Neiman Marcus, both known for apparel, offer significant discounts at 43.2% and 37.8% respectively.
- Amazon’s expansive SKU coverage (1344) is countered by a modest 29.5% discount, showing its focus on variety over depth of discounts.
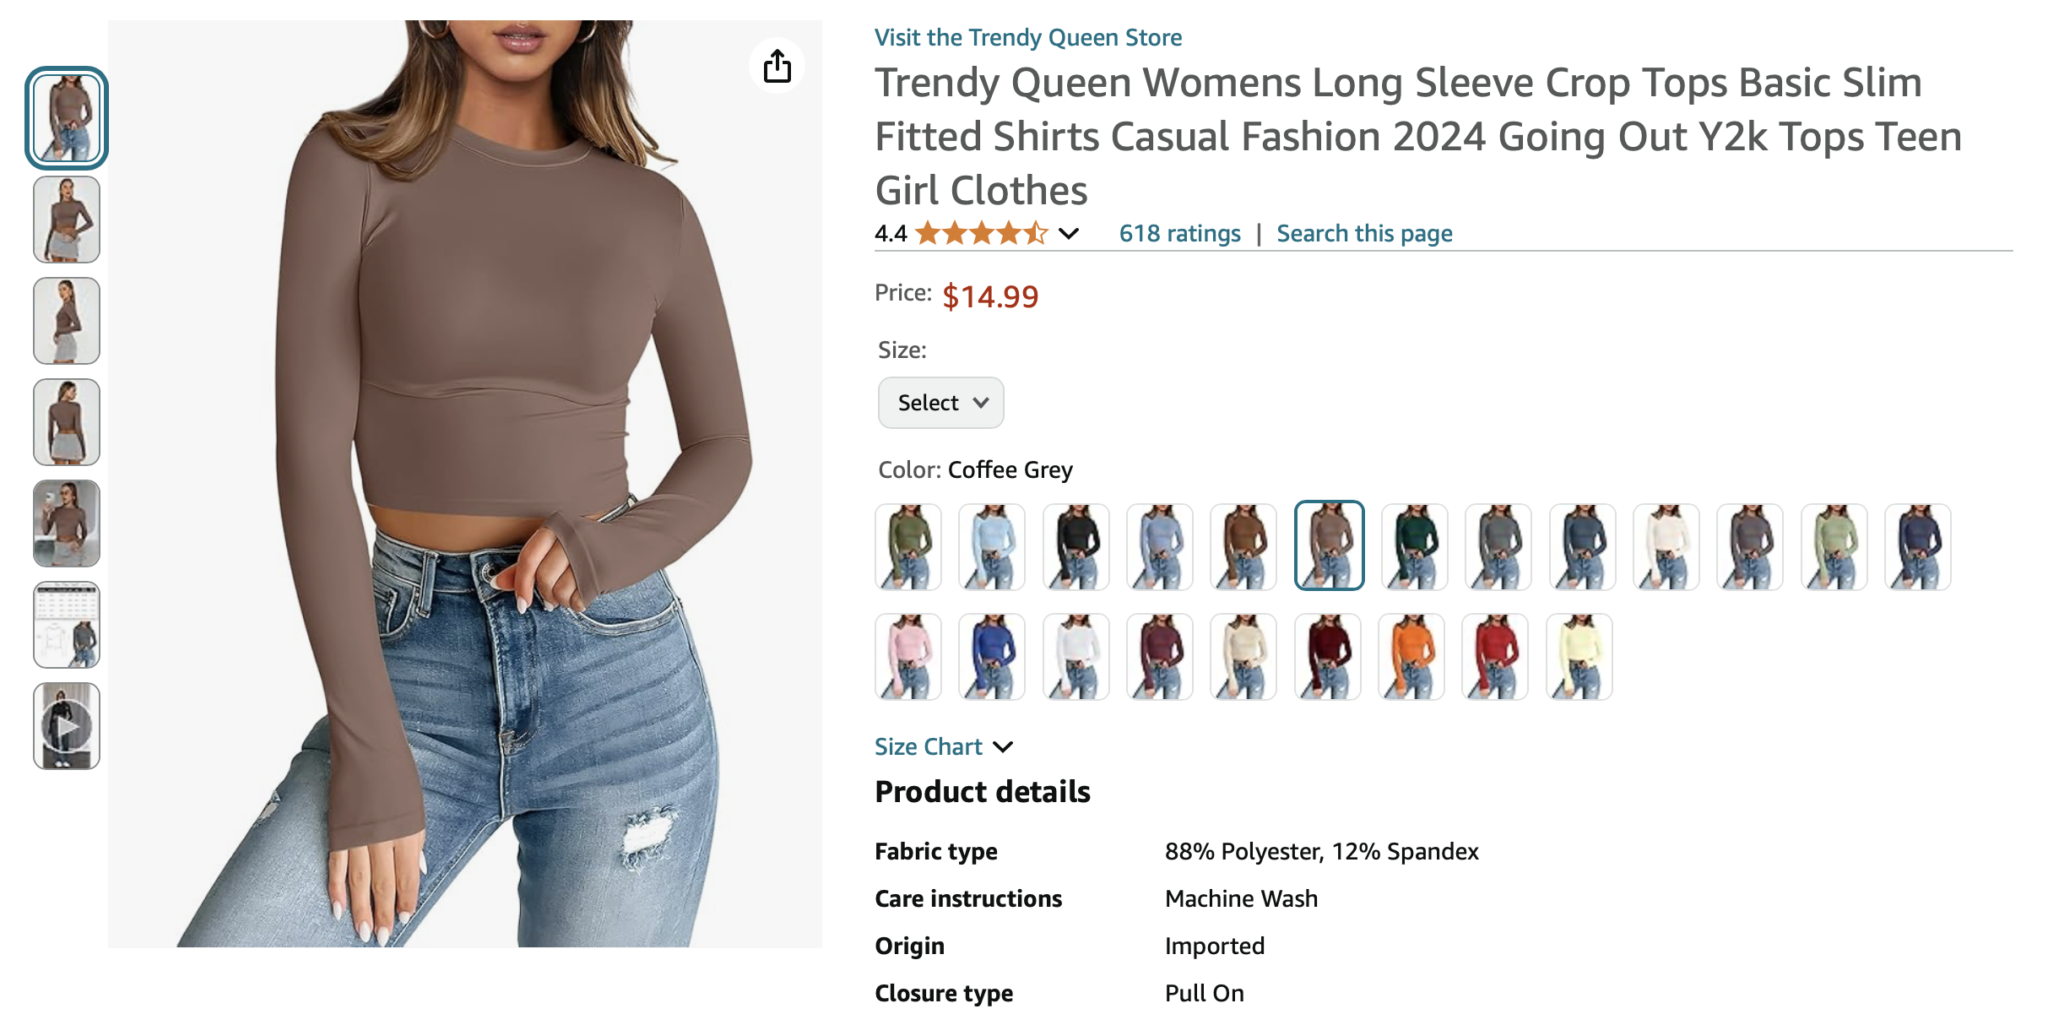
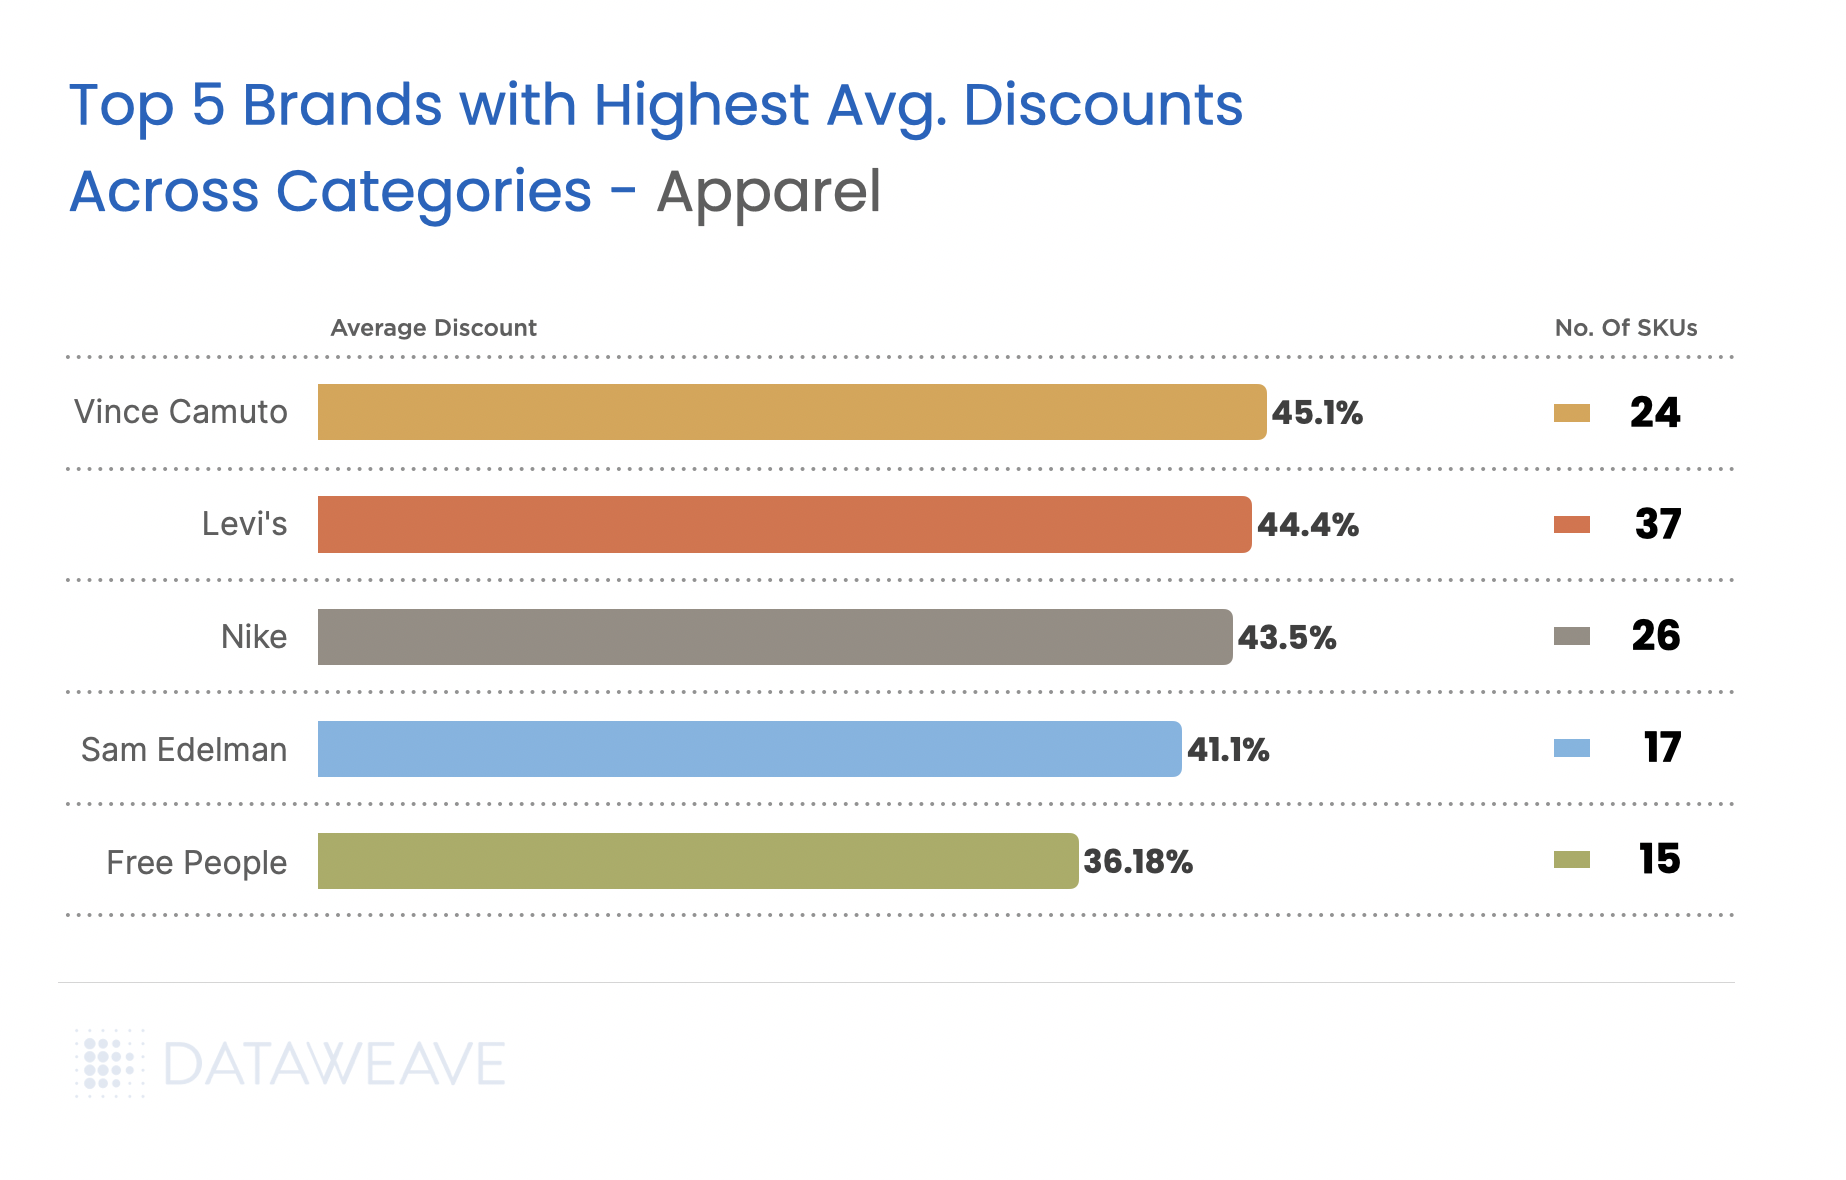
Premium fashion brands dominate the highest discounts this Black Friday in the apparel category. Vince Camuto leads with over 45.1% average discount. Notably, Levi and Nike’s aggressive 44.43% and 43.50% discounts suggests significant inventory positions or intent to capture market share.
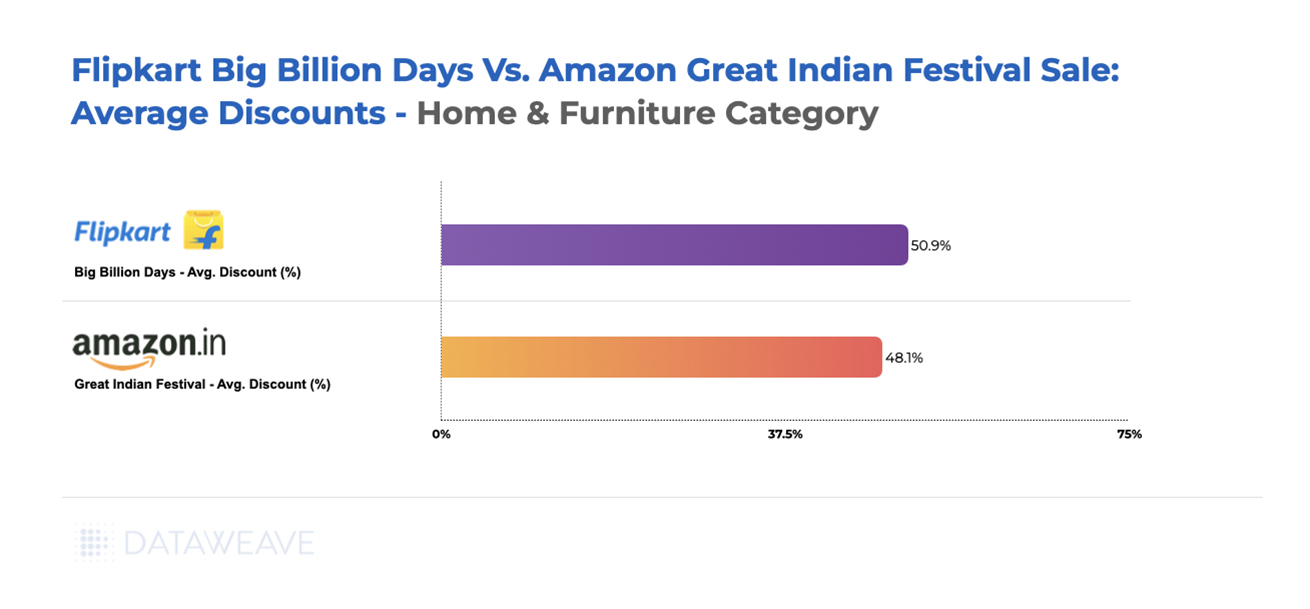
Home & Furniture
Our analysis reveals an interesting trend across the category.
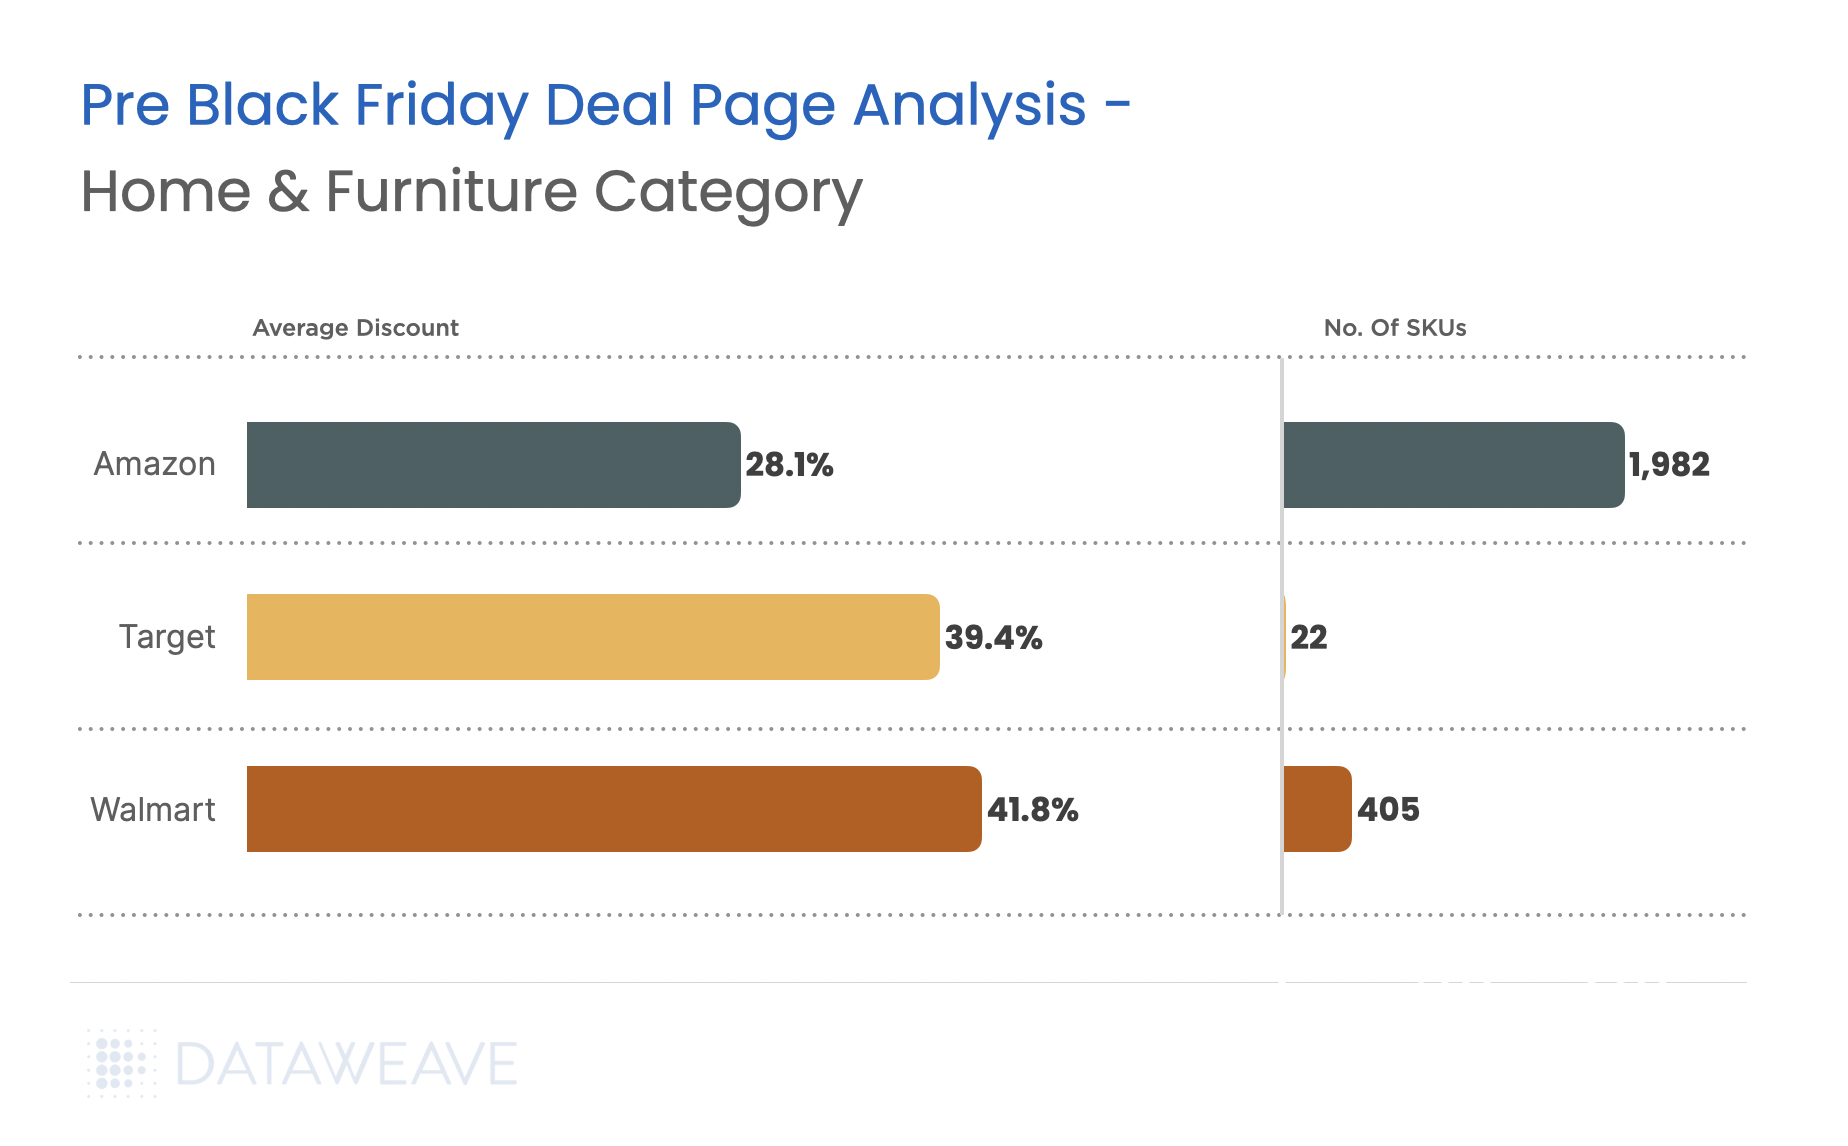
- In the home & furniture category too, Walmart leads at 41.8% average discounts. Target follows closely, but with significantly lesser SKUs on offer.
- Amazon’s 28.1% discount, though the lowest among major players, spans a substantial 1,982 SKUs, reinforcing its position as a marketplace for diverse needs.
Top 3 Products With the Highest Discounts Across Retailers
To provide a clearer picture of the early Black Friday landscape, we analyzed the top 3 products with the most substantial discounts in consumer electronics and health & beauty categories. These insights highlight how retailers are leveraging strategic discounts on high-value items to attract early shoppers.
Top Discounted Products in Consumer Electronics
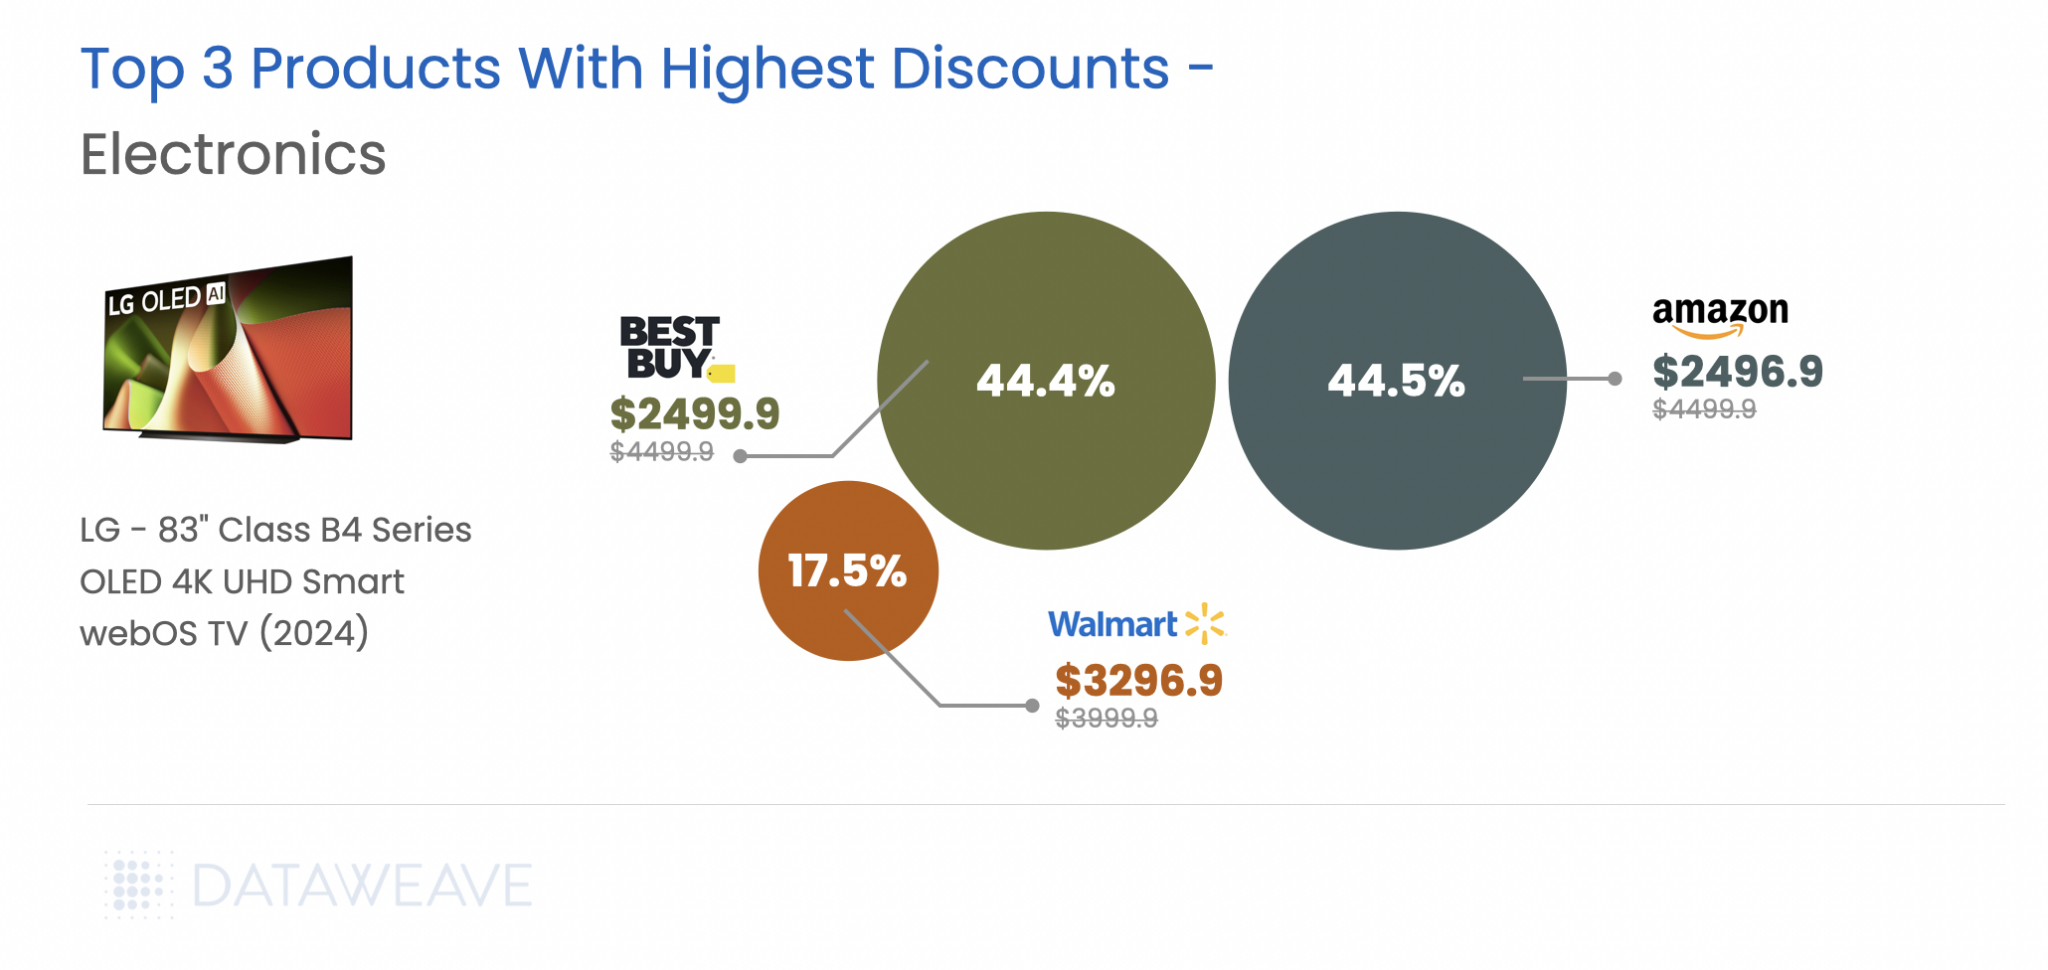
Premium TVs dominate the discount scene, with LG’s 83″ OLED offering up to 44.5% off on Amazon, closely followed by a 44.4% discount on Best Buy, showcasing aggressive competition. The same product has much lower discounting on Walmart, but notably, the product is retailed at $3999.9, at least $1000 less than other retailers, highlighting Walmart’s commitment to offering lowest prices.
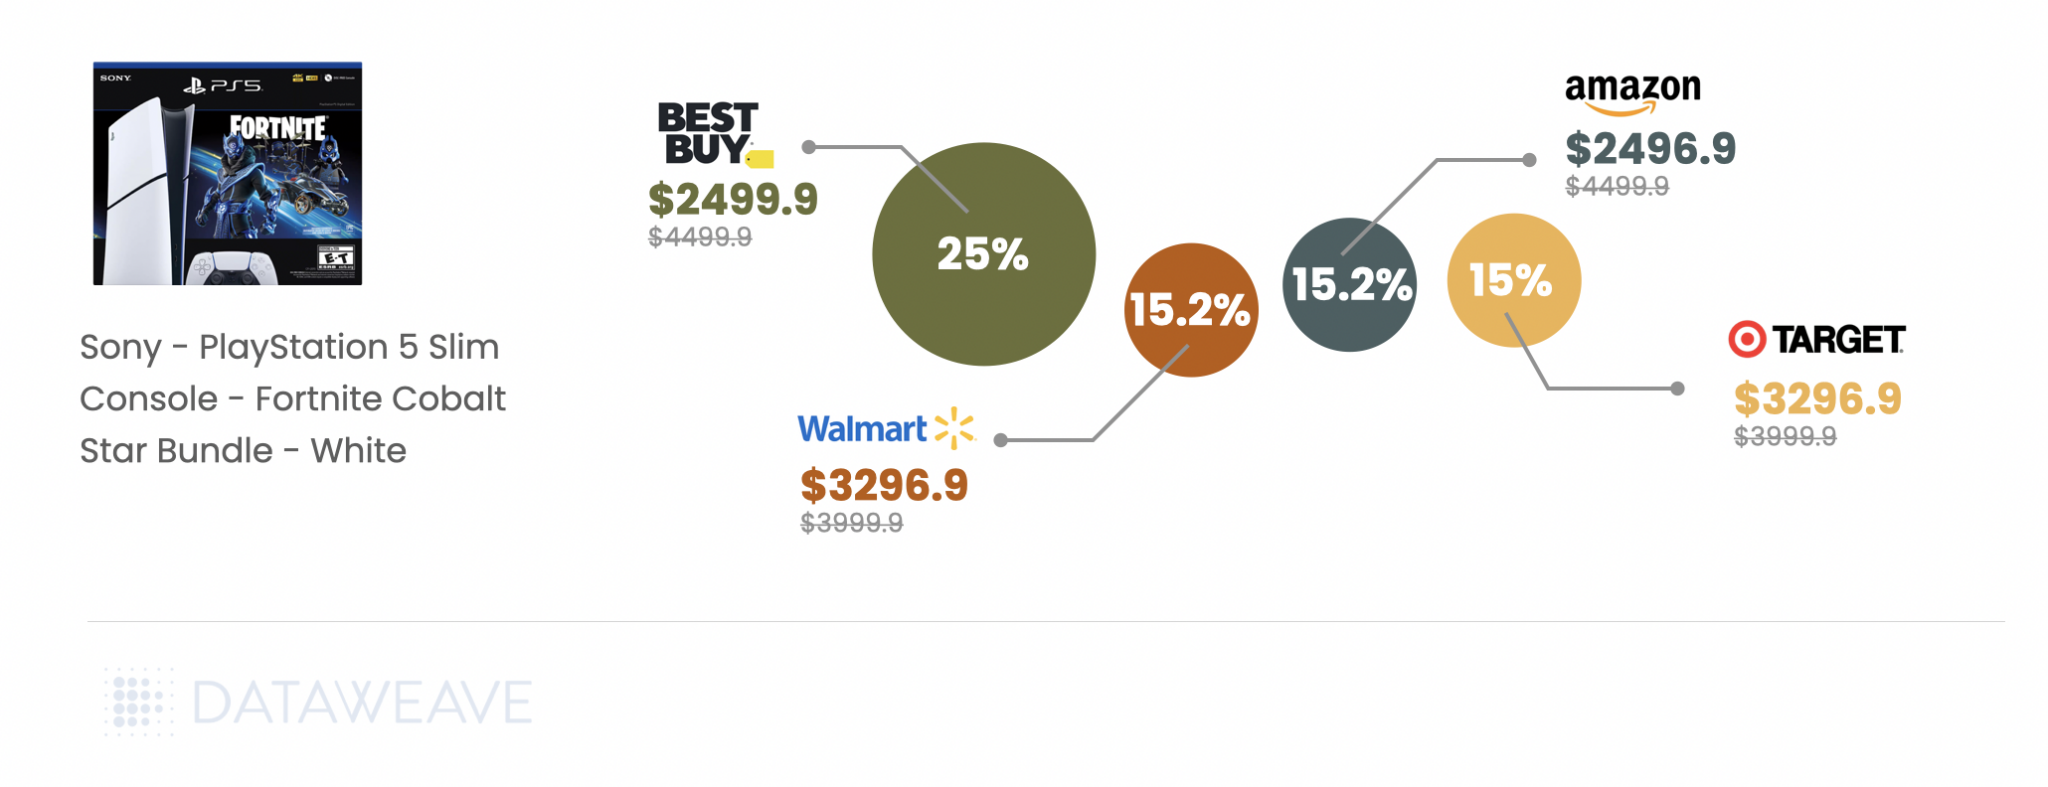
Gaming consoles, like the PlayStation 5 Slim Bundle, show moderate discounts (ranging from 15% on Walmart and Target to 25% at Best Buy), appealing to tech-savvy shoppers.
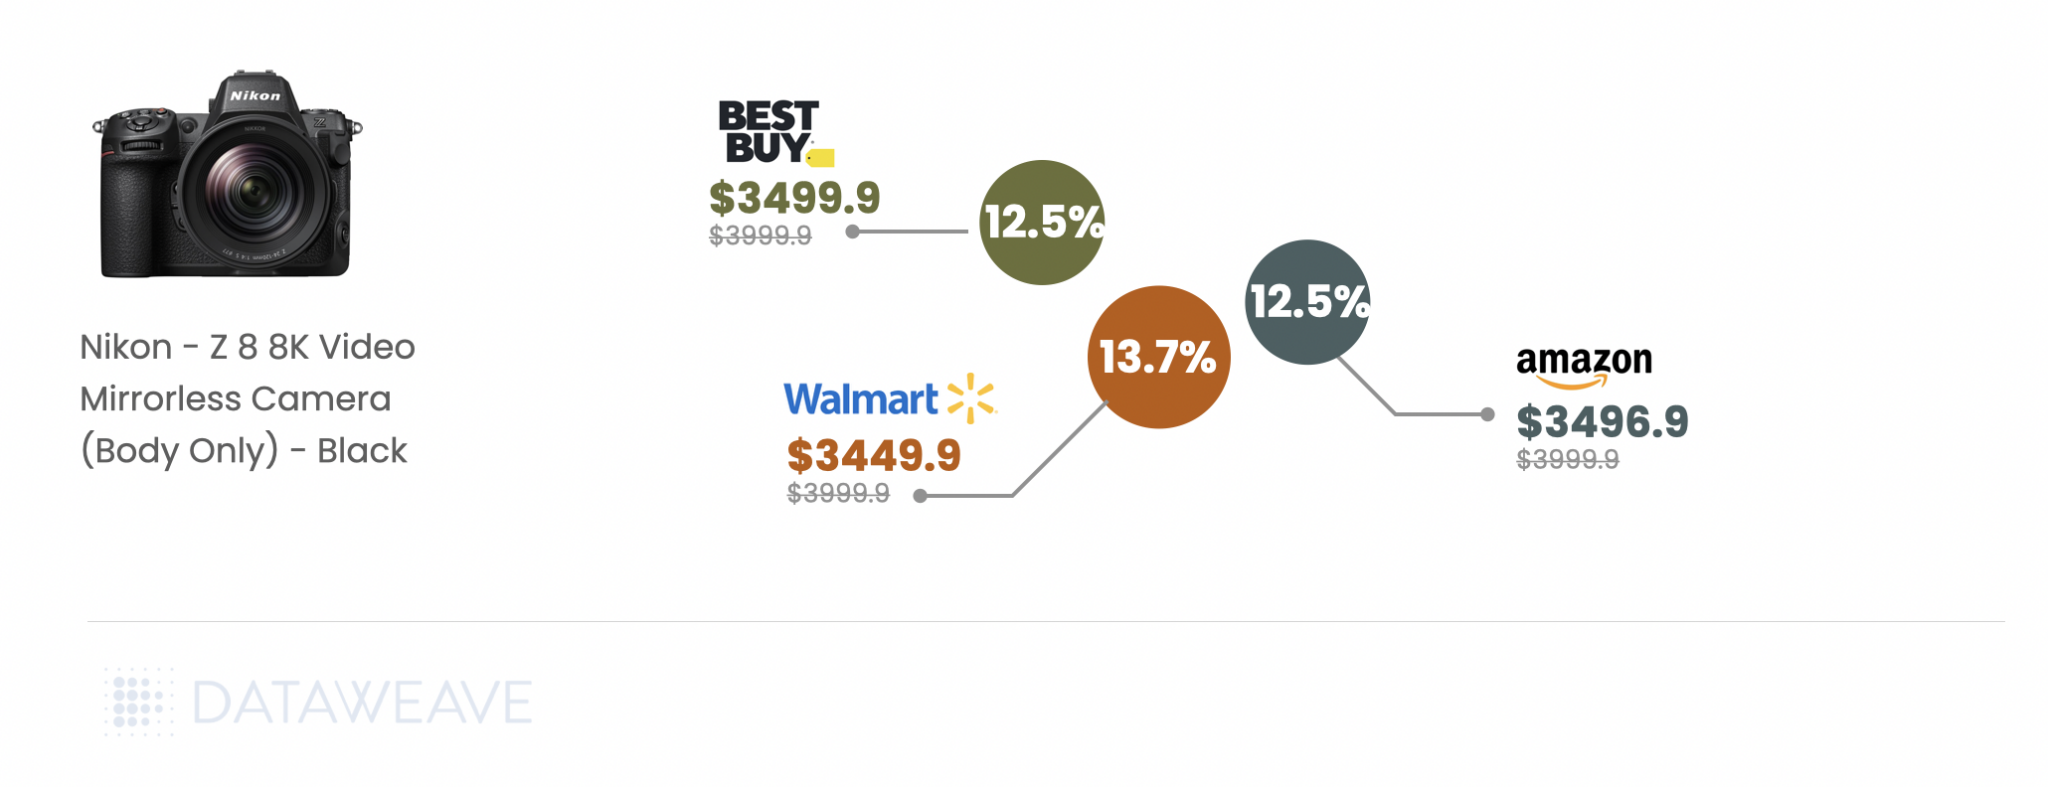
Notable competition is evident in price matching across major retailers, particularly in TVs and high-value electronics like the Nikon Z 8 camera, where Walmart offers the deepest discount at 13.75%, edging past Amazon and Best Buy.
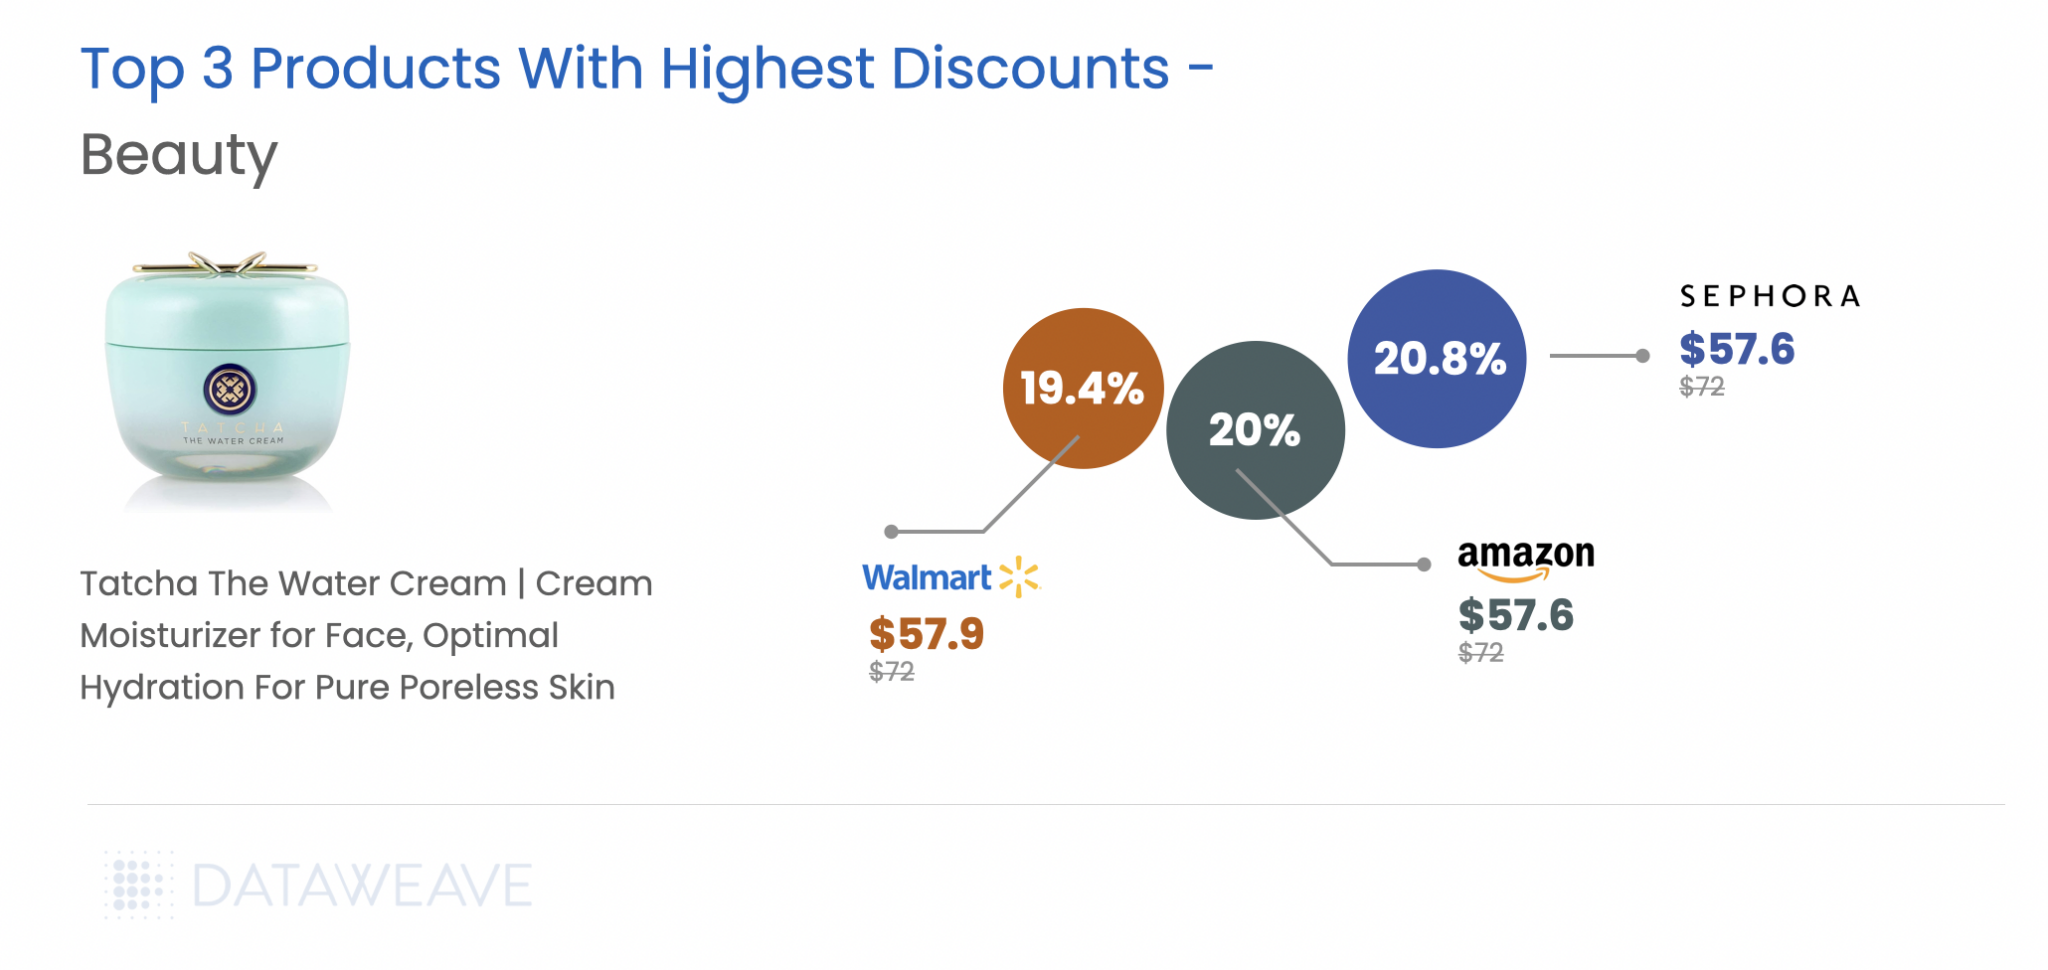
Top Discounted Products in Health & Beauty
Viral skincare staples like Tatcha’s Water Cream show tight discounting consistency, with Walmart offering 19.47% off compared to Amazon’s 20% and Sephora’s 20.83%.
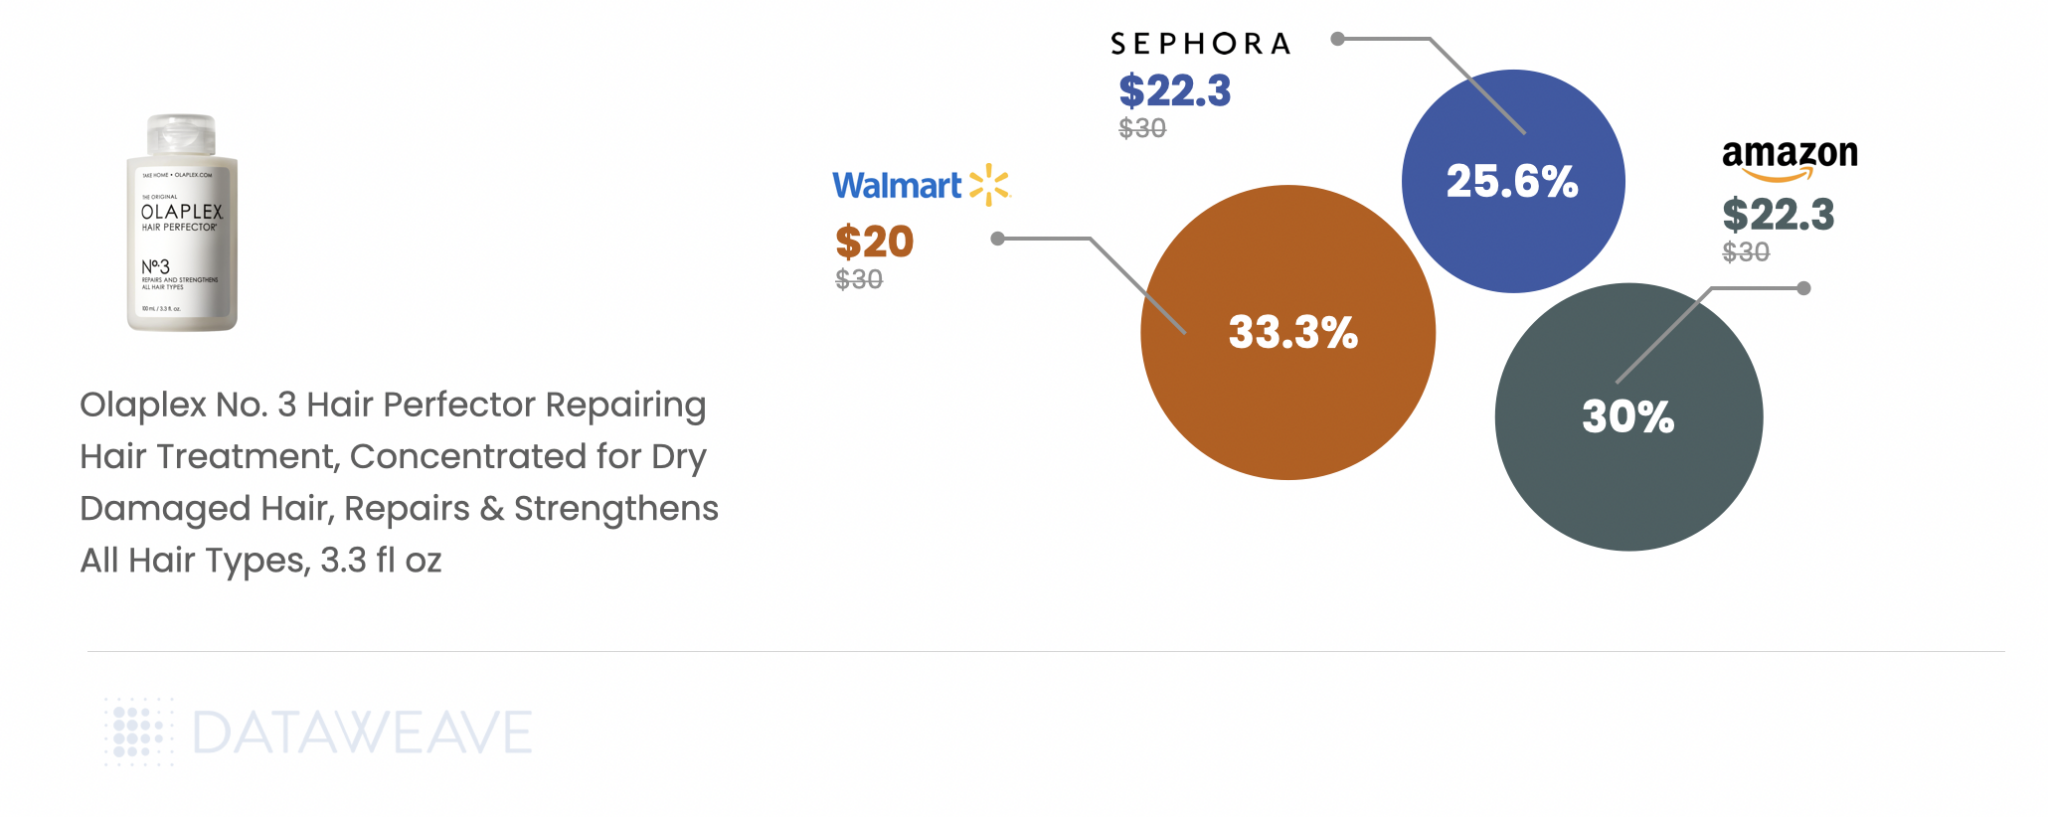
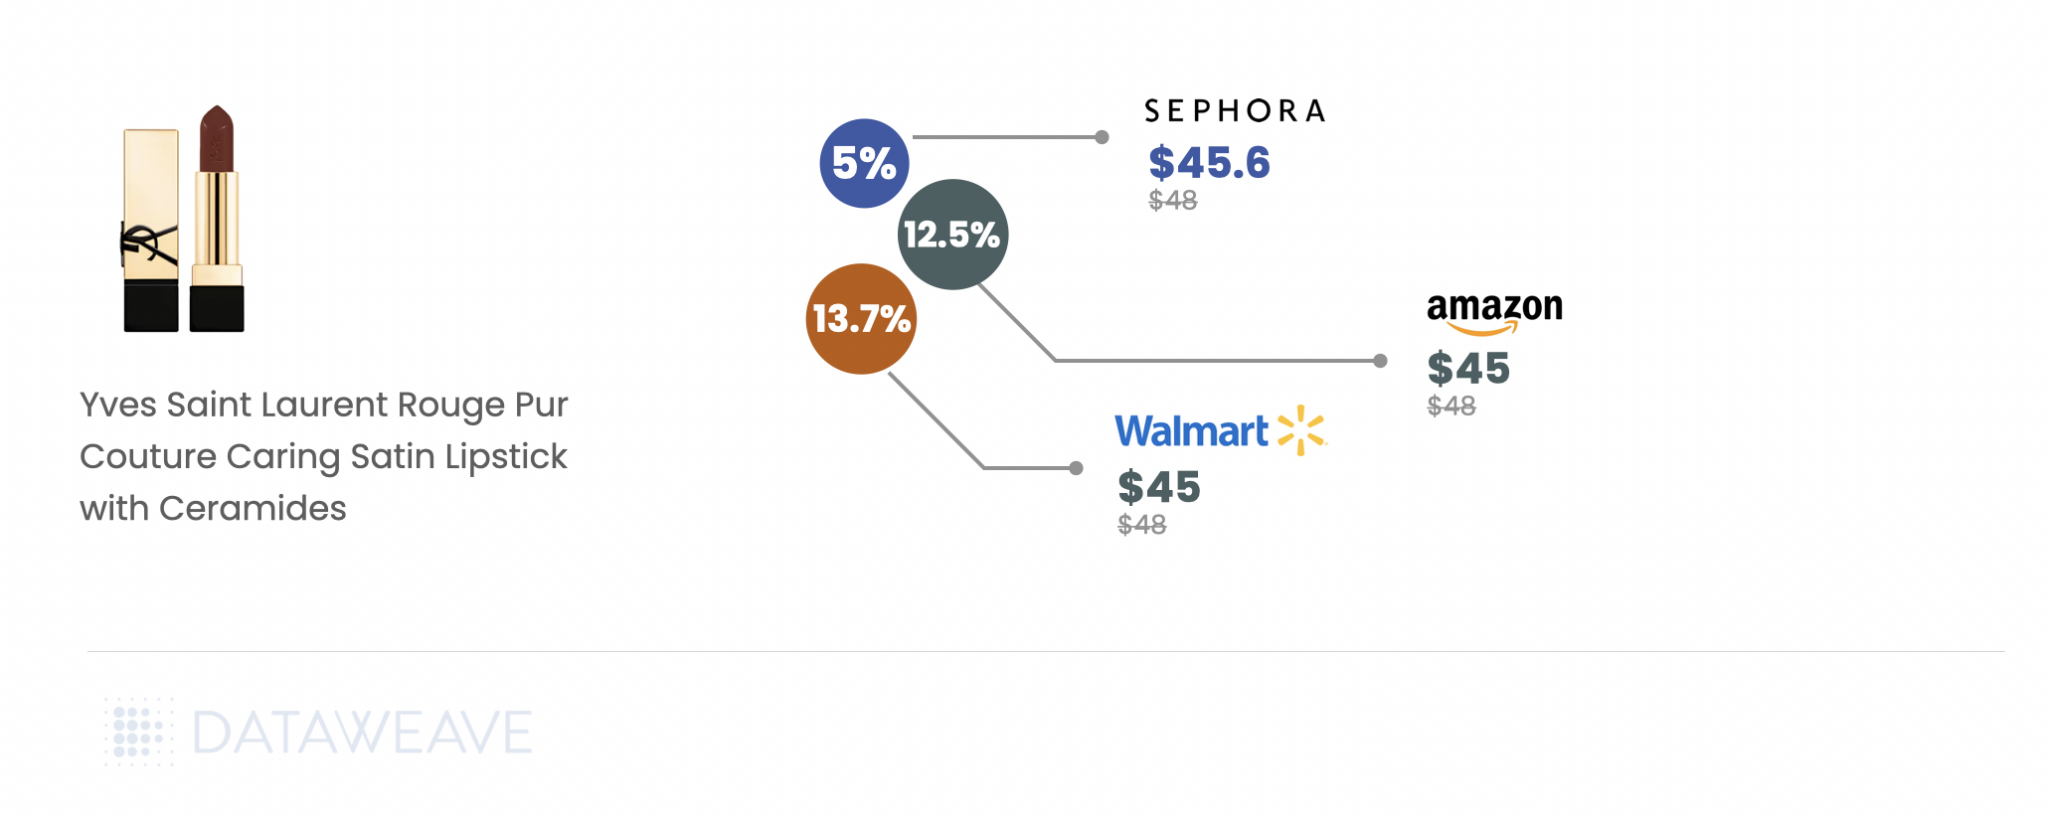
Trending haircare brand Olaplex displays greater disparity, with Walmart leading with a 33.33% discount, surpassing Amazon and Sephora. Luxury brand, Yves Saint Laurent’s Satin Lipstick is one of the highest discounted items across retailers.
Looking Ahead
Our analysis suggests that while some early deals offer genuine value, particularly in premium beauty and high-end electronics, many retailers might be holding their best discounts for Black Friday.
For shoppers, the key is being selective: jump on premium brand discounts now (since they’re likely to remain the same though the weekend), but wait on mid-range electronics and home goods where better deals are likely to emerge on Black Friday or Cyber Monday.
For retailers, the imperative is clear: dynamic pricing intelligence is crucial for maintaining a competitive edge while protecting margins. Competitive insights will be critical as the holiday season progresses to balance market share against profitability.
Stay tuned for our Black Friday Cyber Monday analysis next week, where we’ll track how these early discounts compare to the main event’s deals!