Brands are investing millions of dollars in digital retail media to make their products stand out amid unrelenting competition.
The ad spend on digital retail media worldwide was estimated at USD 114.4 billion in 2022, and the current projections indicate that it will grow to USD 176 billion by 2028. This amounts to a 54% increase in just six years.
The current surge in digital retail media advertising has led brands to find an effective way to monitor the efficacy of their ad spend. While Share of Search has long been used to measure brand visibility effectively, the metrics often missed tracking ads on retail sites.
DataWeave’s Share of Media solution helps solve this problem.
What is the Share of Media?
At DataWeave, Share of Media is a metric used to measure a brand’s presence in sponsored listings and banner ads on eCommerce platforms. It captures how often a brand appears in paid promotions compared to competitors, offering insights into advertising visibility and effectiveness.
These days most marketplaces seamlessly blend banner ads and sponsored listings into organic search results. Let’s take a closer look.
Banner Advertising
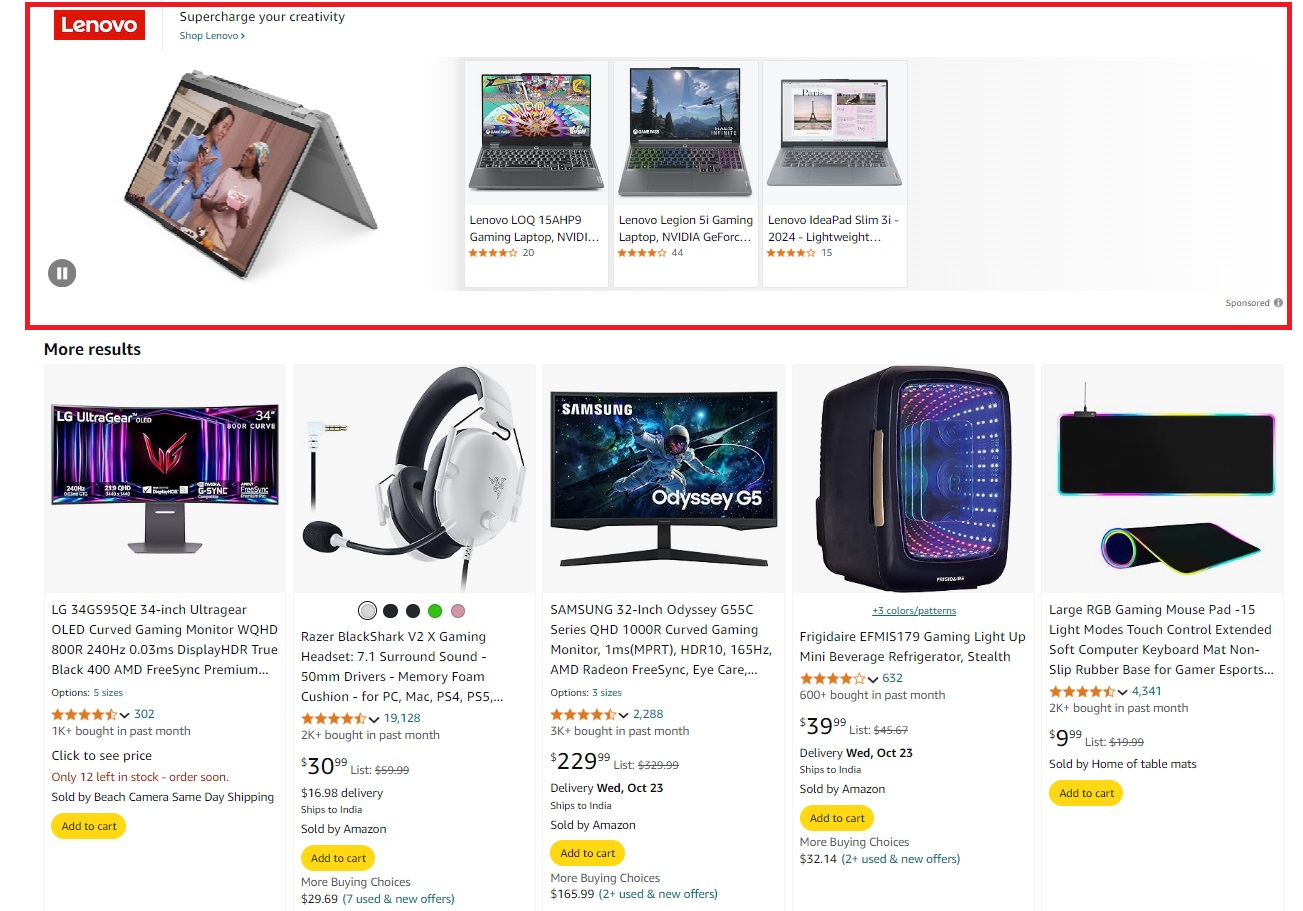
Banner advertising strategically places creative banners across websites—often at the top, bottom, or sides. Some eCommerce platforms also integrate these banners into product search listings.
What makes banner ads so special is the unique ability to allow marketers to use various types of media in a single ad, such as images, auto-play videos, and animations. Brands can also present curated collections of products. This flexibility provides marketers with creative opportunities to differentiate from competitors, capture customer interest, and encourage conversions.
Sponsored Listings
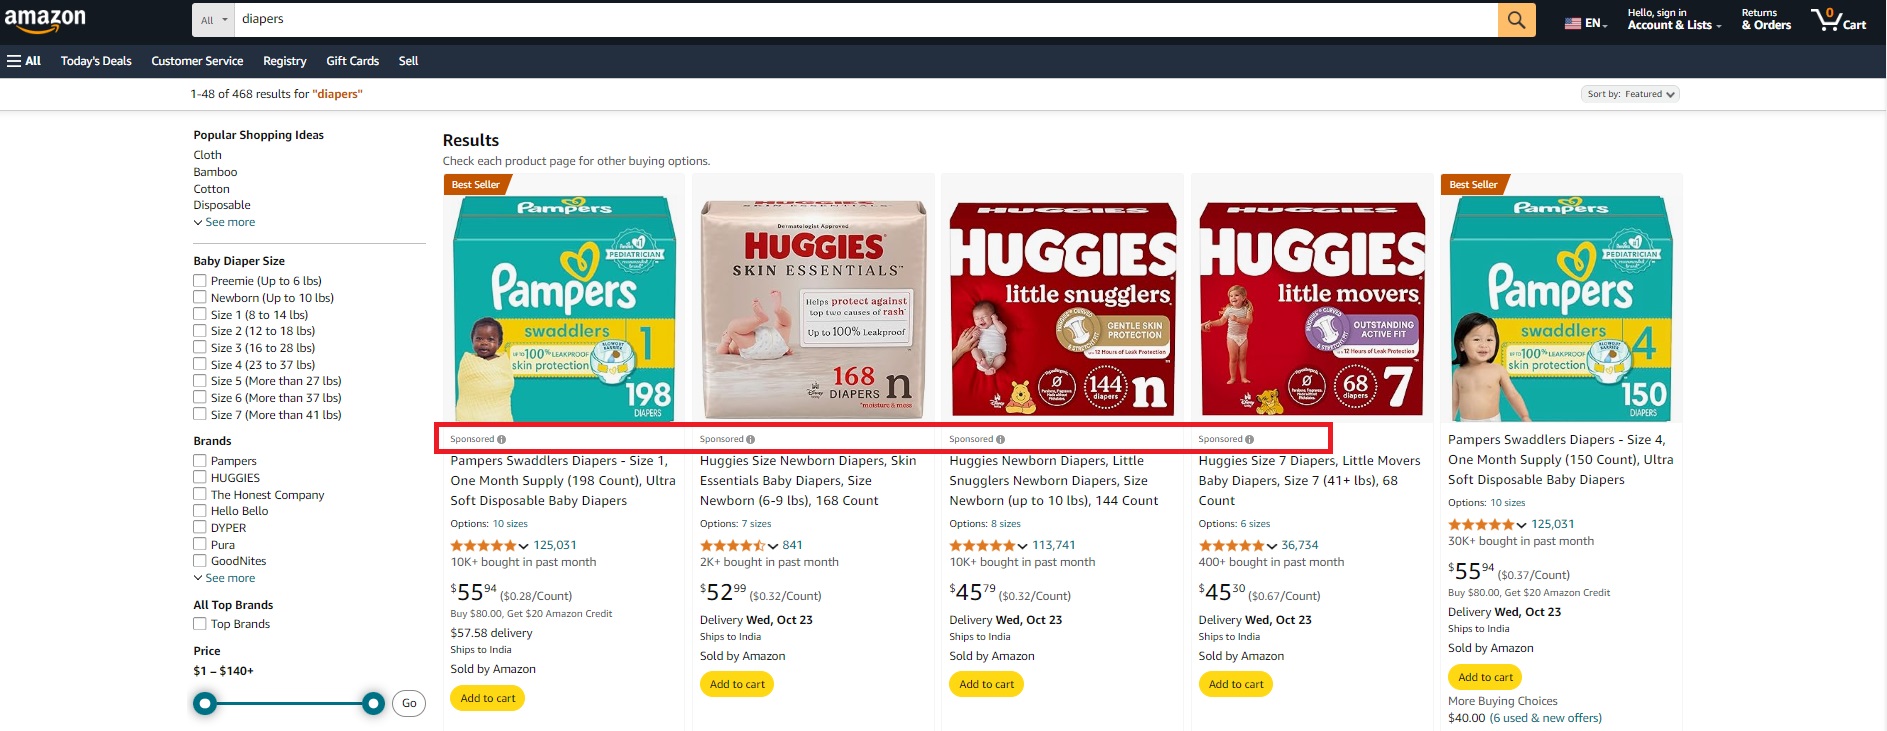
Sponsored listings are paid placements within search engine results or eCommerce platforms. They are usually marked as ‘sponsored’ or ‘ad,’ and they often appear at the top of search results and alongside organic product listing results.
Unlike organic search results, sponsored listings are prioritized based on the advertiser’s bid amount and relevance to users’ search queries.
Sponsored listings offer a strategic advantage by enabling businesses to connect directly with consumers who are actively searching for their products. This targeted approach ensures that marketing efforts are focused on individuals with high intent of making a purchase, maximizing the potential return on investment.
The Power of Banner Ads and Sponsored Listings
Banner ads and sponsored listings are great choices for boosting customer engagement and product sales. Here are four key advantages they offer:
Enhanced Visibility: Digital retail media strategically places your brand where it will stand out—outshining competitors and grabbing the attention of high-purchase-intent consumers.
Precision in Reach: These ads target specific keywords or categories, allowing for highly focused advertising based on demographics and search intent.
Minimal Conversion Friction: Smooth transitions from ads to a brand’s native store or product listing on the marketplace keep conversion friction to a minimum.
Brand Awareness and Recall: Consistent exposure to your brand through banner ads and sponsored product listings can leave lasting impressions and build brand recognition.
The bottom line is that it’s increasingly important for brands to monitor their Share of Media.
How to Monitor Your Brand’s Share of Media
DataWeave’s Digital Shelf Analytics (DSA) platform extends beyond the traditional Share of Search metrics and provides robust support for monitoring the Share of Media.
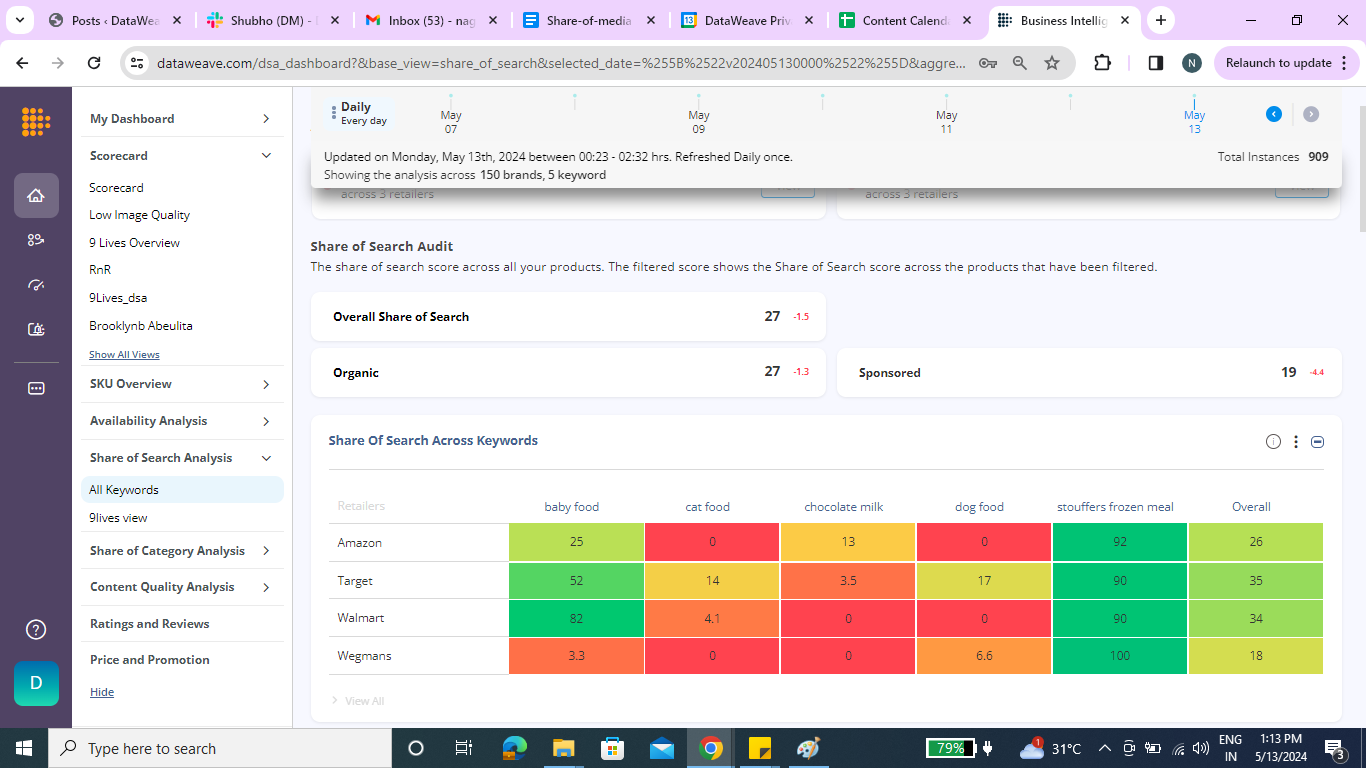
DataWeave monitors the Share of Media in two ways: keywords and product categories. Users can view Share of Media insights through aggregated views, trend charts, and detailed tables. The views are designed to show brand visibility and the overall competitive landscape. For example, the screenshot below, taken from DataWeave’s dashboard, showcases the Share of Media across keywords, categories, and retailers.
Share of Media by Keyword
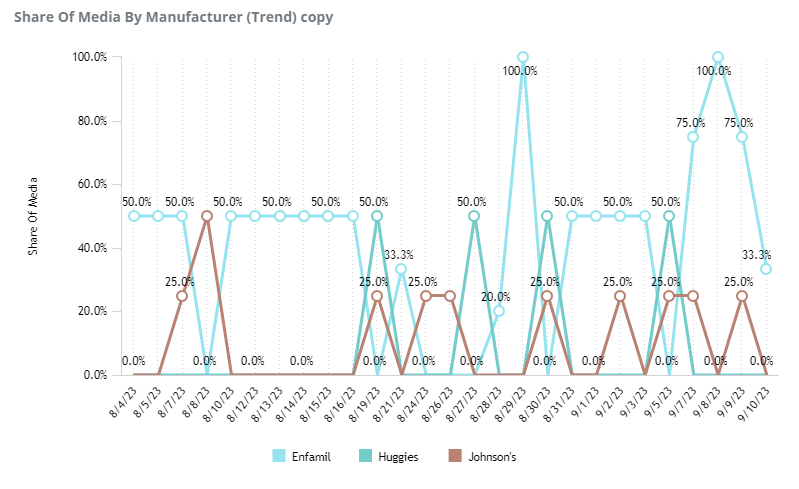
The Share of Media metric captures a brand’s advertising presence within search listings for a designated keyword. This provides a comprehensive view of a brand’s visibility and promotional efforts across retail platforms, helping brands validate and gauge the effectiveness of their ad spend.
For example, the screenshot below shows the trend of manufacturer’s Share of Media by keyword—‘baby food.’
Share of Media by Category
The Share of Media metric measures the presence of brands’ banner ads and sponsored listings across product categories on retail sites. This helps brands see which product categories require more investment, making it easier for them to spend their ad budget wisely.
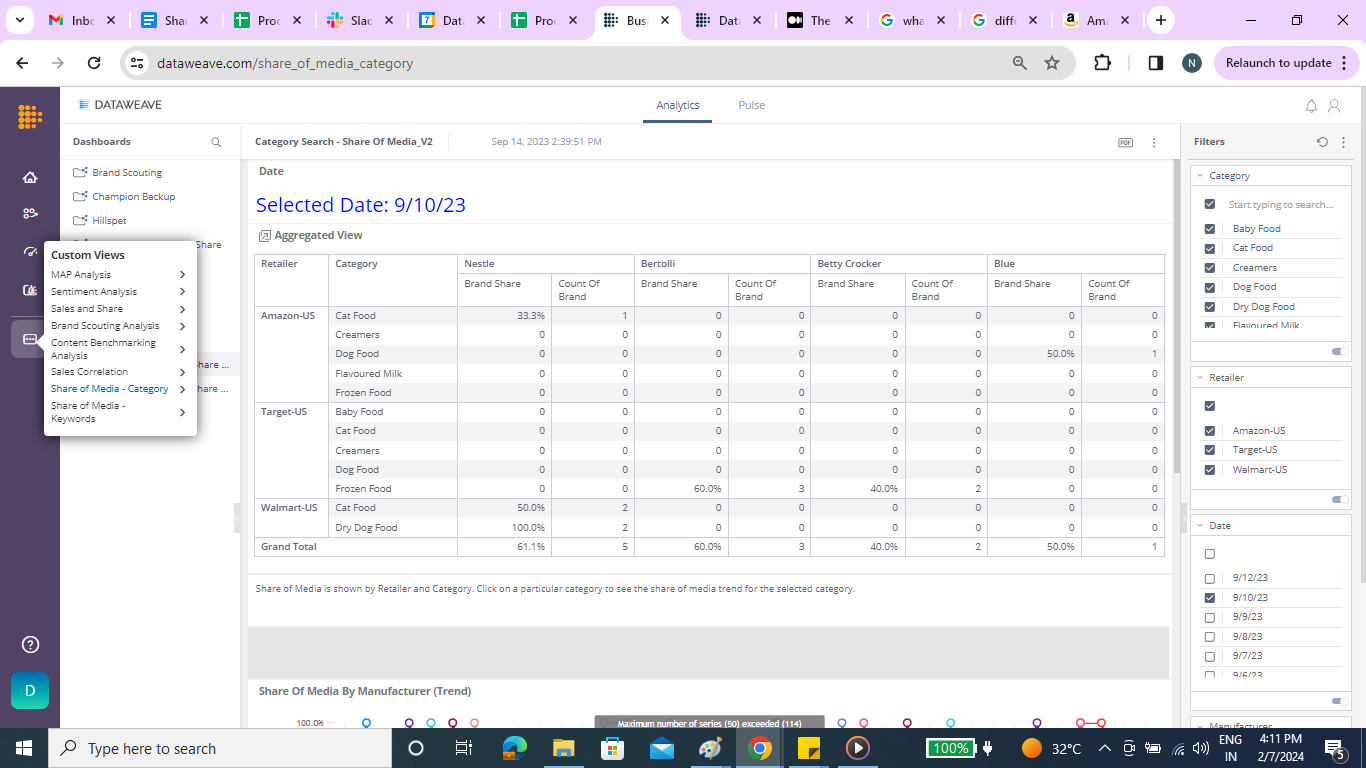
The screenshot below illustrates manufacturers’ Share of Media by category across retailers.
Share of Media: An Essential Ecommerce Metric
As retail media continues to evolve, our analytics must follow—after all, knowledge is a competitive advantage. In the dynamic world of eCommerce, where competition is fierce and consumer attention is scarce, understanding your share of media is crucial.
Analyzing the Share of Media can give brands a competitive edge. By regularly monitoring and analyzing this metric, you can make data-driven decisions to improve your brand’s visibility, attract more customers, and ultimately drive sales growth. With a deeper understanding of their target audience and market dynamics, brands can refine promotional efforts to drive more effective results and optimize return on ad spend (ROAS).
For more information on how Digital Shelf Analytics can enhance your brand’s digital shelf presence, request a demo or contact us at contact@dataweave.com.
Our world is increasingly going online. We work online, socialize online, and shop online every day. As a consumer brand, you need to ensure complete awareness of your brand’s online presence across eCommerce platforms, search engines, and media.
Only by deeply understanding the customer journey can you ensure that your product is reaching your ideal customers and maximizing your brand’s market share. You need data to intrinsically understand your customer journey and make changes where you’re lacking.
As the old adage goes: ‘You can’t manage what you don’t measure.’
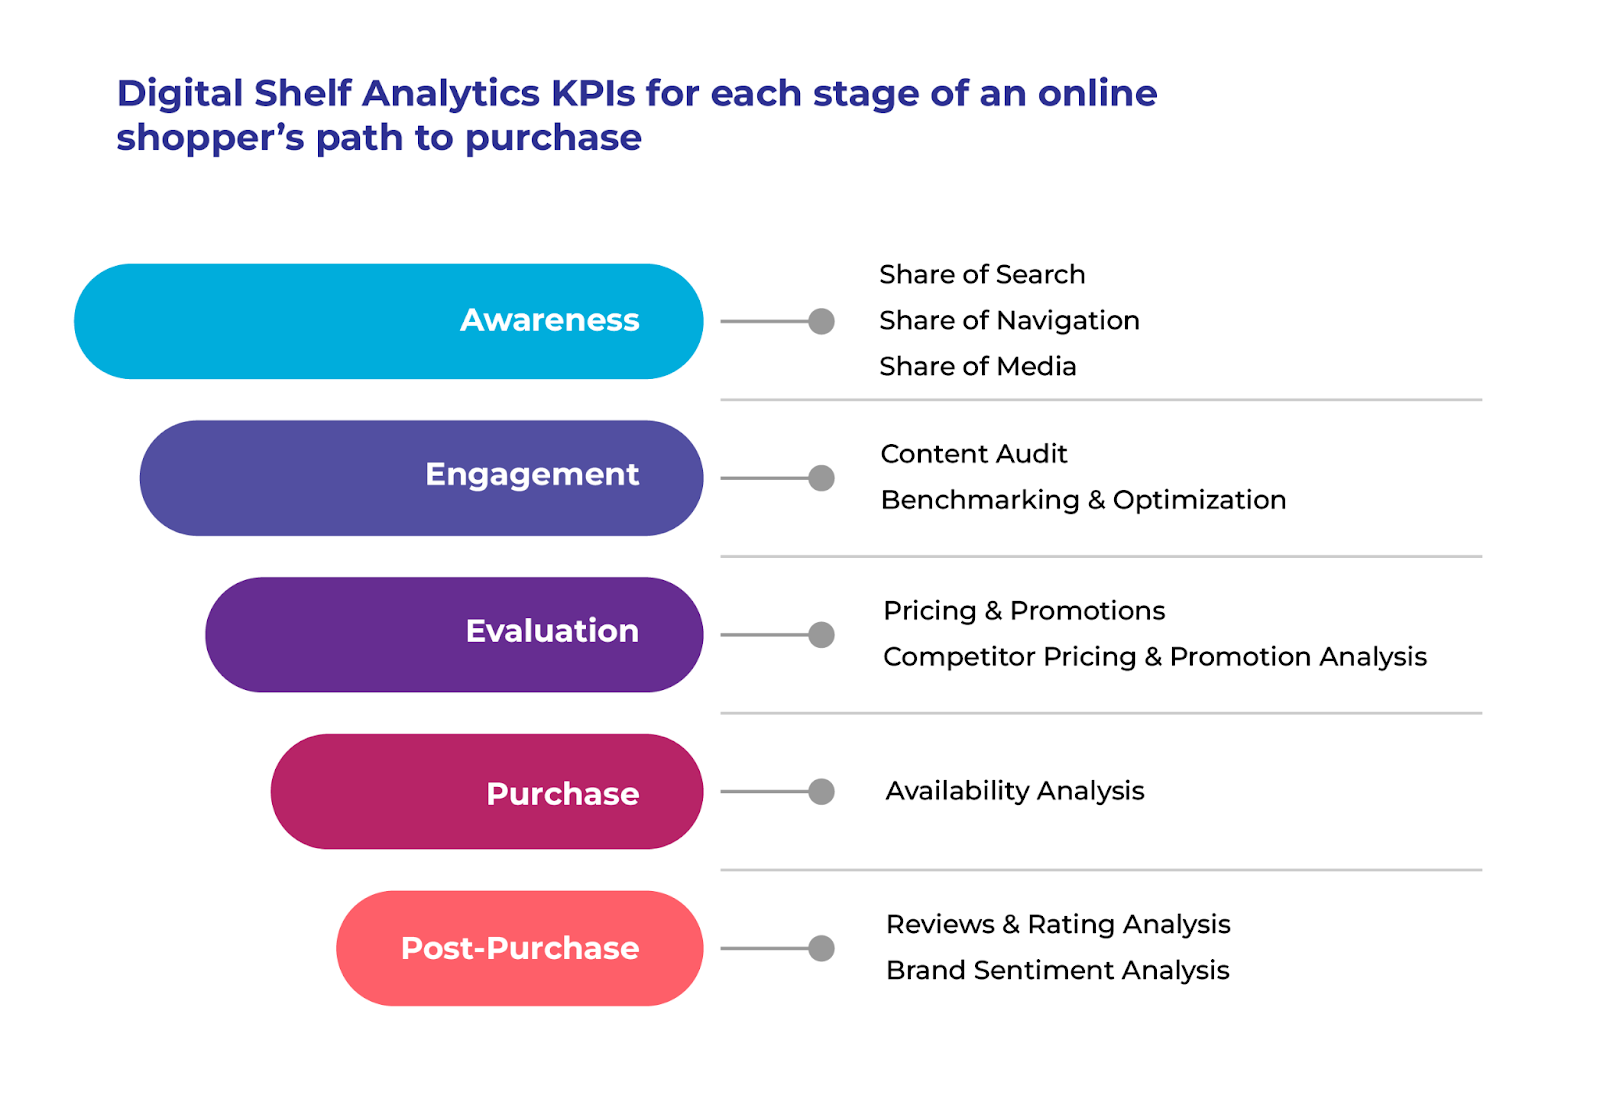
You need digital shelf metrics to measure and start benchmarking your buyer’s journey. To find several of these types of key performance indicators (KPIs), you need a digital shelf analytics solution. These platforms allow you to track various metrics along the path to purchase from the awareness stage to the post-purchase phase across the entire internet, helping to inform online and offline sales strategies.
Digital shelf analytics will help you gain insights into how your brand is doing versus the competition, which areas are lagging behind in historical performance, and what activities are driving sales. There are innumerable ways in which you can leverage these valuable insights. But how do you know which KPIs to start tracking with your digital shelf analytics solution?
Here, we’ve summarized the top metric types your peers report, track and base their decisions on.
With these KPIs in hand, consumer brands like yours can ensure that their products are consistently visible and appealing to their target audience across online marketplaces, ultimately enhancing conversion rates, market share, and profitability.
Read this guide to learn more about the top digital shelf metrics consumer brands are tracking and how to use them in your own strategy.
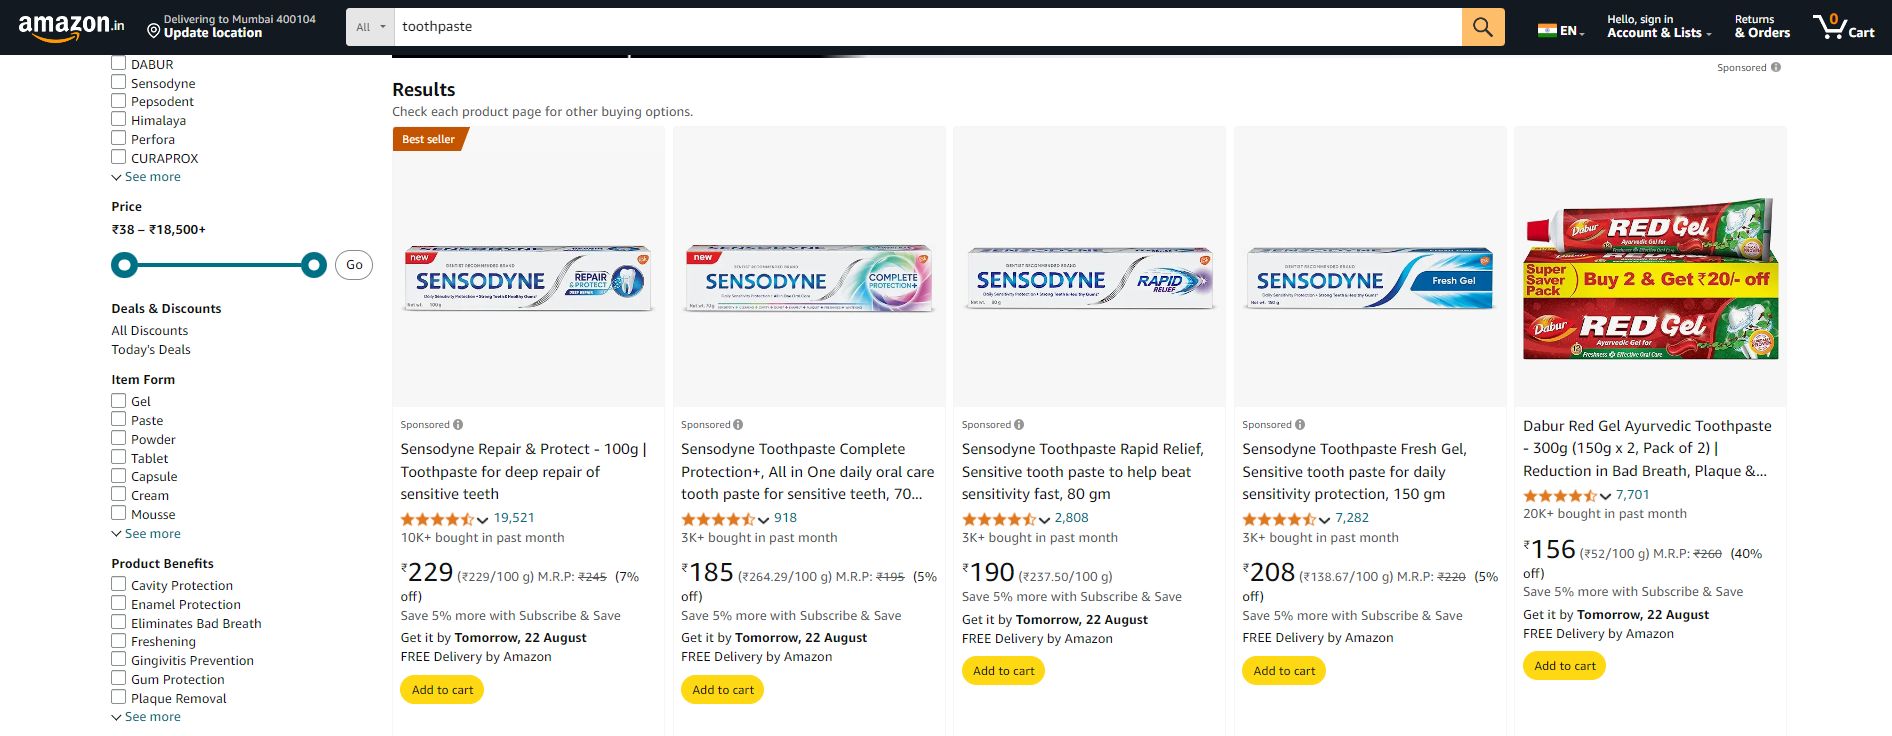
1. Share of Search
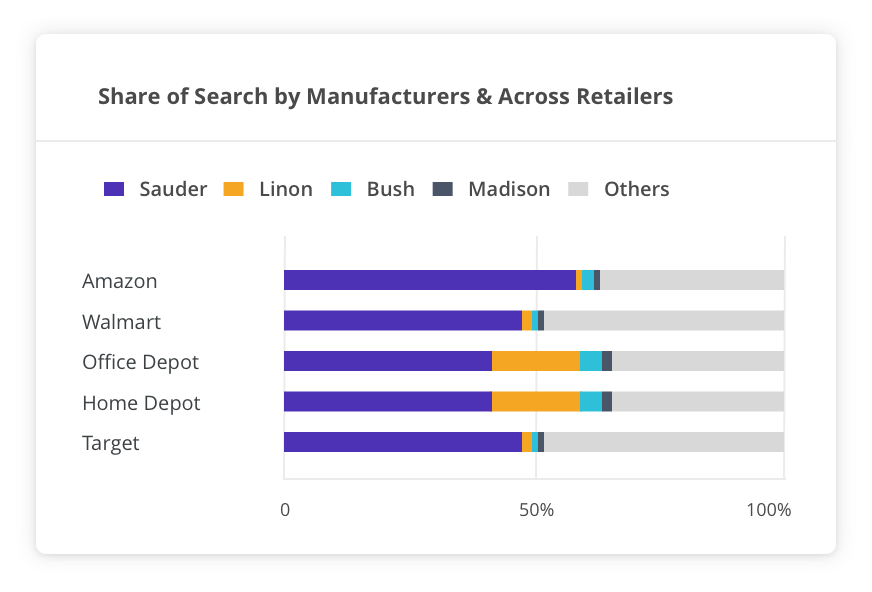
Share of Search (SoS) is a KPI in digital shelf analytics that measures how frequently a consumer brand’s products appear in search results on eCommerce platforms relative to the competition for specific keywords. A good digital shelf analytics solution will be able to show this metric across all the top marketplaces and retailers, such as Amazon and Walmart, but also more niche marketplaces for industry-specific selling.
This metric provides brands with a quantifiable way to measure how frequently their products are being “served up” to customers on online marketplaces. Essentially, it measures visibility and discoverability.
With Share of Search on DataWeave, you can slice and dice your data in innumerable ways. These are a few important views you can see:
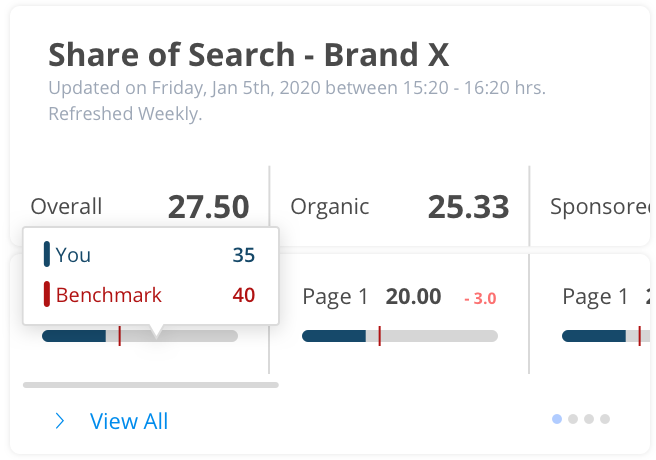
Aggregated SoS
Organic and Sponsored SoS scores
SoS scores across brands, retailers, keywords, cities
Historical SoS score trends
Once you have benchmarked your SoS and category presence relative to your competition, you need to start interpreting the data. Here are some questions you can ask yourself to help interpret your findings:
Which of my key categories have the lowest SoS score?
Which products feature low on search results because they are out of stock?
Are my competitors’ products faring better due to sponsored searches?
Is my SoS low due to poor content quality?
With insights in hand, you will know which actions to take to drive the biggest impact. For example, you could increase sponsored search results or improve organic reach by optimizing product pages.
Understanding your SoS is essential to maximizing the awareness phase of your customer journey. It will help you improve your brand visibility and increase product conversions through better search and category presence.
2. Share of Media
Share of Media (SoM) is a KPI that is just as impactful, if not more so, than the SoS metric. However, only a limited number of brands track it or use it to drive strategic action. This makes it a perfect opportunity for brands looking to get an edge on the competition.
But what is SoM in digital shelf analytics? Essentially, it’s a way of measuring retail media advertising activities like brand-sponsored banners, listings, videos, ads, and promotions that sometimes blend into search results. The main types of retail media advertising exist in two categories: banner advertising and sponsored listings.
Banner advertising involves strategically placing designed banners within websites and search listings. These banners raise brand awareness and drive traffic to online storefronts.
Sponsored listings are paid placements within search results on search engines or eCommerce platforms. They are prioritized based on the total bid amount and the product’s relevance. These paid listings are marked with “sponsored” or “ad.”
These listings serve to enhance your brand’s overall visibility, help you gain more precise reach, increase conversions, and drive better brand awareness and recall with your customers.
These efforts aren’t free, however, so measuring their effectiveness is critical not only to gain all the listed benefits but to also not waste your valuable marketing budget. The SoM KPI can help a consumer brand answer questions like:
Where are the opportunities to increase paid ads?
Which categories could benefit from a promotional boost or a strategic and streamlined allocation of ad spend?
Which of my competitors have active banners and what is their share of media by keyword?
How has my ad spend trended historically in comparison to my competitor?
DataWeave’s digital shelf analytics (DSA) is among the first providers to offer Share of Media KPI tracking and analysis. This is because it requires advanced, multi-modal AI to gather, view, and aggregate listings that encompass text, images, and video. With Share of Media tracking facilitated by DataWeave, consumer brands can track and analyze the effectiveness of their own promotional investments as well as those of their competitors.
3. Content Quality
The content quality metric measures how well your product content adheres to the retailer’s specific guidelines, which are in place to steer traffic and sales on their sites.
With the help of a DSA platform’s AI and ML capabilities, you can measure different elements of your product detail pages (PDPs), such as titles, descriptions, images, videos, and even customer reviews. You need to know which elements are missing, where they are missing, and which ones are negatively affecting sales so you can take corrective action.
Did you know that the average cart abandonment rate is 69.99%? The quality of your content can significantly impact this number. Ensuring that your content is high-quality will help influence product discoverability, customer engagement, and conversion rates. It will also help position you ahead of the competition. If your content quality is poor, you may find yourself with lower search rankings, a higher return rate, and more abandoned carts.
Here are some questions you can answer with the help of the content quality digital shelf metric:
Is my product content at a retail site exactly what was syndicated?
Are there any retailer initiated changes to my product content?
Are my product content updates reflected on the retailer platforms?
How well does my product content comply with the retailer guidelines?
How do I optimize my product content for enhanced discoverability and conversion?
DataWeave’s content quality digital shelf analysis helps consumer brands ensure that product content on eCommerce platforms is high-quality and benchmark their product listings against the competition. It does this through a combination of AI-driven quality analysis and by presenting brands with actionable recommendations. These optimized suggestions are based on the top-performing products so you can focus your valuable time on the areas that will drive the biggest impact.
4. Pricing & Promotions
Your customers can easily shop around to find the best price for the product you’re selling. If your competitor is selling it cheaper, you’ll lose that sale.
That’s why it’s essential to understand the pricing and promotional landscape for each of your products and categories. This can be a challenge, especially if it’s a common product or comes in multiple pack sizes or variants.
It’s equally important to track pricing and promotions even at individual, physical stores. Doing so will allow you to remain competitive and responsive to local market dynamics by tailoring your pricing strategies based on regional competition. You don’t want your products to be overpriced (lost sales) or underpriced (lost profit) in specific markets.
Harmonizing insights when operating an omnichannel consumer brand is extremely difficult without the aid of a digital shelf analytics solution. Insights need to be aggregated between desktop sites, mobile sites, and mobile applications, as well as from physical storefronts.
Questions you can answer with the help of the pricing & promotions digital shelf metric include:
How do my product prices and promotions compare to my competitors?
How consistent is my product pricing across retail websites?
How does my product pricing vary across regions, ZIPs, and stores?
How do price changes influence my sales numbers?
Are there regional differences in pricing and promotion effectiveness?
DataWeave’s digital shelf analytics platform stands out with its sophisticated location-aware capabilities, which enable the aggregation and analysis of localized pricing and promotions. The platform defines locations based on a range of identifiers, such as latitudes and longitudes, regions, states, ZIP codes, or specific store numbers.
The platform can also extract promotional information, such as credit card-based or volume-based promotions. You can see variances across retailers, split by price groups, brands, and competitors. DataWeave specializes in enabling brands to conduct in-depth analyses across a wide array of attributes so you can answer just about any pricing or promotional question you have.
5. Availability
The availability KPI in digital shelf analytics measures the in-stock and availability rates for a brand’s products across eCommerce and physical locations. Similar to the pricing and promotions metric, it relies heavily on location awareness, down to individual stores. Measuring both online availability and offline in-stock rates will help you understand the big picture and take more informed replenishment action.
When you start leveraging the availability KPI with the help of digital shelf analytics, you can improve inventory management, boost product discoverability, increase the frequency with which your online product listings convert, and generally drive more sales. This KPI is essential for ensuring your customers can always find and buy the products they want.
With the availability KPI, you can start answering questions like:
What is my overall in-stock rate?
Which of my products frequently go out of stock?
How does product availability vary across different regions and stores?
What is the impact of availability on my conversion rates?
Are there any seasonal trends in product availability that I need to address?
How quickly are we resolving stockout issues across different locations?
What are my biggest opportunities to reduce stockouts?
DataWeave enables consumer brands to track their product availability metric through automated data collection from various eCommerce platforms in conjunction with physical in-stock rates. The platform provides granular, store-level insights so you can understand regional stock variations and optimize inventory distribution. By tracking historical availability data, you can identify seasonal patterns and predict future demand to pre-empt stockout issues. All of this can be configured with automatic notifications to alert you when there has been a stockout event or when a low stock threshold has been passed, facilitating timely replenishment.
6. Ratings & Reviews
The final KPI in our guide is the ratings & reviews digital shelf metric. Consumers rely heavily on genuine feedback from their peers and refer to star ratings, posted comments, and uploaded pictures to inform their buying decisions. This KPI analyzes the impact of customer feedback and reviews on your products’ performance across eCommerce platforms so you can measure overall brand perception and isolate areas of opportunity.
This metric does something other digital shelf metrics don’t; it can inform your product strategy. It can help you identify repeat complaints that your product team can address with the manufacturer or use for the design of future products.
Some questions you can answer with this powerful KPI include:
What is the overall customer sentiment towards my products based on ratings and reviews?
Which product features are frequently mentioned positively or negatively by customers?
How do my product ratings and reviews compare to those of my competitors?
Are there common issues or complaints that need to be addressed to improve customer satisfaction?
Which products have the highest and lowest ratings, and why?
With DataWeave’s digital ratings and reviews feature, you can keep a pulse on customer sentiment to take short-term action as well as decide long-term strategy. You can leverage reviews to influence product perception, refine products, and enhance overall customer satisfaction.
DataWeave’s Digital Shelf Metrics
Each one of these metrics is interconnected and collectively influences a brand’s success. For instance, improving content quality and earning higher ratings can significantly enhance your product’s visibility in search results, thereby boosting the Share of Search digital shelf metric. By focusing on a comprehensive approach that integrates these metrics, brands can ensure their products are consistently visible, competitively priced, well-reviewed, and readily available.
DataWeave gives consumer brands the means to execute a holistic digital shelf strategy. From a single portal, track and improve digital shelf metrics like Share of Search, Share of Media, Pricing and promotions, Availability, and Ratings and Reviews.
Our solutions help audit and optimize the most critical KPIs that drive sales and market share for brands so you can stay competitive in a dynamic digital landscape and foster long-term customer satisfaction.
Retailers heavily depend on pricing intelligence solutions to consistently achieve and uphold their desired competitive pricing positions in the market. The effectiveness of these solutions, however, hinges on the quality of the underlying data, along with the coverage of product matches across websites.
As a retailer, gaining complete confidence in your pricing intelligence system requires a focus on the trinity of data quality:
Accuracy: Accurate product matching ensures that the right set of competitor product(s) are correctly grouped together along with yours. It ensures that decisions taken by pricing managers to drive competitive pricing and the desired price image are based on reliable apples-to-apples product comparisons.
Freshness: Timely data is paramount in navigating the dynamic market landscape. Up-to-date SKU data from competitors enables retailers to promptly adjust pricing strategies in response to market shifts, competitor promotions, or changes in customer demand.
Product matching coverage: Comprehensive product matching coverage ensures that products are thoroughly matched with similar or identical competitor products. This involves accurately matching variations in size, weight, color, and other attributes. A higher coverage ensures that retailers seize all available opportunities for price improvement at any given time, directly impacting revenues and margins.
However, the reality is that untimely data and incomplete product matches have been persistent challenges for pricing teams, compromising their pricing actions. Inaccurate or incomplete data can lead to suboptimal decisions, missed opportunities, and reduced competitiveness in the market.
What’s worse than poor-quality data? Poor-quality data masquerading as accurate data.
In many instances, retailers face a significant challenge in obtaining comprehensive visibility into crucial data quality parameters. If they suspect the data quality of their provider is not up to the mark, they are often compelled to manually request reports from their provider to investigate further. This lack of transparency not only hampers their pricing operations but also impedes the troubleshooting process and decision-making, slowing down crucial aspects of their business.
We’ve heard about this problem from dozens of our retail customers for a while. Now, we’ve solved it.
DataWeave’s Data Statistics and SKU Management Capability Enhances Data Transparency
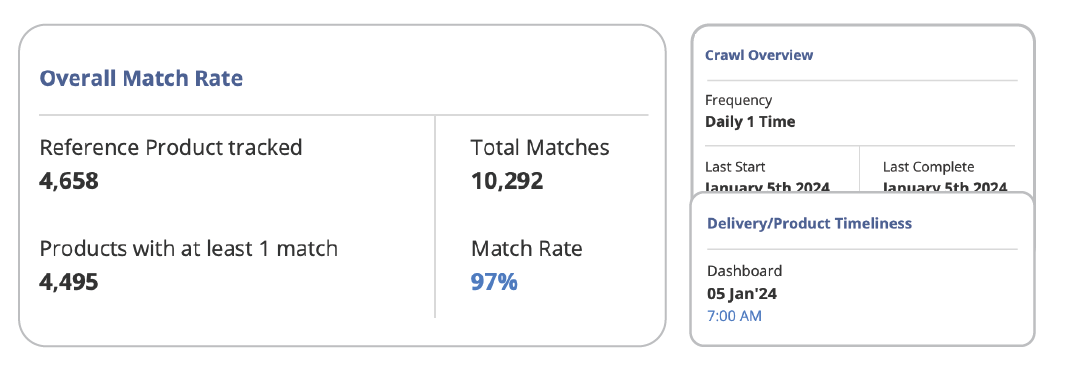
DataWeave’s Data Statistics Dashboard, offered as part of our Pricing Intelligence solution, enables pricing teams to gain unparalleled visibility into their product matches, SKU data freshness, and accuracy.
It enables retailers to autonomously assess and manage SKU data quality and product matches independently—a crucial aspect of ensuring the best outcomes in the dynamic landscape of eCommerce.
Beyond providing transparency and visibility into data quality and product matches, the dashboard facilitates proactive data quality management. Users can flag incorrect matches and address various data quality issues, ensuring a proactive approach to maintaining the highest standards.
Retailers can benefit in several ways with this dashboard, as listed below.
View Product Match Rates Across Websites
The dashboard helps retailers track match rates to gauge their health. High product match rates signify that pricing teams can move forward in their pricing actions with confidence. Low match rates would be a cause for further investigation, to better understand the underlying challenges, perhaps within a specific category or competitor website.
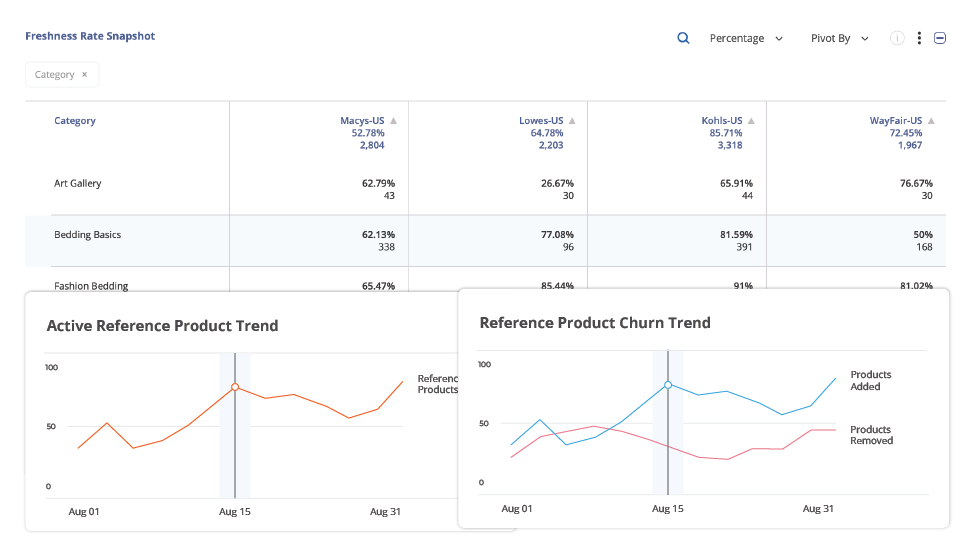
Our dashboard presents both summary statistics on matches and data crawls as well as detailed snapshots and trend charts, providing users with a holistic and detailed perspective of their product matches.
Additionally, the dashboard provides category-wise snapshots of reference products and their matching counterparts across various retailers, allowing users to focus on areas with lower match rates, investigate underlying reasons, and develop strategies for speedy resolution.
Track Data Freshness Easily
The dashboard enables pricing teams to monitor the timeliness of pricing data and assess its recency. In the dynamic realm of eCommerce, having up-to-date data is essential for making impactful pricing decisions. The dashboard’s presentation of freshness rates ensures that pricing teams are armed with the latest product details and pricing information across competitors.
Within the dashboard, users can readily observe the count of products updated with the most recent pricing data. This feature provides insights into any temporary data capture failures that may have led to a decrease in data freshness. Armed with this information, users can adapt their pricing decisions accordingly, taking into consideration these temporary gaps in fresh data. This proactive approach ensures that pricing strategies remain agile and responsive to fluctuations in data quality.
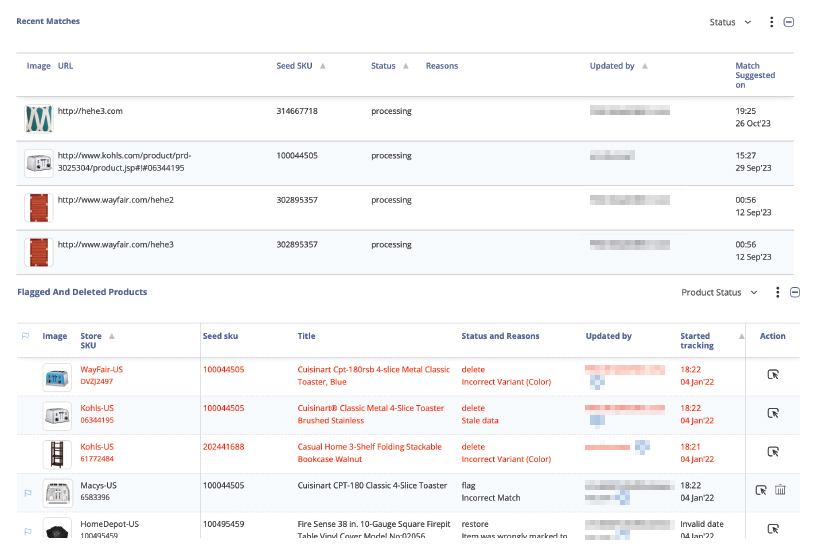
Proactively Manage Product Matches
The dashboard provides users with proactive control over managing product matches within their current bundles via the ‘Data Management’ panel. This functionality empowers users to verify, add, flag, or delete product matches, offering a hands-on approach to refining the matching process. Despite the deployment of robust matching algorithms that achieve industry-leading match rates, occasional instances may arise where specific matches are overlooked or misclassified. In such cases, users play a pivotal role in fine-tuning the matching process to ensure accuracy.
The interface’s flexibility extends to accommodating product variants and enables users to manage product matches based on store location. Additionally, the platform facilitates bulk match uploads, streamlining the process for users to efficiently handle large volumes of matching data. This versatility ensures that users have the tools they need to navigate and customize the matching process according to the nuances of their specific product landscape.
Gain Unparalleled Visibility into your Data Quality
With DataWeave’s Pricing Intelligence, users gain the capability to delve deep into their product data, scrutinize match rates, assess data freshness, and independently manage their product matches. This approach is instrumental in fostering informed and effective decisions, optimizing inventory management, and securing a competitive edge in the dynamic world of online retail.
Inflation, like an invisible force, silently shapes the dynamics of economies, gradually eroding the purchasing power of consumers and leaving its imprint on various industries. High costs, hiring lags, and stagnating earnings pose severe challenges to businesses. One industry segment that intimately feels the impact of inflation is grocery, where price increases can be extremely concerning for the average consumer.
Over the last 12-plus months, the US has experienced a notable rise in inflation, stirring up concerns and influencing the way we shop for everyday essentials. Rising costs of raw materials, transportation, and labor have all played a role in driving up prices. Additionally, disruptions in global supply chains and fluctuations in currency exchange rates have further exacerbated the situation, creating a complex web of interdependencies.
To understand the magnitude of this phenomenon across leading e-retailers, we delved into an in-depth analysis of four major retail giants: Walmart, Amazon, Target, and Kroger.
Each of these retailers possesses a unique business model and competitive strategy, as well as faces unique challenges. This leads to distinct approaches to managing inflationary pressures. Walmart for instance, expects operating income growth to outpace sales growth in 2023. Given the persistence of high prices and the potential for further macro pressures, the retailer is taking a cautious outlook. In 2022, Amazon’s eCommerce business swung to a net loss of $2.7 billion, compared to a profit of $33.4 billion the previous year.
Amid these challenging circumstances, understanding the grocery pricing trends and strategies becomes imperative for retailers, both online and in stores to adapt and thrive in the current economic landscape. By examining their pricing trends, we can gain valuable insights into how these companies navigate the turbulent waters of the grocery industry against the backdrop of inflation.
Our Research Methodology
The data collected for our analysis encompassed a diverse range of products, from pantry staples like flour and rice to perishable goods like dairy and produce – a basket of around 600 SKUs matched across Amazon, Kroger, Target and Walmart, between January 2022 to February 2023.
Further, we separately focused on the prices of a smaller subset of 30+ high-volume daily staples that are likely to yield higher sales and margins for these retailers.
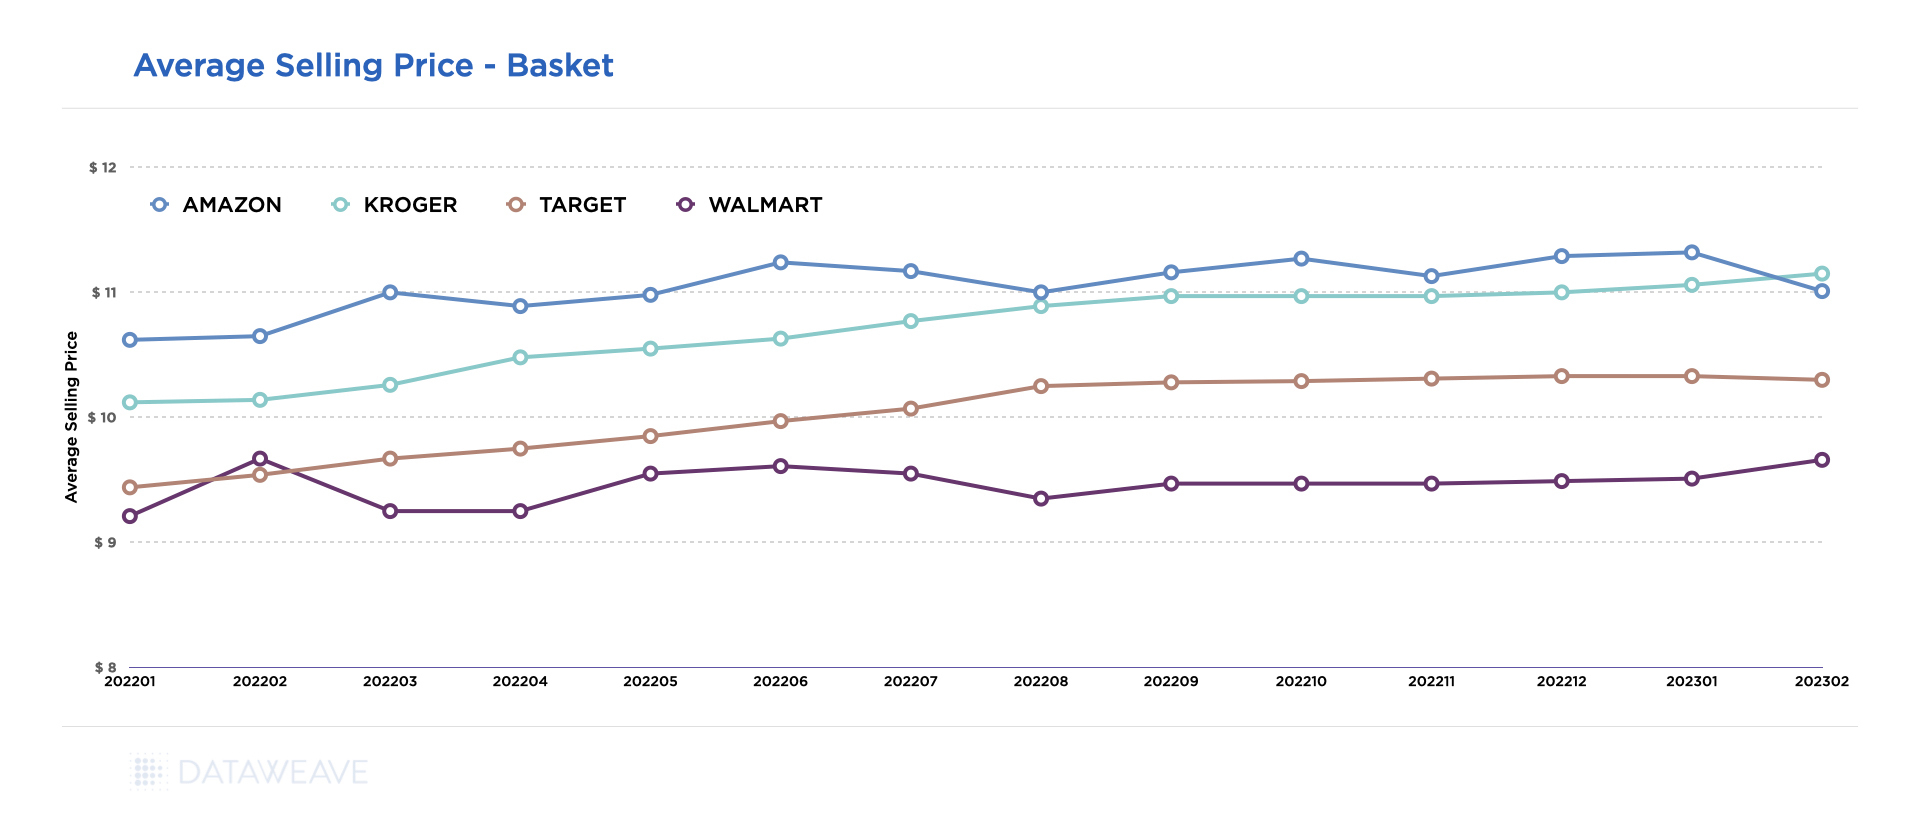
Average Selling Price of a Broad Set of Grocery Items
Our analysis reveals that Walmart consistently offers the lowest prices, with an average of 8% below its closest competitor, Target, despite an annual price increase of about 5%. Walmart seems to prioritize a “stability and predictability” strategy over margin optimization. The retailer’s 8% growth last quarter indicates that this strategy is bearing fruit. However, it’s important to note that this approach may have its drawbacks as Walmart’s margins come under pressure.
Average selling price trend across a basket of 500+ SKUs across Target, Walmart, Kroger, Amazon in the grocery category from Jan ’22 to Feb ’23.
In order to weather inflationary pressures, Walmart may adopt a cautious approach to growth while also focusing on securing margins. Reports suggest that the retailer has been pushing back against consumer packaged goods (CPG) manufacturers following a series of price hikes to counter inflationary cost pressures in early 2023. One of the reasons behind Walmart’s growth and increased sales can be attributed to ‘non-traditional’ higher-income households now seeking deals and discounts at Walmart as their spending power declines.
Interestingly, Amazon emerges as the highest-priced retailer, followed by Kroger, which increased its prices by 10% throughout the year. Consumer perception commonly associates Amazon with the lowest prices, but the data tells a different story. In fact, Amazon has been charging 12% to 18% higher prices than Walmart for groceries and is still maintaining its success.
While the company’s online sales declined by 4%, it saw a significant 9% increase in revenue from third-party seller services, such as warehousing, packaging, and delivery, in 2022. Amazon’s strong logistics and same-day delivery services give it a competitive advantage over other retailers, contributing to its revenue growth and margins. Interestingly, this presents an opportunity for Walmart and other retailers to increase prices while maintaining their strong competitive price positions.
Kroger, on the other hand, seems to be aiming for a premium price perception, consistently raising prices almost every month. Kroger’s pricing strategy appears to be closer to Amazon’s.
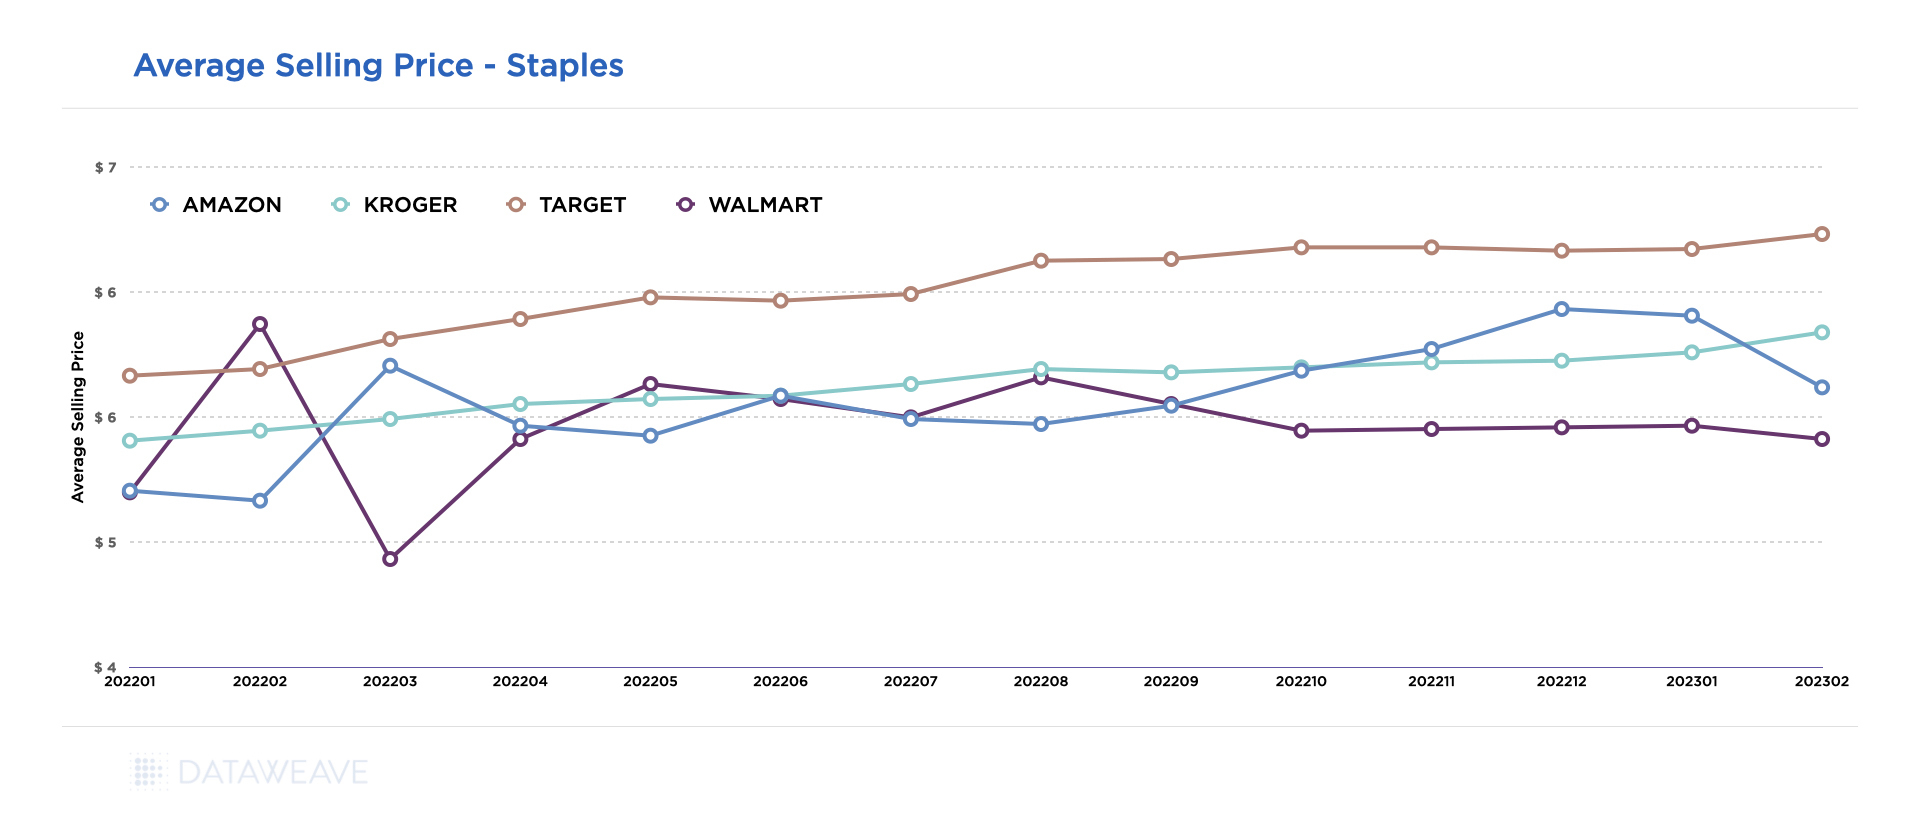
Average Selling Price for High-Volume Daily Staples
Pricing strategies often change for different categories of products. To better understand this, we focused our analysis further on a small subset of 30+ high-volume staples across retailers. These include baked goods, popular beverages, canned food, frozen meals, dairy, cereals, detergents, and other similar items.
Average selling price trend of 30+ high-volume daily staples across Target, Walmart, Kroger, Amazon in the grocery category from Jan ’22 to Feb ’23.
Walmart, possibly overestimating the impact of inflation, has continued to keep its prices the lowest, potentially aiming to increase margins through volume.
The level of price disparity across retailers is expectedly lower here, with Amazon and Kroger closely tracking Walmart’s average prices.
Target’s pricing strategy stands out as it consistently emerges as the highest-priced retailer for daily staples, despite being one of the lower-priced retailers for a broader basket of grocery items. This suggests that Target’s underlying technology may not be as optimized to address market dynamics compared to other leading retailers. In our opinion, Target may want to strengthen its efforts to track pricing more intensely for this sub-category.
A Data-fuelled Approach is the Need of the Hour
In the challenging economic landscape, retailers and grocery stores are under pressure to maintain their revenues and margins. Adopting a comprehensive and dynamic pricing strategy is crucial. Understanding which product categories are experiencing price increases among competitors can help retailers make informed decisions on pricing at both the category and product level.
Retailers should consider their balancing margin performance with consumers’ willingness to pay, rather than implementing broad price increases that may harm customer trust. Price increases can be challenging for both customers and merchants. Retailers who employ a data-driven and insight-based approach are more likely to succeed.
Keep an eye on the DataWeave blog for analysis on pricing, discounting, stock availability, discoverability, and more, across retailers and brands from other industry segments as well.
By 2028, Fortune Business Insights projects that the global bakery products market will reach USD 590 billion. The CAGR (Compounded annual growth rate) for 2021-28 is estimated at 5.12%. Products in this segment include bread, buns, cookies, tortillas, salted snacks, English muffins, bagels, confectionery food, hot dogs, cakes, popcorn, and so on.
Due to disruptions in the global supply chain caused by lockdowns and border closures, the pandemic has had a negative impact on the demand for bakery products and snacks worldwide. However, the market is not only changing, but consumer demand is increasing. Post-pandemic, health, food, and safety have gained renewed attention.
People across the world are making healthier choices with a focus on wellness.
A growing number of people are interested in plant-based foods and beverages, reducing sugar consumption, and understanding the link between lifestyle and health, including obesity and diabetes. As a result of these trends, food producers are reshaping their product strategies to meet new consumer demands.
In this article, we take a look at the ways companies can leverage data to inform their e-commerce strategy.
What’s driving up the demand for bakery products?
More people are choosing easy-to-use bakery products and snacks over other foods due to urbanization, convenience, western diets, and women’s participation in the workforce. Additionally, innovations in baking systems, food technologies, ingredients, formulations, and product ideas are providing customers with a greater level of choice, flexibility, and freedom.
How is e-commerce changing the game for bakery product companies?
To optimize their supply chains, bakery food and snack companies must better understand e-commerce metrics given the wide variety of products available and eventually convert sales. There are several measures that companies need to pay attention to.
Stock availability metrics, discounts across locations, and share of search results – are all critical metrics companies need to track. In addition to providing manufacturers and retailers with an insight into the trends, DataWeave’s tools also allow them to make better business decisions and ultimately improve their bottom line.
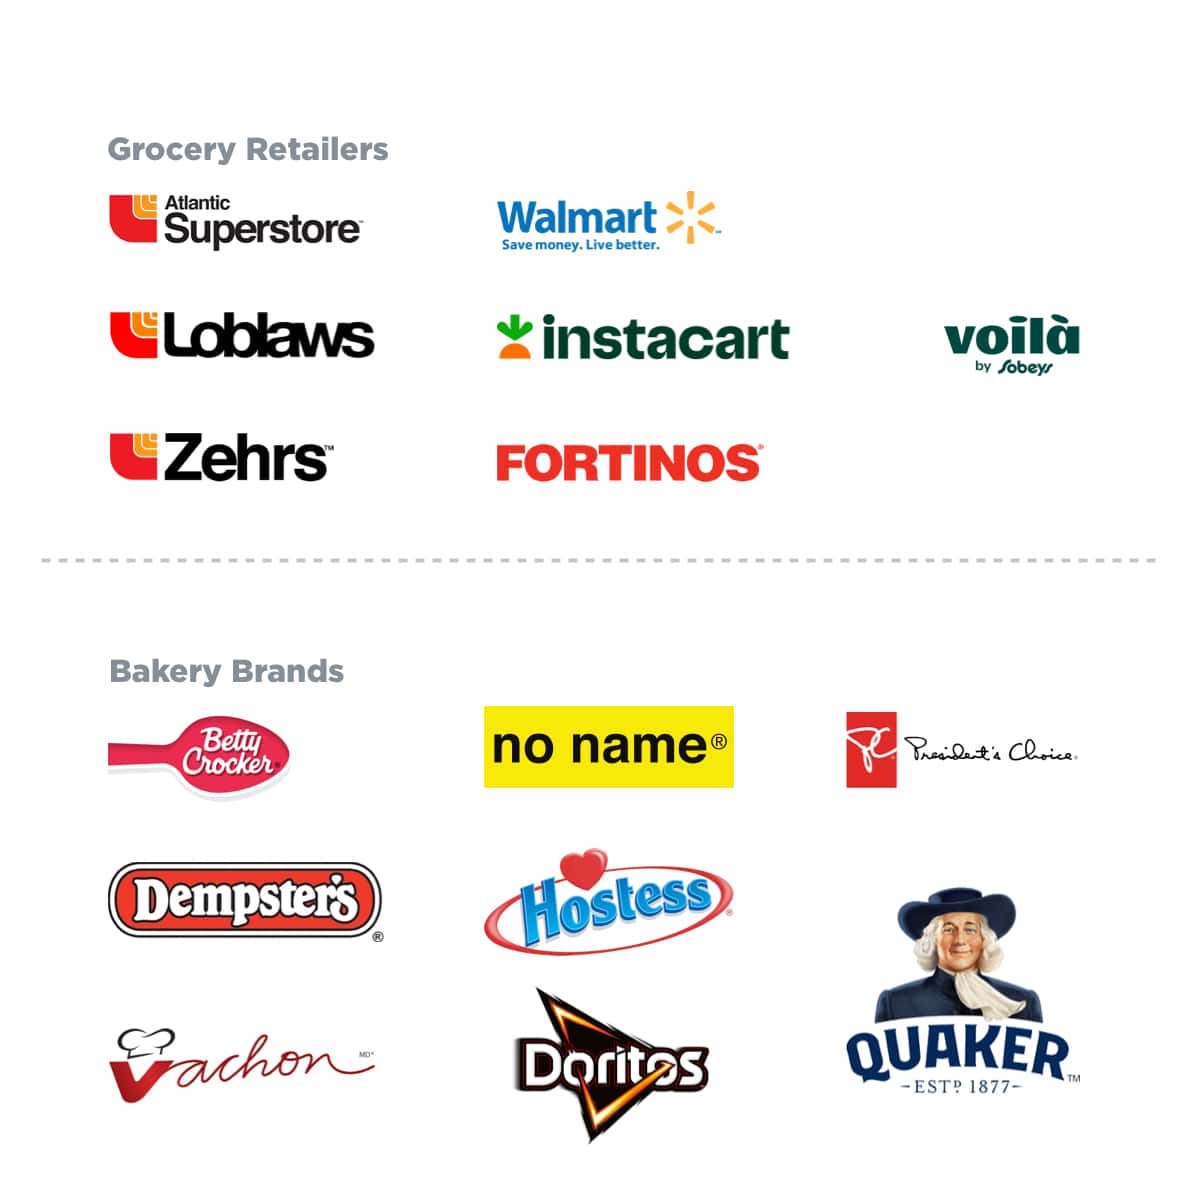
Grocery Retailers and Bakery Brands tracked
Methodology
Data Scrape period: February 2022 to September 2022
Category tracked: Bread and Bakery, Chips, Crackers, Deserts, Snacks.
Share of Search Analysis
Which brands feature the most on e-commerce portals?
When listing items on e-commerce platforms, share of search is crucial. The highest share of the top ten or top twenty items available on these platforms is correlated with how many times the item may be viewed. As a result, it would have a greater chance of being selected by the customer.
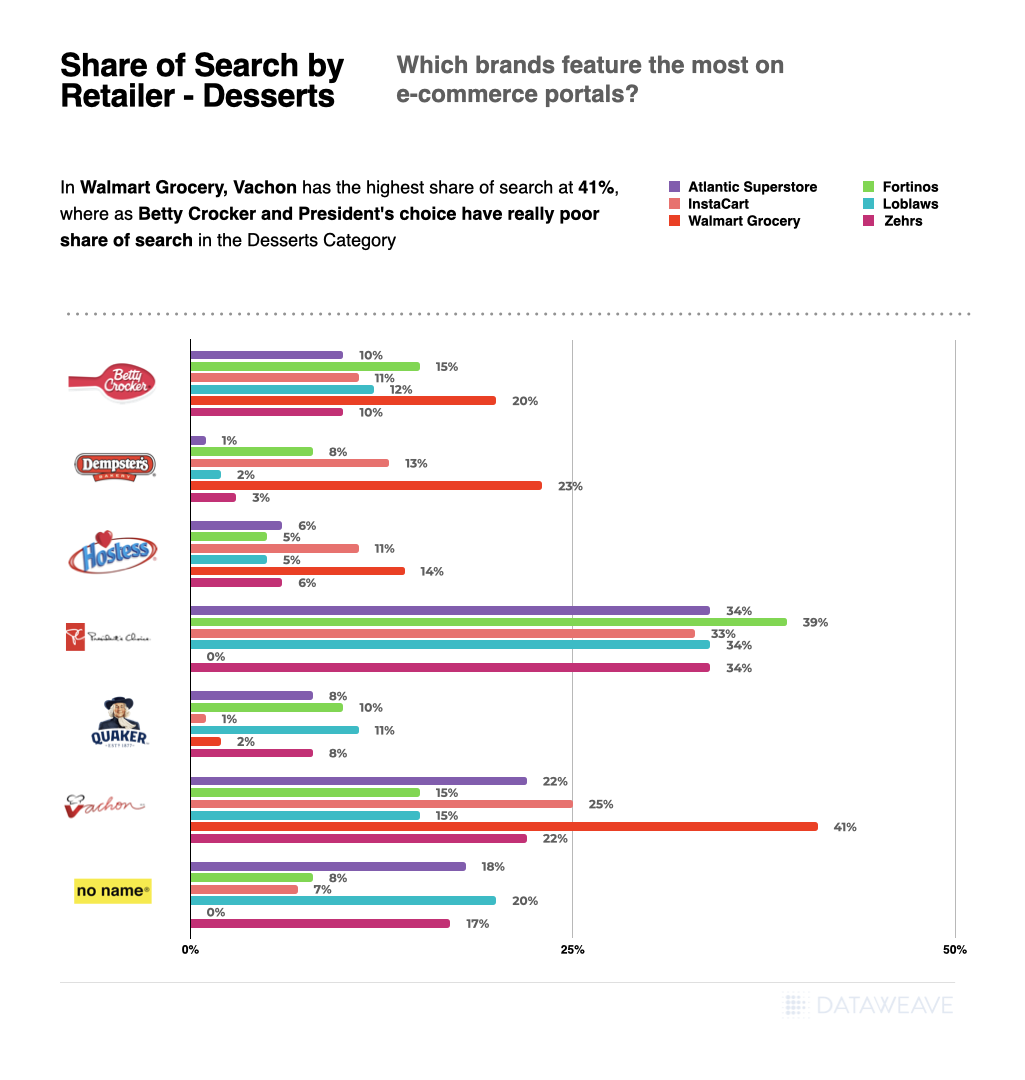
By Retailer for Category “Desserts”
Share of Search for Brands in each retailer
In Walmart Grocery, Vachon has the highest share of search at 41%, whereas Betty Crocker, Presidents Choice and No Name had the lowest share of search at 0%, in the Desserts Category.
In Loblaws, Presidents Choice had the highest share of search of 34%, whereas Dempsters had the lowest share of search of 2% in the Desserts Category.
The brand Presidents Choice consistently ranks high in the share of search results for Desserts across multiple retailers, including Atlantic Superstore, Fortinos, Instacart, Loblaws, and Zehrs – except at two retailers, Voila and Watlmart Grocery, where its share is zero.
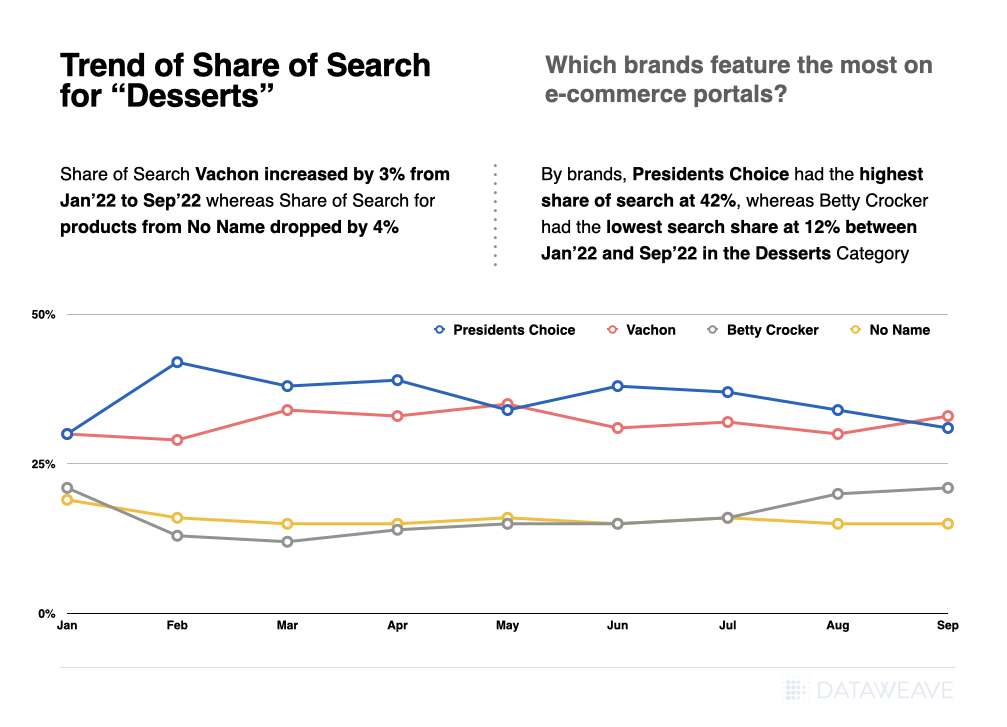
Trend of Share of Search for “Desserts”
Share of Search analysis by Brands over Time in category “Desserts”
Share of search had dropped by around 4% for No Name, whereas for Vachon, it increased by 3% from Jan’-22 to Sep’ 22
By brands, Presidents Choice had the highest share of search at 42%, whereas Betty Crocker had the lowest share of search at 12% between Jan’ 22 and Sep’ 22 in the Desserts Category.
Availability Analysis
Which products are widely available across e-commerce portals?
The availability of the product on the e-commerce portal is one of the key indicators of meeting customer demand. Brands can use insights from DataWeave to strategize how to restock their inventory and ease customer demand. Based on data analysis, brands can also determine which products to prioritize on which platforms.
By Category
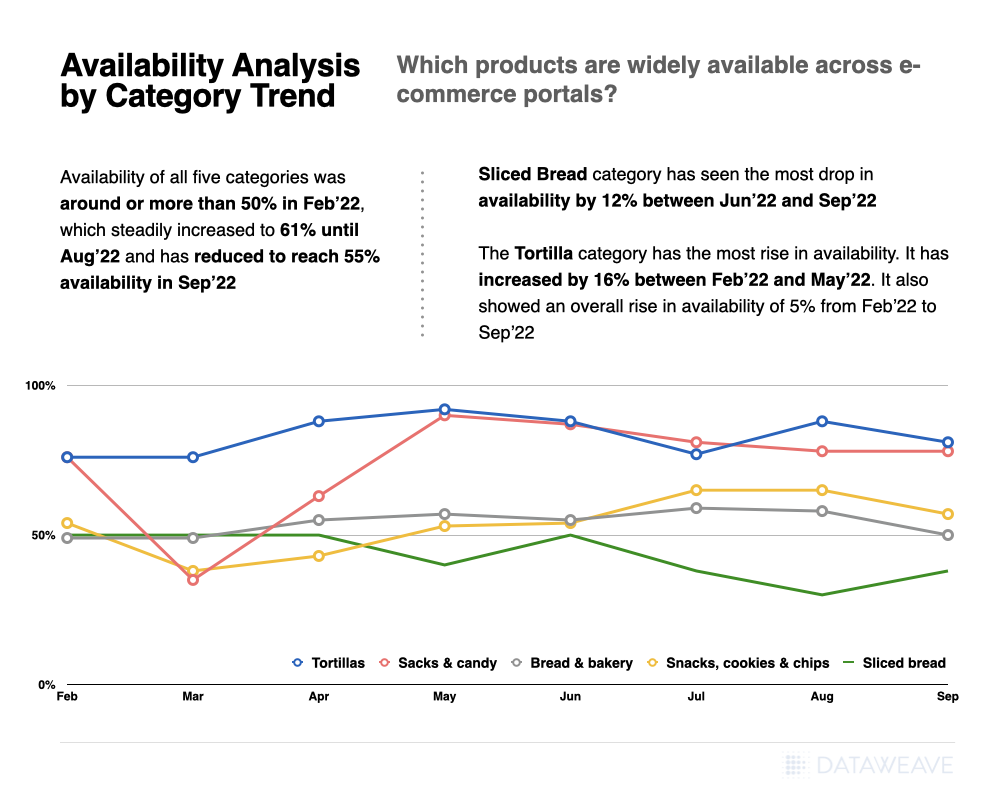
Availability analysis by Category over Time
Availability of all five categories was around 52% in Feb’ 22, which steadily increased to 61% until Aug’ 22 and has reduced to reach 55% availability in Sep’ 22
Sliced Bread category has seen the most drop in availability by 12% between Jun’ 22 and Sep’ 22
The tortilla category has the most rise in availability. It has increased by 16% between Feb-22 and May-22. It also showed an overall rise in availability of 5% from Feb-22 to Sep-22
By Location
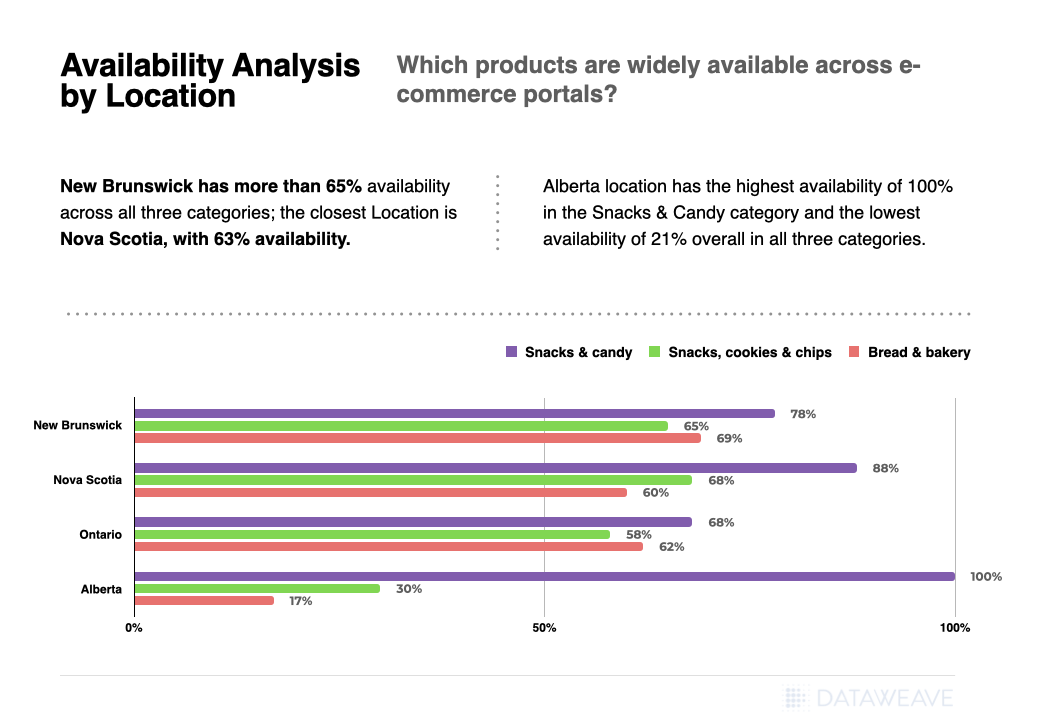
Availability analysis by Location and Category
Across categories, Snacks & Candy had better availability at 73% than Bread & Bakery, with 56% availability.
By Location, New Brunswick had more than 65% availability across all three categories; the closest Location is Nova Scotia, with 63% availability.
Alberta had the highest availability of 100% in the Snacks & Candy category and the lowest availability of 21% overall in all three categories (weighted aggregate)
Discounts Analysis
Several discount-based insights can be studied on e-commerce platforms. From location-based trends, retailer-based trends, and manufacturer-based insights. These insights can help companies make the most of the revenue opportunity while creating an attractive value proposition for the retail consumer.
By Category
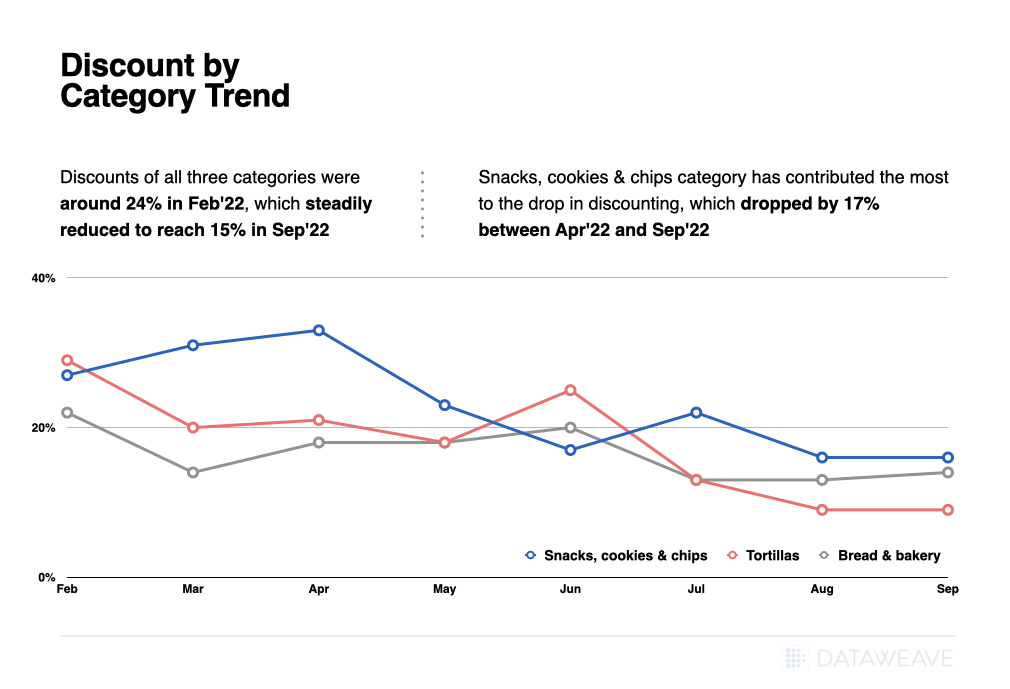
Discount analysis by Category
Discounts of all three categories were around 24% in Feb’ 22, which steadily reduced to reach 15% in Sep’ 22
Snacks, cookies & chips category has contributed the most to the drop in discounting, which dropped by 17% between Apr’ 22 and Sep’ 22
The Tortilla Category does not have any discount in the month of Jul’ 22
By Retailer
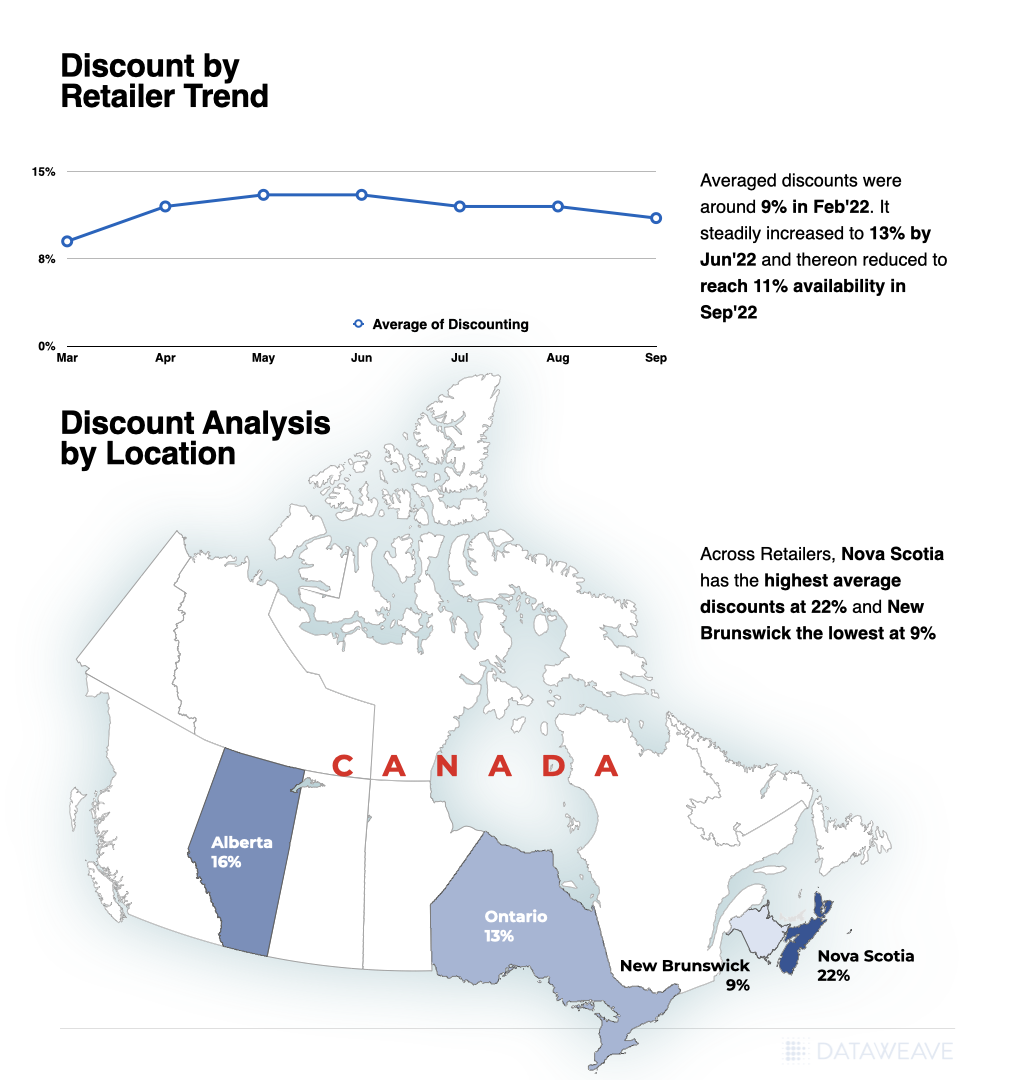
Discount on Bread & Bakery category in Walmart Grocery was around 9% in Feb’ 22. It steadily increased to 13% by Jun’ 22 and thereon reduced to reach 11% availability in Sep’ 22.
By Location
Across Retailers, Nova Scotia had the highest availability of discounts at 22%, whereas New Brunswick had the lowest with discounts at 9% in Bread & Bakery category.
Discount analysis by Retailers and Locations – Alberta, Ontario, New Brunswick, Nova Scotia Note: Analysis does not cover all locations
Bakery and snack product manufacturers on e-commerce platforms have access to a rich trove of insights they can leverage to benchmark their strategies. They can better understand customer demands, align their supply chain and critically understand the trends impacting their bottom line. Engaging with a third-party platform like DataWeave’s Digital Shelf Analytics can help brands unlock tremendous value.
Consumers are discovering and trialing new eCommerce marketplaces, brands and products at a faster rate than ever before, given the vast amount of choices encountered browsing for products online. A recent analysis shows how events like Amazon Prime Day, Black Friday, and Cyber Monday are especially fruitful for new-to-brand customer advertising, encouraging B2C marketers to increase their digital advertising spend to fuel product discovery, sales and market share for their brands.
The majority of eCommerce consumers are discovering products via relevant keywords attributable to their needs, with most clicks happening on page one results for the first few products listed. Simplifying the digital shopping experience is critical for brands to be in the consideration set for the majority of consumers who won’t venture past page one results.
An internal analysis conducted shows getting a product to page one on retailer websites can improve sales by as much as 50 percent, but figuring out the right levers to pull to get there organically—without paid advertising—is a real challenge, especially given fast-changing algorithms. While more than half of all retail related online browsing sessions are “organic”, sometimes brands need to boost their product visibility by investing in sponsored (paid) opportunities to improve a product’s rank.
Data analytics can equip brands with intelligence to help them decide when, where, and how to make digital advertising investments profitably, while simultaneously acting on insights that help drive organic growth. Considering a majority of U.S. consumers begin their product discovery on marketplaces like Amazon, it makes sense for brands to prioritize digital advertising opportunities with Amazon.
Maximize Return on Ad Spend (ROAS) with Amazon Ads
Brands use Amazon Ads to drive brand awareness, acquire new customers, drive sales and gain market share, with the goal of furthering their marketing return on investment. Top performing advertisers average 40 percent greater year-on-year (YoY) sales growth, 50 percent greater YoY growth in customer product page viewership on Amazon, and 30 percent higher returns on ad spend (ROAS) with Amazon Ads, according to a recent analysis. Sponsored Products, Sponsored Brands, Amazon DSP and Sponsored Display are among the types of Amazon Ads options cited that produce maximum return.
Ensuring your product listings appear at the top of page one results on Amazon for the most relevant discovery keywords is therefore the most important determinant for maximizing ROAS. DataWeave has become a vetted partner and measurement provider in the Amazon Advertising Partner Network, with the goal of supporting brands to optimize digital advertising campaigns by providing visibility to Digital Shelf Analytics (DSA) key performance indicators (KPIs), like Share of Search, Pricing and Product Availability, Content Audits, Ratings and Reviews, and Sales Performance and Market Share.
Below is a summary of how our Digital Shelf solutions, in partnership with Amazon Ads, can improve the performance of your Amazon Ads campaigns
1. Keyword Recommendations Improve Share of Search
With the DataWeave Share of Search solution, brands can monitor their placement of both organic and paid discovery keywords relative to their competition. Once your keywords are determined, you are also provided a weighted Share of Search score that helps measure how well each keyword performs relative to product discoverability. Below is an example of insights you’d gain.
Share of Keyword Search
Brands can provide their own list of keywords to monitor, or through our Amazon Ads collaborative solution, learn which keywords are the “best” for them to measure in the realm of Amazon. Performance results are based on data that shows which keywords consumers are actually using when browsing online alongside other keywords brands request to measure. Users are able to see exactly which keywords are most popular, competitive (and even unexpected), and relevant at an Amazon Standard Identification Number (ASIN) level of granularity.
We can also estimate the degree of relevance and estimated traffic for the recommended keywords. Brands can then use these insights to adjust campaign strategies based on these parameters, which can boost product discoverability and rank visibility. A brand could assume people find its products by brand name, yet traffic insights may reveal a majority of people look for a generic product type before they end up buying that particular brand.
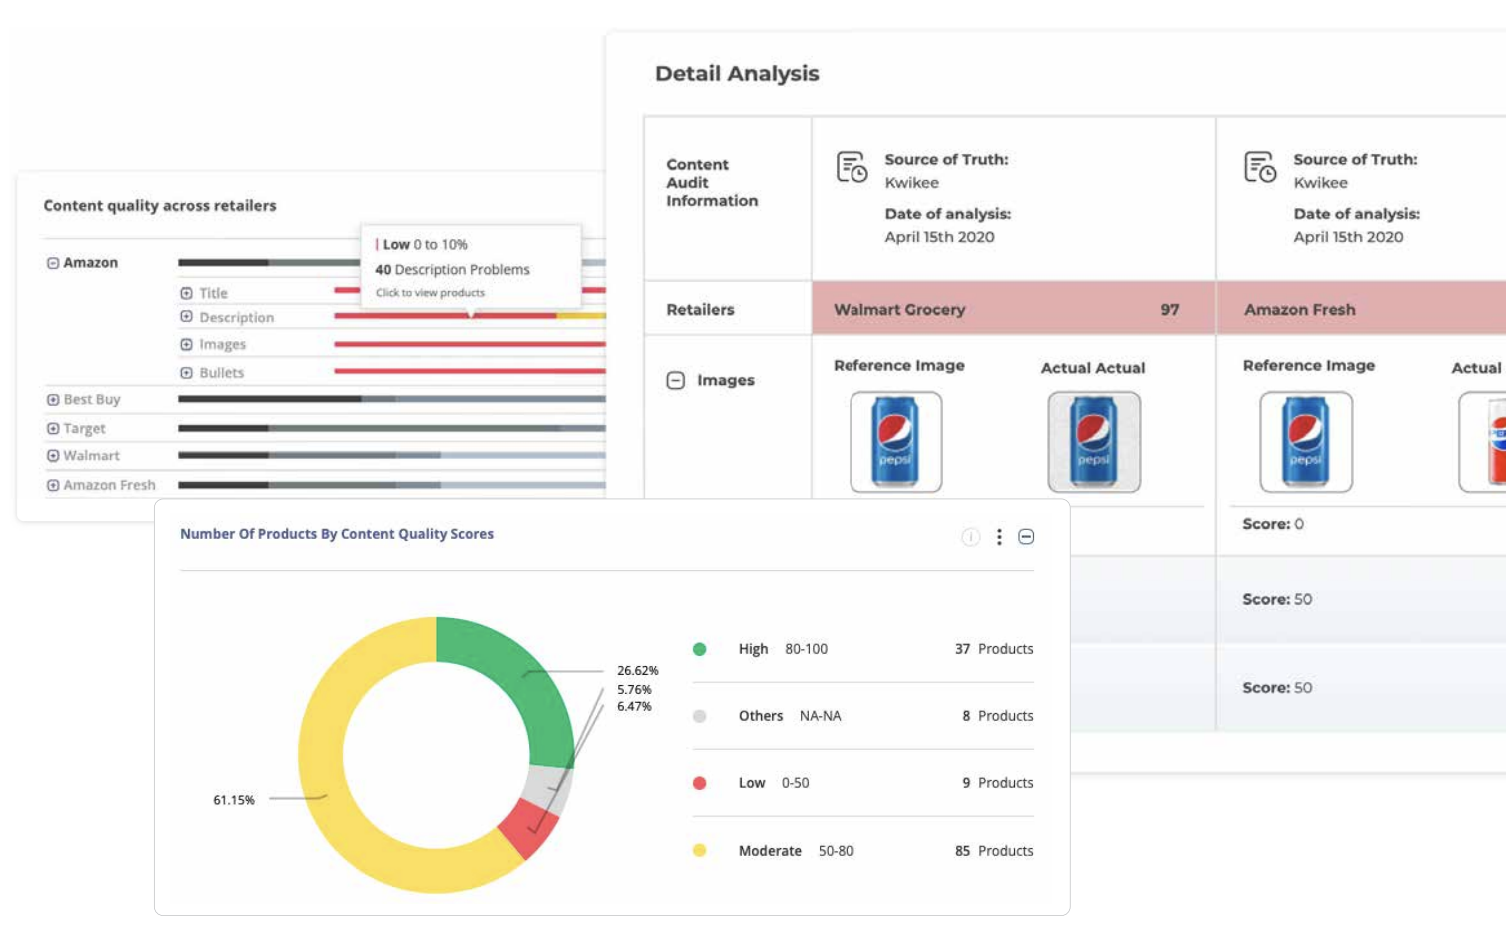
Strong product content is critical to succeeding on Amazon. Thorough, accurate, and descriptive content leads to better click through rates (CTR), conversion rates, more positive reviews, and fewer returns, which results in increased discoverability. DataWeave’s Content Audit solution reviews existing copy and images on a per-attribute basis to highlight any gaps essential to improving visibility, as seen in the example below.
Content Analysis
To further growth, it is equally as important that your product content aligns with your advertising strategy. With Amazon Ads partner add-on, our solution can also audit your content to measure how effectively you are incorporating Amazon Ads keywords into your product content to enhance discovery relevancy.
3. Discover More Opportunities with Pricing and Product Availability Insights
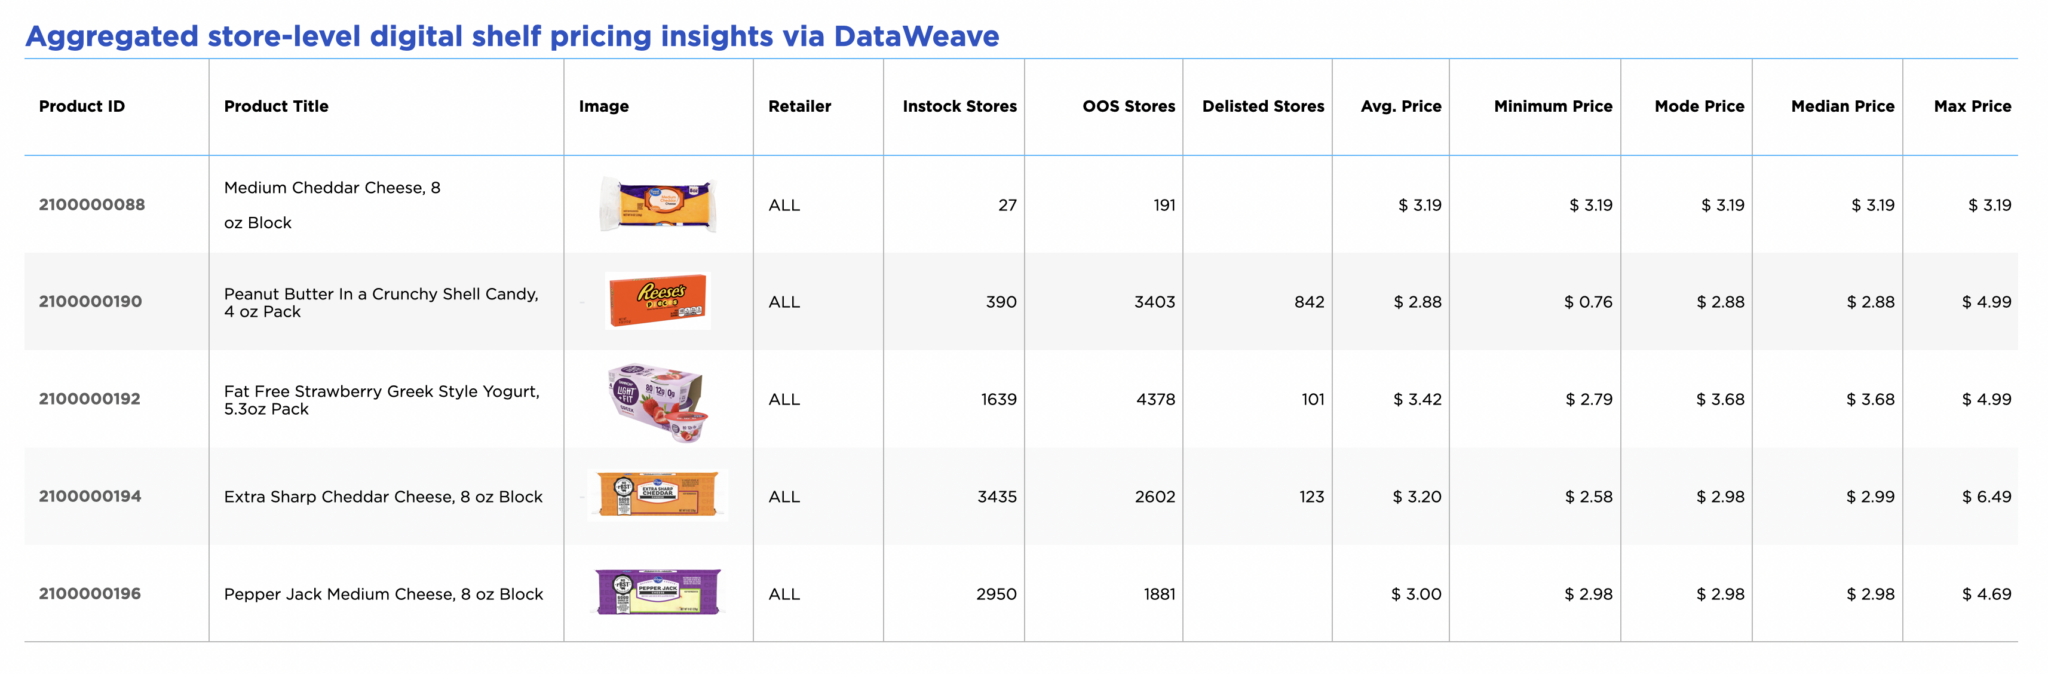
Quality content and keyword updates will only get you so far if your products are not consistently available and priced competitively. With DataWeave’s Pricing and Promotions and Product Availability modules, advertisers can monitor their selling prices and availability trends alongside their competitors to uncover more opportunities to incorporate into advertising campaigns, as seen in the Pricing and Promotions dashboard example below.
Promotion Analysis
Additionally, product targeting recommendations can be utilized to target a competitor’s ASIN that may be overpriced or that is having issues staying in stock. Alternatively, broaden your strategy to target specific brands, complementary products, or category listing pages.
You can also create alerts on your own products to monitor when items are low on inventory or out of stock to ensure key products are consistently available when customers are shopping.
4. Leverage Ratings and Reviews to Increase Conversion
Product ratings and reviews are also a critical component to running a successful Amazon Ads campaign. A large number of reviews and a positive star rating will provide customers with the confidence to purchase, resulting in higher conversion rates. Conversely, negative feedback can have a detrimental impact, resulting in lost sales and wasted ad spend. DataWeave’s Ratings and Reviews module can help you monitor your reviews and extract attribute-level insights on your products. This information can then be utilized to further optimize your advertising strategy.
If you see consistent feedback in your reviews on aspects of a product not meeting customer expectations, address them in your product content to prevent potential misplaced expectations. Alternatively, if customer reviews are raving about certain product features, ensure these are promoted and relevant keywords are populated throughout your descriptions and feature bullets. Below is an example of insights seen within the DSA Ratings & Reviews dashboard.
Ratings and Reviews
5. Correlate Digital Shelf KPIs to Sales Performance and Market Share
The newest DSA module, Sales Performance and Market Share, provides SKU, sub-category, and brand-level sales and market share estimates on Amazon for brands and their competitors, via customer defined taxonomies, to easily benchmark performance results.
This data can also be correlated with other Digital Shelf KPIs, like Content Audit and Product Availability, giving brands an easy way to check the effect of attribute changes and how they impact sales and market share. Similarly, brands can see how search rank, both organic and sponsored, affects sales and market share estimates.
Understanding the correlation between your advertising campaigns and your Digital Shelf brand visibility will help you identify which areas to prioritize to drive sales and win more market share.
Digital Shelf Insights Help Brands Win with Amazon Ads
The need for access to flexible, actionable eCommerce insights is growing exponentially as a way to help brands drive growth, increase their Share of Voice, and to gain a competitive edge. As a result, more global brands are seeking Digital Shelf Analytics for access to near real-time marketplace changes and to develop data-driven growth strategies that leverage pricing, merchandising, and competitive insights at scale.
By monitoring, measuring and analyzing key performance indicators (KPIs) like Sales Performance and Market Share, Share of Search, Content Audits, Product Availability, Pricing and Promotions and Ratings and Reviews alongside competitors, brands will know what actions to take to boost brand visibility, customer satisfaction, and online sales.
DataWeave’s acceptance into the Amazon Advertising Partner Network enables Amazon advertisers to effectively build their Amazon growth strategies and determine systems that enable faster and smarter advertising and marketing decision-making to optimize product discoverability and overall results.
Connect with us now to learn how we can scale with your brand’s analytical needs, or for access to more details regarding our Amazon Ads Partnership or Digital Shelf solutions.
As eCommerce grows in complexity, brands need new ways to grow sales and market share. Right now, brands face urgent market pressures like out-of-stocks, an influx of new competition and rising inflation, all of which erode profitability. As online marketplaces mature, more brands need to make daily changes to their digital marketing strategies in response to these market pressures, shifts in demand, and competitive trends.
eMarketer forecasts 2021 U.S. eCommerce will rise nearly 18% year-over-year (vs. 6.3% for brick-and-mortar), led by apparel and accessories, furniture, food and beverage, and health and personal care. The eCommerce industry is also undergoing fundamental changes with newer entities emerging and traditional business models evolving to adapt to the changed environment. For example, sales for delivery intermediaries such as Doordash, Instacart, Shipt, and Uber have gone from $8.8 billion in 2019 to an estimated $35.3 billion by the end of 2021. Similarly, many brands have established or are building out a Direct to Consumer (D2C) model so they can fully own and control their customer’s experiences.
In response, DataWeave has launched the next generation of our Digital Shelf Analytics suite to help brands across retail categories directly address today’s costly market risks to drive eCommerce growth and gain a competitive advantage.
“Our new enhancements help brands improve online search rank visibility and quantify the impact of digital investments – especially in time for the busy holiday season.” ~ Karthik Bettadapura, CEO and co-founder, DataWeave
The latest product enhancements provide brands access to tailored dashboard views that track KPI achievements and trigger actionable alerts to improve online search rank visibility, protect product availability and optimize share of search 24/7. Dataweave’s Digital Shelf Analytics platform works seamlessly across all forms of eCommerce platforms and models – marketplaces, D2C websites and delivery intermediaries.
Dashboard for Multiple Functions
While all brands share a common objective of increasing sales and market share, their internal teams are often challenged to communicate and collaborate, given differing needs for competitive and performance data across varying job functions. As a result, teams face pressure to quickly grasp market trends and identify what’s holding their brands back.
In response, DataWeave now offers executive-level and customized scorecard views, tailored to each user’s job function, with the ability to measure and assess marketplace changes across a growing list of online retail channels for metrics that matter most to each user. This enhancement enables data democratization and internal alignment to support goal achievement, such as boosting share of category and content effectiveness. The KPIs show aggregated trends, plus granular reasons that help to explain why and where brands can improve.
Brands gain versatile insights serving users from executives to analysts and brand and customer managers.
Prioritized, Actionable Insights
As brands digitize more of their eCommerce and digital marketing processes, they accumulate an abundance of data to analyze to uncover actionable insights. This deluge of data makes it a challenge for brands to know exactly where to begin, create a strategy and determine the right KPIs to set to measure goal accomplishment.
DataWeave’s Digital Shelf Analytics tool enables brands to effectively build a competitive online growth strategy. To boost online discoverability (Share of Search), brands can define their own product taxonomies across billions of data points aggregated across thousands of retailer websites. They can also create customized KPIs that track progress toward goal accomplishment, with the added capability of seeing recommended courses of action to take via email alerts when brands need to adjust their eCommerce plans for agility.
“Brands need an integrated view of how to improve their discoverability and share of search by considering all touchpoints in the digital commerce ecosystem.” ~ Karthik Bettadapura, CEO and co-founder, DataWeave
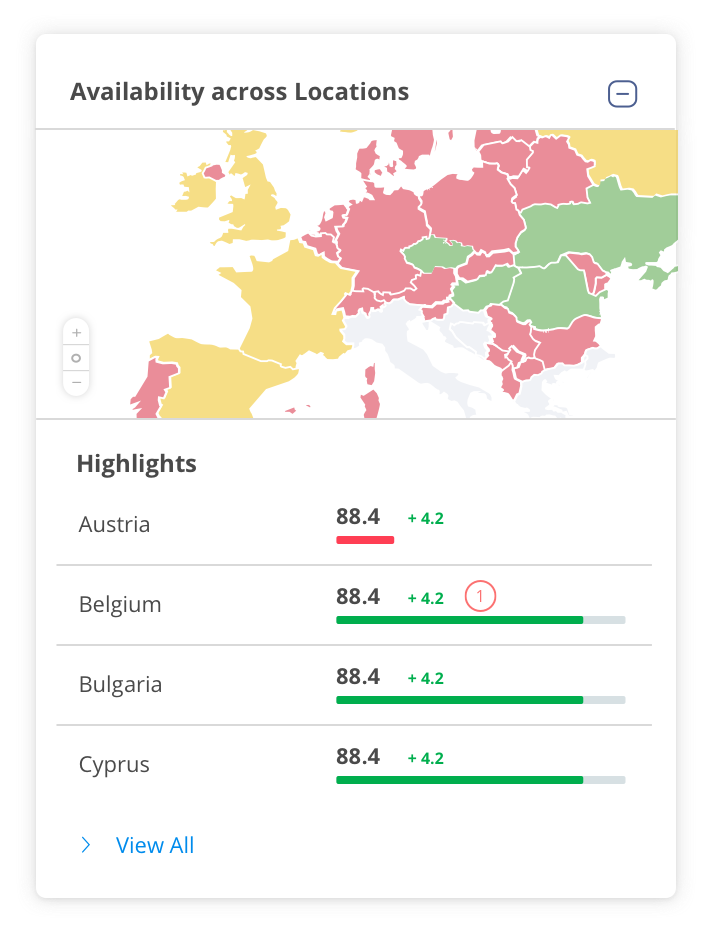
Of vital importance, amid today’s global supply chain challenges, brands gain detailed analysis on product inventory and availability, as well as specific insights and alerts that prompt them to solve out-of-stocks faster, which Deloitte reports is a growing concern of consumers (75% are worried about out-of-stocks) this holiday season.
User and system generated alerts provide clarity to actionable steps to improving eCommerce effectiveness.You also have visibility to store-level product availability, and are alerted to recurring out-of-stock experiences.
Scalable Insights – From Bird’s Eye to Granular Views
DataWeave’s Digital Shelf Analytics allows brands to achieve data accuracy at scale, including reliable insights from a top-down and bottom-up perspective. For example, you can see a granular view of one SKUs product content alongside availability, or you can monitor a group of SKUs, say your best selling ones, at a higher level view with the ability to drill down into more detail.
Brands can access flexible insights, ranging from strategic overviews to finer details explaining performance results.
Many brands struggle with an inability to scale from a hyper-local eCommerce strategy to a global strategy. Most tools available on the market solve for one or the other, addressing opportunities at either a store-level basis or top-down basis – but not both.
According to research by Boston Consulting Group and Google, advanced analytics and AI can drive more than 10% of sales growth for consumer packaged goods (CPG) companies, of which 5% comes directly from marketing. With DataWeave’s advanced analytics, AI and scalable insights, brands can set and follow global strategies while executing changes at a hyper-local level, using root-cause analysis to drill deeper into problems to find out why they are occurring.
As more brands embrace eCommerce and many retailers localize their online assortment strategies, the need for analytical flexibility and granular visibility to insights becomes increasingly important. Google reports that search terms “near me” and “where to buy” have increased by more than 200% among mobile users in the last few years, as consumers seek to buy online locally.
e-Retailers are now fine-tuning merchandising and promotional strategies at a hyper-local level based on differences seen in consumer’s localized search preferences, and DataWeave’s Digital Shelf Analytics solution provides brands visibility to retailer execution changes in near real-time.
Competitive Benchmarking
Brand leaders cannot make sound decisions without considering external factors in the competitive landscape, including rival brands’ pricing, promotion, content, availability, ratings and reviews, and retailer assortment. Dataweave’s Digital Shelf Analytics solution allows you to monitor share of search, search rankings and compare content (assessing attributes like number of images, presence of video, image resolution, etc.) across all competitors, which helps brands make more informed marketing decisions.
Brands are also provided visibility into competitive insights at a granular level, allowing them to make actionable changes to their strategies to stay ahead of competitors’ moves. A new module called ‘Sales and Share’ now enables brands to benchmark sales performance alongside rivals’ and measure market share changes over time to evaluate and improve competitive positioning.
Monitor competitive activity, spot emerging threats and immediately see how your performance compares to all rivals’, targeting ways to outmaneuver the competition.
Sales & Market Share Estimates Correlated with Digital Shelf KPIs
In a brick-and-mortar world, brands often use point of sale (POS) based measurement solutions from third party providers, such as Nielsen, to estimate market share. In the digital world, it is extremely difficult to get such estimates given the number of ways online orders are fulfilled by retailers and obtained by consumers. Dataweave’s Digital Shelf Analytics solution now provides sales and market share estimates via customer defined taxonomy, for large retailers like Amazon. Competitive sales and market share estimates can also be obtained at a SKU level so brands can easily benchmark their performance results.
Additionally, sales and market share data can also be correlated with digital shelf KPIs. This gives an easy way for brands to check the effect of changes made to attributes, such as content and/or product availability, and how the changes impact sales and market share. Similarly, brands can see how modified search efforts, both organic and sponsored, correspond to changes in sales and market share estimates.
Take Your Digital Shelf Growth to the Next Level
The importance of accessing flexible, actionable insights and responding in real-time is growing exponentially as online is poised to account for an increasing proportion of brands’ total sales. With 24/7 digital shelf accessibility among consumers comes 24/7 visibility and the responsibility for brands to address sales and digital marketing opportunities in real-time to attract and serve online shoppers around the clock.
Brands are turning to data analytics to address these new business opportunities, enhance customer satisfaction and loyalty, drive growth and gain a competitive advantage. Companies that adopt data-driven marketing strategies are six times more likely to be profitable year-over-year, and DataWeave is here to help your organization adopt these practices. To capitalize on the global online shopping boom, brands must invest in a digital shelf analytics solution now to effectively build their growth strategies and track measurable KPIs.
DataWeave’s next-gen Digital Shelf Analytics enhancements now further a brand’s ability to monitor, analyze, and determine systems that enable faster and smarter decision-making and sales performance optimization. The results delight consumers by helping them find products they’re searching for, which boosts brand trust.
Connect with us to learn how we can scale with your brand’s analytical needs. No project or region is too big or small, and we can start where you want and scale up to help you stay agile and competitive.