Category: Delivery Intermediaries

  • How DataWeave Enhances Transparency in Competitive Pricing Intelligence for Retailers

    How DataWeave Enhances Transparency in Competitive Pricing Intelligence for Retailers

    Retailers heavily depend on pricing intelligence solutions to consistently achieve and uphold their desired competitive pricing positions in the market. The effectiveness of these solutions, however, hinges on the quality of the underlying data, along with the coverage of product matches across websites.

    As a retailer, gaining complete confidence in your pricing intelligence system requires a focus on the trinity of data quality:

    • Accuracy: Accurate product matching ensures that the right set of competitor product(s) are correctly grouped together along with yours. It ensures that decisions taken by pricing managers to drive competitive pricing and the desired price image are based on reliable apples-to-apples product comparisons.
    • Freshness: Timely data is paramount in navigating the dynamic market landscape. Up-to-date SKU data from competitors enables retailers to promptly adjust pricing strategies in response to market shifts, competitor promotions, or changes in customer demand.
    • Product matching coverage: Comprehensive product matching coverage ensures that products are thoroughly matched with similar or identical competitor products. This involves accurately matching variations in size, weight, color, and other attributes. A higher coverage ensures that retailers seize all available opportunities for price improvement at any given time, directly impacting revenues and margins.

    However, the reality is that untimely data and incomplete product matches have been persistent challenges for pricing teams, compromising their pricing actions. Inaccurate or incomplete data can lead to suboptimal decisions, missed opportunities, and reduced competitiveness in the market.

    What’s worse than poor-quality data? Poor-quality data masquerading as accurate data.

    In many instances, retailers face a significant challenge in obtaining comprehensive visibility into crucial data quality parameters. If they suspect the data quality of their provider is not up to the mark, they are often compelled to manually request reports from their provider to investigate further. This lack of transparency not only hampers their pricing operations but also impedes the troubleshooting process and decision-making, slowing down crucial aspects of their business.

    We’ve heard about this problem from dozens of our retail customers for a while. Now, we’ve solved it.

    DataWeave’s Data Statistics and SKU Management Capability Enhances Data Transparency

    DataWeave’s Data Statistics Dashboard, offered as part of our Pricing Intelligence solution, enables pricing teams to gain unparalleled visibility into their product matches, SKU data freshness, and accuracy.

    It enables retailers to autonomously assess and manage SKU data quality and product matches independently—a crucial aspect of ensuring the best outcomes in the dynamic landscape of eCommerce.

    Beyond providing transparency and visibility into data quality and product matches, the dashboard facilitates proactive data quality management. Users can flag incorrect matches and address various data quality issues, ensuring a proactive approach to maintaining the highest standards.

    Retailers can benefit in several ways with this dashboard, as listed below.

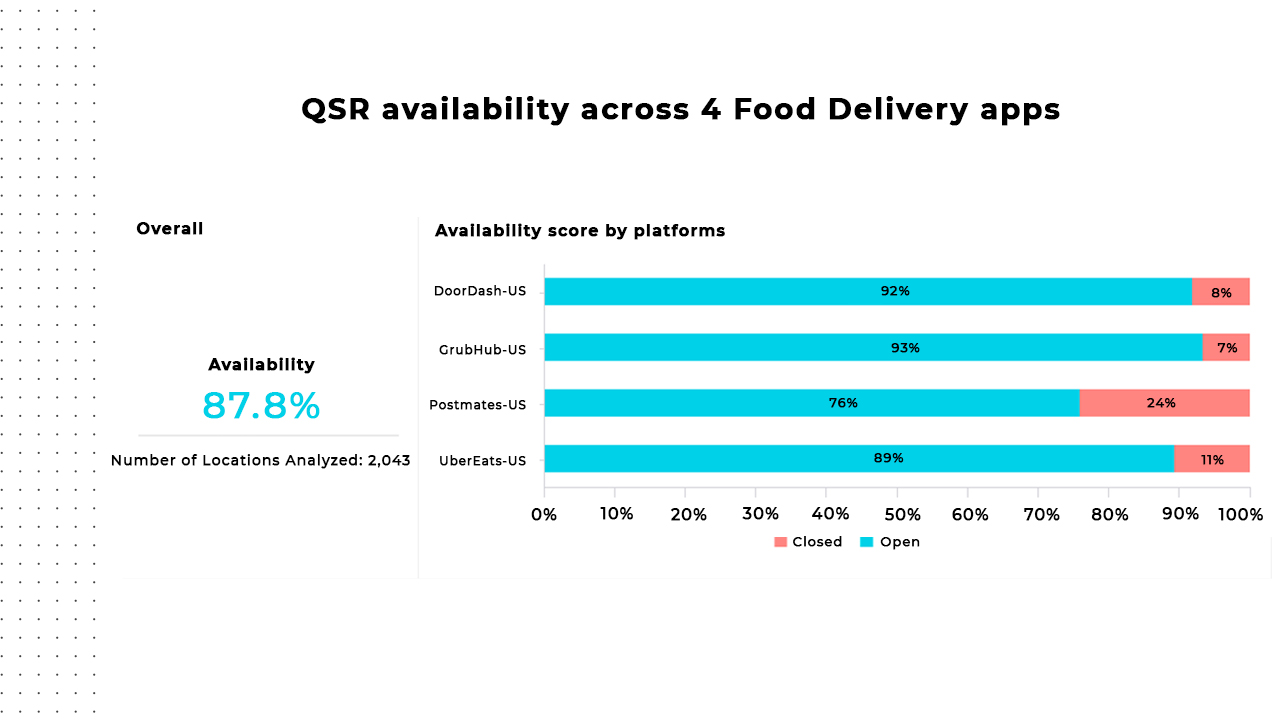
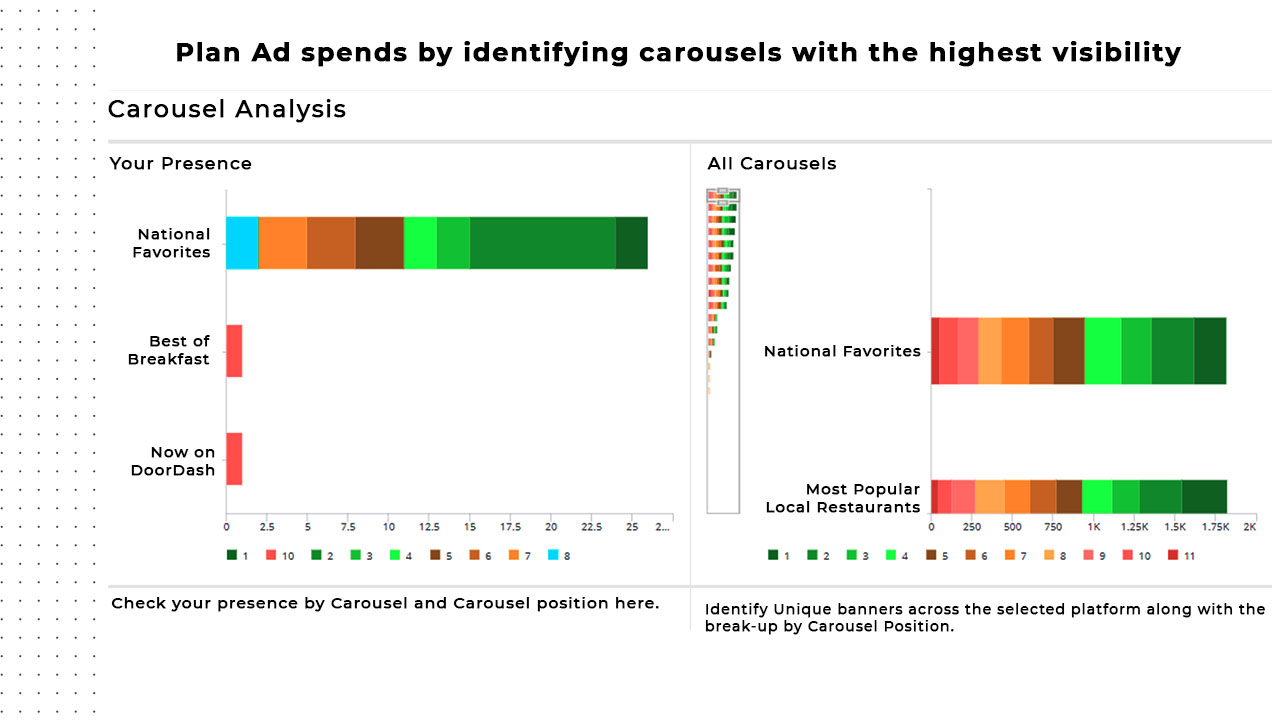
    View Product Match Rates Across Websites

    The dashboard helps retailers track match rates to gauge their health. High product match rates signify that pricing teams can move forward in their pricing actions with confidence. Low match rates would be a cause for further investigation, to better understand the underlying challenges, perhaps within a specific category or competitor website.

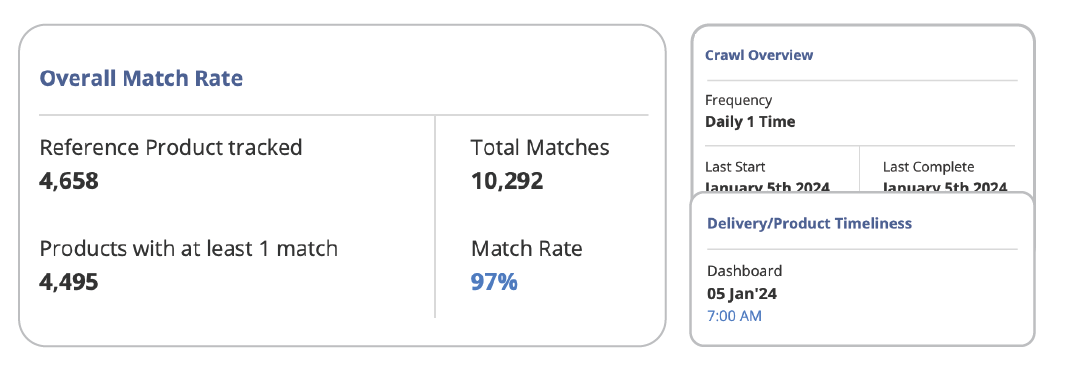
    Our dashboard presents both summary statistics on matches and data crawls as well as detailed snapshots and trend charts, providing users with a holistic and detailed perspective of their product matches.

    Additionally, the dashboard provides category-wise snapshots of reference products and their matching counterparts across various retailers, allowing users to focus on areas with lower match rates, investigate underlying reasons, and develop strategies for speedy resolution.

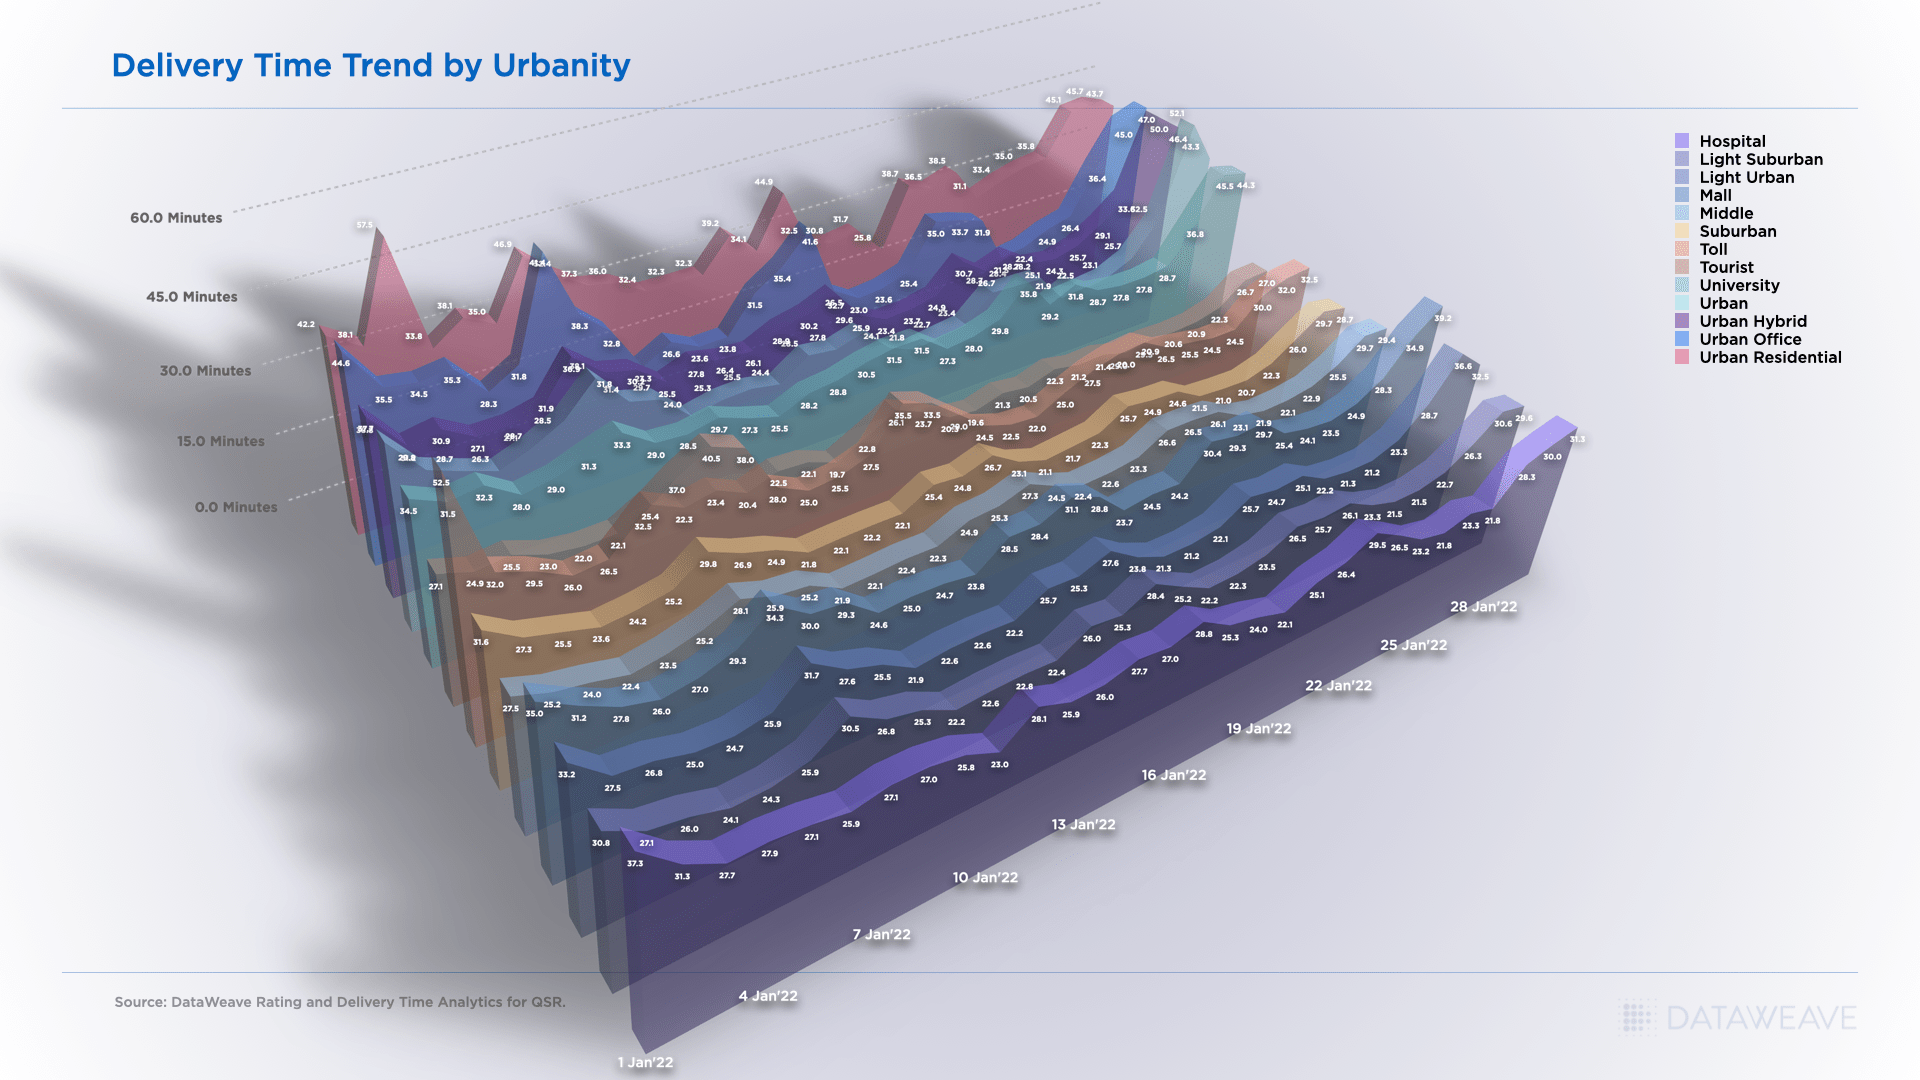
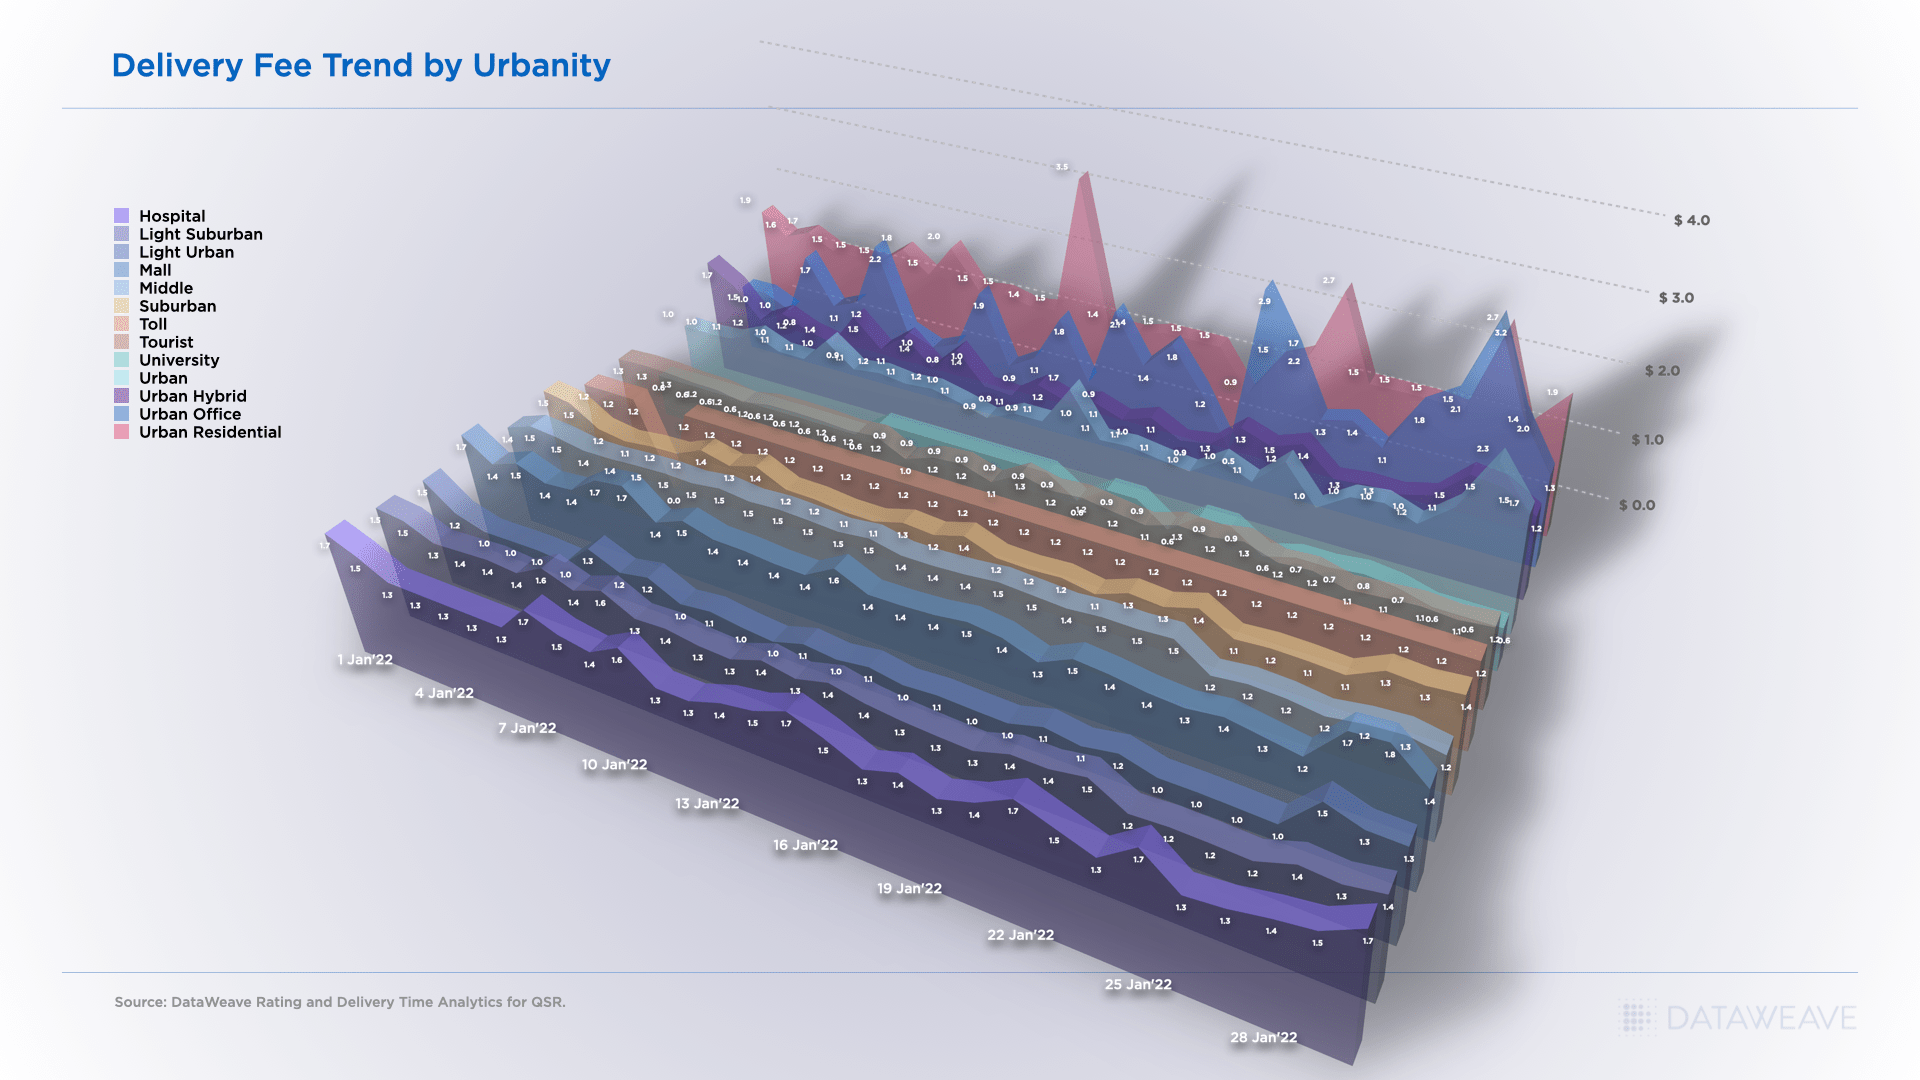
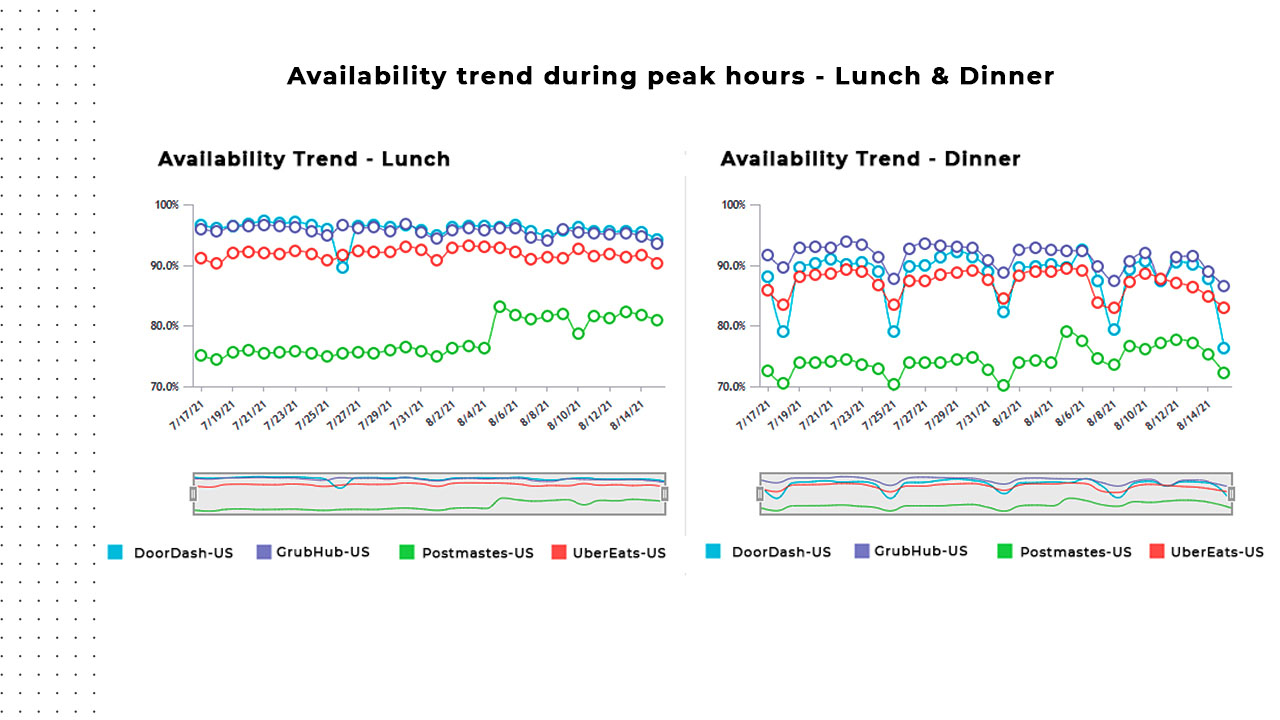
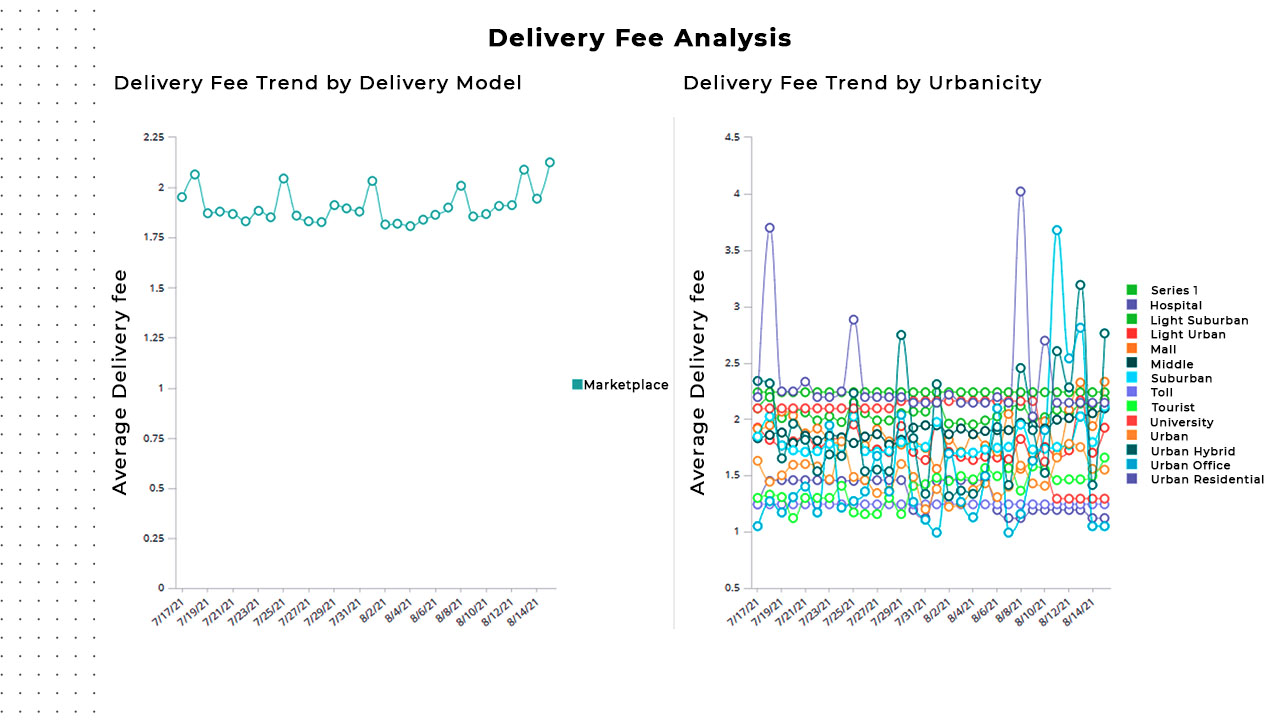
    Track Data Freshness Easily

    The dashboard enables pricing teams to monitor the timeliness of pricing data and assess its recency. In the dynamic realm of eCommerce, having up-to-date data is essential for making impactful pricing decisions. The dashboard’s presentation of freshness rates ensures that pricing teams are armed with the latest product details and pricing information across competitors.

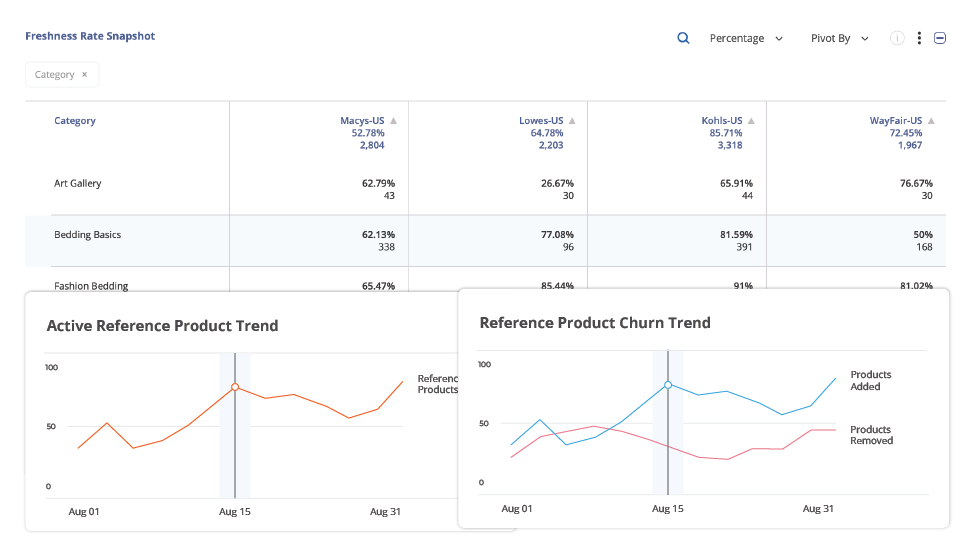
    Within the dashboard, users can readily observe the count of products updated with the most recent pricing data. This feature provides insights into any temporary data capture failures that may have led to a decrease in data freshness. Armed with this information, users can adapt their pricing decisions accordingly, taking into consideration these temporary gaps in fresh data. This proactive approach ensures that pricing strategies remain agile and responsive to fluctuations in data quality.

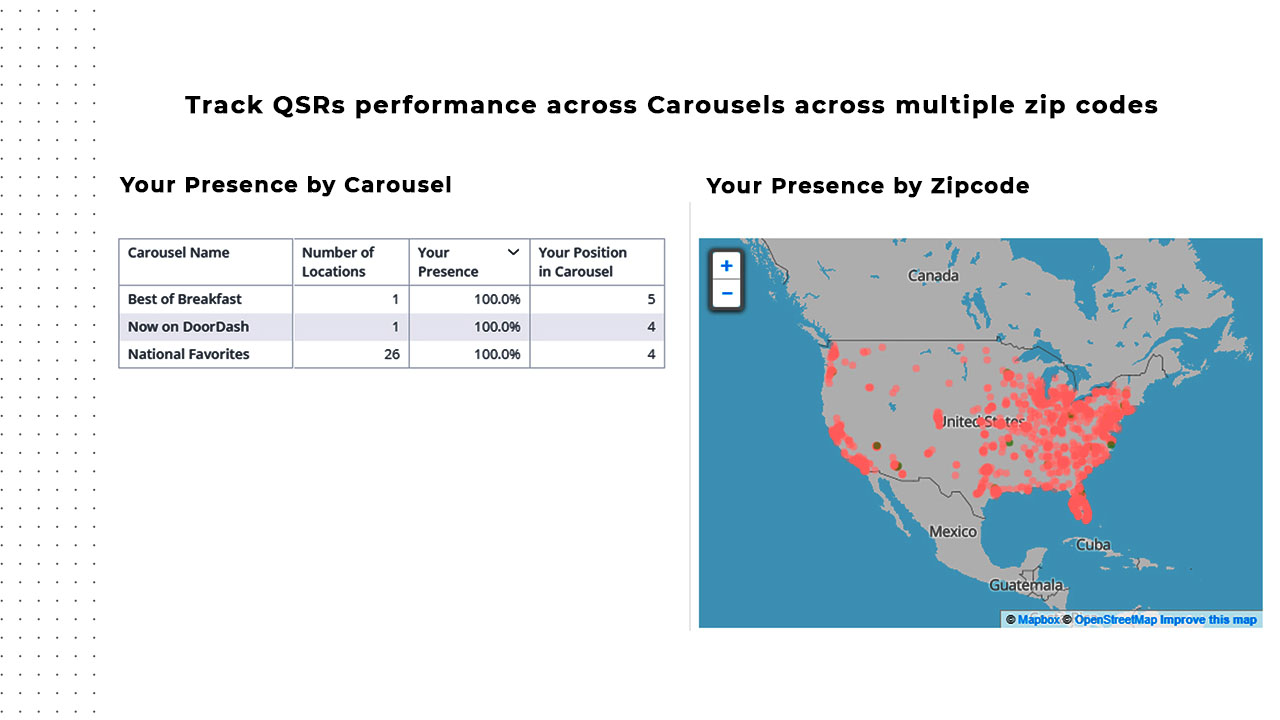
    Proactively Manage Product Matches

    The dashboard provides users with proactive control over managing product matches within their current bundles via the ‘Data Management’ panel. This functionality empowers users to verify, add, flag, or delete product matches, offering a hands-on approach to refining the matching process. Despite the deployment of robust matching algorithms that achieve industry-leading match rates, occasional instances may arise where specific matches are overlooked or misclassified. In such cases, users play a pivotal role in fine-tuning the matching process to ensure accuracy.

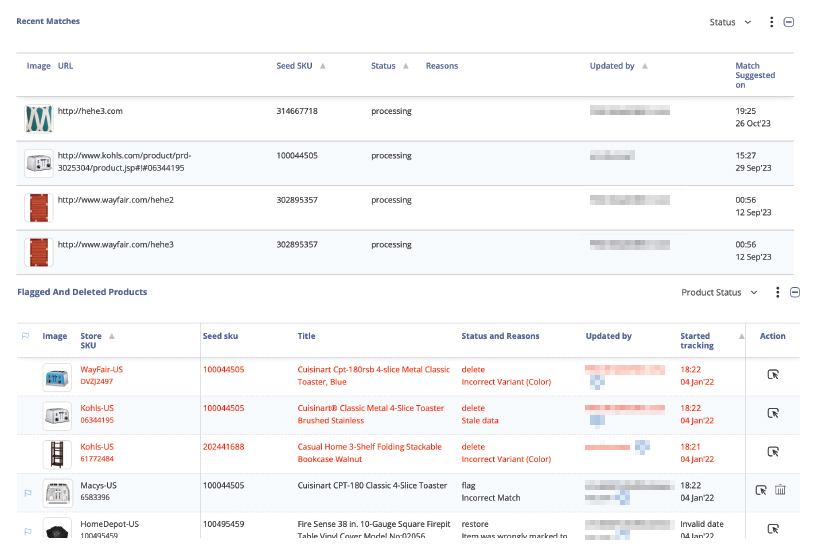
    The interface’s flexibility extends to accommodating product variants and enables users to manage product matches based on store location. Additionally, the platform facilitates bulk match uploads, streamlining the process for users to efficiently handle large volumes of matching data. This versatility ensures that users have the tools they need to navigate and customize the matching process according to the nuances of their specific product landscape.

    Gain Unparalleled Visibility into your Data Quality

    With DataWeave’s Pricing Intelligence, users gain the capability to delve deep into their product data, scrutinize match rates, assess data freshness, and independently manage their product matches. This approach is instrumental in fostering informed and effective decisions, optimizing inventory management, and securing a competitive edge in the dynamic world of online retail.

    To learn more, reach out to us today!

  • Capturing and Analyzing Retail Mobile App Data for Digital Shelf Analytics: Are Brands Missing Out?

    Capturing and Analyzing Retail Mobile App Data for Digital Shelf Analytics: Are Brands Missing Out?

    Consumer brands around the world increasingly recognize the vital role of tracking and optimizing their digital shelf KPIs, such as Content Quality, Share of Search, Availability, etc. These metrics play a crucial role in boosting eCommerce sales and securing a larger online market share. With the escalating requirements of brands, the sophistication of top Digital Shelf Analytics providers is also on the rise. Consequently, the adoption of digital shelf solutions has become an essential prerequisite for today’s leading brands.

    As brands and vendors continue to delve further and deeper into the world of Digital Shelf Analytics, a significant and often overlooked aspect is the analysis of digital shelf data on mobile apps. The ability of solution providers to effectively track and analyze this mobile-specific data is crucial.

    Why is this emphasis on mobile apps important?

    Today, the battle for consumer attention unfolds not only on desktop web platforms but also within the palm of our hands – on mobile devices. As highlighted in a recent Insider Intelligence report, customers will buy more on mobile, exceeding 4 in 10 retail eCommerce dollars for the first time.

    Moreover, thanks to the growth of delivery intermediaries like Instacart, DoorDash, Uber Eats, etc., shopping on mobile apps has received a tremendous organic boost. According to an eMarketer report, US grocery delivery intermediary sales are expected to reach $68.2 billion in 2025, from only $8.8 billion in 2019.

    In essence, mobile is increasingly gaining share as the form factor of choice for consumers, especially in CPG. In fact, one of our customers, a leading multinational CPG company, revealed to us that it sees up to 70% of its online sales come through mobile apps. That’s a staggering number!

    The surge in app usage reflects a fundamental change in consumer behavior, emphasizing the need for brands to adapt their digital shelf strategies accordingly.

    Why Brands Need To Look at Apps and Desktop Data Differently

    Conventionally, brands that leverage digital shelf analytics rely on data harnessed from desktop sites of online marketplaces. This is because capturing data reliably and accurately from mobile apps is inherently complex. Data aggregation systems designed to scrape data from web applications cannot easily be repurposed to capture data on mobile apps. It requires dedicated effort and exceptional tech prowess to pull off in a meaningful and consistent way.

    In reality, it is extremely important for brands to track and optimize their mobile digital shelf. Several digital shelf metrics vary significantly between desktop sites and mobile apps. These differences are natural outcomes of differences in user behavior between the two form factors.

    One of these metrics that has a huge impact on a brand’s performance on retail mobile apps is their search discoverability. Ecommerce teams are well aware of the adverse impact of the loss of even a few ranks on search results.

    Anyone can easily test this. Searching something as simple as “running shoes” on the Amazon website and doing the same on its mobile app shows at least a few differences in product listings among the top 20-25 ranks. There are other variances too, such as the number of sponsored listings at the top, as well as the products being sponsored. These variations often result in significant differences in a brand’s Share of Search between desktop and mobile.

    Share of Search is the share of a brand’s products among the top 20 ranked products in a category or subcategory, providing insight into a brand’s visibility on online marketplaces.

    Picture a scenario in which a brand heavily depends on desktop digital shelf data, confidently assuming it holds a robust Share of Search based on reports from its Digital Shelf Analytics partner. However, unbeknownst to the team, the Share of Search on mobile is notably lower, causing a detrimental effect on sales.

    To fully understand the scale of these differences, we decided to run a small experiment using our proprietary data analysis and aggregation platform. We restricted our analysis to just Amazon.com and Amazon’s mobile app. However, we did cover over 13,000 SKUs across several shopping categories to ensure the sample size is strong.

    Below, we provide details of our key findings.

    Share of Search on The Digital Shelf – App Versus Desktop

    Our analysis focused on three popular consumer categories – Electronics, CPG, and Health & Beauty.

    In the electronics category, brands like Apple, Motorola, and Samsung, known for their mobile phones, earbuds, headphones, and more, have a higher Share of Search on the Amazon mobile app compared to the desktop.

    Meanwhile, Laptop brands like Dell, Acer, and Lenovo, as well as other leading brands like Google have a higher Share of Search on the desktop site compared to the app. This is the scenario that brands need to be careful about. When their Share of Search on mobile apps is lower, they might miss the chance to take corrective measures since they lack the necessary data from their provider.

    In the CPG category, Ramen brand Samyang, with a lot of popularity on Tiktok and Instagram, shows a higher Share of Search on Amazon’s mobile app. Speciality brands like 365 By Whole Foods, pasta and Italian food brands La Moderna, Divinia, and Bauducco too have a significantly higher Share of Search on the app.

    Cheese and dessert brands like Happy Belly, Atlanta Cheesecake Company, among others, have a lower Share of Search on the mobile app. Ramen brand Sapporo is also more easily discovered on Amazon’s desktop site. Here, we see a difference of more than 5% in the Share of Search of some brands, which is likely to have a huge impact on the brand’s mobile eCommerce sales levels and overall performance.

    Lastly, in the Health & Beauty category, Shampoos and hair care brands like Olaplex, Dove, and Tresemme exhibited a higher Share of Search on the mobile app compared to the desktop.

    On the other hand, body care brands like Neutrogena and Hawaiian Tropic, as well as Beardcare brand Viking Revolution displayed a higher Share of Search on Amazon’s desktop site.

    Based on our data, it is clear that there are several examples of brands that do better in either one of Amazon’s desktop sites or mobile apps. In many cases, the difference is stark.

    So What Must Brands Do?

    Our findings emphasize the imperative for brands to move beyond a one-size-fits-all approach to digital shelf analytics. The striking variations in Share of Search between mobile apps and desktops conclusively demonstrate that relying solely on desktop data for digital shelf optimization is inadequate.

    If brands see that they’re falling behind on the mobile digital shelf, there are a few things they can do to help boost their performance:

    • If a brand’s Share of Search is lower on the mobile app, they can divert their retail spend to mobile in order to inorganically compensate for this difference. This way, any short-term impact due to lower discoverability is mitigated. This is also likely to result in optimized budget allocation and ROAS.
    • Brands also need to ensure their content is optimized for the mobile form factor, with images that are easy to view on smaller screens, and tailored product titles that are shorter than on desktops, highlighting the most important product attributes from the consumer’s perspective. Not only will this help brands gain more clicks from mobile shoppers, but this will also gradually lead to a boost in their organic Share of Search on mobile.
    • CPG brands, specifically, need to optimize their digital shelf for delivery intermediary apps (along with marketplaces). The grocery delivery ecosystem is booming with companies like DoorDash, Delivery Hero, Uber Eats, Swiggy, etc. leading the way. Using Digital Shelf Analytics to optimize performance on delivery apps is quite an involved process with a lot of bells and whistles to consider. Read our recently published whitepaper that specifically details how brands can successfully boost their visibility and conversions on delivery apps.

    But first, brands need to identify and work with a Digital Shelf Analytics partner that is able to capture and analyze mobile app data, enabling tailored optimization approaches for all eCommerce platforms.

    DataWeave leads the way here, providing the world’s most comprehensive and sophisticated digital shelf analytics solution, rising above all other providers to provide digital shelf insights for both web applications and mobile apps. Our data aggregation platform successfully navigates the intricacies of capturing public data accurately and reliably from mobile apps, thereby delivering a comprehensive cross-device view of digital shelf KPIs to our brand customers.

    So reach out to us today to find out more about our digital shelf solutions for mobile apps!

  • 7 Key Metrics that QSRs want (but may not get) from Food Delivery Apps

    7 Key Metrics that QSRs want (but may not get) from Food Delivery Apps

    The Quick Service Restaurant market is projected to be valued at $691 billion by 2022. As the QSR industry grows and the market becomes even more competitive, restaurant chains continuously seek ways to increase sales via food aggregators to market their business. To improve ROI and sales, having data and insights into key metrics could help QSRs to boost their success rate.

    QSRs would like to know how they stack up against their competition regarding discoverability on cluttered food aggregator apps. Restaurants want to know the gaps in their product assortment to understand what drives customers to their competitors. Getting insights into delivery time and competitors’ delivery fees will help QSR improve delivery ETAs and optimize fees. They can also set competitive pricing with insights into their competitors’ pricing. In addition, they can use data to optimize their ad spending on food apps and improve marketing ROI.

    In this blog, we will discuss the relationship between QSRs and food aggregators and how getting data about key metrics from these food delivery platforms can help QSRs scale their revenue. 

    Data: The Key Ingredient to increasing sales

    According to Statista, online food ordering revenue is expected to grow at a robust CAGR of 10.39% between 2021 and 2025. Food Aggregators apps like Uber Eats, DoorDash, and GrubHub offer convenient meal delivery options from various QSRs within a single app. Food aggregators provide a multitude of benefits for QSRs. They give access to a huge customer base, quick delivery, and an easy entry into quick commerce, helping QSRs increase visibility. Although QSRs rely on food aggregator platforms for hassle-free ordering, tracking, and delivery, they can’t always rely on them to share critical data that could help them optimize their operations & increase sales. 

    Online food ordering revenue
    Online food ordering revenue

    1. Data on Product Assortment

    QSRs need assortment insights to understand their competitor’s menu assortment. Assortment analytics plays a crucial role in ensuring that QSRs aren’t losing sales because their competitors are offering cuisines and dishes that they aren’t. Understanding gaps in menus helps QSRs to better plan their menu. However, food aggregator apps can’t share competitors’ assortment data with QSRs for a multitude of reasons, guidelines, and privacy laws. Thankfully, at DataWeave, our QSR intelligence solution can! We help restaurants improve their assortment by sharing insights into the dishes and cuisines their competitors’ have on display.

    Menu Assortment
    Menu Assortment

    2. Data on QSR Discoverability

    QSRs would love to know how to increase discoverability on food aggregators, as it will help them to appear ahead in search results and beat the competition. Improving visibility on these apps directly impacts sales and drives more orders for restaurants. Some aggregators offer discoverability information but give it on demand, usually after 20-30 days, making it irrelevant due to the enormous time gap. They also don’t provide information about the change in the discoverability of your competition. All these data points are so critical, and understandably so, Food Apps can’t share this level of information with restaurants. However, DataWeave’s QSR Intelligence solution can! It provides real-time discoverability insights into your restaurant and competitor’s visibility so that the data is actionable, and QSRs can use insights to improve visibility

    Read how DataWeave’s QSR Intelligence helped an American QSR Chain and how their ranking on search results page on Ube rEats, DoorDash & Grubhub impacted outlet discoverability & sales!

    3. Data on Pricing & Promotions

    Pricing a QSR’s menu is tricky. If you price too high, you’ll turn off new customers. If you price too low, you’ll cut margins & may even come off as low-qualify. Customer Price Perception is greatly influenced by the Price-Quality relationship. To add to this, restaurants are often up against stiff competition from restaurants with similar cuisine offerings so it’s critical that prices are competitive. Understanding competitor pricing doesn’t imply that you have to beat their prices. You can compensate for any price differences by offering higher quality cuisines, better customer service, and quicker delivery. Once again, food apps can’t share competitors’ pricing data with QSRs. But DataWeave’s QSR & Pricing Intelligence solution can! QSRs can use these insights to drive more revenue & margins by pricing their menu right.

    4. Data on Delivery Time

    QSRs must be able to deliver hot meals, in a timely manner to customers because customers want to quickly dig into the delicious food they ordered. Quicker deliveries within the ETA will also help earn the trust and loyalty of customers. However, food aggregators don’t share information on the delivery times with restaurants – not their own delivery time or their competitors. DataWeave can help QSRs to understand their peak hours and optimize their service to ensure quick ETAs. They can also get detailed insights into competitors’ delivery times to make sure they’re competitive. This is important because customers will often pick restaurants with quicker ETAs.


    Read how DataWeave’s QSR Intelligence helped an American QSR Chain understand the correlation between delivery time & sales volumes

    Delivery time trend by urbanity
    Delivery time trend by urbanity

    5. Data on Delivery Fee

    As a thumb rule, customers will always compare delivery fees across apps. They’re conscious of delivery dollars included in their bill and often choose a restaurant with lesser delivery fees. This makes it even more critical for restaurants to understand how they stack up against their competitors. Understanding competitors’ delivery fees could potentially help QSRs to optimize their rates. And once again, food aggregators can’t share information on competitors’ delivery fees with restaurants. However, DataWeave’s QSR Intelligence can provide all delivery-related insights – be it Delivery etas or fees. 

    Delivery fee trend by urbanity
    Delivery fee trend by urbanity

    6. Data on Ad Performance & ROI

    Getting ad analytics will help QSRs better manage their budgets & increase the ROI on their Ad spends. For example, wouldn’t it be great if QSRs were able to understand which ad formats or promotions led to the most sales? Or which carousal ads had the most visibility in key zip codes where your QSR is expected to do maximum business? Or even insights into a competitor’s ads and promotions on food apps. Knowing this information will help restaurants spend sensibly when buying media on Food Apps & get the most bang for their advertising buck. Food apps do provide standard ad analytics – a number of clicks, CTR, and so on, but for more complex, insightful & actionable insights, there’s DataWeave’s QSR Intelligence

    Read how DataWeave’s QSR Intelligence helped an American QSR Chain understand the ROI delivered on ad spends across Food Delivery apps.

    Insightful & actionable insights for QSR Chains
    Insightful & actionable insights for QSR Chains
    Insightful & actionable insights for QSR Chains
    Insightful & actionable insights for QSR Chains

    7. Data on Outlet Availability / Availability Audit

    To avoid lost sales, being available & “open for business” on Food Apps during peak lunch & dinner hours is critical. Also on weekends, when order volumes are usually high. Sometimes because of technical glitches, QSR outlets appear unavailable on Food Apps. A glitch like that can lead to lost business, and the longer the glitch stays undiscovered, the greater the impact on revenue. While Food Aggregators do their best to make sure all QSRs are up and running on their app, using DataWeave’s QSR Intelligence, restaurants can now do an outlet audit to make sure that’s the case. With just a mere 2.8% unavailability, we saw a 28% drop in the sales for one of our QSR customers! That’s how critical Availability insights are. 

    Conclusion

    Analyzing and optimizing sales, delivery, discoverability, availability & customer data is one of the fastest ways to help grow your QSRs revenue. However, the biggest challenge QSRs face is that it isn’t always easy to get this information. With DataWeave’s QSR Intelligence now some of that data is a little more accessible as we discussed in this blog. And additionally, here are the 7 Tricks we recommend QSRs to use to win on Food Apps

  • Share of Keyword Search Cinco de Mayo 2022

    Share of Keyword Search Cinco de Mayo 2022

    As inflation continues to hike costs for consumers and supply chains challenge them to maintain loyalty, there is still an active audience willing to pay the ultimate price for the convenience of food and alcohol delivery. That being said, we analyzed 8 popular Retail and Delivery Intermediary websites and 11 popular ‘Cinco de Mayo’ keywords to see which Brands are predicted to win the battle of Digital Shelf Share of Search this holiday.

    2022 Cinco de Mayo Share of Search Insights - Top Brands for 'Cinco de Mayo'
    2022 Cinco de Mayo Share of Search Insights – Top Brands for ‘Cinco de Mayo’

    Opportunities for Food & Bev on Cinco de Mayo

    While most of our analysis focused on popular Cinco de Mayo food and beverage products, none of these brands populated on either Target (pictured on left below) or Walmart (pictured on right below) page 1 search results for the term ‘Cinco de Mayo’. Keyword search results for this term are dominated primarily by décor brands as indicated below.

    Brands Achieving Top Share of Search for Food and Beverage Categories on Cinco de Mayo 2022
    Brands Achieving Top Share of Search for Food and Beverage Categories on Cinco de Mayo 2022

    Share of Keyword Search Results – Alcohol Category

    Three of the most popular alcohol types sought out during Cinco de Mayo are ‘Mexican Beer’, ‘Mezcal’, and ‘Tequila’. Below are the brands dominating Share of Keyword Search results on each of the major retail websites we researched.

    AmazonFresh, Meijer, Kroger, and Sam's Club Share of Search - Beer, Mezcal, and Tequila Keywords on Cinco de Mayo 2022
    AmazonFresh, Meijer, Kroger, and Sam’s Club Share of Search – Beer, Mezcal, and Tequila Keywords on Cinco de Mayo 2022

    We also reviewed the same keyword performance across popular delivery intermediaries to see how Share of Keyword Search altered for ‘Mexican Beer’, ‘Mezcal’, and ‘Tequila’. The results are below for TotalWine, Instacart, Drizly and GoPuff:

    TotalWine, Instacart, Drizly, and GoPuff of Search - Beer, Mezcal, and Tequila Keywords on Cinco de Mayo 2022
    TotalWine, Instacart, Drizly, and GoPuff of Search – Beer, Mezcal, and Tequila Keywords on Cinco de Mayo 2022

    The keyword ‘Agave’ is also a popular search term within the alcohol category during the time leading up to Cinco de Mayo. We reviewed keyword search performance at various zip codes to see how price points that populated on page 1 search results varied given the change in median income. Below are the results:

    Share of Search for Alcohol by Price Point and Zip Code on AmazonFresh
    Share of Search for Alcohol by Price Point and Zip Code on AmazonFresh

    Share of Keyword Search Results – Grocery Categories

    We also reviewed some of the most popular grocery items purchased during Cinco de Mayo by Keyword Share of Search results to see which brands are primed to win the Digital Shelf this year. Below are the results for Target.com and Walmart.com.

    Walmart and Target Share of Search - Food and Beverage Keywords on Cinco de Mayo 2022
    Walmart and Target Share of Search – Food and Beverage Keywords on Cinco de Mayo 2022

    Below are the results for the same popular grocery items and alcohol keywords related to Cinco de Mayo and the page 1 results seen for Brand Share of Search on Safeway.com.

    Safeway Share of Search - Food and Beverage Keywords on Cinco de Mayo 2022
    Safeway Share of Search – Food and Beverage Keywords on Cinco de Mayo 2022

    Access to these types of real-time digital marketplace insights can enable retailers and brands to make strategic decisions and help drive profitable growth in an intensifying competitive environment. Be sure to reach out to our Retail Analytics experts for access to more details regarding the above analysis, and let us know what other holiday insights you’d be interested in seeing this year. Happy Cinco de Mayo!

  • The Rise of On-Demand Grocery Delivery after the Pandemic

    The Rise of On-Demand Grocery Delivery after the Pandemic

    Before the pandemic, the grocery industry was set around brick-and-mortar stores, and there was a slow movement towards on-demand grocery. Online grocery delivery was still considered a peripheral channel. However, grocery shoppers started turning to on-demand platforms since the onset of COVID-19. According to Acosta’s report, since the pandemic, 45% of customers prefer online grocery shopping over physical stores. 

    COVID-19 drastically accelerated the online grocery delivery trend, increasing 10% and 15% of total grocery sales during the peak COVID-19 time. In the U.S., online grocery shopping reached nearly $90 billion in sales in 2020, increasing by more than $30 billion. 

    In this article, you’ll learn about the early pioneers of online grocery delivery in the U.S., the modern players, and the impact of COVID-19 on grocery trends.

    Early pioneers of online grocery delivery

    Early pioneers of online grocery delivery
    Early pioneers of online grocery delivery

    In the late 1990s, consumers had just started ordering products online. Online grocery shopping was an early area of focus. It offered lucrative rewards to high-spending consumers, increased convenience, and saved them time. Peapod, founded in 1989 by brothers Andrew and Thomas Parkinson, was the first online grocery delivery service. Back when they started, users had to install software from CD-ROMs and then place orders. Though it took years to become a well-known name in the industry, Peapod is still in business.

    Webvan and HomeGrocer.com were two other early pioneers of online grocery delivery that started in 1996 in California and 1997 in Washington respectively. Webvan had a successful launch in California, and they had aggressive expansion plans to operate in 26 major cities around the United States. However, the company filed for bankruptcy less than two years later. HomeGrocer.com quickly created the infrastructure needed to support the business, including a fleet of vans and a huge warehouse. They had impressive early growth, and sales reached over $1 million a day by mid-2000. They expanded into other markets, including California, Georgia, Oregon, Texas, and Illinois.

    Modern players of the on-demand grocery delivery

    Modern players of the on-demand grocery delivery
    Modern players of the on-demand grocery delivery

    Online Grocery Trends Post-Pandemic

    When COVID-19 first began to engulf the world, supermarkets and grocery delivery platforms like Amazon Fresh and Instamart became overwhelmed with huge demands. To handle the surge of online orders, stores had to make drastic changes to accommodate the switch to on-demand delivery requests. Popular grocery delivery brands had to introduce waitlists and online queues for new customers. According to a poll, 53% of shoppers would continue online grocery shopping because they had a good experience, indicating that the on-demand grocery trend will continue post-pandemic. 

    mckinsey grocery report
    Mckinsey Grocery Report

    As shoppers prefer more digital channels in their path to purchase, the on-demand grocery trend is becoming much more significant for both consumers and brands. According to a McKinsey and company survey, frozen fruits, health care items, fresh fruits and vegetables, packaged foods, household care items, beverages, and deli meats categories are likely to remain popular among U.S. consumers post-pandemic. Meanwhile, CoreSight Research found that fresh fruits and vegetables were the biggest bestsellers from 2020-to 2021 followed by fresh dairy, meat, eggs, frozen food, and bread and baked goods. 

    Why Grocery Shoppers are going digital

    Online ordering offers a more personalized experience to shoppers as they get recommendations for products that are often bought together. When paired with data analysis and AI-powered algorithms, grocery stores could work on targeted marketing and offer quick delivery services. 

    1. Flexibility

    On-demand grocery shopping offers customers a wide range of delivery options, including subscription services, buy online pick up in-store, click and collect, option-based pricing, and much more. This offers choice and accessibility to modern customers looking for speed and convenience.

    2. Convenience

    With the increasing focus on social distancing and safety, shoppers started to rely on delivery services rather than waiting in long queues and risking exposure. The focus and priority of grocery shoppers shifted from discounts and pricing to convenience, speed, and safety. Online grocery shopping order methods also differ by generation. 40% of millennials prefer to shop groceries on mobile, and 52% prefer computers. Similarly, 66% of Gen X prefer to shop on computers, and only 27% prefer to shop on smartphones. 

    Grocery Shoppers are going digital
    Grocery Shoppers are going digital

    3. Speed

    The fierce competition in the on-demand grocery delivery space has led to small delivery times. Startups like GoPuff (30 minutes), and Jiffy (15 minutes) are competing with the big boys like Walmart and Amazon Fresh to deliver groceries in under an hour. Quick delivery options like two-hour delivery and same-day delivery have made it easier for customers to shop for fresh produce. Customers can quickly order a few items for a specific recipe and get it delivered within a few hours

    4. Multiple payment methods

    At store checkouts, cash and card are the only two acceptable options. Customers prefer to have more options in today’s modern world. Online grocery shopping makes buying easier by offering multiple payment options like PayPal, credit/debit cards, and monthly payment plans that negate the delivery fees for each delivery.

    How to successfully run a Grocery Delivery Business?

    The increasing demand for speed and convenience puts pressure on the grocery industry that faces inventory issues like fresh produce and product availability. However, the benefit of online grocery delivery services is that it provides insight into the end-to-end view of the customer journey. Grocery delivery brands can use the data to design services and models that meet customer demand and minimize costs across the supply and distribution chain. 

    If you’re a Grocery Delivery company and want to track your delivery time, or product catalogue so you can boost sales with an in-demand product assortment, or you want to drive more revenue & margin by making sure your products are priced right v/s your competition, reach out to us at DataWeave! Sign up for a demo with our team to know how we can help you optimize your online sales.

  • How Restaurants can use QSR Intelligence to Drive Sales

    How Restaurants can use QSR Intelligence to Drive Sales

    Quick service restaurants (QSR) are not only about delivering great food. They also have to overcome challenges like delivery, logistics, and affordable pricing, especially since covid-19 has staggered the entire industry. QSR intelligence helps restaurants get real-time insight into their performance across food delivery apps. With QSR intelligence, restaurants can identify the highest paying buyers across customer segments, demographics, and locations. Data-driven insights will help QSRs improve performance, decrease delivery time, optimize ad budget, and increase food quality – all with the goal to scale revenue and increase orders through food apps.

    The global fast food and quick service restaurant market are expected to grow at a CAGR of 5.1% from 2020 to 2027. The QSR industry is rapidly growing to encompass the changing needs of customers. 60% of U.S. consumers order delivery or takeout once a week and online ordering is growing 300% faster than in-house dining. With QSR intelligence, restaurants can get insights into metrics that will drive their profitability by helping them to fine-tune menus, enhance customer interaction, improve advertisements, and adjust inventory.

    Benefits of QSR Intelligence

    Continuous in-depth analysis of restaurant statistical data will help companies spot trends and devise strategies to improve sales via food apps. Here are a few benefits of QSR intelligence:

    a.    Improve estimates & minimize wait times

    QSR intelligence can help with accurate sales forecasting. With big data, restaurants can track their popular dishes or combos for various meal times to minimize wait times and increase delivery speed. It can also inform restaurants about upcoming trends, especially during holidays and festivals. Keeping an eye for trends will play a significant role in maximizing efficiency during food preparation and ensuring accurate food delivery ETAs.

    b.    Location-based promotions

    QSR intelligence allows restaurants to target customers based on their proximity to the restaurant. The food must be delivered at a particular time to the customers to enjoy the dish at the right temperature. QSRs can apply demographic intelligence to determine cancellation rates, delivery charges, and the proportion of demand and supply. These metrics will help QSRs to improve location-based promotions.

    c.    Increase ROI on deliveries

    To increase return on investment through food deliveries, QSRs can track metrics like location-based promotions, various payment options, ratings, etc. Tracking these metrics will help QSRs offer accurate ETAs, improve operational efficiency, and personalize services, which will increase revenue. Restaurants will also be able to understand where they can adjust their profit margins to increase revenue while maintaining a cumulative level of success.

    How to use QSR Intelligence

    a.    Assortment and availability

    The more restaurants can understand what and how their customers eat, the better they will be prepared to service those demands throughout the day. For example, QSRs can calibrate the menu, ingredients availability, and kitchen preparation time depending on their customers’ orders for lunch and dinner. This also helps optimize daily workflow, such as reorganizing staff to lower labor costs, optimizing the supply chain for ingredient delivery, and revamping the menu to offer better dishes. Another way to ensure your availability is to analyze your busiest hours and adjust the staff and delivery workforce accordingly. For example, if your customers tend to order more during breakfast, it’s worth considering opening your restaurant a bit earlier.

    QSR availability across 4 Food Delivery apps
    Availability across 4 QSR Food Delivery apps
    Availability trend during peak hours - Lunch & Dinner
    Availability trend during peak hours – Lunch & Dinner

    b.    Delivery time

    One of the most driving factors for the success of QSR is delivery time. Restaurants have to ensure the food is delivered as quickly as possible so customers can consume it at the right temperature. Data-driven insights can help restaurants track repeat addresses, find shortcuts or time-saving routes, and avoid unfamiliar or low delivery locations.

    QSRs have to analyze the entire delivery process from time taken to order on the app, how quickly kitchens can prepare orders, hand over to delivery partners, and get them to the customers. An essential part of QSRs is throughput, the speed at which they can process and deliver orders. During peak hours like lunch and dinner, faster service and quick ETAs ensure that customers do not choose other restaurants. If you have different menus for breakfast and other meals, ensure that your foodservice app can remove such menus when they are not available.

    Delivery Time Analysis
    Delivery Time Analysis
    Delivery Fee Analysis
    Delivery Fee Analysis

    c.    Pricing and Promotions

    QSRs have to understand customers’ price sensitivity while determining delivery costs and ensuring profitability for the business and delivery partners. Customers might look for free deliveries but not adding delivery charges might lead to loss. A deep dive into common transaction data across the locations will allow restaurants to understand the price sensitivity of all customer segments, helping them make intelligent pricing decisions.

    QSR intelligence can also help restaurants determine which delivery locations are most profitable. This helps to adjust the delivery radius, fee, and promotions. Restaurants can offer promo codes, coupons, referral codes, etc., to attract customers and encourage repeat purchases.

    d.    Discoverability

    Restaurants have to ensure that their dishes are on the first-page listing. With QSR intelligence on category analysis, keyword optimization, and competition analysis, restaurants can help their customers discover dishes. This also includes optimizing listings for pricing and rating and delivery fees and availability during peak times such as breakfast, lunch, and dinner.

    e.    Advertisement Optimizer

    QSRs can use data to optimize the advertisement budget and adequately improve return on investment. They can track the visibility of advertisement banners across locations and optimize them for different times of the day. Data analysis can also help restaurants understand which customer segments are more likely to convert to long-term loyalists. This data will help QSRs design personalized campaigns and align advertisement budgets while converting them to long-term customers, further improving the bottom line.

    Ad spends by identifying carousels with the highest visibility
    Ad spends by identifying carousels with the highest visibility
    Track QSRs performance across Carousels across multiple zip codes
    Track QSRs performance across Carousels across multiple zip codes

    f.     Growth & Expansion

    Upselling and cross-selling are two popular tactics that improve growth for quick-service restaurants. However, that requires a rich understanding of customers’ price sensitivity, preferences, and behavior. QSR intelligence can provide information about which upsell and cross-selling offers a customer segment is likely to value and which optimal channels for distributing the offer.

    Conclusion

    Quick service restaurants can track critical data points and use them to increase revenue and improve customer experience. Learning how to price, promote, and deliver food to customers during a pandemic can be challenging. QSR intelligence will help brands attract the right clientele, adjust inventory, reduce overall marketing costs, and increase order rates. This will also help increase customer loyalty across segments which can, in turn, increase the number of returning customers and profitability.

  • Quick Commerce in 2022: An Era of Hyperlocal Delivery

    Quick Commerce in 2022: An Era of Hyperlocal Delivery

    Busy lifestyles, urbanization, aging populations, and smaller households led to the preference for convenience and efficiency in eCommerce deliveries. However, the Covid-19 pandemic caused a massive shift in customer demand and buying decisions. The modern consumer journey moved from takeaway food to online shopping to quick or same-day deliveries. With evolving digital touchpoints, customers now favor fast deliveries and convenience. 

    According to a 2020 survey by KPMG in the UK, 43% of consumers chose next-day delivery, a 4% increase from last year. Interestingly, 17% of consumers abandoned a brand if they faced a longer delivery. Standard delivery time has shortened from 3 to 4 days and two-day shipping to next-day or same-day delivery. This increasing trend of quick delivery has led to the boom of quick commerce or Q-Commerce. Quick commerce or on-demand delivery refers to retailers that deliver goods in under an hour or as quickly as 10 minutes. The rise of Q-commerce is caused by changing consumer behavior and rising expectations since the pandemic. 

    In this blog, you’ll learn about quick commerce or Q-Commerce and its benefits. You’ll also read about factors to consider for quick commerce and tips to implement this business model. 

    1. What is Quick Commerce?

    on-demand delivery
    On-Demand Delivery

    Quick commerce or on-demand delivery is a set of sales and logistics processes that empowers eCommerce businesses, restaurants, grocery chains, and manufacturers to deliver products in less than 24-hours. A study shows that 41% of consumers are willing to pay for same-day delivery while 24% of customers will pay more to deliver their items within a one- or two-hour window.  

    Changing lifestyles and customer behavior directly impacted the rise of Q-Commerce. The takeaway food industry had used quick commerce for many years. But with Q-Commerce businesses consistently cutting delivery time, quick commerce for instant grocery delivery has become a new trend. For instance, India-based online grocery delivery firm Grofers rebranded to BlinkIt amid rising competition, promising 10-minute instant delivery. 

    2. How quick is Quick Commerce?

    The post-pandemic lifestyle & the rise in the number of small and single-person households has led to an increase in demand for products in small quantities that need to be delivered sooner than later. Sometimes in as little as 10 minutes! This trend is oriented towards specific products such as packed or fresh foods, Groceries, Food delivery, Gifts, Flowers, Medicines to name a few.

    quick delivery service
    Quick Commerce Categories

    Local shops that can reach more customers with less friction have swapped traditional brick-and-mortar warehouses to cater to an urban population. These online Q-Commerce stores can deliver goods from favorite stores and offer a vast choice of products that are available 24/7. However, it requires real-time inventory management, data-driven pricing management, innovative logistics technology, a fantastic rider community, and a proper assortment. 

    3. Factors to consider for Quick Commerce

    q commerce
    Competitive Assortment & Pricing

    a. Assortment

    With growing competition, getting product assortment right isn’t easy for quick commerce businesses, yet it’s critical to their success. To optimize assortment for quick commerce stores, they need to understand how demand differs between demographics and various stores. Since quick delivery involves packed and fresh products, it is even more essential to carry a unique assortment for each store. 

    Data analytics will help Q-Commerce businesses understand which products are repeatedly purchased in every store. It also helps identify high-demand gaps in your competitors’ platforms. Assortment analytics can help distinguish shifts in customer behavior across short- and long-term demands. The key to increasing sales is shaping inventory to match the overlap between market opportunity and consumer interest. With assortment analytics, they can determine the optimal mix of products for their daily inventory. 

    b. Pricing

    Pricing information is readily available on quick commerce businesses, allowing customers to compare prices before making purchase decisions. Before deciding on a product, shoppers actively track the best deals on platforms across various Q-Commerce delivery platforms. According to a survey, 31% of consumers rated price comparisons as the essential aspect of their shopping experience. Understanding price perception can help quick commerce companies to optimize their pricing strategy while remaining competitive. 

    A competitive pricing strategy does not imply that Q-Commerce businesses have to cut prices. Instead, it’s about adjusting prices relative to your competitors but not significantly impacting the bottom line. Competitive pricing provides real-time pricing updates, allowing quick commerce platforms to drive sales by nailing their pricing strategy. 

    c. Delivery Time

    delivery time
    Grocery Delivery Race In India

    Delivery time has become the game-changer in quick commerce, with platforms fighting over shorter delivery times. Unpredictable factors such as specific delivery windows, last-minute customer requests, and traffic congestion can wreak havoc in your planning. Optimizing your delivery time can improve operational efficiency through faster delivery, quick route planning, and driver monitoring. 

    Big eCommerce platforms like Amazon offer same-day or next-day delivery to prime members with no extra fee on minimum order criteria. The only demand of customers who do not worry about discounts or lower wholesale prices is quick delivery. The demand for quick delivery services has led to many global retailers offering same-day delivery to meet those expectations.

    d. Demand Forecasting

    Since quick commerce is a viable solution for certain products, businesses must determine what customers want and when they want it. Q-Commerce businesses can use historical data to predict future sales patterns with demand forecasting. It ensures that Q-Commerce businesses can limit wastages and their inventory can cater to a targeted market. Demand forecasting also helps to replenish stock based on real-time data. Furthermore, companies can identify bottlenecks and points of wastage in the supply chain with a demand-driven system in place.

    4. Benefits of Quick Commerce

    same day delivery
    Q-Commerce Benefits

    a. Competitive USP

    Q-Commerce businesses get new value propositions because customers that need immediate delivery are willing to try new brands and order from new stores. It also allows online Q-Commerce businesses to compete with global marketplaces and brick-and-mortar stores. 

    We at DataWeave have helped quick-service restaurants (QSRs) that are going the Q-Commerce route & selling via food aggregator apps to increase their revenue significantly. Our AI-Powered Food Analytic solutions have helped QSRs diagnose improvement areas, monitor key metrics, and drive 10-15% growth. Our data has helped them understand availability during peak times, monitor product visibility by region, track competitors, and choose suitable banners for promotion. Read more about that here.

    b. Increase margins

    A study from Deloitte suggests that 50% of online shoppers spend extra money to get convenient delivery of the products they need during the pandemic. These customers also paid extra for on-demand fulfillment and bought online pick-up in-store options. 

    Since the assortment of products in quick commerce is relatively small, Q-Commerce businesses can drive sales for their most profitable product lines. There is a potential for greater margins because wealthier demographics often require convenience. For instance, time-stranded professionals value convenience over discounts. 

    c. Customer experience is paramount

    With quick commerce, retailers can meet customer expectations and exceed them, fostering brand loyalty. Quick commerce addresses customer pain points such as running out of food before a small party or getting a birthday present for your friends. It can simply help people who cannot make it to the shop or stock up essentials.

    5. How to implement Quick Commerce

     quick delivery
    Implementation of Quick Commerce

    a. The need for local hubs

    To pack and deliver products in under an hour, businesses must be located close to the customers. Therefore, quick commerce relies on local warehouses that can serve customers in immediate proximity. Since the duration of two-wheelers is less likely to be impacted by heavy traffic or parking spaces, delivery services employ riders to deliver products.

    b. Ensure you have the right analytics in place

    Another essential part of running a quick commerce business is to have a web or phone application that can facilitate online ordering and offer accurate stock information to customers. Q-Commerce businesses also need a real-time inventory management tool that will provide insights into stock levels and allow for quick reordering and redistribution of products. This will also prevent deadstock and stockouts. 

    DataWeave’s Food Delivery Analytics product suite helps companies to increase order volumes, understand inventory, and optimize prices. It also provides access to discounts, offers, delivery charges, inventory, and final cart value across all your competitors. 

    c. It’s all about stock availability & assortment

    Q-Commerce in the Grocery Delivery space is excellent for specific product niches like packed or fresh foods and vegetables, drinks, gifts, cosmetics, and other CPG products that customers use every day.

    The stock assortment is as important in the Food Delivery space with restaurant chains like McDonald’s or Burger King that generate as much as 75% of their sales from online orders. These businesses have to make sure they’re carrying the most in-demand product assortment there is. 

    Conclusion

    same day delivery
    Same Day Delivery

    The rise of quick commerce represents the next big change in eCommerce, accompanied by a shift in consumer behavior towards online grocery shopping and food ordering. When positioned with proper assortment and pricing, instant delivery services can allow Q-Commerce businesses to capture the influx of consumers looking for speedy delivery. By tapping into big data from quick commerce markets, Q-Commerce businesses can gain insights into consumer demands. 

    If you’re a Q-Commerce business in the Food Delivery or Grocery Delivery space, reach out to our experts at DataWeave to learn how our solutions can help you understand the best Pricing Strategy, Delivery Time SLAs, Assortment Mix you need in order to successfully sell on Q-Commerce platforms. 

  • How Brands Can Outperform Rivals With Next-Gen Digital Shelf Analytics

    How Brands Can Outperform Rivals With Next-Gen Digital Shelf Analytics

    As eCommerce grows in complexity, brands need new ways to grow sales and market share. Right now, brands face urgent market pressures like out-of-stocks, an influx of new competition and rising inflation, all of which erode profitability. As online marketplaces mature, more brands need to make daily changes to their digital marketing strategies in response to these market pressures, shifts in demand, and competitive trends.

    eMarketer forecasts 2021 U.S. eCommerce will rise nearly 18% year-over-year (vs. 6.3% for brick-and-mortar), led by apparel and accessories, furniture, food and beverage, and health and personal care. The eCommerce industry is also undergoing fundamental changes with newer entities emerging and traditional business models evolving to adapt to the changed environment. For example, sales for delivery intermediaries such as Doordash, Instacart, Shipt, and Uber have gone from $8.8 billion in 2019 to an estimated $35.3 billion by the end of 2021. Similarly, many brands have established or are building out a Direct to Consumer (D2C) model so they can fully own and control their customer’s experiences.

    In response, DataWeave has launched the next generation of our Digital Shelf Analytics suite to help brands across retail categories directly address today’s costly market risks to drive eCommerce growth and gain a competitive advantage.

    Our new enhancements help brands improve online search rank visibility and quantify the impact of digital investments – especially in time for the busy holiday season.”  
    ~ Karthik Bettadapura, CEO and co-founder, DataWeave

    The latest product enhancements provide brands access to tailored dashboard views that track KPI achievements and trigger actionable alerts to improve online search rank visibility, protect product availability and optimize share of search 24/7. Dataweave’s Digital Shelf Analytics platform works seamlessly across all forms of eCommerce platforms and models – marketplaces, D2C websites and delivery intermediaries.

    Dashboard for Multiple Functions

    While all brands share a common objective of increasing sales and market share, their internal teams are often challenged to communicate and collaborate, given differing needs for competitive and performance data across varying job functions. As a result, teams face pressure to quickly grasp market trends and identify what’s holding their brands back.

    In response, DataWeave now offers executive-level and customized scorecard views, tailored to each user’s job function, with the ability to measure and assess marketplace changes across a growing list of online retail channels for metrics that matter most to each user. This enhancement enables data democratization and internal alignment to support goal achievement, such as boosting share of category and content effectiveness. The KPIs show aggregated trends, plus granular reasons that help to explain why and where brands can improve.

    Brands gain versatile insights serving users from executives to analysts and brand and customer managers.

    Prioritized, Actionable Insights

    As brands digitize more of their eCommerce and digital marketing processes, they accumulate an abundance of data to analyze to uncover actionable insights. This deluge of data makes it a challenge for brands to know exactly where to begin, create a strategy and determine the right KPIs to set to measure goal accomplishment.

    DataWeave’s Digital Shelf Analytics tool enables brands to effectively build a competitive online growth strategy. To boost online discoverability (Share of Search), brands can define their own product taxonomies across billions of data points aggregated across thousands of retailer websites. They can also create customized KPIs that track progress toward goal accomplishment, with the added capability of seeing recommended courses of action to take via email alerts when brands need to adjust their eCommerce plans for agility.

    “Brands need an integrated view of how to improve their discoverability
    and share of search by considering all touchpoints in the digital commerce ecosystem.”

    ~ Karthik Bettadapura, CEO and co-founder, DataWeave

    Of vital importance, amid today’s global supply chain challenges, brands gain detailed analysis on product inventory and availability, as well as specific insights and alerts that prompt them to solve out-of-stocks faster, which Deloitte reports is a growing concern of consumers (75% are worried about out-of-stocks) this holiday season.

    User and system generated alerts provide clarity to actionable steps to improving eCommerce effectiveness.
    You also have visibility to store-level product availability, and are alerted to recurring out-of-stock experiences.

    Scalable Insights – From Bird’s Eye to Granular Views

    DataWeave’s Digital Shelf Analytics allows brands to achieve data accuracy at scale, including reliable insights from a top-down and bottom-up perspective. For example, you can see a granular view of one SKUs product content alongside availability, or you can monitor a group of SKUs, say your best selling ones, at a higher level view with the ability to drill down into more detail.

    Brands can access flexible insights, ranging from strategic overviews to finer details explaining performance results.

    Many brands struggle with an inability to scale from a hyper-local eCommerce strategy to a global strategy. Most tools available on the market solve for one or the other, addressing opportunities at either a store-level basis or top-down basis – but not both.

    According to research by Boston Consulting Group and Google, advanced analytics and AI can drive more than 10% of sales growth for consumer packaged goods (CPG) companies, of which 5% comes directly from marketing. With DataWeave’s advanced analytics, AI and scalable insights, brands can set and follow global strategies while executing changes at a hyper-local level, using root-cause analysis to drill deeper into problems to find out why they are occurring.

    As more brands embrace eCommerce and many retailers localize their online assortment strategies, the need for analytical flexibility and granular visibility to insights becomes increasingly important. Google reports that search terms “near me” and “where to buy” have increased by more than 200% among mobile users in the last few years, as consumers seek to buy online locally.

    e-Retailers are now fine-tuning merchandising and promotional strategies at a hyper-local level based on differences seen in consumer’s localized search preferences, and DataWeave’s Digital Shelf Analytics solution provides brands visibility to retailer execution changes in near real-time.

    Competitive Benchmarking

    Brand leaders cannot make sound decisions without considering external factors in the competitive landscape, including rival brands’ pricing, promotion, content, availability, ratings and reviews, and retailer assortment. Dataweave’s Digital Shelf Analytics solution allows you to monitor share of search, search rankings and compare content (assessing attributes like number of images, presence of video, image resolution, etc.) across all competitors, which helps brands make more informed marketing decisions.

    Brands are also provided visibility into competitive insights at a granular level, allowing them to make actionable changes to their strategies to stay ahead of competitors’ moves. A new module called ‘Sales and Share’ now enables brands to benchmark sales performance alongside rivals’ and measure market share changes over time to evaluate and improve competitive positioning.

    Monitor competitive activity, spot emerging threats and immediately see how your performance compares to all rivals’, targeting ways to outmaneuver the competition.

    Sales & Market Share Estimates Correlated with Digital Shelf KPIs

    In a brick-and-mortar world, brands often use point of sale (POS) based measurement solutions from third party providers, such as Nielsen, to estimate market share. In the digital world, it is extremely difficult to get such estimates given the number of ways online orders are fulfilled by retailers and obtained by consumers. Dataweave’s Digital Shelf Analytics solution now provides sales and market share estimates via customer defined taxonomy, for large retailers like Amazon. Competitive sales and market share estimates can also be obtained at a SKU level so brands can easily benchmark their performance results.

    Additionally, sales and market share data can also be correlated with digital shelf KPIs. This gives an easy way for brands to check the effect of changes made to attributes, such as content and/or product availability, and how the changes impact sales and market share. Similarly, brands can see how modified search efforts, both organic and sponsored, correspond to changes in sales and market share estimates.

    Take Your Digital Shelf Growth to the Next Level

    The importance of accessing flexible, actionable insights and responding in real-time is growing exponentially as online is poised to account for an increasing proportion of brands’ total sales. With 24/7 digital shelf accessibility among consumers comes 24/7 visibility and the responsibility for brands to address sales and digital marketing opportunities in real-time to attract and serve online shoppers around the clock.

    Brands are turning to data analytics to address these new business opportunities, enhance customer satisfaction and loyalty, drive growth and gain a competitive advantage. Companies that adopt data-driven marketing strategies are six times more likely to be profitable year-over-year, and DataWeave is here to help your organization adopt these practices. To capitalize on the global online shopping boom, brands must invest in a digital shelf analytics solution now to effectively build their growth strategies and track measurable KPIs.

    DataWeave’s next-gen Digital Shelf Analytics enhancements now further a brand’s ability to monitor, analyze, and determine systems that enable faster and smarter decision-making and sales performance optimization. The results delight consumers by helping them find products they’re searching for, which boosts brand trust.

    Connect with us to learn how we can scale with your brand’s analytical needs. No project or region is too big or small, and we can start where you want and scale up to help you stay agile and competitive.