Category: D2C

  • Augmenting AI-powered Product Matching with Human Expertise to Achieve Unparalleled Accuracy

    Augmenting AI-powered Product Matching with Human Expertise to Achieve Unparalleled Accuracy

    In today’s expansive omnichannel commerce landscape, pricing intelligence has become indispensable for retailers seeking to stay competitive and refine their pricing strategies. The sheer magnitude of eCommerce, spanning thousands of websites, billions of SKUs, and various form factors, adds layers of complexity. Consequently, ensuring the accuracy and reliability of competitive insights presents a formidable challenge for retailers aiming to leverage pricing data effectively.

    At the core of any robust pricing intelligence system lies product matching. This process enables retailers to recognize identical or similar products across competitors. Once these matches are identified, tracking prices is a relatively more straightforward task, facilitating ongoing analysis and informed decision-making.

    Accurate matching is crucial for meaningful price comparisons and tailoring product assortments. The challenge is matching products is often complicated, especially for non-local brands, niche categories, or items lacking consistent global identifiers. It becomes even trickier when trying to match very similar but not identical products. A comprehensive approach that compares and analyzes multiple attributes like product titles, descriptions, images and more is essential.

    Artificial intelligence algorithms are commonly used to automate product matching, leveraging machine learning techniques to analyze patterns in images and text data. While AI can adapt and improve over time, the question remains: Can it fully address the complexities of product matching on its own?

    The reality is that many retailers still struggle with incomplete, inaccurate, or outdated product data, despite these AI-powered product matching solutions. This can lead to suboptimal pricing decisions, missed opportunities, and reduced competitiveness.

    Challenges in an ‘AI-only’ Approach to Product Matching

    While AI plays a vital role in automated product matching solutions, there are complexities that AI alone cannot fully address:

    Subjectivity in Matching Criteria

    Some product categories have subjective or hard-to-quantify criteria for determining similarity. AI learns from historical data, so it may struggle with nuanced aspects like:

    Aesthetics, style, and design: In the Fashion and Jewellery vertical, for example, products are matched according to attributes like style, aesthetics, design – all of which have some subjectivity involved.

    Quantity/packaging variations: In the grocery sector, variations in product packaging and quantities can introduce complexities that require subjective decision-making. For example, apples may be sold in different packaging like a 0.5 kg bag or a pack of 4 individual apples. Determining if these different packaging options should be considered equivalent often involves making a qualitative judgment call, rather than a clear-cut objective decision.

    Matching product sets: For categories like home furnishings, the focus is often on matching coordinated sets rather than individual items. For example, in the bedroom category, matching may involve grouping together an entire set of complementary furniture like a bed frame, dresser, and wardrobe based on their cohesive design and style. This goes beyond simply making one-to-one product associations, requiring more nuanced judgments about aesthetic coordination.

    Contextual Factor

    Products can have regional preferences, cultural differences, or evolving trends that impact how they are matched. AI may miss important context like Local/regional product names or distinct brand names across countries.

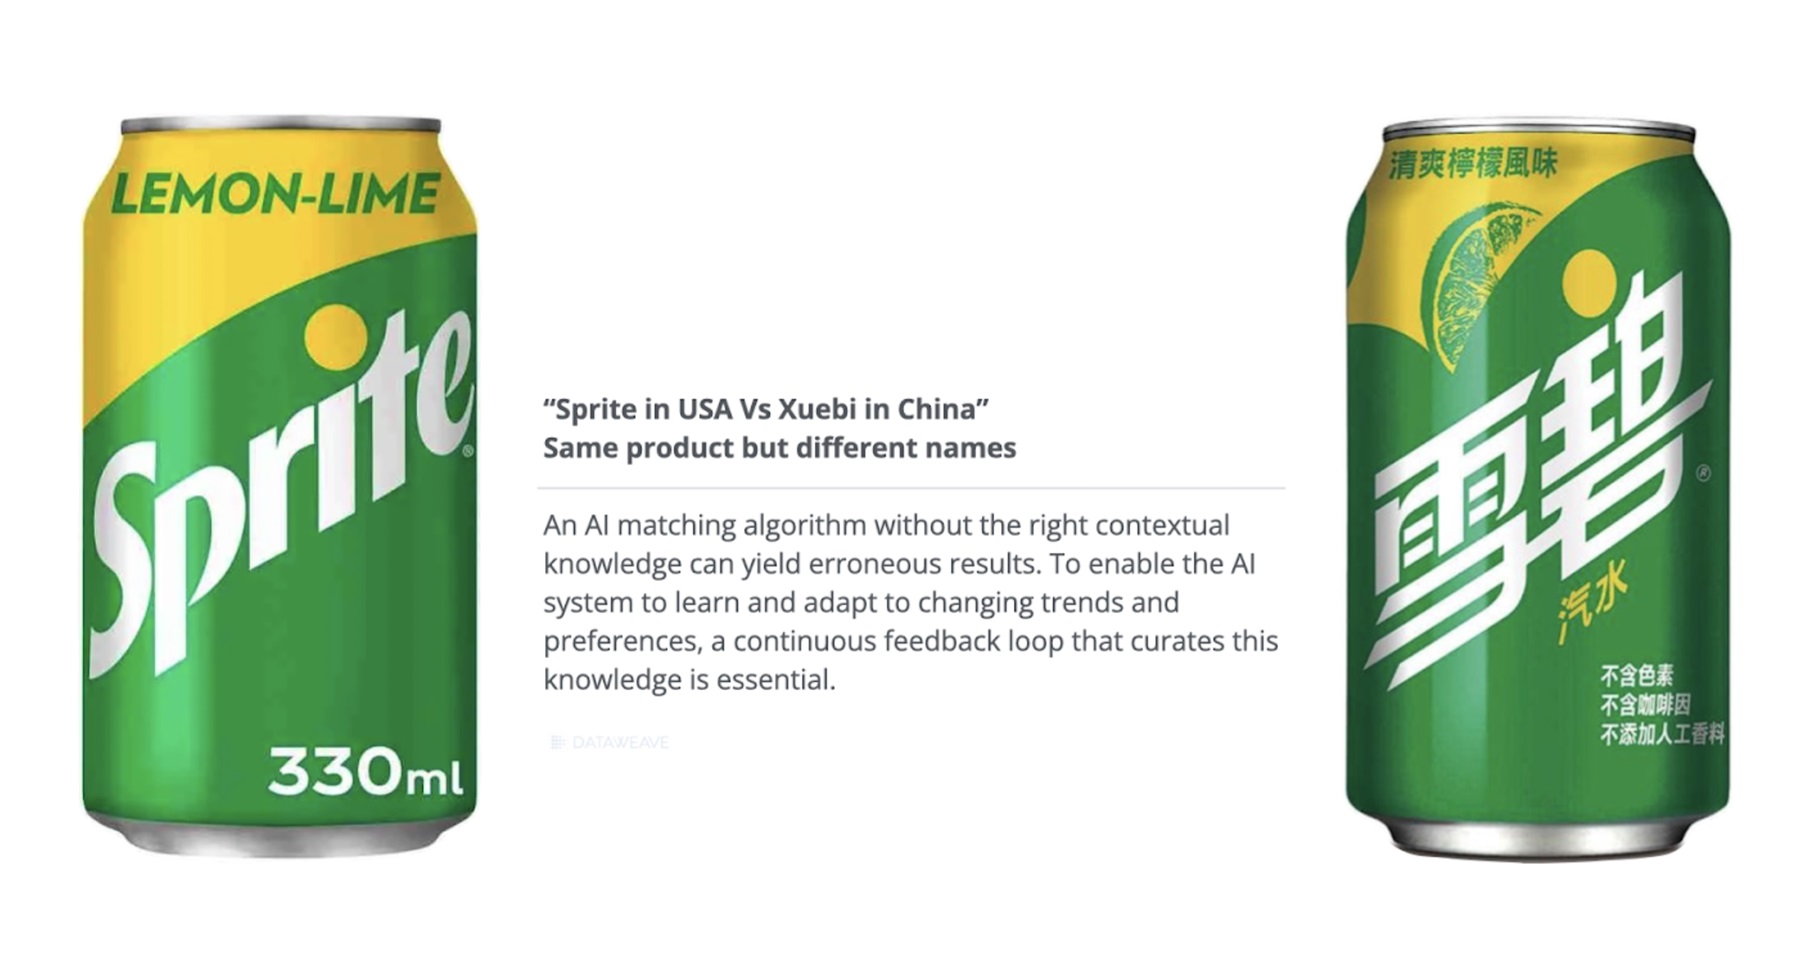
    For instance, in the image we see Sprite (in the US) is branded Xubei in China. Continuous human curation is needed to help AI adapt to this context.

    High Accuracy & Coverage Expectations

    Retailers rely on AI powered and automated pricing adjustments based on product matching for insight. To ensure that pricing recommendations and updates are accurate, accurate product matching is crucial. For this, simply identifying similar top results is not enough – the process must comprehensively capture all relevant matches. While AI excels at finding the top groupings with around 80% accuracy, even small matching errors can have significant consequences.

    As AI matching improves, customer expectations may rise even higher. If AI achieves 90% accuracy, for instance, SLAs may demand over 95%. Reaching such a high level of accuracy is very challenging for AI alone, especially when faced with incomplete data, contextual nuances, evolving trends, and subjective matching criteria across products and categories.

    The solution is to combine the power of AI with human expertise. This is the key to achieving true data veracity – the accuracy, freshness, and comprehensive coverage required for precise and reliable product matching.

    Human-in-the-Loop Approach for Elevated Product Matching

    Human intelligence and quality testing can elevate the AI powered product matching process by addressing key challenges:

    • Matching Validation: AI algorithms may identify product matches with 80-90% accuracy initially. Having humans validate these AI-suggested matches allows for correcting errors and pushing the accuracy close to 100%. As humans flag issues, provide context, and re-label incorrect predictions, it allows the AI model to learn and enhance its reliability for complex, high-stakes decisions.
    • Applying Contextual Judgment: For subjective matching criteria like aesthetics, design, and categorizing product sets, human discernment is needed. Humans can make nuanced judgments beyond just quantitative rules, ensuring meaningful apples-to-apples product comparisons. Their contextual understanding augments AI’s capabilities.
    • Continuous Learning Via Feedback Loop: Product experts possess rich category knowledge across markets. Integrating this human insight through an iterative feedback loop helps AI models quickly learn and adapt to changing trends, preferences, and context. As humans explain their match assessments, the AI continuously enhances its precision over time.

    By combining AI’s automation and scale with human validation, judgment, and knowledge curation, pricing intelligence solutions can achieve the accuracy and coverage demanded for actionable competitive pricing insights.

    DataWeave’s Data Veracity Framework: A Scalable Workflow Combining AI and Human Expertise

    Given the vast number of products, retailers, and brands that exist today, any product matching solution must be highly scalable. At DataWeave, we bring you such a scalable workflow to address these complexities by integrating human expertise with AI-driven automation. The image below outlines our approach for combining AI with human intelligence in a seamless, scalable workflow for accurate product matching:

    Retailers and brands can benefit in several ways with this workflow, as listed below.

    Several Rounds of Data Verification Due to Hierarchical Validation Teams

    The workflow employs a hierarchical validation team of Leads and Executives to efficiently integrate human expertise without creating bottlenecks. Verification Leads play a pivotal role in managing the distribution of product matches identified by DataWeave’s AI model to the Verification Executives.

    The Executives then meticulously validate these AI-suggested matches, adding any missing product associations and removing inaccurate matches. After validation, the matched product groups are sent back to the Leads, who perform random sampling checks to ensure quality.

    Throughout this entire workflow, feedback and suggestions are continuously gathered from both the Executives and Leads. This curated input is then incorporated back into DataWeave’s AI model, allowing it to learn and improve its matching accuracy on an ongoing basis.

    This hierarchical structure ensures that human validation seamlessly scales alongside the AI’s matching capabilities. Leveraging the respective strengths of AI automation and human expertise in an iterative feedback loop prevents operational bottlenecks while steadily elevating overall accuracy.

    Confidence-based Distribution of Matched Articles for Validation

    The AI model assigns confidence scores, differentiating high-confidence (>95%) and low-confidence matches. For high-confidence groups, executives simply remove incorrect matches – a quicker process. Low-confidence matches require more human effort in adding/removing matches.

    As the AI model improves over time with feedback, the share of high-confidence matches increases, making validation more efficient and swift.

    Automated, Standardized Process with Iterative Feedback Loop

    The entire workflow is standardized and automated, with verification metrics seamlessly tracked. At each step, feedback captured from both leads and executives flows back into the AI, enhancing its matching accuracy and coverage iteratively.

    DataWeave’s closed-loop system of AI automation with hierarchical human validation allows product matching to achieve comprehensive accuracy at a vast scale.

    Unleash the Power Accurate and Comprehensive Product Matching

    In summary, combining AI and human expertise in product matching is crucial for retailers navigating the complexities of omnichannel retail. While AI algorithms excel in automation, they often struggle with subjective criteria and contextual nuances. DataWeave’s approach integrates AI-driven automation with human validation, delivering the industry’s most accurate product matching capabilities, enabling actionable competitive pricing insights.

    To learn more, reach out to us today!

  • The Indian E-Commerce Showdown: Unveiling the Price War Between Flipkart’s Big Billion Days and Amazon’s Great Indian Festival

    The Indian E-Commerce Showdown: Unveiling the Price War Between Flipkart’s Big Billion Days and Amazon’s Great Indian Festival

    India’s homegrown eCommerce giant Flipkart, now backed by Walmart, reported a record 1.4 Billion customer visits during the early access phase and throughout the seven days of its premier shopping event, the Big Billion Days, launched on 8th October 2023. Competing with Flipkart, Amazon’s Great Indian Festival sale event started on October 8th as well and saw a whopping 95 Million customer visits to the website within the first 48 hours of the event.

    For consumers, the most pressing question was, “Who offered more attractive deals and lower prices during these sale events?”

    To answer this question, we leveraged our proprietary data aggregation and analysis platform and analyzed the prices and discounts on Amazon and Flipkart across key product categories..

    The details of our sample are mentioned below:

    • Number of SKUs Analyzed: 30,000+
    • Websites: Amazon.com and Flipkart.com
    • Categories: Apparel, Home & Furniture, Electronics, Health & Beauty
    • Dates: 7th Oct 2023 to 22nd Oct 2023

    Key Findings

    Based on our analysis, the Big Billion Days by Flipkart showcased relatively higher price reductions across categories compared to the Great Indian Festival sale by Amazon. The Apparel category on Flipkart saw the highest average discount at 50.6%. The Health & Beauty category had the lowest discount across Flipkart at 39.4% and Amazon at 33%.

    Overall, Flipkart offered higher discounts in each product category. It is clear that the retailer invested heavily in leveraging its supplier partnerships with key brands or sellers to enable them to offer higher discounts, thereby attracting more customers.

    Next, let’s take a closer look at each product category.

    Apparel

    While a majority of retailers expected demand for apparel and clothing to dip this festive season in India, eCommerce giants like Amazon and Flipkart are likely to recognize the strong consumer inclination towards apparel during this period.

    In the detailed assessment of Apparel sub-categories, Women’s Dresses, Women’s Tops, Men’s Shirts, Men’s Shoes, and Women’s Innerwear emerged as the segments showcasing the most substantial discounts during the sale events. While Flipkart offered higher average discounts across all sub-categories, Amazon offered competitive discounts as well.

    We observed significant differences in the average discounts across brands between Flipkart’s Big Billion Days and Amazon’s Great Indian Festival. Reinforcing the significant discounts on the Shoes subcategory, brands like Red Tape, Arrow, Adidas, Reebok, Nike, and more offered extensive discounts on both Flipkart and Amazon. Notably, Adidas and Reebok offered better deals on Amazon’s Great Indian Festival as compared to Flipkart.

    One8 by Virat Kohli had a significantly lower discount on Amazon compared to Flipkart, indicating an exclusive partnership.

    For brands, however, reducing prices is just one approach to entice shoppers. They must also guarantee their prominent presence and easy discoverability within Amazon and Flipkart search results. To gain insight into this, we monitored brands’ Share of Search across various frequently used search terms in addition to the discounts they provided. The Share of Search denotes the portion of a brand’s products within the top 20 search results for a specific search query.

    Our data indicates that Jockey and Speedo gained in Share of Search on Flipkart, but reduced discoverability on Amazon. Van Heusen fell behind in search results on Flipkart but showed a higher Share of Search on Amazon.

    Home & Furniture

    With demand for home and furniture products picking up in October, right before the festive season, Amazon and Flipkart offered significant discounts in this category.

    Discounts on both Amazon and Flipkart hovered around 50%. Across a few subcategories, Flipkart offered slightly lower discounts compared to Amazon. Only Luggage, Rugs, Sofas, and Entertainment Units saw lower markdowns on Flipkart during the Big Billion Days. 

    Dishwashers and Washer/ Dryers saw higher discounts on Amazon compared to Flipkart. The significant discounts on these products on Amazon possibly point to changing consumer preferences, as demand for these products is traditionally low in India, but seems to be growing.

    When it comes to Home & Furniture brands, Nasher Miles, Safari, Aristocrat, VIP, and American Tourister, luggage brands mostly, offered higher discounts on Flipkart, followed closely by Amazon.

    In terms of Share of Search, Skybags had high discoverability on both Flipkart and Amazon. The brand leveraged a strategy of offering big discounts this festive season as well as ensuring prominent placement in search results. Wildcraft lost out on its discoverability on Flipkart in contrast to its prominence on Amazon. Duroflex saw lower searchability on Amazon compared to Flipkart’s Big Billion Days.

    Consumer Electronics

    The Consumer Electronics and Appliances Manufacturers Association (CEAMA) expected an uptick in sales of consumer electronics products this festive season in India. With more consumers buying premium products using credit cards and EMIs, demand for expensive, high-end electronics was expected to increase.

    Again, average discounts in this category hovered around 50% on Flipkart and Amazon.

    Across electronics subcategories, Smartwatches, Earbuds, and Drones had the highest markdowns with Flipkart leading the pack during the Big Billion Days. Amazon offered relatively higher discounts at 44.9% on the TV subcategory, compared to Flipkart’s 40.6%.

    Speakers, Laptops, Smartphones, and Tablets also saw lower markdowns on Amazon compared to Flipkart. Amazon was the official partner for the launch of many high-level smartphones and products in September-October, contributing to the higher markdowns in the subcategory.

    Across brands, Lenovo’s discounts were the most differentiated between the two sites, with the brand offering higher discounts on Amazon (45.4%) compared to Flipkart (24.7%). Noise offered the highest discounts at 72.5% on Amazon and 52.8% on Flipkart. Brands like Boat and Zebronics, also saw lower discounts on Flipkart.

    Mi and JBL offered deeper discounts on Flipkart’s Big Billion Days. Apple meanwhile stands out with only 11.83% discounts on Amazon, but the brand offered impressive 31.4% discounts on Flipkart.

    Samsung dominated the Share of Search on Amazon at 15.7%, compared to only 2.6% on Flipkart. Apple and Lenovo also saw higher discoverability on Amazon. On Flipkart, JBL and Skullcandy stand out as brands with high search visibility.

    Health & Beauty

    The Health & Beauty category saw the lowest markdowns with only 39.4% discounts on Flipkart and 33% on Amazon.

    In the subcategories analyzed, Electric Toothbrushes had relatively high markdowns across both sites. Staple and lower priced subcategories like Toothpaste had the lowest markdowns across both sale events, with Amazon offering only 17.4% average discounts.

    Across brands, Beardo, a leading beard care brand, offered significantly higher discounts on Amazon compared to Flipkart. Most other well-known brands, including Nivea and Vaseline, saw higher discounts on Amazon compared to Flipkart. Only Tresmme and Dove were exceptions with higher discounts on Flipkart.

    In terms of Share of Search, once again, Beardo was the most discoverable brand in this category. Brands like Dove, Pond’s, Swiss Beauty, and Tresemme saw a lower Share of Search on Flipkart compared to Amazon.

    Navigating the Competitive Landscape: How To Thrive During Sale Events

    Amazon and Flipkart’s strategic pricing during the Big Billion Days and the Great Indian Festival Sale reflects a balance of profitability, inventory, and competition. Competitive pricing insights empower retailers to make informed decisions, optimize strategies, and thrive during high-stakes sale events with timely and relevant insights at a massive scale.

    To learn more about how you can leverage competitive pricing insights to stay ahead of the game during sale events, reach out to us today!

  • From Data to Dollars: How Digital Shelf Analytics Drives Tangible Business Impact and ROI for Brands

    From Data to Dollars: How Digital Shelf Analytics Drives Tangible Business Impact and ROI for Brands

    For consumer brands, the digital marketplace presents an unparalleled landscape of opportunities for engaging with consumers and expanding their market presence. Within this dynamic environment, Digital Shelf Analytics has emerged as a crucial pillar in a brand’s eCommerce strategy. This technology provides valuable insights into a brand’s organic and paid visibility on marketplaces, content quality, pricing strategies, promotional efforts, and product availability. These insights help brands gain a comprehensive understanding of their competitive positioning and overall market performance.

    Nevertheless, many brands often grapple with the question of whether this understanding translates into tangible actions that drive real business impact and return on investment (ROI). This uncertainty stems from a lack of clarity about the direct correlation between digital shelf insights and key metrics such as enhanced sales conversions.

    Nonetheless, there is compelling evidence that when these insights are effectively harnessed and strategic actions are taken, brands can realize significant, measurable benefits.

    So, the question arises: does Digital Shelf Analytics genuinely deliver on its promises?

    At DataWeave, we’ve partnered with numerous brands to fuel their eCommerce growth through the application of digital shelf analytics. In this article, we will delve into these insights, uncovering the concrete and quantifiable results that brands can achieve through their investments in digital shelf analytics.

    Digital Shelf KPIs and Their Impact

    Digital Shelf Analytics is a robust system that analyzes specific key performance indicators (KPIs) about the digital shelf, furnishing brands with precise recommendations to not only bolster these KPIs but also to monitor the enhancements over time. The following is a brief explanation of digital shelf KPis and their expected impact areas:

    Product Availability: Ensuring Shoppers Never Hear “Out of Stock” Again

    Timely insights on the availability of products ensures brands reduce replenishment times at scale, which can significantly impact sales, creating an unbreakable link between product availability and revenue. With Digital Shelf Analytics, procurement and replenishment teams can set up notifications to promptly identify low or out-of-stock items and take swift action. This can also be done for specific ZIP codes or individual stores. In addition, availability plays a crucial role in a brand’s Share of Search and search rankings, as online marketplaces often ensure only in-stock products are shown among the top ranks.

    Share of Search: Dominating the Digital Aisles

    If a product isn’t visible, does it even exist? In fact, 70% of consumers never go beyond the first page of search results on major online marketplaces. Therefore, as a brand, the visibility of your products for relevant search keywords and their appearance on the first page can heavily determine your awareness metrics. This is where the concept of Share of Search comes into play. Think of it as securing prime shelf space in a physical store. Digital shelf insights and benchmarking with category leaders for Share of Search help ensure your products command relevant attention on the digital shelf.

    Content Quality: Crafting the Perfect Product Story

    Creating engaging product descriptions and visuals is akin to giving your products a megaphone in a crowded marketplace. By enhancing content quality, including product names, titles, descriptions, and images, brands can climb the search result rankings, leading to increased visibility and subsequently, more sales.

    Ratings and Reviews: The Power of Social Proof

    Public opinion holds immense sway. Research indicates that a single positive review can trigger a 10% surge in sales, while a multitude of favorable reviews can propel your product to a 44% higher trajectory. The correlation between ratings and sales is not surprising—each step up the rating ladder can translate to substantial revenue growth.

    While it’s reasonable to anticipate a connection between these KPIs and downstream impact metrics such as impressions, clicks, and conversions, we were driven to explore this correlation through the lens of real-world data. To do so, we meticulously monitored the digital shelf KPIs for one of our clients and analyzed the improvements in these metrics.

    It’s essential to acknowledge that not all observed impact areas can be solely attributed to enhancements in digital shelf KPIs. Still, it’s evident that a robust correlation exists. The following section presents an in-depth case study, shedding light on the results of this analysis.

    A Success Story: Real-World Impact of Digital Shelf Analytics

    Let’s dive into the journey of one of our clients – a prominent CPG brand specializing in the sale of baked goods and desserts. Through their experience, we will illustrate the transformative impact of our DataWeave Digital Shelf Analytics product suite.

    Over a period of one year, from August 2022 to July 2023, the brand leveraged several key modules of Digital Shelf Analytics for Amazon, including Share of Search, Share of Category, Availability, Ratings and Reviews, and Content Audit. Each of these digital shelf KPIs played a vital role in shaping the brand’s performance across various stages of the buyer’s journey.

    The buyer’s journey is typically delineated into three key stages:

    • Awareness: At this stage, shoppers peruse multiple product options presented on search and category listing pages, gaining an initial understanding of the available choices.
    • Consideration: Here, shoppers narrow down their selections and evaluate a handful of products, moving closer to a purchase decision.
    • Conversion: In this final stage, shoppers make their ultimate product choice and proceed to complete the purchase.

    Let’s now examine the data to understand how digital shelf KPIs helped drive tangible ROI on Amazon for the brand across the stages of the buyer journey.

    Stage 1: Raising Awareness

    Enhancing Share of Search and Share of Category can help brands boost product visibility and raise brand awareness. The following chart demonstrates the steady, incremental improvements in our client’s Share of Search and Share of Category (in the top 20 ranks of each listing page) throughout the analyzed period. These enhancements were achieved through various measures, including product sponsorship, content enhancement, price optimization, promotional initiatives, and more.

    This amplified Share of Search and Share of Category directly translates into improved product discoverability, as evident from the surge in impressions depicted in the chart below.

    Stage 2: All Things Considered

    In the consideration stage, shoppers make their product selections by clicking on items that meet their criteria, which may include factors like average rating, number of ratings, price, product title, and images. For brands, this underscores the importance of crafting meticulously detailed product content and accumulating a substantial number of ratings.

    The subsequent chart illustrates the year-long trend in both average ratings and the number of ratings, both of which have displayed steady improvement over time.

    The enhancements in the number of ratings and the average rating have a direct and positive impact on product consideration. This, in turn, has led to a noticeable year-over-year increase in page views, as indicated in the chart below.

    These improvements are likely to have also been influenced by the overall enhancement of content quality, which is detailed separately in the section below.

    Stage 3: Driving Decisions

    As buyers progress to the next stage, they reach the pivotal point of making a purchase decision. This decision is influenced by multiple factors, including product availability, content quality, and the quality of reviews, reflecting customer sentiment.

    Our client effectively harnessed our Availability insights, significantly reducing the likelihood of potential out-of-stock scenarios and enhancing replenishment rates, as highlighted in the chart below. The same chart also indicates improvements in content quality, measured by the degree to which the content on Amazon aligns with the brand’s ideal content standards.

    Below, you’ll find the year-over-year growth in conversion rates for the brand on Amazon. This metric stands as the ultimate measure of business impact, directly translating into increased revenue for brands.

    As the data uncovers, growth in key digital shelf KPIs cumulatively had a strong correlation with impressions, page views, and conversion rates.

    It is also important to note that the effect of each KPI cannot be viewed in isolation, since they are often interdependent. For example, improvement in content and availability could boost Share of Search. Accurate content could also influence more positive customer feedback. Brands need to consider optimizing digital shelf KPIs holistically to create sustained business impact.

    Impact on eCommerce Sales

    After the implementation of digital shelf analytics, the results spoke for themselves. Sales consistently outperformed the previous year’s records month after month. As shown in the chart below, the diligent application of DataWeave’s recommendations paved the way for an impressive 8.5% year-over-year increase in sales, leaving an indelible mark on the brand’s eCommerce success.

    From boosting product visibility to catapulting conversion rates, Digital Shelf Analytics serves as the key to unlocking unparalleled online success.

    While the success story detailed above does not establish a direct causation between Digital Shelf Analytics and sales revenue, there is undoubtedly a strong correlation. It’s evident that digital shelf KPIs play a pivotal role in optimizing a brand’s eCommerce performance across all stages of the buyer journey. Hence, for brands, it is vital that they collaborate with the right partner and harness digital shelf insights to fine-tune their eCommerce strategies and tactics.

    That said, the eCommerce landscape is in a constant state of flux, and there is still much to learn about how each digital shelf KPI influences brand performance in the online realm. With more data and an increasing number of brands embracing Digital Shelf Analytics, it’s only a matter of time before a direct causation is firmly established.

    Reach out to us today to know more about how your brand can leverage Digital Shelf Analytics to drive higher sales and market share in eCommerce.

  • 2021 Cost-Push Inflationary Trends Ran Rampant, Impacting Holiday Discounts

    2021 Cost-Push Inflationary Trends Ran Rampant, Impacting Holiday Discounts

    Business has been anything but usual this holiday season, especially in the digital retail world. The holiday hustle and bustle historically seen in stores was once again occurring online, but not as anticipated given the current strength of consumer demand and the reemergence of COVID-19 limiting in-store traffic. While ‘Cyber Weekend’, Thanksgiving through Cyber Monday, continues to further its importance to retailers and brands, this year’s performance fell short of expectation due to product shortages and earlier promotions that pulled forward holiday demand.

    Holiday promotions were seen beginning as early as October in order to compete with 2020 Prime Day sales, but discounting, pricing and availability took an opposite direction from usual. This shift influenced our team to get a jump start on our 2021 digital holiday analysis to assess how drastic the changes were versus 2020 activity, and to understand how much of this change has been influenced by inflationary pressures and product scarcity.

    Scarcity Becomes a Reality

    Our initial analysis started by reviewing year-over-year product availability and pricing changes from January through September 2021, leading up to the holiday season, as detailed in our 2021 Cyber Weekend Preliminary Insights blog. We reviewed popular holiday categories like apparel, electronics, and toys, to have a broad sense of notable trends seen consistently throughout various, applicable marketplaces. What we found was a consistent decline in product availability over the last six months compared to last year, alongside an increase in prices.

    Although retailers significantly improved stock availability in November and early December 2021, even digital commerce giants like Amazon and Target were challenged to maintain consistent product availability on their website as seen below. While small in magnitude, there is also a declining trend occurring again closer toward the end of our analysis period, post Cyber Weekend, across all websites included in our analysis.

    Inventory Availability 2021 Holidays
    Source: Commerce Intelligence – Product Availability insights for Home & Garden, Jewelry & Watches, Clothing & Shoes, Bed N Bath, Lighting & Ceiling Fans categories

    Greater Discounts, Higher Prices?

    With inflation at a thirty-nine year high, retailers and manufacturers have realized they can command higher prices without impacting demand as consumers have shown their willingness to pay the price, especially when threatened by product scarcity. Our assessment is that while some products and categories have responded drastically, manufacturers’ suggested retail prices (MSRPs) have increased nearly seven percent on average from January to December 2021. MSRP adjustments are not taken lightly either, as this is an indication increased prices will be part of a longer-term shift in product strategy.

    2021 MoM Retail Inflation Tracker
    Source: Commerce Intelligence – Pricing Insights for Bed & Bath, Electronics, Furniture, Healthy & Beauty, and Fashion categories on Amazon.com & Target.com each month in 2021 comparing price increases from January 2021 base

    Our 2021 pre-Cyber Weekend analysis reviewed MSRP changes for select categories (Bed & Bath, Electronics, Furniture, Healthy & Beauty, and Fashion) on Amazon and Target.com, and found around forty-eight percent of products on Amazon and thirty-five percent of products on Target.com have increased their MSRPs year-over-year, but kept pre-holiday discount percentages the same.

    Looking more specifically as to what year-over-year changes occurred on Black Friday in 2021, we observed MSRPs increasing across the board for all categories at various magnitudes. This indicates why 2021 discounts appeared to be greater than or equivalent to 2020 for many categories, when in reality consumers paid a higher price than they would have in 2020 for the same items.

    2021 Black Friday MSRP Increases
    Source: Commerce Intelligence – MSRP Pricing Insights for Bed & Bath, Electronics, Furniture, Healthy & Beauty, and Fashion categories on Black Friday November 27th, 2021, versus average MSRP pricing for the same SKU count from November 20-26th 2021

    On Amazon.com, categories like health & beauty have already increase MSRPs by a much greater percentage and magnitude versus Target.com leading up to and during Black Friday 2021, while other categories like furniture have increased MSRPs evenly on average across both retail websites. The below chart cites a few specific examples of year-over-year SKU-level MSRP, promotional price, and discount changes within found within the electronics, furniture, fashion, and health & beauty categories.

    Black Friday 2021 vs. 2020 SKU-level Price Changes
    Source: Commerce Intelligence – MSRP Pricing Insights for Bed & Bath, Electronics, Furniture, Healthy & Beauty, and Fashion categories on Black Friday November 27th, 2021, versus average MSRP pricing for the same SKUs on Black Friday November 26th, 2020.

    Fewer, but Deeper Discounts

    From October through early November 2021, fewer products were discounted compared to this same period in 2020, and the few that were saw much deeper discounts apart from the home improvement category. The most extreme example we saw in discounts offered was within furniture where only three percent of SKUs were on discount in 2021 compared to twenty-six percent in 2020. Interestingly, the magnitude of discount was also higher pre-Cyber Weekend 2021 versus 2020, but this trend was not exclusive to furniture and was also seen within electronics, health & beauty, and home improvement.

    Pre-Black Friday 2021 and 2020 SKUs on Discount and Magnitude
    Source: Commerce Intelligence – Pricing Insights for Bed & Bath, Electronics, Furniture, Healthy & Beauty, and Fashion categories on Amazon.com & Target.com Pre-Black Friday average selling price during November 20-26th 2021 versus average selling price from November 13-19th 2021 compared to Pre-Black Friday average selling price during November 19-25th 2020 versus average selling price from November 12-18th, 2020.

    Within the furniture category, the subcategories offering the greatest number of SKUs with price decreases on Black Friday 2021 were rugs by a wide margin, followed by cabinets, bed and bath, and entertainment units, but the magnitude of discounts offered were all under twenty percent.

    2021 Black Friday Furniture Category Price Decreases
    Source: Commerce Intelligence – Pricing Insights for Bed & Bath, Electronics, Furniture, Healthy & Beauty, and Fashion categories on Amazon.com and Target.com on Black Friday November 27th, 2021, versus average pricing for the same SKUs from Pre-Black Friday November 20-26th 2021 and Black Friday November 26th, 2020, versus average pricing for the same SKUs from Pre-Black Friday November 19th-25th 2020

    Accounting for this phenomenon could have been retailers’ attempts to clear inventory for SKUs which hadn’t sold even during the period of severe supply chain shortages. With more products selling at higher prices this year, retailers were also able to use fewer SKUs with greater discounts to attract buyer in hopes of filling their digital baskets with more full-priced goods, helping to protect margins heading in to Cyber Weekend. Scarcity threats also encouraged consumers to buy early, even when not on promotion, to ensure they would have gifts in time for the holidays.

    The same trends seen pre-Cyber Weekend 2021 were also seen on Black Friday with a year-over-year decrease in the percentage of SKUs offered on discount versus 2020, and steeper price reductions for the discounted products which can also be attributed to the increase in MSRPs.

    Black Friday 2021 and 2020 SKUs on Discount and Magnitude
    Source: Commerce Intelligence – Pricing Insights for Bed & Bath, Electronics, Furniture, Healthy & Beauty, and Fashion categories on Amazon.com and Target.com on Black Friday November 27th, 2021, versus average pricing for the same SKUs from Pre-Black Friday November 20-26th 2021 and Black Friday November 26th, 2020, versus average pricing for the same SKUs from Pre-Black Friday November 19th-25th 2020

    2021 Black Friday Price Increases?

    We all know Black Friday is all about price reductions, discounts and deals and so it’s rare to see actual price increases, yet for Black Friday 2021, trends ran counter to this. We observed price increases across all categories for around thirteen to nineteen percent of SKUs, with an average price increase of around fifteen percent in 2021 versus an average of only two percent in 2020.

    SKUs with Price Increases Black Friday 2021 and 2020
    Source: Commerce Intelligence – Pricing Insights for Bed & Bath, Electronics, Furniture, Healthy & Beauty, and Fashion categories on Amazon.com and Target.com on Black Friday November 27th, 2021, versus pricing for the same SKUs from Pre-Black Friday November 20-26th 2021 and Black Friday November 26th, 2020, versus average pricing for the same SKUs from Pre-Black Friday November 19th-25th 2020

    At an account level, we noticed a few interesting differences happening on Black Friday 2021 versus 2020 regarding category price changes. On Target.com, almost ninety percent of the bed and bath SKUs analyzed had a price change on Black Friday in 2021 versus 2020 with eighty-two percent presenting a higher price year-over-year versus only around seven percent showing a decrease, where on Amazon nearly forty-four percent of bed and bath SKUs showed an increase in price and around thirty-eight percent showed a decrease. Except for the health and beauty category on Target.com, more than half of the SKUs in each category saw a price increase on Black Friday versus a price decrease.

    2021 YoY Price Changes on Black Friday
    Source: Commerce Intelligence – Pricing Insights for Bed & Bath, Electronics, Furniture, Healthy & Beauty, and Fashion categories on Amazon.com and Target.com on Black Friday November 27th, 2021, versus average pricing for the same SKUs on Black Friday November 26th, 2020.

    The magnitude of year-over-year price changes seen on Black Friday 2021 was significant across all categories, but the magnitude of price increases found on Amazon.com within the health and beauty category outpaced the rest by far. We reviewed three hundred and sixty-five SKUs on Amazon.com within the health & beauty category and saw almost eighty-three percent of them had a price change with around thirty-one percent decreasing prices and around fifty-two percent increasing prices. This means that within the health & beauty category on Amazon.com, more than fifty percent of the SKUs tracked were sold at a one hundred and seventy-six percent higher price on average during Black Friday 2021 versus 2020.

    Magnitude of Black Friday 2021 Price Increases
    Source: Commerce Intelligence – Pricing Insights for Bed & Bath, Electronics, Furniture, Healthy & Beauty, and Fashion categories on Amazon.com and Target.com on Black Friday November 27th, 2021, versus average pricing for the same SKUs on Black Friday November 26th, 2020.

    The subcategories offering the greatest number of SKUs with price increases on Black Friday 2021 were cameras, followed by men’s fragrances, laptops, and desktops & accessories, but the magnitude of discounts offered were all under ten percent.

    2021 Subcategories with Price Increases during Black Friday
    Source: Commerce Intelligence – Pricing Insights for Bed & Bath, Electronics, Furniture, Healthy & Beauty, and Fashion categories on Amazon.com and Target.com on Black Friday November 27th, 2021, versus pricing for the same SKUs from Pre-Black Friday November 20-26th 2021 and Black Friday November 26th, 2020, versus average pricing for the same SKUs from Pre-Black Friday November 19th-25th 2020

    The Aftermath Post-2021 Cyber Weekend

    Extending this analysis beyond the holiday weekend, we analyzed price change activity from December third through the ninth across the top US retailers (chart below) and found that price decreases have been very minimal, comparatively speaking. Though there was a spike in number of price decreases from December 8th to the 9th, the percentage of SKUs with price decreases was still very low (less than three percent). We anticipate this trend will continue into 2022.

    SKUs with Price Decrease Post Cyber Weekend 2021
    Source: Commerce Intelligence – Pricing insights for Home & Garden, Jewelry & Watches, Clothing & Shoes, Bed N Bath, Lighting & Ceiling Fans categories

    A Sign of Things to Come

    A confluence of inflationary trends, product shortages and consumer liquidity have driven many marketplace changes to occur simultaneously. Government programs in the form of stimulus checks, have put extra money in consumers’ hands, and so they’ve been more willing to spend. That, coupled with the shock in the supply chain, has motivated people to buy far ahead of the 2021 holiday season. Hence, retailers have needed to rely much less on across-the-board discounts. Promotions have been more strategic – we’ve seen deeper discounts over fewer products, likely used to draw consumers in to buy certain items, and once they’re there, customers are buying everything else at a non-discount level. When these factors once again normalize, we could see a return to the “race to the bottom” that has occurred since the financial crisis of 2008-2009, but for once, retailers may be able to maintain some pricing power as the 2021 holiday shopping season played out.

    Even though performance was not as anticipated and holiday sales did not grow as rapidly as they did in 2020, Cyber Monday was still the greatest online shopping day in 2021. Through it all, retailers managed to keep their digital shelves stocked and orders filled in time for the holidays for the most part, running the risk of housing aged inventory if goods didn’t arrive in time. Despite predictions for steep promotions in January 2022, with supply chains still challenged and inflationary pressures still full steam ahead, we don’t anticipate much in the way of enhanced discounts to continue beyond the holidays.

    Access to these types of real-time digital marketplace insights can enable retailers and brands to make strategic decisions like how and when to address inflationary pressures, while also supporting many other day-to-day operations and help drive profitable growth in an intensifying competitive environment. Continue to follow us in the coming weeks for a detailed 2021 year-end review across more retailers and categories. Be sure to reach out to our Retail Analytics experts for access to more details regarding the above analysis.         

  • How Brands Can Outperform Rivals With Next-Gen Digital Shelf Analytics

    How Brands Can Outperform Rivals With Next-Gen Digital Shelf Analytics

    As eCommerce grows in complexity, brands need new ways to grow sales and market share. Right now, brands face urgent market pressures like out-of-stocks, an influx of new competition and rising inflation, all of which erode profitability. As online marketplaces mature, more brands need to make daily changes to their digital marketing strategies in response to these market pressures, shifts in demand, and competitive trends.

    eMarketer forecasts 2021 U.S. eCommerce will rise nearly 18% year-over-year (vs. 6.3% for brick-and-mortar), led by apparel and accessories, furniture, food and beverage, and health and personal care. The eCommerce industry is also undergoing fundamental changes with newer entities emerging and traditional business models evolving to adapt to the changed environment. For example, sales for delivery intermediaries such as Doordash, Instacart, Shipt, and Uber have gone from $8.8 billion in 2019 to an estimated $35.3 billion by the end of 2021. Similarly, many brands have established or are building out a Direct to Consumer (D2C) model so they can fully own and control their customer’s experiences.

    In response, DataWeave has launched the next generation of our Digital Shelf Analytics suite to help brands across retail categories directly address today’s costly market risks to drive eCommerce growth and gain a competitive advantage.

    Our new enhancements help brands improve online search rank visibility and quantify the impact of digital investments – especially in time for the busy holiday season.”  
    ~ Karthik Bettadapura, CEO and co-founder, DataWeave

    The latest product enhancements provide brands access to tailored dashboard views that track KPI achievements and trigger actionable alerts to improve online search rank visibility, protect product availability and optimize share of search 24/7. Dataweave’s Digital Shelf Analytics platform works seamlessly across all forms of eCommerce platforms and models – marketplaces, D2C websites and delivery intermediaries.

    Dashboard for Multiple Functions

    While all brands share a common objective of increasing sales and market share, their internal teams are often challenged to communicate and collaborate, given differing needs for competitive and performance data across varying job functions. As a result, teams face pressure to quickly grasp market trends and identify what’s holding their brands back.

    In response, DataWeave now offers executive-level and customized scorecard views, tailored to each user’s job function, with the ability to measure and assess marketplace changes across a growing list of online retail channels for metrics that matter most to each user. This enhancement enables data democratization and internal alignment to support goal achievement, such as boosting share of category and content effectiveness. The KPIs show aggregated trends, plus granular reasons that help to explain why and where brands can improve.

    Brands gain versatile insights serving users from executives to analysts and brand and customer managers.

    Prioritized, Actionable Insights

    As brands digitize more of their eCommerce and digital marketing processes, they accumulate an abundance of data to analyze to uncover actionable insights. This deluge of data makes it a challenge for brands to know exactly where to begin, create a strategy and determine the right KPIs to set to measure goal accomplishment.

    DataWeave’s Digital Shelf Analytics tool enables brands to effectively build a competitive online growth strategy. To boost online discoverability (Share of Search), brands can define their own product taxonomies across billions of data points aggregated across thousands of retailer websites. They can also create customized KPIs that track progress toward goal accomplishment, with the added capability of seeing recommended courses of action to take via email alerts when brands need to adjust their eCommerce plans for agility.

    “Brands need an integrated view of how to improve their discoverability
    and share of search by considering all touchpoints in the digital commerce ecosystem.”

    ~ Karthik Bettadapura, CEO and co-founder, DataWeave

    Of vital importance, amid today’s global supply chain challenges, brands gain detailed analysis on product inventory and availability, as well as specific insights and alerts that prompt them to solve out-of-stocks faster, which Deloitte reports is a growing concern of consumers (75% are worried about out-of-stocks) this holiday season.

    User and system generated alerts provide clarity to actionable steps to improving eCommerce effectiveness.
    You also have visibility to store-level product availability, and are alerted to recurring out-of-stock experiences.

    Scalable Insights – From Bird’s Eye to Granular Views

    DataWeave’s Digital Shelf Analytics allows brands to achieve data accuracy at scale, including reliable insights from a top-down and bottom-up perspective. For example, you can see a granular view of one SKUs product content alongside availability, or you can monitor a group of SKUs, say your best selling ones, at a higher level view with the ability to drill down into more detail.

    Brands can access flexible insights, ranging from strategic overviews to finer details explaining performance results.

    Many brands struggle with an inability to scale from a hyper-local eCommerce strategy to a global strategy. Most tools available on the market solve for one or the other, addressing opportunities at either a store-level basis or top-down basis – but not both.

    According to research by Boston Consulting Group and Google, advanced analytics and AI can drive more than 10% of sales growth for consumer packaged goods (CPG) companies, of which 5% comes directly from marketing. With DataWeave’s advanced analytics, AI and scalable insights, brands can set and follow global strategies while executing changes at a hyper-local level, using root-cause analysis to drill deeper into problems to find out why they are occurring.

    As more brands embrace eCommerce and many retailers localize their online assortment strategies, the need for analytical flexibility and granular visibility to insights becomes increasingly important. Google reports that search terms “near me” and “where to buy” have increased by more than 200% among mobile users in the last few years, as consumers seek to buy online locally.

    e-Retailers are now fine-tuning merchandising and promotional strategies at a hyper-local level based on differences seen in consumer’s localized search preferences, and DataWeave’s Digital Shelf Analytics solution provides brands visibility to retailer execution changes in near real-time.

    Competitive Benchmarking

    Brand leaders cannot make sound decisions without considering external factors in the competitive landscape, including rival brands’ pricing, promotion, content, availability, ratings and reviews, and retailer assortment. Dataweave’s Digital Shelf Analytics solution allows you to monitor share of search, search rankings and compare content (assessing attributes like number of images, presence of video, image resolution, etc.) across all competitors, which helps brands make more informed marketing decisions.

    Brands are also provided visibility into competitive insights at a granular level, allowing them to make actionable changes to their strategies to stay ahead of competitors’ moves. A new module called ‘Sales and Share’ now enables brands to benchmark sales performance alongside rivals’ and measure market share changes over time to evaluate and improve competitive positioning.

    Monitor competitive activity, spot emerging threats and immediately see how your performance compares to all rivals’, targeting ways to outmaneuver the competition.

    Sales & Market Share Estimates Correlated with Digital Shelf KPIs

    In a brick-and-mortar world, brands often use point of sale (POS) based measurement solutions from third party providers, such as Nielsen, to estimate market share. In the digital world, it is extremely difficult to get such estimates given the number of ways online orders are fulfilled by retailers and obtained by consumers. Dataweave’s Digital Shelf Analytics solution now provides sales and market share estimates via customer defined taxonomy, for large retailers like Amazon. Competitive sales and market share estimates can also be obtained at a SKU level so brands can easily benchmark their performance results.

    Additionally, sales and market share data can also be correlated with digital shelf KPIs. This gives an easy way for brands to check the effect of changes made to attributes, such as content and/or product availability, and how the changes impact sales and market share. Similarly, brands can see how modified search efforts, both organic and sponsored, correspond to changes in sales and market share estimates.

    Take Your Digital Shelf Growth to the Next Level

    The importance of accessing flexible, actionable insights and responding in real-time is growing exponentially as online is poised to account for an increasing proportion of brands’ total sales. With 24/7 digital shelf accessibility among consumers comes 24/7 visibility and the responsibility for brands to address sales and digital marketing opportunities in real-time to attract and serve online shoppers around the clock.

    Brands are turning to data analytics to address these new business opportunities, enhance customer satisfaction and loyalty, drive growth and gain a competitive advantage. Companies that adopt data-driven marketing strategies are six times more likely to be profitable year-over-year, and DataWeave is here to help your organization adopt these practices. To capitalize on the global online shopping boom, brands must invest in a digital shelf analytics solution now to effectively build their growth strategies and track measurable KPIs.

    DataWeave’s next-gen Digital Shelf Analytics enhancements now further a brand’s ability to monitor, analyze, and determine systems that enable faster and smarter decision-making and sales performance optimization. The results delight consumers by helping them find products they’re searching for, which boosts brand trust.

    Connect with us to learn how we can scale with your brand’s analytical needs. No project or region is too big or small, and we can start where you want and scale up to help you stay agile and competitive.

  • How Artificial Intelligence is giving the  Indian Beauty Industry a Facelift

    How Artificial Intelligence is giving the Indian Beauty Industry a Facelift

    With the help of artificial intelligence and machine learning, beauty and cosmetics companies are exploring new possibilities. According to a report by Avendus, the global beauty and personal care market are expected to touch US$725 billion by 2025 and the young Indian market is expected to grow to $28 billion by then. This segment is a space of opportunity and today we have more than 80 Indian brands in this domain. 

    D2C beauty brand logos
    D2C beauty brand logos

    While technology in this space plays a very important role, Artificial Intelligence (AI) amongst everything else is giving the beauty industry a makeover. This is because, AI can create an impact on all stages of the beauty value chain — from research & development to supply chain management to product selection, marketing, and more! Resonating this thought, Chaitanya Nallan, CEO & Co-Founder, SkinKraft Laboratories mentions “As a digital-first brand, we sell across multiple e-commerce platforms as well as through our own website. Thus, it is very important that we track and maintain inventory across all channels in real-time to avoid stock-outs and loss of sales. We use AI for this. We have built an in-house data tracking dashboard that pulls in inventory information from all warehouses and maps them against sales to give us an accurate estimate of days of inventory across all SKUs and across all platforms. This information directly feeds into our procurement dashboard and also helps the marketing team to create the right sales strategy.”

    Stock availability is crucial to driving sales. If you need help tracking your online inventory – DataWeave can help give you a near real-time view of your product stock status across marketplaces. 

    With AI being a powerful technology wand, here is how it can drive the future of beauty brands within the D2C segment in India.

    Making Virtual Product trials a reality

    virtual product trial
    Virtual Product Trial

    Augmented Reality (AR) is a prevalent term and many companies are already using it on an everyday basis. More commonly, the Snapchat and Instagram filters we use are all powered by AR. In a similar vein, virtual images can be laid over actual images in real-time using AI. And keeping this concept handy, beauty brands are bringing to the front the AR-powered ‘virtual mirrors’ that let consumers try on cosmetic products in real-time. Modiface by L’Oréal is a perfect example of VR-mirrors, which has pioneered the AR-powered makeup try-ons in the market. These virtual mirrors use AI algorithms to detect the user’s face through a camera by focal points and map the face. Then using AR, images of makeup are adjusted according to the terms obtained and overlaid over the features on the face giving consumers a virtual feel of what they’d look like wearing the product. 

    Virtual try on
    Virtual Try-on

    Much recently, Indian brand Lakme has made ‘virtual try on’ possible by creating a smart mirror on its official website that allows customers to watch their reflection, try on different shades, and customize those shades according to their preferences. Shade matching until a few years back was an entirely on-ground phenomenon and customers visiting a local cosmetics store were able to choose and match the shade of compact, eye shadow, and lipstick against their true skin tone. Today AI can allow you to narrow down on products based on a virtual shade card, put them against your skin in real-time. 

    Make it Truly Personalised

    Every customer is unique, and one size does not fit all. Everyone has a personalized beauty regime they follow & understanding this could be the key to success for beauty brands. For this reason, the future of beauty lies in harnessing AI and AR solutions to tailor the beauty shopping experience to match the needs of the individual consumer. This not only enhances digital engagement but also increases purchasing confidence which in turn helps brands drive conversion and brand loyalty.  

    Pre-pandemic, offline beauty advisors played a consultative role when customers were making purchase decisions. A lot of this has moved online – take for instance Olay. It launched an online “Skin Advisor” app based on a deep-learning algorithm that analyses a consumer’s skin using a simple selfie! Armed with information on their skin type, customers can make an informed, personalized purchase that’s right for their specific skin type. 

    Skin Advisor App
    Skin Advisor App

    Understanding customer preferences and using data from their past purchases also help with personalized marketing in a big way. “Data-driven personalization gives brands insight into what their customers are interested in. We integrate this data into our marketing campaigns and deliver specific, personalized, and relevant content. This way, we make sure to target the right audience with the right messaging. This, in turn, helps us increase engagement and retain customers. Moreover, this combined data, allows us to get repeat sales through upselling and cross-selling. Further, knowing customers beyond just simple demographics helps us improve our targeting and helps us predict future behaviour. We’d like to know, for instance, if a customer clicked on our advertisement, liked, or commented on our social media product displays, signed up to our email list, etc. These analytics reveal a customer’s interest. Combine it with demographics – and you get a sense of what the customer is interested in,” Dhruv Madhok, Co-Founder, ARATA highlights. 

    Boost Product Development

    Social listening
    Social listening

    AI algorithms can be used to study and analyse customer feedback. The algorithm works towards interpreting customer comments, reviews, and feedback on a brand’s website, social media channels, and other online platforms. Artificial Intelligence can also decode and analyse questionnaires and feedback forms that the customers may have responded to online or offline. 

    The beauty and personal care industry is largely driven by usage and customer preferences, so gauging how customers feel about key products can help businesses create & develop products that customers will most likely prefer to buy. For instance, reputed beauty brand Avon recently mentioned that it developed the True 5-in-1 Lash Genius Mascara based on actual consumer feedback! They used machine learning & artificial intelligence to read, filter, process & rank thousands of online consumer comments to determine the top features they crave in a mascara. Using this customer gathered intelligence, they developed a unique product that consumers we’re “asking for”!

    True 5-in-1 Lash Genius Mascara by beauty brand Avon
    True 5-in-1 Lash Genius Mascara by beauty brand Avon

    Need help listening to what your consumers are saying about your brand online? Read more about DataWeave’s AI Powered Sentiment Analysis solution.

    More and more brands are listening to customer responses closely to give way to new products, bring in tweaks to their existing basket, and innovate further. “Our ORM team is leading the knowledge accumulation as far as social listening is concerned. They are not just responsible for responding to customer queries, they are also instrumental in highlighting key insights based on user behaviour being observed,” Chaitanya of SkinKraft Laboratories further asserts. 

    Bombay Shaving Company too with its data-centric culture leverages customer responses for decision making & product development. “In-home personal care and hygiene exploded during the pandemic. We used data analytics to explore different dimensions of in-home experience-driven needs (new usage occasions, need for convenience and DIY, etc.). We listened to our customers & were able to introduce our women’s brand, with innovative hair removal products in a big way during this period. Which today contributes to a significant percentage of our business,” Shantanu Deshpande, Founder & CEO, Bombay Shaving Company mentions.

    Given the scope and scale of the beauty and personal care industry that is major ‘usage’ driven, Artificial Intelligence with its diverse potential can bring a paradigm shift in the industry. AI can help not only with virtual trials, personalization, listening in to customers’ feedback but also with monitoring a brand’s Digital Shelf. Brands can amplify their online sales by tracking Digital Shelf KPIs like share of search & product visibility, pricing & discounting, product content, availability & assortment. Reach out to our Digital Shelf experts to learn more.