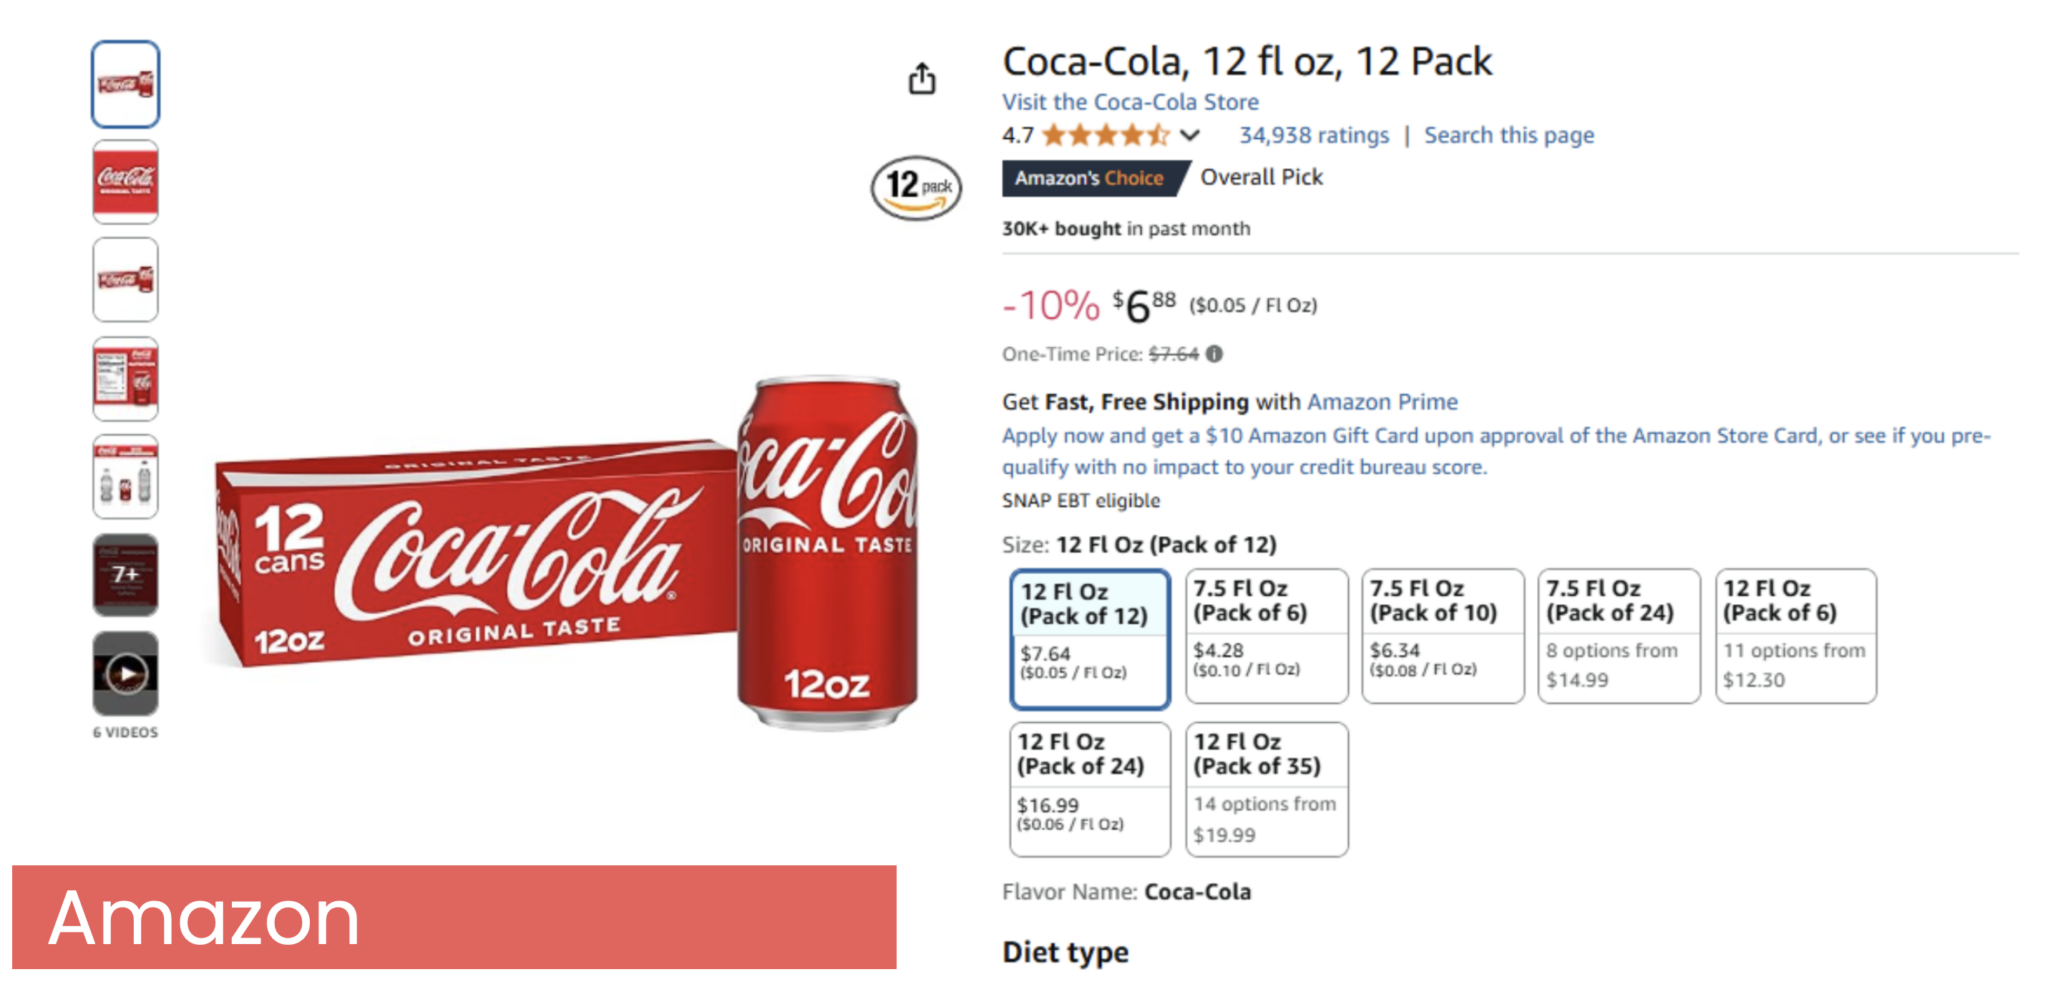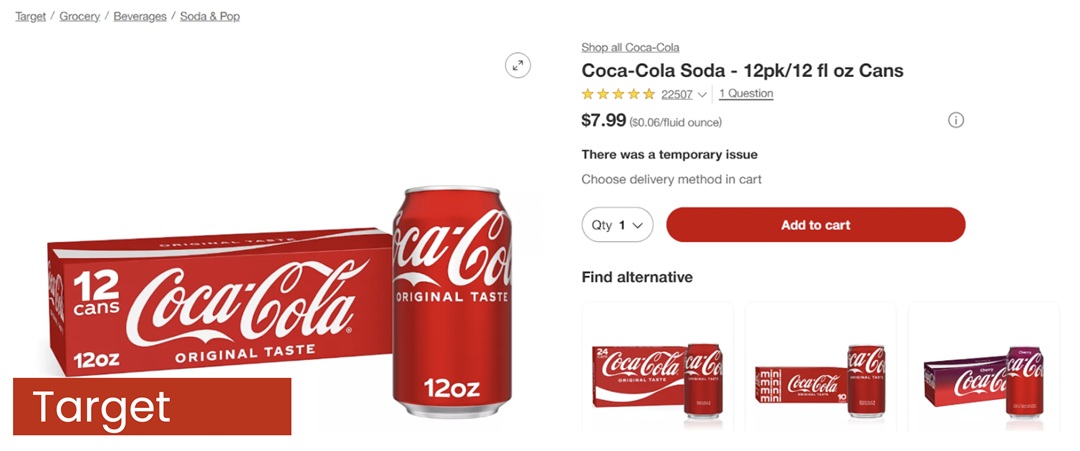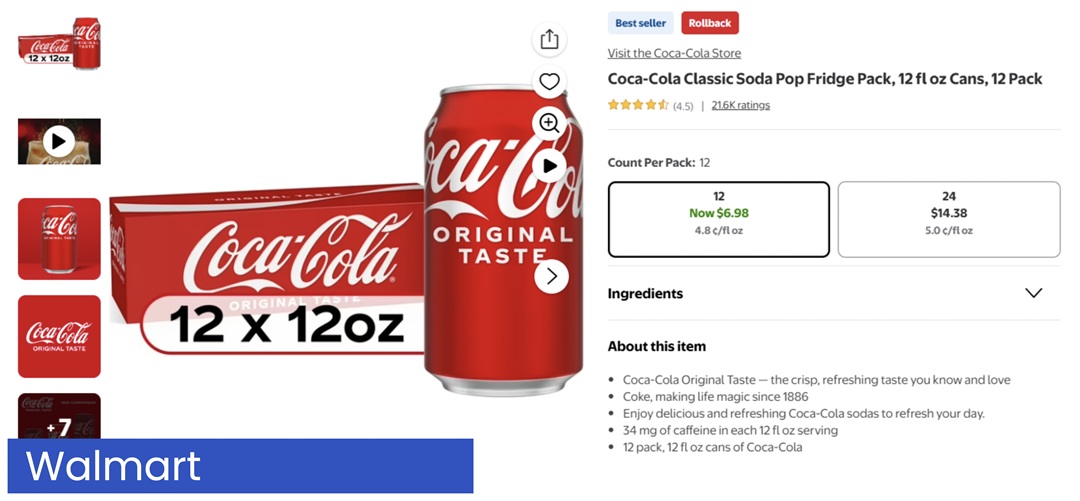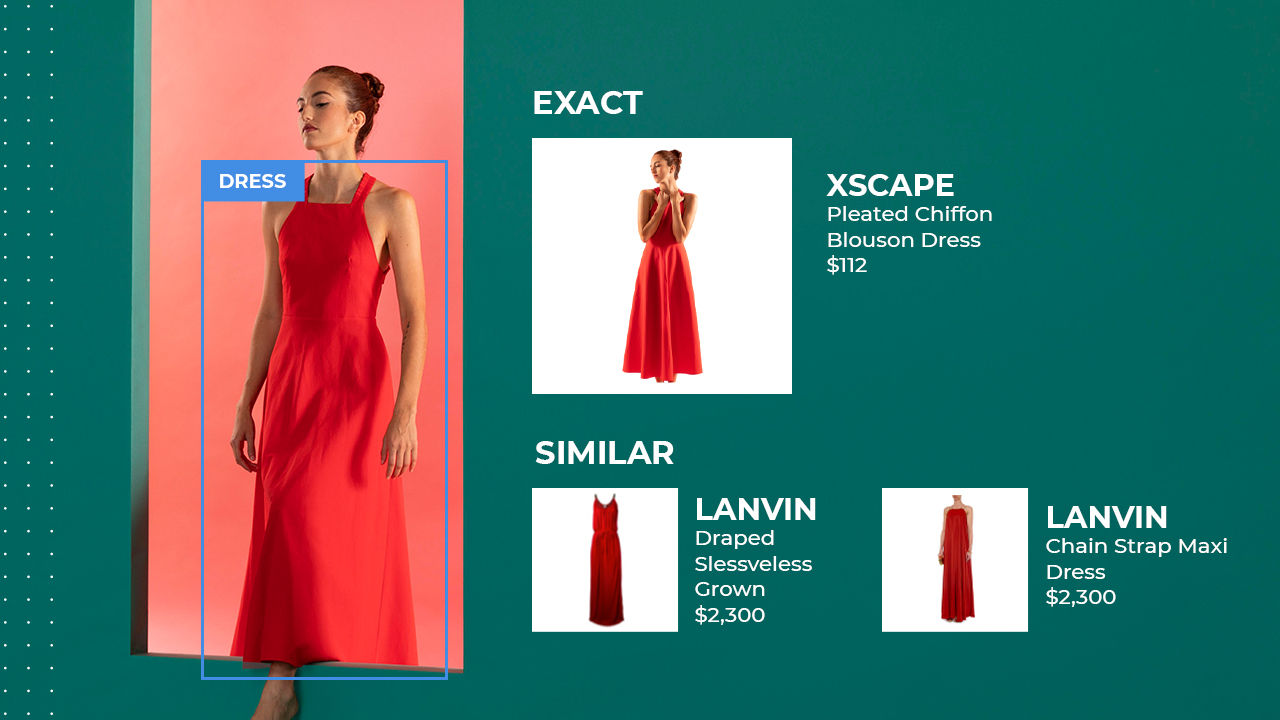
AI-powered product matching is the backbone of competitive pricing intelligence. Accurate matches help you compare prices correctly, identify meaningful assortment gaps, and optimize product content. Inaccurate matches distort every one of these insights. In some categories, a single mismatch can cause millions of dollars of lost revenue.
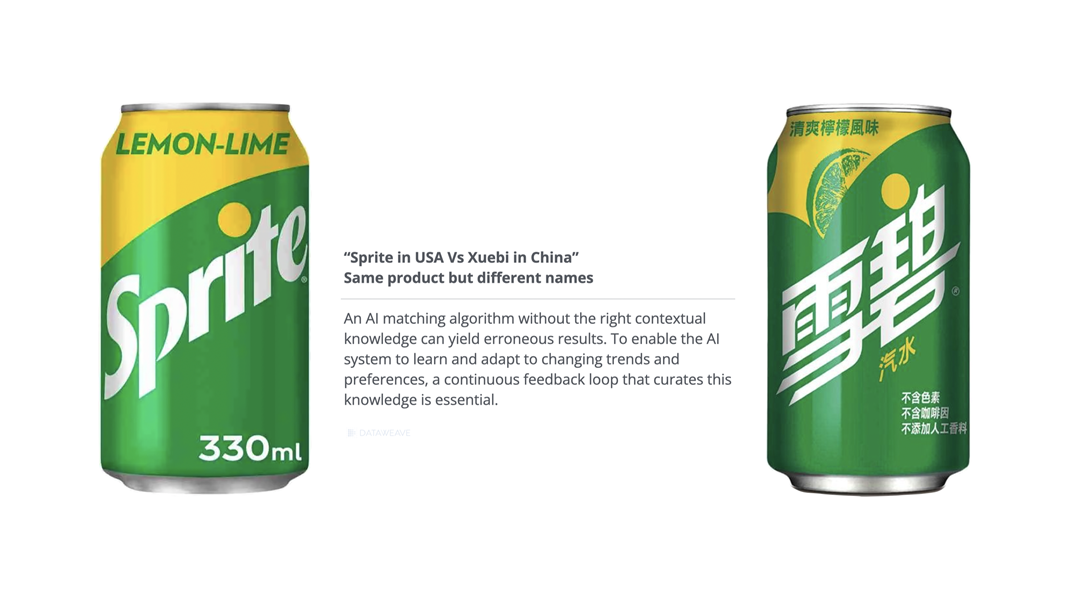
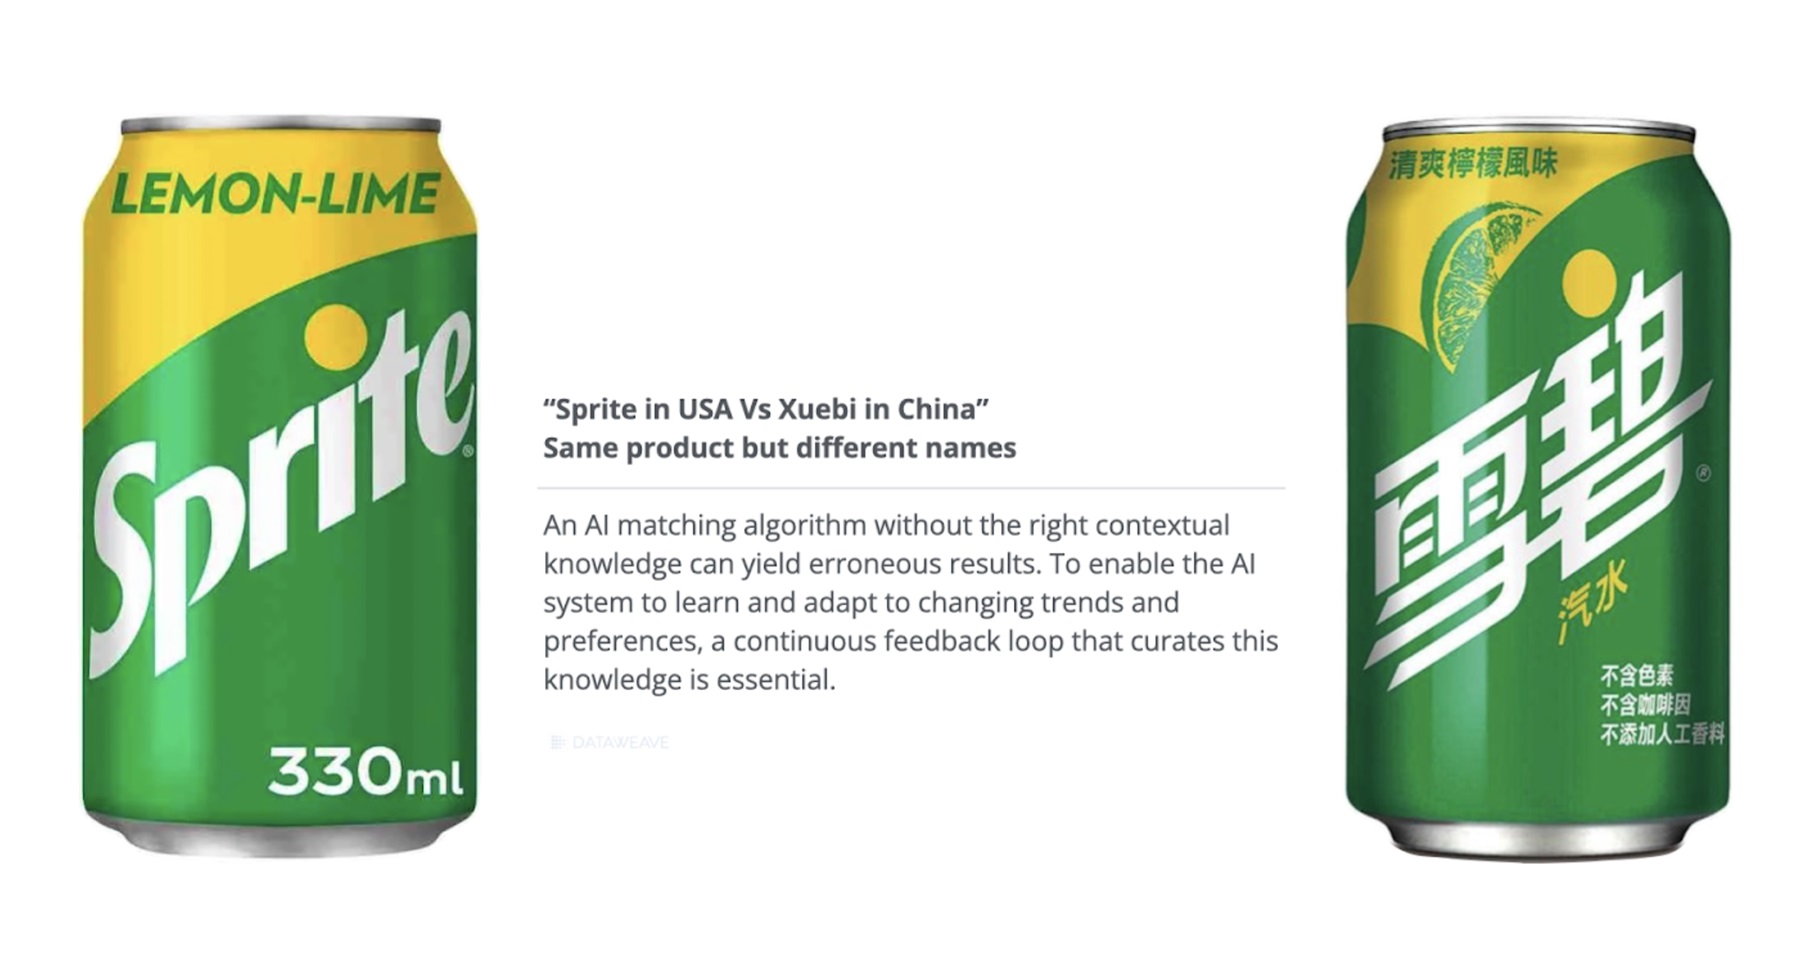
Retailers and brands know this problem well. Product catalogs are vast. Competitor assortments shift daily. Titles are inconsistent. Product codes are missing. Images vary by region or packaging. Basically, context matters, and AI alone often misses that context.
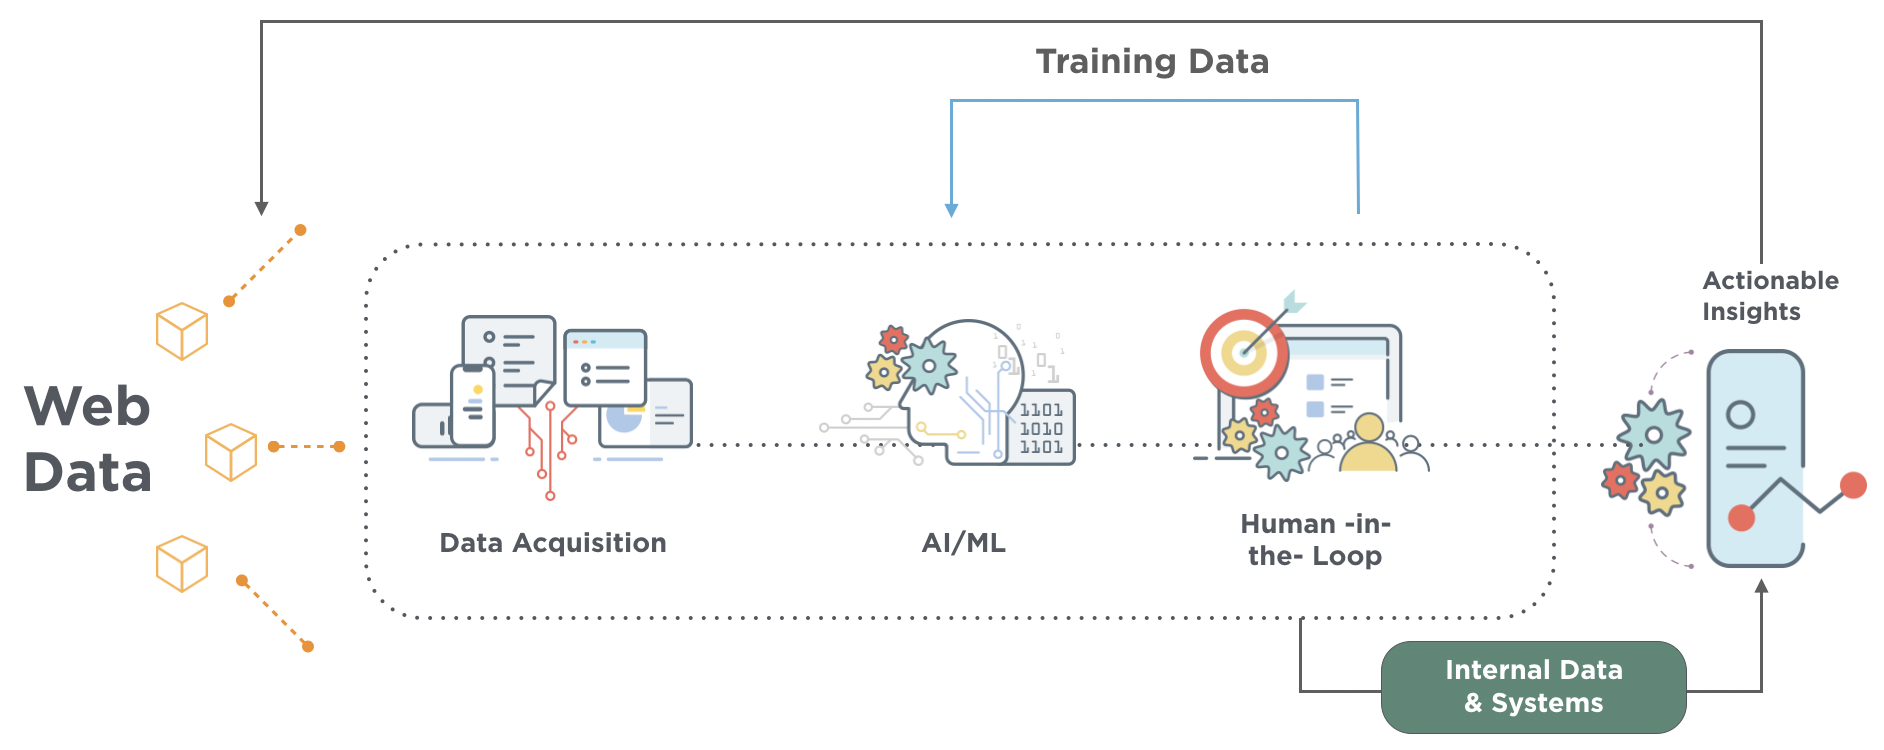
This is why a human-in-the-loop approach is essential. It allows product matches to be verified consistently, at scale, and with the context that only people can provide. Many retailers have also told us they want to take this a step further. They want the ability to control and define their own product matches.
Sometimes that is because they need to fix inevitable errors quickly. Other times, it is because their teams have deeper category knowledge and can make the right judgment calls when AI falls short.
To make that possible, DataWeave introduced User-Led Match Management. It combines the scale of AI with the judgment of experts within retail organizations. The platform does not just suggest matches. It gives your teams the tools to approve, reject, or refine them. This ensures your competitive intelligence reflects both machine precision and your unique business logic.
Why AI Matching Alone Falls Short
AI has changed the speed and scale of product matching. Algorithms can process millions of SKUs quickly. They can detect similarities in text, images, and metadata. But in retail, the stakes are too high to rely on AI alone.
Here is where AI sometimes falls short:
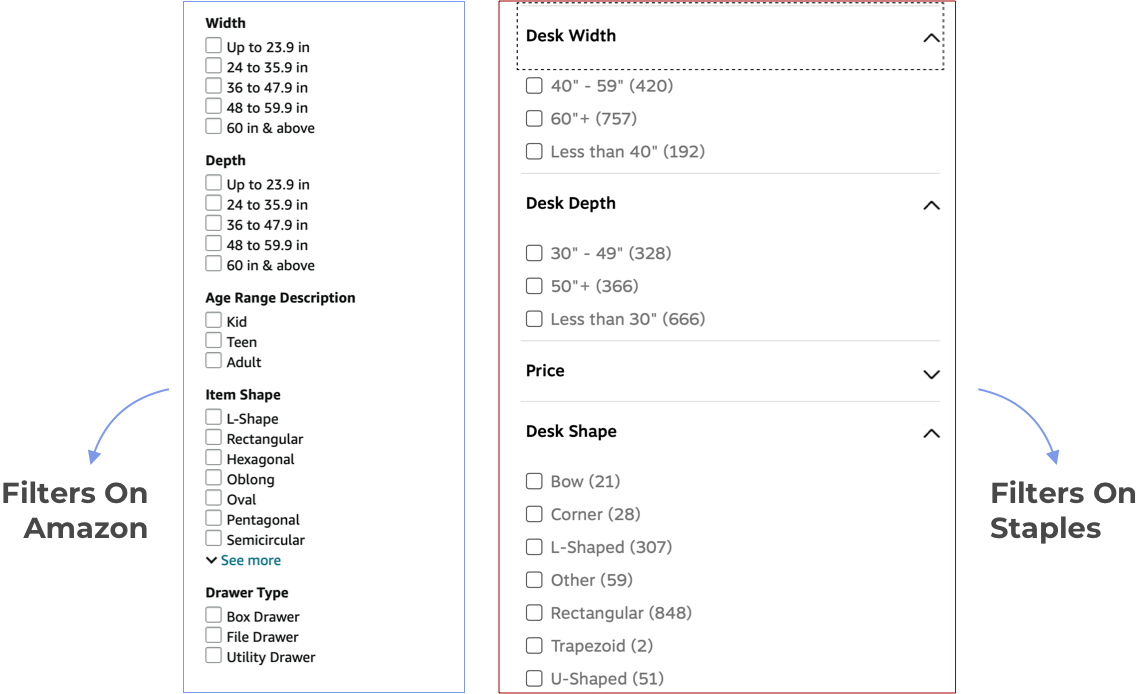
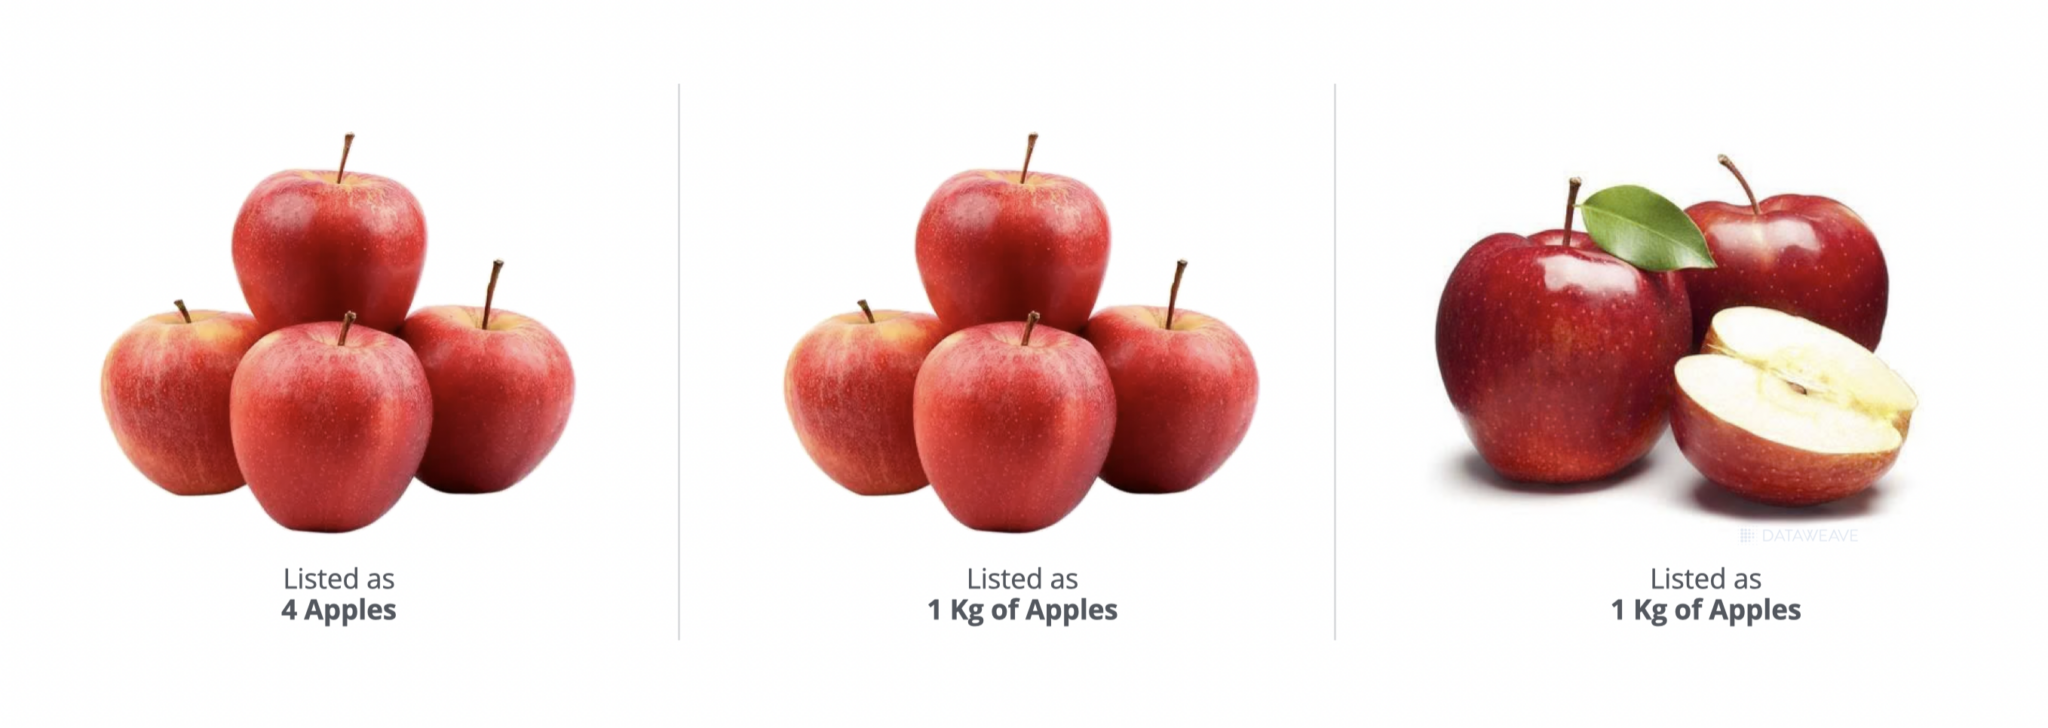
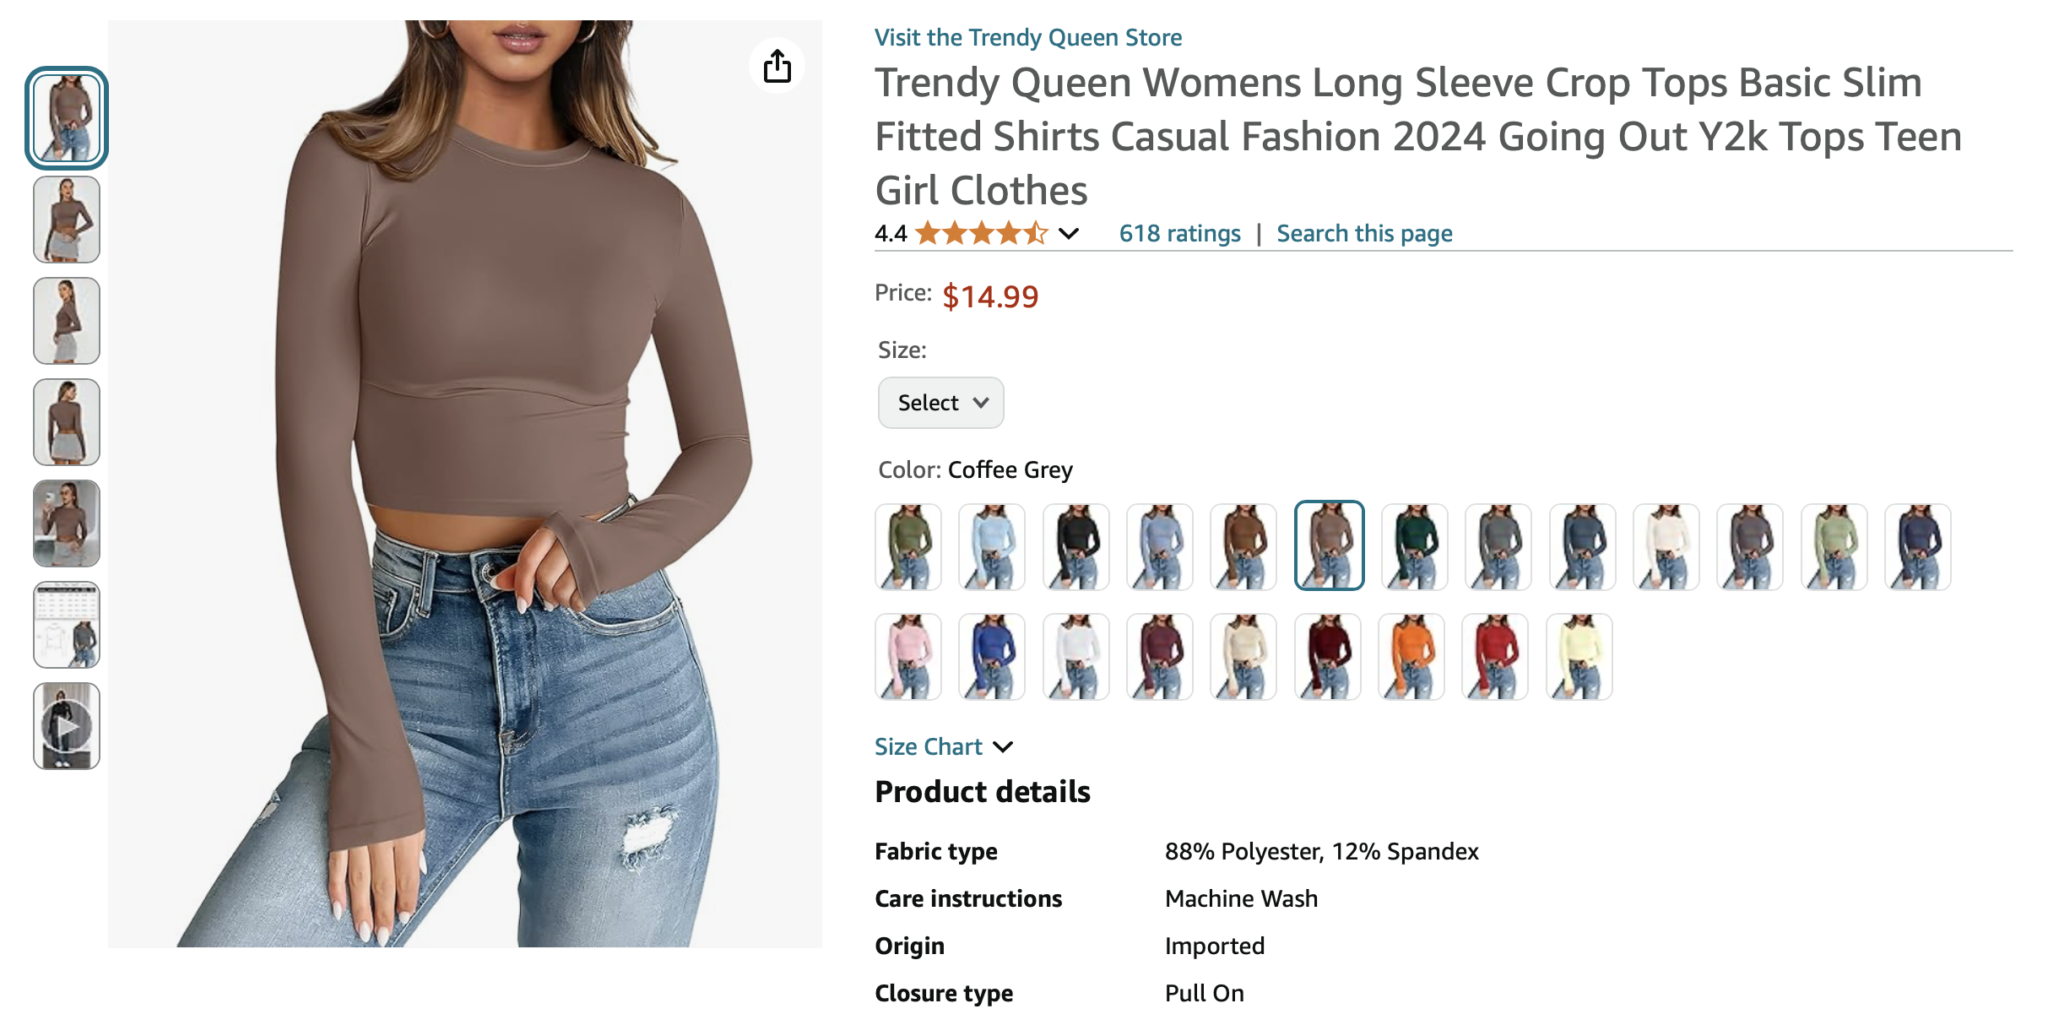
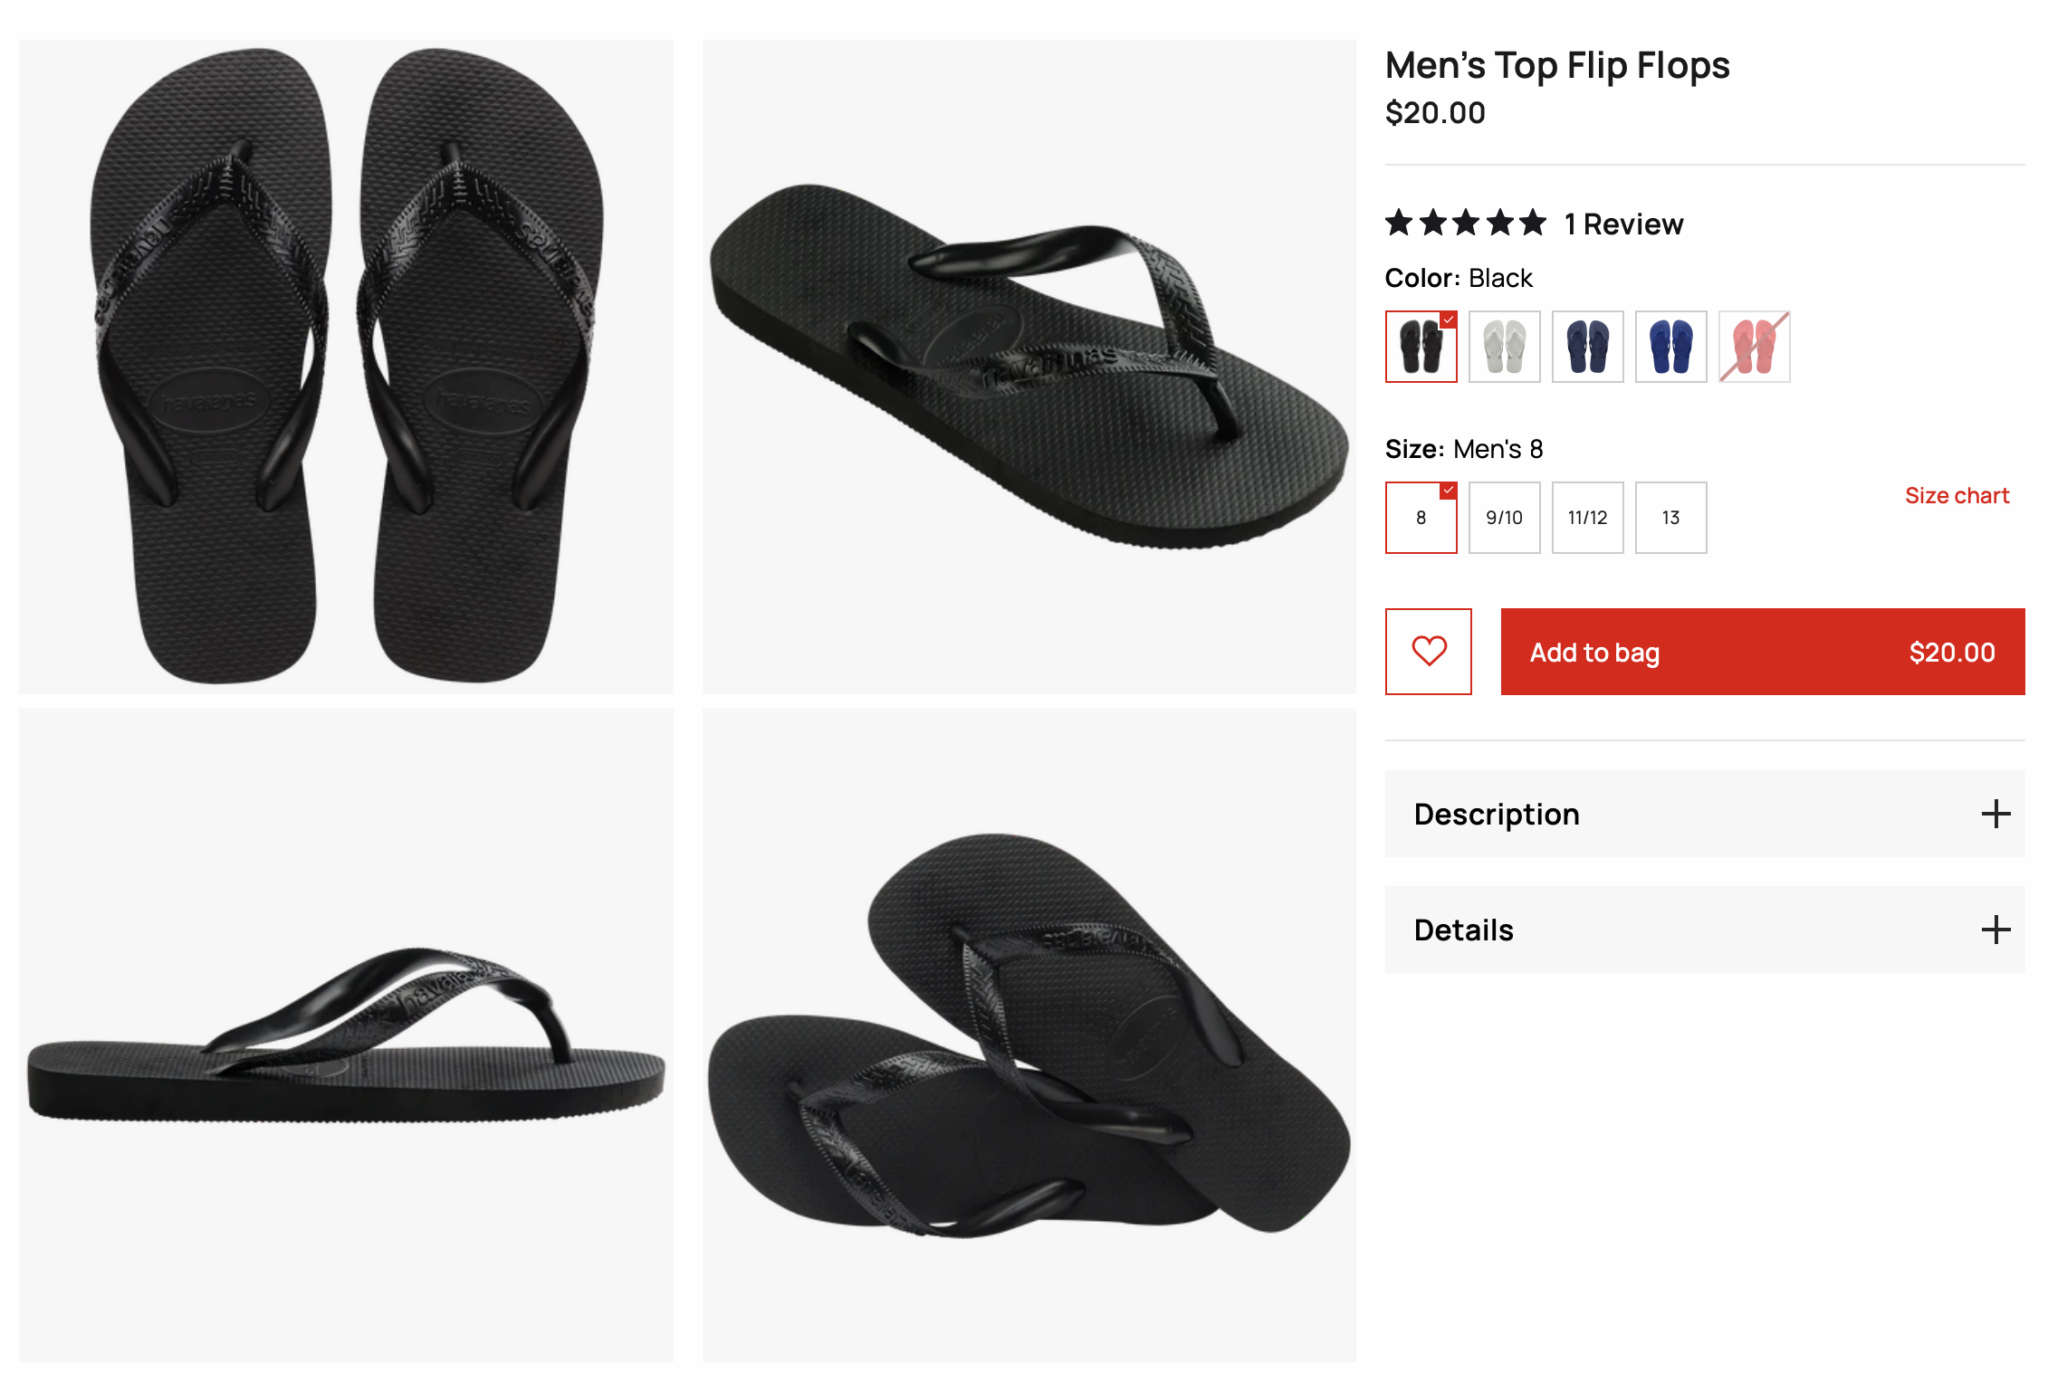
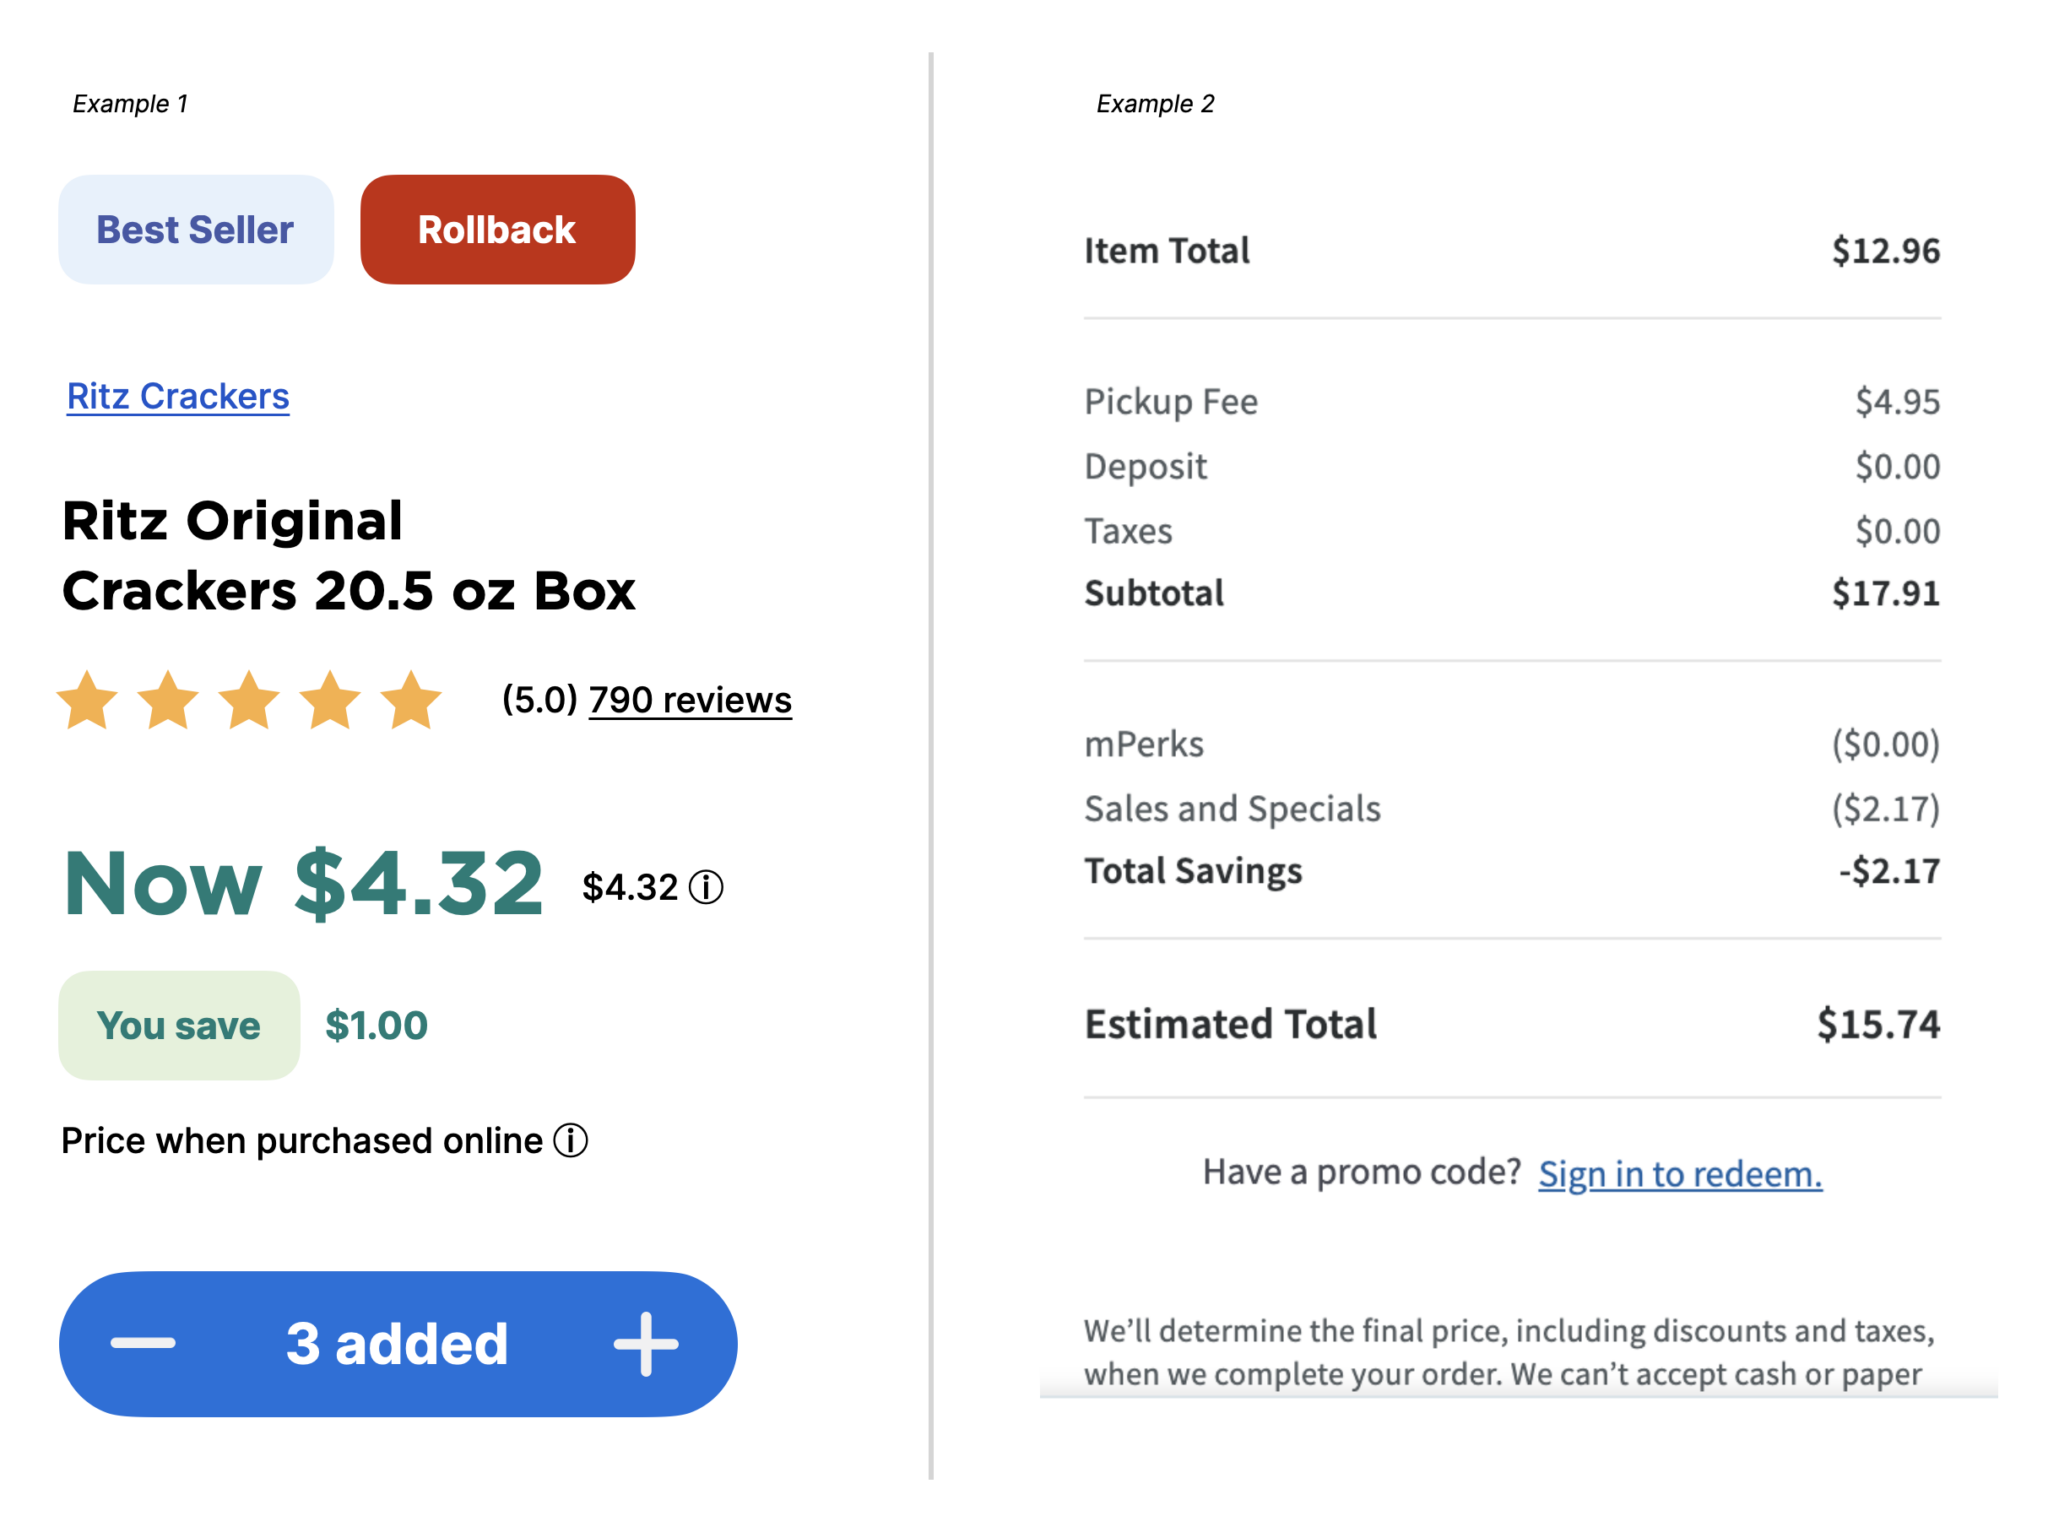
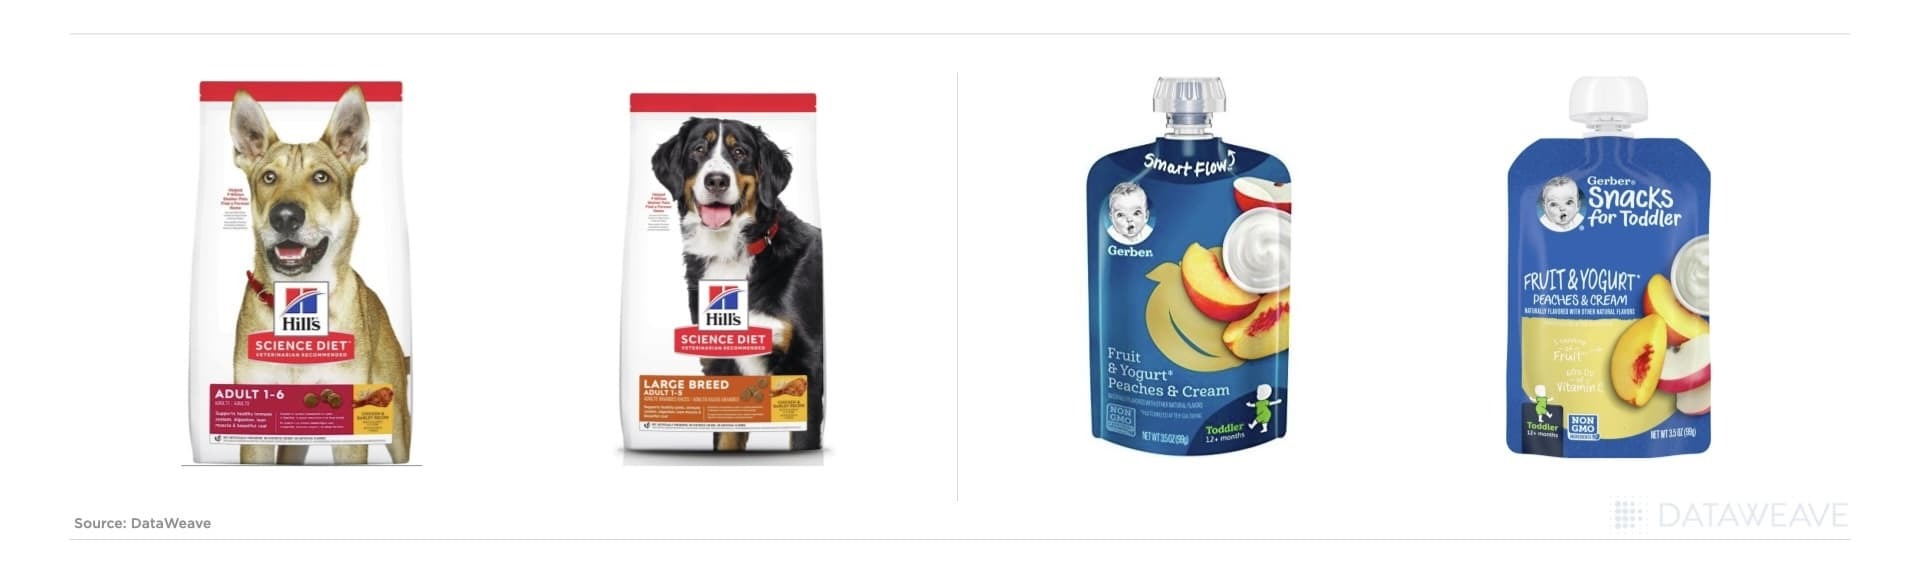
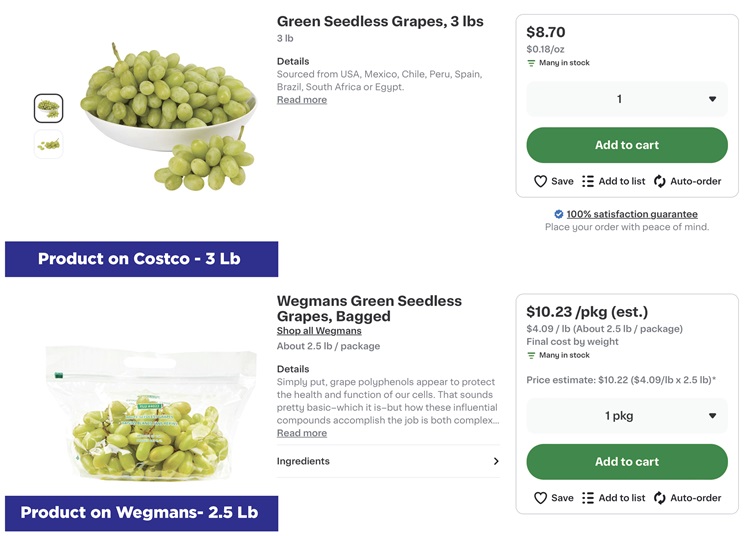
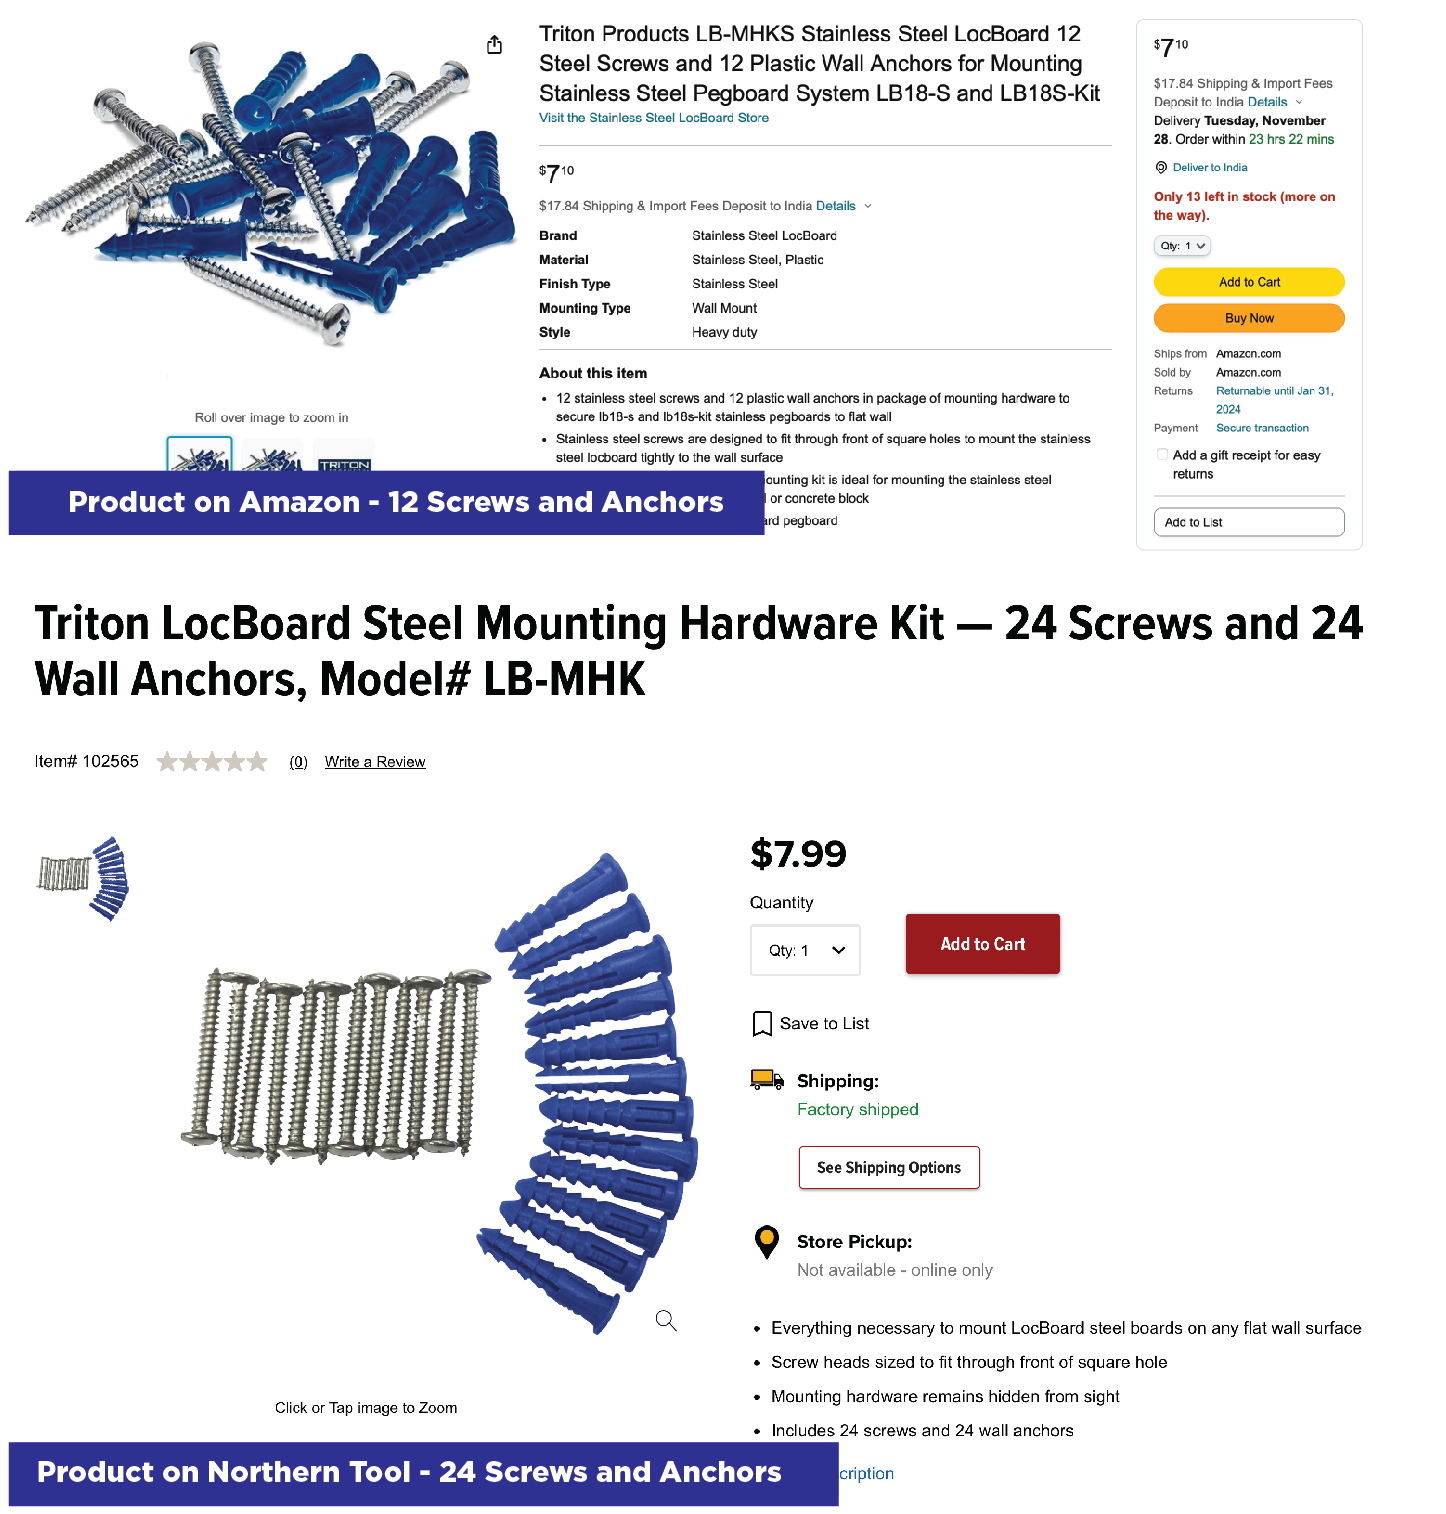
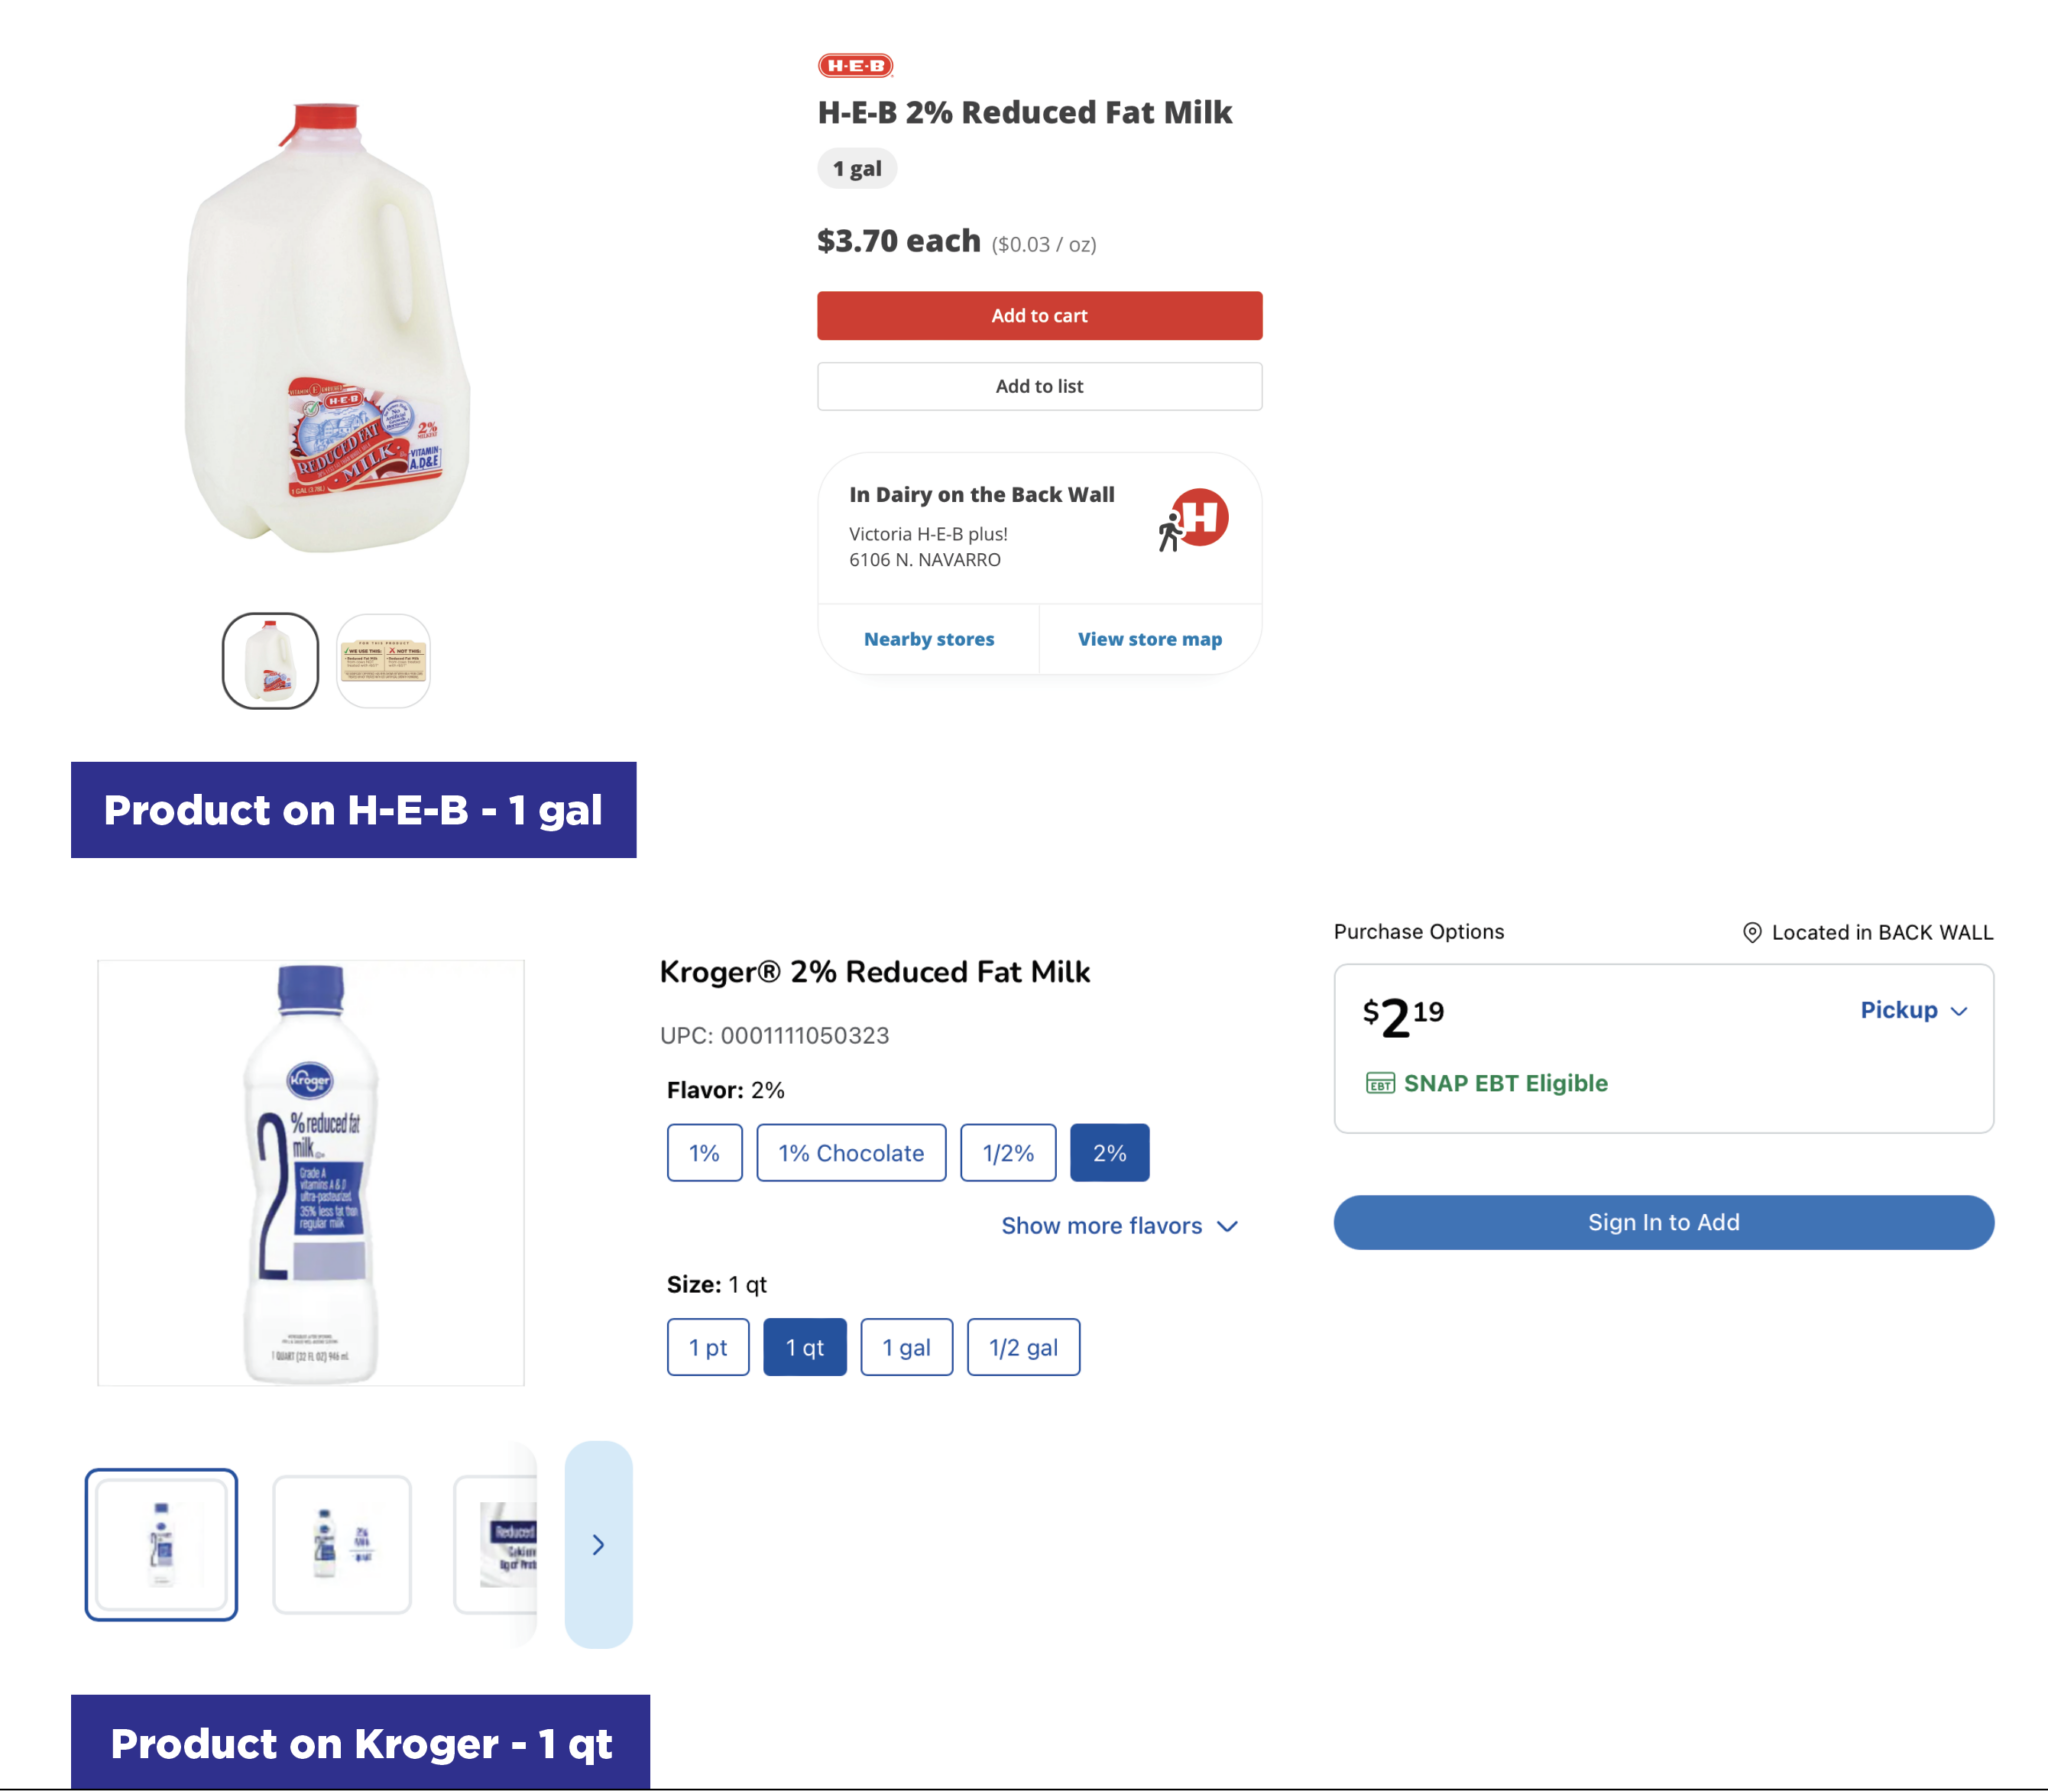
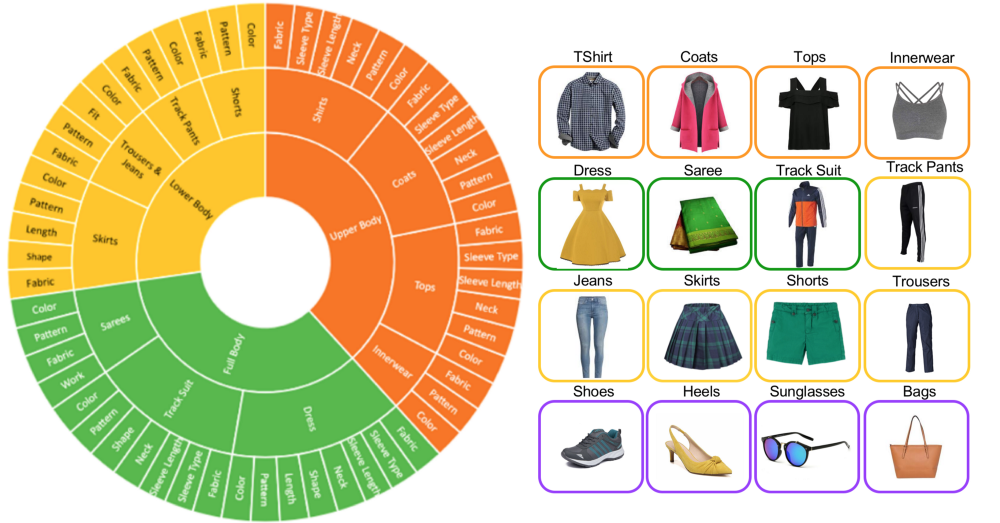
- Category complexity: Matching rules that work in electronics may fail in fashion or grocery. An electronics SKU may depend on a model number. A fashion SKU may depend on seasonality. A grocery SKU may depend on pack size or whether it is a private label.
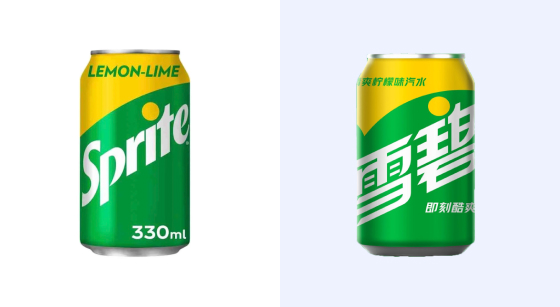
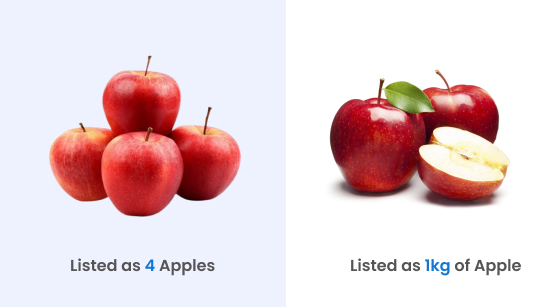
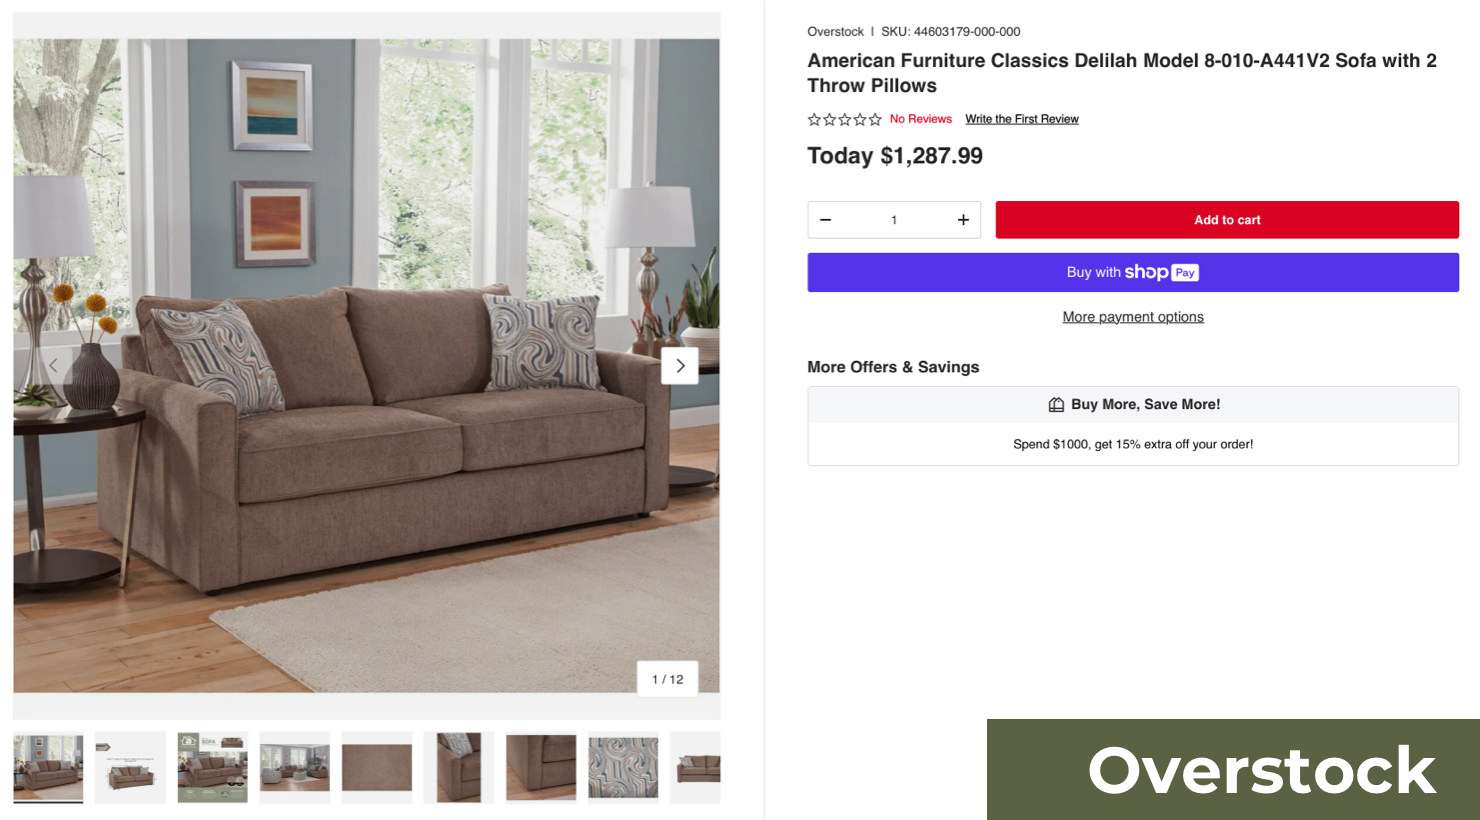
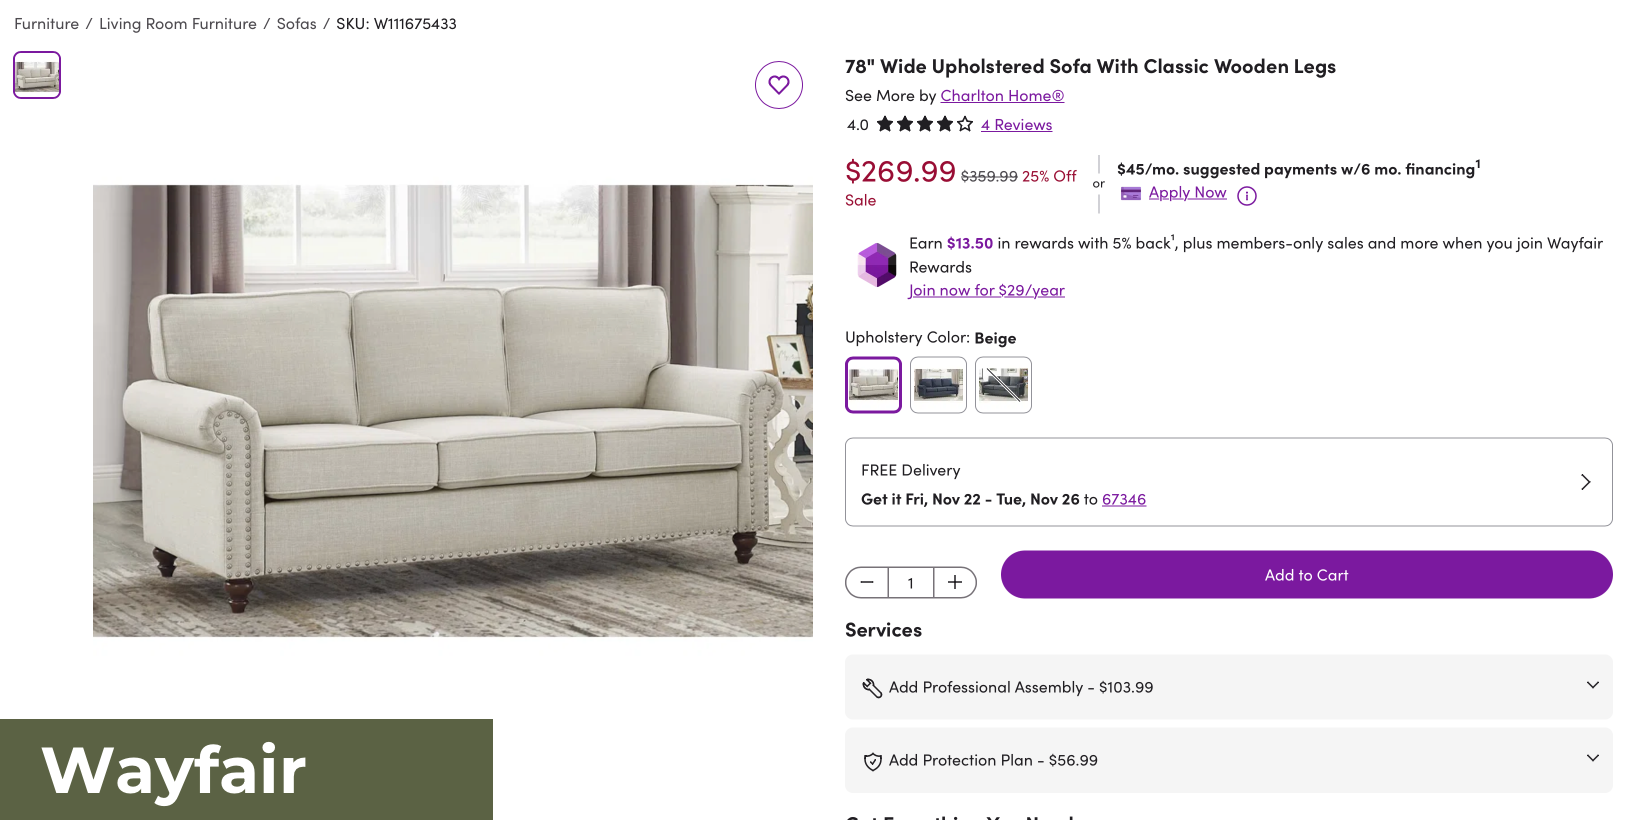
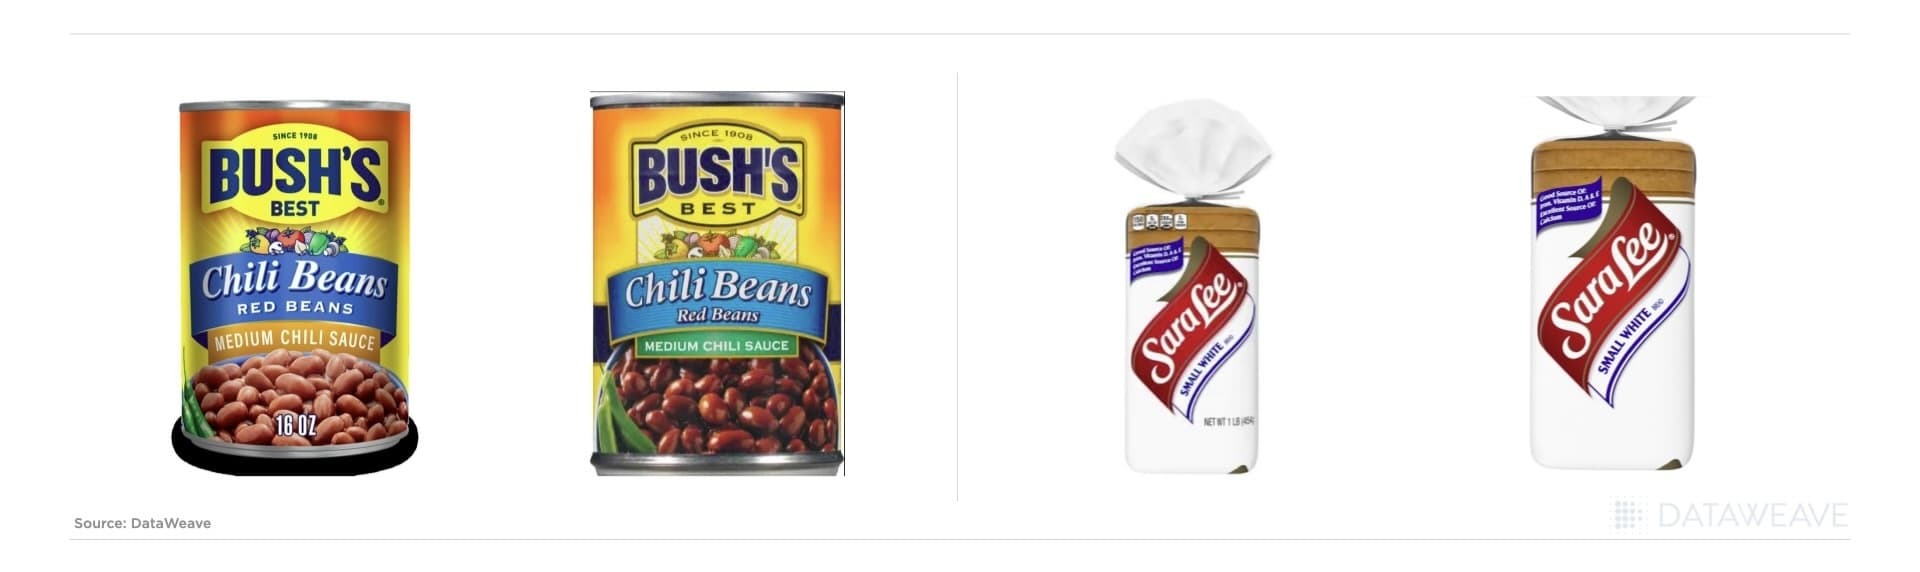
- Data inconsistency: Titles vary. Images differ across regions. These gaps, when large, trip up algorithms.
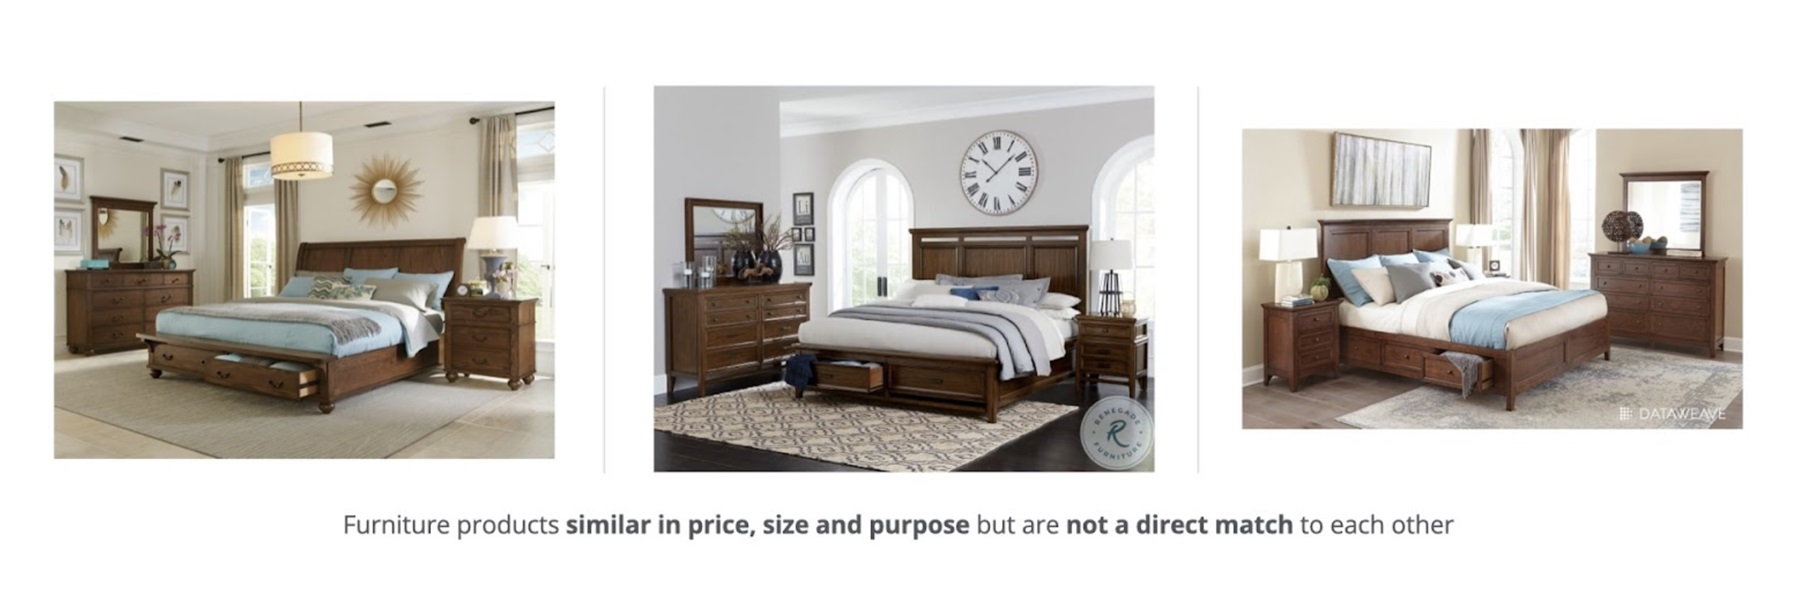
- Business context: Should a premium product ever be compared against a budget line? Should seasonal products match year-round items? AI may not know these boundaries.
- Scale vs. accuracy: Automated systems optimize for coverage. That speed often limits accuracy for a small set of SKUs. Even a 1% error rate across millions of SKUs creates thousands of bad comparisons.
AI is critical for scale. But accuracy requires human input. DataWeave’s human-in-the-loop framework addresses this by allowing expert reviewers to validate and improve AI outputs. Our user-led match management takes this further by putting control directly into the hands of your business teams.
What DataWeave’s User-Led Match Management Delivers
With User-Led Match Management, your team is not a passive reviewer. They become active participants in shaping the accuracy of your competitive intelligence.
Your teams can:
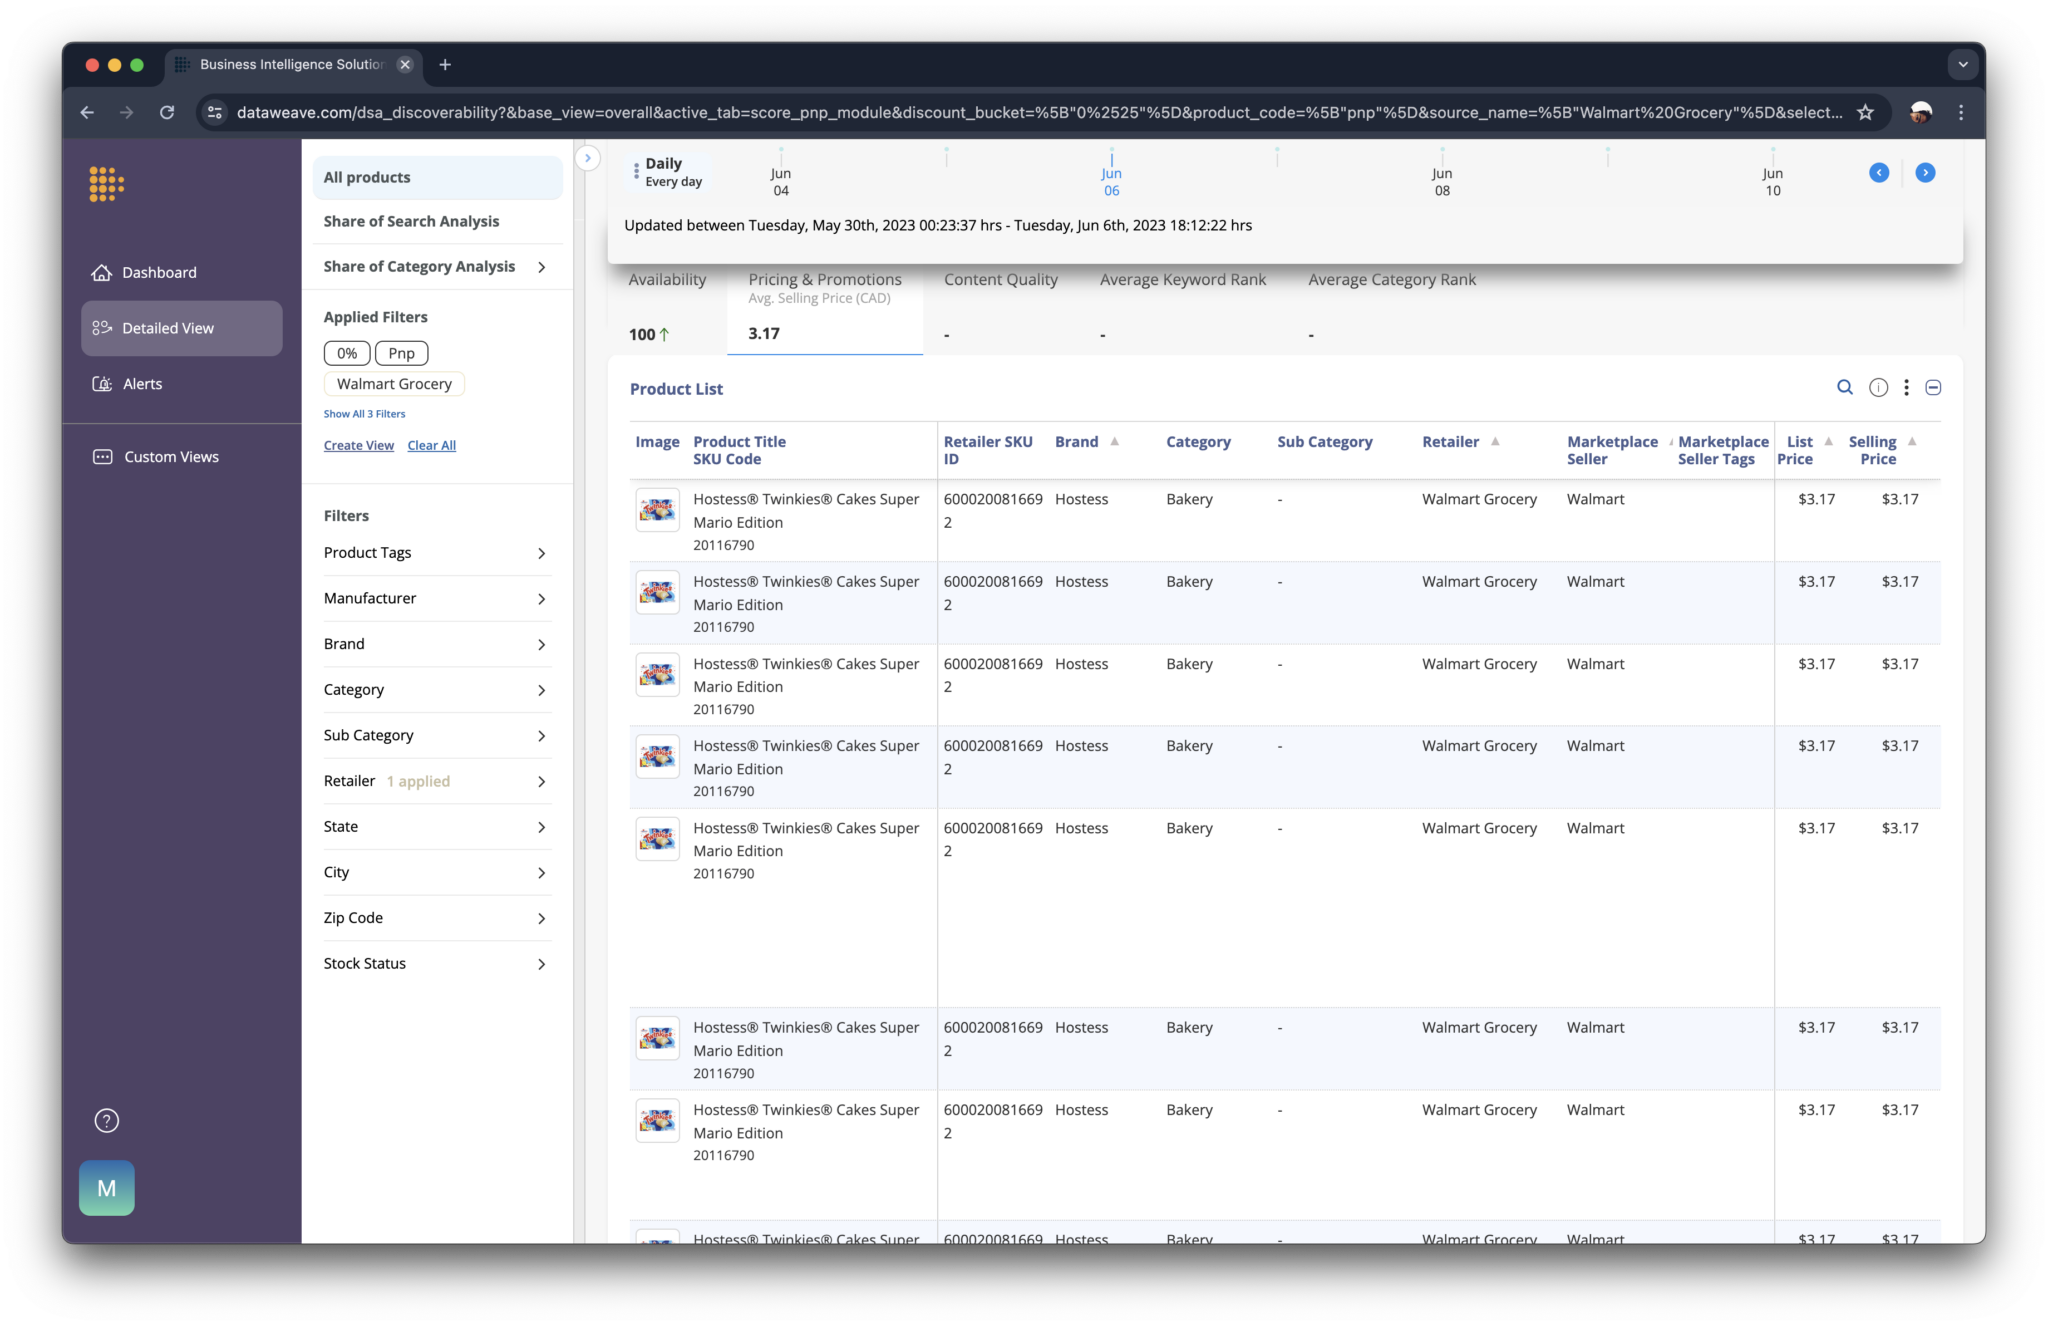
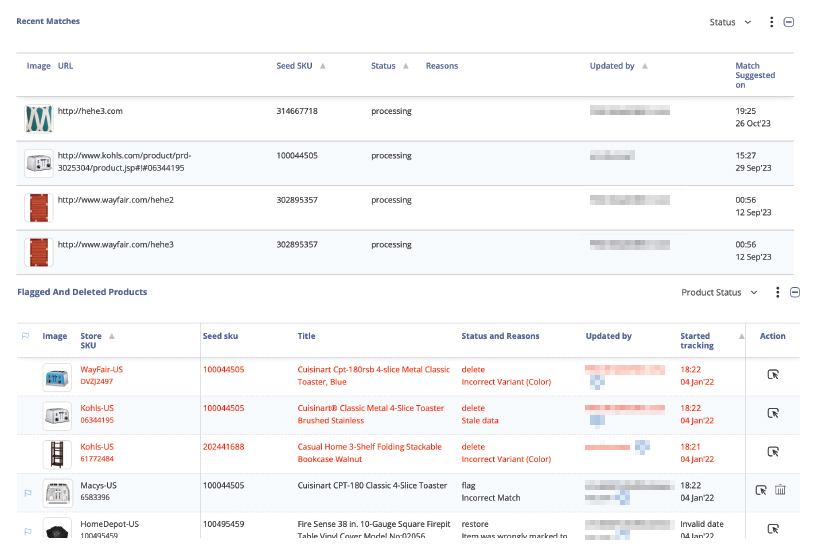
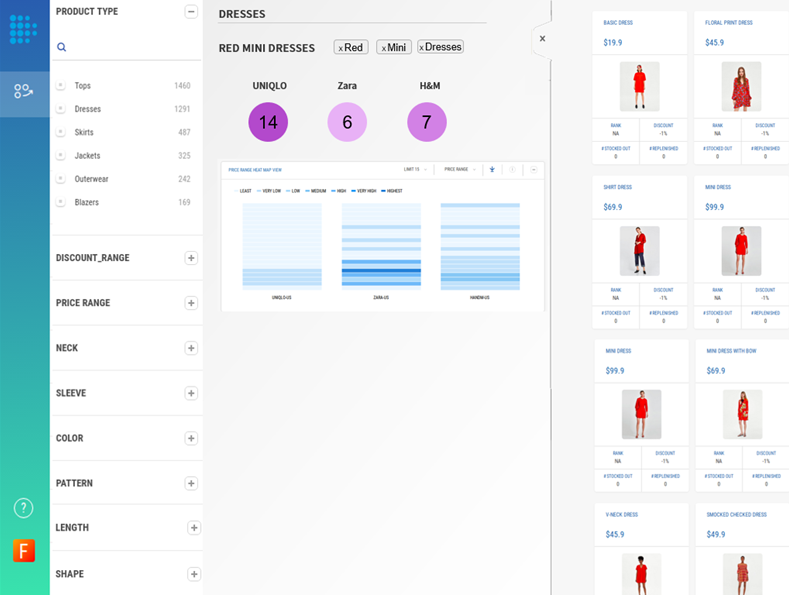
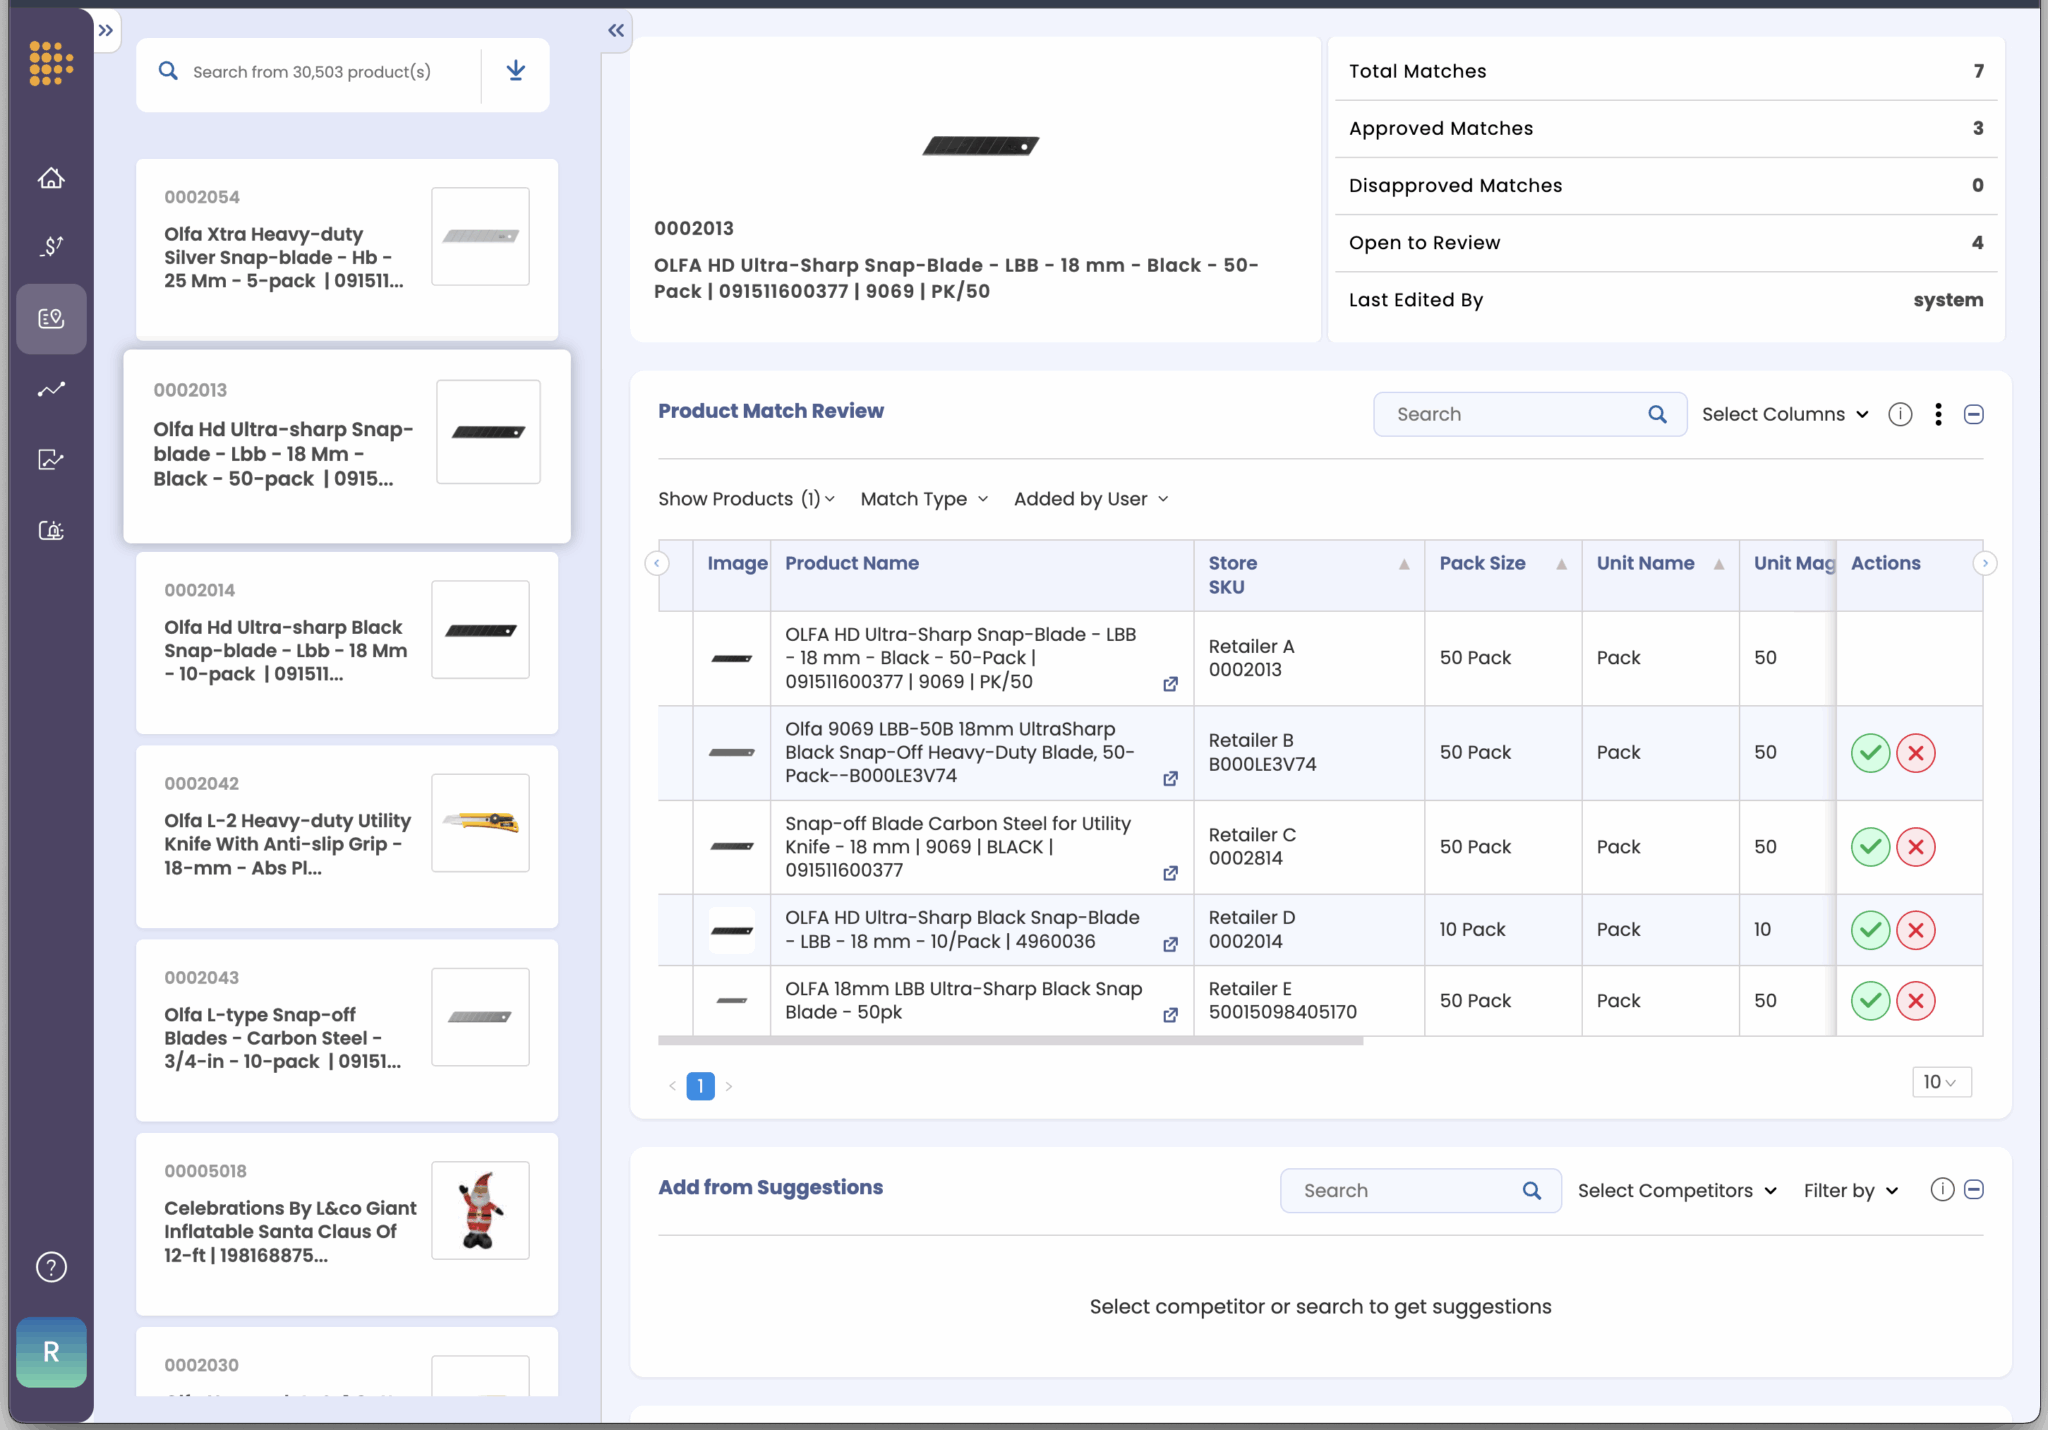
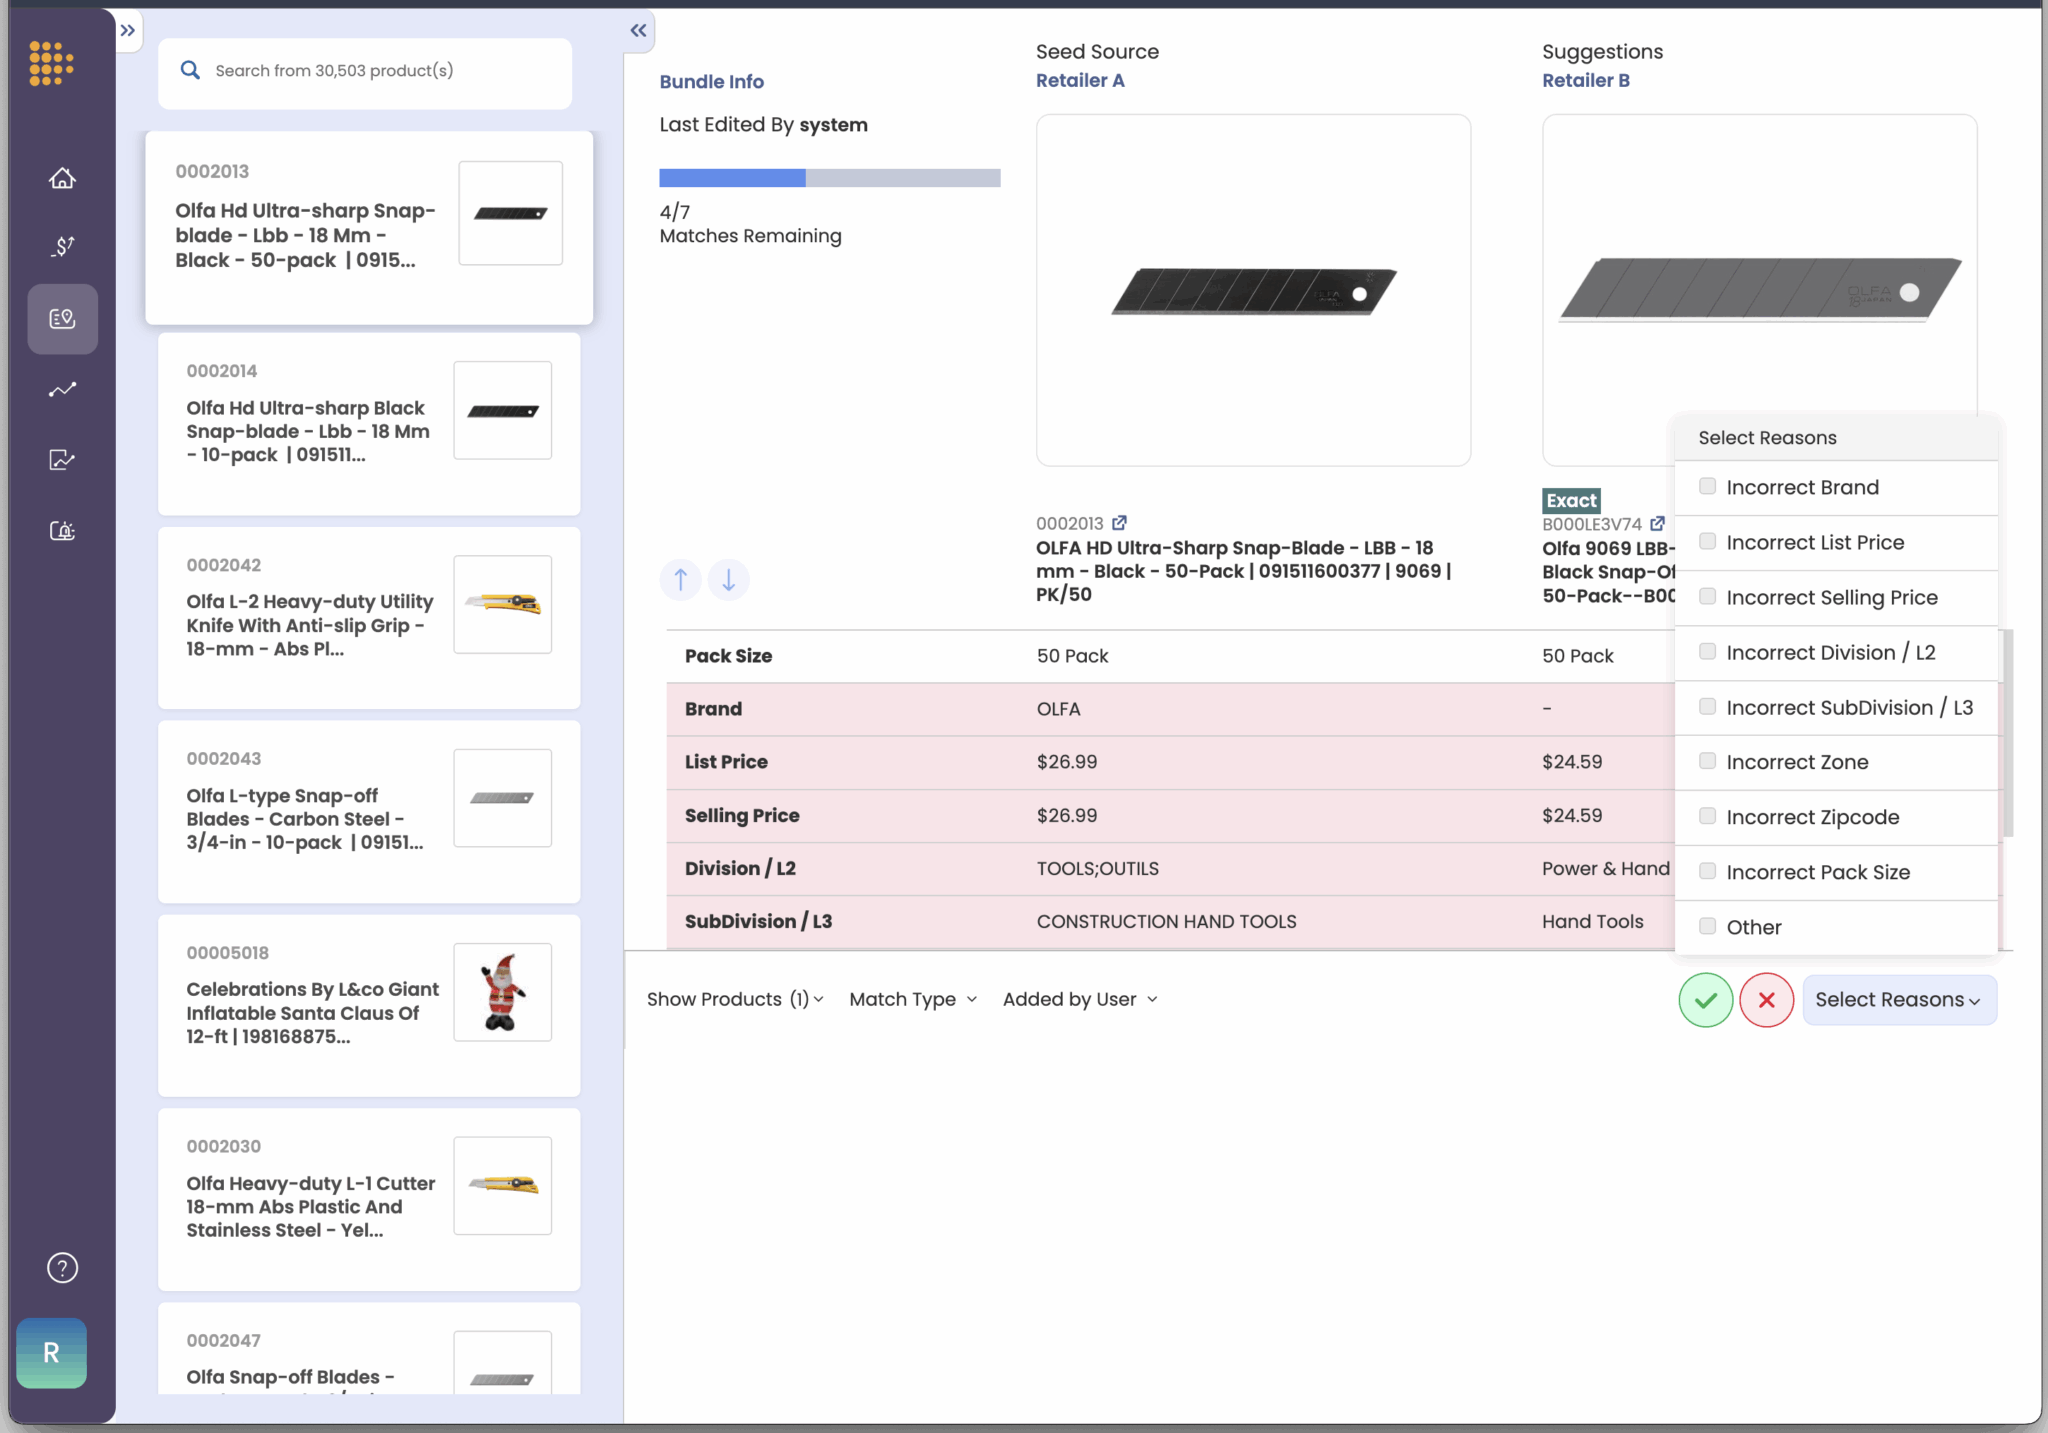
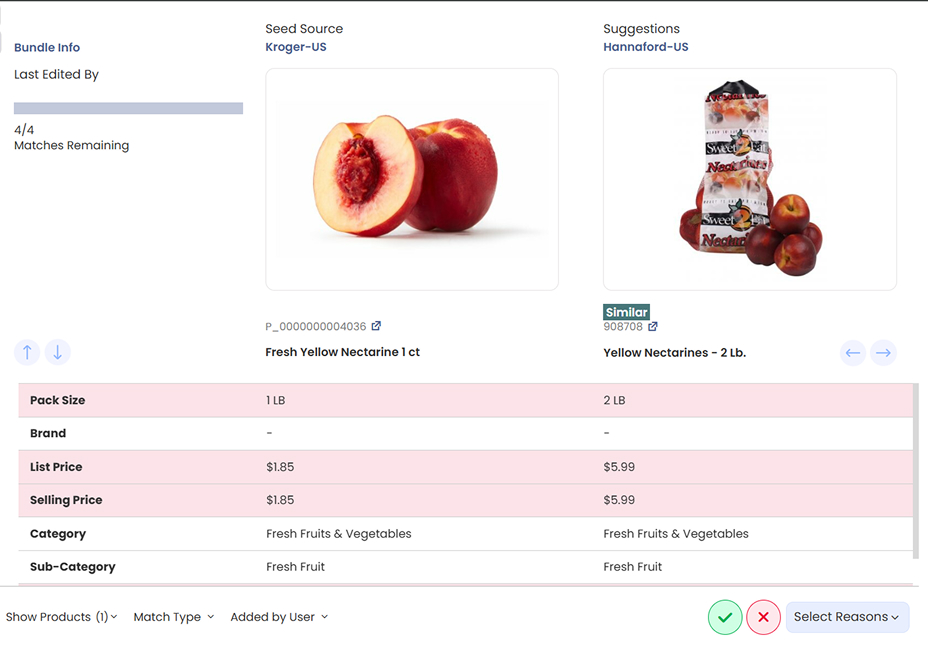
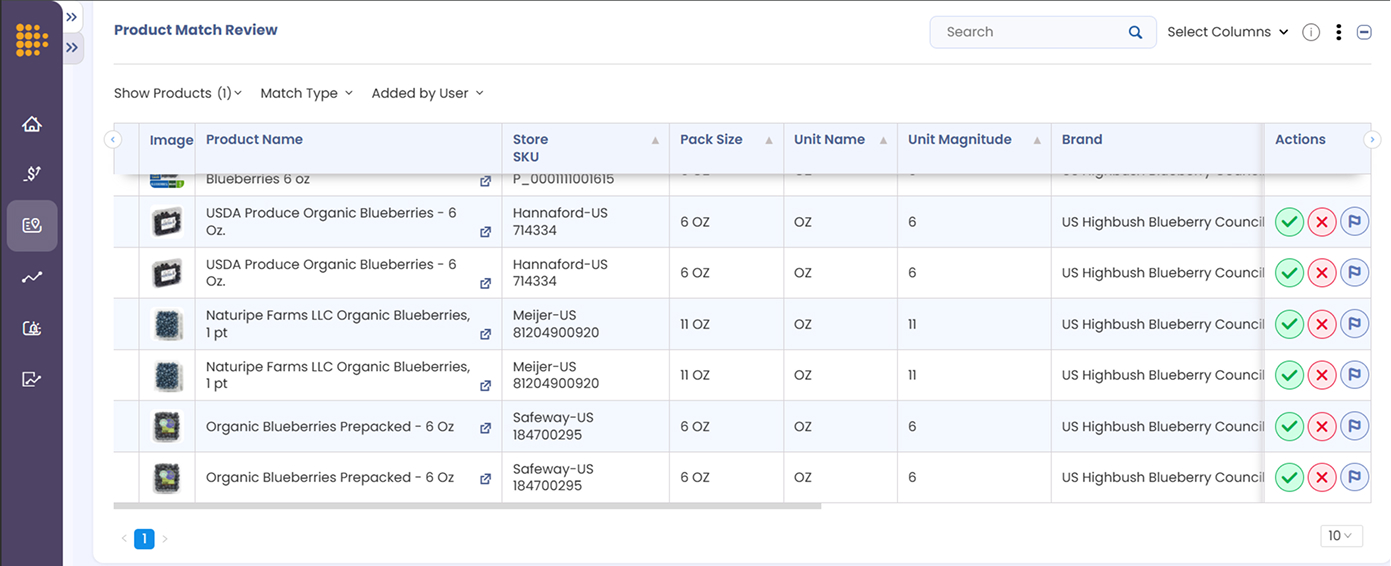
- Approve, reject, or flag AI-suggested matches. Every suggestion comes with full visibility into why it was made. Your team can validate matches quickly, fix errors, and improve the dataset in real time.
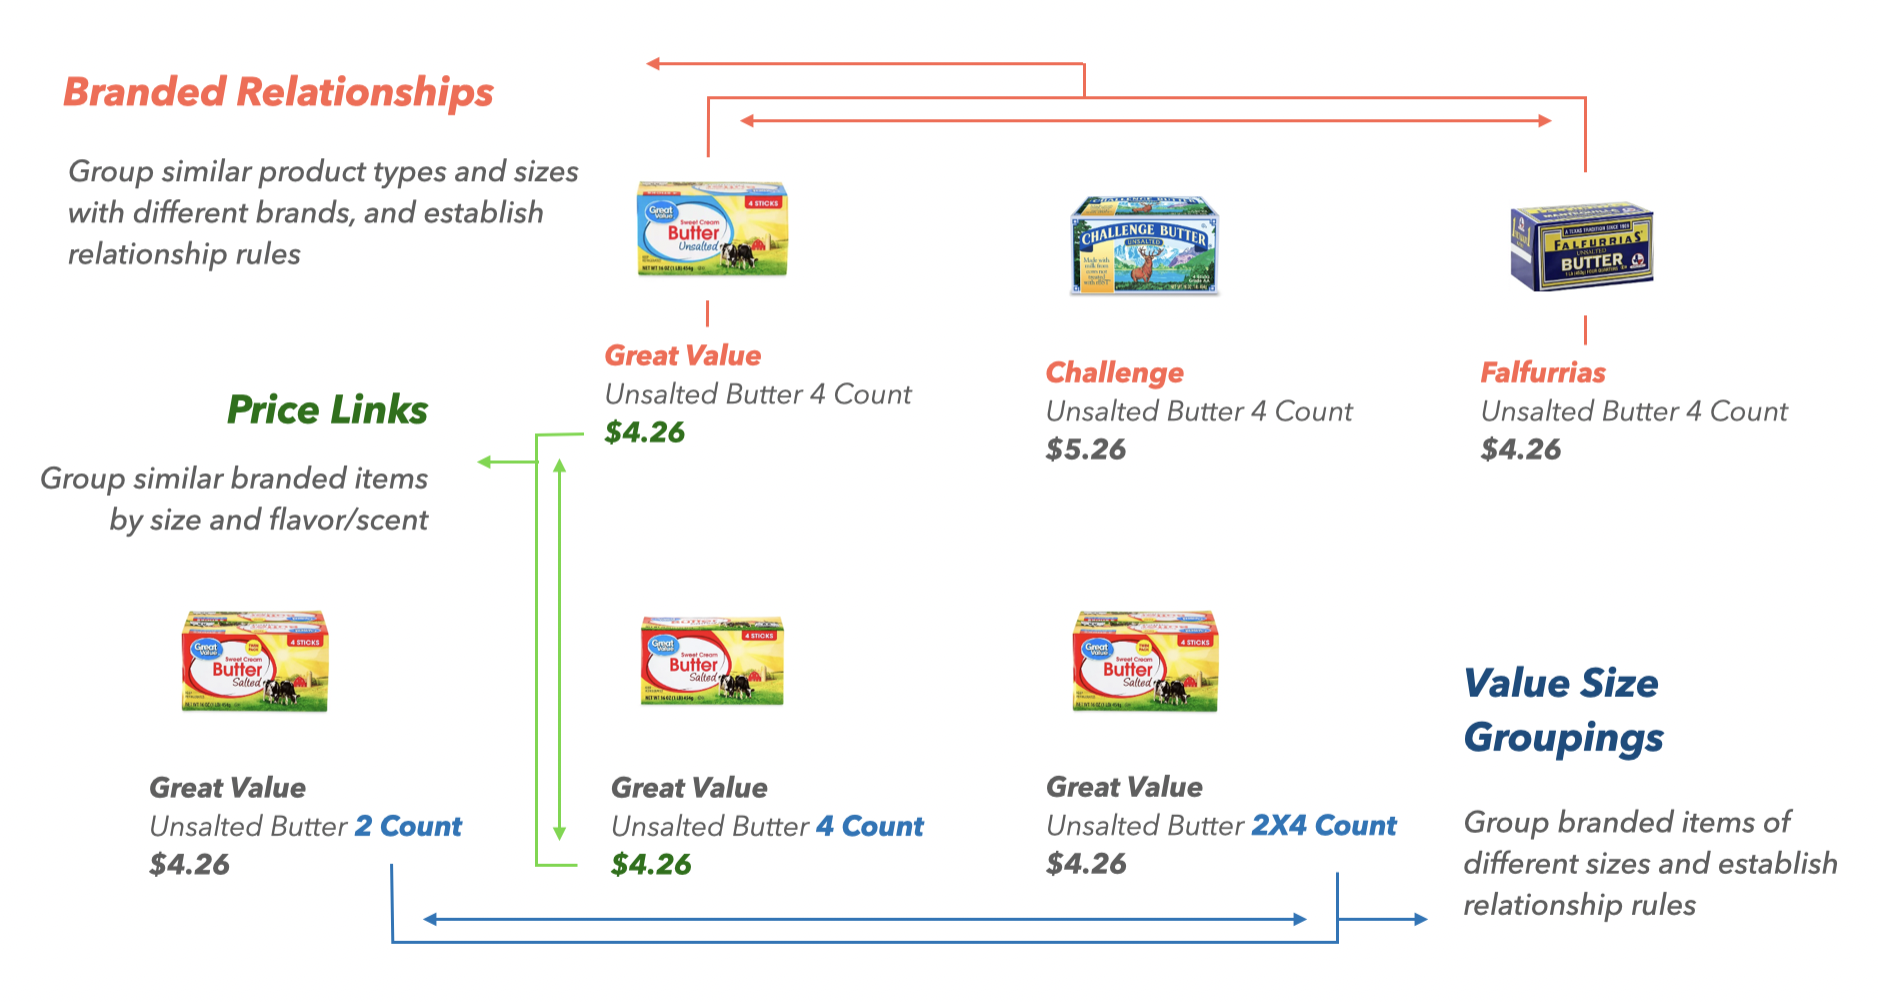
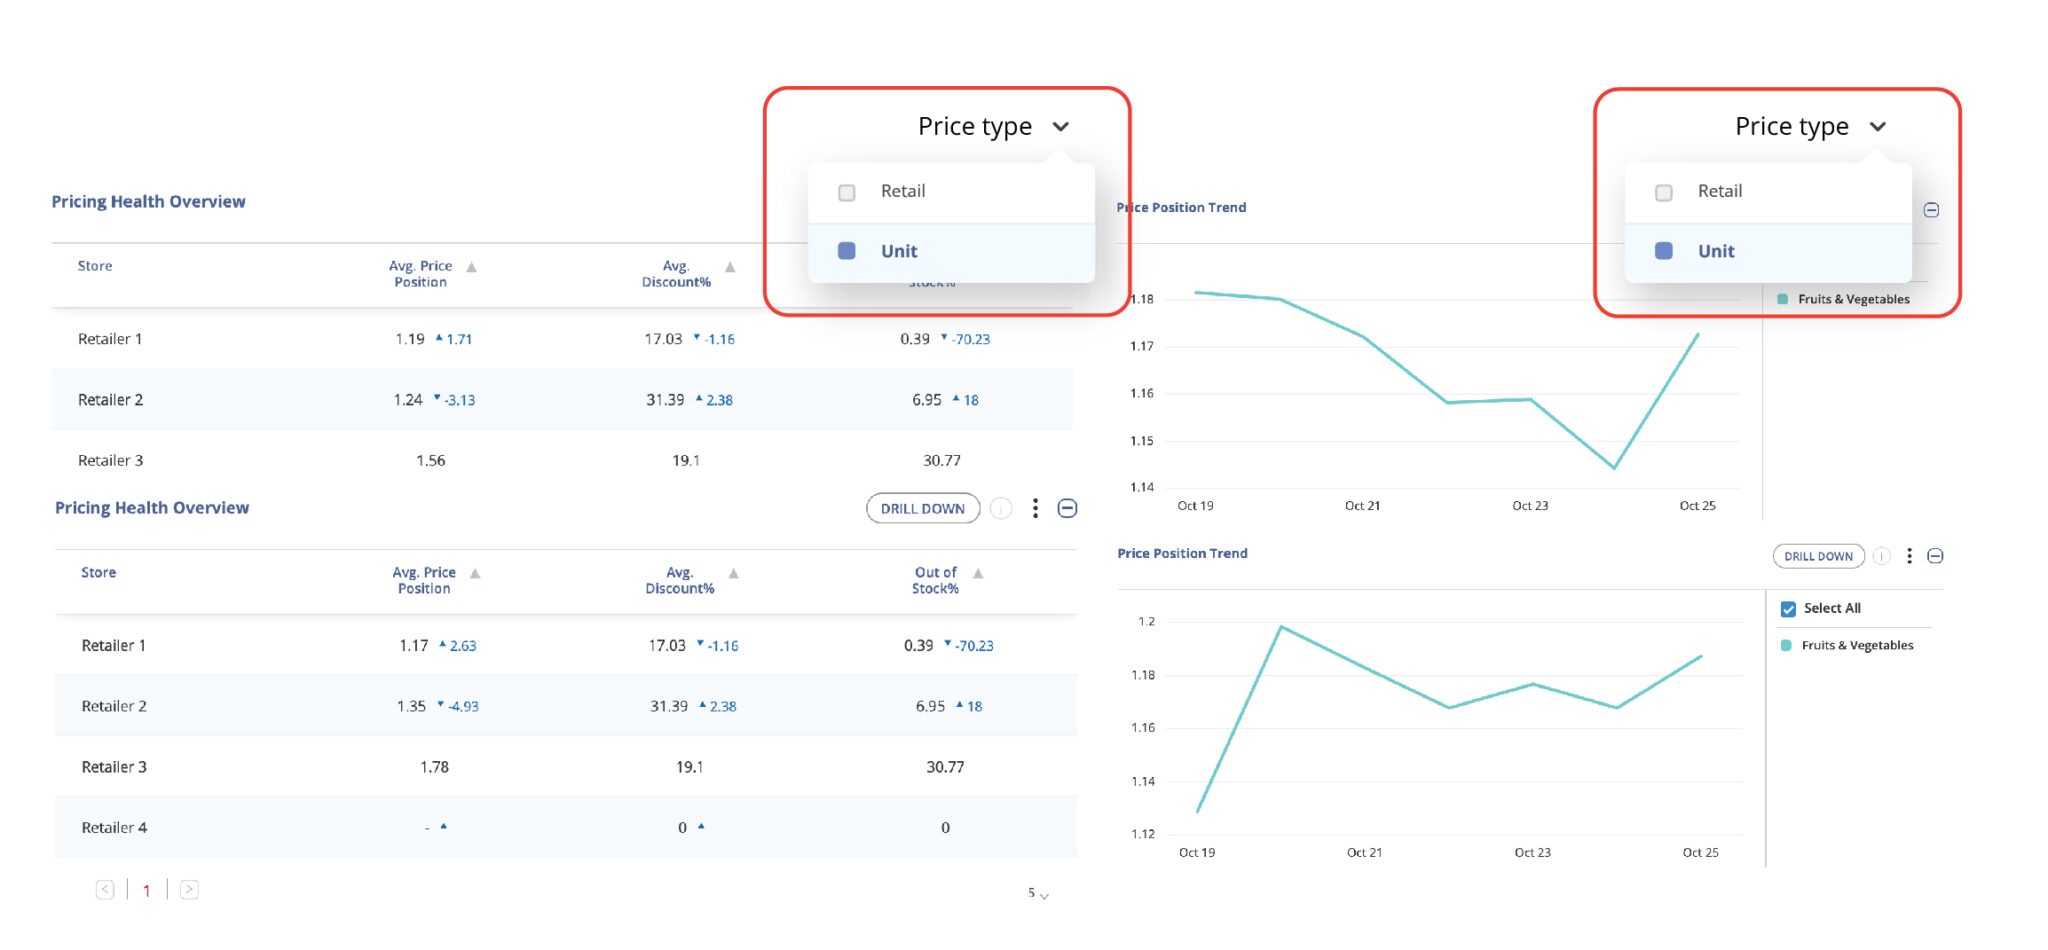
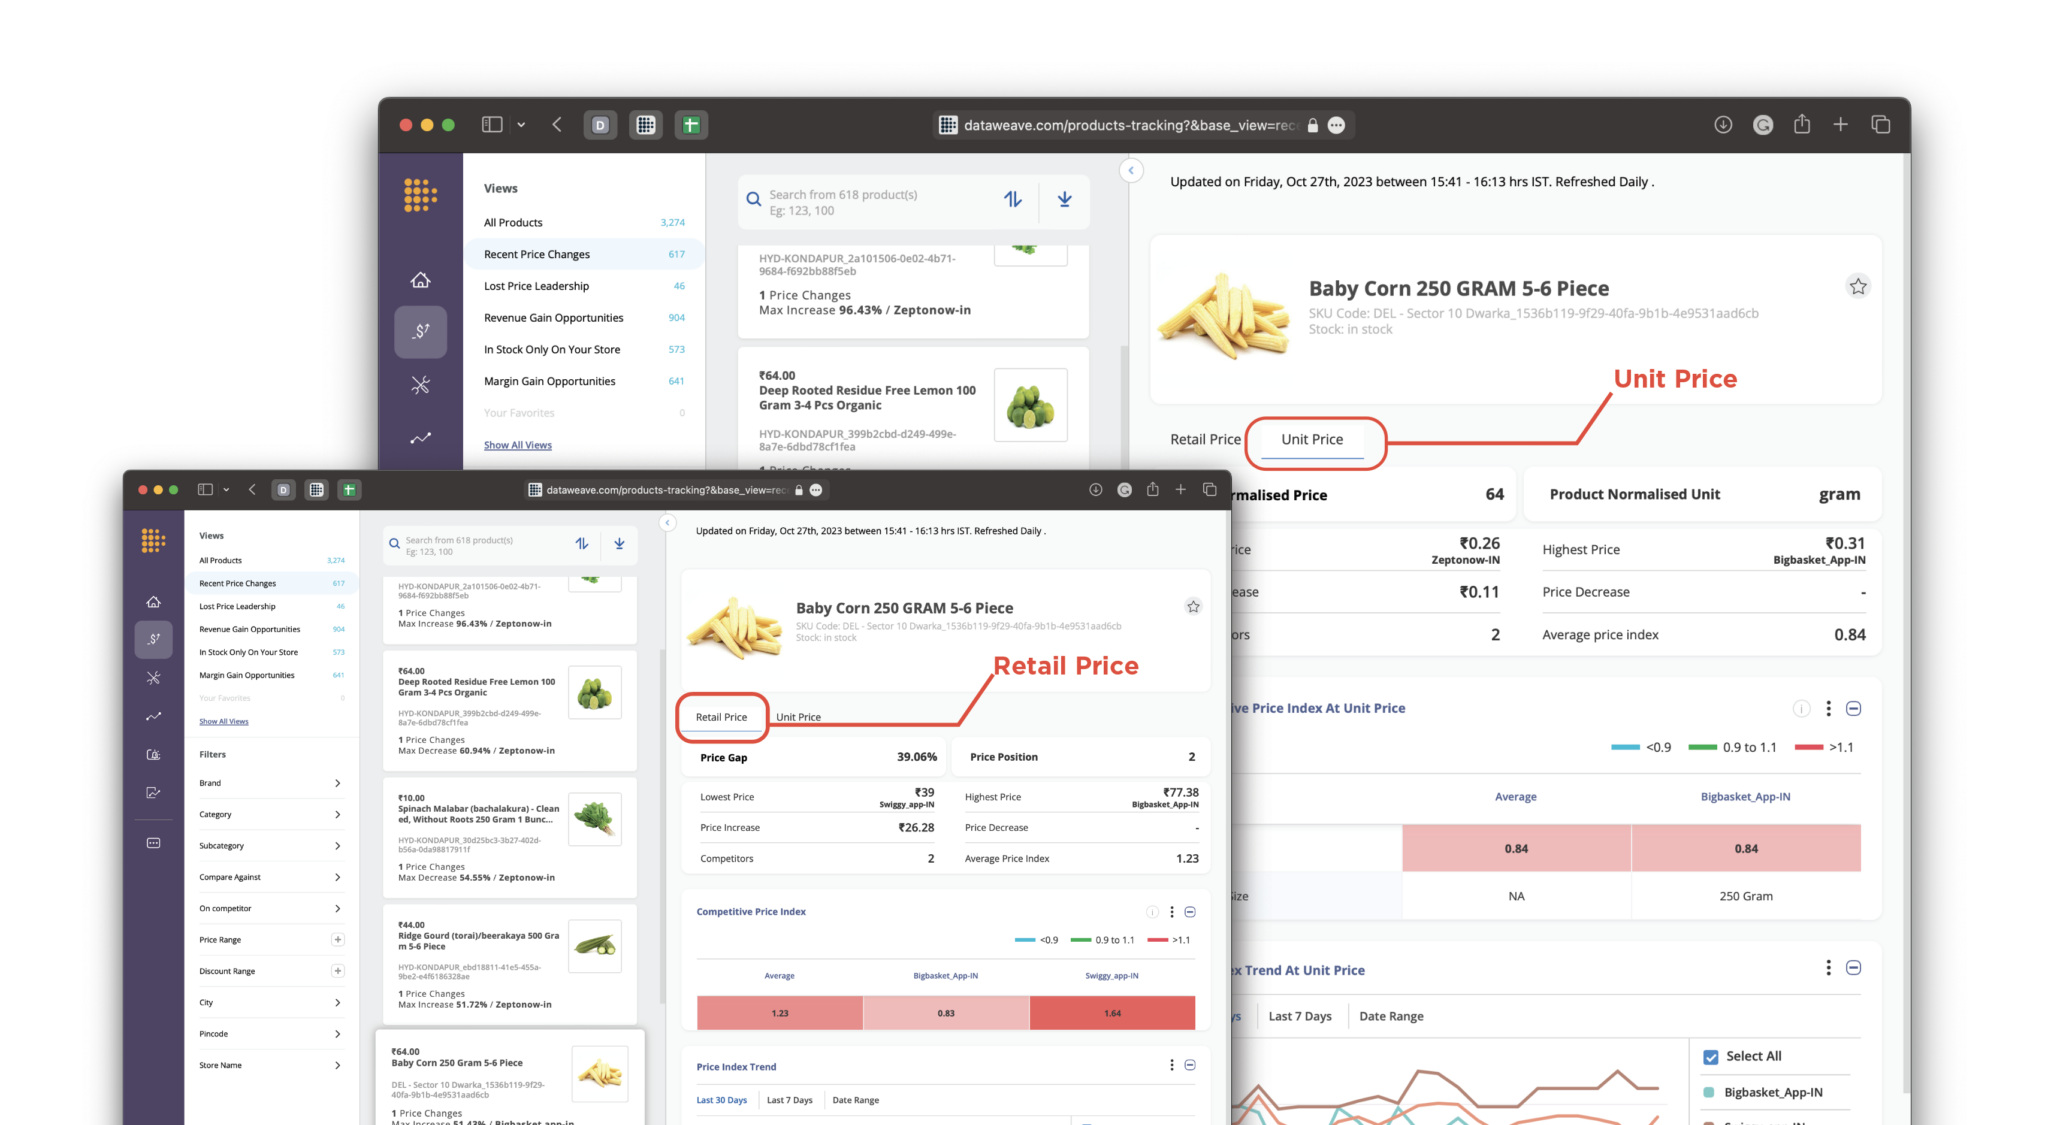
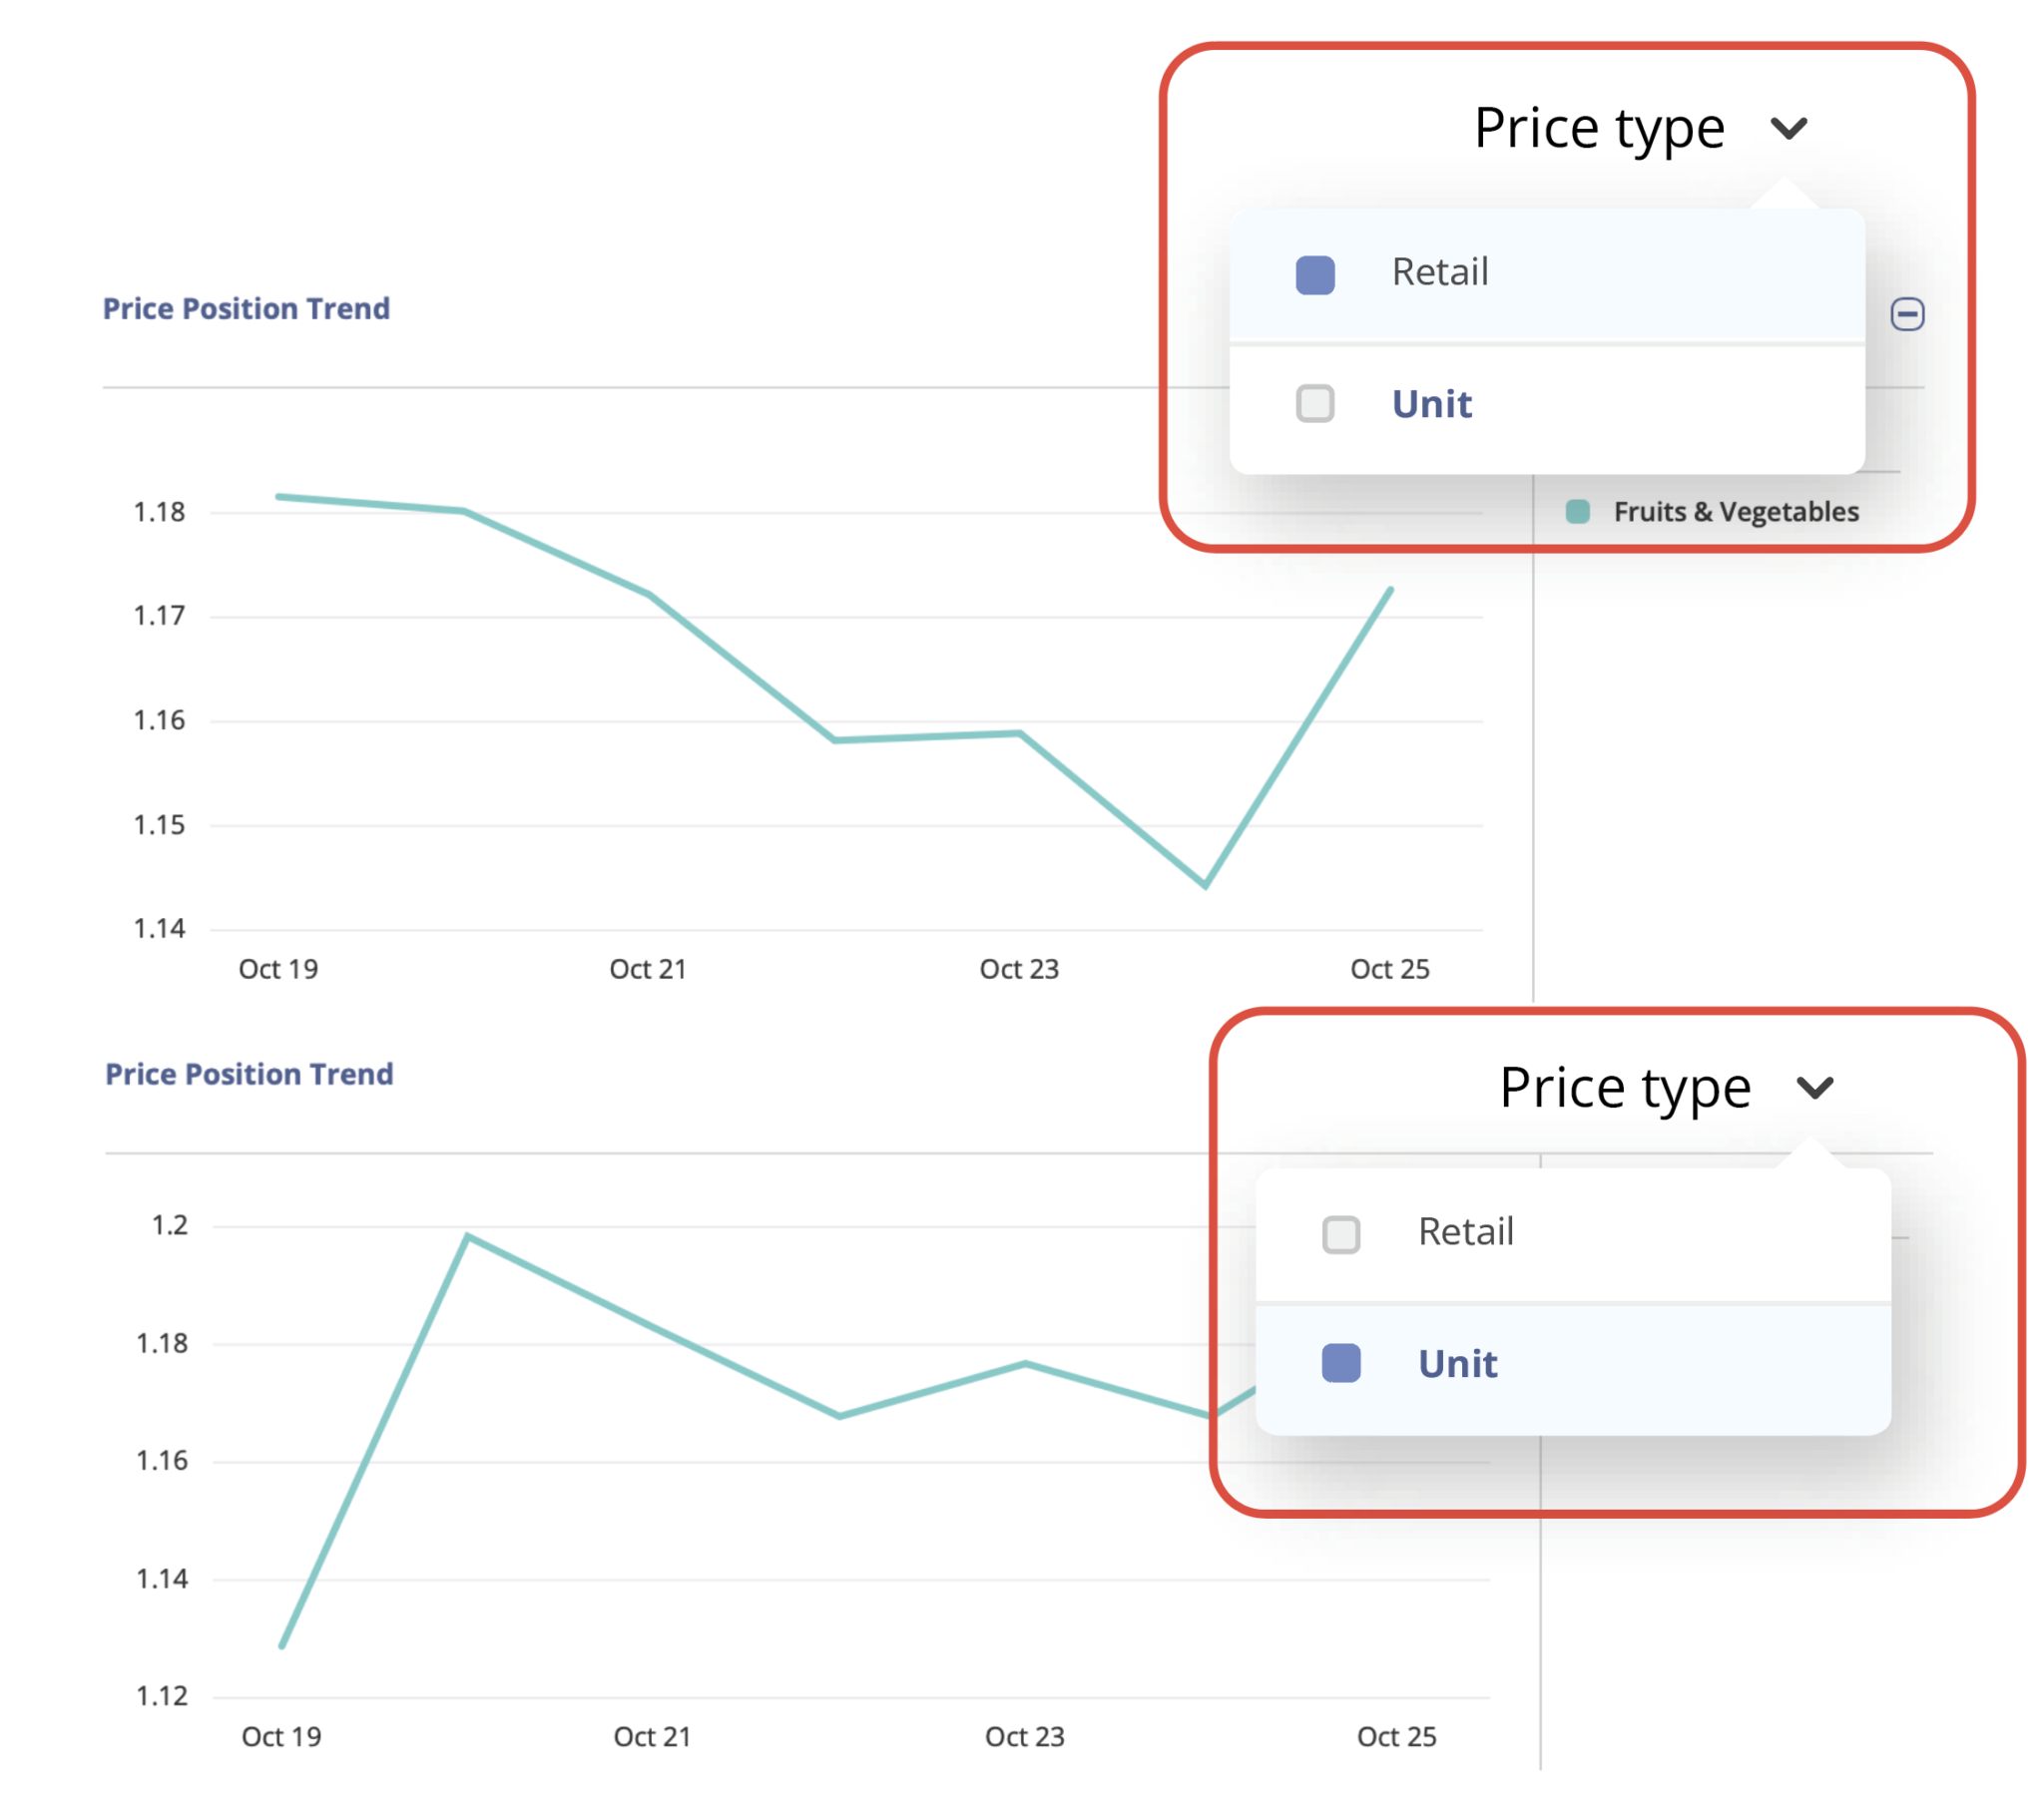
- Define what “similar” means for your business. A retailer may want to compare multipacks against single packs. A brand may only care about comparing premium products to other premium products. With User-Led Match Management, your team sets tolerance levels that match your strategy.
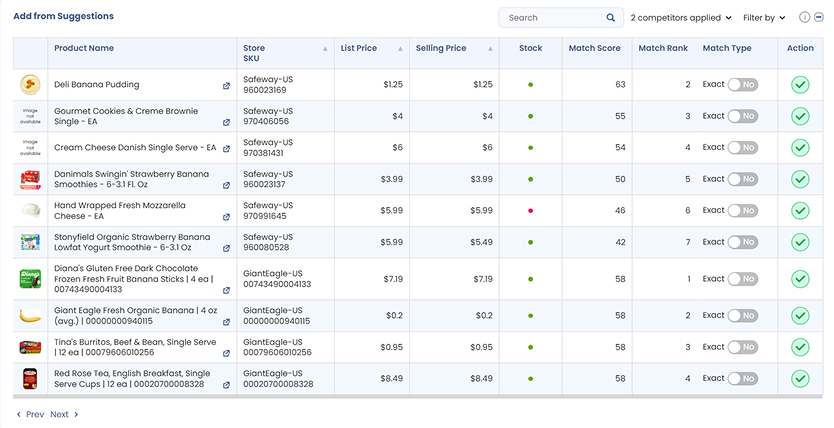
- Manually add or refine matches. When AI misses edge cases, your team can add them. This ensures coverage is complete and reflects the true competitive landscape.
This approach creates a loop where AI, complemented by DataWeave’s human-in-the-loop framework does the heavy lifting, and your teams can fine-tune the results. The outcome is both scale and accuracy.
Key Features
DataWeave designed User-Led Match Management to be simple, intuitive, and scalable:
- Expert-Led Decision Making forms the heart of the system. Rather than trusting AI suggestions blindly, teams gain full visibility into matching logic and can leverage their contextual knowledge of products, categories, and retailers. When the system suggests matching a premium product against a basic alternative, human experts can reject the match and flag it for different criteria. This expertise is particularly valuable for new product launches, seasonal items, or products with complex positioning strategies.
- Business Logic Integration: Teams can define matching parameters that reflect their specific strategic needs. A premium brand might establish rules that prevent matches against budget alternatives, while a value retailer might specifically seek those comparisons. Category managers can create different matching criteria for different product lines, ensuring that seasonal items, limited editions, and promotional products are handled appropriately.
- Transparent Decision Making: Every match decision creates an audit trail capturing who made the decision, when it occurred, and the reasoning behind it. This transparency is crucial for enterprise environments where pricing decisions need to be defensible and strategies need to be consistent across teams and time periods.
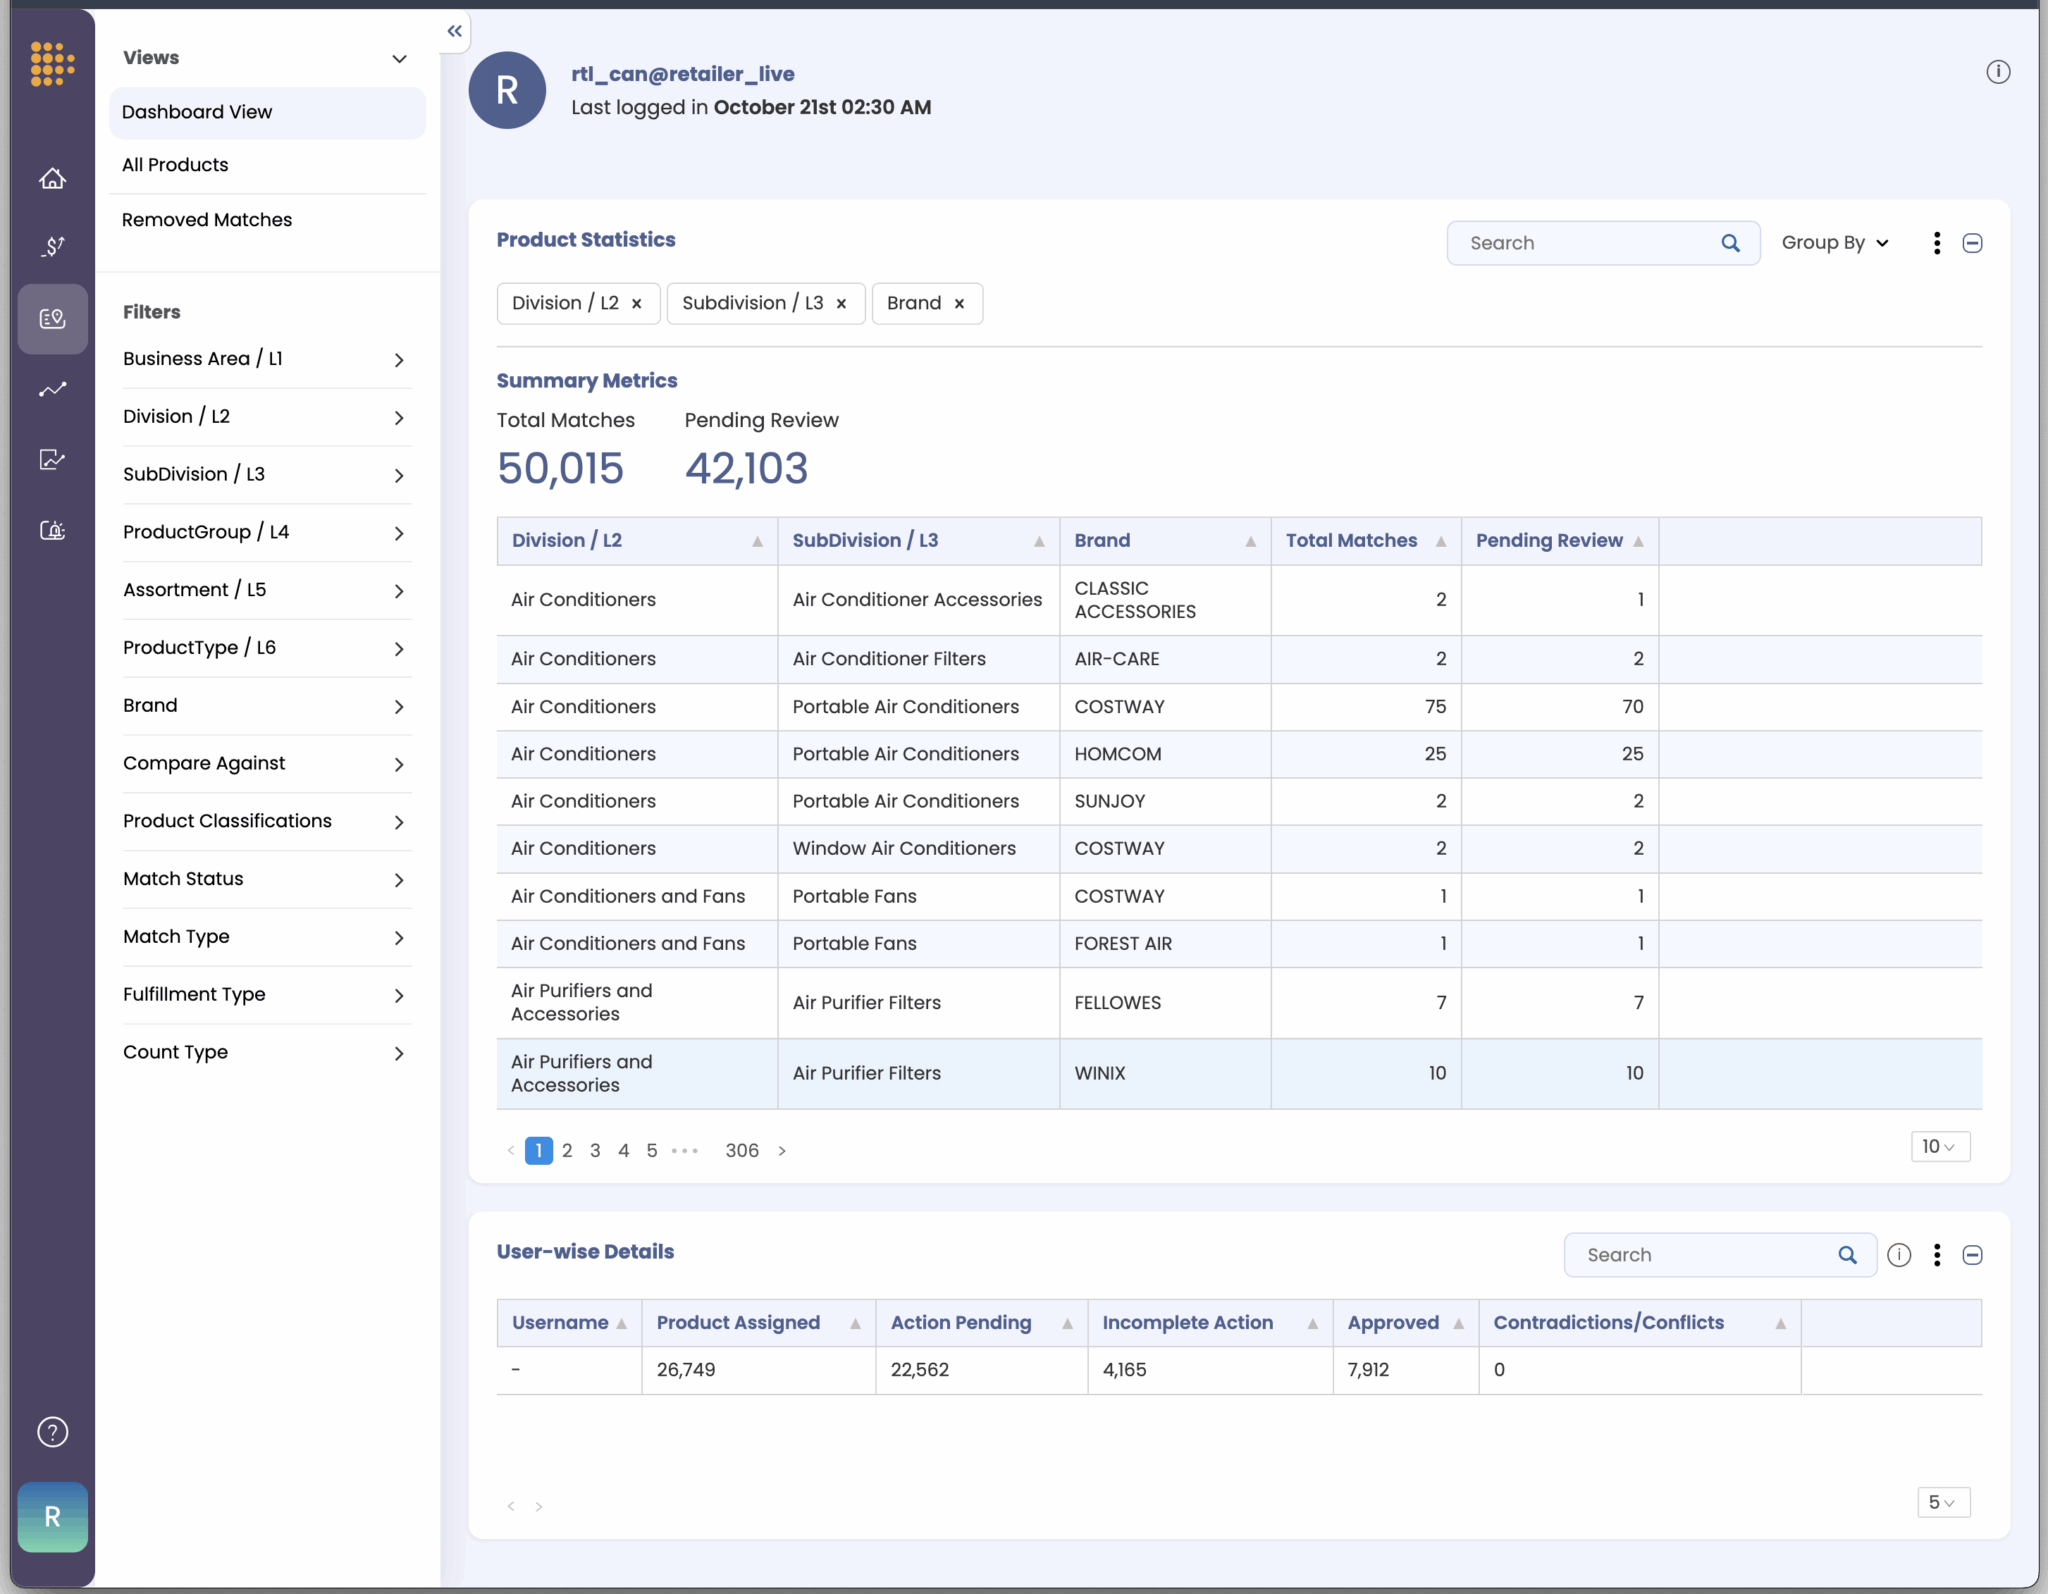
- Scalable Validation: User-Led systems provide bulk operations for efficiency while maintaining oversight. Teams can upload thousands of matches for validation, use filtered views to focus on high-priority items, and leverage automated alerts for matches that fall outside established tolerance levels.
Each of these features reduces the friction between AI outputs and business-ready insights.
Technical Foundation
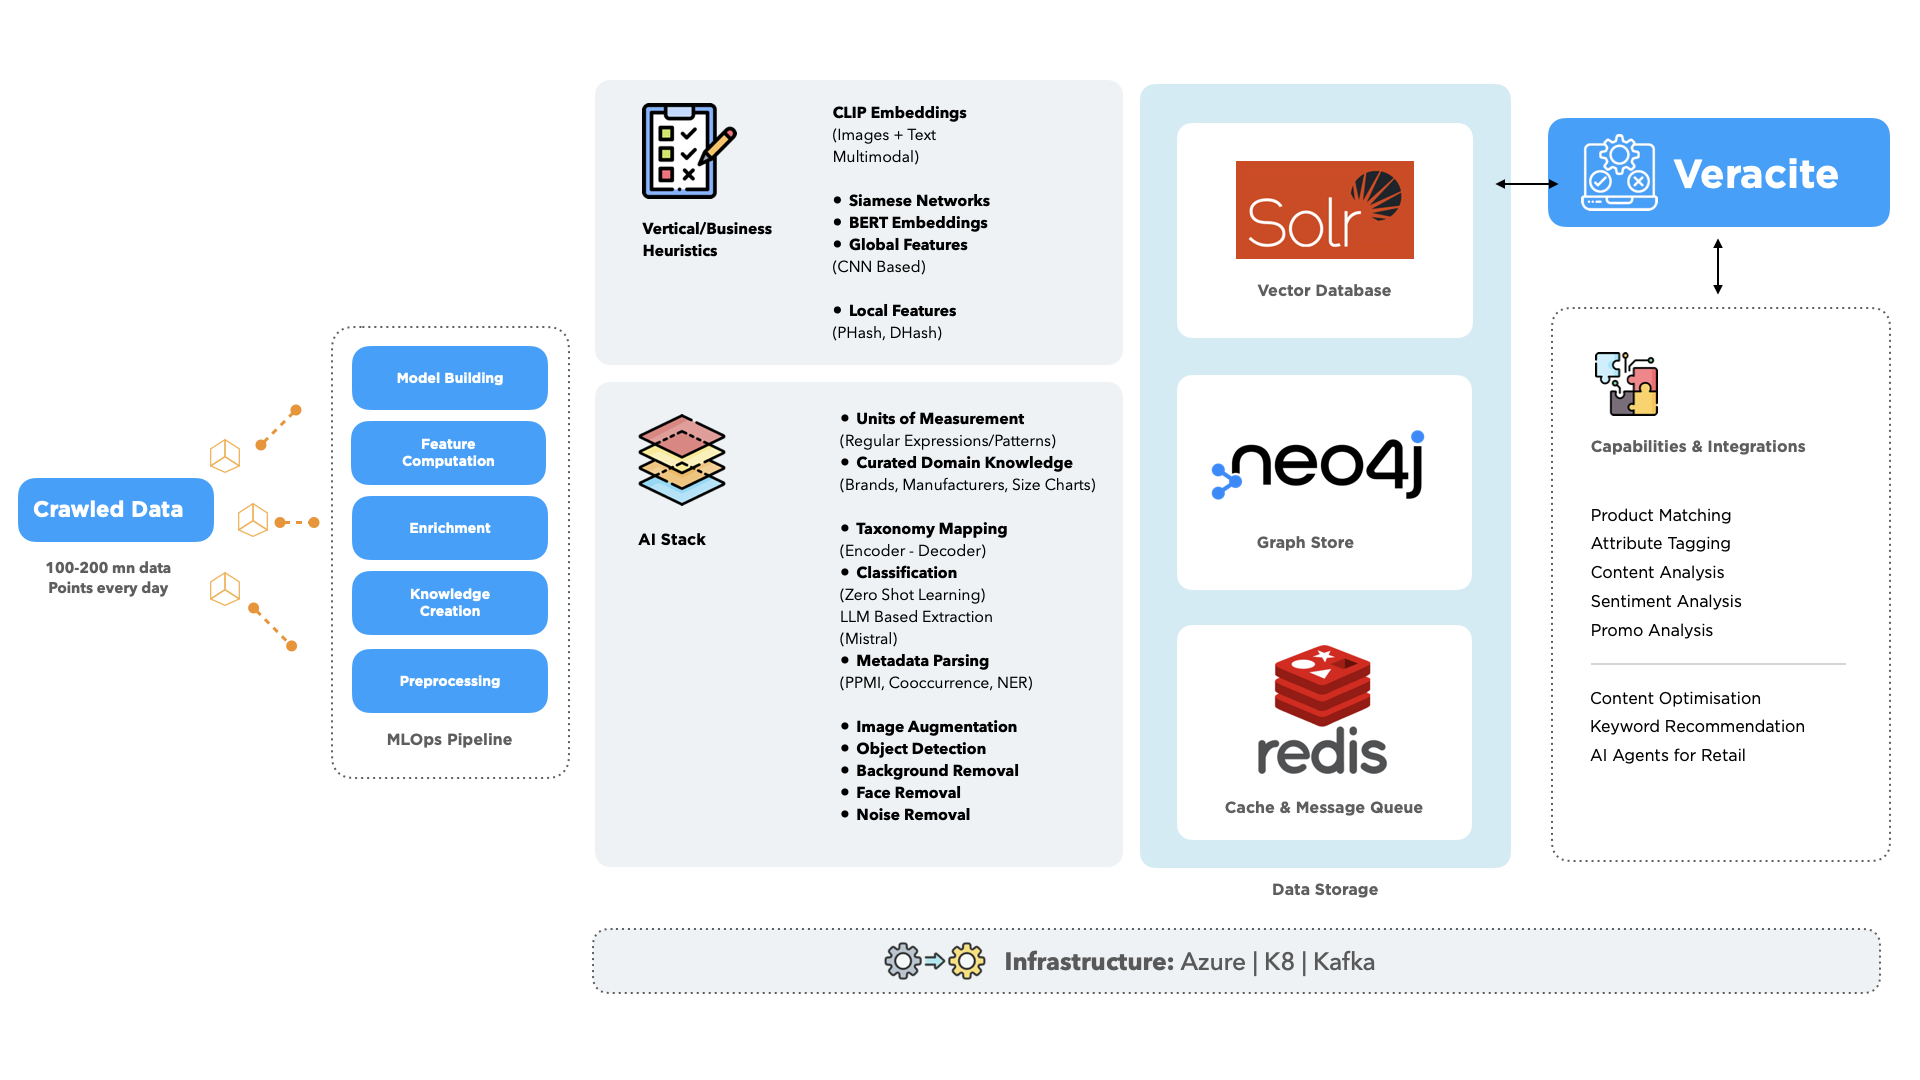
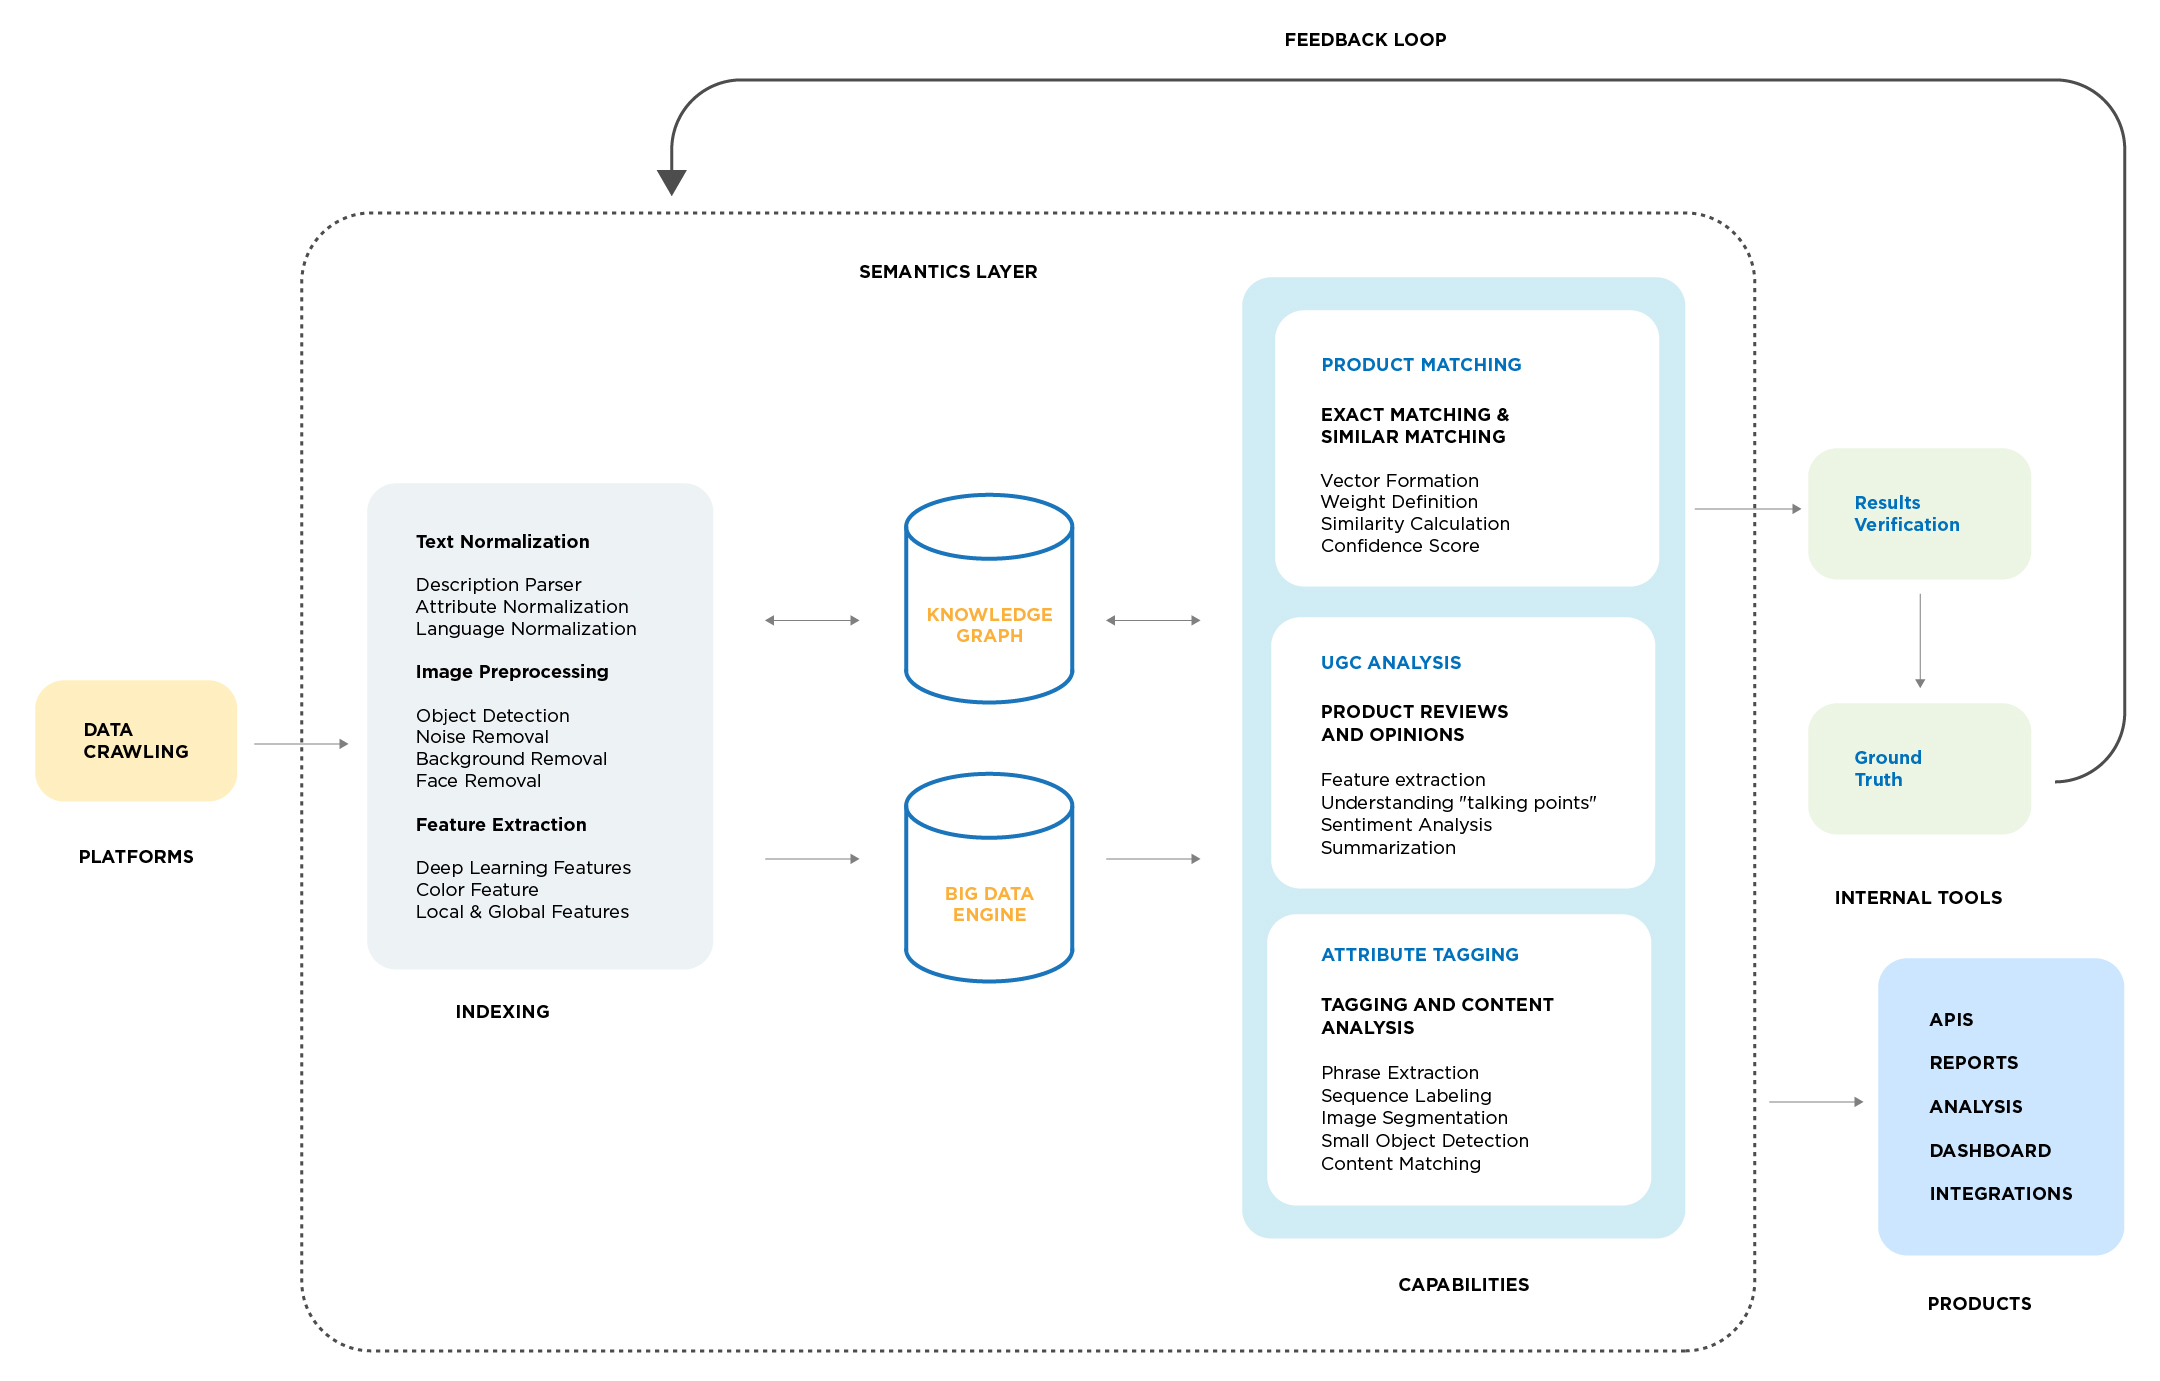
The AI foundation behind User-Led Match Management is built for precision and scale.
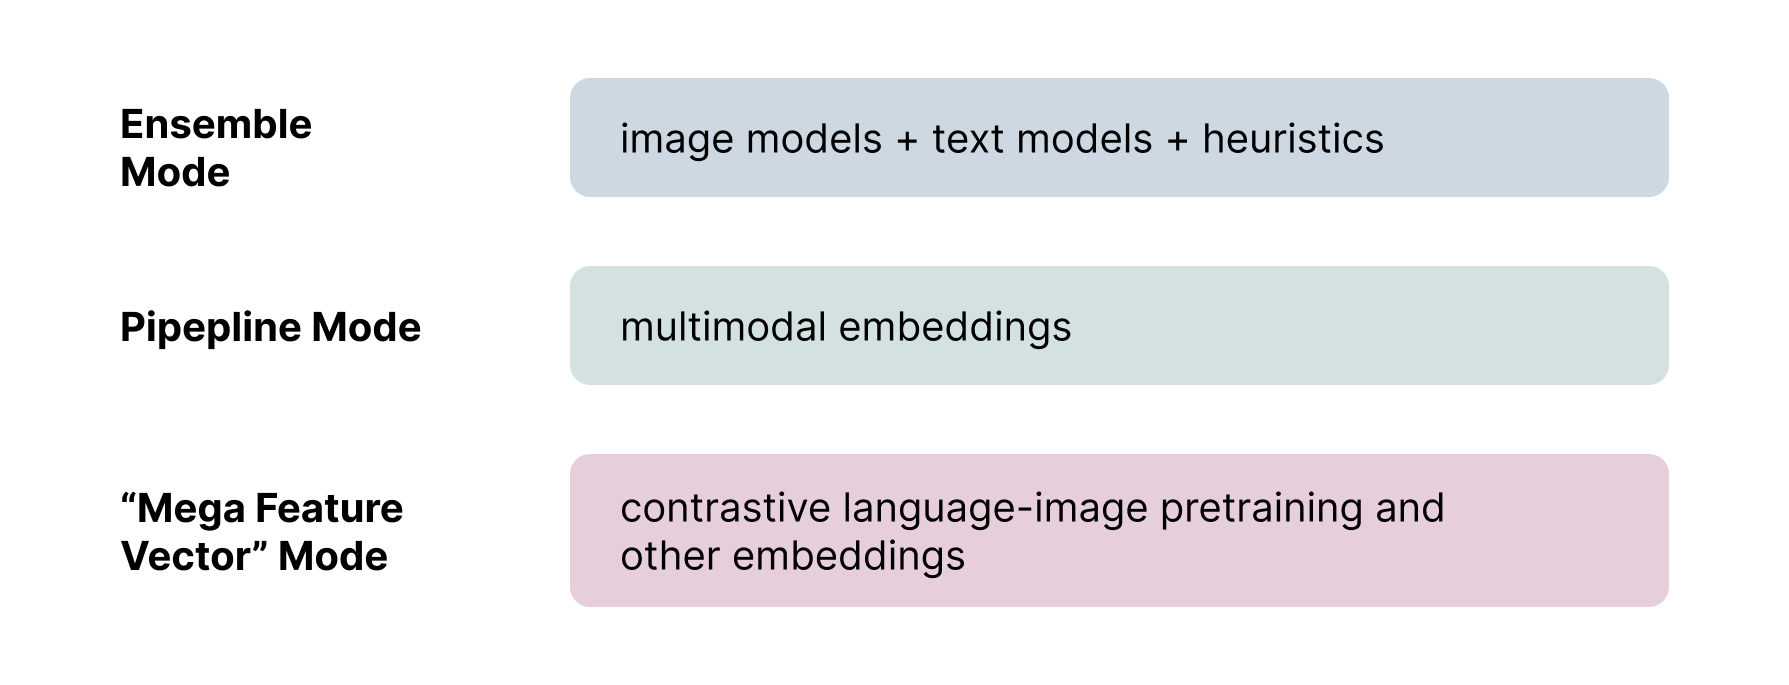
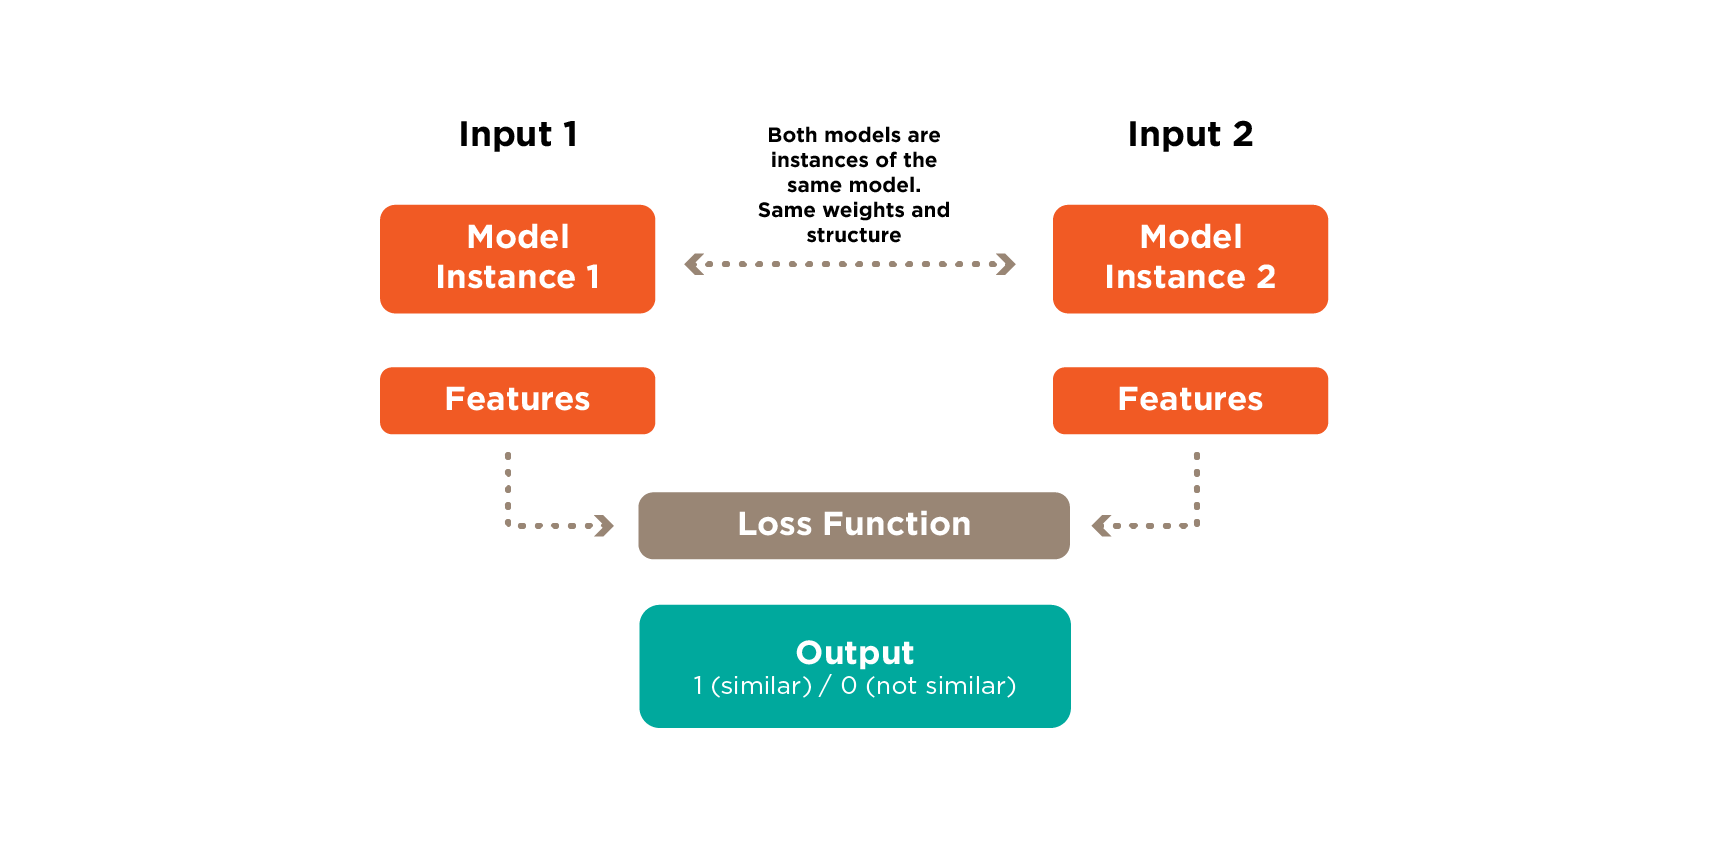
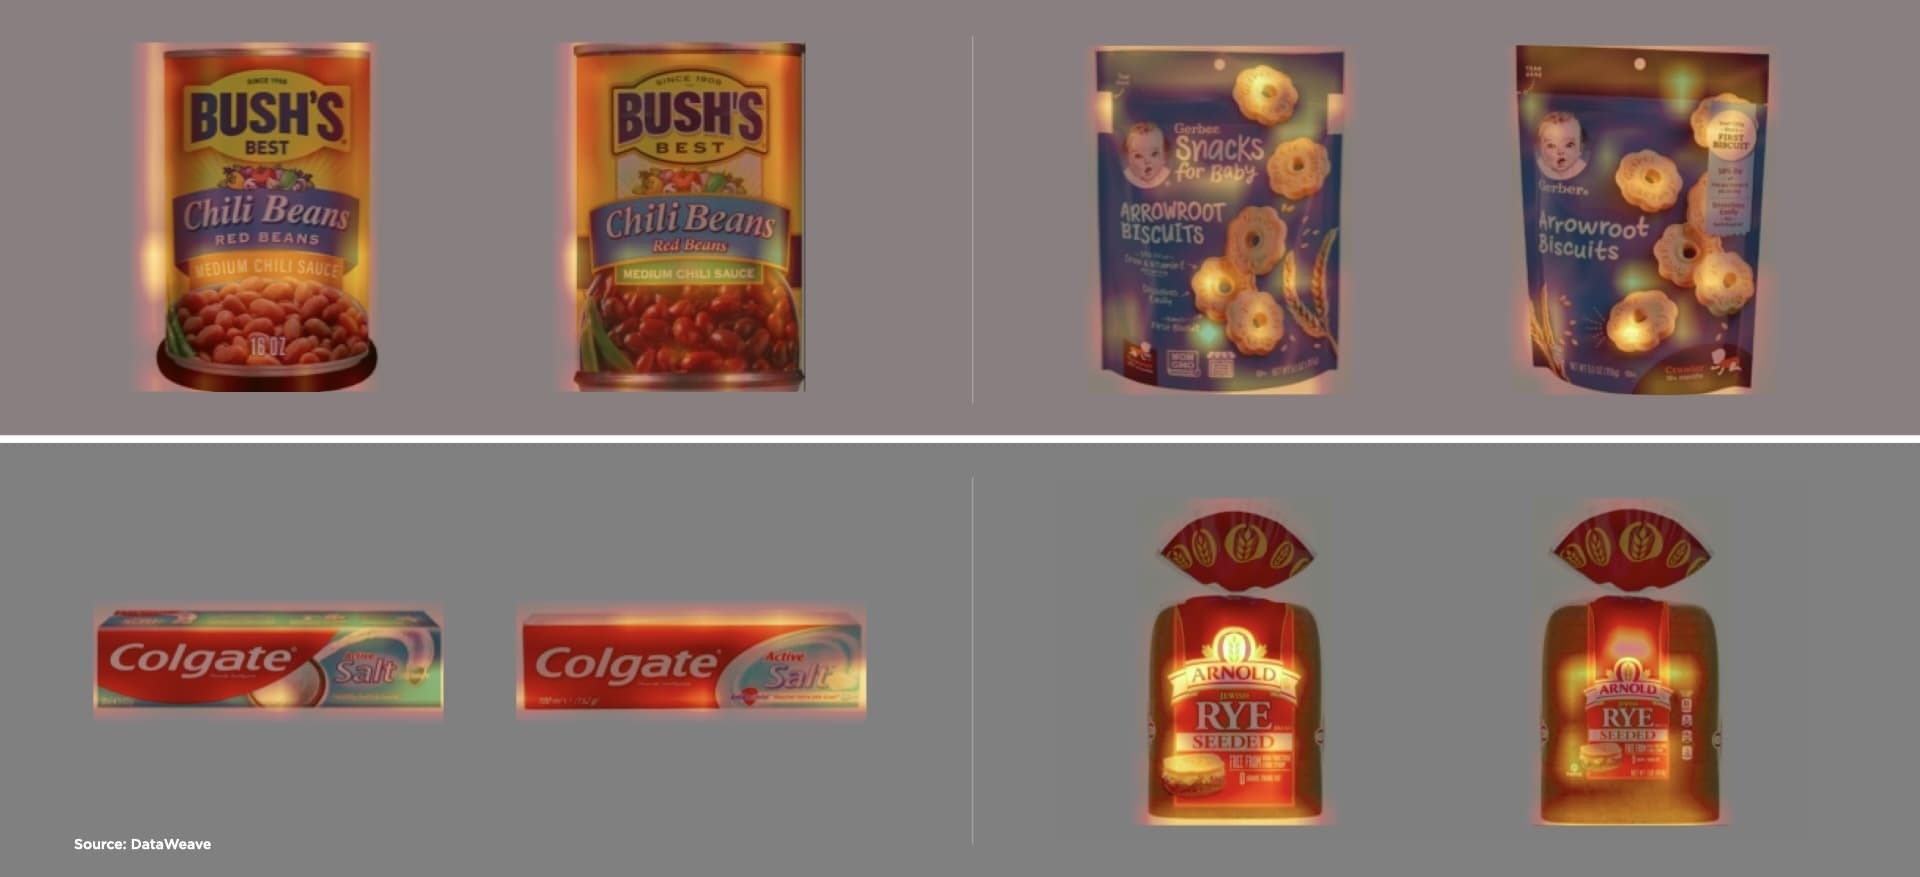
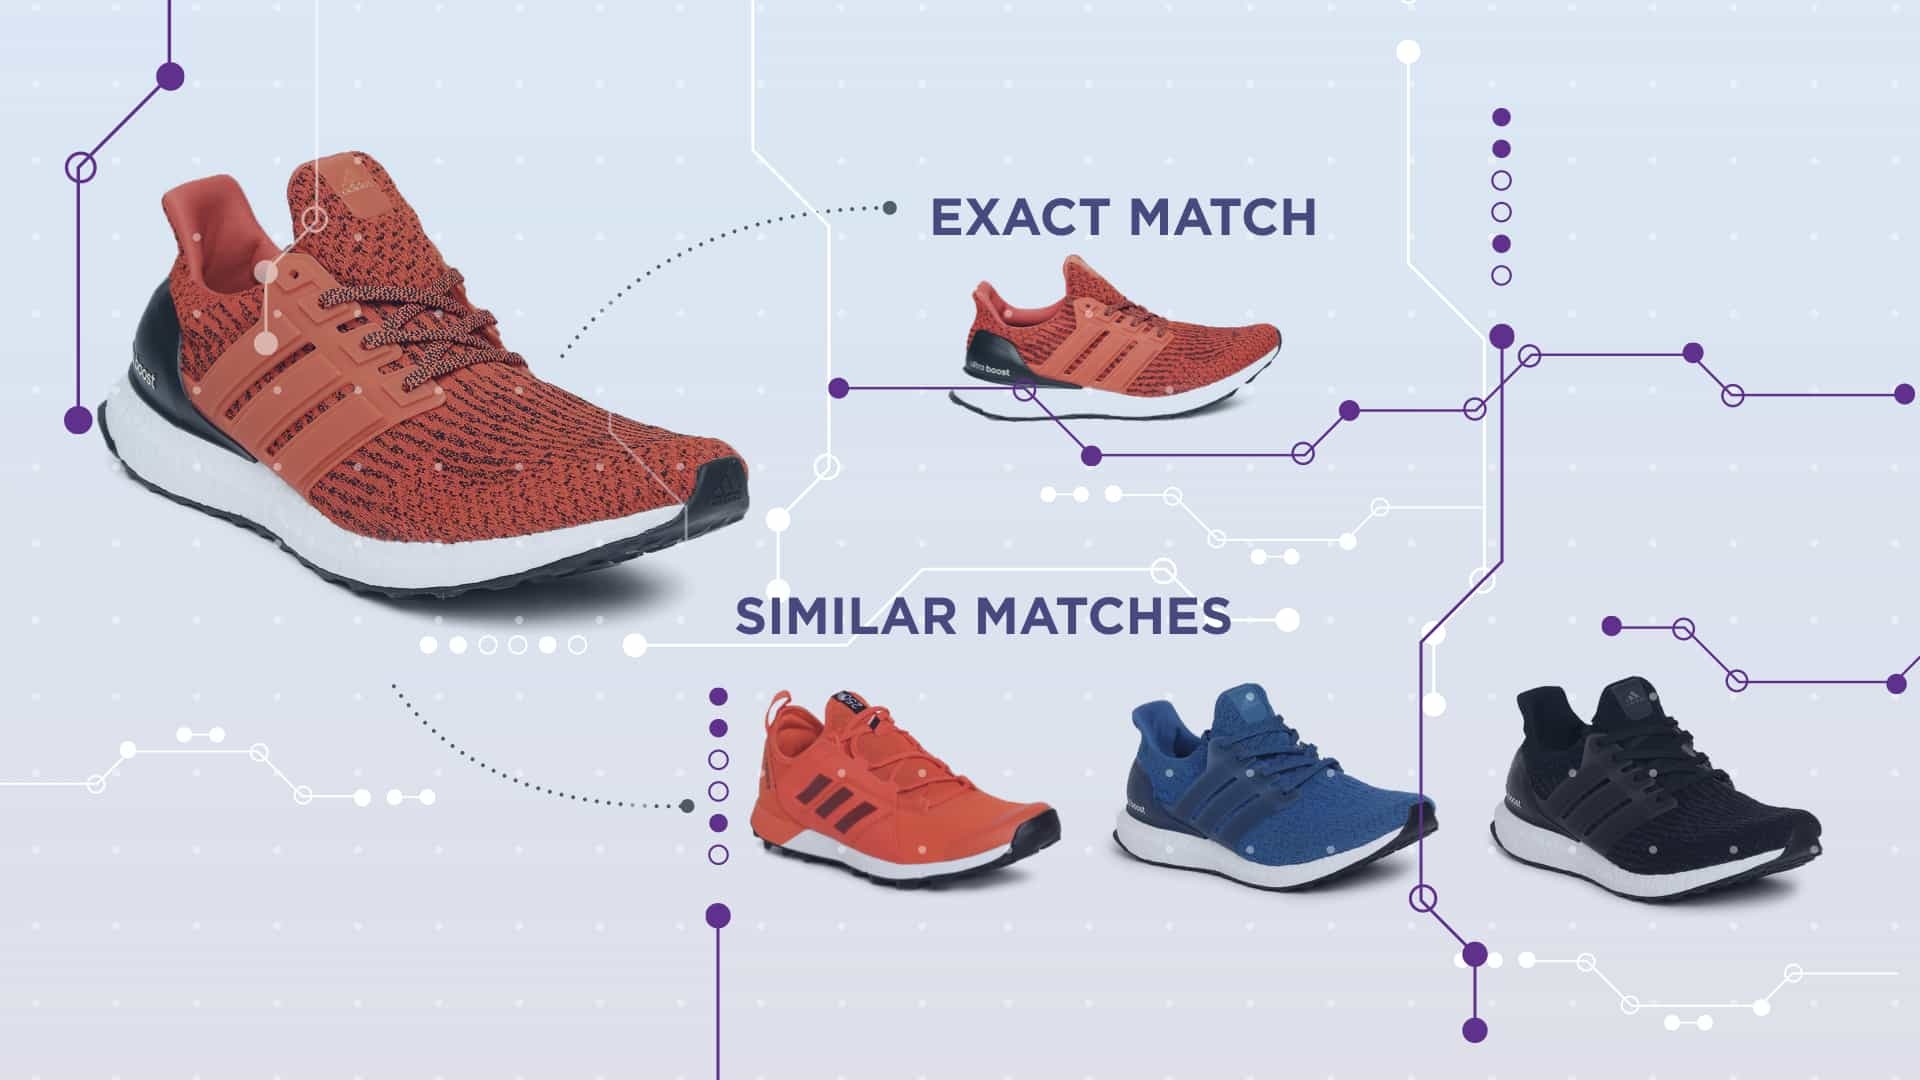
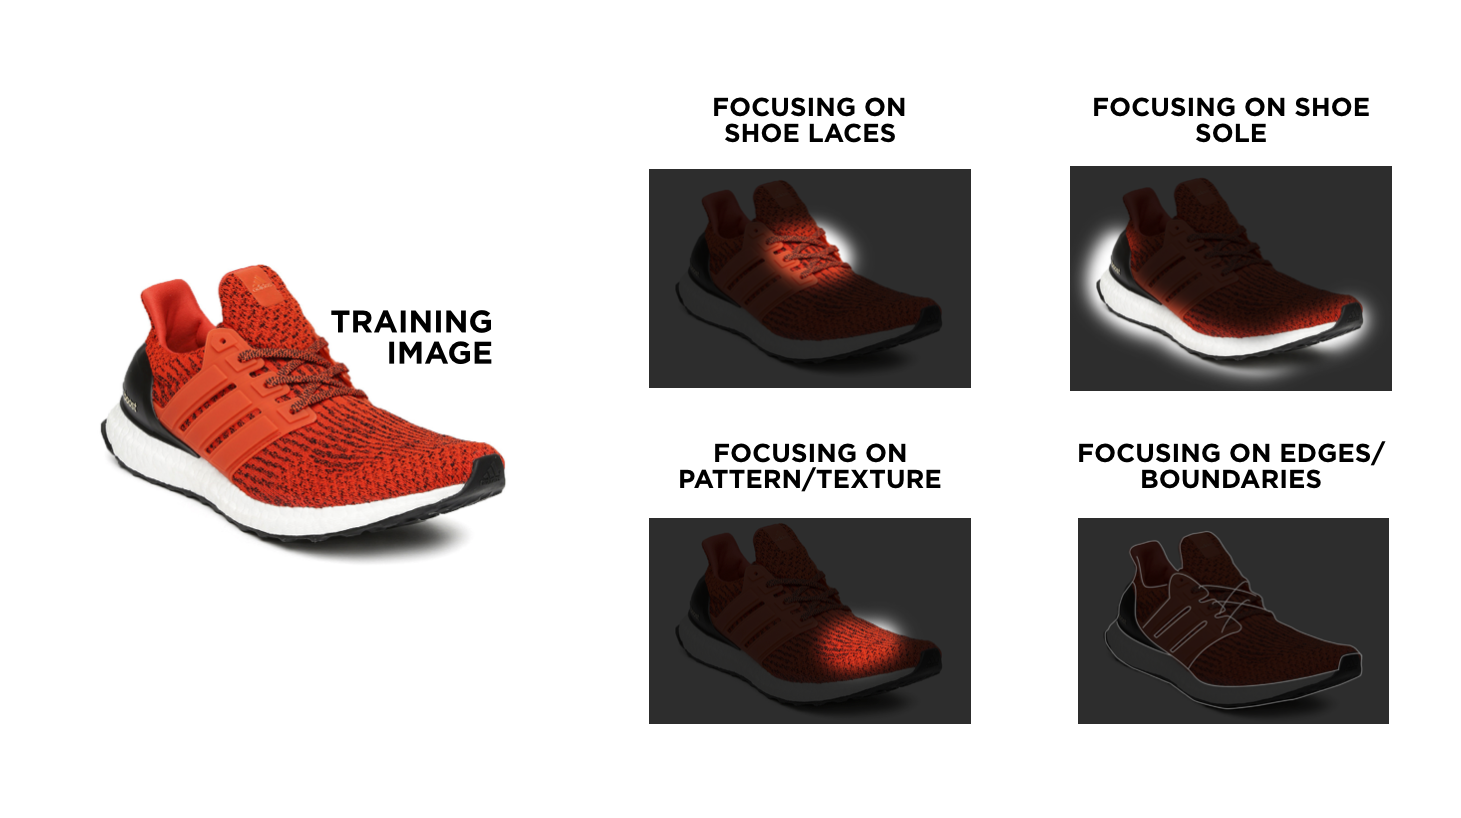
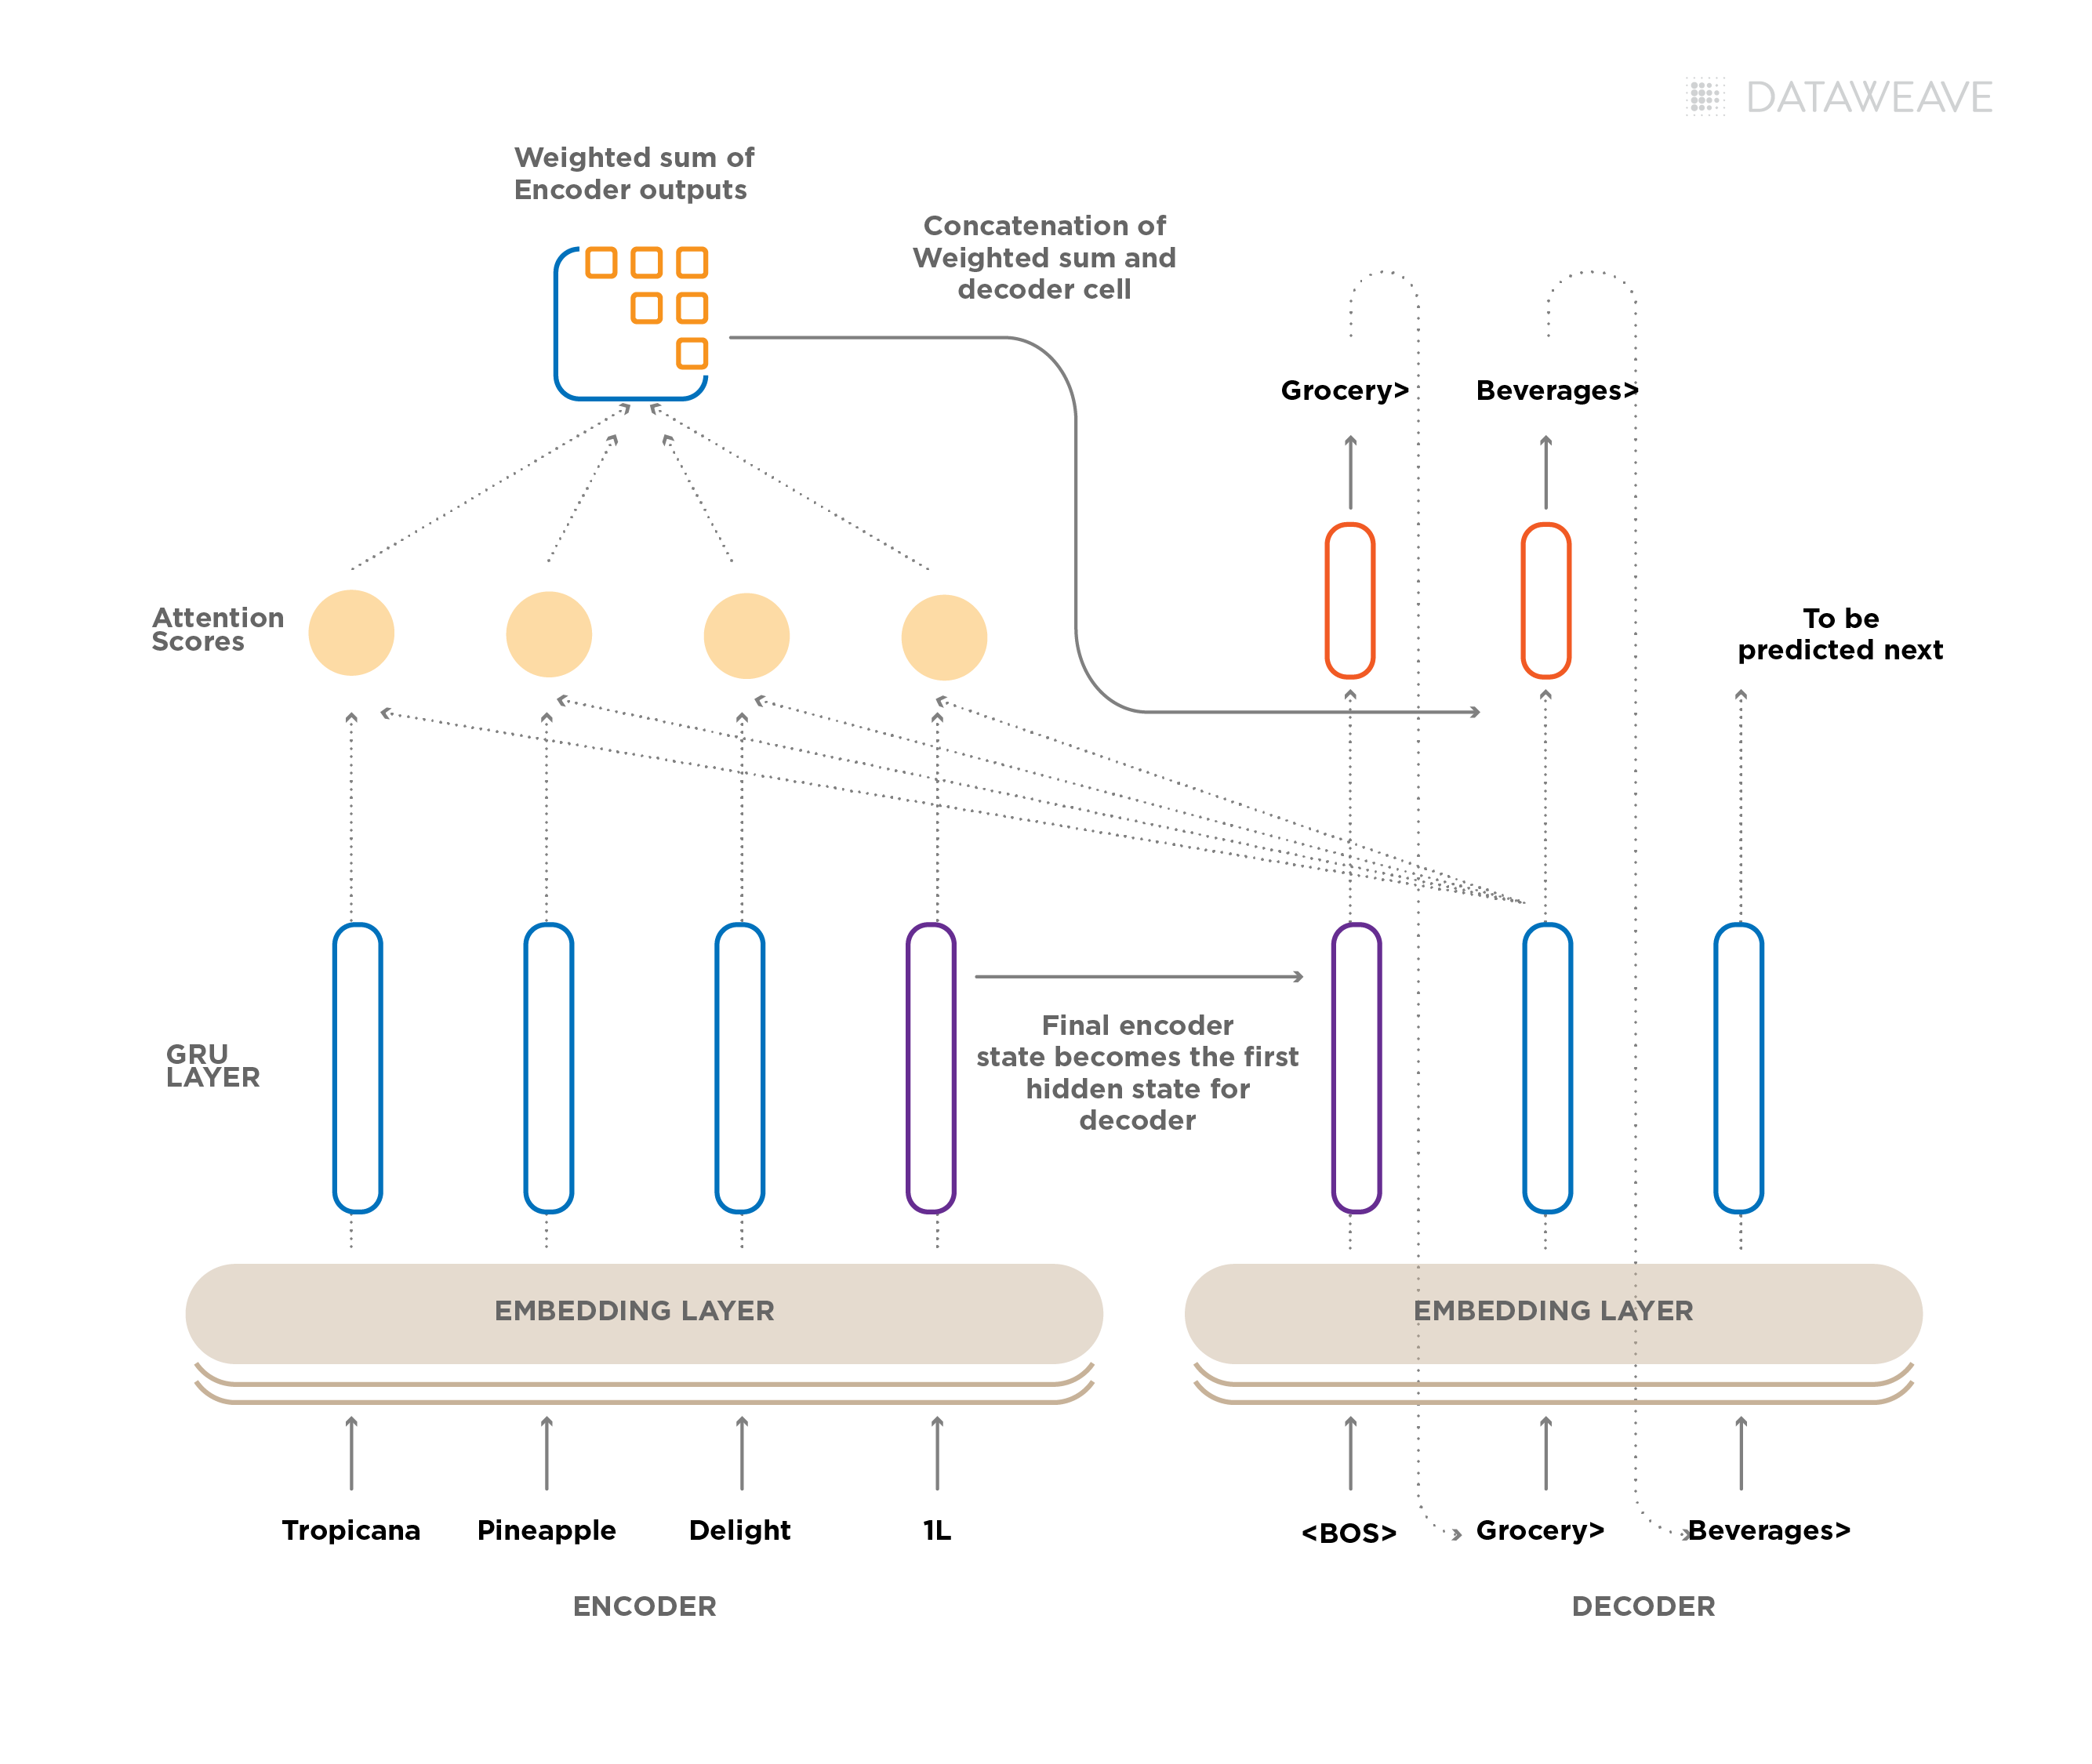
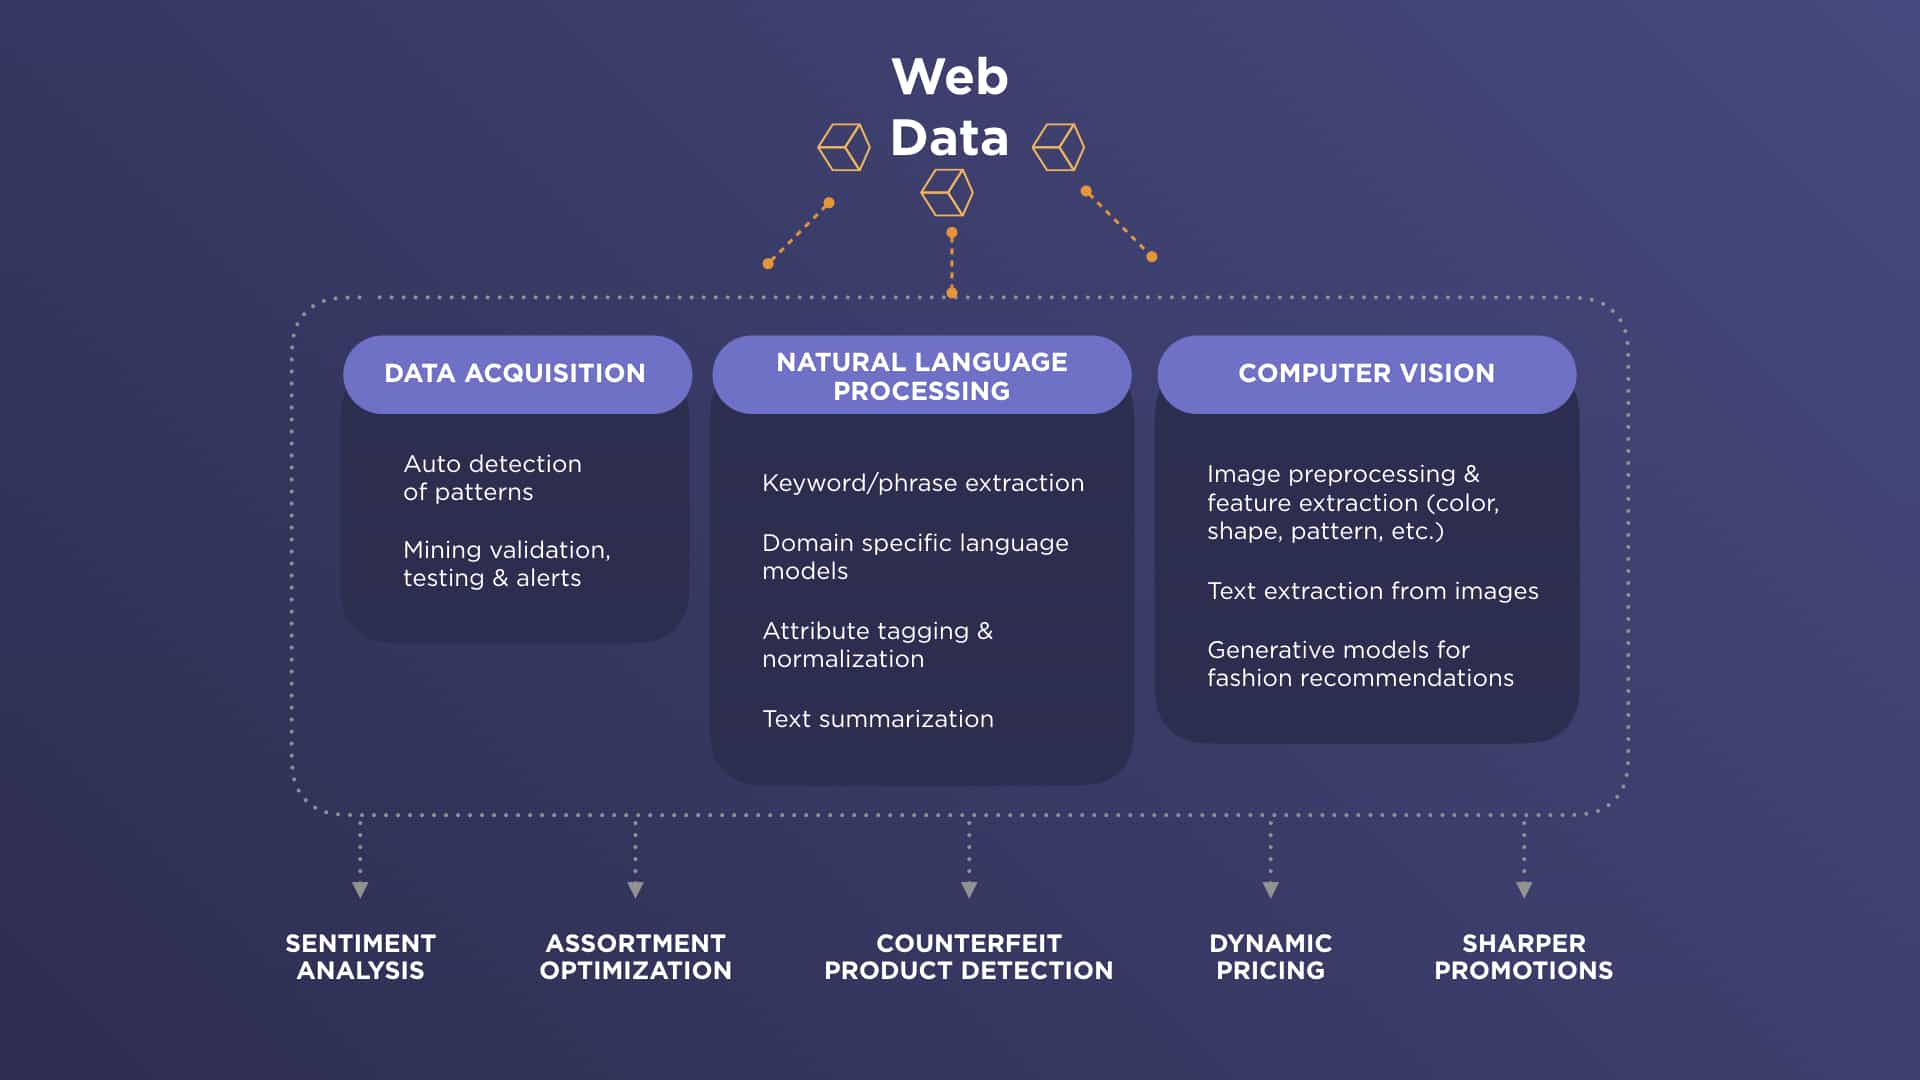
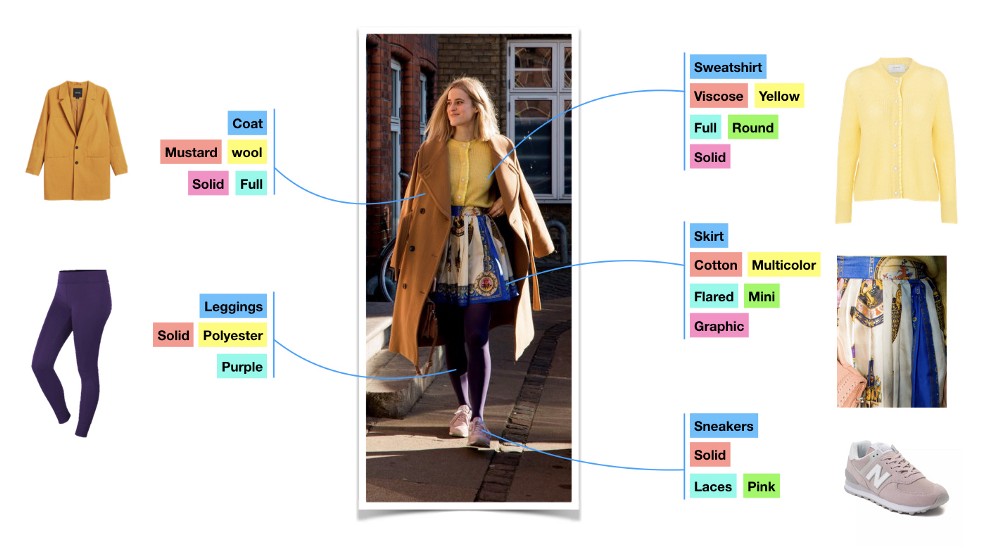
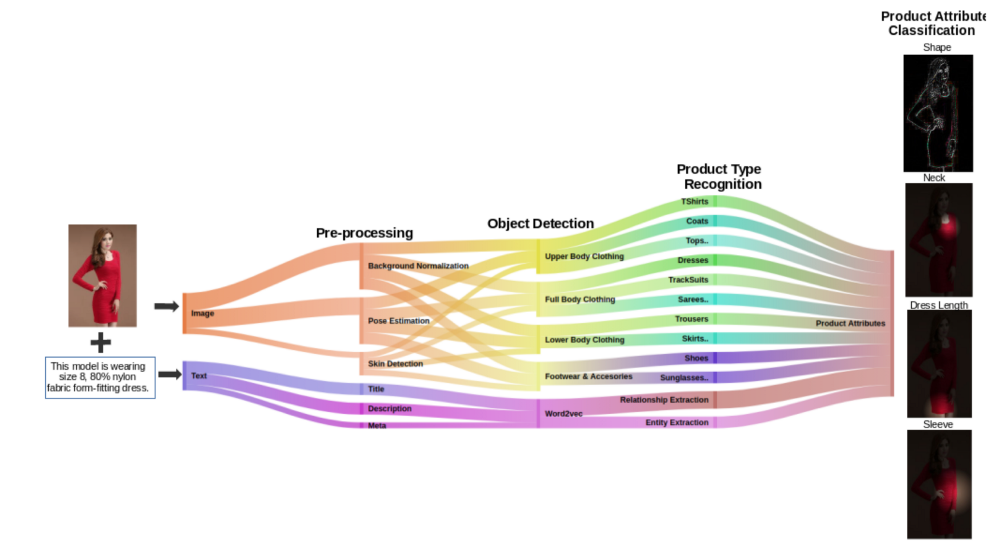
- It uses multimodal AI that combines text, image, and metadata analysis to identify matches even when products are described or displayed differently across retailers.
- Domain heuristics apply retail-specific logic, recognizing that “Large” means something different in apparel than in beverages, and that seasonal items require unique treatment.
- Knowledge graphs link products across brands, categories, and regions to reveal true relationships even when surface attributes vary.
- Through continuous learning, every human correction improves future AI suggestions, making the system smarter and more accurate over time.
For more information, download our whitepaper here!
Why This Matters
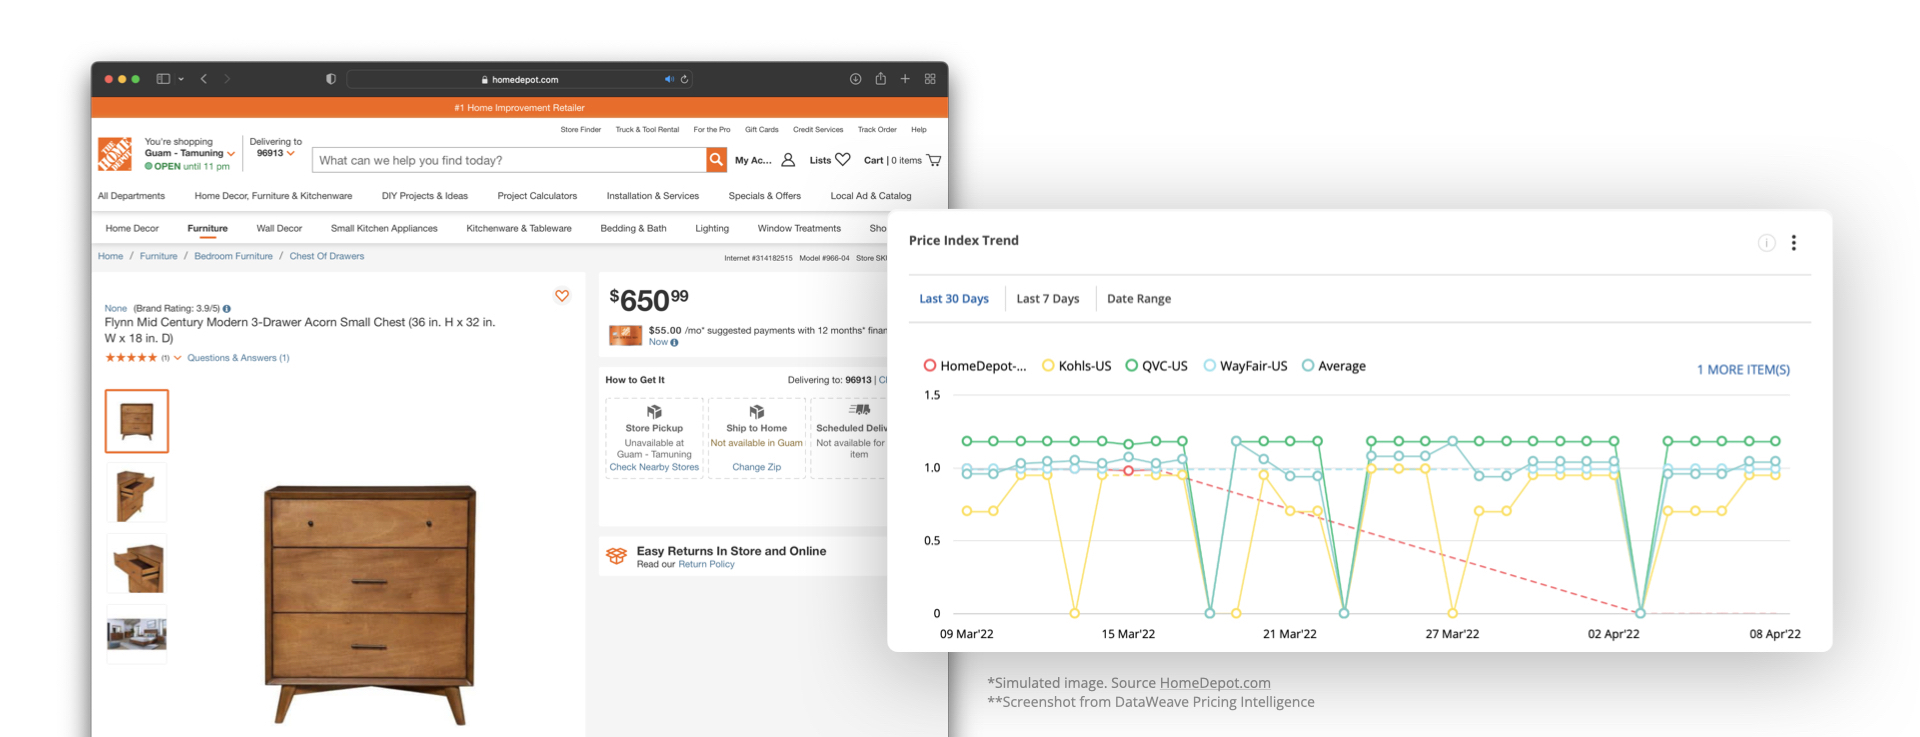
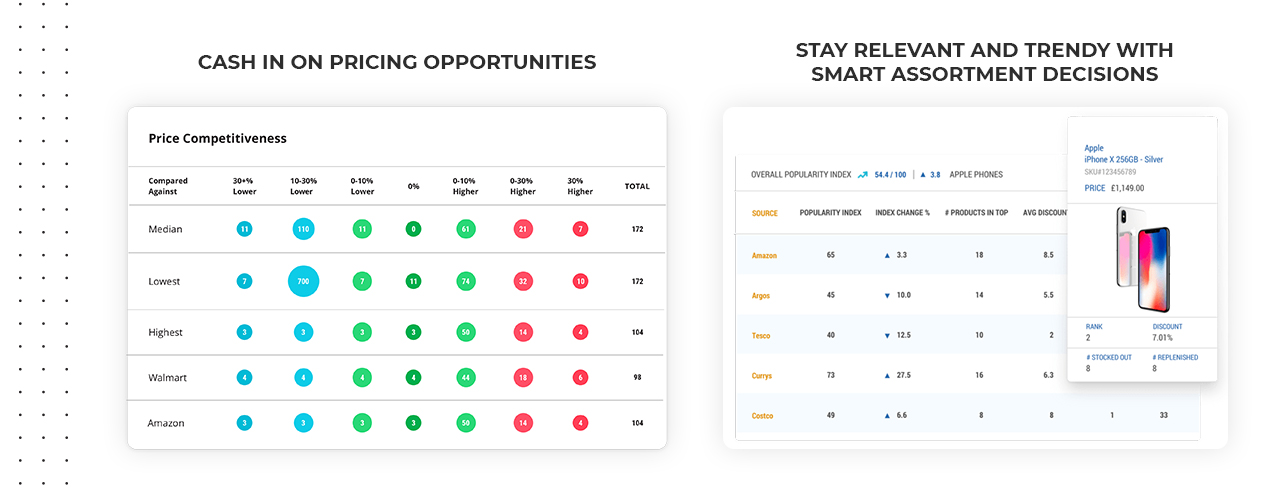
Pricing Intelligence
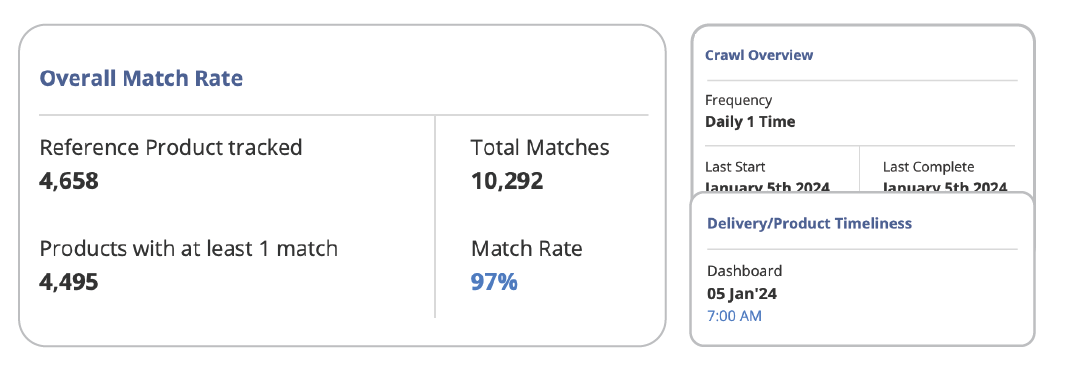
With DataWeave, accurate and reliable product matching is the standard. Advanced algorithms and built-in quality checks deliver consistently high accuracy, reducing the risk of mismatched products and unreliable insights.
In the few cases where a match needs review, User-Led Match Management gives your team the ability to validate it quickly and easily. You get full visibility and control, while DataWeave ensures the integrity of the overall matching framework.
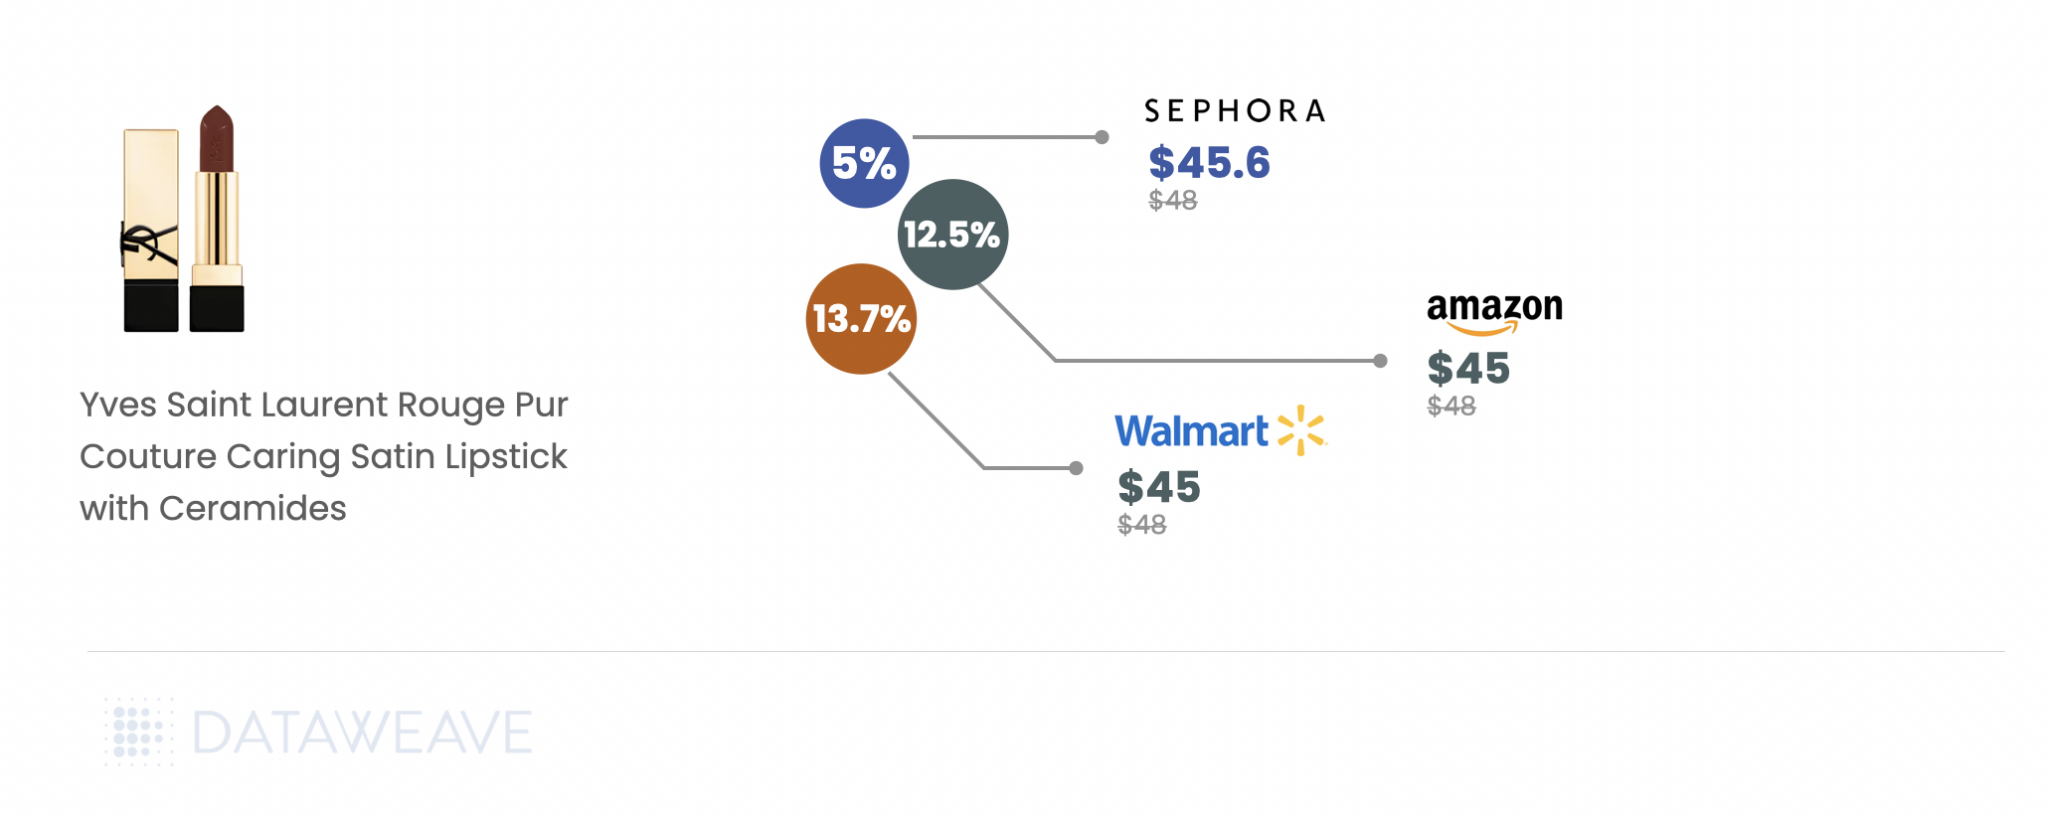
The outcome is true apples-to-apples price comparisons that protect margins, strengthen pricing strategies, and build trust in every decision.
Assortment Analytics
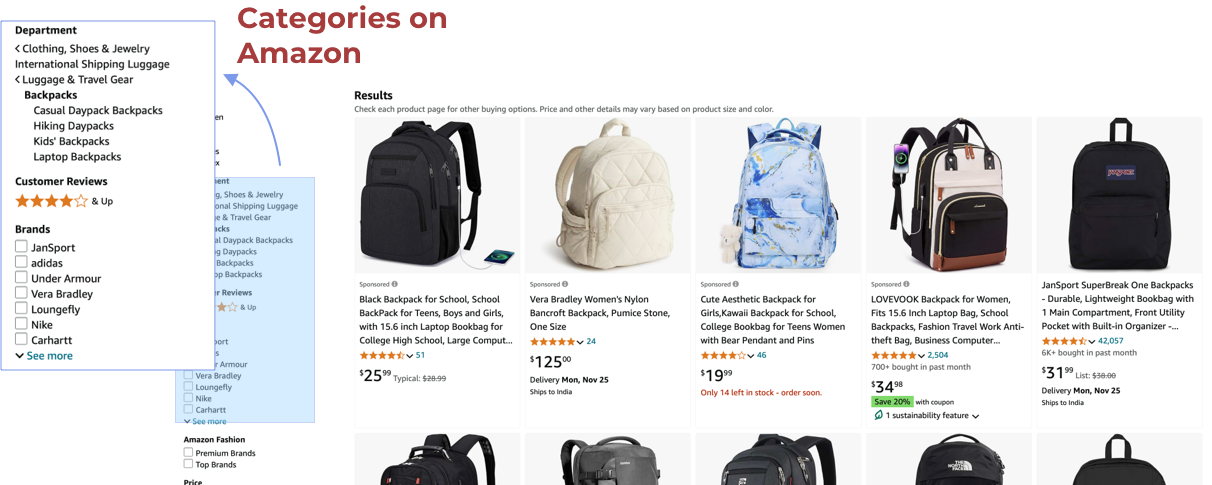
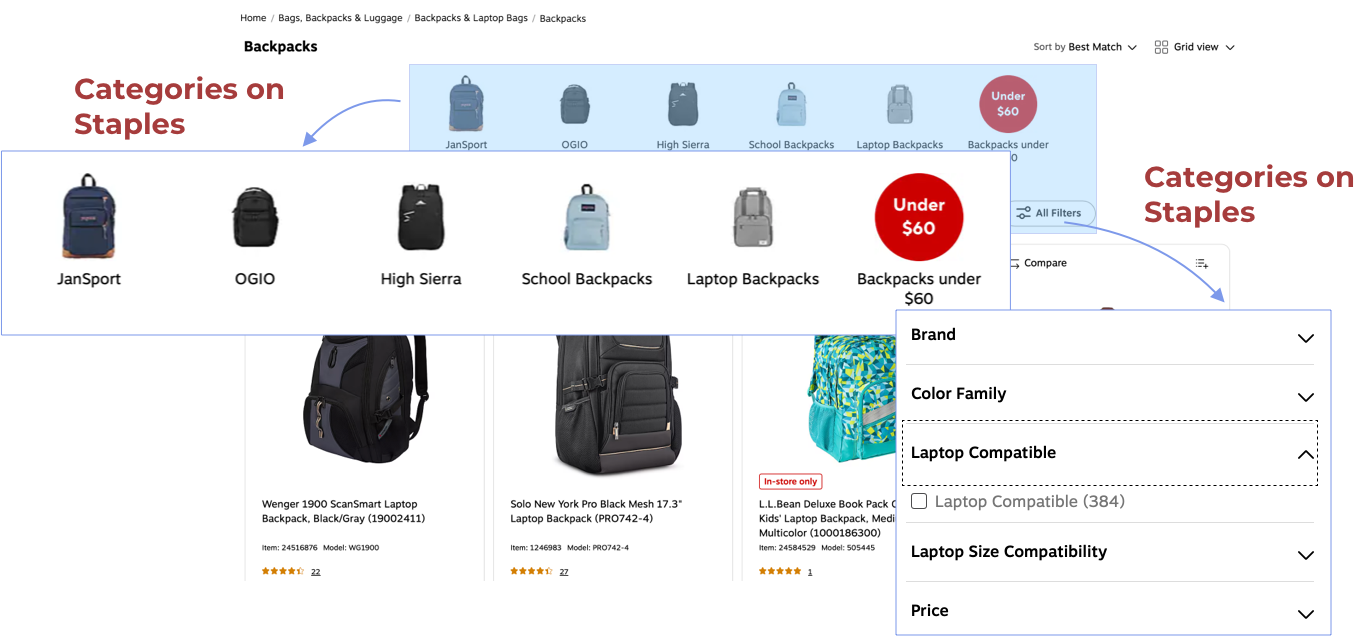
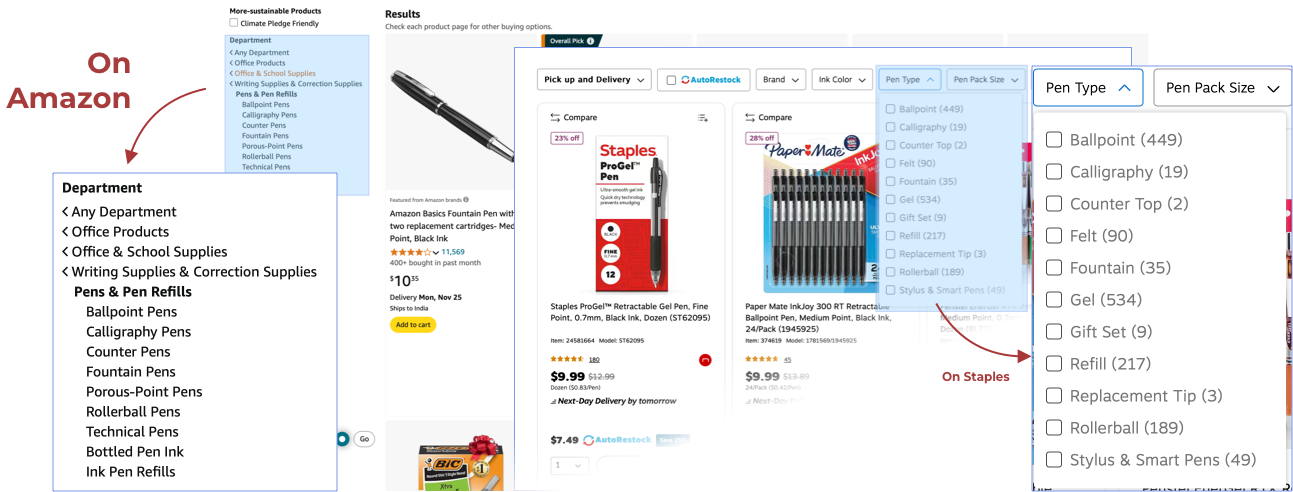
Gaps and overlaps only matter when matches are accurate. To understand your true competitive landscape, you need to eliminate false gaps and phantom overlaps that distort assortment insights.
DataWeave’s advanced Match Management ensures precise product alignment across retailers, categories, and regions, giving you a clear view of your position in the market. At the same time, user-led oversight adds transparent validation, allowing your teams to confirm or refine matches based on their category knowledge.
The result is a complete and trustworthy view of category coverage that reflects reality, not noise. It helps you identify real opportunities to expand assortments, close gaps, and respond quickly to market changes.
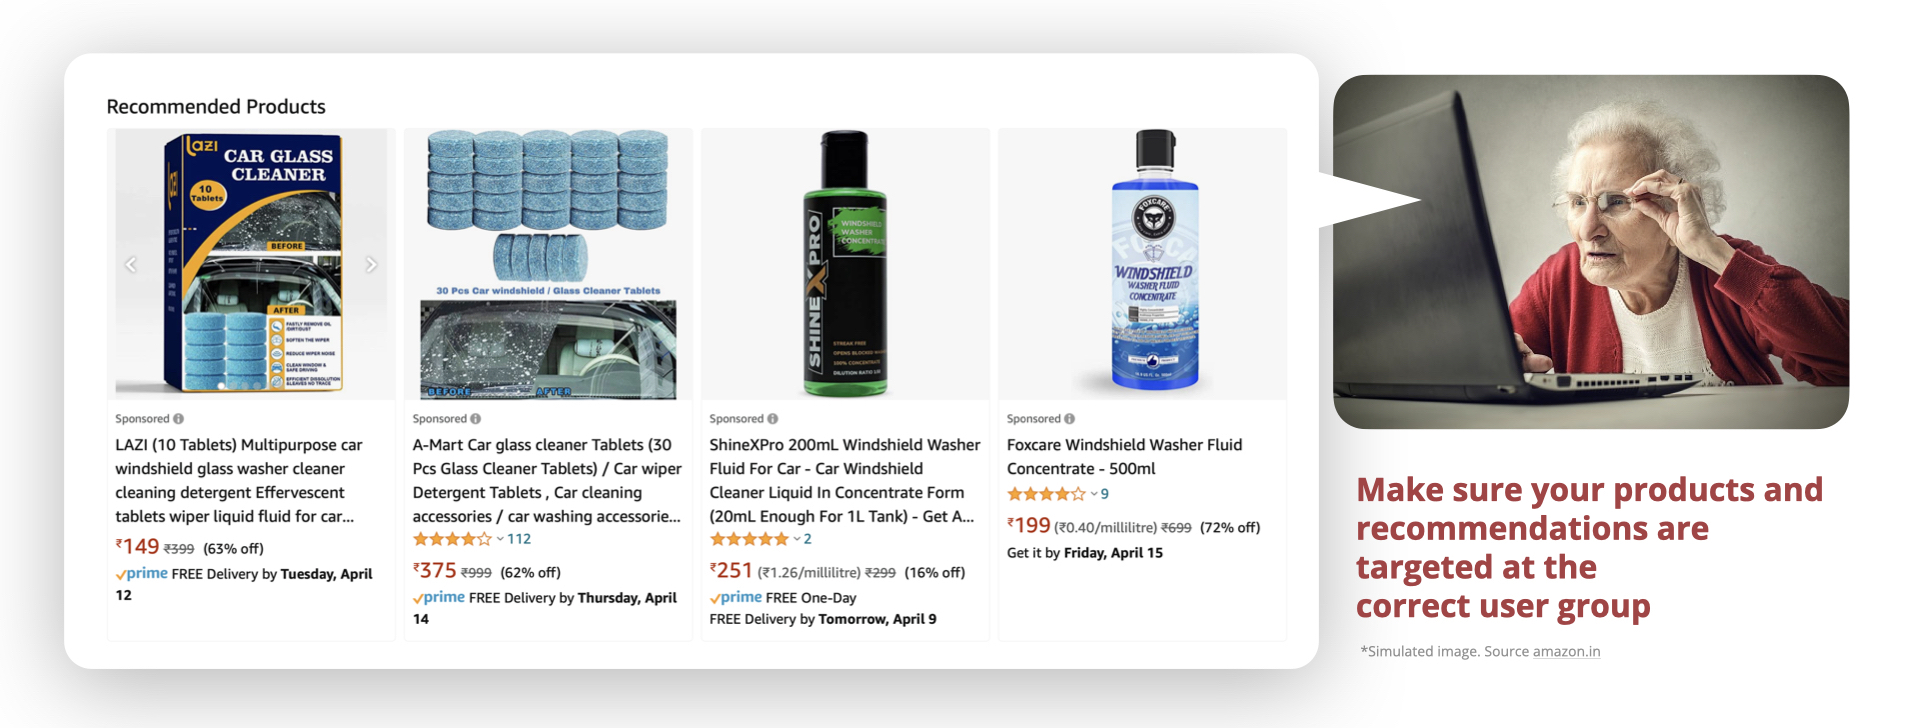
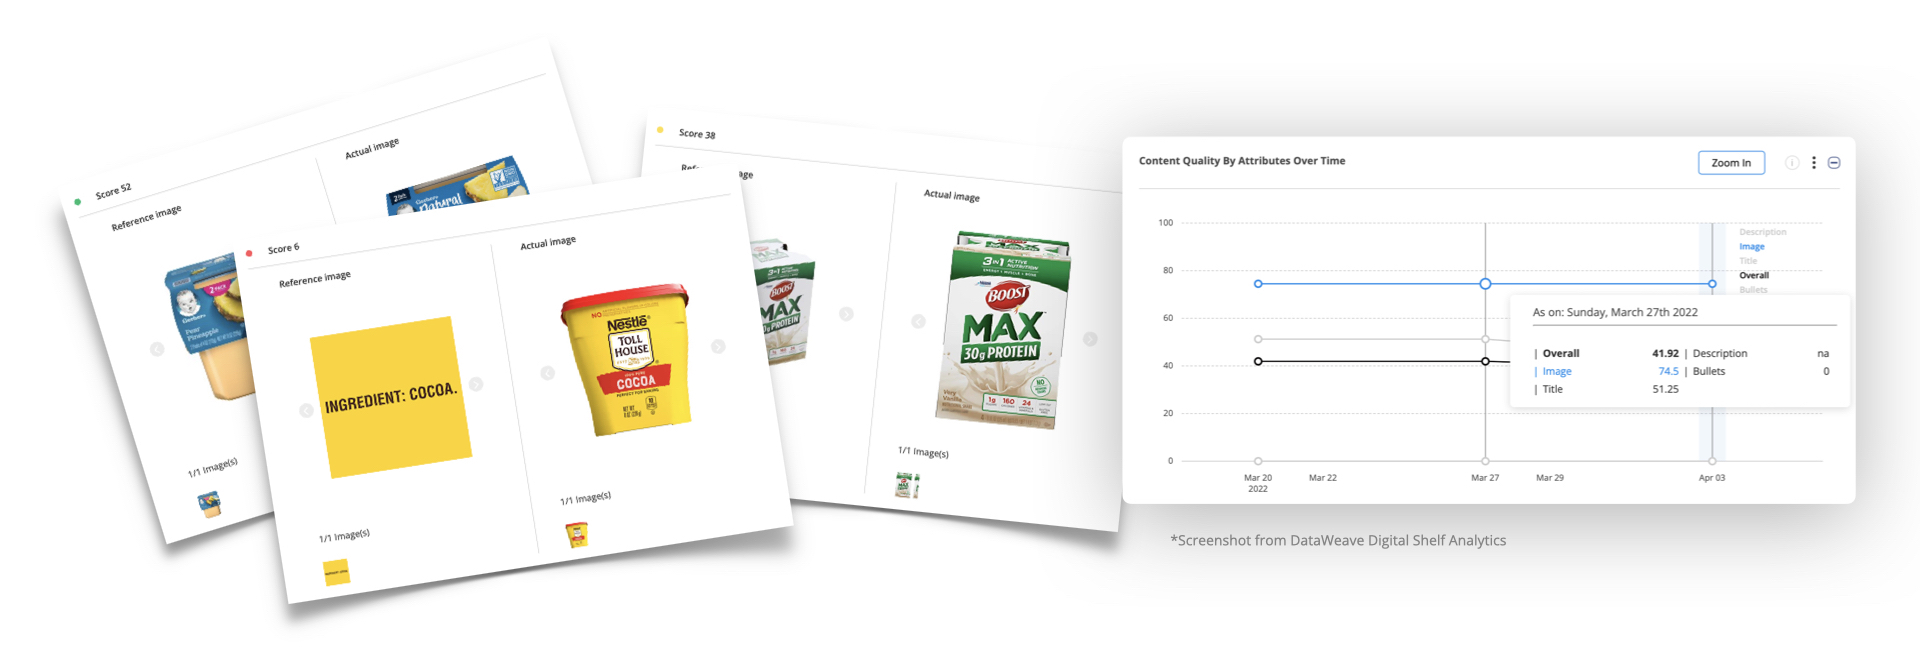
Content Optimization
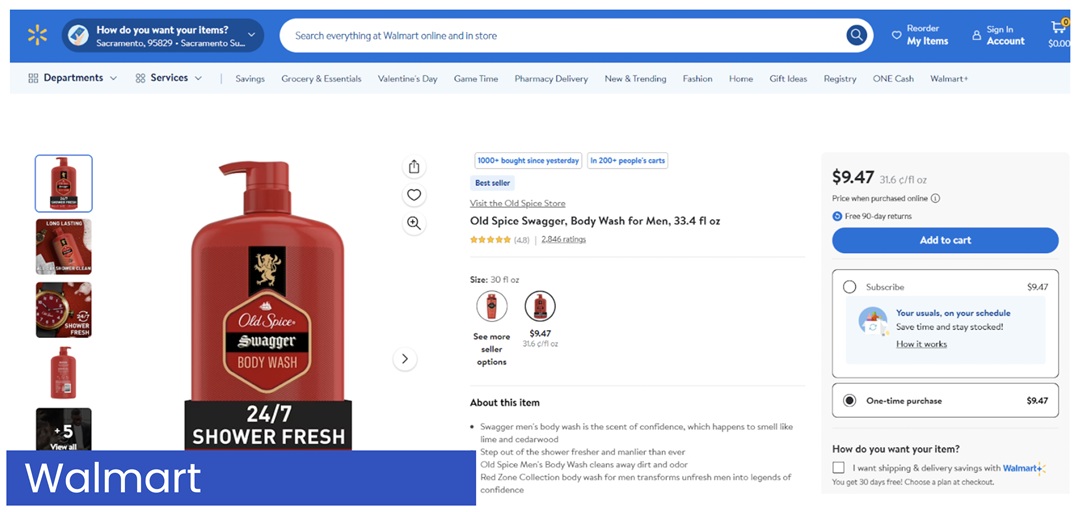
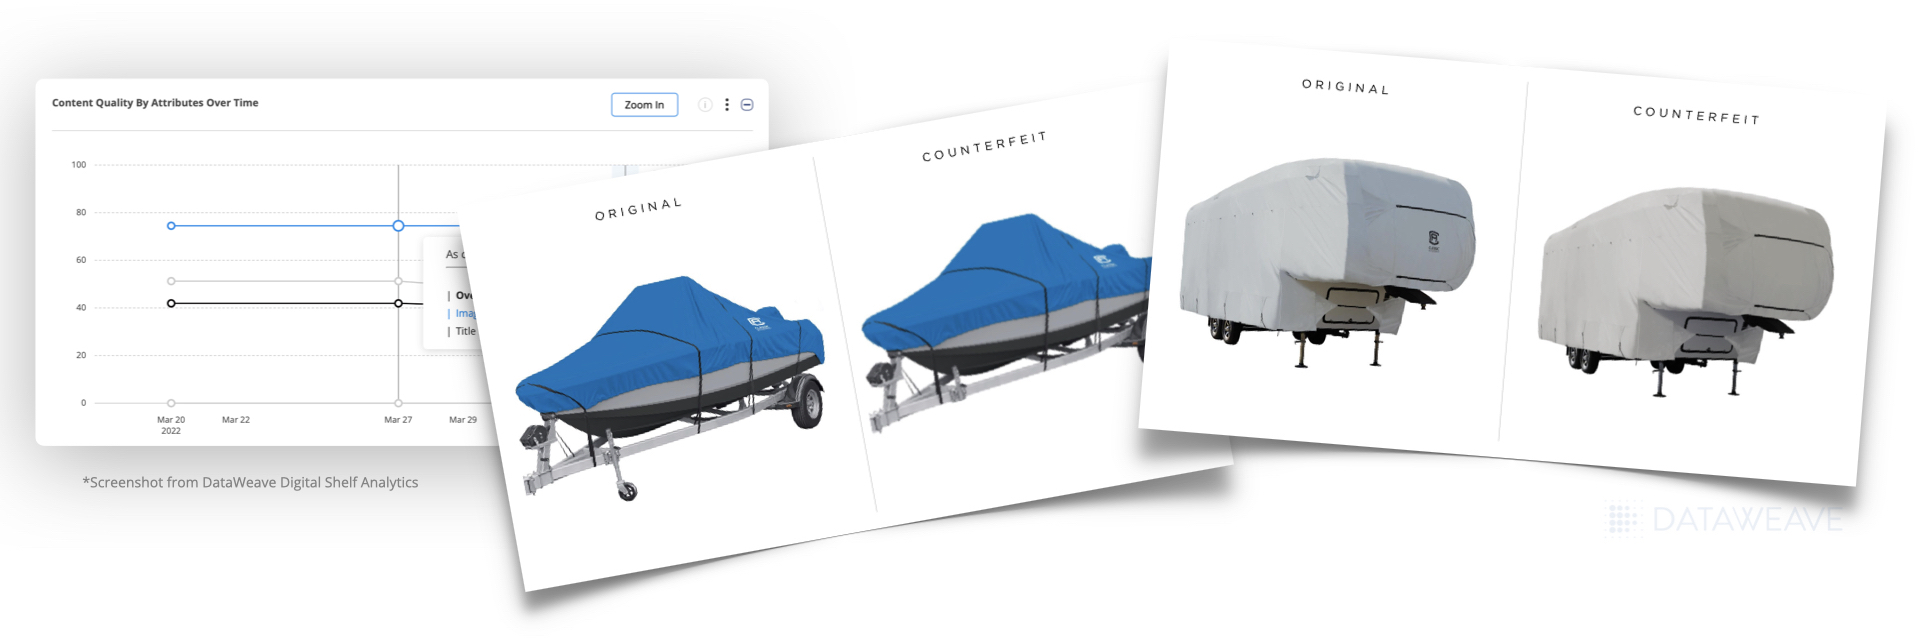
Digital shelf audits only deliver value when the comparisons are accurate. DataWeave ensures that every product is benchmarked against its true competitors so that your insights reflect the real dynamics of your category. For example, a luxury serum is never compared to a basic moisturizer, and a premium electronic device is never matched with an entry-level model.
With user-led control, your teams have transparent oversight of every match. They can review, validate, or adjust comparisons to make sure each audit aligns with your business standards. The result is a more reliable and actionable view of your digital shelf performance, helping you fine-tune content, optimize visibility, and strengthen conversion across channels.
Trust and Accountability
Leadership teams need complete confidence in the data they use to make decisions. User-Led Match Management delivers that confidence by combining the scale of AI with the assurance of human validation. Every match decision is transparent and traceable, giving teams clear visibility into how and why a product was matched.
This approach builds trust across departments, from analysts to executives. It ensures that every pricing, assortment, and content decision is backed by data that is both accurate and accountable.
Your Market, Your Rules, Your Insights
Retailers and brands today need more than fast data. They need data they can trust, shape, and act on with confidence. User-Led Match Management gives them that control. It turns product matching from a static, automated process into a dynamic, collaborative workflow that adapts to how real teams operate.
Category managers can fine-tune match rules instead of waiting on system updates. Pricing teams can validate critical SKUs in minutes, not days. Digital shelf teams can ensure their audits reflect real competitors, not algorithmic guesses. Executives gain visibility into decisions they can stand behind, supported by transparent data trails and measurable accuracy.
In short, User-Led Match Management puts control back where it belongs – in your hands. It helps every team move faster, compete smarter, and make decisions powered by data they can truly believe in.
Reach out to us to learn more!