Category: Amazon

  • Who Won Prime Day 2021’s Consumer Electronics Price War?

    Who Won Prime Day 2021’s Consumer Electronics Price War?

    Amazon’s Prime Day 2021 global shopping event took place June 21 and 22, 2021 and smashed previous sales records. At DataWeave, we wanted to know how Prime Day 2021 deals and discounts on electronics compared across retailers and regions. We focused on how retailers adapted their Prime Day pricing strategies to stand out in the competitive consumer electronics category.

    Our Methodology
    We tracked the pricing of several leading retailers in nine countries across five regions, including:

    • The US (Amazon US, Best Buy, Target and Walmart)
    • The UK (Amazon UK, Ebay, Etsy and OnBuy)
    • Europe (Amazon France, Amazon Germany and Amazon Italy)
    • The Middle East (Amazon Saudi Arabia and Amazon UAE)
    • Asia (Amazon Japan and Amazon Singapore)

    Let’s see how retailers used pricing tactics to gain a competitive advantage during Prime Day, as well as which electronics brands had the highest discounts around the world.

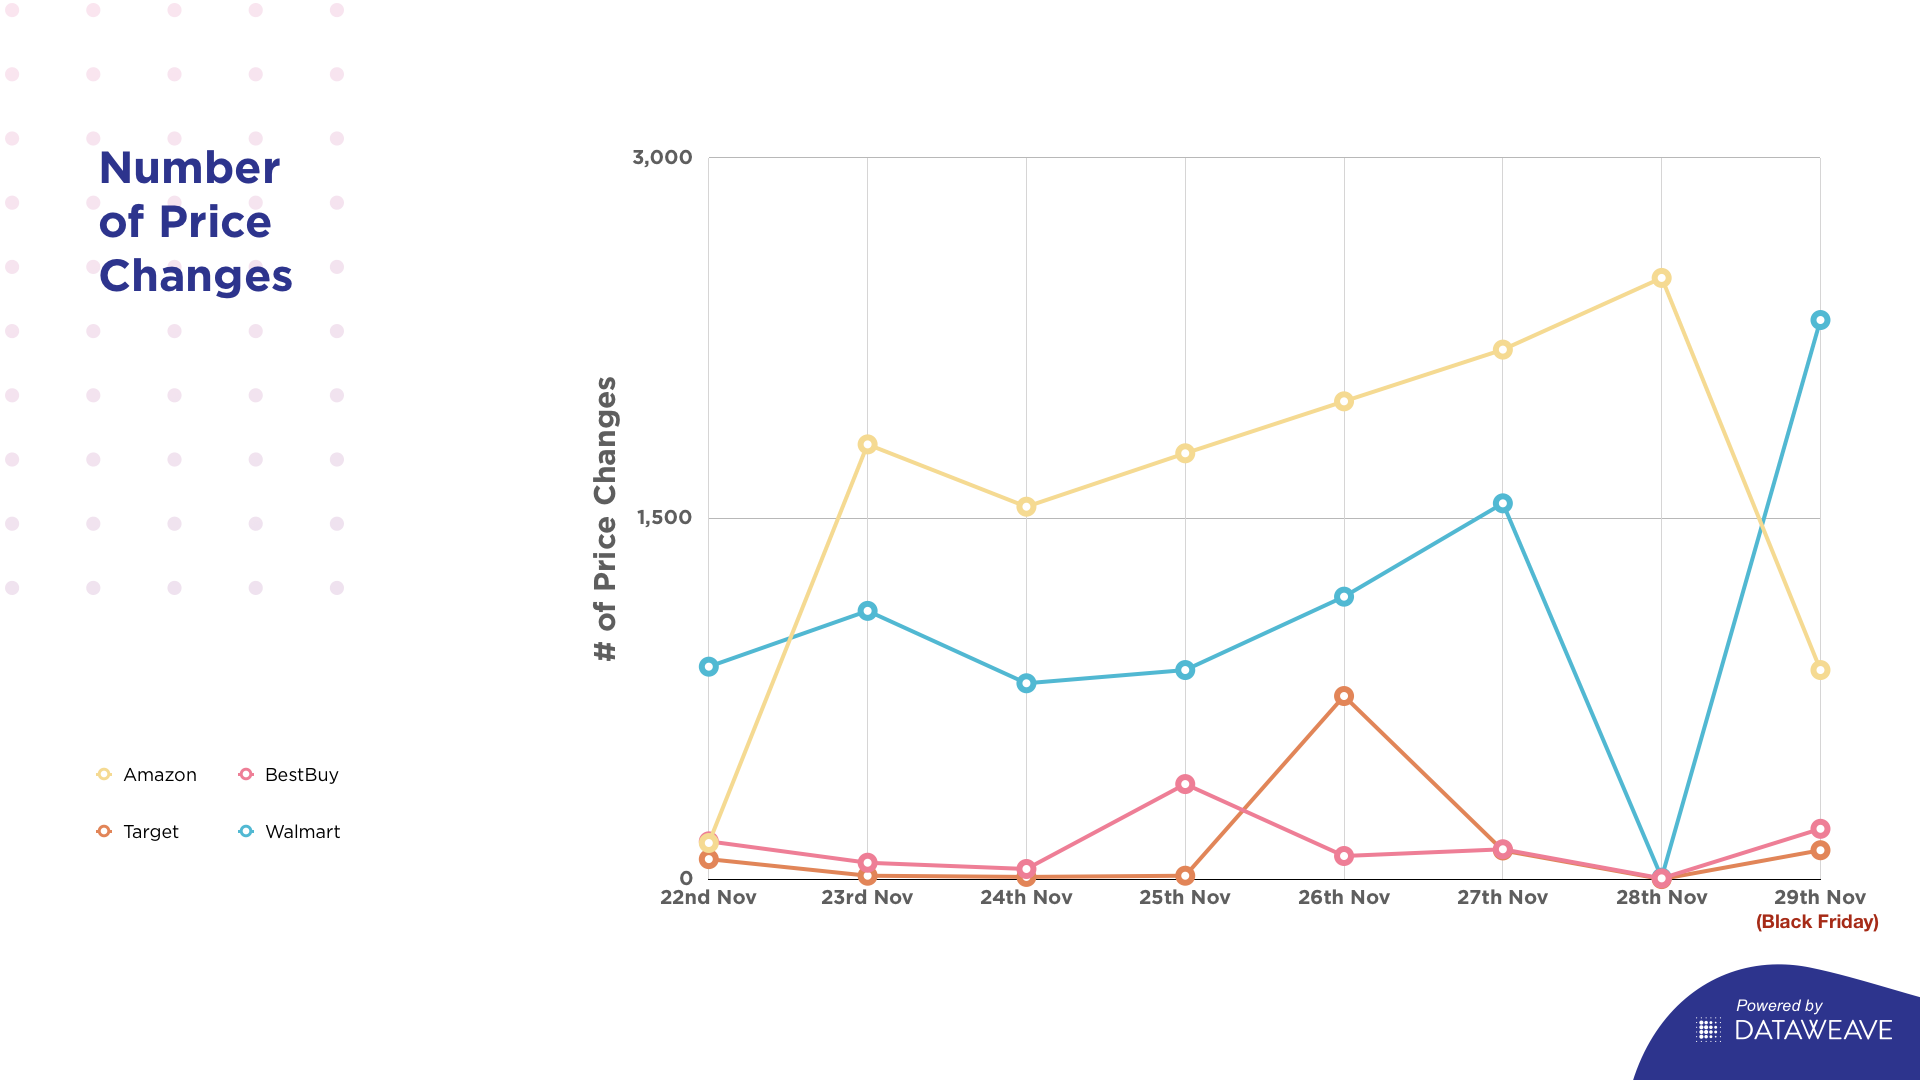
    Percentage of items with a price decrease

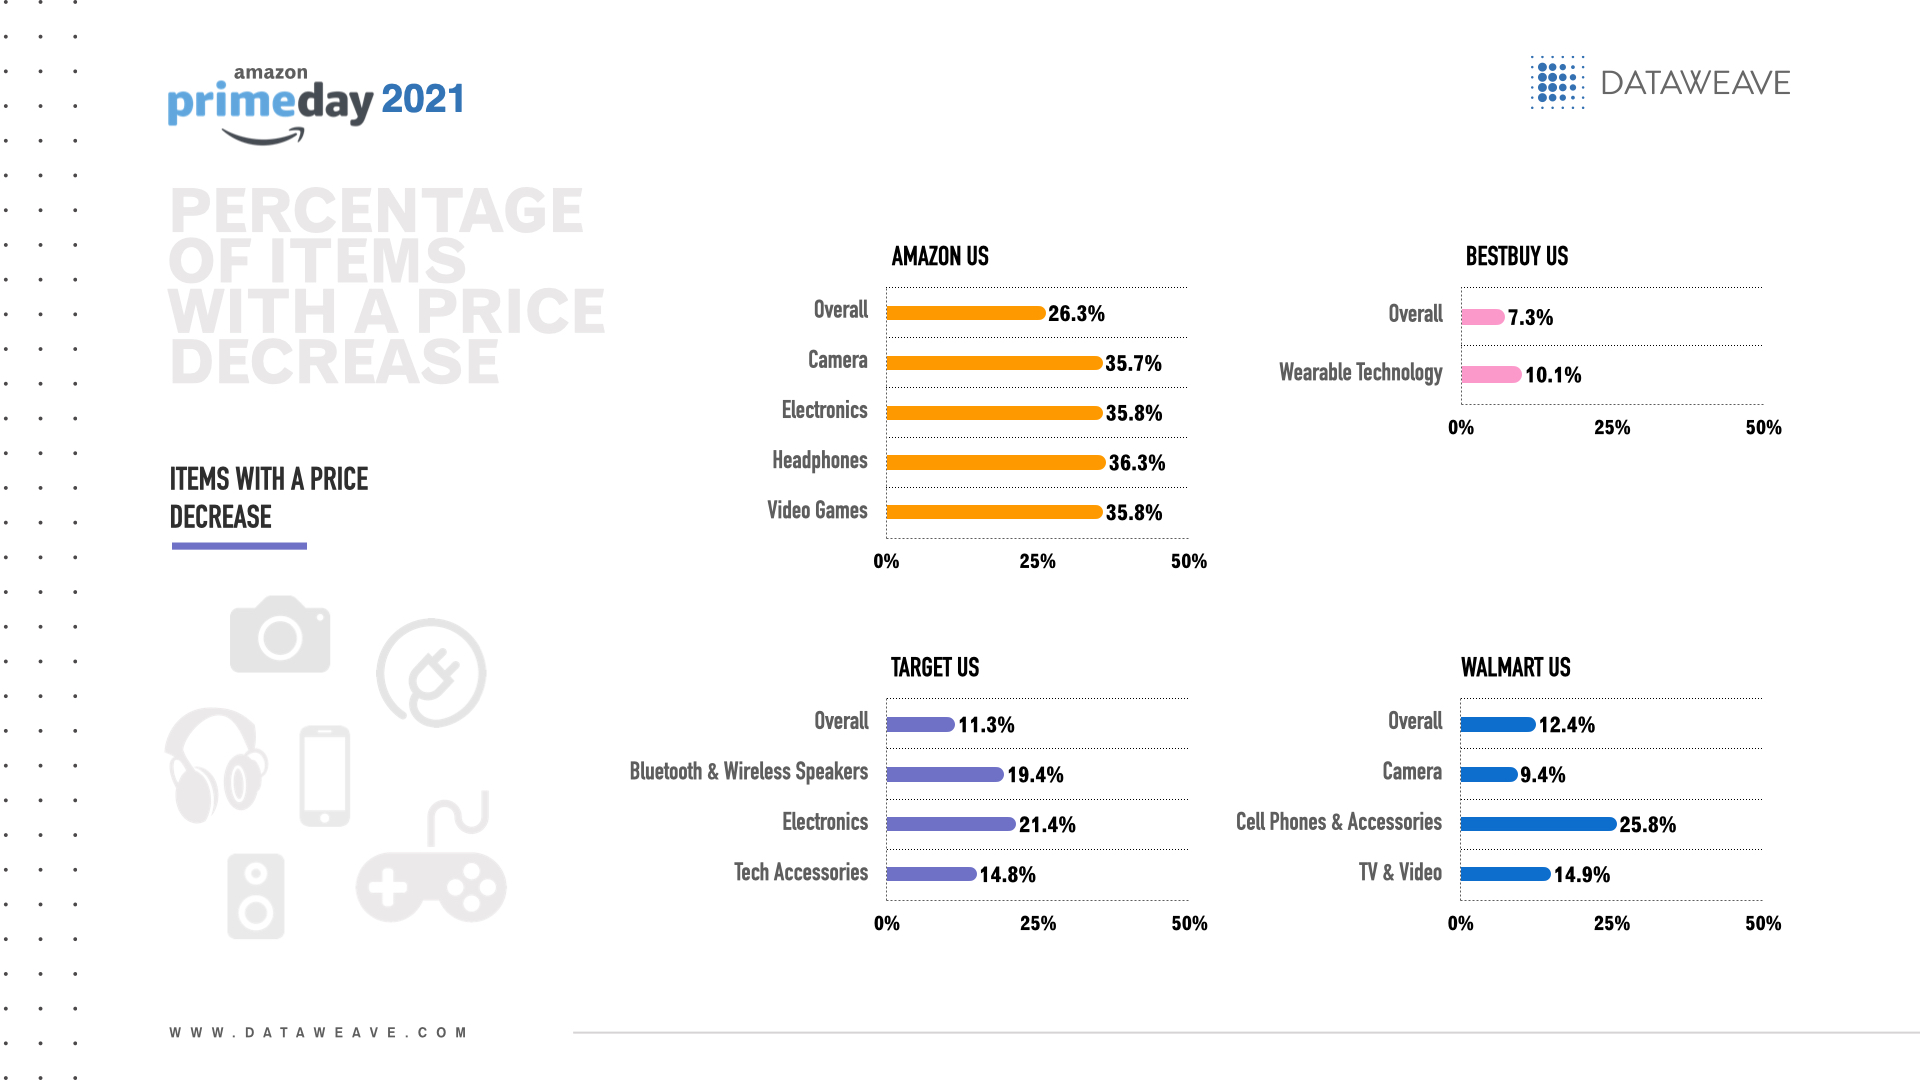
    The US retailer with the overall highest percentage of items with a price decrease for Prime Day was Amazon US (26.3%).

    Electronics subcategories with the highest percentage of items with a price decrease per US retailer were:

    Amazon US: Headphones (36.3%), video games and electronics (both 35.8%) and cameras (35.7%)
    Best Buy: Wearables (10.1%) and electronics (6.8%)
    Target: Electronics (21.4%), Bluetooth & wireless speakers (19.4%) and tech accessories (14.8%)
    Walmart: Cell phones & accessories (25.8%), TV & video (14.9%) and cameras (9.4%)

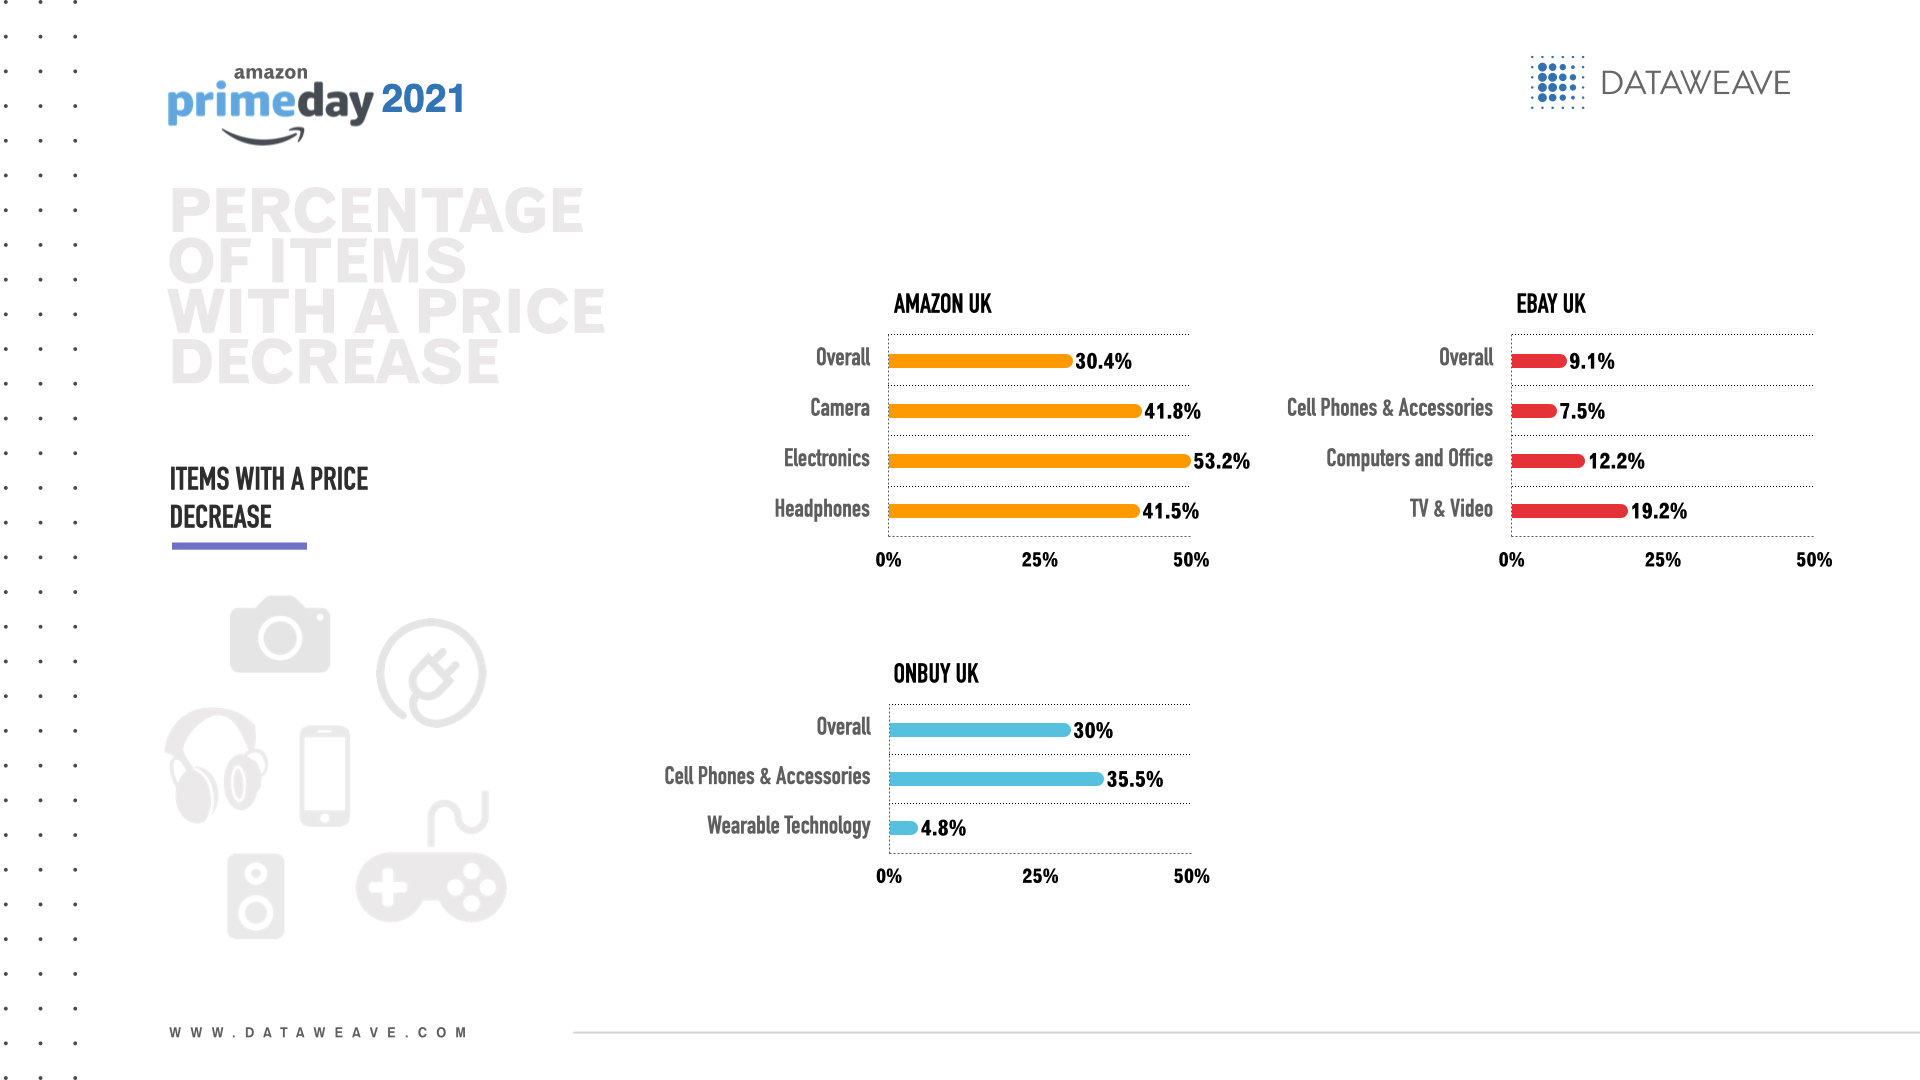
    The UK retailer with the overall highest percentage of items with a price decrease for Prime Day was Amazon UK (30.4%), closely followed by OnBuy (30.0%). Of note, Amazon UK offered price increases on 10 times as many products as OnBuy (2379 vs. 237).

    Electronics subcategories with the highest percentage of items with a price decrease per UK retailer were:

    Amazon UK: Electronics (53.2%), cameras (41.8%) and headphones (41.5%)
    Ebay: TV & video (19.2%), computers & office (12.2%) and cell phones & accessories (7.5%)
    Etsy: Electronics (1.4%)
    OnBuy: Cell phones & accessories (35.5%) and wearables (4.8%)

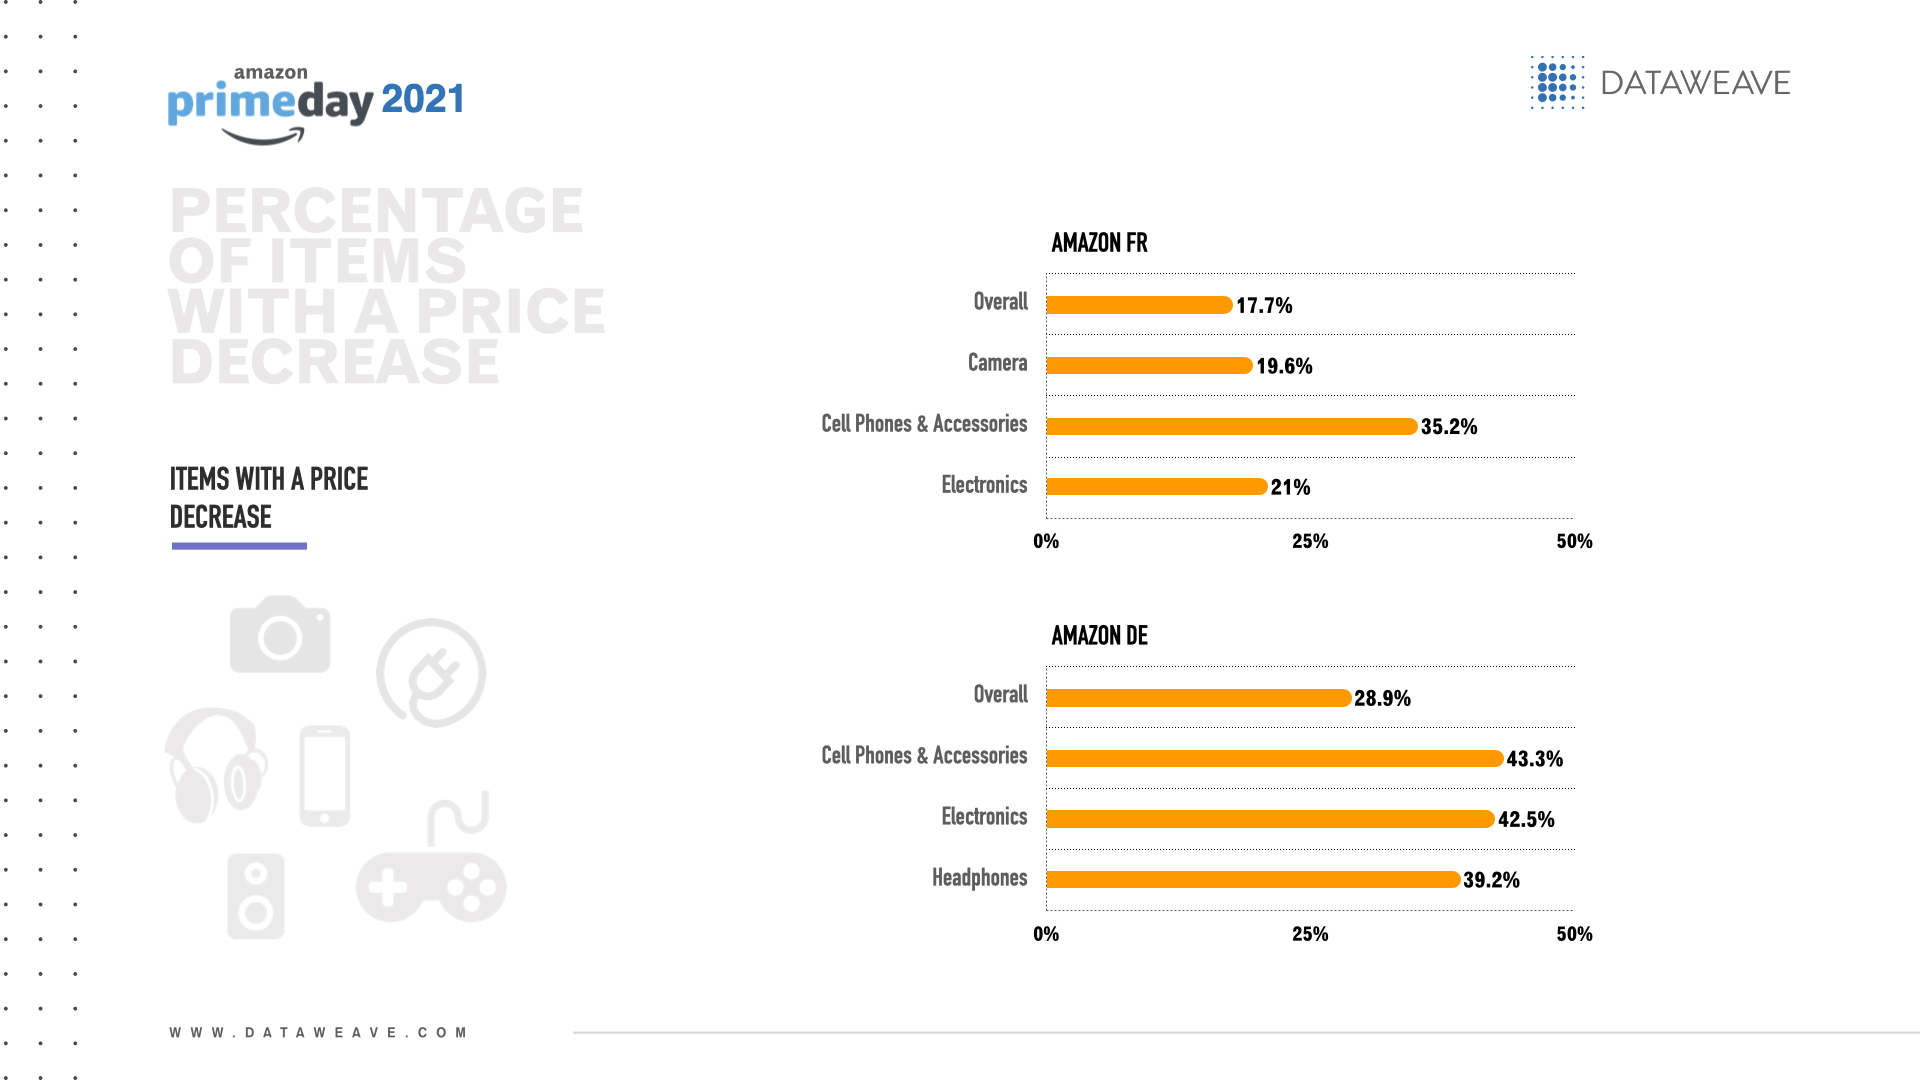
    In Europe, Amazon Germany had the overall highest percentage of items with a price decrease for Prime Day (28.9%).

    Electronics subcategories with the highest percentage of items with a price decrease per European retailer were:

    Amazon France: Cell phones & accessories (35.2%), electronics (21.0%) and cameras (19.6%)
    Amazon Germany: Cell phones & accessories (43.3%), electronics (42.5%) and headphones (39.2%)
    Amazon Italy: Headphones (25.0%), cell phones & accessories (14.3%) and Bluetooth & wireless speakers (8.3%)

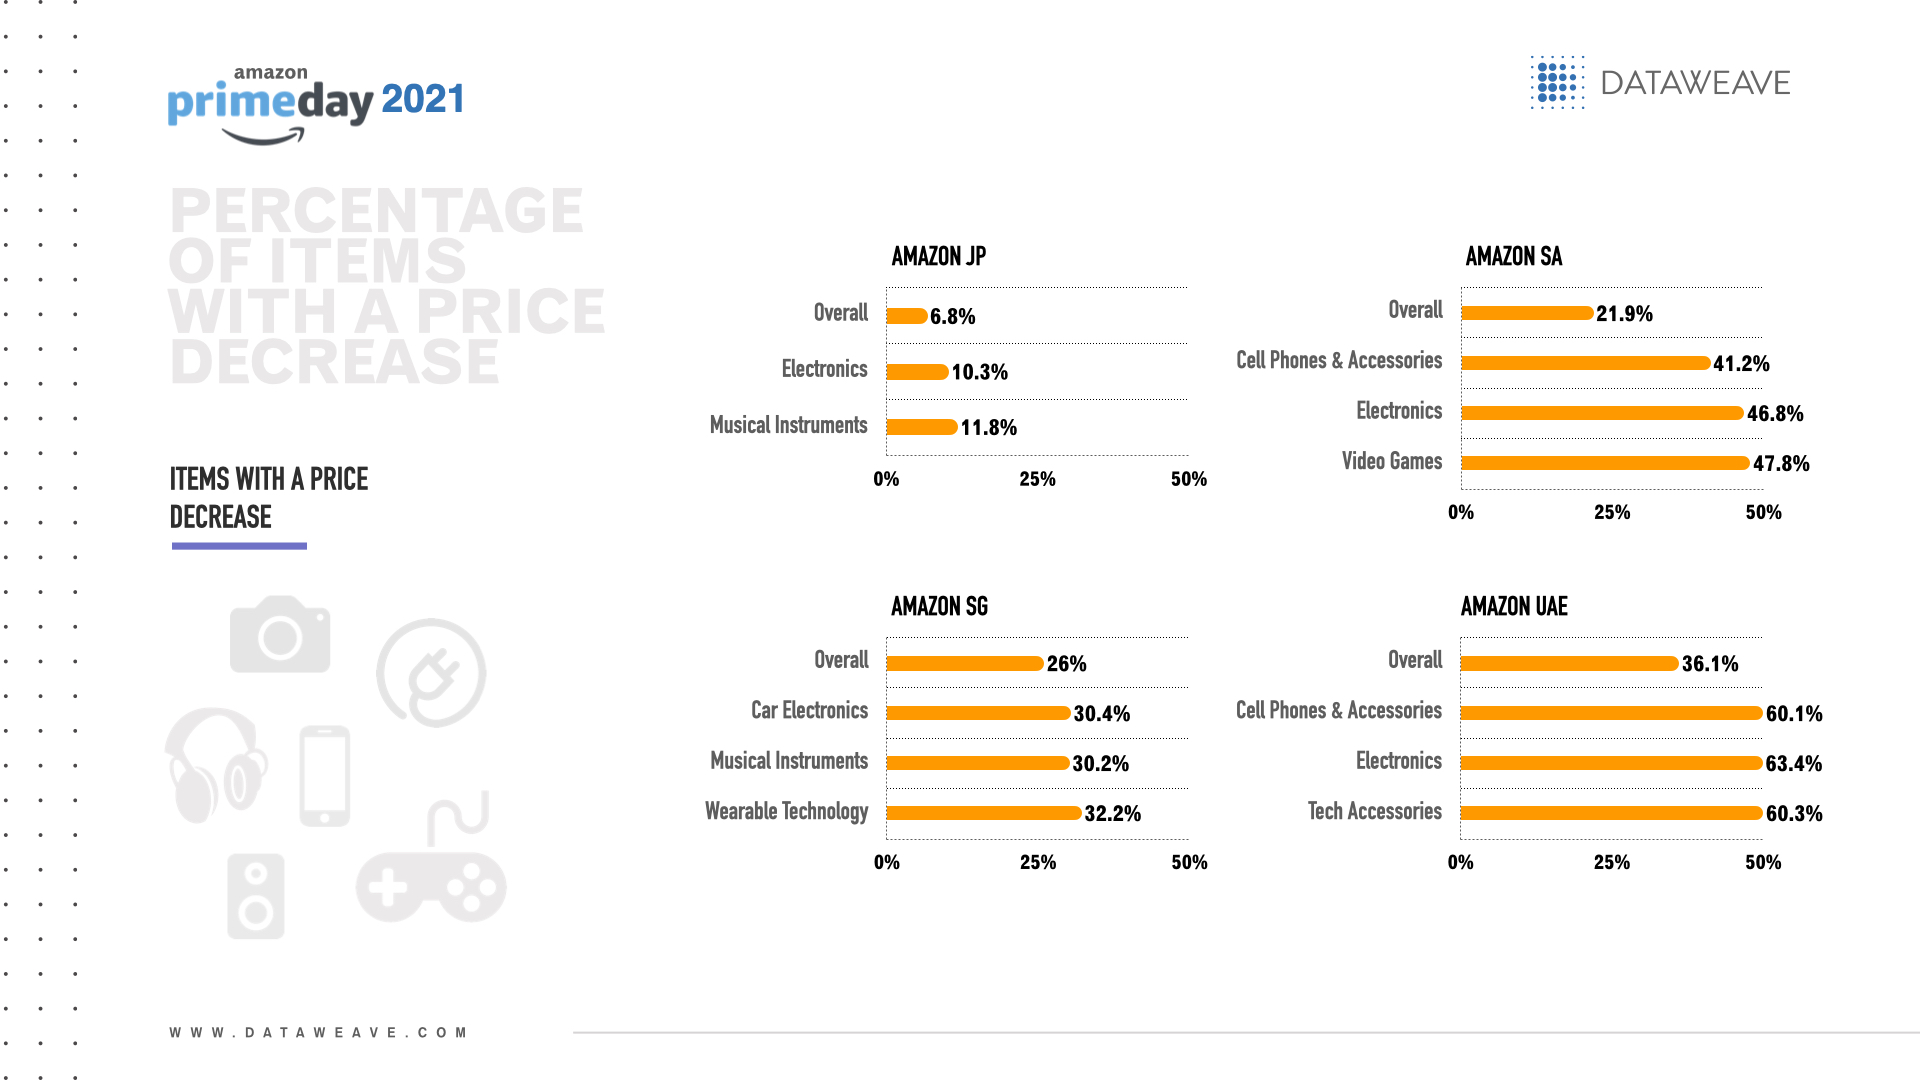
    Across the Middle East & Asia, Amazon UAE had the overall highest percentage of items with a price decrease for Prime Day (36.1%).

    Electronics subcategories with the highest percentage of items with a price decrease per retailer were:

    Amazon Saudi Arabia: Video games (47.8%), electronics (46.8%) and cell phones & accessories (41.2%)
    Amazon UAE: Electronics (63.4%), tech accessories (60.3%) and cell phones & accessories (60.1%)
    Amazon Japan: TV & video (14.9%), musical instruments (11.8%) and electronics (10.3%)
    Amazon Singapore: Wearables (32.2%), car electronics (30.4%) and musical instruments (30.2%)

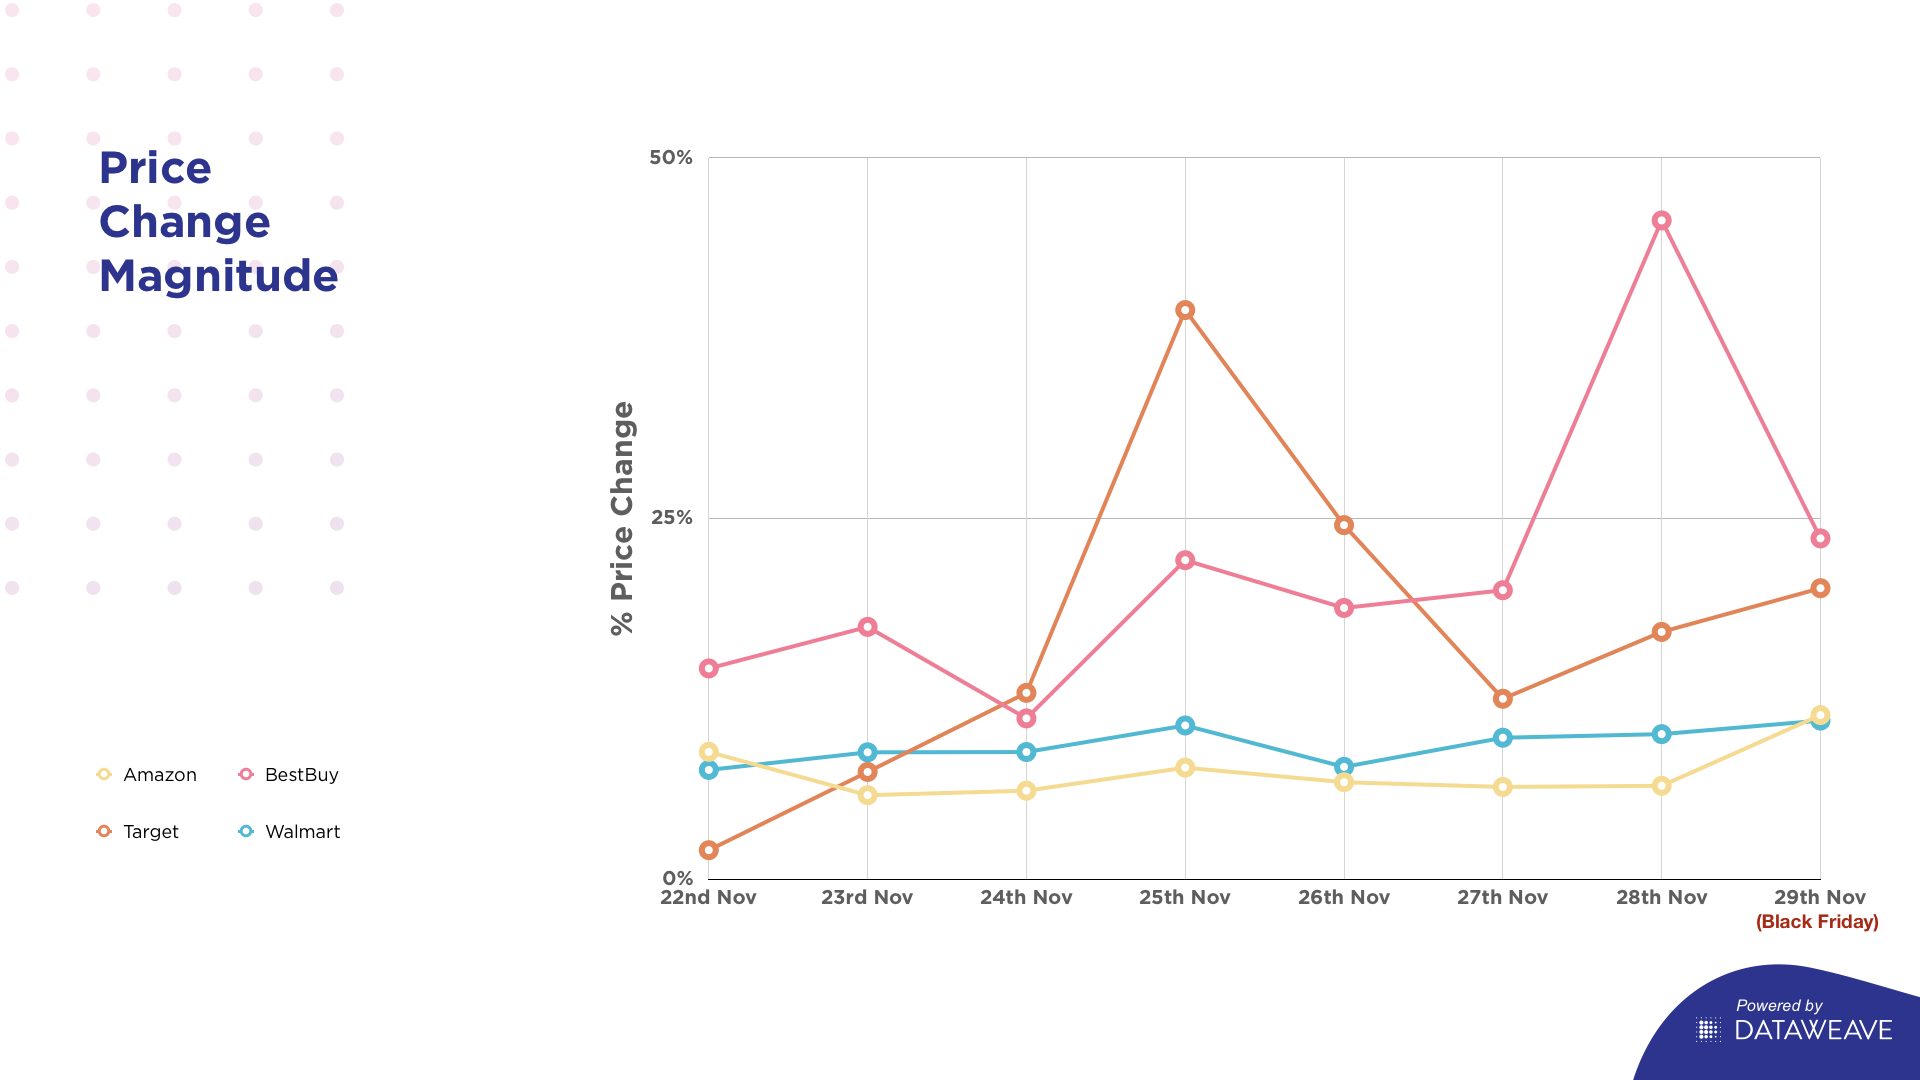
    Magnitude of price decrease

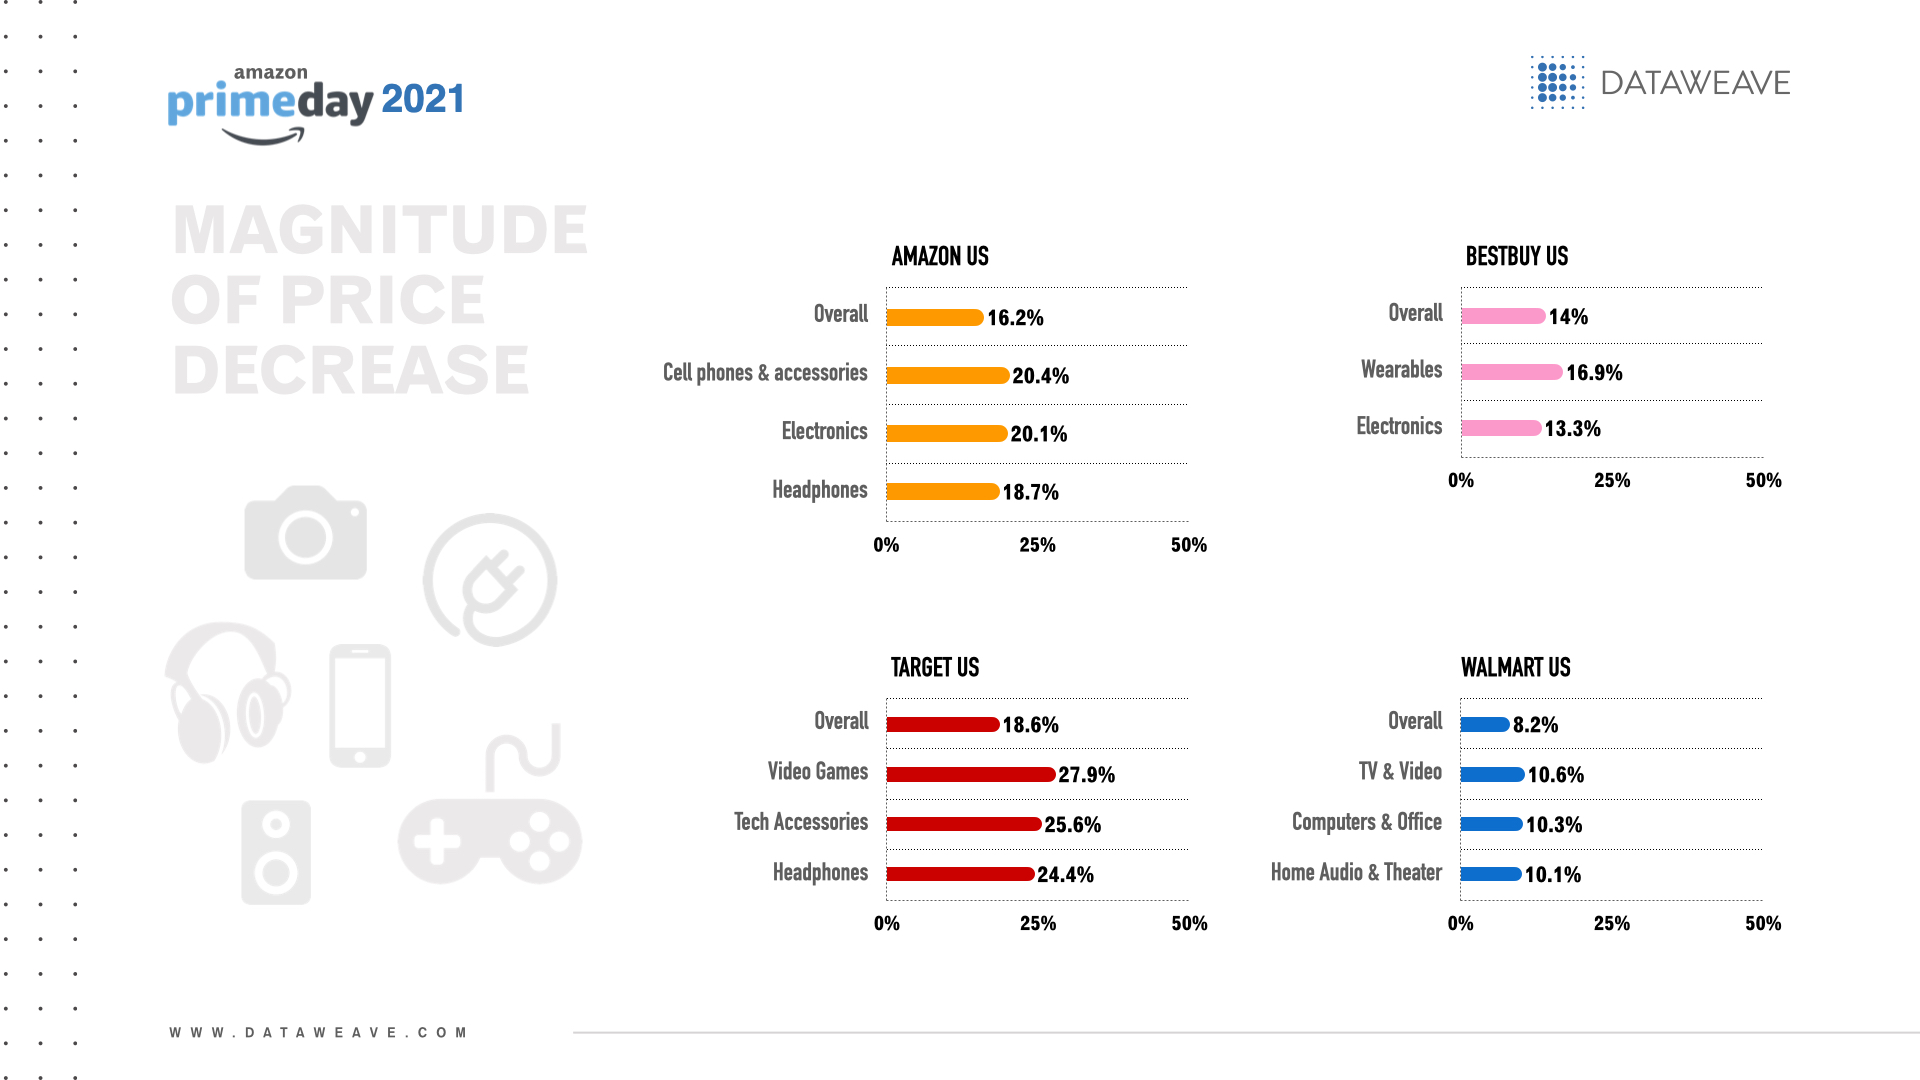
    The US retailer with the greatest overall magnitude of price decrease for Prime Day was Target (18.6%).

    The electronics subcategories with the greatest magnitude of price decrease per US retailer were:

    Amazon US: Cell phones & accessories (20.4%), electronics (20.1%) and headphones (18.7%)
    Best Buy: Wearables (16.9%) and electronics (13.3%)
    Target: Video games (27.9%), tech accessories (25.6%) and headphones (24.4%)
    Walmart: TV & video (10.6%), computers & office (10.3%) and home audio & theater (10.1%)

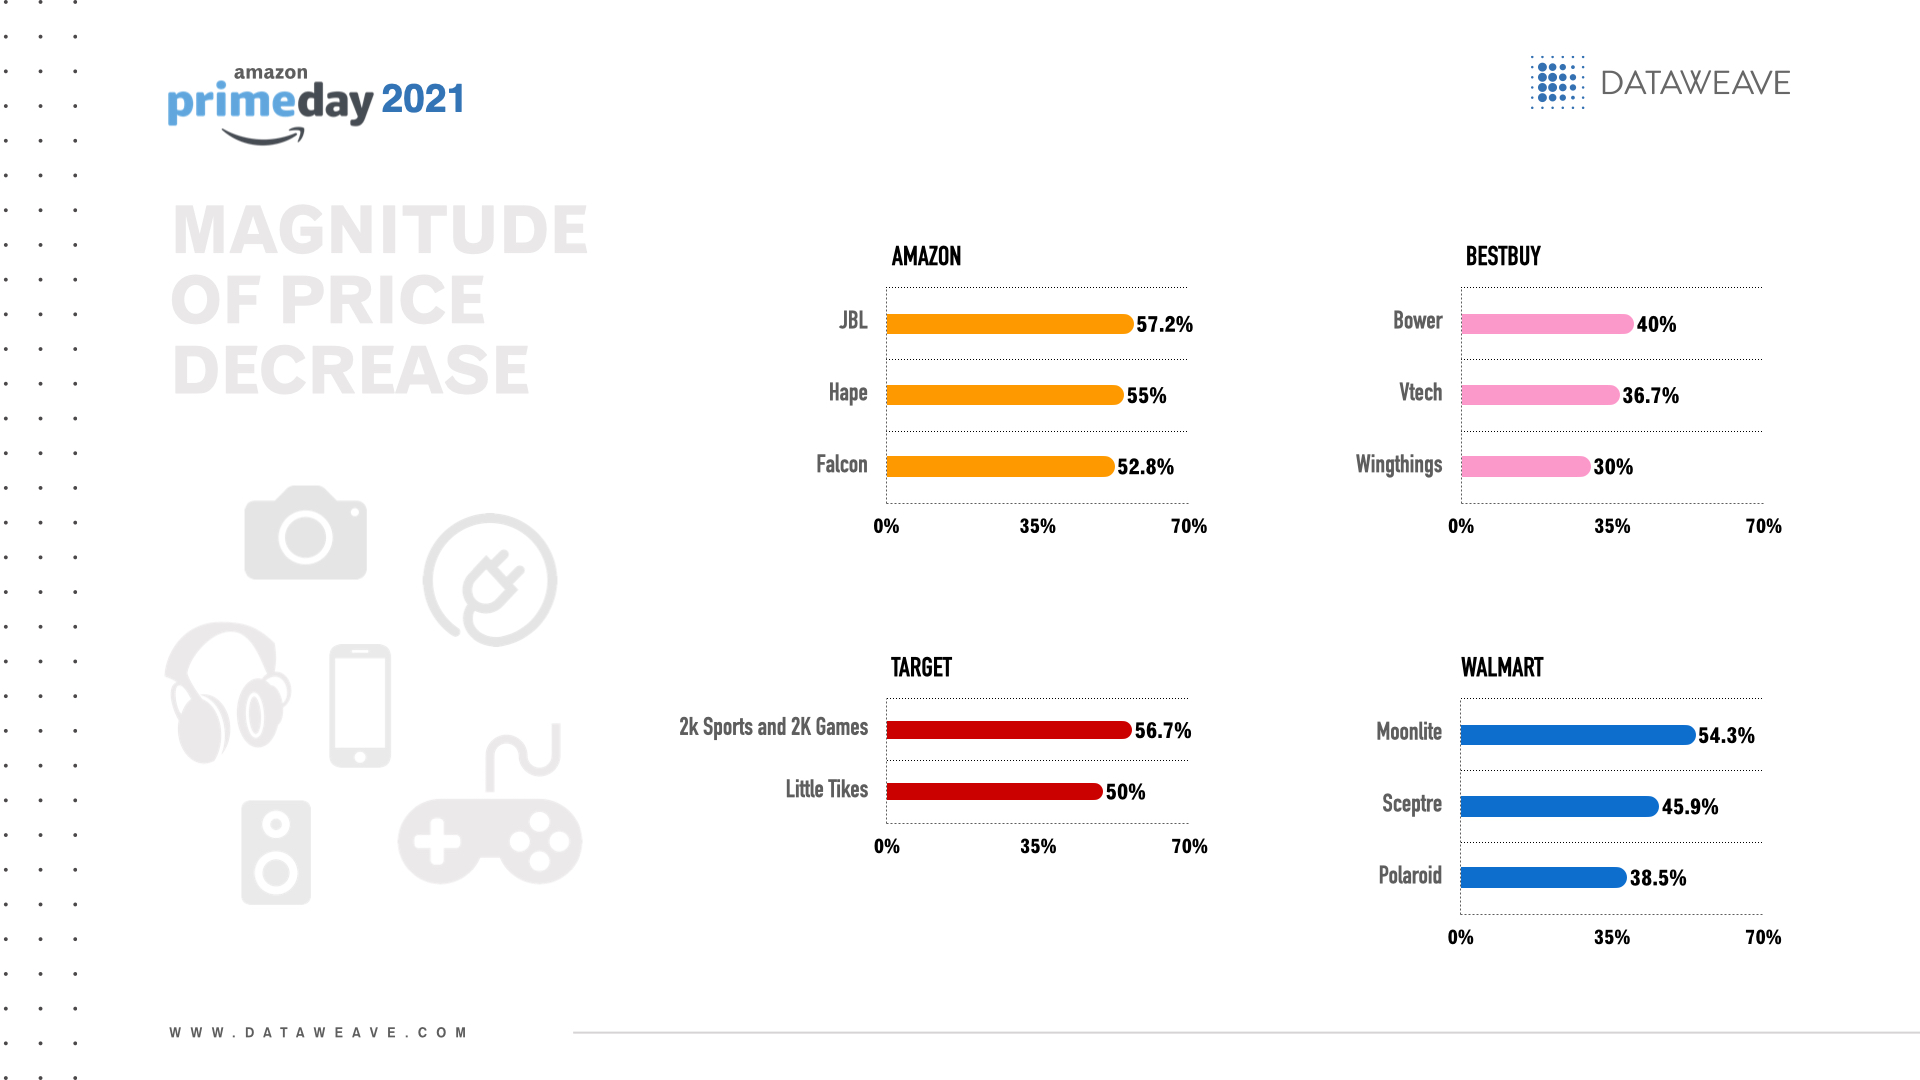
    Brands with the greatest magnitude of price decreases per US retailer included:

    Amazon US: JBL (57.2%), Hape (55.0%) and Falcon (52.8%)
    Best Buy: Bower (40.0%), Vtech (36.7%) and Wingthings (30.0%)
    Target: 2k Sports and 2K Games (both 56.7%), Little Tikes (50.0%)
    Walmart: Moonlite (54.3%), Sceptre (45.9%) and Polaroid (38.5%)

    The UK retailer with the greatest overall magnitude of price decrease for Prime Day was OnBuy (22.1%).

    The electronics subcategories with the greatest magnitude of price decrease per UK retailer were:

    Amazon UK: Home audio & theater (28.4%), electronics (21.7%) and cell phones & accessories (20.1%)
    Ebay: TV & video (19.5%), wearables (18.7%) and computer & office (16.6%)
    Etsy: Electronics (14.8%)
    OnBuy: Cell phones & accessories (22.3%) and wearables (5.9%)

    Brands with the greatest magnitude of price decreases across electronics categories per UK retailer included:
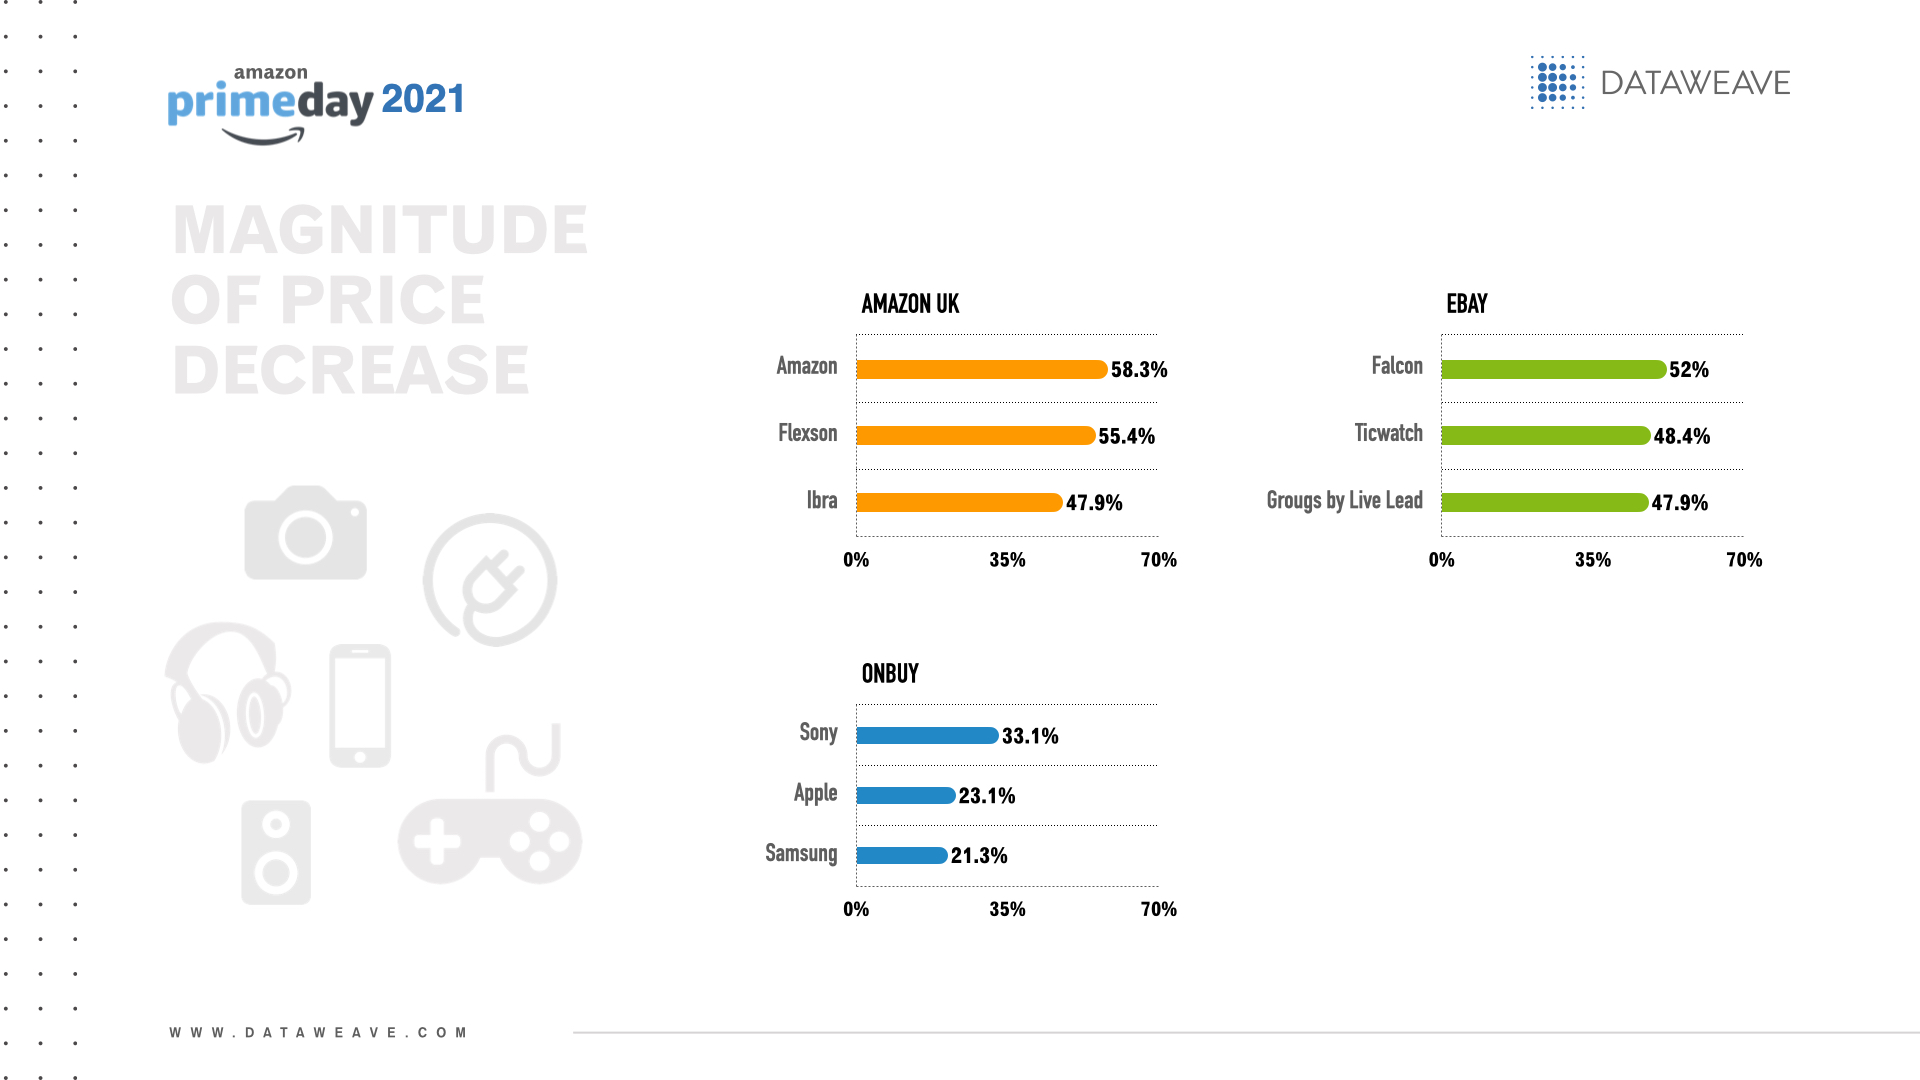
    Amazon UK: Amazon (58.3% for both cell phones & accessories and headphones), Flexson (55.4%) and Ibra (47.9% for both cameras and TV & video)
    Ebay: Falcon (52.0%), Ticwatch (48.4%) and Grougs by Live Lead (47.9%)
    OnBuy: Sony (33.1%), Apple (23.1%) and Samsung (21.3%)

    Among European retailers, Amazon Italy offered the greatest overall magnitude of price decrease for Prime Day (18.9%) among a total of 66 products.

    The electronics subcategories with the greatest magnitude of price decrease per European retailer were:
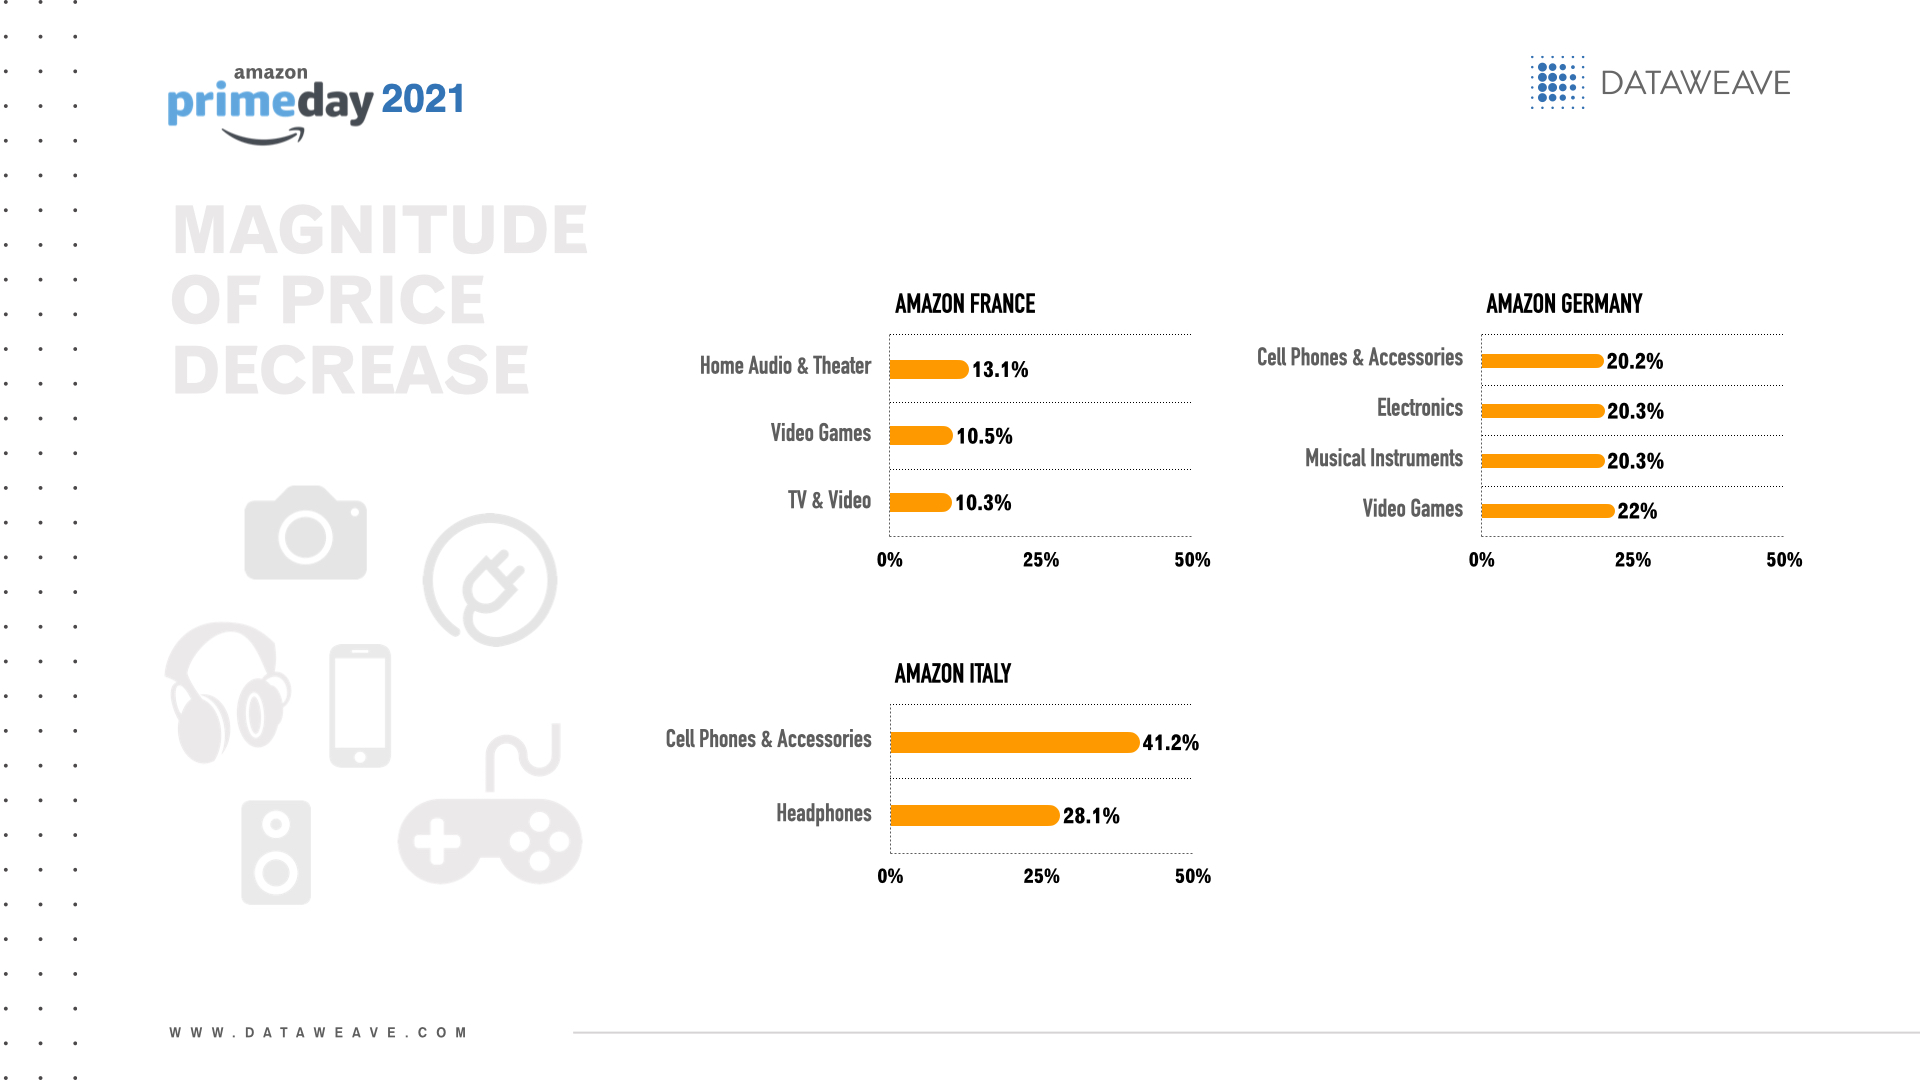
    Amazon France: Home audio & theater (13.1%), video games (10.5%) and TV & video (10.3%)
    Amazon Germany: Video games (22.0%), electronics and musical instruments (both 20.3%) and cell phones & accessories (20.2%)
    Amazon Italy: Cell phones & accessories (41.2%) and headphones (28.1%)

    Brands with the greatest magnitude of price decreases per European retailer included:
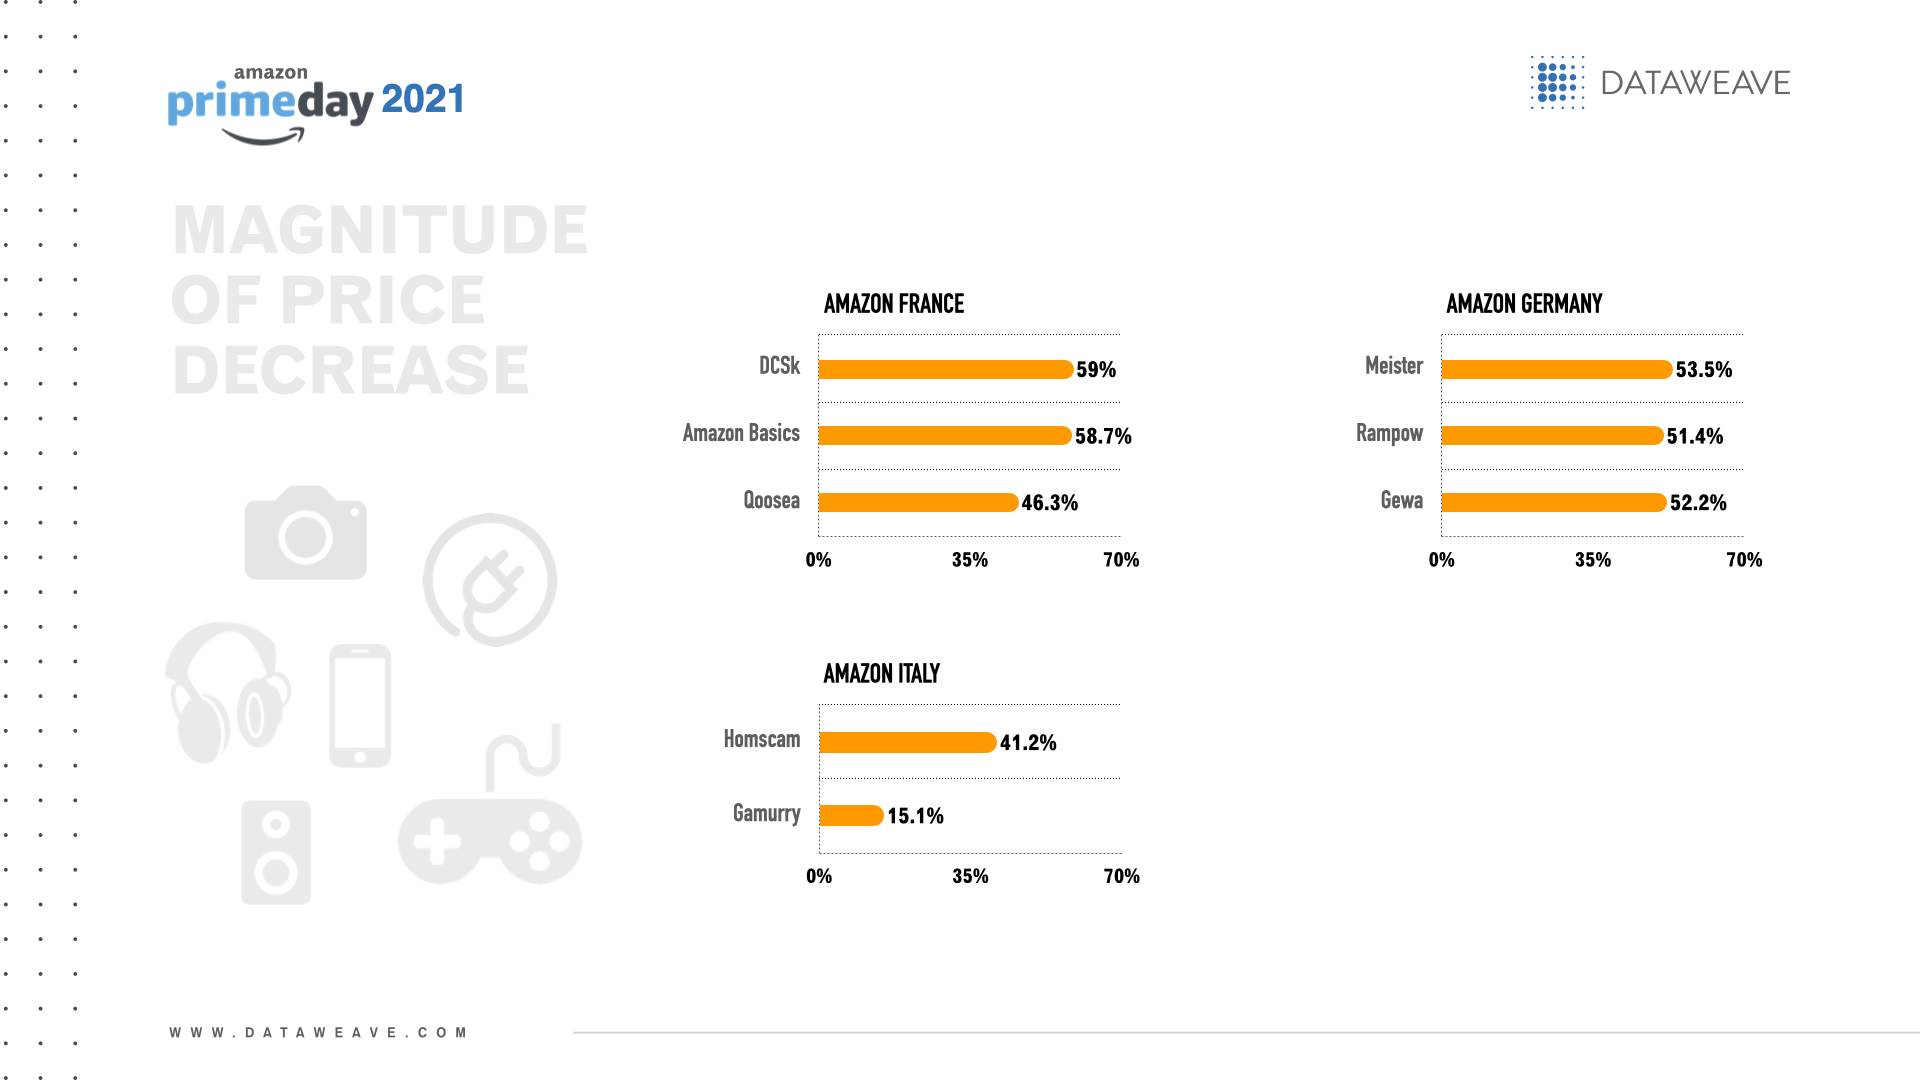
    Amazon France: DCSk (59.0%), Amazon Basics (58.7%) and Qoosea (46.3%)
    Amazon Germany: Meister (53.5%), Rampow (51.4%) and Gewa (51.1%)
    Amazon Italy: Homscam (41.2%) and Gamurry (15.1)

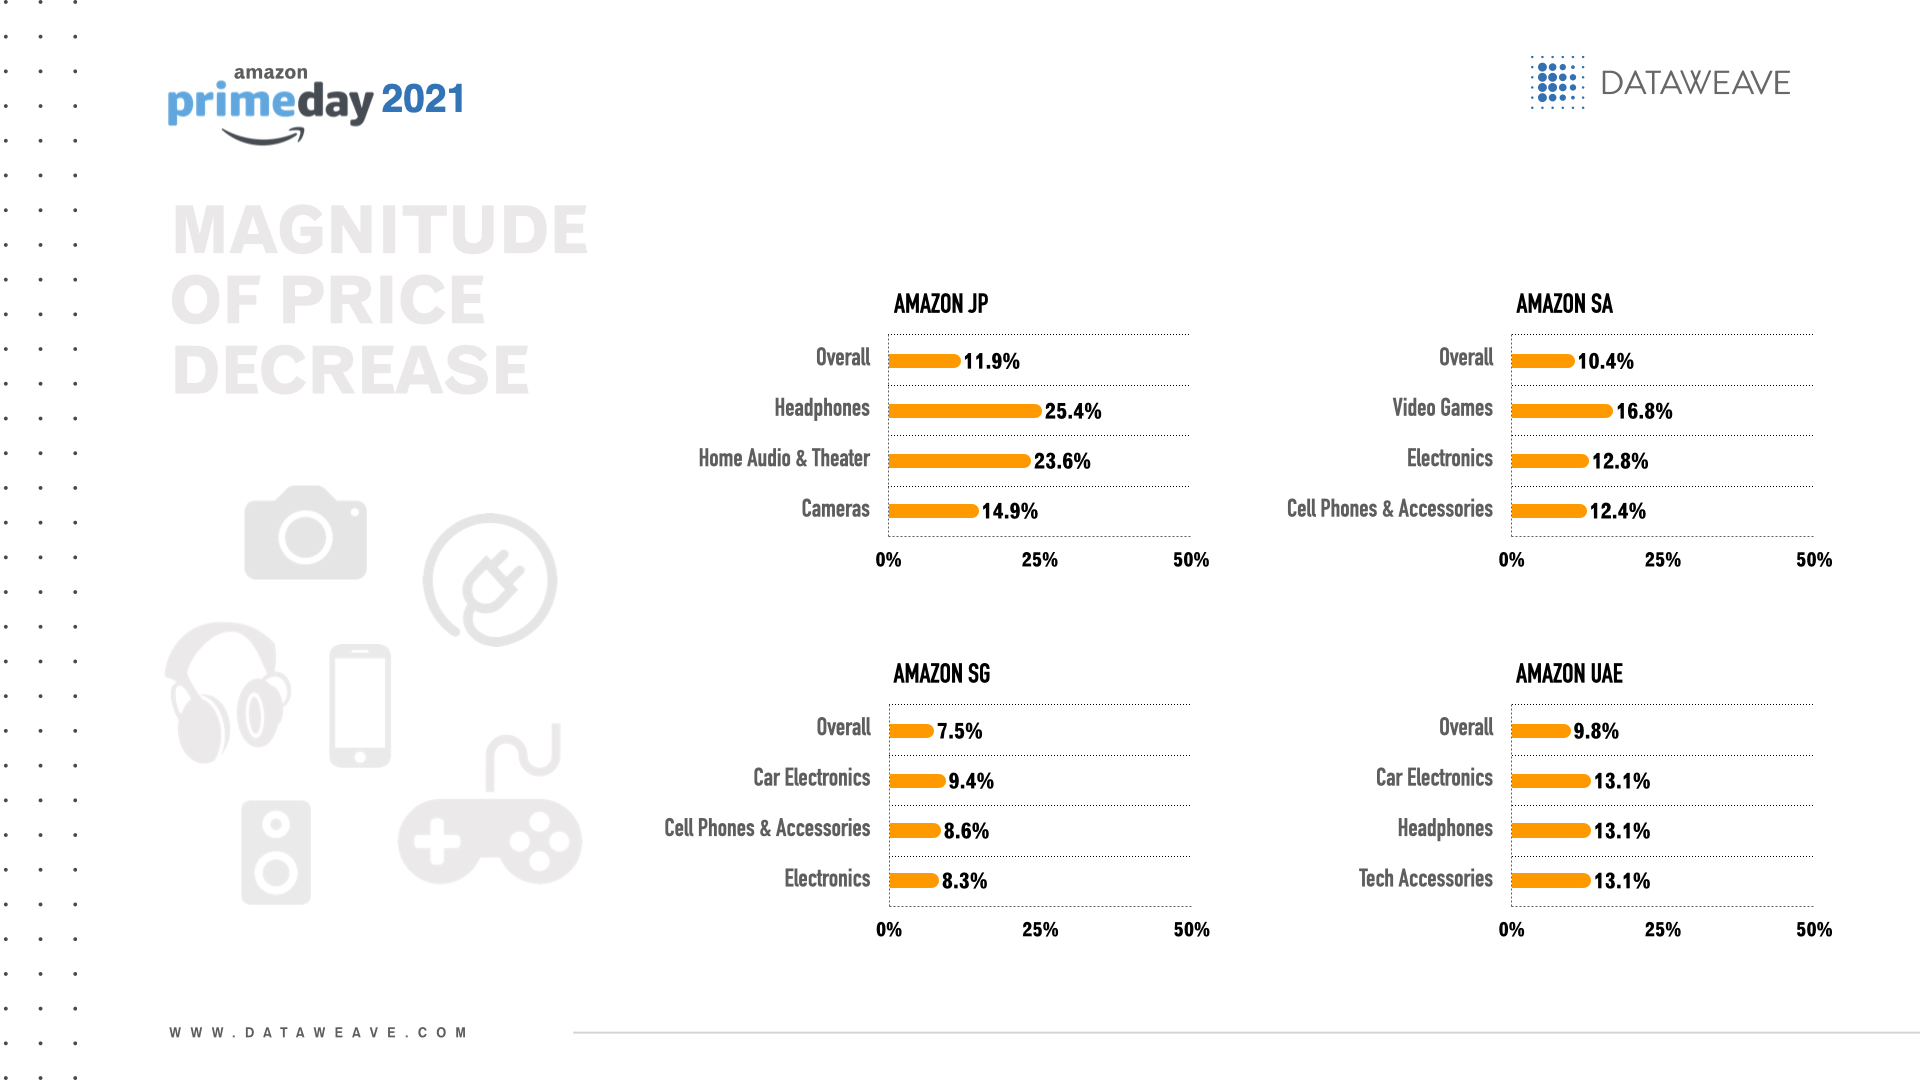
    Across the Middle East and Asia, Amazon Japan offered the greatest overall magnitude of price decrease for Prime Day (11.9%) among a total of 66 products.

    The electronics subcategories with the greatest magnitude of price decrease per retailer were:

    Amazon Saudi Arabia: Video games (16.8%), electronics (12.8%) and cell phones & accessories (12.4%)
    Amazon UAE: Car electronics, headphones and tech accessories (all 13.1%)
    Amazon Japan: Headphones (25.4%), home audio & theater (23.6%) and cameras (14.9%)
    Amazon Singapore: Car electronics (9.4%), cell phones & accessories (8.6%) and electronics (8.3%)

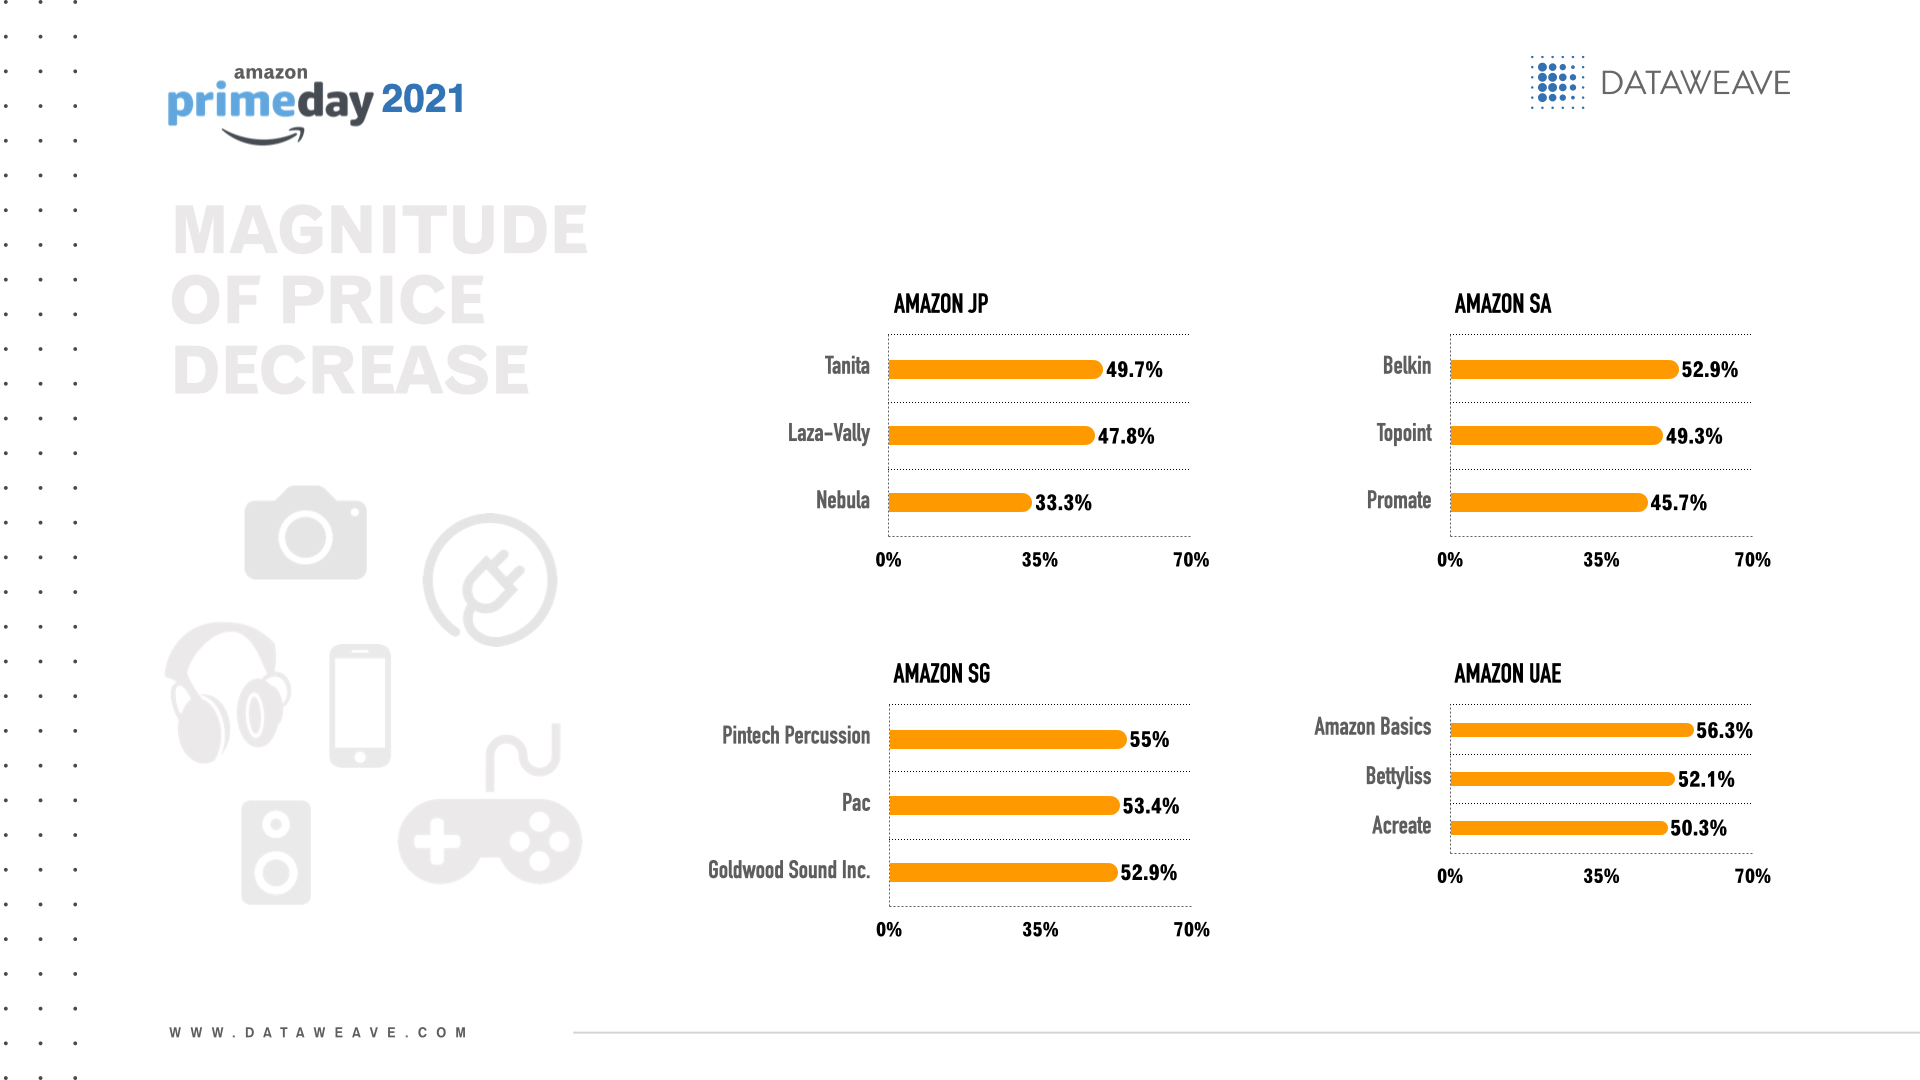
    Brands with the greatest magnitude of price decreases per retailer in the Middle East and Asia included:

    Amazon Saudi Arabia: Belkin (52.9%), Topoint (49.3%) and Promate (45.7%)
    Amazon UAE: Amazon Basics (56.3%), Bettyliss (52.1%) and Acreate (50.3%)
    Amazon Japan: タニタ(Tanita) (49.7%), Laza-Vally (47.8%) and Nebula (33.3%)
    Amazon Singapore: Pintech Percussion (55.0%), Pac (53.4%) and Goldwood Sound Inc. (52.9%)

    Discounts before, during and after the event

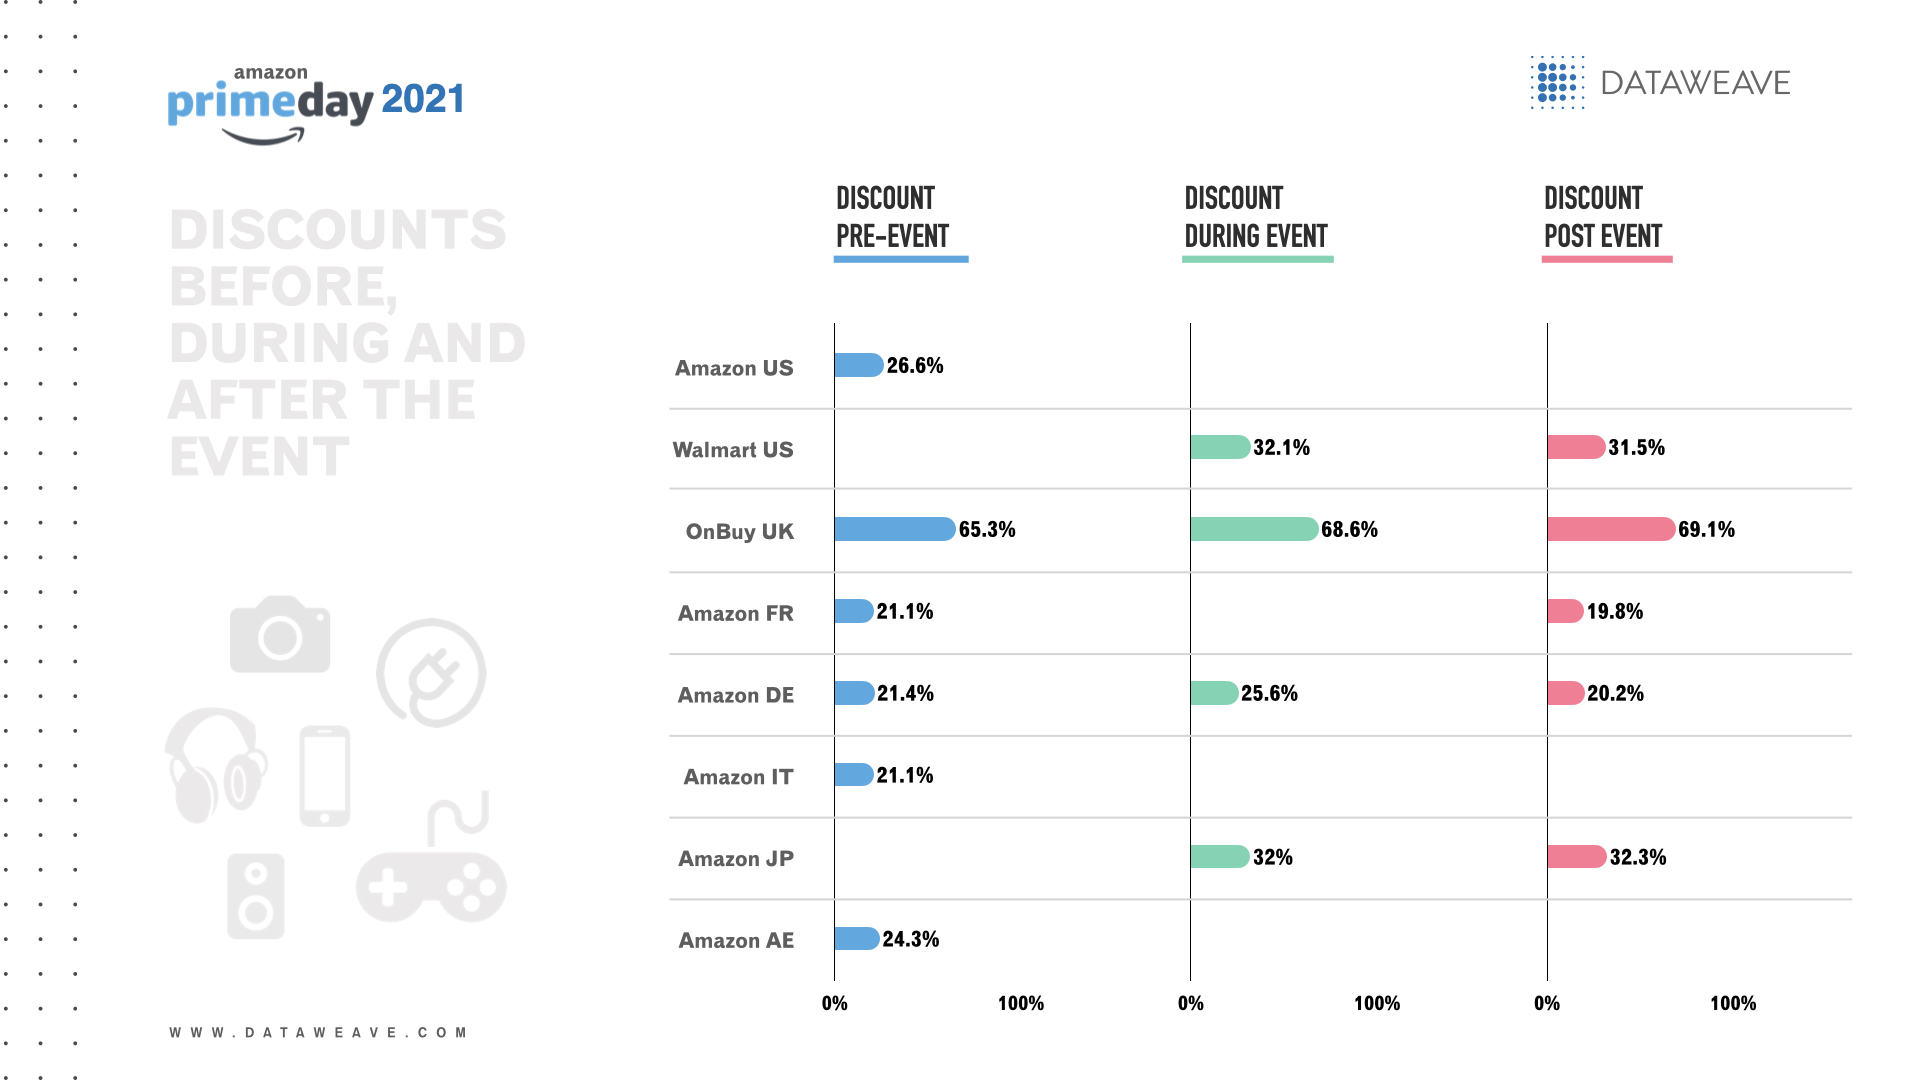
    The US retailer with the biggest overall electronics discount before Prime Day was Amazon US (26.6%). Amazon’s biggest discounts were on home audio & theater (30.5%), TV & video (29.1%) and cell phones & accessories (28.6%).

    Walmart offered the biggest discounts during (32.1%) and after (31.5%) the event. During the event, Walmart’s biggest discounts were on cell phones & accessories (46.3%), home audio & theater (35.5%) and computers & office (31.0%). Similarly, after the event, Walmart’s biggest discounts were on cell phones & accessories (45.8%), home audio & theater (35.3%) and computers & office (30.8%).

    OnBuy was the UK retailer with the biggest overall electronics discount before (65.3%), during (68.6%) and after (69.1%) Prime Day with a product count of 237. OnBuy’s biggest discounts were on cameras (69.5% before, during and after the sales event), cell phones & accessories (rising from 67.6% before the sales event to 71.6% during and 71.8% after the event) and wearables (65.2% before and after the event yet 35.5% during Prime Day).

    In Europe, Amazon Germany offered the biggest overall electronics discount before (21.4%), during (25.6%) and after (20.2%) Prime Day. Amazon France and Amazon Italy also offered comparable overall discounts (21.1%) before Prime Day.

    In the pre-sales event, Amazon Germany gave the most generous discounts on cameras (34.1%), wearables (24.7%) and headphones (24.3%). During Prime Day, Amazon Germany offered the biggest discounts on video games (30.7%), headphones (30.1%) and electronics (28.3%). After Prime Day, Amazon Germany offered the biggest discounts on headphones (24.2%) electronics (22.6%) and cell phones & accessories (22.1%).

    Across retailers in the Middle East & Asia, Amazon UAE offered the biggest overall electronics discount before Prime Day (24.3%), whereas Amazon Japan offered the biggest discount during (32.0%) and after (32.3%) Prime Day.

    In the pre-sales event, Amazon UAE offered the most generous discounts on TV & video (31.3%), musical instruments (31.0%) and headphones (25.4%). During and after Prime Day, Amazon Japan offered the biggest discounts on Bluetooth & wireless speakers and electronics (both 99.0%).
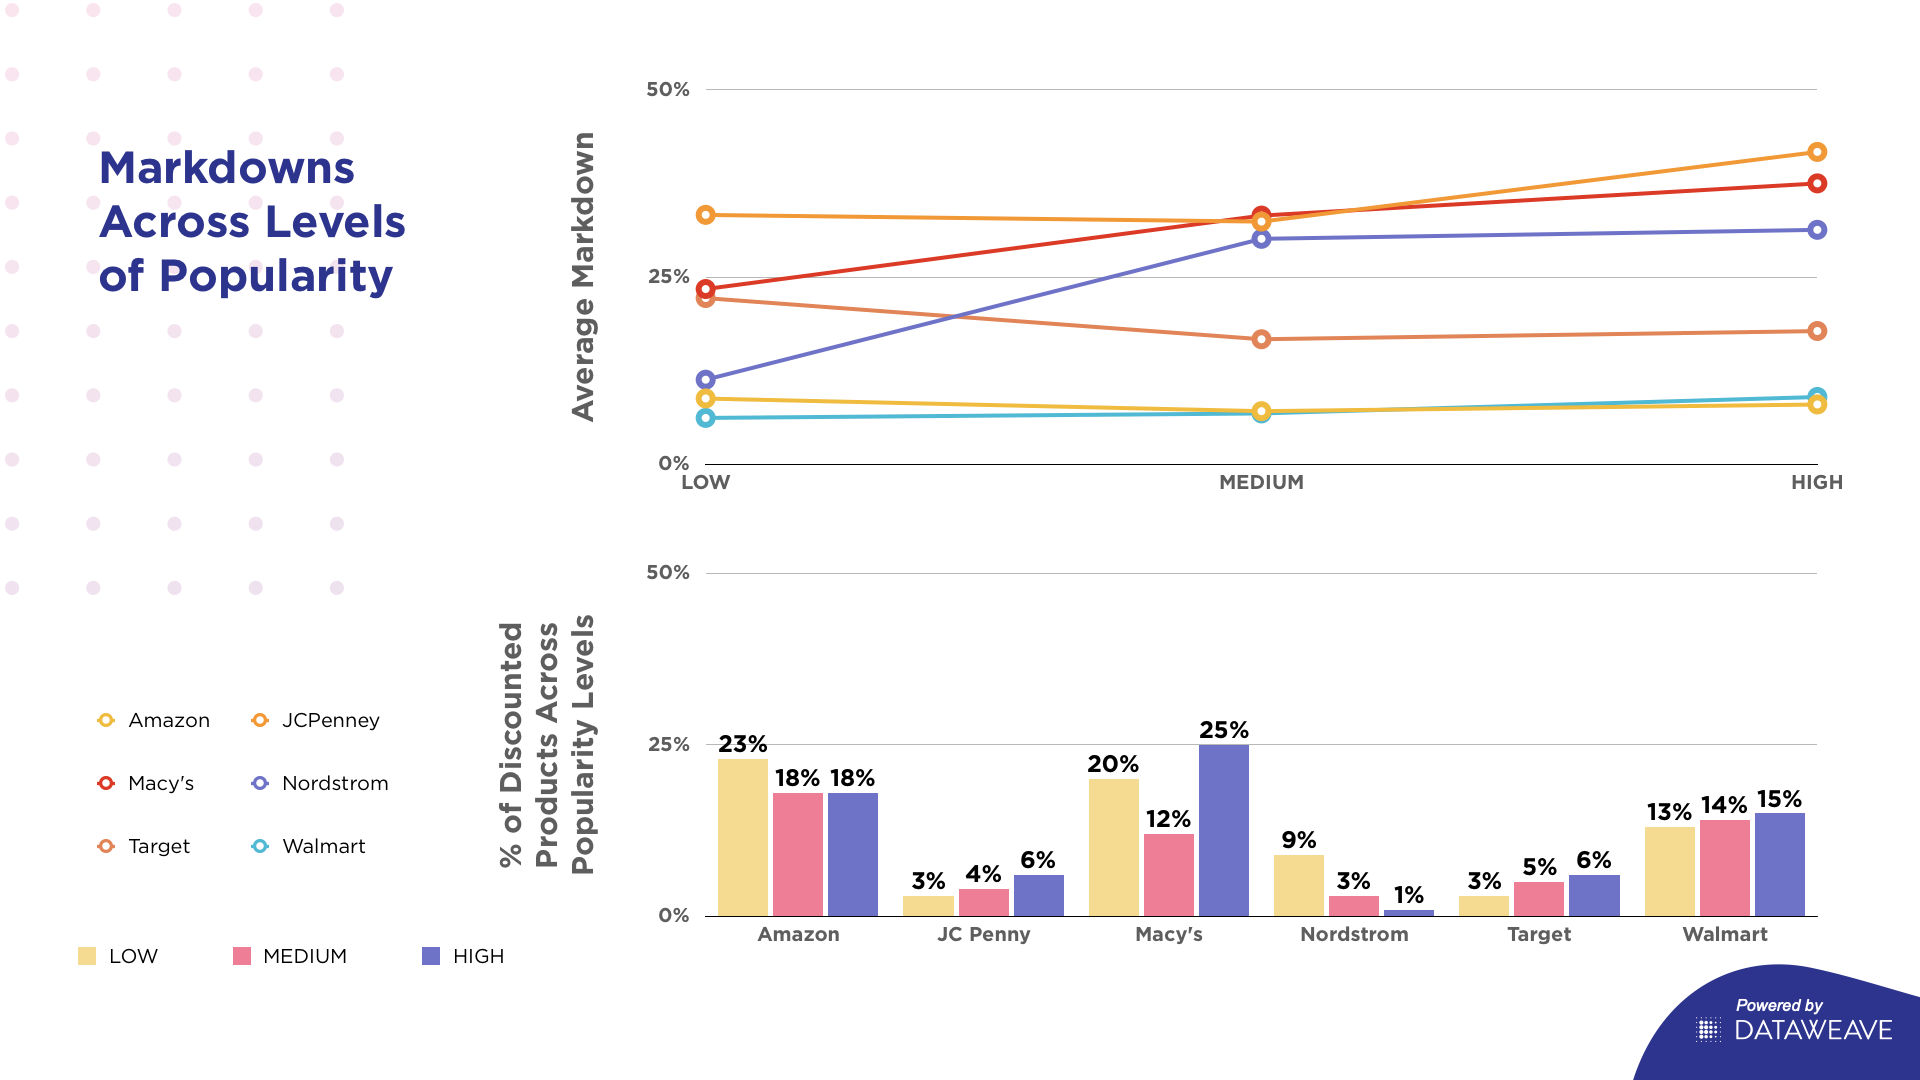
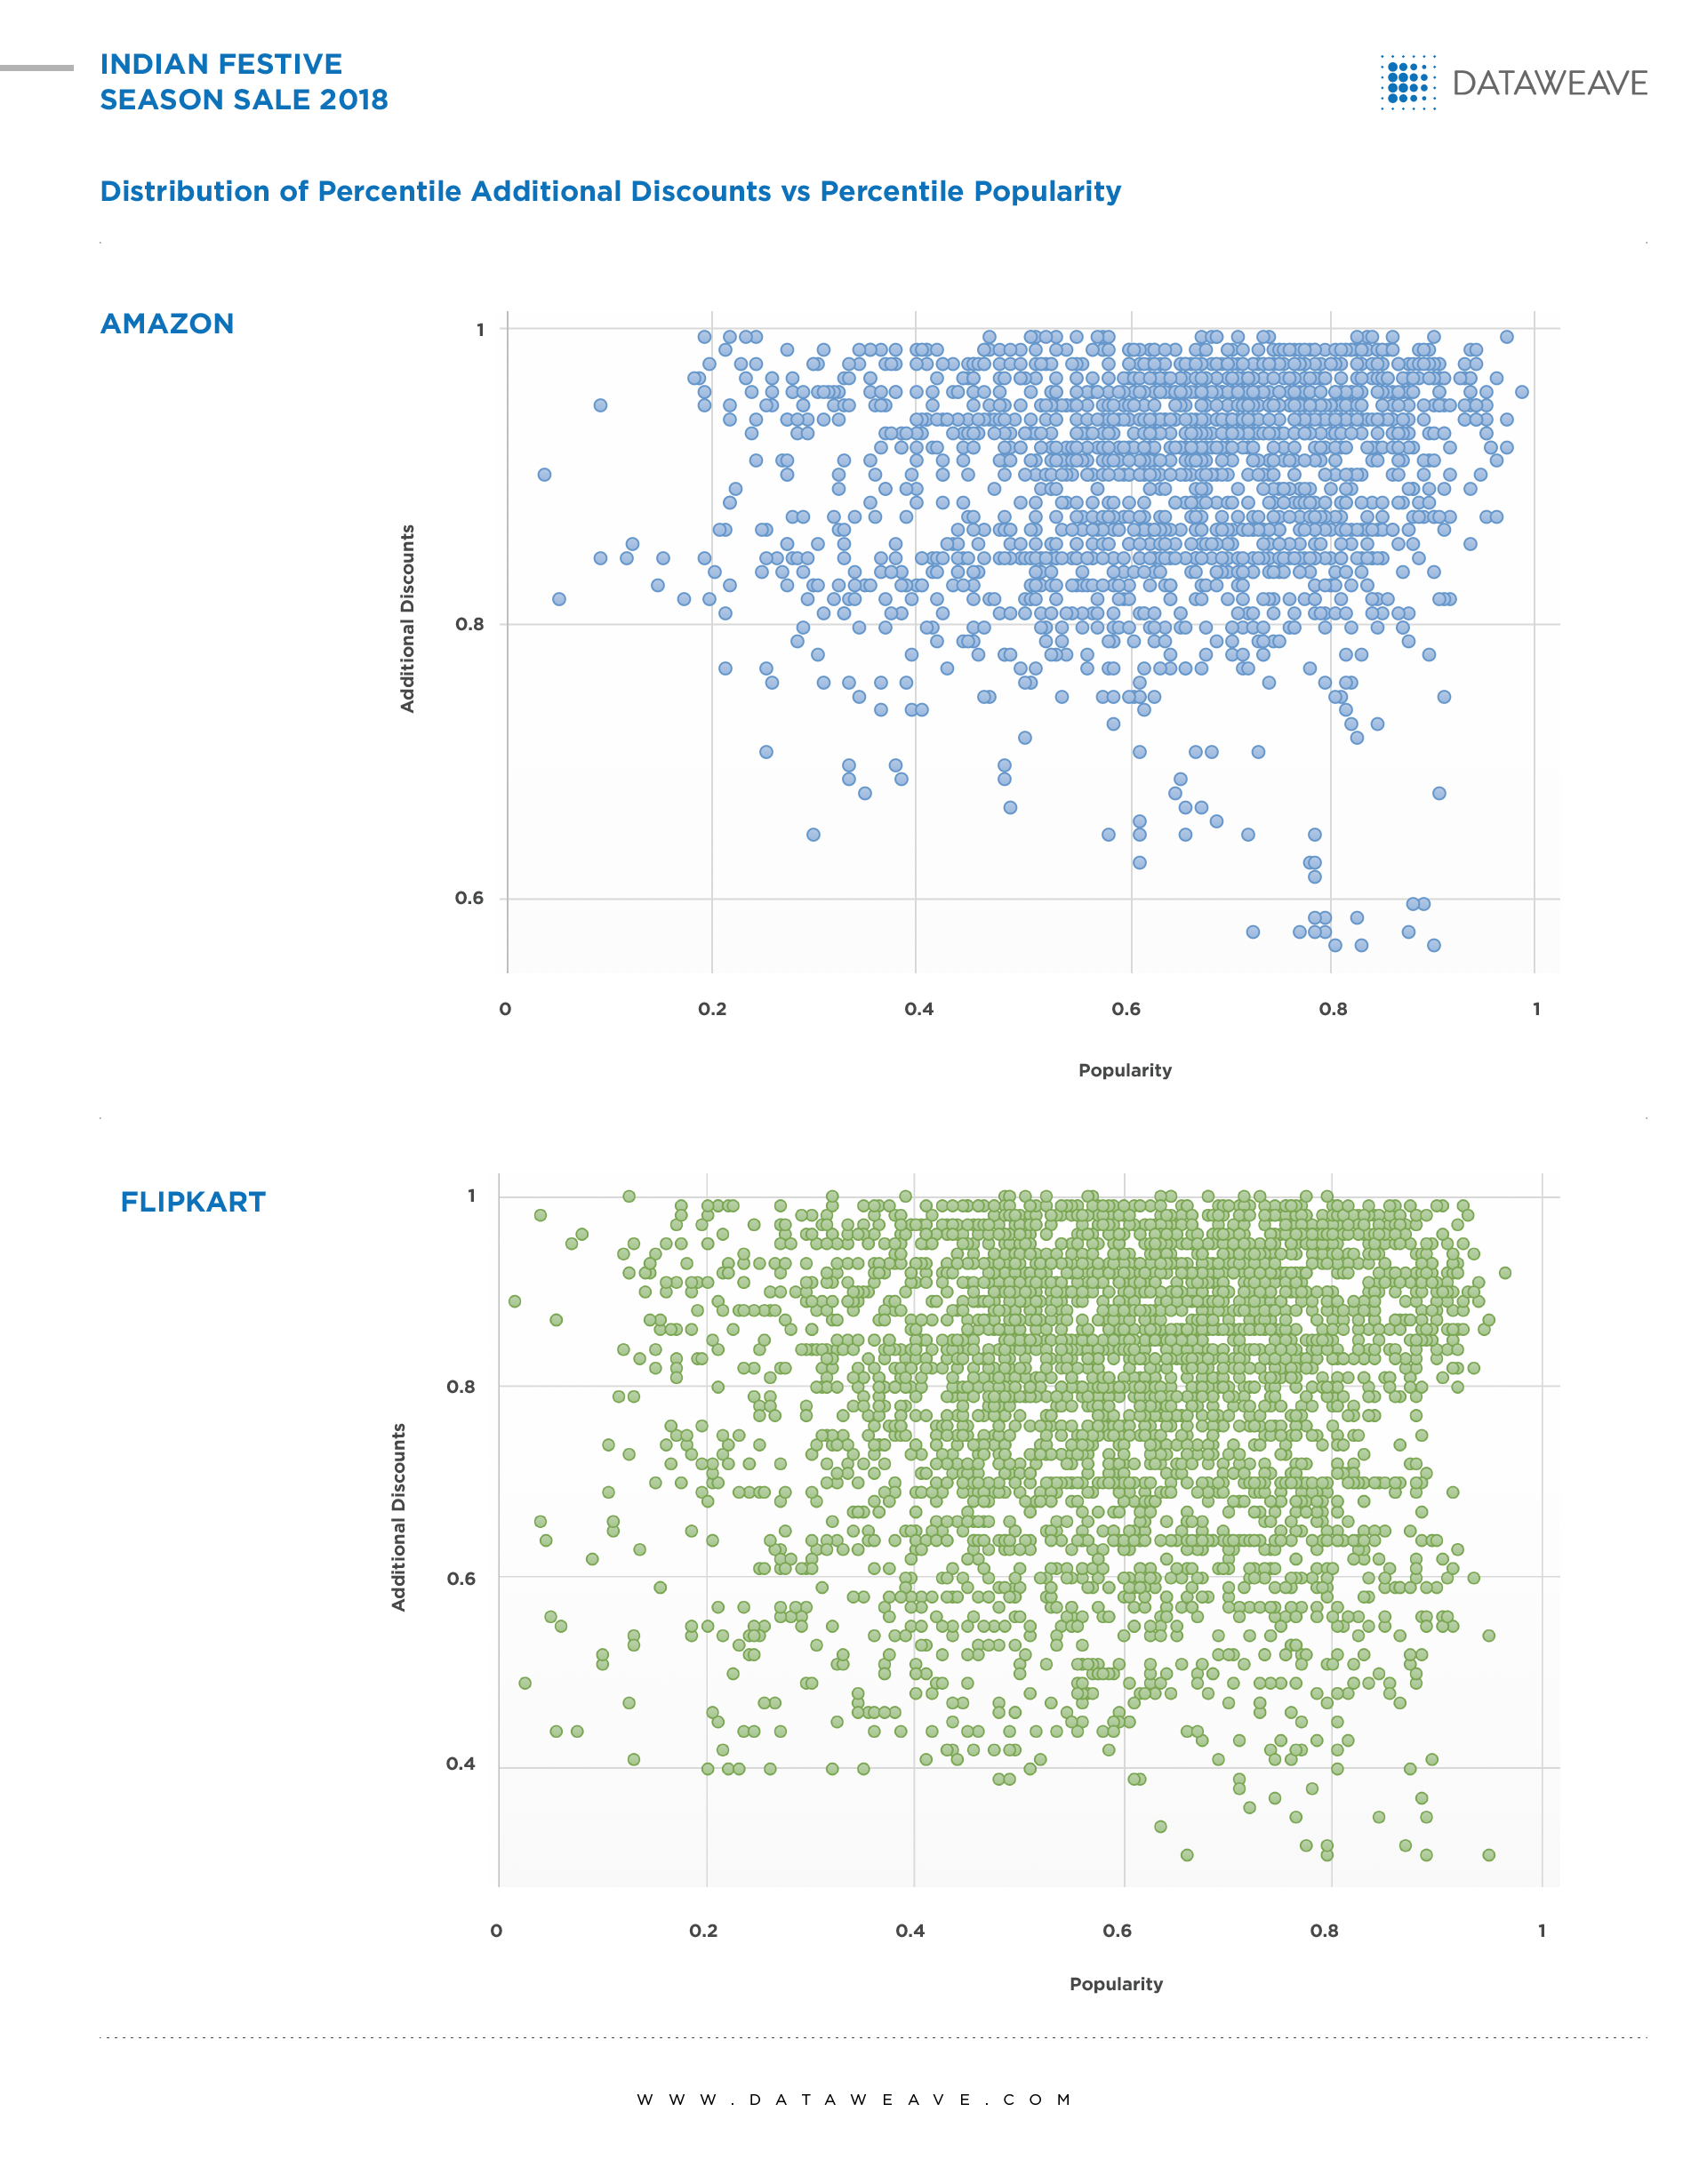
    Popularity

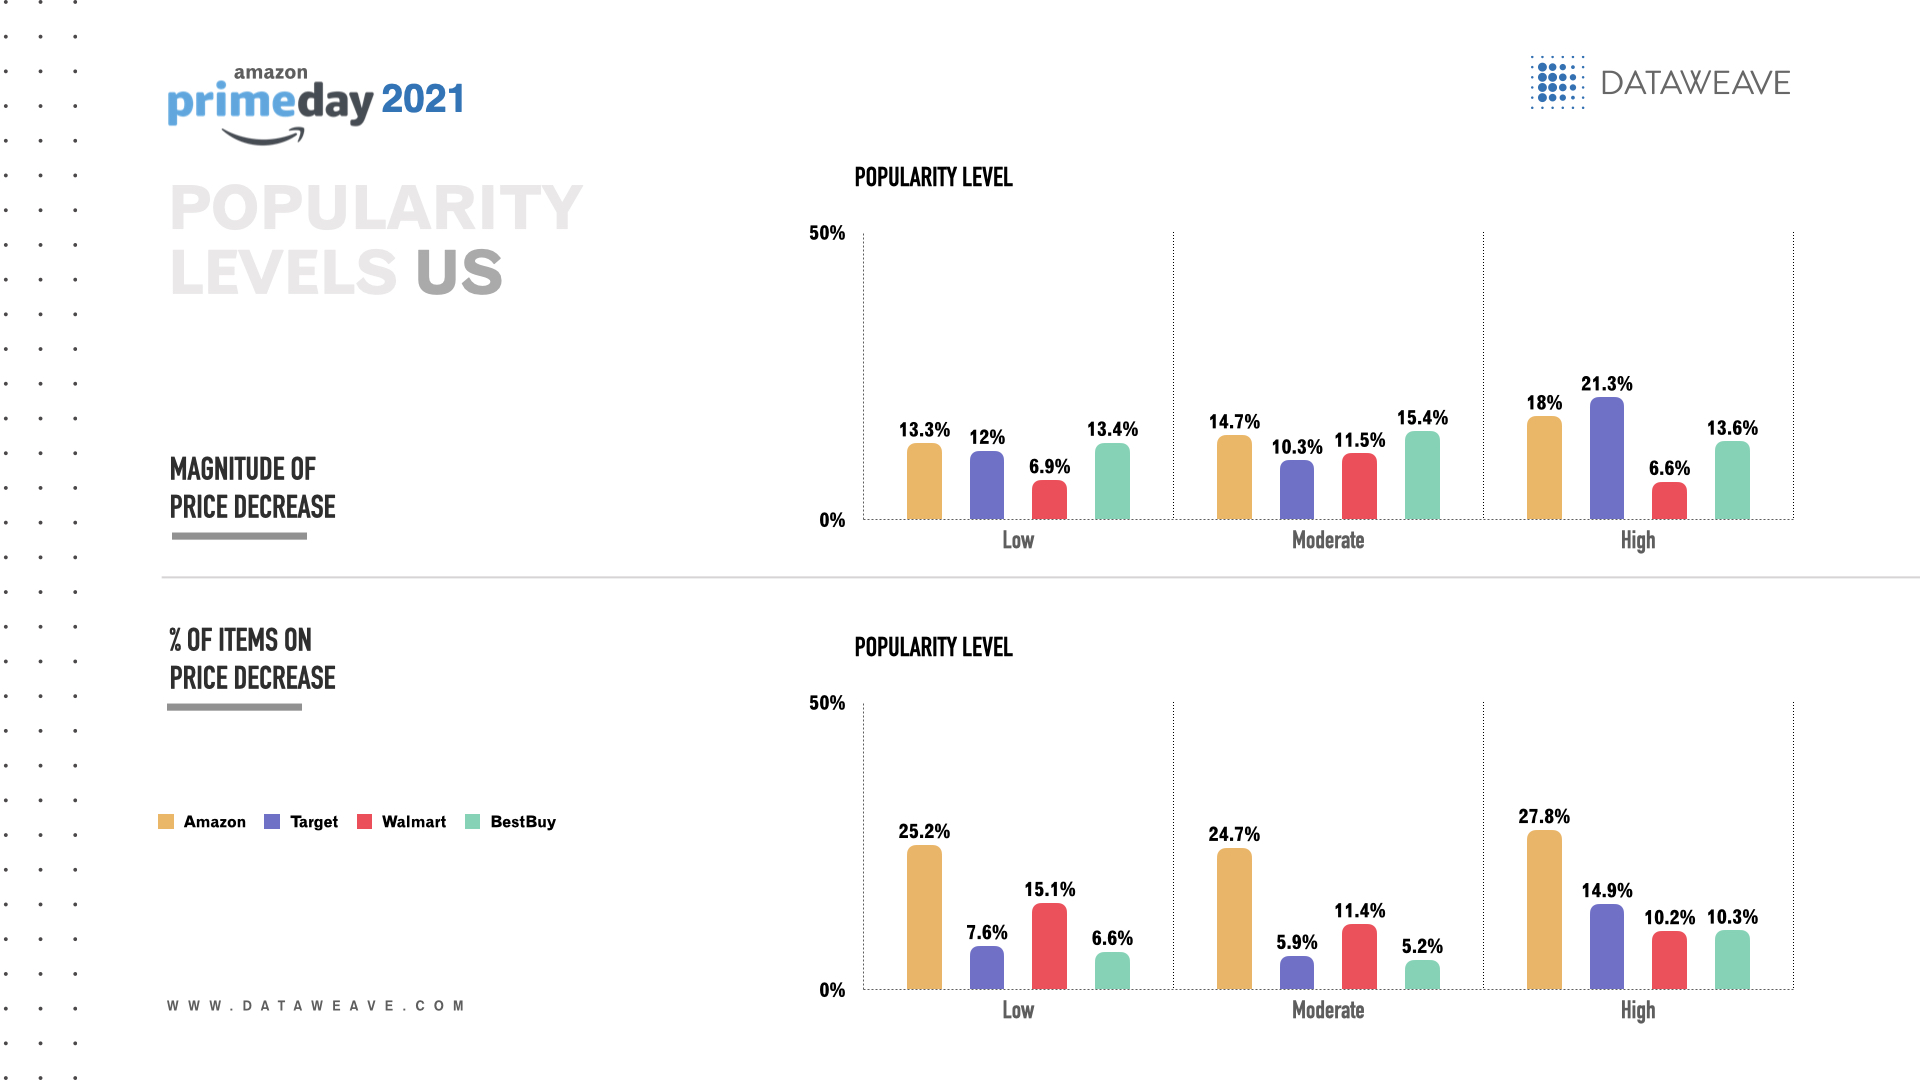
    In the US, among electronics with high popularity, Amazon US offered the highest percentage of items with a price decrease (27.8%) and Target offered the greatest magnitude of price decrease (21.3%).

    For electronics with moderate popularity, Amazon US offered the highest percentage of items with a price decrease (24.7%) and Best Buy offered the greatest magnitude of price decrease (15.4%).

    Among electronics with low popularity, Amazon US offered the highest percentage of items with a price decrease (25.2%) and Best Buy offered the greatest magnitude of price decrease (13.4%), closely followed by Amazon US (13.3%).

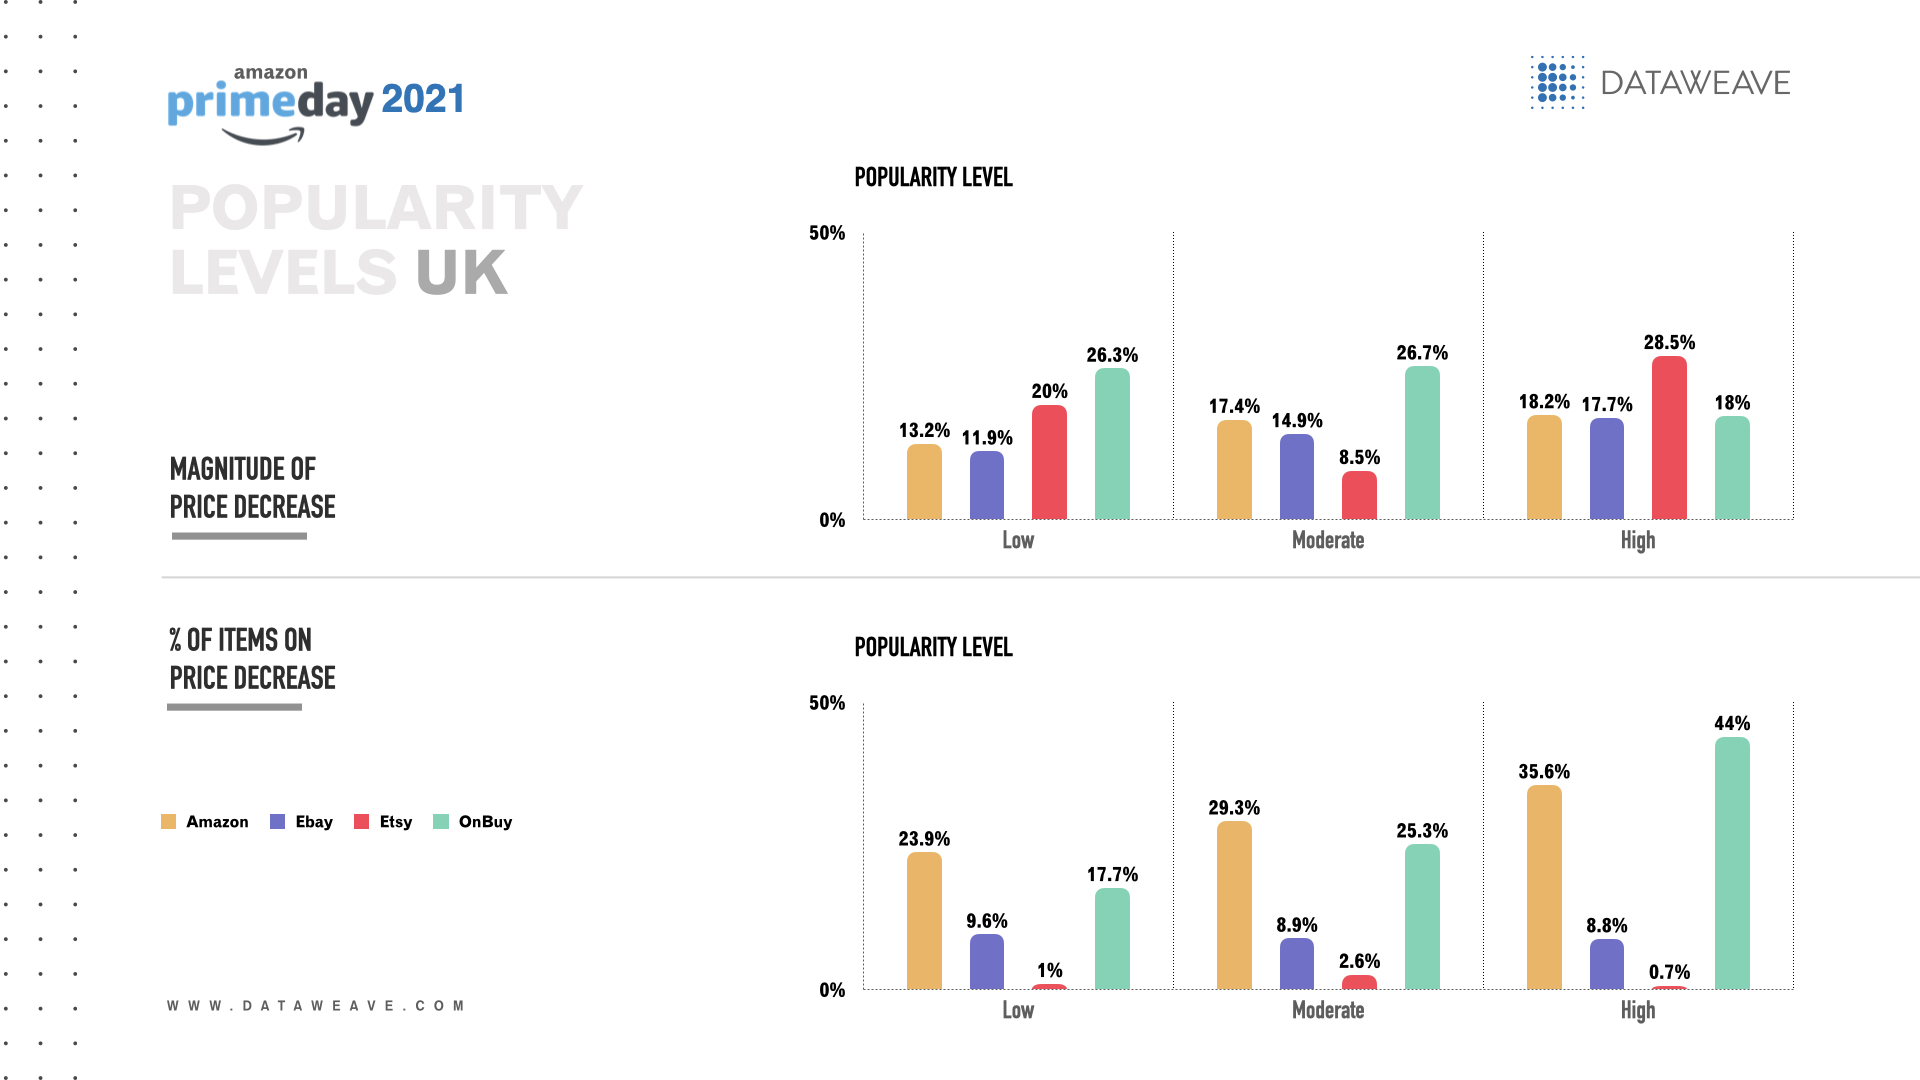
    In the UK, among electronics with high popularity, OnBuy offered the highest percentage of items with a price decrease (44.0%) among 84 products and Etsy offered the greatest magnitude of price decrease (28.5%) among 150 products.

    For electronics with moderate popularity, Amazon UK offered the highest percentage of items with a price decrease (29.3%) and OnBuy offered the greatest magnitude of price decrease (26.7%).

    Electronics with low popularity, Amazon UK offered the highest percentage of items with a price decrease (23.9%) and OnBuy offered the greatest magnitude of price decrease (26.3%).

    In Europe, among electronics with high popularity, Amazon Germany offered the highest overall percentage of items with a price decrease (30.1%) and the greatest overall magnitude of price decrease (20.2%).

    For electronics with moderate popularity, Amazon Germany offered the highest percentage of items with a price decrease (29.7%) and Amazon Italy offered the greatest magnitude of price decrease (41.2%) among 12 products.

    Among electronics with low popularity, Amazon Germany offered the highest percentage of items with a price decrease (26.7%) and the greatest magnitude of price decrease (17.2%).

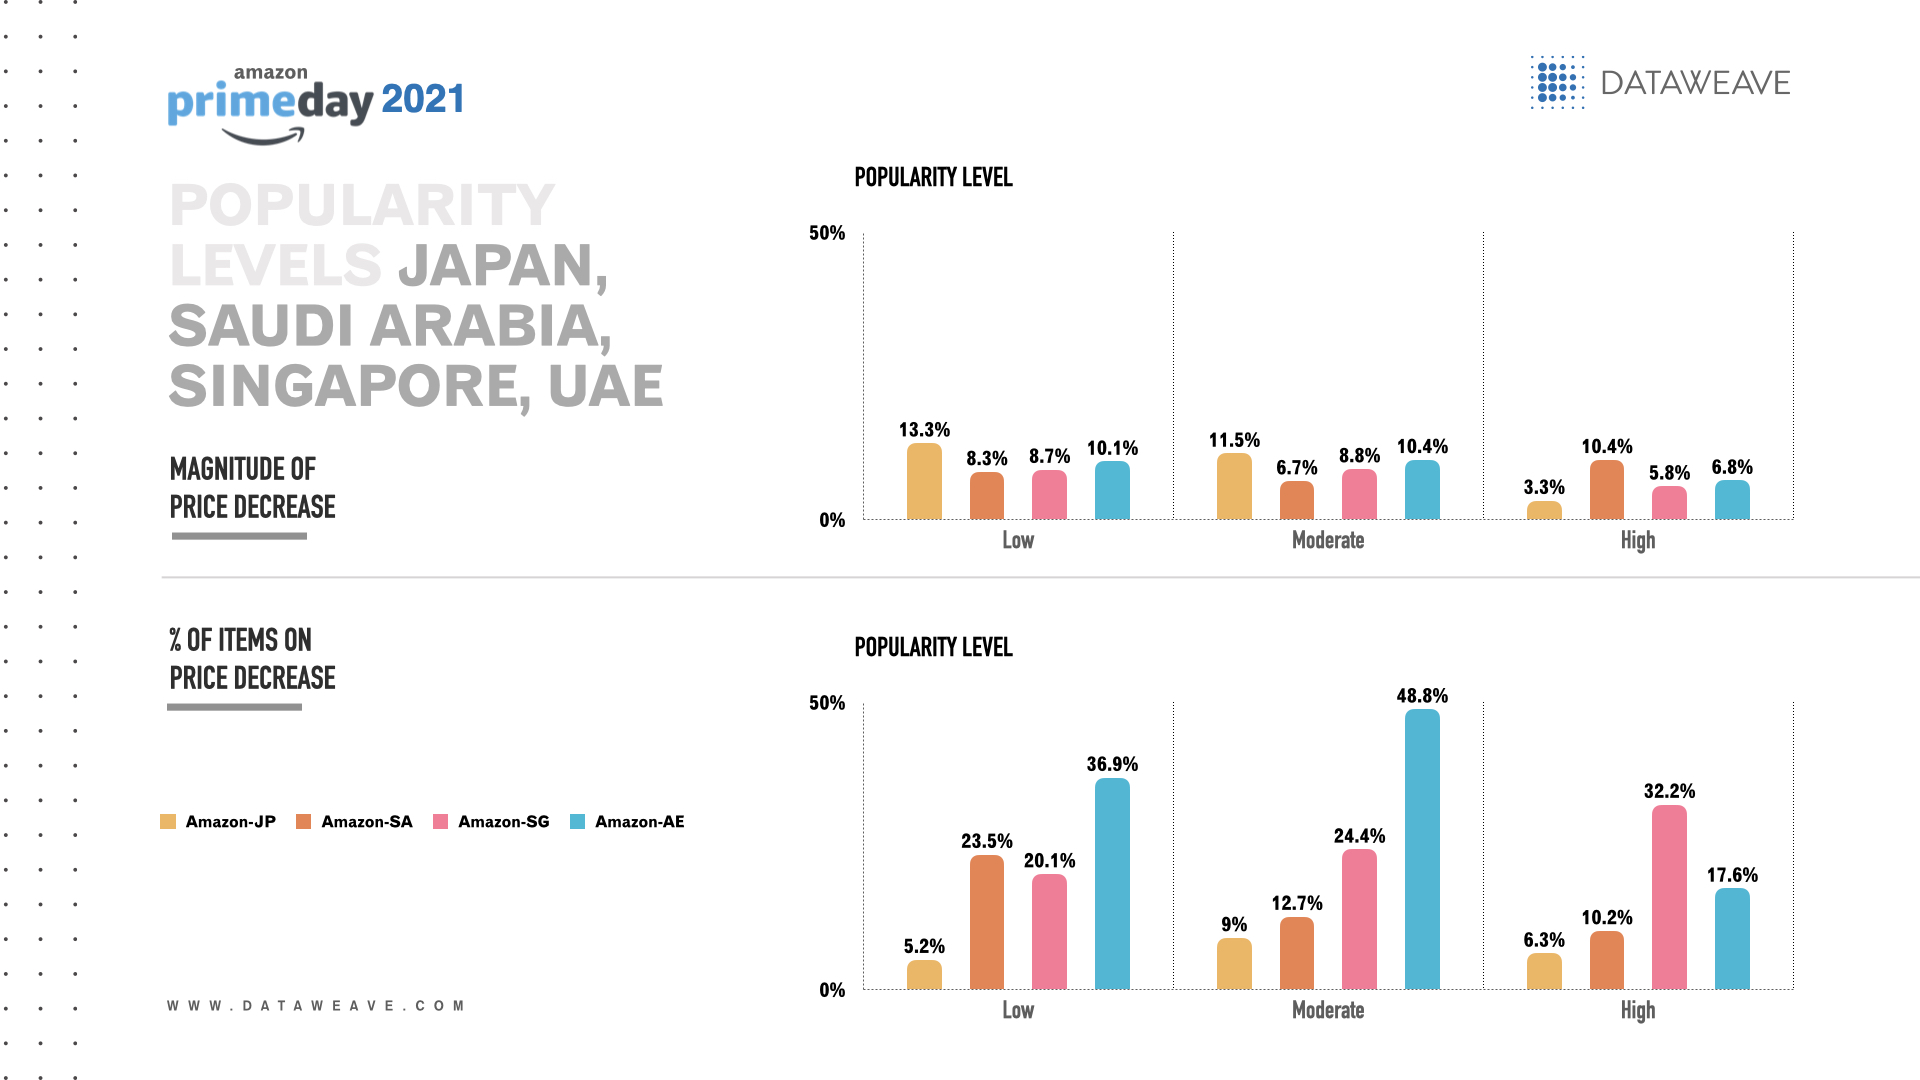
    In Middle East & Asia, among electronics with high popularity, Amazon Singapore offered the highest overall percentage of items with a price decrease (32.2%) and Amazon Saudi Arabia had the greatest overall magnitude of price decrease (10.4%).

    For electronics with moderate popularity, Amazon UAE offered the highest percentage of items with a price decrease (48.8%) and Amazon Japan offered the greatest magnitude of price decrease (11.5%).

    Similarly, among electronics with low popularity, Amazon UAE offered the highest percentage of items with a price decrease (36.9%) and Amazon Japan the greatest magnitude of price decrease (13.3%).

    Consumers won big on Prime Day 2021

    Overall, Prime Day 2021 offered a wide range of deals across the competitive electronics category in each region. Almost all of the retailers we studied (except for Ebay) showed up in the analysis for offering notable discounts and pricing strategies this year. Amazon US, OnBuy, Amazon Germany, Amazon Japan and Amazon UAE appeared in the results most often among their respective regions. Stay tuned for Prime Day 2021 pricing insights across other categories, including home, health & beauty and fashion.

  • Amazon’s losing its pricing advantage this holiday season

    Amazon’s losing its pricing advantage this holiday season

    Amazon’s pricing advantage has declined in key categories, compared to last year as we enter 2020’s holiday season.

    The holidays are here and the retail industry is gearing up for the yearly stampede. In a report published by Bain & Company, in partnership with DataWeave, it was observed that, “When it comes to pricing, Amazon’s historical advantage is also deteriorating. The research shows that in October and November 2019, Amazon matched or beat competitors’ prices 81% of the time in the categories studied. By November of 2020, that rate dropped to 74%”. This was based on the four key categories where we had pricing data for Amazon and at least one other competitor.

    Amazon’s pricing advantage has declined in key categories

    Amazon_product_pricing

    Aggressive pricing, which was once Amazon’s forte, seems to be on a downward trend this year. All but one category saw an increase in the percentage of products where they beat the lowest price, ‘movies, music, video games’ – by a small margin of one percentage point.

    What could this shift be attributed to? The obvious would be the repercussions of COVID but there perhaps is more at work here. As observed last year, the behemoth that Amazon is, does not deter its competitors from constantly biting at the heels, with a steely determination to rope in market share. Everything from increased and specific customer demands, to government legislation, there are a lot of moving parts.

    One thing is for sure, this is surely just the beginning of the great e-commerce battle. For access to the full article that was published in the Retail Holiday Newsletter by Bain & Company and powered by DataWeave, click here.

  • Amazon Great Indian Festival Vs Big Billion Day- Who offered better discounts?

    Amazon Great Indian Festival Vs Big Billion Day- Who offered better discounts?

    The Great Indian Festival finally arrived and it coincided with Flipkart’s Big Billion Day Sale. The pandemic has pushed consumers to shop online and both, the Great Indian Festival and the Big Billion Day sales had been eagerly anticipated. Flipkart’s sale lasted between 16-21 October, while Amazon’s (in India) took started on 17th October.

    It is claimed that Amazon and Flipkart have hit $3.5 billion in sales in just four days. On the last day of its Sale, Flipkart claimed to have achieved 10 times growth as compared to last year’s Big Billion Day sale. Clearly, the sales have surpassed all the forecasts made for this year’s sale. We at DataWeave took a closer look to analyze the discounts that were offered across popular categories, to see if customers really had access to better deals and discounts. 

    Our Methodology:

    We looked at the top 500 products across categories like Fashion – men and women, electronics, Amazon devices, baby products, grocery and personal care. The pricing offered on these products across the sale period was compared with the pre-sale price, to understand the trend in discounts across the popular categories and brands.

    The Verdict:

    We segmented the products we were tracking into the following:

    Type 1: Products were either priced the same or were discounted over the sale compared to pre-sale 

    Type 2: Products were either priced the same or witnessed price increase during the sale compared to pre-sale 

    Type 3: Products which saw both price increase and decrease during sale compared to pre-sale

    Type 4: Products whose price continued to be the same even during the sale 

    flipkart_big_billion_day_2020_chart_1

    Flipkart clearly provided the better deals to customers for the categories we looked at during their Big Billion Day sale compared to Amazon. Flipkart discounted 54% of its products during the sale period compared to Amazon, and 26% of the products were discounted. 

    It is also interesting to note that in addition to offering more discounted products, Flipkart also offered additional discounts than Amazon.

    Amazon offered 13.2% additional discount and most of this average discounting can be attributed to a 33.8% discount on Amazon devices. It also ended up increasing the pricing for 16% of the products during the sale period, while Flipkart hiked the pricing for 6% products. 56% of products on Amazon continued being sold at the same price even during the sale. 

    Additional discounts across product premiumness levels

    Premiumness was based on the actual price of a product before the sale event. This was divided into low, medium and high premiumness levels, with high indicating higher selling prices.

    flipkart_big_billion_day_2020_chart_2
    big_billion_day_great_indian_sale_2020

    In Amazon devices, baby products, electronics and grocery-cooking essentials, Amazon showed a direct relationship between its additional discounts and the level of premiumness. While Flipkart did not seem to follow a particular pattern with respect to product premiumness. 

    Flipkart offered the highest discounts for premium products in the Fashion category (for both men and women) compared to the rest. 

    Top brands by additional discounts:

    We looked at popular brands across categories to arrive at brands that were being sold at the maximum discount. These brands appeared at least twenty times in the top 500 ranks we considered.

    amazon_great_indian_sale_2020_electronics

    Acer, Philips, Samsung, Lenovo, Bajaj, Asus which were common brands across both Flipkart and Amazon in the electronics category, were being sold at much deeper discounts on Flipkart (almost double), compared to that on Amazon.

    Avita was extremely popular under the laptop sub-category on Flipkart and was observed to be discounted the highest during the sale.

    In Fashion, Titan was the most discounted brand with 53.9% additional discount but only 4% and 2% of the products offered discounting in mens’ and womens’ fashion respectively. Reebok in mens’ fashion and Fastrack, Sonata and Puma in womens’ wear on Flipkart, had discounts across almost all the products. 

    amazon_great_indian_sale_2020_baby_care
    flipkart_big_billion_day_2020_baby_care

    In the baby care category, Hasbro gaming on Flipkart had the highest additional discount followed by Funskool. Both the brands had more than 85% of their products discounted. 

    Johnson’s, which was common on both Amazon and Flipkart, was offered at higher discounts on Amazon compared to Flipkart. However, only 31% products were discounted vs 72% on Flipkart.

    Most Visible Brands

    We looked at the top 200 ranks across each sub-category to narrow down on the most visible brands across the sale period.

    amazon_great_indian_sale_top_brands
    flipkart_big_billion_day_2020_top_brands

    Across all categories and their sub-categories, the sub-category laptop had distinct brands that hold the majority of the products. This is observed both in Amazon and Flipkart where brands like Lenovo, HP, Asus hold more than 33% share of the first 200 products. 

    “Mobile” category was dominated by brands like Redmi and Boat on Amazon, and Realme and OPPO on Flipkart. These brands occur at least 24% of the time in the top 200 ranks.

    Who Won?

    There are many ways to look at this. To begin with, the combined sales of Flipkart and Amazon during the festive season in India accounted for more than 90% of the e-commerce industry’s gross sales. That amounts to a 55% year-on-year growth. Delving further, we see that Flipkart was far more aggressive with their offerings.

    They discounted 56.8% additional products at an overall discount of 15%. On the other hand, Amazon retained their typical cautious approach to discounting, with only 28.4% of the products, at an overall discount of 12.8%.

    If we adopt a more macro view of the sales, we have to take into account that this year is somewhat of an anomaly. Given the social distancing norms and other SOPs governing the common man, more people have been ushered into the world of online shopping. The penetration extended far into the Tier 2 and Tier 3 cities as well, thus potentially benefiting Flipkart, owing to their interior reach.

    Going by the numbers, Flipkart seems to have taken this round without a doubt. As we observed though, there are many ways to look at this and what seems to stand out from these two giants, is the consumer. At the end of the day, it’s the consumer that in spite of these strange times, has shopped more than before, indicating that the situation is getting back to a semblance of normalcy.

    So Flipkart’s got the sales numbers but the consumer got deeper discounts on more products. As the old adage goes, ‘consumer is king’.

  • Prime Day 2020: Home categories fuel retail rivalry & desirable discounts

    Prime Day 2020: Home categories fuel retail rivalry & desirable discounts

    According to our preliminary analysis of Prime Day 2020, Amazon’s rivals offered more generous discounts within Home categories to stay competitive as more consumers invest in their homes this year.

    This year the COVID-19 pandemic has transformed consumers into homebodies who increasingly work, learn and shop from home. This year also marks the first time Prime Day took place in the Fall, jumpstarting the holiday sales season.

    At DataWeave, we wanted to know whether Prime Day 2020 lived up to the hype and how Amazon’s deals compared to other retailers’ discounts. Our analysis examines products across four popular Home categories: Bed & Bath, Furniture, Kitchen and Pet Care.

    Our Methodology

    We tracked the pricing of several leading retailers (Home Depot, Target, Walmart and Amazon) selling the Home categories of Bed & Bath, Furniture, Kitchen and Pet Care to assess their pricing and assortment strategies during this annual sales event. Our analysis focused on additional discounts offered during the sale to estimate the true value that the sale represented to consumers. Our calculations compared product prices on Prime Day versus the prices prior to the sale. The sample consisted of up to the top 750 ranked products across 16 popular product types for the home.

    The Verdict 

    Overall, Amazon reported the lowest price reduction in all Home categories (12.4%), compared to Target (22.1%), Home Depot (16.5%), and Walmart (15.1%). Yet Amazon reported the second-highest percentage of additionally discounted products (9.6% vs. 11.0% for Target).

    After Prime Day ended, certain retailers’ Home assortments saw more significant price increases than others. For instance, 88% of Target’s 760 products in Bed & Bath, Furniture, Kitchen and Pet Care received a price increase during the post-sale period, compared to 47% of Walmart’s 1005 products. Walmart’s everyday low price strategy helps to explain the difference between the two big box retailers.

    These results suggest that Prime Day 2020 may boost Amazon’s marketing and PR engagement yet its rivals offered the most generous deals in Home categories. As home-related categories’ sales soared during the pandemic, Amazon’s competitors offered deep discounts to stand out online and grow their market share. As such, consumers may want to embrace the habit of comparing multiple retailers’ websites to discover the best Prime Day deals in Home categories.

    Top product types by additional discount

    In Bed & Bath, Target offered the biggest average additional discount (27.4%) and Amazon offered the lowest (13.3%). Bed sheets and pillowcases were a popular product category for additional discounts across all four retailers, with Target offering the best average additional discount at 31.3%. Other popular product types among rival retailers included blankets, comforters and bathroom furniture.


    In Furniture, Home Depot (20.5%) offered the biggest overall additional discount, closely followed by and Target (19.2%). Living room furniture was a popular subcategory for all four retailers, with Home Depot offering the highest additional discount (29.1%). Other popular product types included furniture for the bedroom, home office, kitchen and dining room.

    In the Kitchen category, Target offered the biggest average additional discount for small appliances (21.8%), a subcategory in which all four retailers offered discounts. Within the large appliance subcategory, Walmart’s additional discounts were nearly triple Amazon’s (15.7% vs. 5.6%).

    Within the Pet Care category, Target offered the biggest average additional discount (18.5%). Cat food was a popular product category, with Target offering the best average additional discount (50.0%). Other popular product types across all four retailers included dog collars, leashes and dry dog food.

    Additional discounts across product “premiumness” levels

    Premiumness was calculated as the average selling price before the sale event. This was divided into low, medium and high premiumness levels, with high indicating higher selling prices.

    In Bed & Bath, most retailers showed an inverse relationship between their additional discounts and the products’ level of premiumness. Target offered the biggest additional discounts across all levels of premiumness, more than double Amazon’s discounts (27.2% vs. 12.3%). Target’s bold discounting strategy shows a commitment to protecting its competitive position across the entire Bed & Bath category.

    By far, Amazon offered the greatest percentage of additional discounts in Bed & Bath compared to its rivals across all levels of premiumness. Comparatively pervasive discounts help the e-commerce giant offer a greater variety of appealing deals within this category.

    In Furniture, most retailers showed a direct relationship between their additional discounts and the level of premiumness. Notably, Home Depot offered massive additional discounts at the high premium level, nearly triple Amazon and Walmart (34.5% vs. 12.7%). This move suggests Home Depot is serious about winning the business of upscale consumers in the Furniture category.

    Target differentiated its assortment by discounting by far the greatest portion of its Furniture at all premiumness levels (22.4%) and Home Depot discounted the least (4.4%). Amazon and Walmart distributed the greatest portion of their additional discounts to the moderate level of premiumness. Target’s strategy tries to attract all Furniture shoppers while Amazon and Walmart try to make their mid-market offerings affordable to more consumers.

    Across all levels of premiumness for Kitchen products, Target offered the biggest additional discounts, including almost double Amazon’s discounts at the medium level (22.5% vs. 13.4%). Target’s aggressive discounting shows a desire to be more competitive by attracting consumers at all levels of the Kitchen category.

    In the Kitchen category, most retailers offered a direct relationship between the proportion of additional discounts and the level of premiumness, yet Home Depot showed an inverse relationship. Amazon’s proportion of additional discounts across all levels of premiumness nearly tripled Home Depot’s (10.1% vs. 3.7%). This discount strategy shows Amazon’s willingness to offer shoppers deals across a broader variety of Kitchen items.

    In Pet Care, Walmart offered the highest overall additional discounts (16.2%), which could fortify its low-cost leadership position for pet lovers at all price points.


    While Target offered the greatest overall percentage of additional discounts in Pet Care, Amazon applied more discounts to the higher end of the premium spectrum and Target focused on the lower end.

    Additional discounts across visibility levels

    In Bed & Bath, Target offered the highest overall additional discounts across all levels of visibility (27.3%) and Amazon offered the lowest (12.4%). Amazon focused its additional discounts on the most visible Bed & Bath products to help online shoppers discover those items with ease and make them appealing enough to add to their cart.


    Amazon offered the lowest additional discounts in the Furniture category across all levels of product visibility. Yet, among the Furniture category’s most visible items, Amazon offered its highest additional discounts. Home Depot’s additional discounts approach was the most aggressive except among the lowest product visibility levels. Home Depot’s discount strategy shows a desire to compete for Furniture’s most visible items.

    In the Kitchen category, Home Depot consistently offered the lowest additional discounts among products at the higher visibility levels. Conversely, Target was the most aggressive in this category, offering additional discounts of up to 43.2% at moderate levels of visibility and double Home Depot’s discounts (26.3% vs. 13.4%) among the most visible items. Amazon may feel confident that men already choose Amazon for their apparel needs.

    In Pet Care, the retailers generally offered the most additional discounts for items in the middle of the visibility spectrum. Walmart offered the most aggressive additional discounts among the most visible Pet Care items, more than double Target’s discounts (13.5% vs. 6.5%).

    Overall, Prime Day 2020 offered an ideal time for Amazon to attract homebound consumers to invest in domestic products, yet its rivals offer much higher additional discounts in Bed & Bath, Furniture, Kitchen and Pet Care. How about other categories? Watch this space for more insights!

  • How Prime Day 2020 Deals Influenced Retail Pricing Strategies

    How Prime Day 2020 Deals Influenced Retail Pricing Strategies

    Our preliminary analysis reveals that Prime Day 2020 motivated Amazon’s rivals to offer deeper discounts in key categories to try to make their merchandise more magnetic and lure consumers away from the e-commerce giant.

    This year’s Prime Day is momentous, as the COVID-19 pandemic has encouraged more consumers to make online shopping a more regular habit. It also marks the first time Prime Day took place in the strategically significant final quarter of the year, kicking off the holiday sales season.

    At DataWeave, we wanted to know whether Prime Day 2020 lived up to the hype and how Amazon’s deals compared to other retailers’ discounts. Our analysis examines products across three popular categories: electronics, beauty and fashion.

    Our Methodology

    We tracked the pricing of several leading retailers (Best Buy, Target, Walmart and Amazon) selling consumer electronics, beauty and fashion to assess their pricing and assortment strategies during this annual sales event.

    Our analysis focused on additional discounts offered during the sale to estimate the true value that the sale represented to consumers. Our calculations compared product prices on Prime Day versus the prices prior to the sale. The sample consisted of up to the top 750 ranked products across 21 popular product types in consumer electronics, beauty and fashion.

    The Verdict

    Overall, Amazon reported the lowest price reduction in the Electronics, Beauty and Fashion categories (13.4%), compared to Best Buy (22.5%), Target (21.7%) and Walmart (16.3%). Yet Amazon reported the second-highest percentage of additionally discounted products (12.0% vs. 15.7% for Target).

    After Prime Day ended, certain assortments reflected more significant price increases than others. For instance, 97% of Target’s 158 products in Electronics, Beauty and Fashion had a price increase during the post-sale period, compared to 49% of Walmart’s 986 products. This discrepancy makes sense given Walmart’s everyday low price strategy.


    These results suggest that although Prime Day generates tremendous media buzz for Amazon, the most generous deals come from its rivals. To stand out and lure shoppers away from Amazon, competitors offered comparatively deeper discounts, especially in categories in which they want to grow their market share. This means online shoppers would be wise to compare prices across retailers’ websites to find the best cross-category deals on Prime Day.

    Top product types by additional discount

    In Electronics, Best Buy offered the biggest average additional discount (22.4%) and Amazon offered the lowest (9.4%). Tablets were a popular product category among Amazon, Best Buy and Walmart, with Best Buy offering the best average additional discount at 19.1%. Other popular product types among rival retailers included TVs, desktops and laptops.


    In Beauty, Target (13.2%) and Walmart (13.1%) almost tied for the biggest overall additional discount. Makeup was a popular beauty subcategory, with Walmart offering the highest additional discount at 19.7%. Other popular product types included hair care, skin care and fragrance.

    In Men’s Fashion, Target offered the biggest average additional discount of 28.1%. Suits and blazers were a popular fashion subcategory, in which Target offered the highest average additional discount at 50.0%. Other popular product types included T-shirts and tank tops, shirts and jeans.


    Within the Women’s Fashion category, Walmart offered the biggest average additional discount of 20.5%. Tops and tees were a popular product category across all three fashion rivals, with Walmart offering the best average additional discount at 23.6%. Other popular product types included dresses, jumpsuits and jeans.

    Additional discounts across product “premiumness” levels

    Premiumness was calculated as the average selling price before the sale event. This was divided into low, medium and high premiumness levels, with high indicating higher selling prices.


    In Electronics, Amazon showed a direct relationship between its additional discounts and the level of premiumness; Best Buy and Walmart showed an inverse relationship. Best Buy offered the biggest additional discounts across all levels of premiumness, nearly triple Amazon’s discounts (20.7% vs. 7.0% ) at the low end of the premium spectrum, and more than double Amazon’s discounts (18.5% vs. 7.3%) at the moderate level. Best Buy’s discounting strategy show it’s serious about protecting its competitive position in electronics.

    Best Buy and Walmart offered the most additional discounts at the high end of the premiumness spectrum, making both retailers more competitive in the high-ticket electronics category. By contrast, Amazon offered nearly double the additional discounts of its rivals within the low segment, which helps to protect its margins while making products even more affordable and appealing.


    In Beauty, Amazon and Walmart offered their biggest additional discounts at the low premium level, possibly to position those products as loss leaders. Meanwhile Target nearly doubled and tripled its rivals’ additional discounts at the high premium level (30.0% vs. 16.0% for Walmart and 11.0% for Amazon) to stand out in this intensely competitive category.

    Amazon stood out by discounting the greatest portion of its Beauty offerings at all premiumness levels and Target discounted the least. Amazon and Walmart showed a direct relationship between their distribution of additional discounts and the beauty products’ premiumness level.


    Across all levels of premiumness for Men’s Fashion, Target offered the biggest additional discounts, including more than triple Amazon’s discounts at the high end (38.4% vs. 12.4%). Target’s aggressive discounting shows a desire to be more competitive within the most premium segment of Men’s Fashion.

    Amazon’s additional discounts accounted for the greatest percentage of its Men’s Fashions across all levels of premiumness, nearly triple Target’s overall average (15.4% vs. 5.3%). This approach shows Amazon’s willingness to give shoppers deals across a broader variety of Men’s Fashion items.

    In Women’s Fashion, Target’s and Walmart’s overall additional discounts were comparable, and Amazon’s discounts were consistently the lowest among all levels of premiumness. Walmart offered its most generous discounts at the low and medium level of premiumness, which could reinforce its low-cost leadership image.

    While Amazon and Target offered a comparable overall percentage of additional discounts in Women’s Fashions, Amazon applied more discounts to the higher end of the premium spectrum and Target focused on the lower end.

    Additional discounts across visibility levels

    In Electronics, Amazon offered the lowest average additional discounts across all levels of visibility. Among the most visible electronics, Amazon and Best Buy gave the most visible electronics higher additional discounts to make those items more alluring to help consumers find the items fast and add them to their online baskets.

    Among the Beauty category’s most visible items, Amazon and Target offered their highest additional discounts. Yet Target was most aggressive in beauty, offering a 30% additional discount at the most visible end of the spectrum as well as at the least visible. This discount strategy shows Target wants to compete in Beauty, spreading its generosity beyond an exclusive focus on highly visible items.

    In Men’s Fashion, Amazon consistently offered the lowest additional discounts at all visibility levels. Target was the most aggressive in this category, offering additional discounts of 50% at moderate levels of visibility and 34.5% among the most visible items. Amazon may feel confident that men already choose Amazon for their apparel needs.

    In Women’s Fashion, the retailers generally offered the most additional discounts for items at the higher end of the visibility spectrum. Walmart offered the most aggressive additional discounts among the most visible items in Women’s Fashion to try to boost its market share in this category.

    Overall, while Prime Day is an effective way for Amazon to boost brand engagement, its rivals overwhelmingly offer higher additional discounts in Electronics, Beauty and Fashion. How about other categories like the booming Home space? Watch this space for more insights!

  • Amazon Triples Down on its Private-label Product Portfolio

    Amazon Triples Down on its Private-label Product Portfolio

    Among Amazon’s most prominent and decisive steps in achieving retail dominance over the last few years has been its focus on expanding its private label portfolio.

    The most recent collaborative report between DataWeave and Coresight Research determines that Amazon’s private label assortment in early 2020 has grown three-fold over the previous two years, most of which is in categories outside of apparel and accessories.

    In addition, the report covers various facets of Amazon’s private label penetration and strategy. These include the size of Amazon’s private label portfolio, the distribution of private label products by category, the product ratings and number of reviews, the average price points across products and brands, and more.

    Our detailed and proprietary Amazon private label dataset includes information on over 20,000 products and 111 brands.

    Some of our key findings are:

    • Amazon’s private-label offering spans 22,617 products across 111 identified private labels.
    • Around half of the private-label products are in clothing, footwear and accessories, which is lower than the three-quarters found in our similar research from June 2018, indicating Amazon’s push into a broader range of categories.
    • The average Amazon private-label product generates a customer rating of 4.3 out of 5, representing positive customer feedback overall.

    Amazon’s Private-Label Offering Spans 22,617 Products across 111 Identified Private Labels

    The number of private-label products—22,617—is more than triple the total of 6,825 from June 2018 (see our previous report). The number of private-label brands also increased substantially (up 50% versus June 2018), indicating that the e-commerce giant has stepped up its private-label strategy.

    Around Half of Private-Label Products Are in Clothing, Footwear and Accessories

    Just over half of Amazon’s private-label products are in “clothing, footwear and accessories,” versus almost three-quarters when we undertook similar research in June 2018, indicating Amazon’s push into a broader range of categories. Other categories that feature more than 1,000 private-label products include “home and kitchen,” “grocery and gourmet food” and “tools and home improvement.”

    Source: DataWeave/Coresight

    The Average Amazon Private-Label Product Generates a Customer Rating of 4.3 out of 5

    We examined feedback provided by Amazon’s private-label customers: Customer satisfaction can be measured by the average star rating that customers have left in reviews. We chart both average star rating and average number of customer reviews per product in the graph below.

    The average Amazon private-label product generates a customer rating of 4.3 stars out of 5, suggesting overall solid customer satisfaction levels.

    Source: DataWeave/Coresight

    The full report is available for Coresight’s premium subscribers. It includes further details of categories and subcategories that suggest longer-term implications—including how Amazon targets a niche customer base through specific category labels but appeals to broader consumer needs by offering multicategory labels.

    To access DataWeave’s proprietary database on Amazon’s private label brands and products, reach out to us today!

  • Coronavirus Outbreak: Impact on E-Commerce Retailers and Consumer Brands

    Coronavirus Outbreak: Impact on E-Commerce Retailers and Consumer Brands

    The Coronavirus, otherwise known as COVID-19, has made landfall on U.S. shores. At the time of writing this article, there are over 230 confirmed cases in the country and 12 deaths. The growing unease about the virus, which has quickly accumulated 95,000+ confirmed cases globally, has, among other things, adversely affected businesses and stock markets the world over.

    In the wake of this outbreak, U.S. based retailers and brands would be prudent to brace themselves and plan ahead to minimize disruptions as much as possible.

    Businesses and consumers in China, the global epicenter of the epidemic, have been dealing with these challenges over the last couple of months. It’s likely that some of the trends observed in China would be mimicked in the U.S. as well, something that domestic retailers and brands would do well to study and prepare for.

    The Inadvertent E-commerce Wave

    When the outbreak happened in China, it caused an uptick in e-commerce adoption as shoppers were reluctant to step out of their homes and instead, opted to shop for their goods online.

    Reports indicate that Chinese online retailer JD.com’s online grocery sales grew 215% YoY over a 10-day period between late January and early February. Similarly, Carrefour’s vegetable deliveries grew by 600% YoY during the Lunar New Year period. Online sales of Dettol, a disinfectant produced by Reckitt Benckiser, rose 643% YoY between 10 February and 13 February on China’s Suning.com.

    In Singapore, another region affected by the virus more recently than in China, Lazada’s grocery arm, RedMart, and Supermarket chain, NTUC FairPrice, both reported an unprecedented surge in demand, which tested their delivery capabilities to the limit.

    This bump in online sales isn’t just restricted to grocery, but other categories as well. Jean-Paul Agon, CEO of L’Oréal, recently said that online sales of the brand’s beauty products increased in China in February.

    Given such a consistent shift in shopping behavior across coronavirus-affected regions, it’s logical to expect that a similar trend would be followed in the U.S. – in fact, it might already be underway.

    A recent survey by Coresight Research indicated that 27.5% of U.S. respondents are avoiding public areas at least to some extent, and 58% plan to if the outbreak worsens. Of those who have altered their routines, more than 40% say they are “avoiding or limiting visits to shopping centers/ malls” and more than 30% are avoiding stores in general. The survey also found consumers will likely begin to avoid restaurants, movie theaters, sporting events and other entertainment venues.

    Therefore, it’s essential for U.S. retailers and brands to swiftly energize their e-commerce readiness and be fully prepared to cater to the circumstances-induced shift in shopping behavior, inclined toward online.

    A Logistical Nightmare

    The most obvious area of impact for retailers and brands is in their supply chain and order fulfilment operations.

    A large portion of consumer product manufacturers rely to some extent on China, and the potential impact of the virus on supply chain processes is inescapable. Chinese factories have been operating at partial capacity, impacting supply chains globally. This has largely affected highly popular e-commerce categories like consumer electronics, fashion and furniture.

    Shares in the U.S. of furniture e-commerce retailer, Wayfair, fell as much as 26% toward the end of February, according to a Bloomberg report. The is particularly revealing, as the online retailer reportedly relies on China for half of its merchandise.

    Retailers struggling to cope with this stress in their supply chain systems would do well to warn their customers beforehand about delays in deliveries, like AliExpress has just done.

    For categories like CPG, as consumers increasingly shop online, retailers that offer Buy Online Pick Up In Store (BOPIS), should expect a surge in its adoption, and reinforce their online infrastructure and in-store operations to cater to the rising demand.

    In addition to disruptions in the supply chain, several other mission-critical areas are likely to get affected too.

    Keeping Up With The Online Surge

    As with any event of this magnitude, the business implications reach far and wide. The following are a few areas that we’ve identified as critical, based on our experience working with retailers and brands. Being aware of and focusing on these issues are likely to alleviate some of the issues faced by consumers today.

    Fair pricing: There have been several reports of price gouging on e-commerce platforms. Examples include 2-ounce Purell bottles being sold for $400 and face masks for up to $20. While these prices have mostly been set by third party merchants, brands are likely to face the flak from consumers. A recent Bloomberg article reported that online retailers still rely partly on employees to manually monitor these items. This approach has obvious limitations, such as products quickly reappearing on the website after being de-listed. Brands and e-commerce platforms will need to explore automated ways of controlling their online pricing practices at large scale.

    3P merchant and counterfeit management: Often, unauthorized third-party merchants selling an original manufacturer’s goods are the ones who unreasonably inflate prices. These merchants tend to test the markets on online marketplaces with their pricing, which adversely affects the brand image of the manufacturer. Further still, they sometimes list counterfeit or fake goods that make incorrect or extravagant claims. Brands will need to swiftly identify and de-list these merchants from online marketplaces.

    Ensuring stock availability: During times like these, it’s a common sight to see empty aisles at supermarkets selling items like canned food, water, paper products and personal care products. Consumers will benefit from brands monitoring their stock availability at stores, which will help them better align their supply chain operations to the rapidly changing demand patterns across the U.S. map. This way, efforts can be more targeted at regions with severe shortages.

    Content compliance: Helium 10, a technology provider for Amazon sellers, reported that since 26 February, 90% of searches on Amazon are coronavirus related, and searches for hand sanitizers spiked to 1.5 million searches in February compared to 90,000 in November. As a result, to arrest exploitative practices, some online marketplaces have announced policy guidelines on product content claiming health benefits. Words like ‘Coronavirus‘, ‘COVID-19‘, ‘Virus‘ and ‘epidemic’ are, in fact, prohibited.  Amazon has already de-listed several merchants claiming fraudulent cures. Ebay has gone as far as to ban all new listings for face masks, hand sanitizers, and disinfecting wipes, due to regulatory restrictions. In this context, retailers and brands will benefit from deploying tracking mechanisms that quickly identify offenders.

    The areas of business presented above are by no means a comprehensive list for retailers and brands to rely on during this time. Still, these are critical impact areas for them to address, even as huge efforts are made toward managing highly stressed supply chains.

    DataWeave Offers Support

    The coronavirus outbreak is likely to get worse before it gets better. As we enter unchartered territories, DataWeave is offering to contribute in small ways, pro bono, by leveraging our expert talent and competitive intelligence technology platform, to address some of the challenges faced by retailers and brands.

    We’re announcing a limited-time, no-cost offer to detect and report on price gouging, the presence of unauthorized third-party merchants, as well as stock availability across U.S. ZIP-codes. This offer will be valid for 4-6 weeks (timeline will be flexible based on how the outbreak develops) and limited to monitoring the top 10 U.S. online marketplaces, as well as critical product categories such as medicinal and hygiene-related products, emergency food items, survival-related products, fuel, etc.

    Reach out to us for further details.

  • Black Friday 2019 Pricing for Online Furniture

    Black Friday 2019 Pricing for Online Furniture

    For today’s shoppers, instant gratification is the need of the hour. It’s, therefore, no surprise that furniture e-retail has been picking up steam over the last decade. What was once a norm to physically touch and feel before making a purchase, is now just a few clicks away. Retailers have bridged the gap by making the purchase process as seamless as possible – easy finance options, hassle-free returns and variety.

    While several factors play a role in driving consumers to shop furniture goods online, price is the primary motivator, as is the case with most popular product categories sold online.

    During Black Friday 2019, DataWeave performed an analysis on a sample of 23,000+ products across six of the top furniture retailers – Amazon, Home Depot, JCPenney, Target, Walmart and Wayfair. Ten product types were covered in the furniture category (such as Beds, Bookcases, Mattresses, Sofas, etc.) and the analysis focused on the top 500 ranked products of each product type.

    To get an accurate depiction of the additional markdowns during the sale, we took the mode of the prices for the preceding week and compared them with that during the sale.

    Additional markdowns

    Target (25%) and Home Depot (21%) marked down their prices most aggressively during the sale.  JCPenney and Wayfair stood out for offering additional markdowns on the highest portions of their ranges (67% and 46% respectively), even though the average markdown percentage was fairly conservative. Amazon and Walmart were steady as usual, with additional markdowns of 8% and 10% on 15% and 17% of their assortment, respectively.

    Premiumness

    To further understand the furniture pricing strategies of these retailers, we categorized their products into buckets of how expensive or cheap the product is (High, Medium, and Low in terms of price), relative to the rest of the products hosted by the retailer, and studied how the additional markdowns varied across these buckets. Where the MRP was not displayed, the most expensive price of the product during the holiday period prior to Black Friday was considered to define the “premiumness” of the product.

    Two patterns clearly stand out from this analysis. Most of the retailers remained relatively equitable between their premium categories with nothing significant to report in terms of varying markdowns. Home Depot and and JCPenney are the only exceptions here, but not by much.  The other interesting insight is that the percentage of marked-down products had a near unanimous pattern of the high level being the most covered, followed by the medium and then low.

    Therefore, while there wasn’t a significant variation in the average markdown across premiumness levels, a larger portion of the high-premium goods were consistently offered at a discount across all retailers.

    Popularity

    Much like our premiumness categorization, we investigated products based on their popularity levels as well. We’ve defined popularity using a combination of the average review rating and the number of reviews for each product, condensed to a scale of low, medium and high.

    We observe slightly different furniture pricing strategies adopted by retailers across popularity levels. While Home Depot, Amazon, and Wayfair chose to provide higher markdowns on their more popular products, Target, JCPenney, Walmart chose to provide higher markdowns on their least popular products. In addition, a larger portion of the least popular products were consistently offered on discount by almost all retailers.

    In combination with our findings across premiumness levels, we can surmise that part of the strategy of most retailers was to liquidate their stock of expensive and unpopular products during the sale.

    Price Change Activity

    As part of our analysis, we also tracked the level of pricing activity across retailers over the last week of November, in terms of the number of price changes made as well as the average price variation for each retailer.

    In general, we can see that Amazon and Walmart  consistently made several price changes through the week, though the average magnitudes of these price changes were relatively low. This echoes the pattern we’ve observed through our analysis of other product categories during the sale event, as well.

    Also, we see an almost coordinated increase in the number of price changes and the average magnitude across the 27th and 28th of November. This is likely an attempt by the retailers to get a head start on Black Friday deals.

    An unusual and interesting pattern was observed with Wayfair, which started out the week with the most changes at 2500. It then tanked the next day and hovered around 500 till the 28th, only to spike to 2500 again. All these changes though, had their variation in and around 5%.

    In summary, its interesting to observe how different retailers approached the much-anticipated holiday season sale events differently. As one might expect, there are significant variations among retailers in the aggressiveness of discounting activity as they approached Black Friday, and on Black Friday itself. Contrasting pricing strategies for popular and premium goods were also observed.

    If you would like to learn more about the pricing of top U.S. retailers across other product categories like consumer electronics, fashion, and beauty & health, check out our series of articles on Black Friday 2019.

  • Health & Beauty on Black Friday: Analyzing Pricing Strategies of Top U.S. Retailers

    Health & Beauty on Black Friday: Analyzing Pricing Strategies of Top U.S. Retailers

    We’ve come a long way from face paint and medicinal herbs to multi-billion dollar industries revolving around health and beauty. Customers are getting increasingly bombarded with variety that promises something for everyone. In fact, a recent DataWeave study identified Health & Beauty as one of the most popular CPG categories in the U.S., both in terms of assortment strength and brand concentration. As with most other categories, pricing activity around Health & Beauty is especially abuzz when Thanksgiving weekend comes around.

    As part of our series of articles analyzing the pricing of leading retailers across categories on Black Friday, the DataWeave team performed an analysis on a sample of 14,000+ products across six top retailers – Amazon, JC Penney, Macy’s, Nordstrom, Target and Walmart. Seven product types were covered across the category, such as Fragrance, Hair Care, Makeup, etc. and the analysis focused on the top 500 ranked products of each product type.

    Additional markdowns

    For this analysis, we considered the mode of the prices for the week before and compared it with that during the sale. This painted a picture of the additional markdowns for the duration of the sale.

    Similar to our prior coverage of the Fashion category during Black Friday, Macy’s had the broadest reach in terms of the marked down products at 25.6%. The average percentage of the markdowns was 22% and was only eclipsed by JC Penney with an average of 34.7%, though this was only offered on 3% of its range. At the other end of the spectrum, Amazon and Walmart had the lowest markdowns at 8.9% and 8.4% respectively but were among the top three in products covered (18% & 12%). Target and Nordstrom offered mid-range markdowns across the board but on a rather conservative selection of products of 5% and 3%, respectively.

    Additional markdowns by product types

    When we delved further into the product types, we noticed that a majority of the retailers heavily marked down makeup, shampoo & conditioner and men’s hair care products. The table illustrates the top three discounted categories for each retailer we analyzed.

    Premiumness

    We categorized the products across retailers into buckets of how expensive or cheap a product is, relative to the rest of the products hosted by the retailer in the respective product type. Where the MRP was not displayed, the most expensive price of the product during the holiday period prior to Black Friday was considered for this categorization. We then tagged products as High, Medium and Low in terms of product premiumness, with High referring to the more expensive products.

    In line with previous trends, Macy’s had the highest markdown on its high level products at 32.8%. It also had the widest coverage for the category at 20%. Amazon, Macy’s, Target, Walmart followed the expected approach of providing higher markdowns on the more premium products, and also on a higher portion of these products. This would be consistent with their goal of providing attractive offers on premium goods while also protecting their margins.

    JC Penney and Nordstrom were exceptions here, with JC Penney providing higher markdowns on its cheaper goods, while Nordstrom focused its markdowns on the medium bucket.  That being said, it should be reiterated that the portion of products with markdowns for both thee retailers was relatively small.

    Popularity

    Similar to categorizing the products at levels of product premiumness, we categorized them into levels of popularity as well. Here, popularity is defined using a combination of the average review rating and number of reviews obtained for each product.

    Interestingly, no consistent pattern has emerged that indicates a strategic focus on factoring product popularity into their pricing strategies for Black Friday.

    Macy’s, JC Penney, and Nordstrom chose to provide higher markdowns on their highly popular products, of which only JC Penney and Macy’s chose to also markdown a higher portion of their highly popular products. It was just as common though to see retailers (including Amazon) marking down the prices of their least popular products. This is likely an attempt by the retailers to liquidate their excessive stock of less popular products during the sale.

    Price Change Activity

    As documented quite often in recent years, the Black Friday sale is no longer limited only to a single day, but attractive offers are often seen right through November, especially over the last week of the month. We tracked the level of pricing activity across retailers over the last week of November, in terms of number of price changes as well as the average price variation for each retailer.


    In typical fashion, we observed that Amazon had the most number of pricing changes by a large margin, peaking at 2500 for the set of products tracked. The next in line was Walmart a long way down at 618 changes on the 27th. Even after the multiple changes, their average price change variation remained at the lower end of the scale – in and around 10%.

    The rest of the retailers exercised fewer price changes, with the slight exception of Macy’s in the days leading up to Black Friday. However, the changes almost ceased from the day before only to marginally rise on the 29th.

    While all the retailers tended to follow a predictable pattern of decreasing variation on the 28th and sharply increasing it the next day, Nordstrom and Walmart did the exact opposite, having likely chosen to jump the gun in offering discounts during Black Friday.

    Conclusion

    To conclude, we deduced that Macy’s had relatively higher markdowns on more of its products than the rest. JC Penney, Nordstrom and Target offered high markdowns on the face of it but on a very small section of products. Unsurprisingly, Amazon and Walmart stayed true to their past patterns and remained conservative in their additional markdowns during the sale but generous in their reach.

    Have a look here at our other observations regarding the Black Friday sale and stay tuned for more insights from our analysis of other product categories!

  • Fashion on Black Friday: Decoding Pricing Strategies of Top U.S. Retailers

    Fashion on Black Friday: Decoding Pricing Strategies of Top U.S. Retailers

    Over the last few Thanksgiving Weekend sales, fashion, what was a category once typically reserved for offline purchases, has evolved into a regularly marked down and popular category as shoppers get more comfortable making these purchases online. This can be credited to the ease of purchase that retailers offer – trials, returns, etc. combined with the desire for shoppers to refresh their wardrobe for the new year ahead.

    At DataWeave, we performed an analysis on a sample of 40,000+ products across six of the top fashion retailers – Amazon, Bloomingdale’s, Macy’s, Nordstrom, Target and Walmart. . Twenty product types were covered across both men’s and women’s fashion and the analysis focused on the top 500 ranked products of each product type.

    Additional Markdowns

    For the sake of this analysis, we compared the prices during the sale with the mode of the prices the week before. This gave us a clear picture of the additional markdowns during the sale period and therefore, the additional value to shoppers.

    Dominating the fashion space, Nordstrom and Macy’s came in hot with the most aggressive discounts on the largest share of their product range, 36% and 27% respectively, on more than a quarter of their range. In the women’s lineup, Target offered a 36% markdown, compared to ~22% for its men’s lineup. Across both categories though, this was only on 1% of Target’s range. In what seems to be an expected trend, Amazon and Walmart remained relatively conservative with their additional markdowns, as they tend to be competitively priced even during non-sale periods.

    Drilling down into the product types, we noticed that very aggressive markdowns were being offered on t-shirts and skirts (over 40%). Swimwear, hosiery, handbags, and sunglasses were other product types that were featured with attractive prices across websites.

    Product Premiumness

    We categorized the products across retailers into buckets of how expensive or cheap the product is, relative to the rest of the products hosted by the retailer. Where the MRP was not displayed, the most expensive price of the product during the holiday period prior to Black Friday was considered. We then bucketed products in categories of High, Medium and Low of product premiumness, with High containing the more expensive products by price.

    Amazon, Bloomingdale’s, Macy’s and Nordstrom chose to markdown the more expensive products in their range higher than the rest of their assortment. This aligns well with what one would expect retailers to do as shoppers tend to expect attractive offers on the more expensive range of products. Also, with the more expensive products, retailers and brands likely have more room to be flexible with margins. Amazon shows a consistent strategy here, having provided higher markdowns on a relatively higher portion of its most premium products and vice versa. This trend can only otherwise partially be seen with Macy’s.

    Walmart though, chose to go the other route and provided higher markdowns on its least premium products. This might have been a targeted effort to maintain their perception among shoppers as a destination for affordable goods. Though it’s important to note here that these markdowns were seen only on a small set of cheap goods – just over 5%.

    Price Change Activity

    Walmart, Nordstrom and to an extent, Bloomingdale’s, had an almost consistent number of price changes throughout the week. Nordstrom recorded the most significant dip in the magnitude of the markdowns over time.

    Amazon and to a smaller degree, Macy’s, had more price changes during the week. However, Amazon’s average price variation remained among the lowest whereas Macy’s clocked in the highest by Black Friday at just under 40%.

    Across the board, the price changes dipped on the 28th and then rose again on the 29th. This can be seen as a conscious effort to have more aggressive activity on Black Friday.

    In summary, fashion-first retailers like Macy’s and Bloomingdale’s went all-in during the sale, while Nordstrom, a multi-category retailer, stood out for its aggressive focus on fashion.

    Amazon and Walmart continued to operate within the competitive space that they’ve carved out for themselves as the leading retailers in the US. We observed a similar trend even in the other product categories we’ve analyzed for the sale. Check out our analysis of the Electronics category during Black Friday here.

  • Black Friday Sale: Breaking Down Pricing Strategies in Consumer Electronics

    Black Friday Sale: Breaking Down Pricing Strategies in Consumer Electronics

    Online holiday shopping (Nov-Dec) in the US for 2019 is projected to be $143.7B, a 14.1% increase from 2018. This sets a rather exciting stage for retail giants in the battle to claim market share. Interesting patterns emerge as each one tries to out-smart the other. Black Friday, in particular, is when most of the activity was expected to be concentrated.

    Inevitably, consumer electronics had strong representation, according to research by Coresight. As traffic steers more towards online shopping, there’s an increased sense of comfort in purchasing big ticket items on an ecommerce platform. There are multiple reasons why electronics lead the race during the holiday season – easy to gift, personal indulgence, comparatively shorter shelf life and well, because who among us can really resist a gadget on sale.

    In line with expectations during the season, there’s been a slew of generous discounts across the board. According to prior trends, Amazon was on course to be the lowest priced. In order to assess this, we decided to study a sample of 1000 products on Amazon and match them against its competitors like Walmart, Target, Best Buy and New Egg. Doing this gave us an accurate picture of the comparative pricing across retailers during this season, right up to Black Friday.

    Competitive Pricing Analysis

    There is a commonly held assumption that Amazon is the lowest priced retailer in most cases. How true is that? Here are our findings:

    We tracked the split across three scenarios during the holiday period – Amazon being exclusively the lowest priced, Amazon sharing the lowest priced spot and Amazon not being the lowest priced.

    Clearly, Amazon monopolized the share of lowest priced products during the entire period – with its share of lowest priced products ranging between 86% and 60%. The dip from 86% to 60% was immediate on the 27th, as Amazon’s competitors caught up. In general, Amazon’s share of lowest priced products fell from 76% to 62% on Black Friday, as its competitors launched their most aggressive promotional campaigns for the holiday season. As shown in the next chart below, a large portion of this can be attributed to Target’s pricing activity.

    Relative Price Index

    From 21 November until Black Friday, we calculated the price index across retailers, which indicates the relative pricing levels each day for the set of matched products – the lower the price index, the lower the average relative price.

    Unsurprisingly, Amazon has been consistently the lowest priced by a fair margin. A few rungs down, New Egg and Fry’s have been going head-to-head with their price positions. Target on the other hand, underwent a spike in relative pricing from 26-28 November. To sum up, in order of lowest pricing, it’s Amazon, Best Buy, Walmart, New Egg, Fry’s and Target.

    Additional Markdowns

    While the insights above were unearthed by comparing the products of retailers against a sample of 1000 Amazon products, we went further and performed a separate analysis on a different sample of 15,000+ products across retailers, which focussed on the top 500 ranked products of each product type for Amazon, Best Buy, Target and Walmart. The product types considered include Digital Cameras, DSLRs, Headphones, Laptops, Mobile Phones, Refrigerators, Tablets, Televisions, USB Flash Drives and Wearables.

    Here, we compared the prices during the sale with the mode of the prices of the same retailer the week before. This put into perspective the level of additional markdowns during the sale period, enabling us to better understand the additional value to shoppers during the sale period (since discounts are often offered during non-sale periods too).

    Looking at opposite ends of the spectrum, we find Amazon with the least drastic markdowns during the sale as it tends to consistently have lower prices across the board. At the other end, there’s Best Buy and Target with the most aggressive markdowns; Target taking the lead, 25.5% on 35% of its products, which is also consistent with the activity we observed in the previous sample of matched products.

    Going further, we’ve broken down the markdown activity by the top product types for each retailer. Across the board, we observe attractive discounts on Headphones, USB Flash Drives and Mobile Phones.

    Price Change Activity

    With the proliferation of pricing intelligence tools (often driven by algorithms), dynamic pricing is a commonly observed behavior among retailers. We analyzed this trend during the holiday period to identify the retailers that are most aggressive in their price change activity. The following charts reveal the number of price changes performed by retailers in our sample as well as the average price variation during this holiday period.

    Amazon made several price changes during the week but with a relatively low magnitude, since it was the lowest priced anyway through the week. The only other player with similar activity was Walmart. Target and Best Buy had significantly fewer price changes but when they did make the changes, the magnitude was much larger. Their focus was solely on a smaller, select set of products where they went all in.

    In conclusion

    As the years advance, the duration of holiday sales is no longer restricted to the actual holiday, but the days preceding and following them as well. With more and more people getting increasingly comfortable with online shopping (14.1% increase from 2018), buying habits are evolving too. Big retailers are cashing in on this and driving their pricing strategies to keep up with the evolution.

    One of the clear cut findings from our research is that there are two primary paths they take: smaller additional markdowns over a longer period and larger additional markdowns over a shorter period. Whichever path they choose, retailers need to be on top of the game with valuable insights, that give them a competitive edge. For accurate and large scale competitive intelligence, reach out to us.

  • Amazon on course for an aggressive Black Friday

    Amazon on course for an aggressive Black Friday

    The holidays are around the corner and that much awaited holiday cheer, has now become directly proportional to the arrival of an Amazon package. According to a new report, in partnership with Bain & Company, DataWeave has observed that early in November, Amazon had the lowest price 30%-50% of the time and matched the lowest price 35%-60% of the remaining cases, based on an analysis performed on a sample of over 16,000 products across 10 websites and 5 product categories.

    Aggressive pricing strategies have been Amazon’s modus operandi for a while now and it’s not about to change this season. In the build up to the Black Friday promotions this year, they even slashed their prices of the rarely discounted Apple products, such as the iPad Pro. This sets the tone for what shoppers can expect as the holiday season comes upon us.

    Results of a recent survey, published as part of the Bain report, revealed that ‘value for money’ was the primary concern that influence purchasing decisions, across categories. In the same breath, the respondents went on to say that they perceive Amazon as a ‘value leader’, sans womens’ clothing and pet supplies.

    Although this season might continue to see Amazon rake in the most market share, competitors are not far behind. There’s heavy investment from the likes of Walmart and others in order to negate the effects of the undercut. If these competitive responses become louder, the dent on customer perception could begin to tilt to more neutral ground.

    Stay tuned as we follow this pattern during the season and release our findings over the next few weeks.

    For access to the full article that was published in the Retail Holiday Newsletter by Bain & Company and powered by DataWeave, click here.

  • Prime Day 2019 Fashion: Were the Deals as Attractive as the Merchandise?

    Prime Day 2019 Fashion: Were the Deals as Attractive as the Merchandise?

    Target and Walmart offered more appealing discounts than Amazon during Prime Day 2019.

    Statista estimates that e-commerce fashion accounted for approximately 20.4% of overall fashion retail sales in the United States in 2018, which amounted to about $103 billion in absolute terms. According to Internet Retailer, apparel is the largest and among the most competitive retail categories in e-commerce. Moreover, as a share of total apparel and accessories sales, online apparel sales is growing at a faster rate than US e-commerce as a whole.

    Given the high-growth and competitive nature of the category, we at DataWeave were interested to find out how high the stakes got during the fifth annual Prime Day earlier this month.

    Our Methodology

    Since Prime Day is no longer necessarily an Amazon event (since competing websites often offer attractive discounts as well), we tracked the pricing of several leading retailers selling fashion apparel, footwear, and accessories to assess their pricing and product strategies during the sale event. Our analysis was focused on additional discounts offered during the sale to estimate the true value that the sale represented to its customers. We calculated this by comparing product prices on Prime Day versus the same prices prior to the sale.

    Our sample consisted of 20 product types across women’s as well as men’s fashion categories. While we did monitor exclusive fashion retailers Macy’s, Bloomingdales, Nordstrom, and Neiman Marcus, we did not find them offering any additional discounts – an interesting insight all on its own since they’ve clearly chosen not to compete with Amazon during the two days of the Prime Day sale. We therefore restricted the rest of our study to Amazon, Target, and Walmart – the latter two of which interestingly offered immensely aggressive discounts in their apparel categories.

    The Verdict

    Despite owning the day at least in name, Amazon was found to offer the lowest additional discounts among the retailers studied. Target and Walmart, on the other hand, ensured that they didn’t lose out on market share this Prime Day by offering substantially high discounts of their own. While Target was the most aggressive with a steep average markdown of 26.5%, Amazon closed out the bottom at 8.4%.

    Walmart and Target didn’t seem particularly focused on compensating their sharp discounts with price increases in other products – their focus seems to have been solely only on offering timely discounts during the sale. Amazon, on the other hand, marked up just about as many products as it marked down, with the markup margin being close to double that of the markdown in an effort to protect margins during the sale.

    Top product types by additional discount

    Target and Walmart both offered aggressive discounts across their top product categories. Walmart ended up with a marginally higher overall average additional discounts on product types like Shirts, T-shirts, and Tops.

    Interestingly, though Amazon offered moderate discounts across its top categories (Lingerie, Swimwear, and Underwear), the volume of marked down products was very limited.

    Additional discounts across popularity levels

    We determined popularity using a combination of average review rating and number of reviews, and the resulting scores were categorized as low, moderate, and high.

    When it came to discounting popular products, there were clear differences in strategy among all the three retailers. Amazon, which interestingly had close to 60% of its products in the low popularity bucket, chose to offer the highest discounts in the same category – indicating an effort to clear its stock of unpopular products. Target and Walmart, on the other hand, focused their discounts on moderate rated products.

    Additional discounts across product “premiumness” levels

    Premiumness was calculated as the average selling price before the sale event. This was divided into four percentile blocks, with higher percentile blocks indicating higher selling prices.

    As found in the electronics and furniture categories that were analyzed previously, most of the discounting activity was focused on the lower end of the premium spectrum with a view to protect margin – despite a largely equitable distribution of discounted products across percentile ranges (with the exception of Target, which had a discounted assortment heavily dominated by its least premium products).

    This indicates a clear strategy to protect margins, while still maintaining the perception of promoting attractive offers to draw traffic. Target and Walmart both offered substantial additional discounts of close to 30% on their least premium products, while at 12%, Amazon offered less than half that discount.

    Additional discounts across visibility levels

    Given the fairly large number of SKUs across the fashion category in general, the discounts across visibility levels understandably didn’t vary much when compared to the more pronounced fluctuations observed in the electronics and furniture categories. This is also largely because consumers tend to explore lower ranked products more so in the fashion category than in other categories.

    Across product categories, we’re seeing lower-than-expected additional discounts on Amazon this Prime Day, coupled with more aggressive pricing activity by Amazon’s competitors. While this puts more pressure on Amazon, this also is a strong validation of Prime Day as a key annual sale event on the US shopper’s calendar.

    Curious to know how Amazon and its competitors performed in other product categories this Prime Day? Watch this space for more!

  • Online Furniture Pricing Strategies on 2019 Prime Day

    Online Furniture Pricing Strategies on 2019 Prime Day

    Just as with electronics, other retailers actually offered far better discounts than Amazon during Prime Day 2019.

    Online furniture sales have risen significantly since the 2000s, driven largely by a growing array of products, and even more so by the convenience of avoiding travel and crowded stores. According to Statista, online furniture and homeware sales were estimated to reach approximately $190 billion in 2018, with China and the United States accounting for over $60 billion in revenue each.

    Thus, furniture has quickly become a key product category during sale events globally – and Prime Day was no different. At DataWeave, we got down to figuring out exactly how plum those deals were this year.

    Our Methodology

    We tracked the pricing of several leading retailers selling home and furniture products to assess their pricing and product strategies during the sale events. Our analysis was focused on additional discounts offered during the sale to estimate the true value that the sale represented to its customers. We calculated this by comparing product prices on Prime Day versus the same prices prior to the sale. Our sample consisted of the top 1,000 ranked products across 10 popular product types, including beds, dining table sets, sofas, entertainment units, and coffee tables – analyzed for five retailers (Amazon, Home Depot, Target, Walmart, and Wayfair).

    The Verdict

    As we found in the electronics category, there were surprising price spikes in this category too – with Target reporting an average increase as high as 14.7%, and Amazon clocking a still moderately high 9.4%. Target also reported the highest distribution of products with price markups. Home Depot indicated the lowest price increase at 4.6%.

    When it came to additional discounts, Amazon fell short of expectations – at 4.7%, it offered the lowest average among its competitors. Target, on the other hand, was extremely aggressive both in terms of additional discounts and volume of discounted products.

    To conclude, all the retailers observed seemed to be keeping a close watch on their margins by countering price reductions with nearly equivalent surges elsewhere in their assortment.

    While there was no single product type that was found to be popular across all five retailers, it was clear that Target was again the most aggressive at offering discounts. It also had among the largest product ranges on discount.

    Amazon chose to follow a very moderate route both in terms of average discount and discounted product volume.

    Additional discounts across popularity levels

    We determined popularity using a combination of average review rating and number of reviews, and the resulting scores were categorized as low, moderate, and high.

    There doesn’t seem to have been much of a focus on low-popularity products in terms of additional discounts. Most of the attention was focused on products with moderate popularity, since there isn’t much of a need to be aggressive on price for highly popular products, and products with lower popularity aren’t really worth promoting.

    The only retailer that offered a higher discount on its most popular products was Home Depot. Walmart, too, seemed reluctant to let go of the opportunity to capitalize on popularity – it chose to offer the same discount on moderately as well as highly popular products.

    Interestingly, Walmart seems to have a disproportionately large share of products in its low popularity category – something it should possibly evaluate in the future in terms of brand quality, products, and service.

    The percentage distribution of products mostly indicated a linear relationship, with the highest distribution usually being offered for highly popular products. The exception was Wayfair, which offered a much larger array in its moderately popular category.

    Additional discounts across product “premiumness” levels

    Premiumness was calculated as the average selling price before the sale event. This was divided into four percentile blocks, with higher percentile blocks indicating higher selling prices.

    Most of the discounting activity seems to have occurred in the lower end of the premium spectrum, with a view to protect margin – despite a largely healthy distribution of products across percentile ranges. This indicates a clear strategy to protect margins, while also promoting attractive offers to draw traffic.

    However, there are a couple of exceptions – Target was consistent throughout the “premiumness” spectrum, resulting in the highest overall discounting activity. Home Depot too was aggressive, but selectively so – it chose attractive pricing for the lower and higher ends of its assortment.

    As expected, many retailers showed higher discounting activity in the higher ranks of their listing pages. As usual, though, there are a few exceptions here too. Home Depot and Wayfair indicated unusual patterns – perhaps relying on search results as opposed to organic listing page results. On the other hand, Target again indicated a consistent pattern, with mostly similar discounts across visibility levels.

    Overall, across all parameters analyzed, both the Electronics and Furniture categories have been treated quite similarly in terms of pricing activity by most retailers. Is Prime Day really all about its marketing hype, or will it live up to its promise in at least one segment? Stay with us to find out as we follow through with our series of articles analyzing various product categories on this year’s Prime Day.

  • A Study of Deals on Amazon Prime Day 2019 | DataWeave

    A Study of Deals on Amazon Prime Day 2019 | DataWeave

    Our preliminary analysis reveals that Prime Day 2019 had other retailers offering better deals than Amazon in many cases.

    As Prime Day extended into an additional day this year, Amazon seems to be hitting the right note with its customers, going by the revenue it’s raking in. This year, the longest Prime Day event ever witnessed a sales increase of 72%overtaking Black Friday and Cyber Monday combined.

    At DataWeave, we were curious to find out how prime these deals were, and if in fact other retailers were offering better discounts. We started with the electronics category, which remains among the most popular categories year on year.

    Our Methodology

    We tracked the pricing of several leading retailers selling consumer electronics to assess their pricing and product strategies during the sale event. Our analysis was focused on additional discounts offered during the sale to estimate the true value that the sale represented to its customers. We calculated this by comparing product prices on Prime Day versus the prices prior to the sale. Our sample consisted of up to the top 1,000 ranked products across 10 popular product types in consumer electronics on Amazon, Best Buy, Target, and Walmart.

    The Verdict


    What we found most surprising was that across retailers, some portions of the assortment underwent price increases as well. While Amazon indicated the lowest increase at 9.1%, Best Buy indicated an increase as high as 27.1%. However, Amazon reported the highest percentage of products (6.9%) that showed a price increase.

    Equally surprising was that Amazon reported the lowest price reduction at 6.3% – Walmart, Target, and Best Buy in fact reduced their prices by much larger margins than Amazon did. A point to note here, however, is that Amazon did report the highest percentage of additionally discounted products – with Best Buy coming in at a close second.

    This goes to show that Prime Day, for all its hype, does not in truth offer the best deals to Amazon shoppers. This, of course, is expected based on the competitors’ perspective of wanting to avoid losing market share. As a result, shoppers would be well advised to compare prices across websites to find the best deal.

    Top product types by additional discount


    USB flash drives were a popular product category across all four retailers analyzed, with Best Buy offering the best average additional discount at 40.7%. Other popular product types ranged from the usual personal devices such as mobile phones, tablets, and smartwatches to home appliances such as refrigerators and TVs.

    Additional discounts across popularity levels

    We determined popularity using a combination of average review rating and number of reviews, and the resulting scores were categorized as low, moderate, and high.

    Interestingly, discounts were not found to be directly proportional to popularity. Except Walmart, all the retailers tended to offer the best discounts on products that enjoyed moderate popularity. This makes sense, since there isn’t a strong need to be aggressive on price for highly popular products in any case. On the other hand, products with lower popularity aren’t really worth promoting. Walmart, which was the exception, reported a higher discount on low- and high-popularity products than it did on moderately popular products.

    The percentage distribution of products did mostly show a directly proportional relationship, with the highest distribution usually being offered for highly popular products. The exception in this case was Best Buy, which evidenced a much higher distribution in its moderately popular goods.

    Additional discounts across product “premiumness” levels

    Premiumness was calculated as the average selling price before the sale event. This was divided into four percentile blocks, with higher percentile blocks indicating higher selling prices.

    In general, all retailers were found to have slightly higher additional discounts in the lower end of the “premiumness” spectrum. This is still a smart move, as it enables sellers to save on margin while still promoting attractive discount percentages. Interestingly, Amazon offered the lowest additional discount – a flat 5% – across all categories, despite offering more or less competitive product distributions compared to other retailers.

    Additional discounts across visibility levels

    Here, too, the lower end of the spectrum mostly witnessed higher additional discounts. This tactic actually offers double benefits – one, the most attractive discounts are offered in the higher realms of visibility, thus effectively enticing consumers to buy these products, and two, it helps build a low price perception (despite this not holding good as one delves deeper into the higher ranks). Again, it’s interesting to note that Amazon didn’t offer the highest discounts here either – in fact, it mostly offered the lowest additional discounts.

    All in all, it seems that Prime Day isn’t all it’s hyped up to be, at least not in the Electronics segment. How about other categories? Watch this space for more insights!

  • Thanksgiving Weekend Sale: How Top US Consumer Brands Fared

    Thanksgiving Weekend Sale: How Top US Consumer Brands Fared

    Online retailers in the US have enjoyed an impressive turnover during 2018’s Thanksgiving weekend sale. Over the last few weeks, DataWeave has published deep-dive reports on the performance of top US retailers in fashion and consumer electronics during this period, detailing their discounting and product strategies across several product types.

    In continuation of our series of articles on the Thanksgiving weekend sale, this article focuses specifically on the top brands across all retailers analyzed.

    Read Also:

    A Study of Fashion Retail Pricing Across Thanksgiving, Black Friday and Cyber Monday 2018

    How Consumer Electronics Was Priced Across Thanksgiving, Black Friday and Cyber Monday 2018

    While a lot of attention from the media and analysts during these sale events is often focused on the strategies and performance of retailers, the festive sale period is equally vital for consumer brands. Both established brands and new entrants across all categories compete aggressively to gain market share during a period that accounts for a substantial portion of annual sales turnover.

    For brands, the two primary drivers of conversion specific to sale events are competitive pricing and prominent brand visibility. At DataWeave, we went about analyzing which brands came out on top across retailers and categories during the Thanksgiving weekend sale, based on these two factors.

    Our Methodology

    We tracked the pricing of 6 leading fashion retailers and 5 major consumer electronics retailers to study the pricing strategies of brands during the sale events. Our analysis focused on additional discounts offered during the sale period to evaluate the true value of the sale event to customers. To calculate this effect, we compared the pricing of products on Thanksgiving Day, Black Friday and Cyber Monday to the pricing of products prior to the sale commencing. We considered the Top 500 ranked products on 11 product types across Men’s and Women’s Fashion and 11 popular consumer electronics products for this analysis.

    Consumer Electronics Brands

    In digital cameras, Canon’s traditional role as a discount leader was on show, featuring on both Best Buy (14%) and Target (20%), the two most aggressive price discounters in consumer electronics. Nikon took Canon’s place in DSLR cameras, for Best Buy (13%), New Egg (10%) and Walmart (4%), albeit at a comparatively low additional discount point.

    Razor benefited from Amazon’s strategy of promoting its lower-priced products, promoting a modest 9% additional discount but across its entire range of laptop products. The competitiveness of this category between brands is shown by Samsung’s decision to give an additional 53% discount across 36% of its product line at Best Buy.

    The strategic approach brands take with different retailers was illustrated by HP’s 30% additional discount on 31% of its products at Target while over at Walmart, HP had a dire a 4% additional discount on a mere 13% of its products. A similar strategy was employed by LG with its televisions. On Amazon, its TVs had a 10% additional discount applied to 46% of its products, while at New Egg that translated to 25% and 8% respectively.

    Among the fast emerging wearables category, under-pressure Chinese firm Huawei dropped an aggressive 46% additional discount on 100% of its product range at Best Buy. By comparison, the next highest in this category was Marc Jacobs at Target with 33% and 40% respectively.

    Most Visible Brands Across Product Types

    In our analysis, brand visibility is represented in terms of both the number of products for each brand, as well as the average rank of all its products (“lower” the rank value, higher is the visibility).

    The influence an online retailer exerted on a brand’s average ranking is illustrated by Canon’s digital cameras. On Amazon, its 296 products had an average ranking of 272, while on Best Buy it was 30 and 48, 73 and 212 on New Egg and 20 and 69 on Walmart. For all these retailers, Canon was the most visible brand in digital cameras, despite such variation.

    It was a similar story on laptops, with HP’s Amazon ranking of 298 based on 166 products, contrasting with a Target ranking of 14 on 18 products and Walmart ranking of 21 on 20 products.

    These patterns appear to play out in TVs too, with Samsung’s Amazon average ranking of 292 based on 150 products contrasting with Walmart average ranking of 10 across 7 products.

    Unsurprisingly, across our analysis of additional discounts and brand visibility, the top brands are well known and recognizable brands in each product type, with very few new entrants breaking out from the pack. This story, though, takes a turn in the following analysis on visibility growth.

    Brands With Highest Growth in Visibility

    To perform this analysis, we developed an index for the visibility of a brand based on the number of products available per brand as well as the average rank of those products. We then compared this score for each brand between before and during the sale period, and subsequently calculated the percentage growth.

    The list of brands that showed the highest growth in visibility for each product type is an interesting mix of well established and newer brands. The usual suspects included the likes of Philips, Fitbit, Sony, Kodak, Nikon, etc. The presence of brands like Apple, Google, and Bose is surprising as they would be expected to command strong visibility even before the sale. Some of the newer brands include Rha, Westinghouse, Garmin, Lanruo, and more.

    Some brands showed a dramatic increase in visibility. Examples include Bose on Walmart (698%), HTC on New Egg (657%), Galanz on Amazon (657%), and Jlab on Target (608%).

    Kodak’s digital cameras (2% growth) on Best Buy took the honors for the lowest increase in visibility, just ahead of HP laptops (3%) on Walmart, Nostalgia Electrics refrigerators (4%) and Belkin Tablets (7%) both on sale at Target. These numbers indicate a relatively static assortment for the respective retailers and product types.

    Fashion Brands

    Moving over to the Fashion category, we observed significantly more aggressive discounting activity, as expected. Parent’s Choice T-shirts recorded the highest additional discount (80%) applied to the widest product range (Walmart 91%). Similarly, Fruit of the Loom saw Amazon promote a 78% additional discount applied across 20% of its products.

    In shoes, Macy’s promoted a 60% additional discount on 50% of Kenneth Cole’s product range. In watches, Amazon featured a 57% additional discount on 50% of Kate Spade New Year branded products. Meanwhile, in sunglasses, Ray Ban in Bloomingdale’s enjoyed a 20% additional discount spread across a whopping 95% of its products, compared to just a 14% additional discount applied to a mere 10% of Ray Ban products in New Egg.

    In stark contrast to what was observed in Electronics, the Fashion category saw fewer large brands dominate the discounting landscape across categories. This isn’t surprising given how the Fashion category tends to be cluttered with a plethora of brands, while the Electronics category usually consists of a leaner set of popular brands in each product type.

    Most Visible Brands Across Product Types

    In casual shoes, Nike’s ranking of 264 on 93 and Converse’s ranking of 239 on 89 products contrasted with Vision Street Wear’s ranking of 8 on 9 products and Time And Tru’s 15 ranking on 14 products.

    Another point of contrast was Micheal Kors (Handbags) cross-retailer platform performance - its average ranking of 184 on 102 products on Macy’s while its average ranking on New Egg was 20 across 12 products. Still, it appears the brand discounted heavily in New Egg to compensate for its relatively low visibility on the website.

    Ray Ban recorded a category high ranking of 209 based on 321 products on Macy’s. By comparison, Ray Ban had a ranking of 17 on 34 products at New Egg. Over at Amazon, Ray Ban managed a creditable 189 ranking on 124 products and a 163 ranking on 120 products at Bloomingdale’s.

    Brands With Highest Growth in Visibility

    Compared to the Electronics category, Fashion consists of certain brands that skyrocketed in their visibility. Examples include Next Level T-shirts (Amazon 2,000%), Michael Kors Watches (Walmart 1,424%), Dakota Watches (Target 751%) and Adidas sports shoes (Amazon 516%).

    Bloomingdale’s delivered amazing visibility growth for key brands, with Burberry (527%), Reiss (500%), The Kooples (%00%), Tory Burch (500%), J Brand (475%), and Adidas (300%) all enjoying strong visibility growth.

    At the other end of the visibility growth spectrum, the growth rates of Lucky shirts (New Egg, 11%), Micheal Kors (New Egg, 20%) Dickies jeans (Target, 22%), Tasso Elba shirts (Macy’s, 23%), and Puma Casual Shoes (Target, 25%) indicate a relatively more static assortment in their respective product types.

    Depth Of Product Range And Discounting Strategy Matters

    Across the three sales, DataWeave identified several different additional discounting and product assortment strategies by both the retailers and the brands.

    While retailers are increasingly discounting the lower priced products to shape price perceptions among shoppers (take a bow Amazon), what are the implications for brands? Firstly, a thin product range is going to make achieving visibility more challenging. Secondly, brand strategies across online retailing platforms will need to be more clearly defined and executed. Thirdly, those brands that treated Thanksgiving, Black Friday and Cyber Monday as discrete events are going to have to rethink their approach as these lines increasingly blur with time.

    If you’re interested to learn more about how DataWeave aggregates and analyzes data from online sources as massive scale, as well as how we provide competitive intelligence to retailers and consumer brands, visit our website!

  • Evolution of Amazon’s US Product Assortment

    Evolution of Amazon’s US Product Assortment

    As with many other product categories, Amazon has made a significant incursion in Apparel — a key battleground category in retail today. Recently, DataWeave once more collaborated with Coresight Research, a retail-focused research firm to publish an in-depth report revealing insights on Amazon’s approach to its US fashion offerings.

    Since our initial collaborative report in February this year, we have witnessed some seismic shifts in the category at both the brand and the product-type level.

    Research Methodology

    We aggregated our analytical data on more than 1 million women’s and men’s clothing products listed on Amazon.com in two stages:

    Firstly, we identified all brands included in the Top 500 featured product listings for each product subcategory in both the Women’s Clothing and Men’s Clothing sections featured on Amazon Fashion (e.g., the top 500 product listings for women’s tops and tees, the top 500 product listings for men’s activewear, etc.). We believe these Top 500 products reflect around 95 percent of all Amazon.com’s clothing sales. This represents 2,782 unique brands.

    We then aggregated the data on all product listings within the Women’s Clothing and Men’s Clothing sections for each of those 2,782 brands. This generated a total of 1.12 million individually listed products. This expansive list forms the basis for our highlights of the report.

    Third-Party Seller Listings Are Rising Sharply

    We identified a total of 1.12 million products across men’s and women’s clothing — a significant increase of 27.3 percent in the seven months between February and September 2018. The drivers of this sharp spike are third-party seller listings. In contrast, the report indicates only a 2.2 percent rise in first-party listings over the same period, compared to a 30.5 percent jump in third-party listings.

    In addition, Amazon has listed just 11.1 percent of all clothing products for sale, with third-party sellers offering the remaining 88.9 percent — an indication of the strength of Amazon’s open marketplace platform.

    A Major Brand Shift On Amazon Fashion Is Underway

    In just over six short months, major brand shifts on Amazon Fashion have taken place. The number of Nike listings has plummeted by 46 percent, driven by a slump in third-party listings following Amazon’s new partnership with Nike — a story recently covered by Quartz. Limited growth in Nike clothing first-party listings failed to compensate for this decline.

    Gildan’s spike in total product listings appears to be fueled by increased first-party listings off a low base. Calvin Klein’s 2017 agreement to supply Amazon with products appears to be driving the Calvin Klein brand’s double-digit uptick in first-party listings on Amazon Fashion.

    Aéropostale’s decline appears to be entirely driven by a drop in its third-party listings. The brand itself is not listed as a seller on Amazon.com.

    Amazon Is Rebalancing Its Apparel Portfolio and Switching Its Focus from Sportswear To Suits

    As its Fashion footprint rapidly matures, Amazon now appears to be rebalancing its portfolio with strong growth being shown in listings for formal categories such as suits and away from sportswear. We recorded a 98.6 percent increase in listings of women’s suits and blazers complemented by a 52.2 percent rise in men’s suit and sports coat listings between February and September 2018.

    Generic “Non-Brands” Are Surging On Top 25 Brands List

    Over the past six months, low-price generic brands have made major inroads into Amazon’s listings. Four unknown “brands” captured the top positions on the list of brands offered on Amazon Fashion. The WSPLYSPJY, Cruiize and Comfy brands appear to be shipped directly to customers from China.

    Source: Coresight/DataWeave (Amazon Fashion: Top 25 Brands’ Number of Listings, February 2018 vs. September 2018)


    Source: Coresight/DataWeave (Amazon Fashion: Top 25 Brands’ Number of Listings, February 2018 vs. September 2018)

    WSPLYSPJY alone accounts for fully 8.6 percent of Amazon men’s and women’s clothing listings. Cruiize accounts for a further 3.2 percent of listings while Comfy chips in another 3.1 percent.

    Amazon Appears To be Executing A Strategic Pivot

    Amazon’s fashion offering is fast maturing. We saw substantial growth in the number of listings for more formal categories. The realignment in third-party listings by Nike together with increased first-party listings for Calvin Klein and Gildan appear to be driven by alliances with Amazon.

    Simultaneously, ultralow-price generic clothing items delivered on order from China have inundated the “Most-Listed Products” rankings. Third parties now represent nearly 90 percent of Amazon Fashion’s offering.

    While Amazon Fashion shoppers enjoy a wider choice than they did even six months ago, we believe a stronger emphasis on first-party listings would grow the products eligible for Prime delivery. This tactic could strengthen Amazon Fashion’s long-term appeal as a shopping destination.

    If you’re interested in DataWeave’s technology, and how we aggregate data from online sources to provide unique and comprehensive insights on eCommerce products and pricing, check us out on our website!

  • Inside India’s eCommerce Battle: Attractive Offers Usher In The Festive Season

    Inside India’s eCommerce Battle: Attractive Offers Usher In The Festive Season

    It’s festival season in India again and shoppers took advantage of aggressive cutthroat competition between Indian online retailers to drive sales to unprecedented highs.

    All the major Indian eCommerce websites including, Amazon, Flipkart, Myntra, and Shopclues opted to go head to head by holding their first sale event this season over 4 to 5 days starting on the 10th of October. Still, as industry reports indicate, one retailer came out on top during this event — an insight supported by our analysis as well.

    A New Battleground

    The highlight this year was seeing how the announcement of global retail colossus Walmart’s acquisition of Flipkart would impact the sale events. The acquisition was the most influential development in India’s eCommerce sector, and it has transported a decades-long U.S. rivalry between Amazon and Walmart to Indian soil. As a result, this year’s sale event held out the promise of more attractive pricing and vast product selection for India’s consumers than ever before.

    Industry analysts estimate that the sale generated a cumulative Rs 15,000 crore in sales over the spread of the five sale days, a whopping outcome. In 2018, this translated into around a 64 per cent year-on-year growth outcome compared to the USD 1.4 billion (around Rs 10,325 crore) generated by the 2017 sales.

    The DataWeave Analysis

    At DataWeave, we analyzed the performance of each of the major eCommerce platforms including Amazon, Flipkart, Myntra, Paytm, and Shopclues. For each eCommerce website, we aggregated data on the Top 500 ranked products for over 40 product types spread across 6 product categories (Electronics, Men’s & Women’s Fashion, Furniture, Haircare, Skincare).

    We focused our analysis on only the additional discounts offered during the sale and compared them to prices prior to the sale, to reflect the true value of the sale to India’s shoppers.


    The battle of the discounts was led primarily by Flipkart and Amazon. Flipkart’s average additional discounts by category actually exceeded Amazon’s in three out of six categories, and it discounted more products that Amazon across all categories.

    Clearly, the focus for all e-tailers was skewed towards the main battlegrounds of Electronics and Fashion, compared to mainstream FMCG categories such as Hair and Skin Care. However, this is not surprising given FMCG functions on rather skinny margins.

    Across retailers, the Men’s and Women’s Fashion categories were the most aggressively discounted, attracting both the highest additional discounts and the highest percentage of products with additional discounts.

    The Furniture category too was an interesting battleground between Amazon and Flipkart, attracting attractive discounts on a wide range of products, particularly in Flipkart’s case.

    Prospective shoppers in search of relatively more expensive clothing products on discount during the sale would have established Myntra as their ideal destination, as it carried more premium products on discount during the sale, relative to all its competitors. For shoppers in search of an electronics bargain though, they would have done well to opt for Flipkart.

    Shoppers may have found some interesting deals on Paytm Mall too, especially in Men’s Fashion, while Shopclues largely held itself back from any dramatic price reductions.

    While Myntra capitalized on its niche though aggressive discounting in the Fashion category, most of the discounting action revolved unsurprisingly around Amazon and Flipkart. To drill down for a more complete understanding of just how the Amazon and Flipkart discounted their products, we conducted a more detailed follow-on analysis.

    We normalized additional discounts and popularity using a scale of 1 to 10 and plotted each product on a chart to analyze its distribution characteristics. Popularity was calculated as a combination of the average review rating and the number of reviews posted. Products with a popularity score of zero, as well as zero additional discounts were excluded from this analysis.


    The most obvious insight yield through this analysis is how Flipkart elected to distribute its additional discounts across a larger range of discount percentages. By contrast, Amazon went all in on the more limited range of products it decided to provide additional discounts on. This is a strategy we have seen Amazon adopt previously.

    One other intriguing insight is Flipkart’s decision to go for a much higher distribution of products falling below a popularity score of 0.5 compared to Amazon. Amazon’s strategy resulted in more of its discounted products having a higher popularity score, relative to Flipkart, albeit only by a comparatively minor amount. However, a shopper’s chances of buying a popular, positively reviewed product at a lower price were higher on Amazon than Flipkart during this sale.

    Achieving a Consistent Competitive Edge

    Flipkart claims to have recorded a 70 per cent plus share of entire Indian e-commerce market in the 4 day-BBD’18 sales. Flipkart further claimed to have cornered an 85 per cent share in the online Fashion category together with a 75 per cent share in the Electrical category’s large appliances during the sale. This includes a contribution by Flipkart’s subsidiary Myntra.

    As these numbers reflect, Amazon still has some way to go to entrench itself in the Fashion category of the Indian market. However, Amazon appears content to continue its surgical discounting philosophy.

    Overall, this year witnessed an impressive participation by Tier II and Tier III Indian city consumers — a sign of things to come in Indian online retail.

    With increasing competitive pressure, retailers simply cannot adopt discounting and product selection strategies in isolation and be successful. Having access to up to date insights on competitors’ products dynamically during the day is emerging as key to ensuring they’re able to sustain their lowest priced strategy for appropriate products. These insights are also proving critical in identifying gaps in their product assortment, which can hamper customer conversion and retention.

    During sale events, modern retailers need to rely on highly granular competitive insights on an hourly basis (or even more frequently) to inform their pricing and product strategies to ensure they consistently maintain a competitive edge for the consumer’s wallet. And while access to reliable competitive intelligence is critical, true value can only be derived when it gets integrated with a retailer’s core business and decision-making processes, such as assortment management, promotions planning, pricing strategies, etc.

    DataWeave’s Competitive Intelligence as a Service helps global retailers do just this by providing timely, accurate, and actionable competitive pricing and product insights, at massive scale. Check out our website to find out more!

  • Prime Day Sale: Unraveling the Highs and Lows of Amazon’s Flagship Event

    Prime Day Sale: Unraveling the Highs and Lows of Amazon’s Flagship Event

    Another year, another round of media frenzy, and another set of records broken.

    In only three years, Amazon’s Prime Day has evolved into one of the landmark sale events of the shopper’s calendar. Reports indicate that this year’s sale made a major splash, raking in over $4.2 billion in sales — a 33% increase compared to last year. Also, the retail behemoth shipped over 100 million products during the 36-hour sale. Amazon stated that they “welcomed more new Prime members on July 16 than on any other previous day in Prime history.”

    The much talked about website outage added some spice and drama to the proceedings during the first hour. However, this was fixed quickly.

    This year is also the first Prime Day with Whole Foods, Amazon’s most expensive acquisition, giving US shoppers unprecedented incentives to shop at the physical stores of the grocery retailer.

    However, Prime Day is not just about the US, but a truly global event. In India, as part of its promotions for Prime Day, Amazon leveraged VR to have people experience the products in their true form factor at select malls.

    At DataWeave, our proprietary data aggregation and analysis platform enabled us to keep an eye on the pricing and discounts of products during the sale. We tracked Amazon.com, Amazon.co.uk, and Amazon.in before (14th July) and during the sale (16th July) and monitored several product types in Electronics, Men’s Fashion, Women’s Fashion and Furniture categories. We captured information on the price, brand, rank on the category page, whether Prime was offered or not, etc. and analyzed the top 200 ranks in each product type listing page. To best indicate the additional value to shoppers during the sale, we focused our analysis only on additional discounts on products between the 14th and 16th of July.

    Scrutinizing the data yielded some rather interesting insights:

    Amazon UK was more aggressive with its discounts than the US and India across most categories, with Furniture being the only exception (highest discounts in the US).

    In the US, Women’s Fashion observed the steepest discounts (12%), though there were discounts available on a larger number of Men’s Fashion products (5% additional discount on 20% of products).

    While disparity between discounts on Prime products vs non-Prime was quite evident, it was surprisingly low for many categories. In fact, the Electronics category in the UK and the Furniture category in India witnessed sharper discounts for non-Prime products than Prime.

    Top categories by additional discount include Women’s Handbags, Sports Shoes, and Pendrives in the US, Sunglasses and Tablets in the UK, and Women’s Tops, Men’s Jeans, Women’s Sunglasses, and Refrigerators in India. Top brands include Nike, Amazon Essentials, Sandisk, and 1home in the US, Oakley, Toshiba, Belledorm, and rfiver in the UK, and Adidas, Sony, UCB, and Red Tape in India.

    As indicated in the following infographic, some of the most discoverable brands during the sale include Canon, Apple, Nike and Casio in the US, Sandisk, Amazon, Levi’s, and Ray Ban in the UK, and Nikon, UCB, Whirlpool, and HP in India. Discoverability here is measured as a combination of the number of the brand’s products in the top 100 ranks and the average rank of all products of the brand. Also in the infographic, is a set of products with high additional discounts during the sale.


    Amazon’s competitors though aren’t ones that simply roll with the punches.

    Flipkart, Amazon’s largest competitor in India (recently acquired by Walmart), announced its own Big Shopping Days sale between July 16 and July 19. On Prime Day, the company joined in with some attractive offers:

    • 8%, 10%, and 7% additional discounts on 11%, 29%, and 16% of Electronics, Men’s Fashion, and Women’s Fashion categories, respectively.
    • 35% off on Perfect Homes 3-seater Sofa
    • 27% additional discount on Acer Predator Helios Gaming Laptop
    • 25% additional discount on Sandisk 16GB Pen Drive

    Propelling the Amazon Flywheel

    While Amazon clearly benefits in the short-term with this sale, the long-term effect of feeding its famous flywheel is evident as well.

    Amazon’s flywheel is a framework through which the company looks to build a self-feeding platform that accelerates growth over time. Attractive discounts and a broad selection of products improves customer experience, which increases traffic to the website, which attracts more merchants on its platform, who in turn broaden the selection of available products.

    Sale events like Prime Day create the sort of hype needed to draw a lot of traffic to Amazon’s website, generating momentum that has a compounding effect on Amazon’s growth. Not surprisingly, more than half of the people surveyed in the US by Cowen last December said they lived in a household with at least one Prime subscription.

    As Amazon’s stock traded at an all time high following Prime Day, it’s only a matter of time before the company becomes the world’s first trillion dollar company.

    Check us out, if you’re interested in learning more about our technology and how we provide Competitive Intelligence as a Service to retailers and consumer brands.

  • How to Win the Coveted Amazon Buy Box | DataWeave

    How to Win the Coveted Amazon Buy Box | DataWeave

    Did you know that over 80% of purchases on Amazon.com is via the buy box?

    While Amazon is all the rage today, raking in 43% of all eCommerce dollars, thousands of merchants on the online marketplace look to seize every opportunity to attract shoppers and drive sales each day. And for these merchants, getting on the buy box is more than half the battle won.

    Recently, Forbes.com published our study of how online merchants can plot their strategy to win the buy box. In this article, we’ll explore some of the key takeaways from this study.

    What is the Amazon buy box?

    The buy box is the section on the right side of Amazon’s product page, where shoppers can add items for purchase to their cart. Since multiple merchants often offer the same product, they compete to win the buy box spot on the product page, which is where customers typically begin the purchasing process — a huge competitive advantage.

    How can merchants win the buy box spot?

    At DataWeave, we aggregate and analyze billions of data points from the Web to deliver Competitive Intelligence as a Service to retailers and consumer brands. Using our proprietary technology platform, we aggregated data for a large sample of products in the mobile phones, clothing, shoes and jewelry categories on Amazon and collected information on all merchants (over 700 in number) selling these product over a period of 10 days.

    We looked closely at several factors that could possibly impact the choice for the buy box:

    • Was Amazon a merchant or not?
    • The effective price (list price + shipping charges — offer/cashback amount) — after all, a common assumption is that the lowest priced merchant has the best chance of winning.
    • Were Prime benefits offered?
    • The quality of review ratings
    • The stock status
    • The number of products offered by a merchant

    We parsed through the data to unearth some interesting insights and found that some factors influenced the move to the buy box spot more than others.

    We see that when Amazon is a merchant, it’s twice as likely to win the buy box compared to other merchants. Further analysis revealed that for around 95% of instances where Amazon was a merchant but was NOT the in the buy box, Amazon was selling at a price 20% greater than the minimum price.

    When the effective price is the lowest, relative to other merchants, the chances of the merchant winning the buy box increased 2.5-fold. Essentially, for the set of merchants who were the lowest priced for each product, only 26% of them won the buy box.

    Merchants who provided Prime benefits to shoppers were 3.5 times more likely to win compared to other merchants. And lastly, if the percentage of positive reviews for a merchant are decreasing over time, the merchant is 5X less likely to win. All other factors analyzed failed to yield statistically significant results.

    Interestingly, no single factor played an overwhelming role in influencing the buy box criteria. So, with the help of statistical modelling, which considers and weighs all factors, we better understood the relationship between all factors, and traced a path for merchants to win the buy box.

    The Cheat Sheet

    While it isn’t quite possible to develop a fool proof framework, the following flowchart can act as a fairly useful guide.


    Clearly, the path to the buy box is not a straightforward one.

    If Amazon itself is a merchant for a product, chances of other merchants winning the buy box are low (35%). However, if a merchant is looking to compete with Amazon for the buy box spot, offering Prime benefits is key (82% probability). Without offering Prime, chances of winning the buy box are almost negligible, even if the merchant is the lowest priced. It’s interesting to note that when Amazon does occupy the buy box spot, it’s the lowest priced in 79% of the cases.

    When Amazon is not a merchant for a product, and competition is only between third-party merchants, offering Prime benefits is still the most influential factor (78%). When Prime isn’t offered, the price is the primary determinant of the buy box merchant (86%).

    Evidently, reducing the price is not always the best course of action. It appears that offering Prime benefits has the biggest impact on a merchant’s chances of winning the buy box, across various scenarios.

    However, it’s important to keep in mind that moving up the “merchant ladder” is a gradual process, based on how merchants perform consistently over time.

    If you’re interested to learn more about DataWeave’s technology, and how we help retailers and consumer brands optimize their online strategies, visit our website!