Category: Amazon

  • Prime Day India 2022 – highlights from the 2 day annual shopping festival!

    Prime Day India 2022 – highlights from the 2 day annual shopping festival!

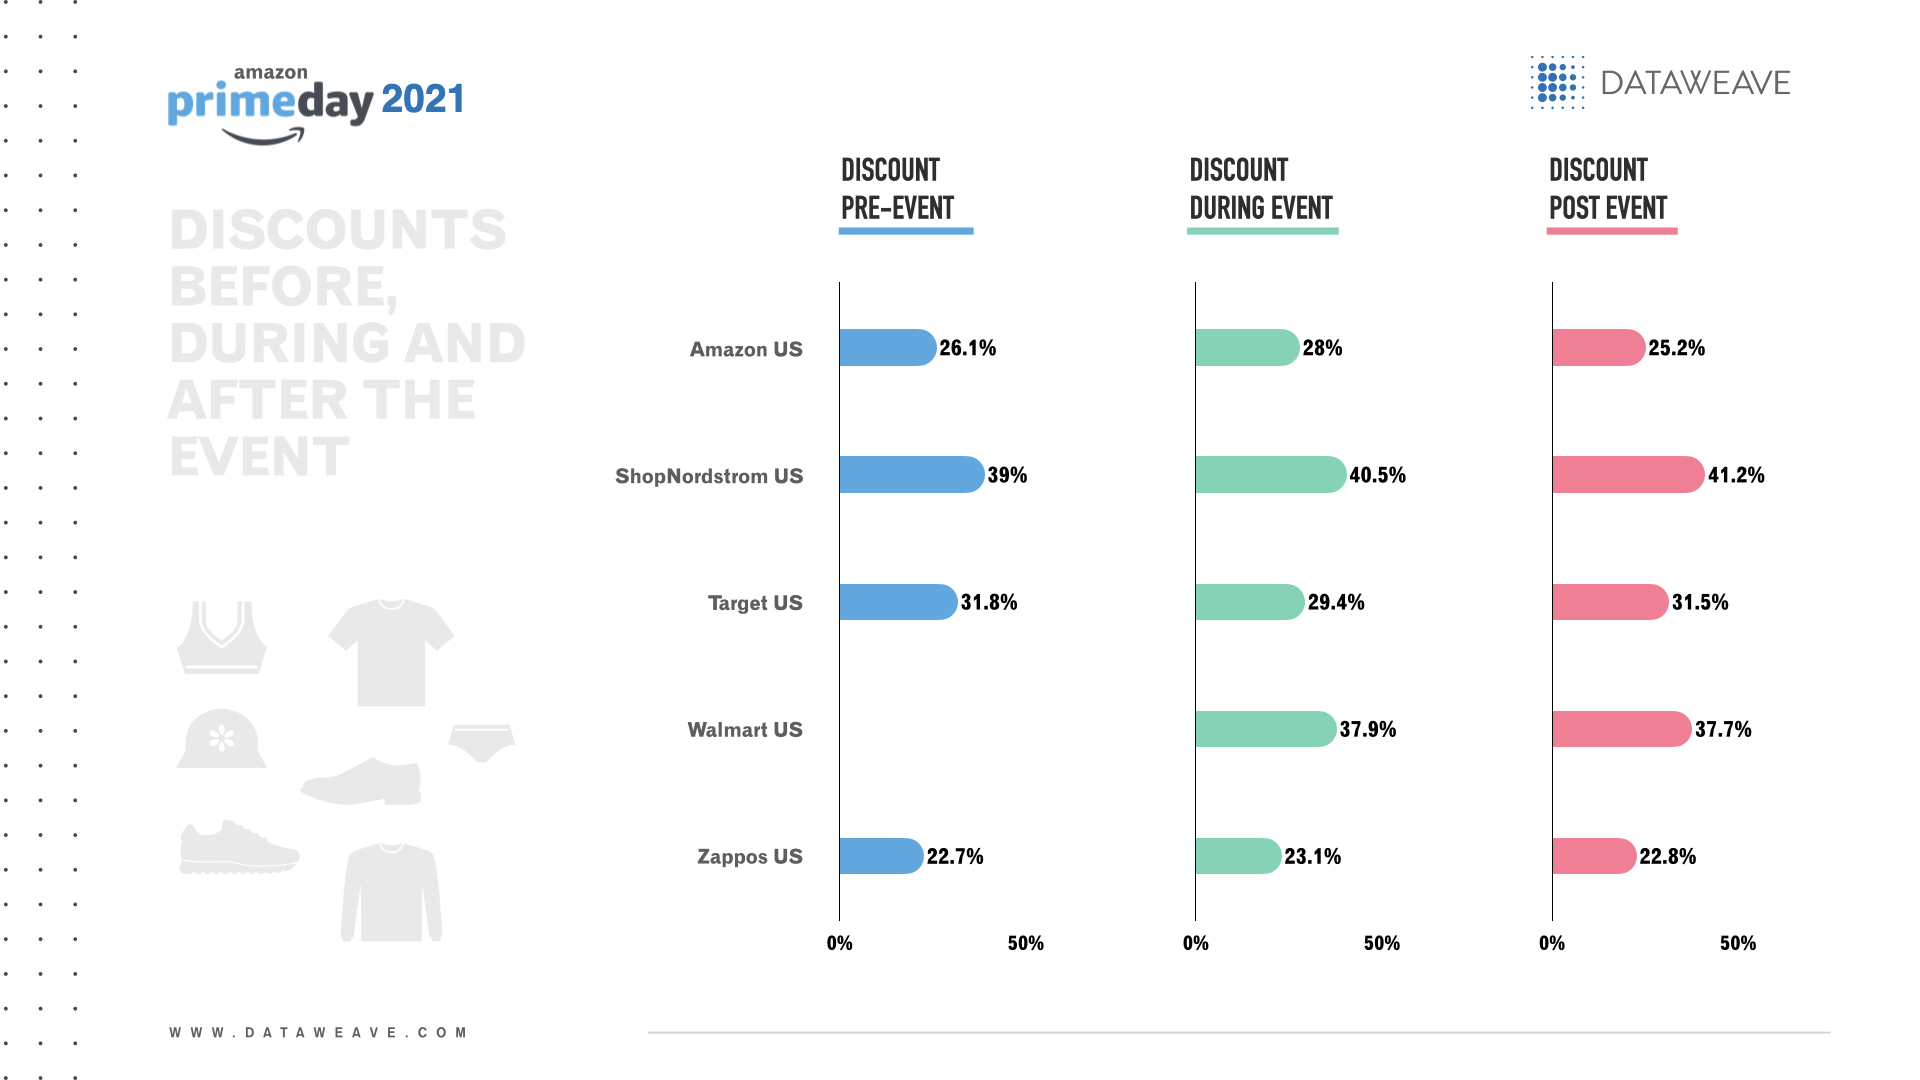
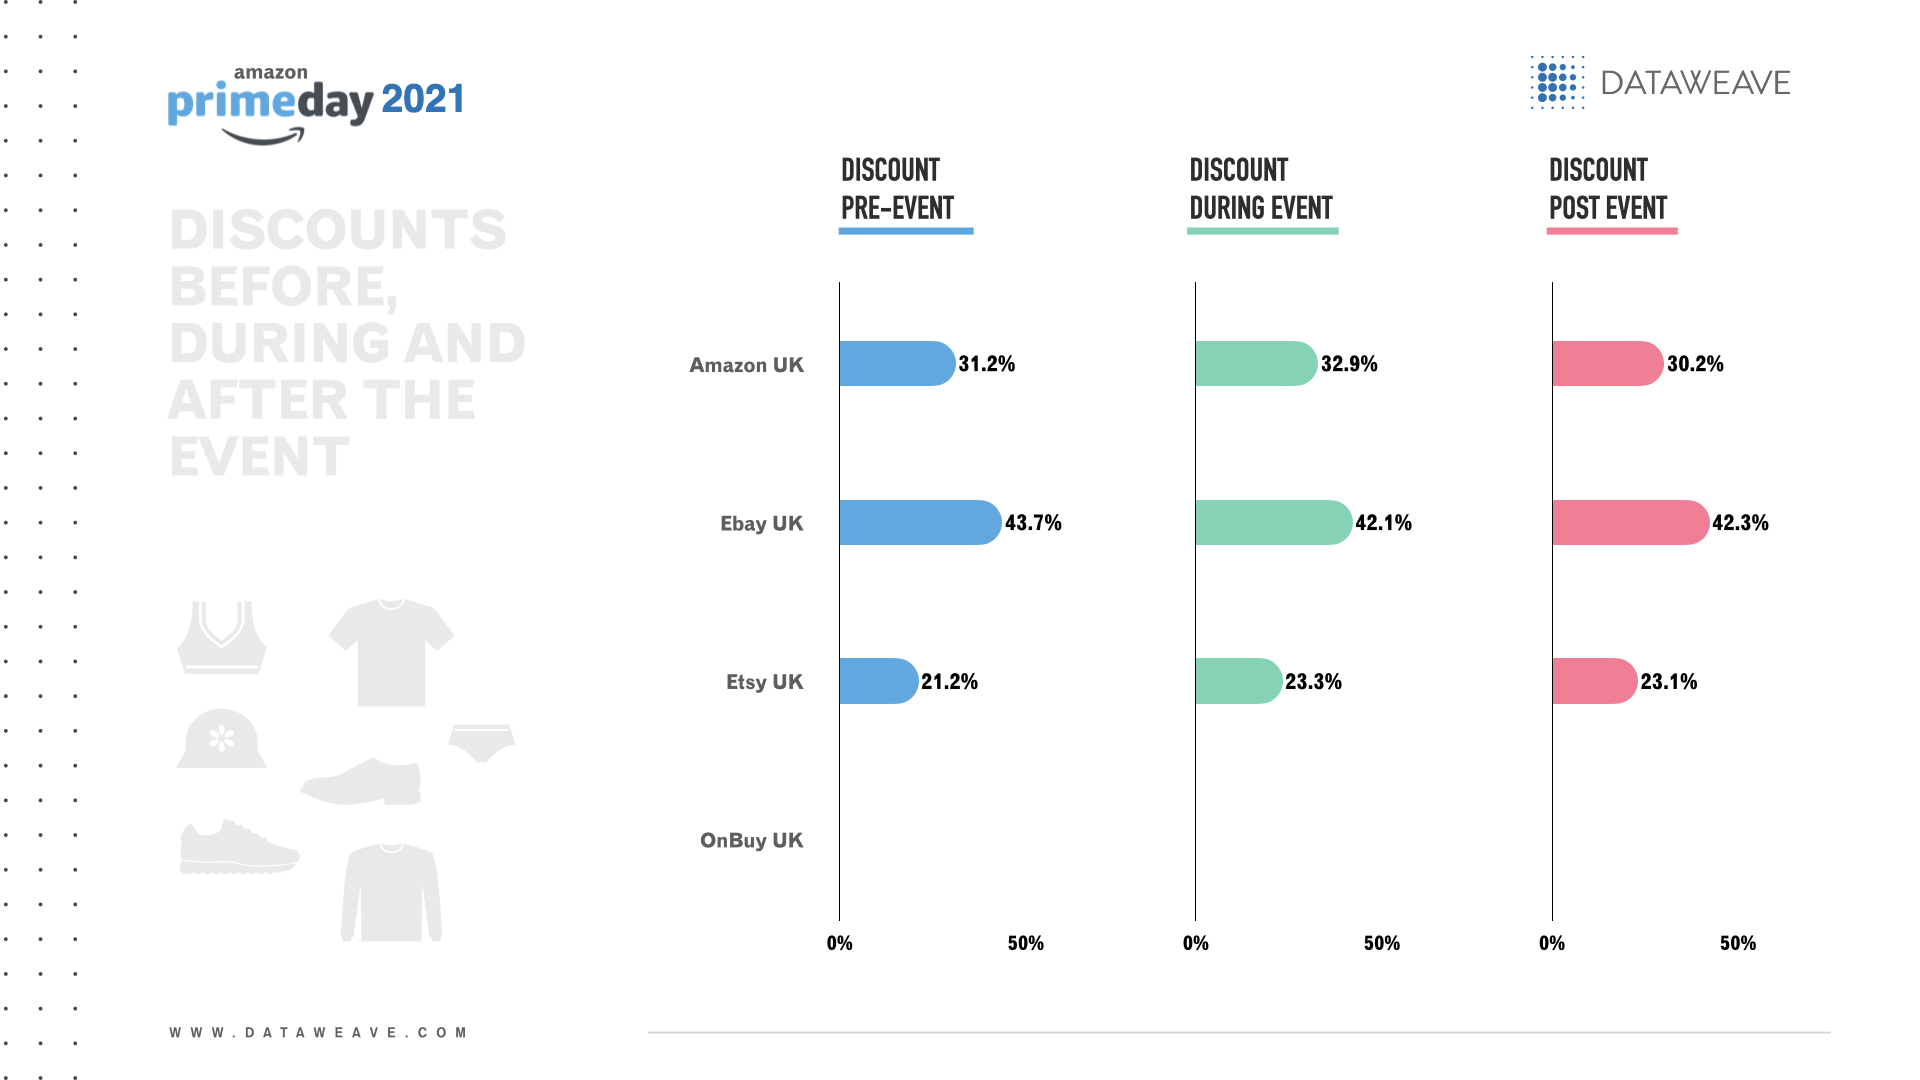
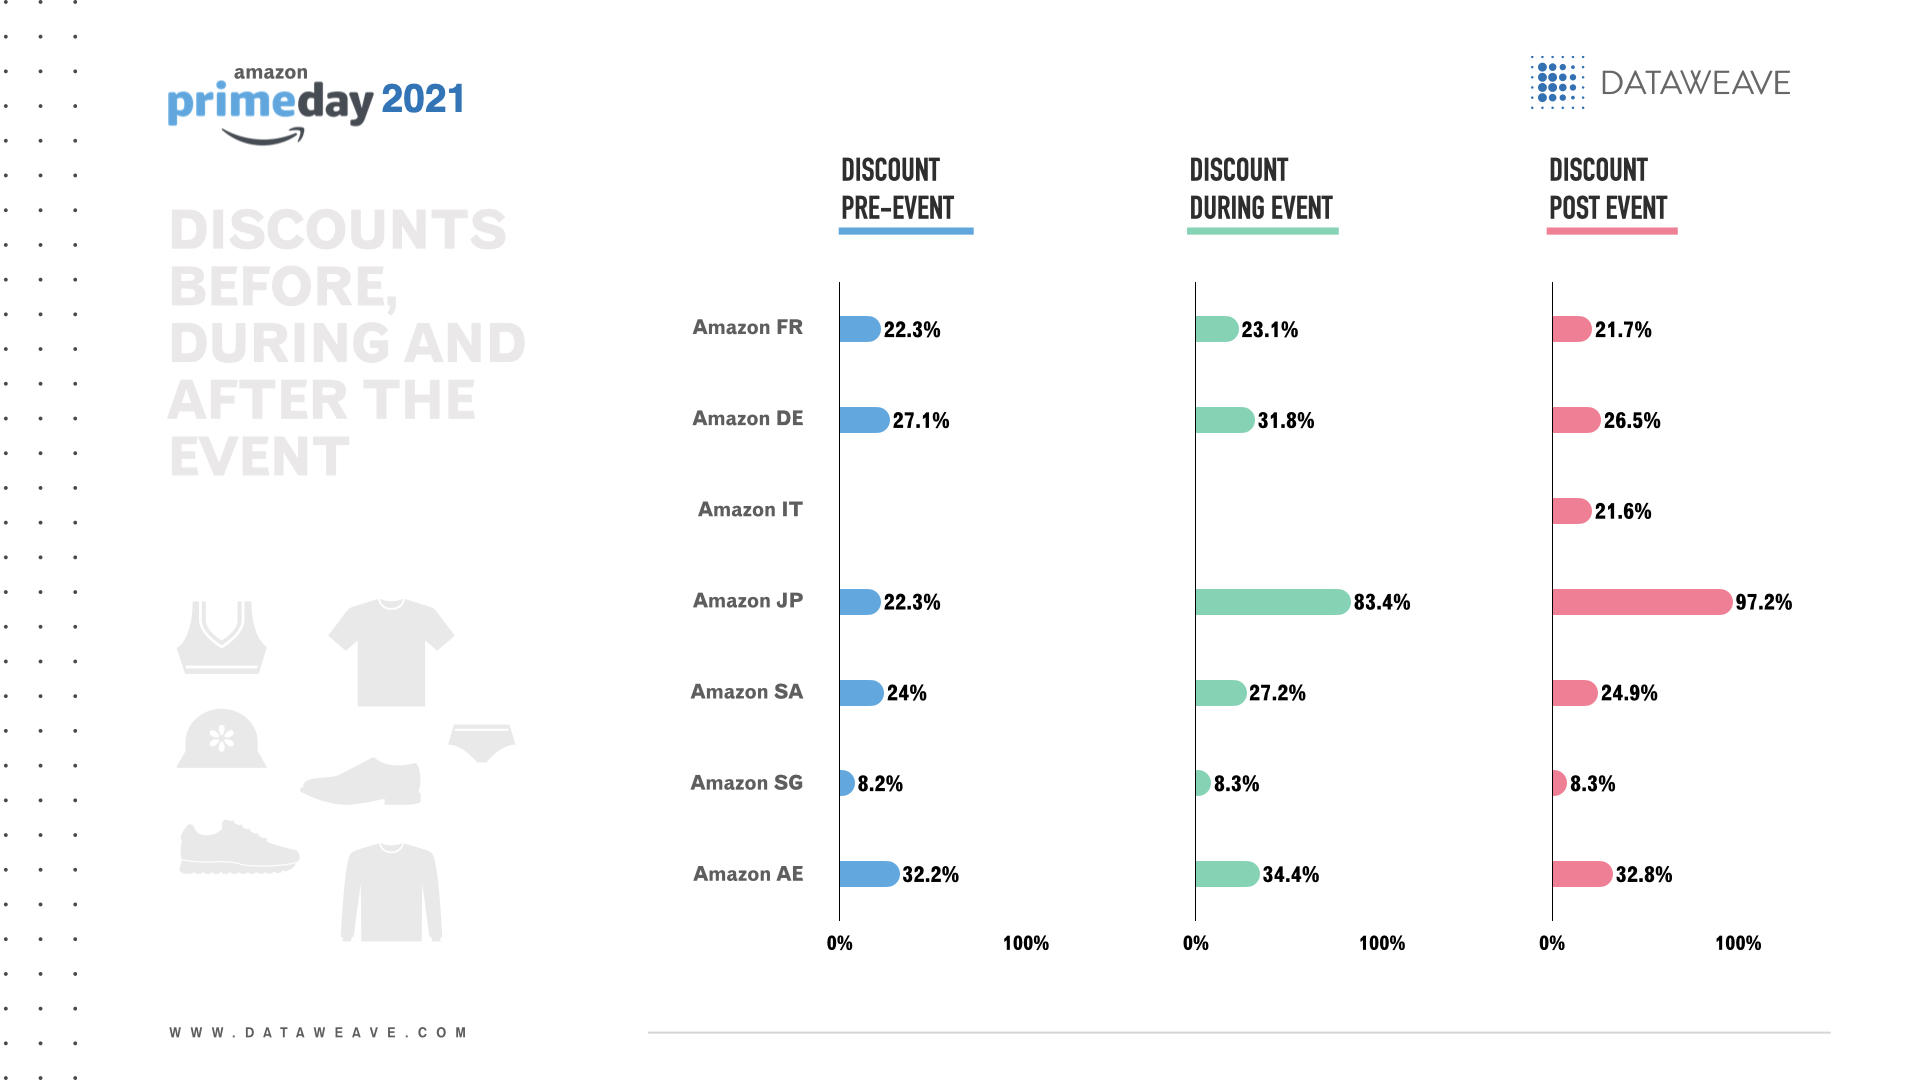
    Amazon India’s much-awaited annual two-day shopping event, Prime Day, kicked off with a bang on July 23rd & 24th this year & was one of the most successful Prime Day events yet! Amazon reported that more than 32,000 sellers saw their highest ever sales day during the event. Interestingly 70% of these sellers who received orders during Prime Day were based in Tier 2 cities in India, further validating how the post-pandemic eCommerce boom has spread across the country. Also, Indian exporters saw 50% business growth on Amazon on Prime Day as customers across markets like North America, Europe, Australia, and Japan continued to purchase Made In India products.
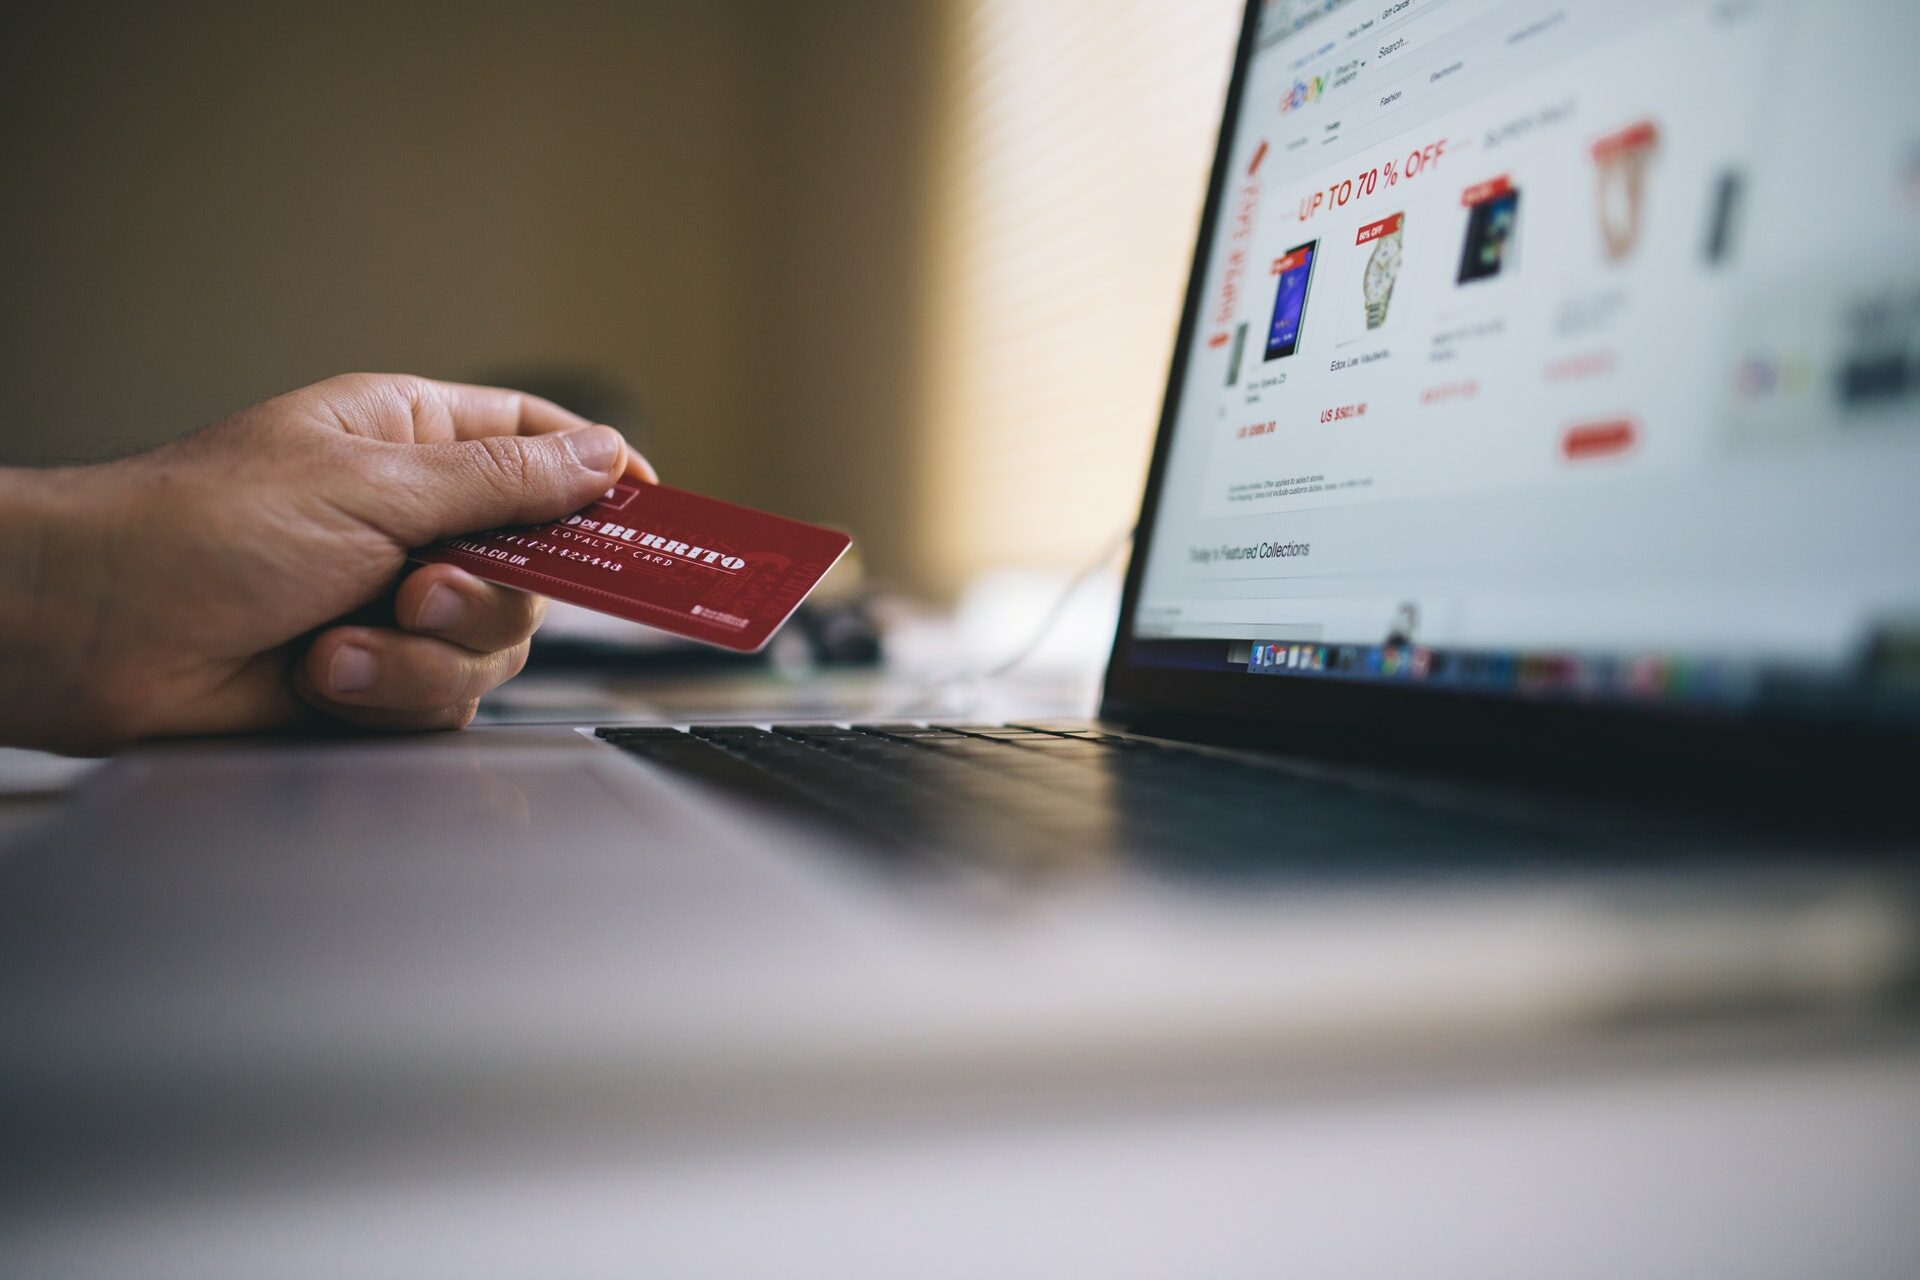
    It was a great 2 days for Indian sellers, but what about customers who were waiting in anticipation for the great deals typically offered on Prime Day? We dug into our data to take a look at the deals, discounts, and brands that shone bright on Prime Day in India.
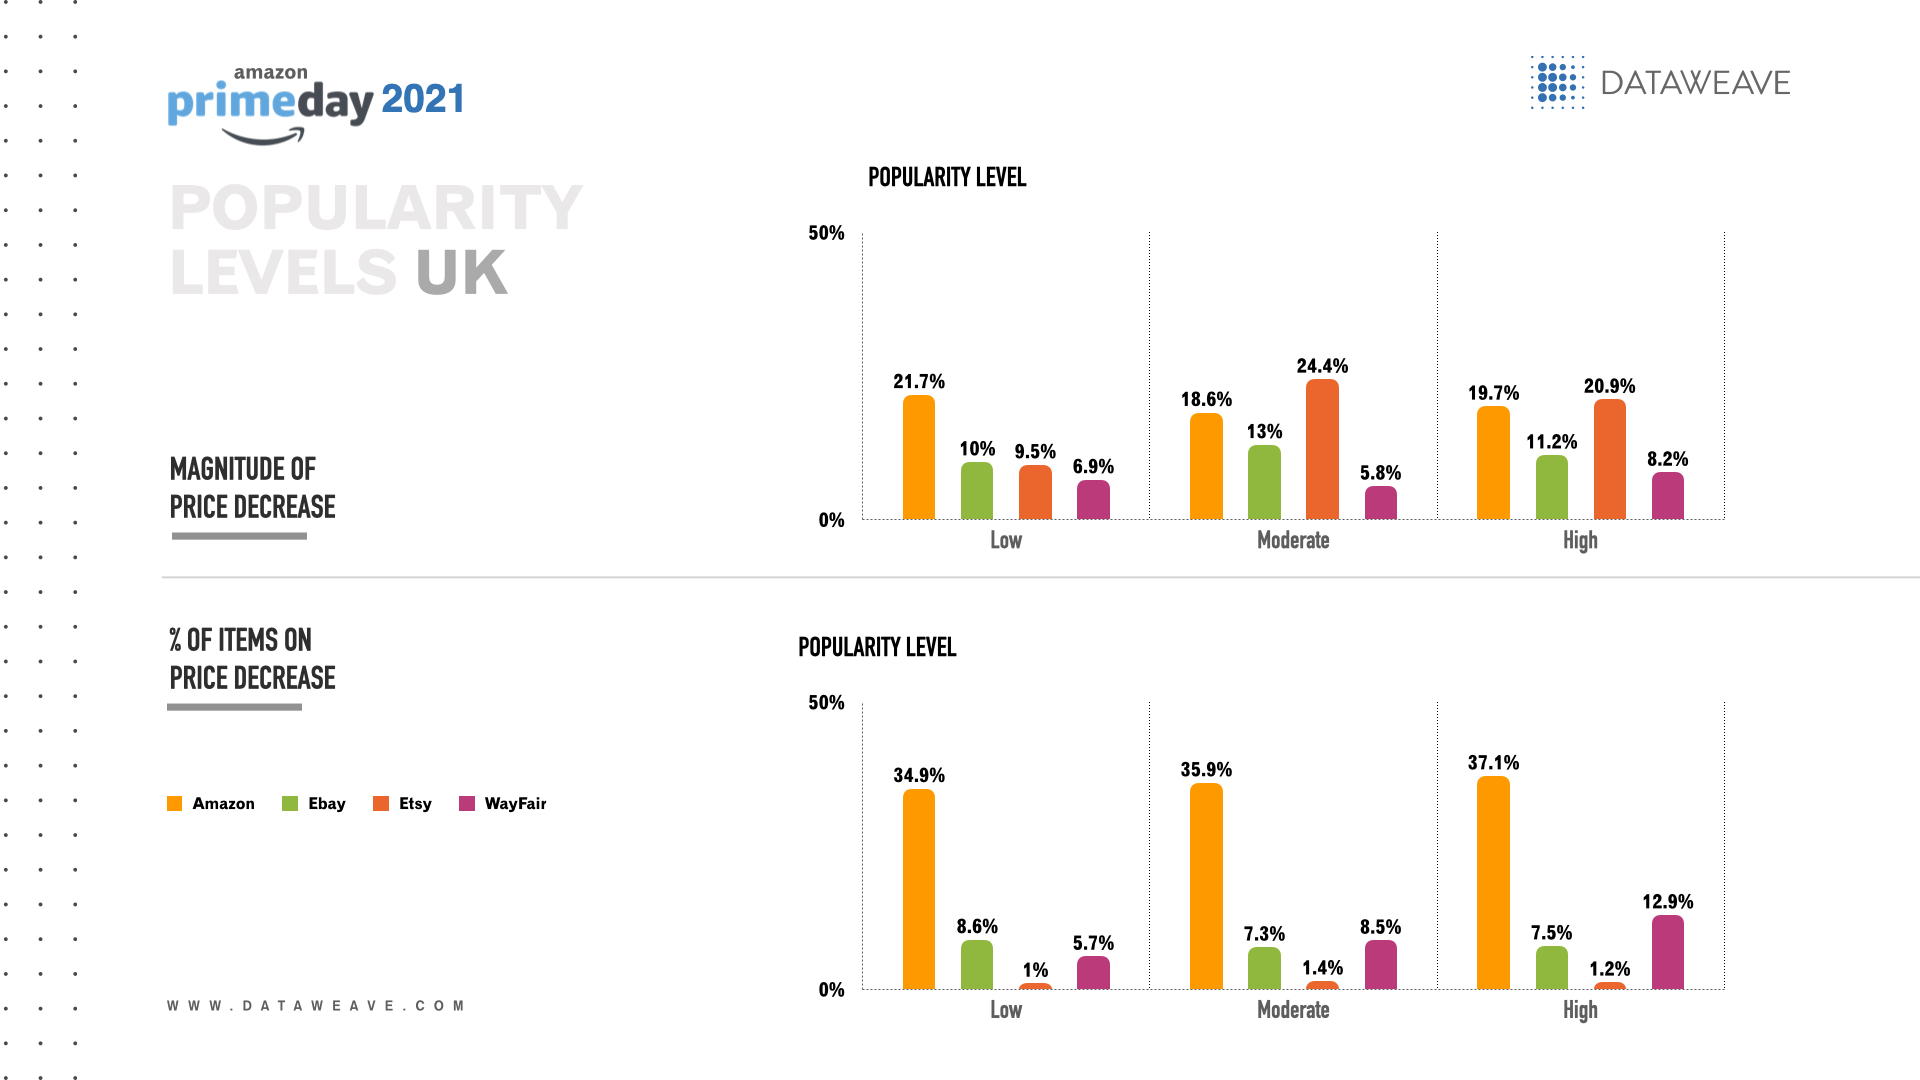
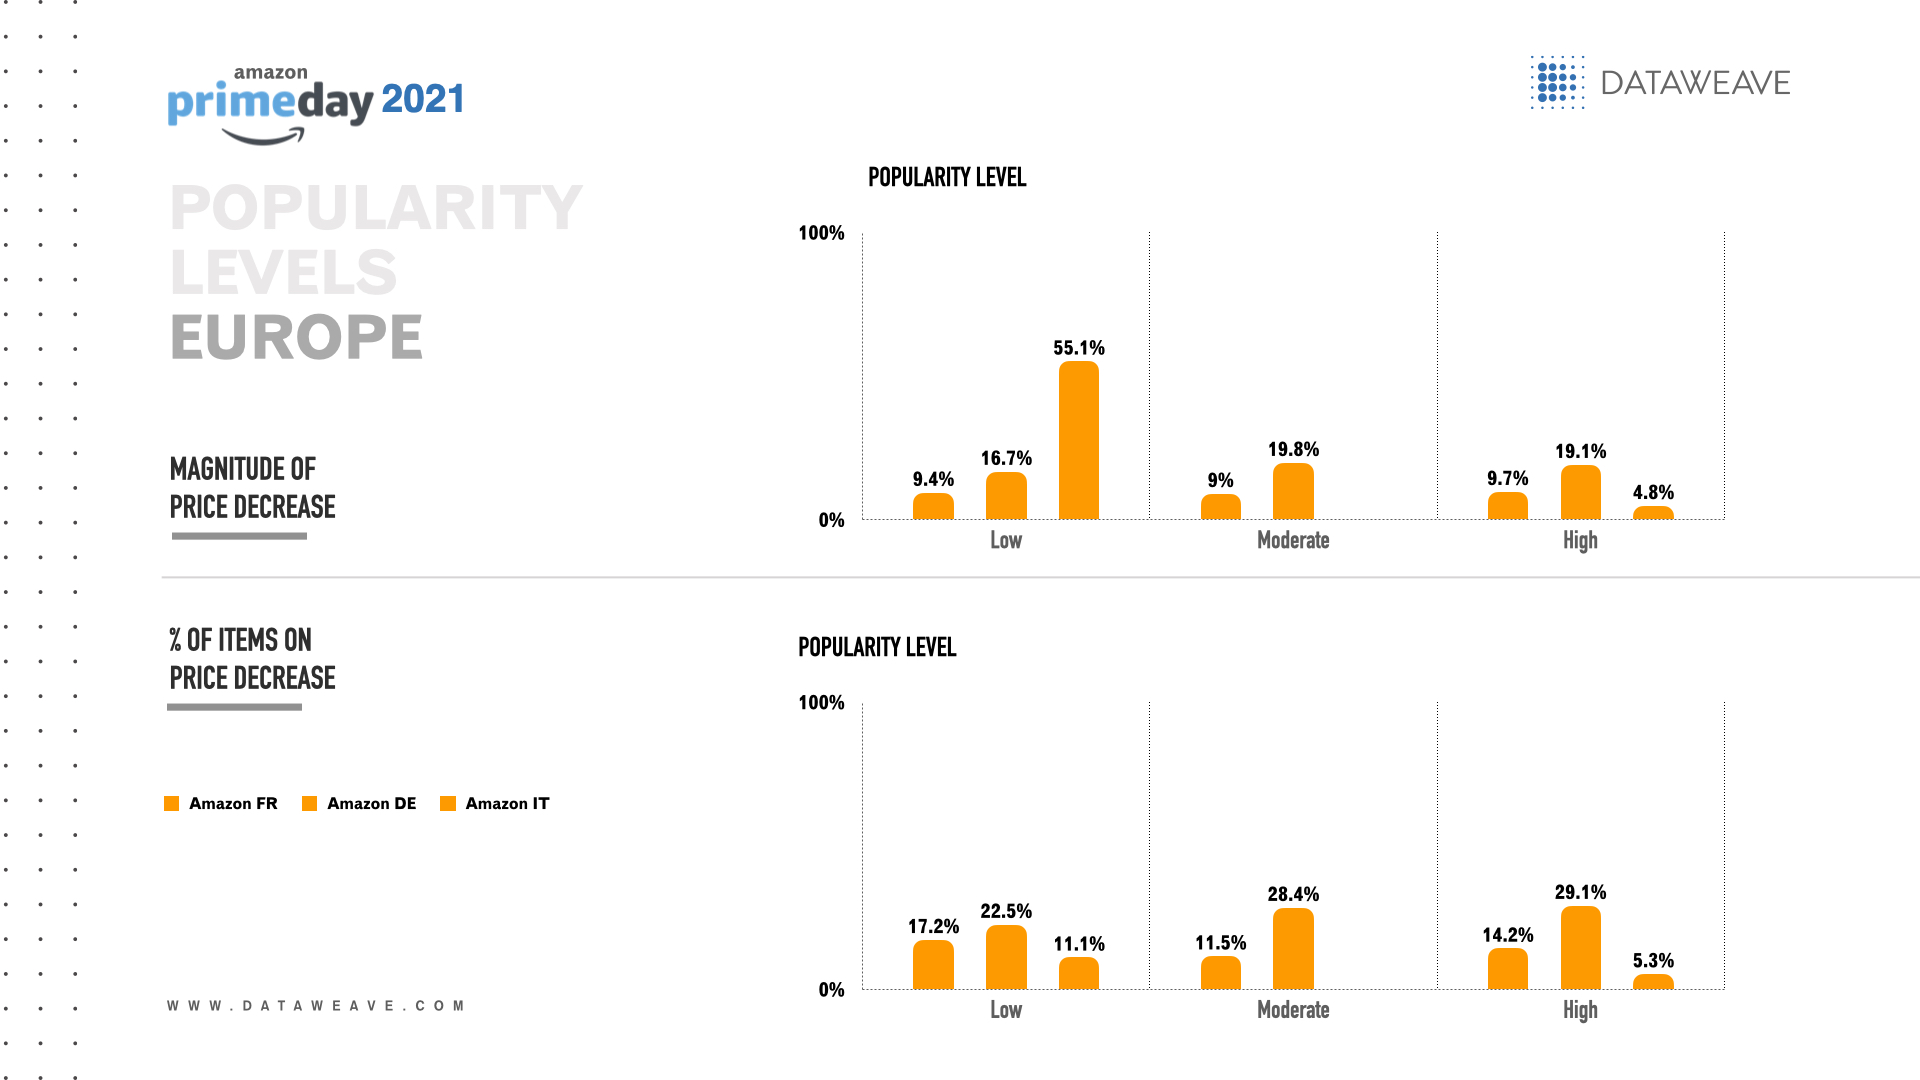
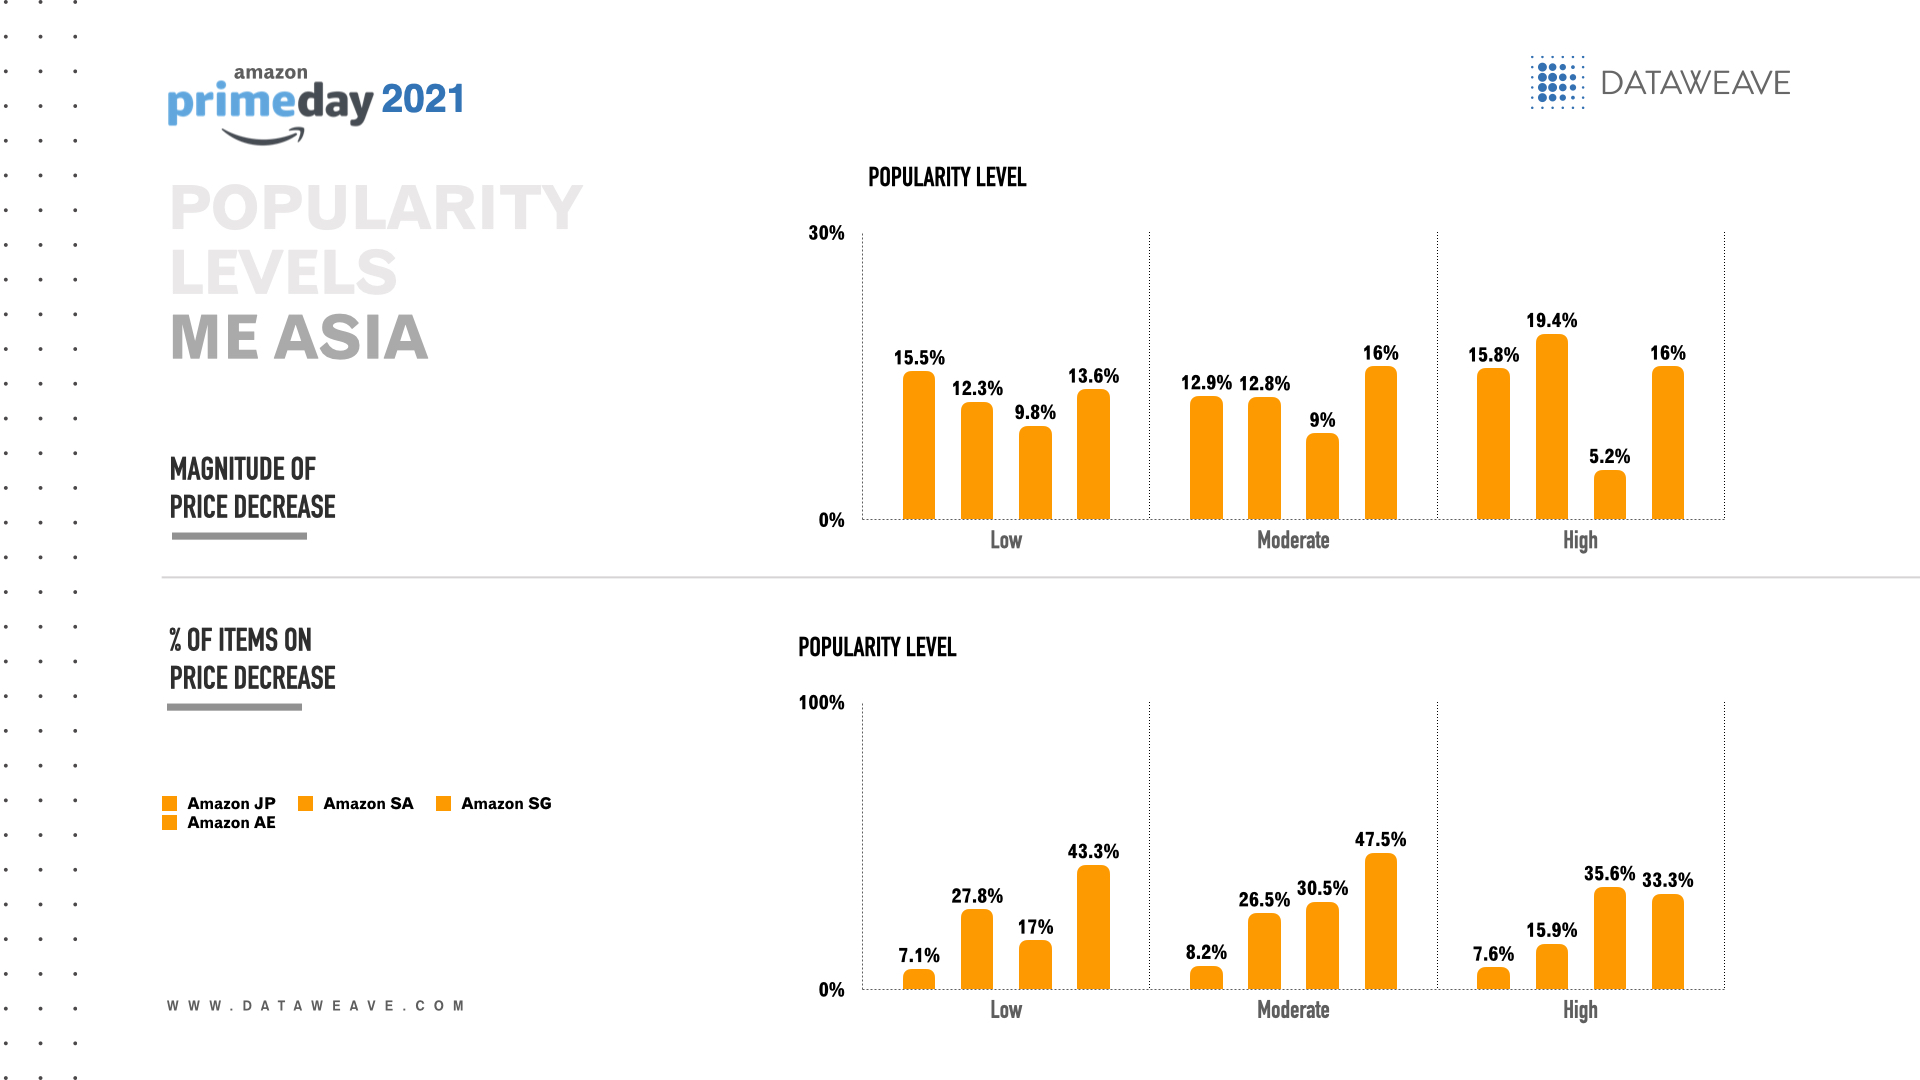
    Methodology

    • In addition to Amazon IN, we also tracked Flipkart on 23 & 24th July 2022, on Prime Day.
    • Categories tracked – Electronics, Grocery, Fashion & Beauty.
    • We looked at Additional Discounts offered on Prime Day: Additional Discount is the extra discount on an item during Prime Day when compared to the Pre-Prime Day price. 
    • We also looked at Post Prime Day Discounts, which were the discounts offered after the 2-day event ended.

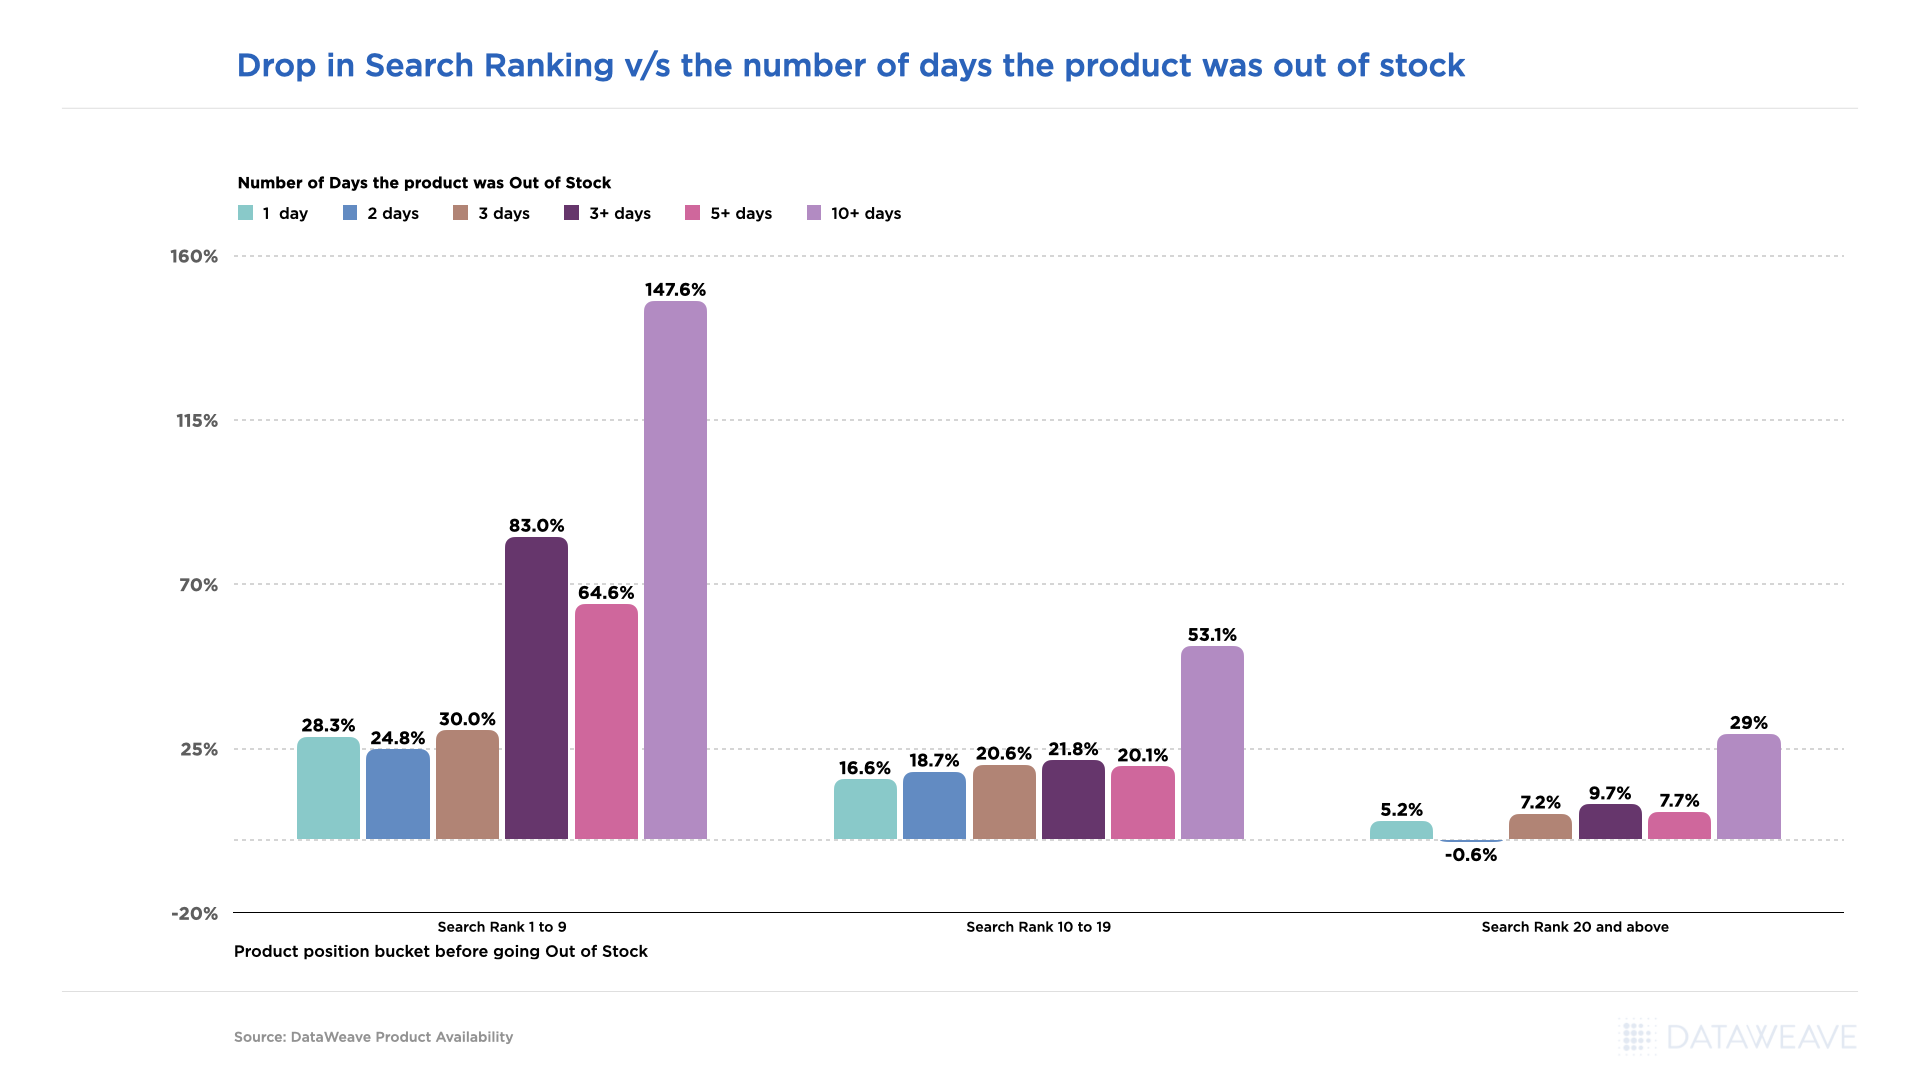
    Amazon v/s Flipkart – who offered better discounts?

    Prime Day discounts are legendary. And across the globe, during Prime Day retailers try and compete to see if they can offer better deals than Amazon. Forbes even published an article on the 36 Prime Day competitor sales that were way more enticing than what Amazon had to offer. In India, we wanted to see if Amazon’s homegrown rival Flipkart might give it a tough fight, so we tracked the volume of discounts across categories on both retailers. 

    Discounts on Amazon & Flipkart across categories
    Discounts on Amazon & Flipkart across categories
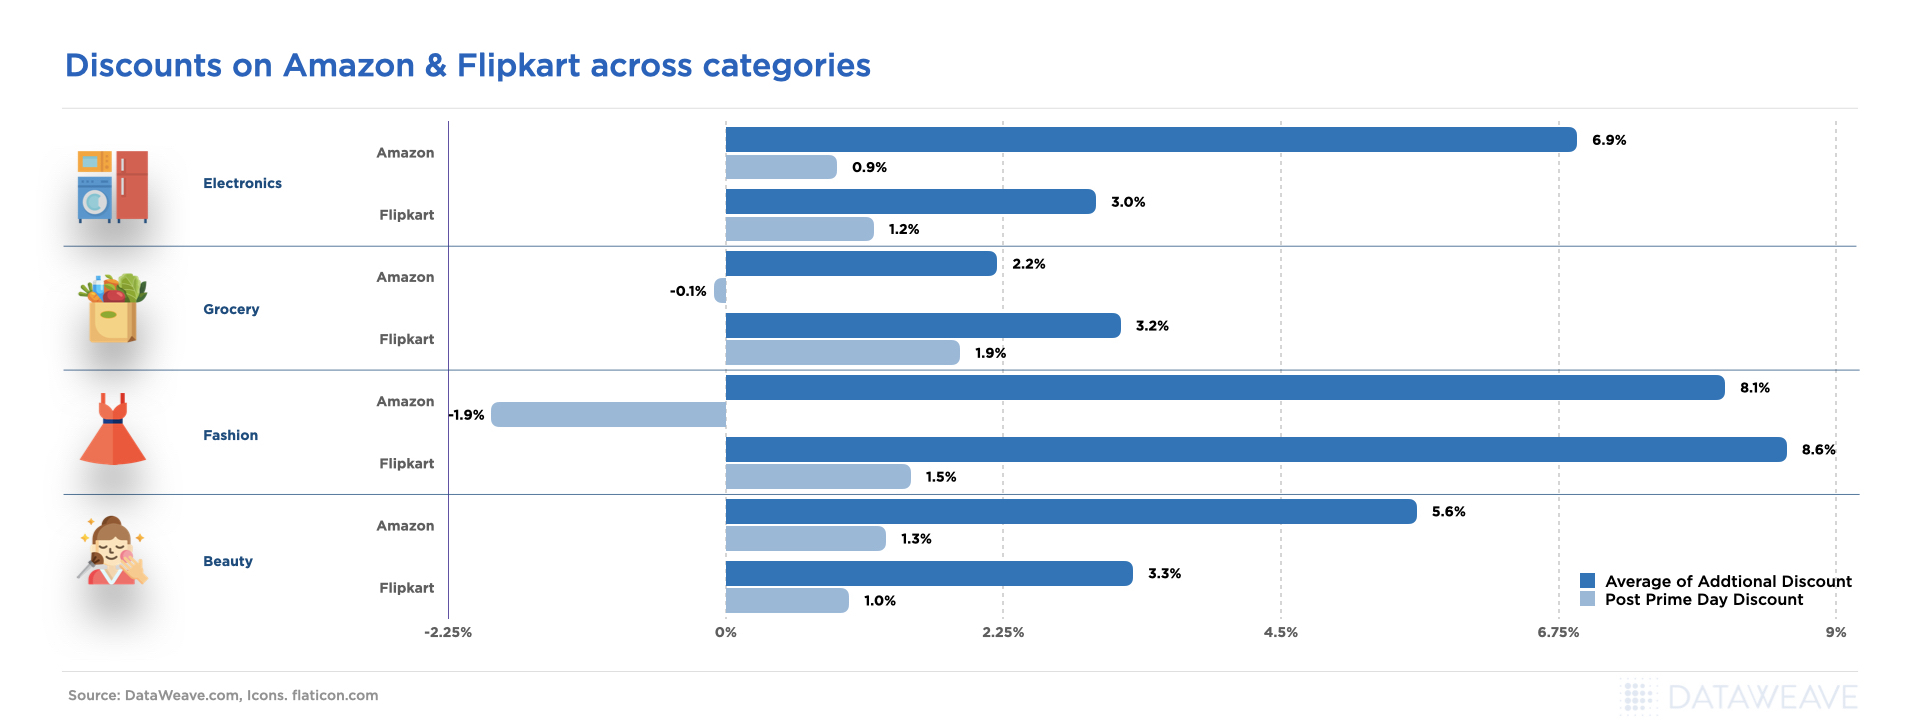
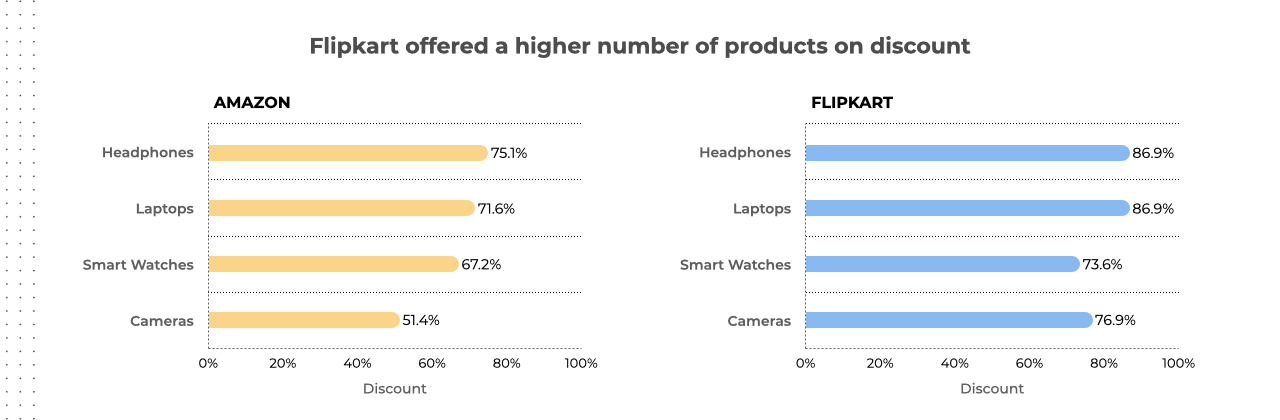
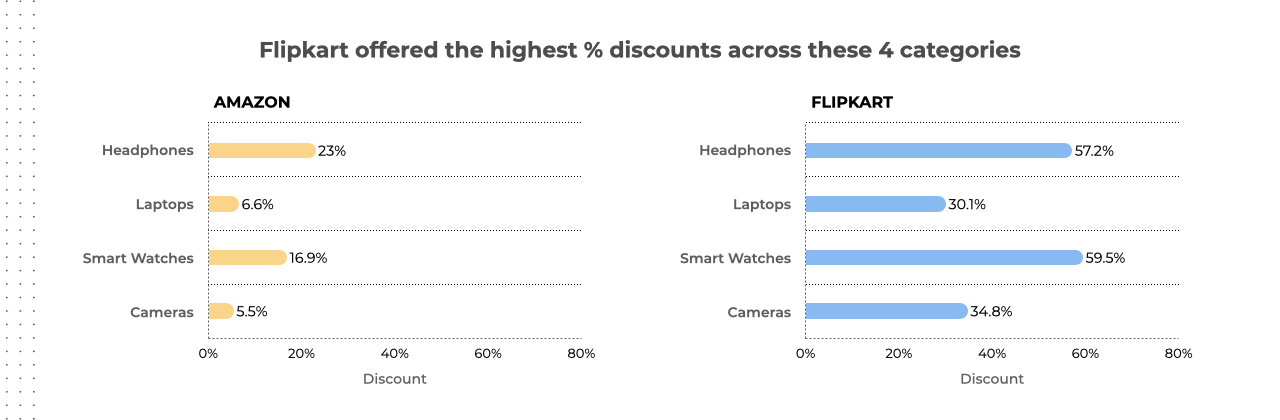
    • Out of the 4 categories we tracked, in spite of Prime Day, Amazon offered discounts higher than Flipkart in only 2 categories – Electronics & Beauty. 
    • … while Flipkart offered higher discounts than Amazon in the Grocery & Fashion category. For groceries, Flipkart offered a 3.2% additional discount v/s 2.2% on Amazon. However, in the Fashion category, the difference was marginal – 8.1% on Amazon v/s 8.6% on Flipkart
    • Post-event, both Amazon & Flipkart went back to the original pre-event prices. This made it clear that Flipkart was tracking and making price changes based on their closest competitor. It’s what smart eCommerce businesses do to stay ahead in the race. 
    • Interestingly, post-event, in the fashion category, not only did Amazon revert to the original pre-event price, they even increased prices by close to 2%.

    Let’s take a look at discounts across 4 categories & the Brands that WON in each category.

    From Electronics to Fashion, Beauty & Groceries, let’s deep dive into the data to see which products were highly discounted within each category and brands that sprinted ahead to win the race on Amazon on Prime Day 2022.

    ELECTRONICS

    Tech publication Gadgets360 reported on the biggest Smartphone deals right from Brands like Samsung, Redmi, Oppo, and more. There were some fab deals on earphones too with Boat taking the lead. We wanted to take a look at electronics on Amazon and see which products had the heaviest discounts & if discounts were more lucrative than Prime Day 2021

    Discounts on Electronics on Prime Day
    Discounts on Electronics on Prime Day
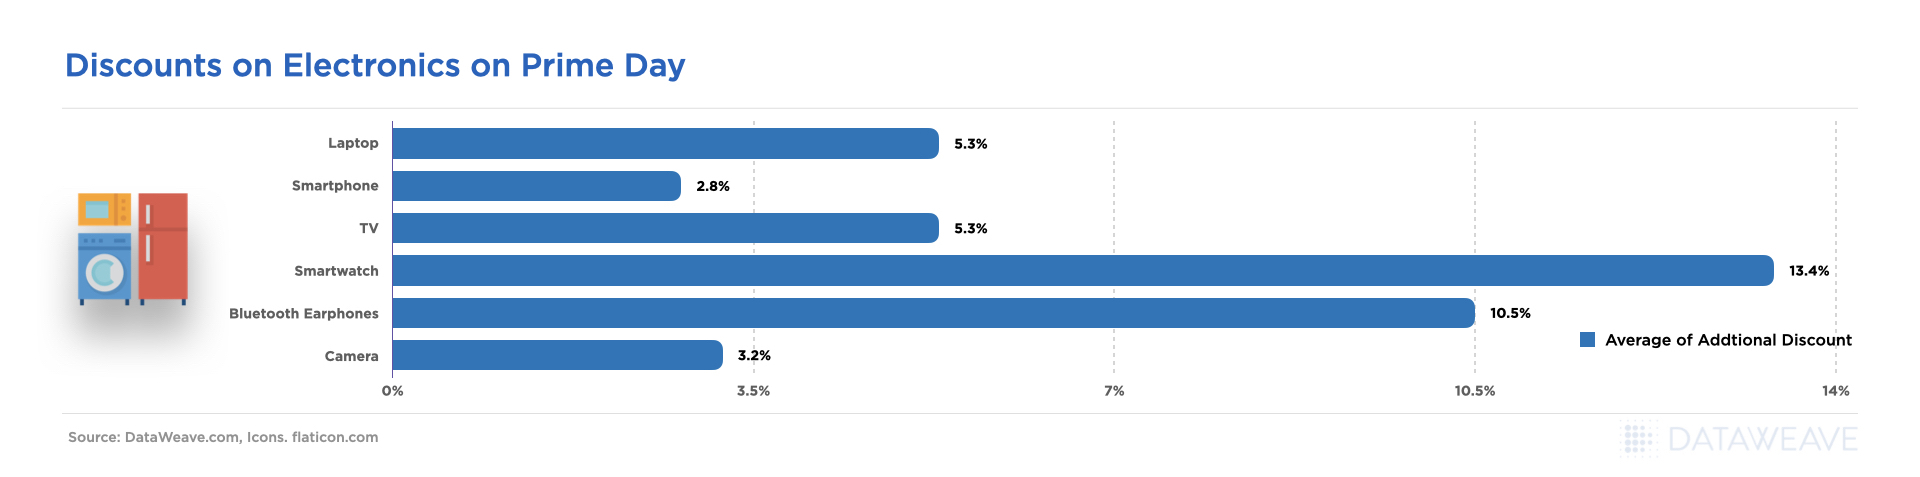
    • Amazon India released highlights from Prime Day and reported that Smartphones & Electronics were among the categories that saw the most success in terms of units sold.
    • From the 6 product categories we tracked within electronics, we saw the highest additional discounts on Smartwatches (13.4%), followed by Bluetooth headphones (10.5%)
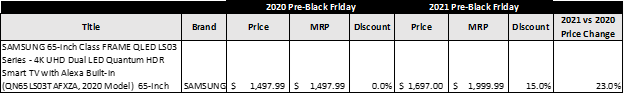
    • TV, Smartphones, cameras, and laptops had an additional discount of between 3 – 5.5%

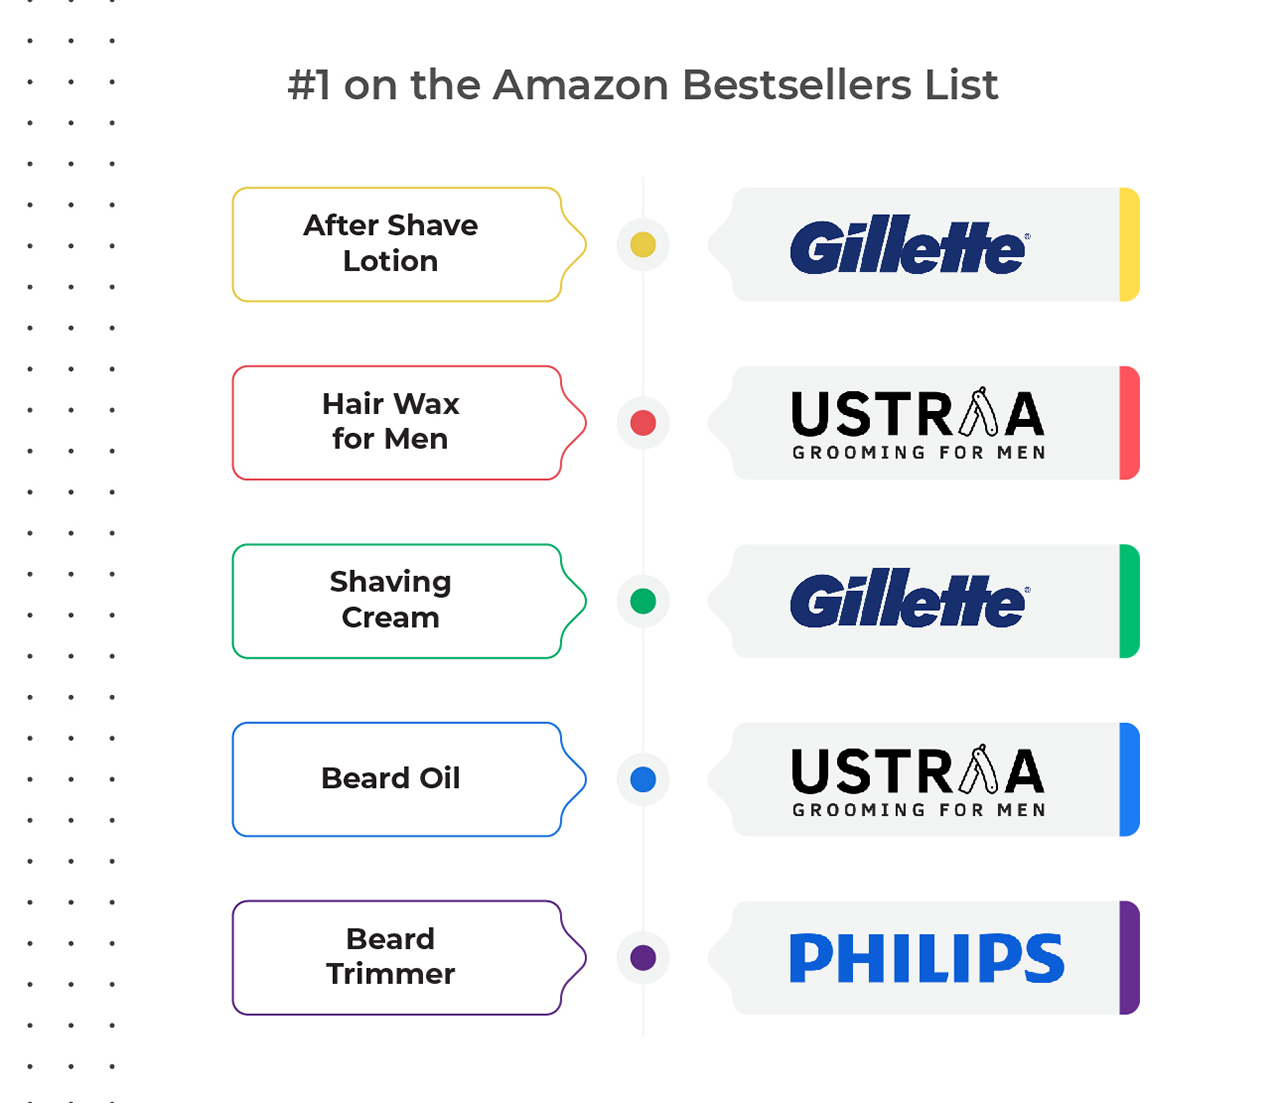
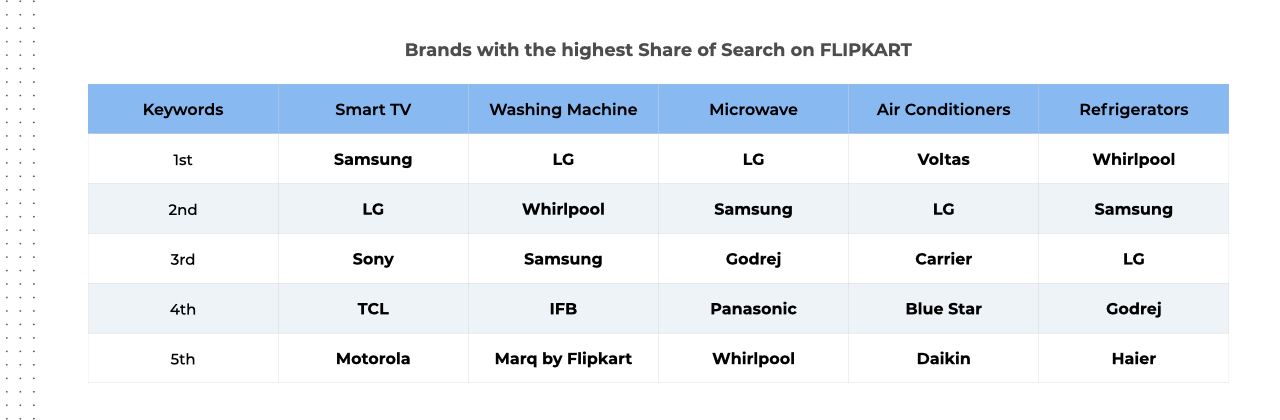
    ELECTRONICS Brands that had the highest Share of Search on Amazon during Prime Day

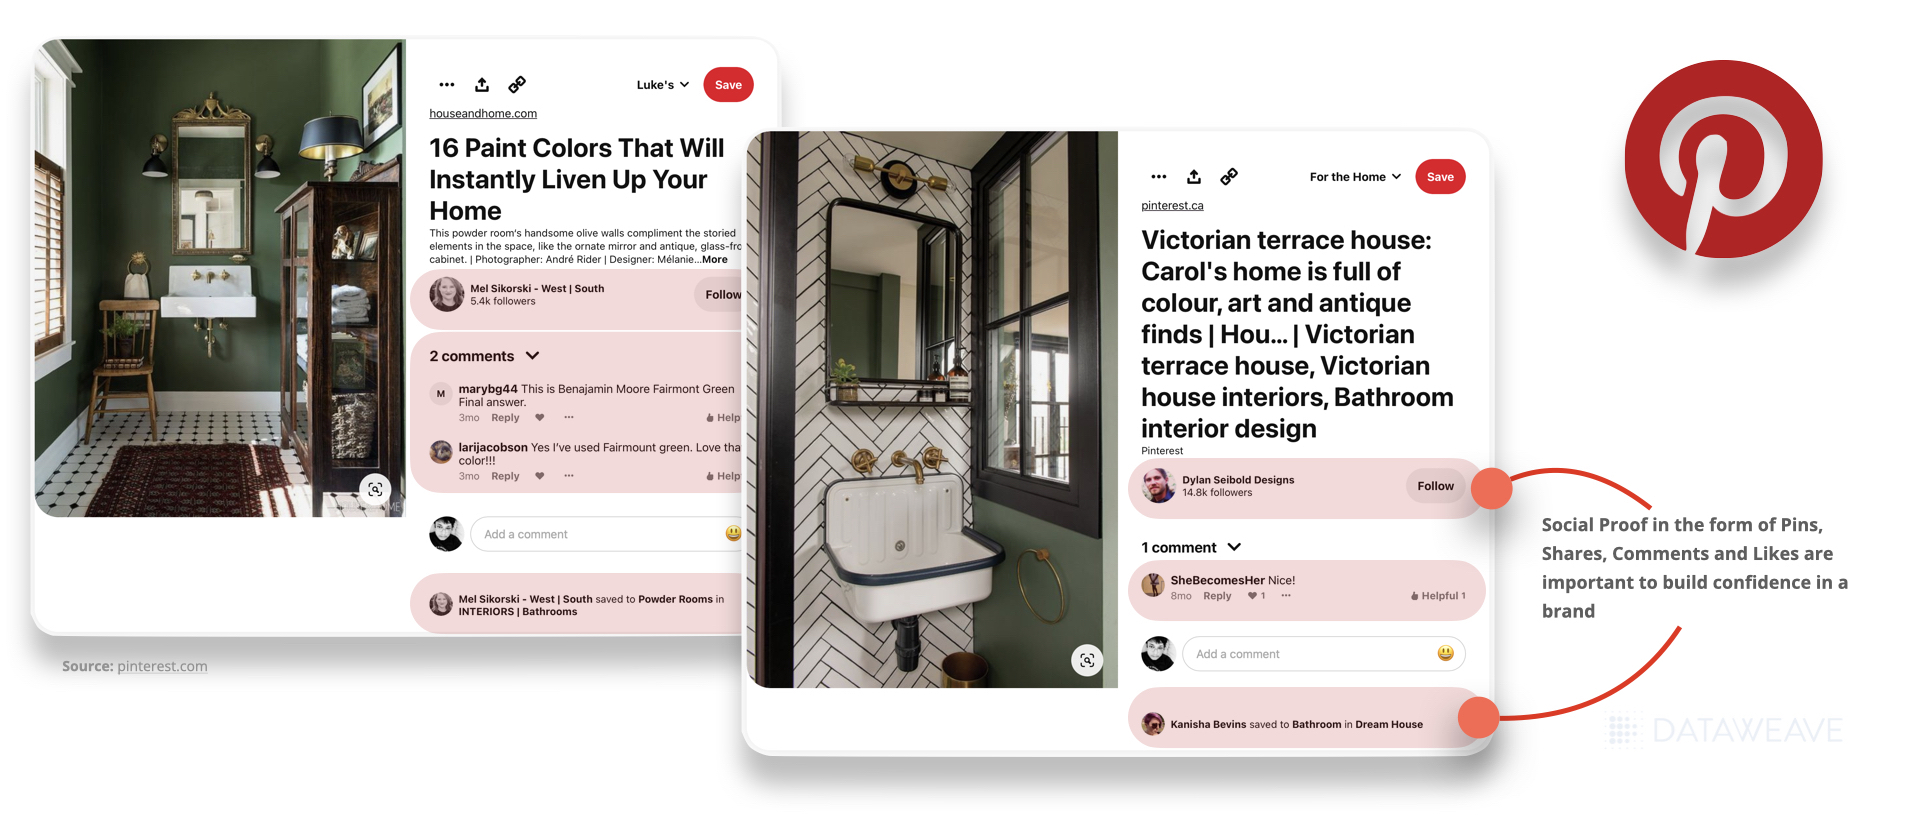
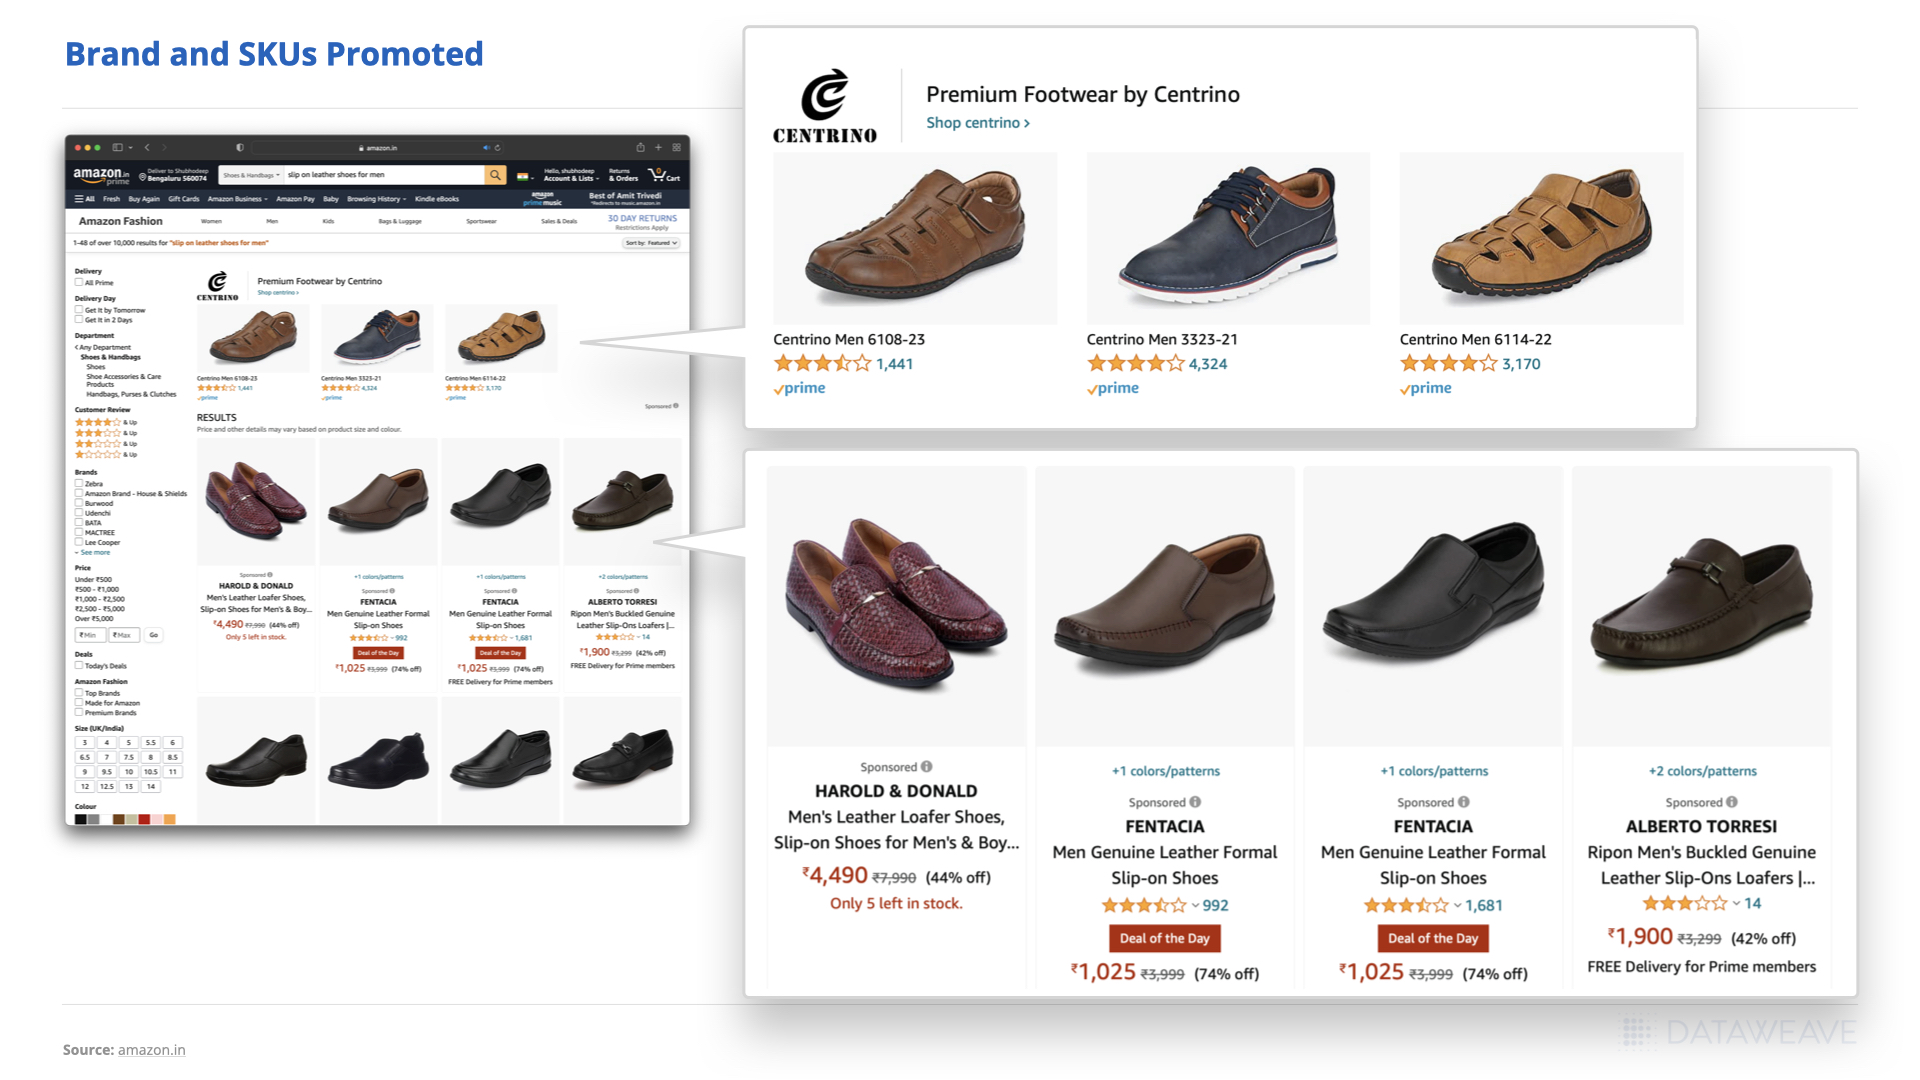
    Research shows that on Amazon, the first 3 products garner 64% of business generated. This is why it is critical for brands to appear in the top few listings when consumers are searching for products. Being on top helps shoppers find your brand with ease & increases the chances of a sale. 

    On Prime Day 2022, Amazon India reported that the top-selling consumer electronics brands were HP, Lenovo, Asus, and Boat to name a few. Our assumption is, these brands must’ve had a high Share of Search (SoS), which played a massive role in increasing sales, so we looked into our data to see which brands had the highest SoS against specific keywords related to electronics. 

    Brand Visibility against the Keywords
    Brand Visibility against the Keywords
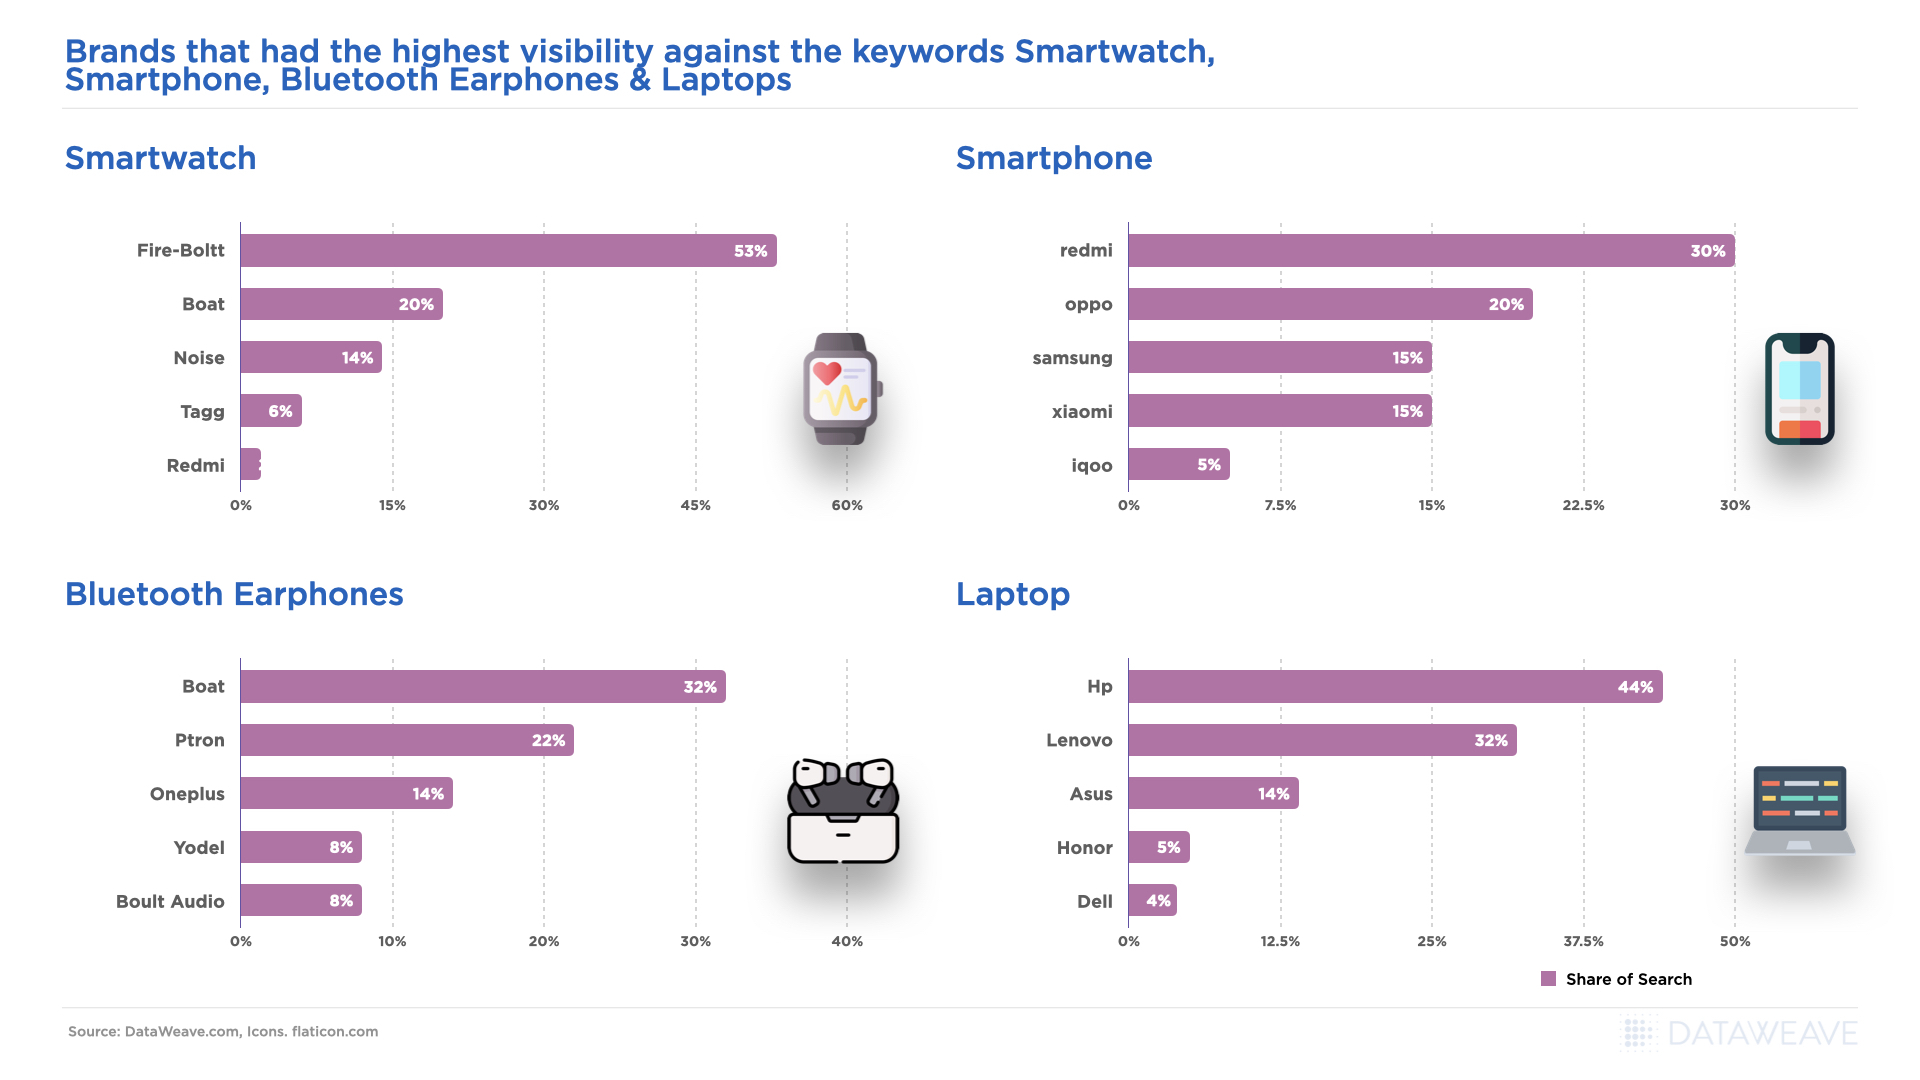
    • Our data aligned with what Amazon reported. HP had high sales, perhaps because they occupied the premium #1 spot in the laptop category with a 44% SoS! Simply put, this means of the 100 laptops that appeared on a page, against a search for the keyword laptop, 44 products were listed by HP! Consumers always gravitate towards buying products they can find with ease
    • Lenovo had a 32% SoS for Laptops. Asus at 14% 
    • The top selling smartphone brands reported by Amazon included OnePlus, Redmi, Samsung, Realme & iQOO – our data showed that 3 out of these 5 brands were in the top 5 listings on Prime Day! Redmi had a whopping 30% SoS against the keyword smartphone, Samsung at 15%, and iQOO at 5% – clear validation that a high SoS can positively impact sales.
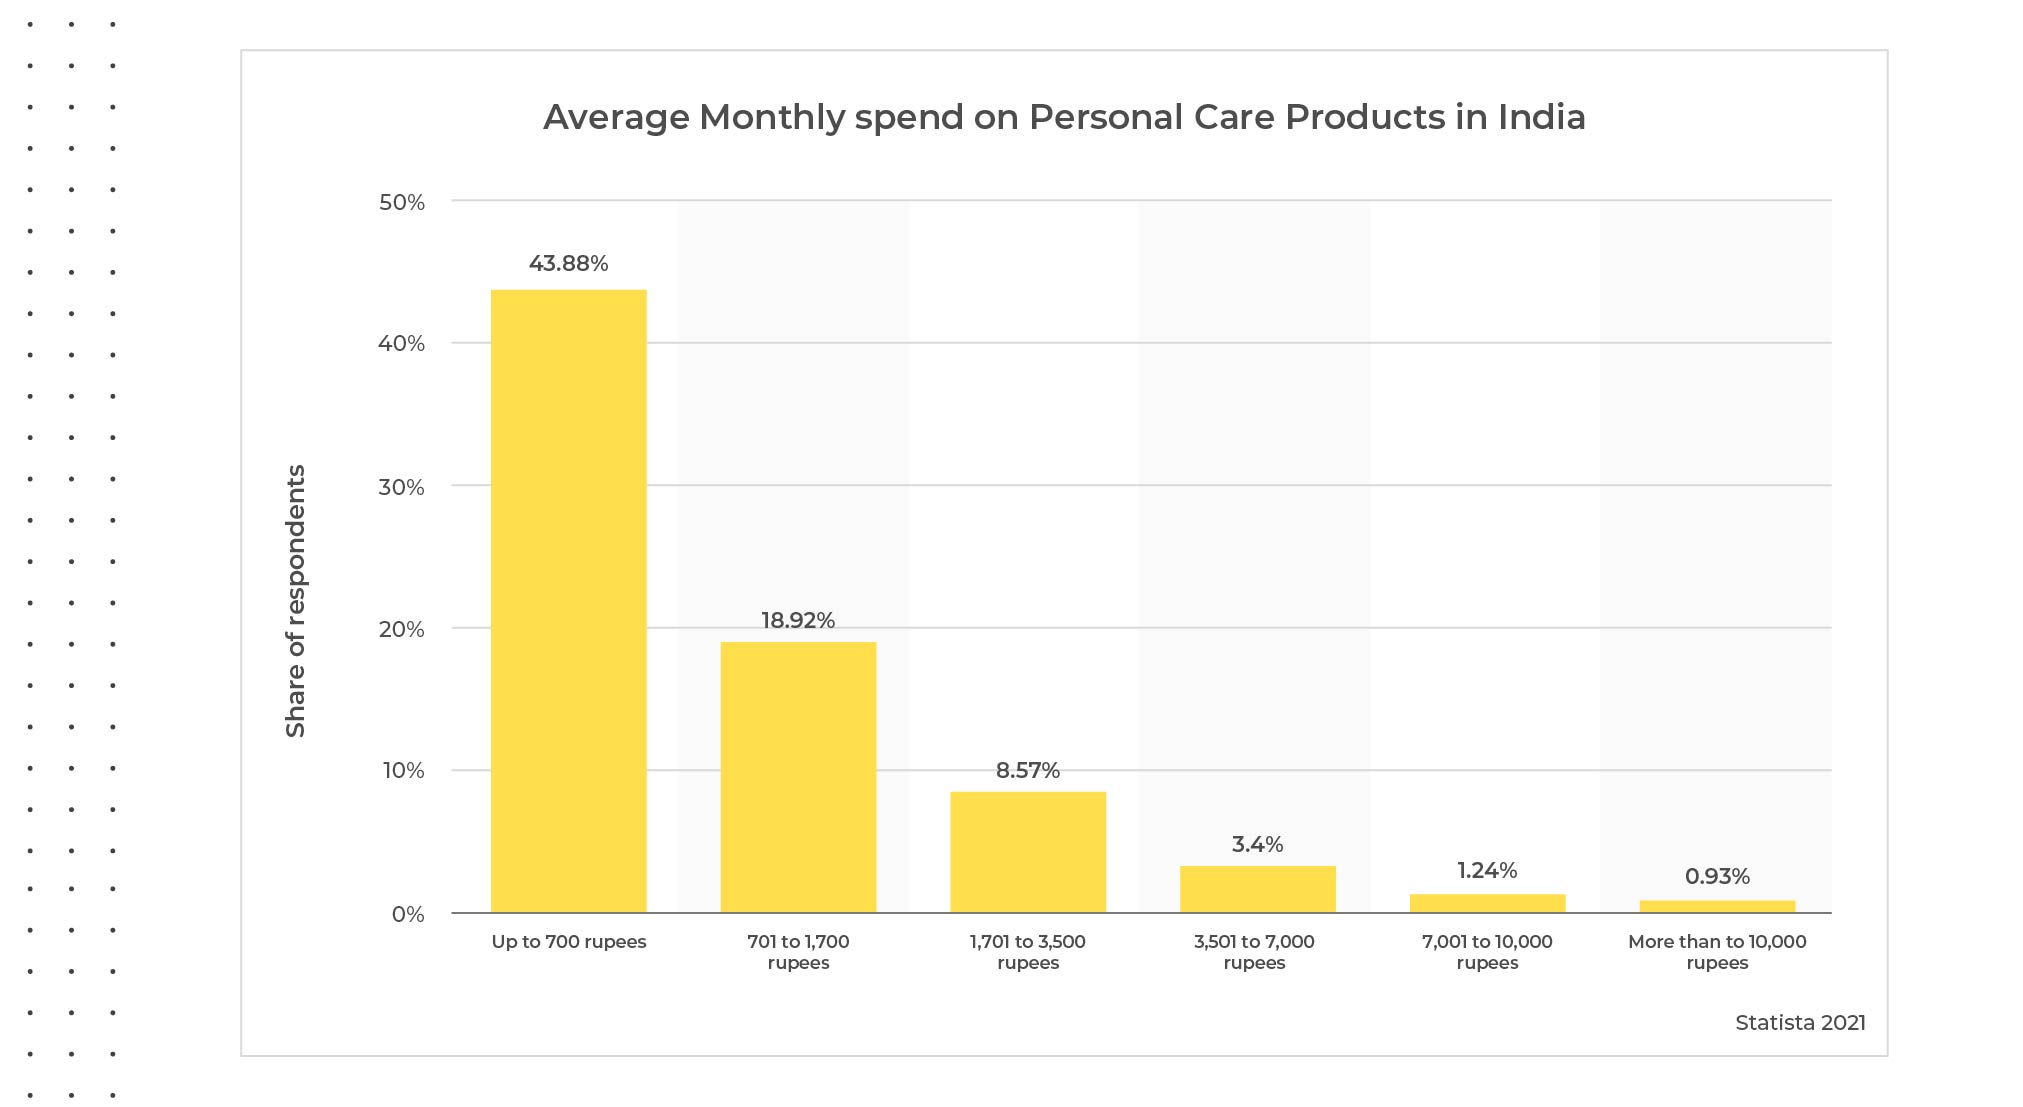
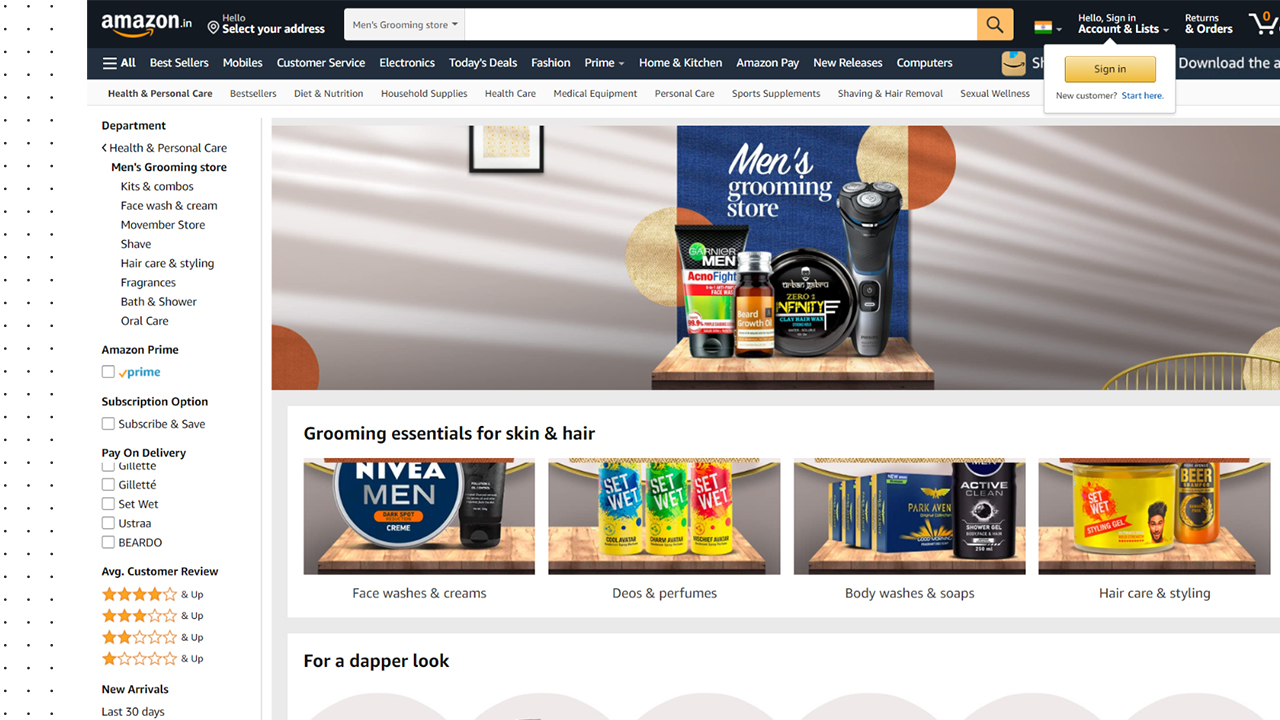
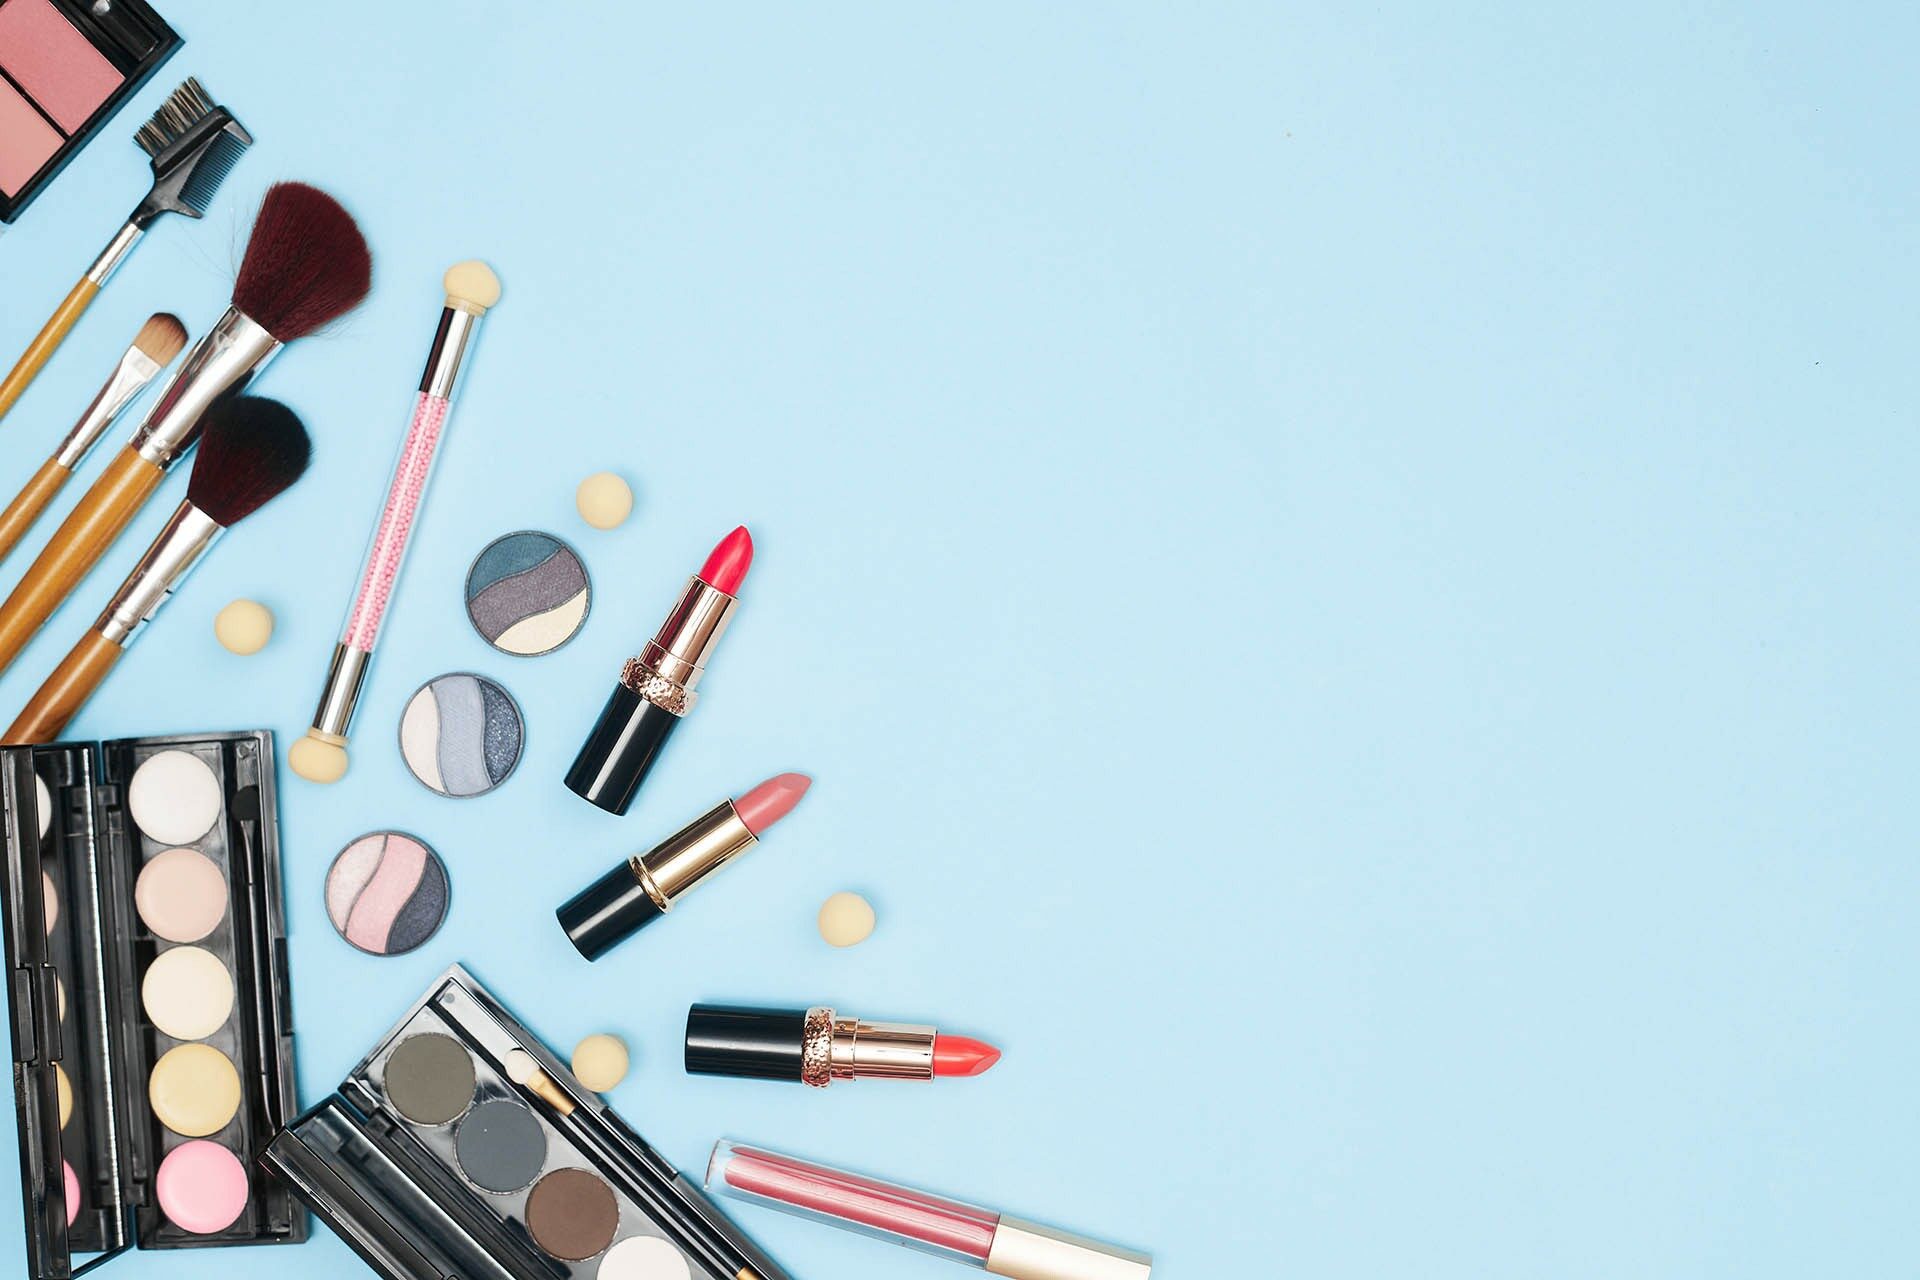
    BEAUTY & GROOMING

    Now let’s look at discounts in the beauty & grooming category. 

    Discounts on Beauty Products on Prime Day
    Discounts on Beauty Products on Prime Day
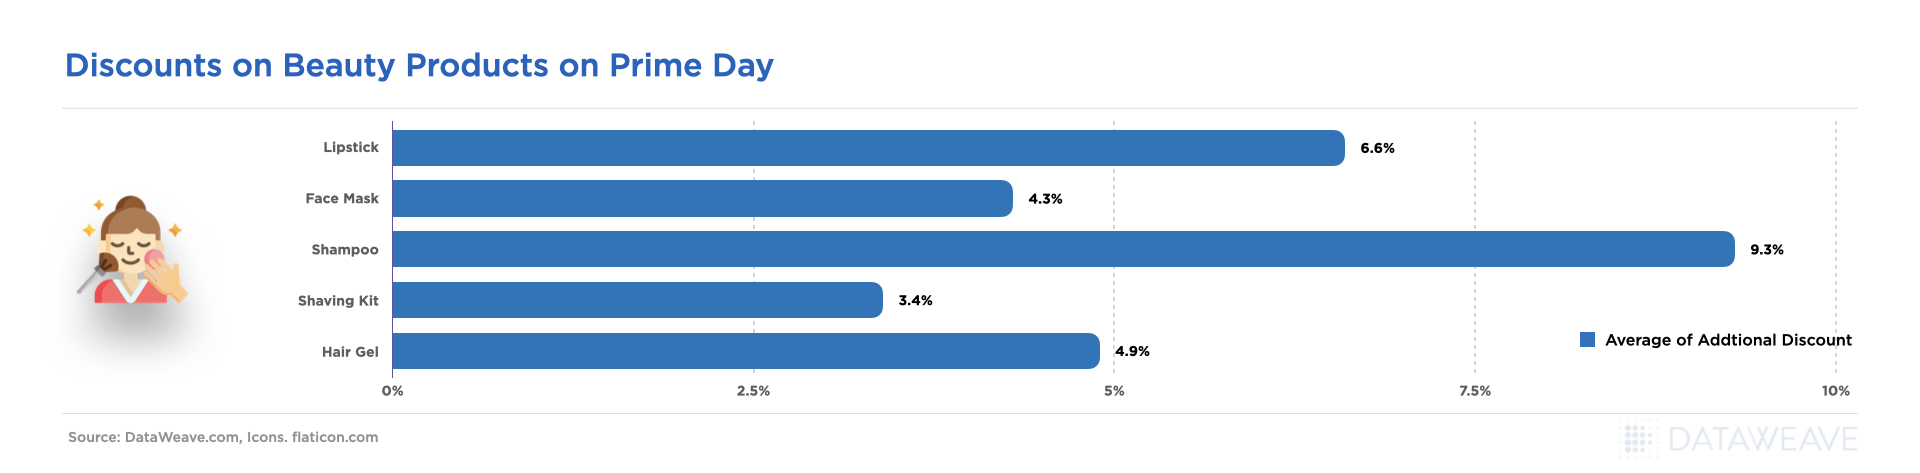
    • The highest additional discounts were given on shampoos (9.3%), followed by Lipsticks (6.6%)
    • Shaving kits for men were at an additional discount of 3.4%. Hair gel at 4.9% & Face Masks at 4.3%

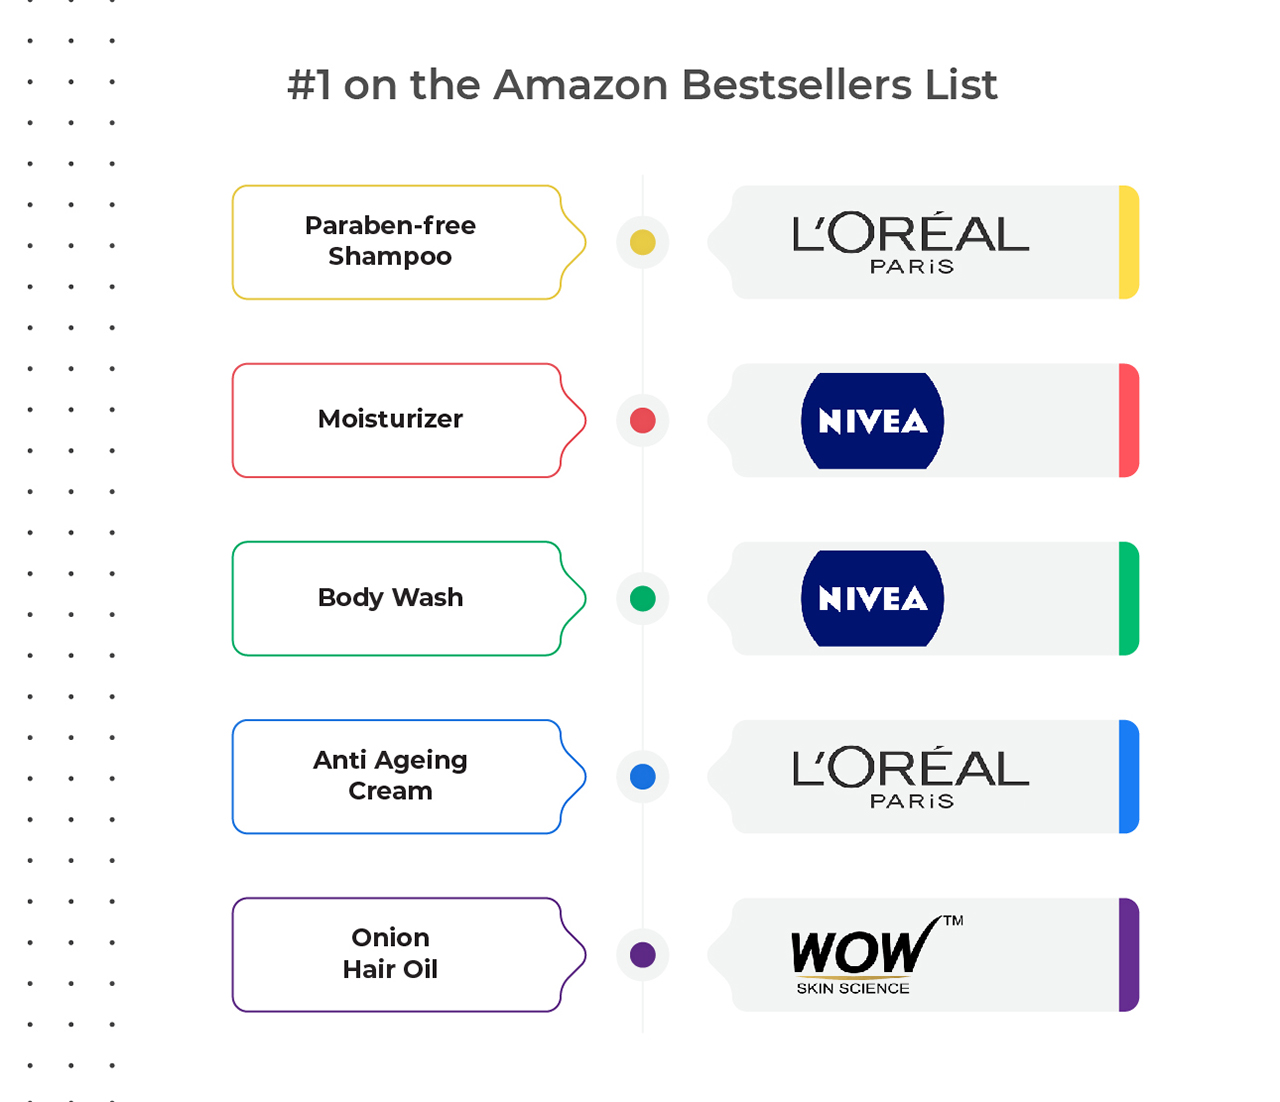
    BEAUTY Brands that had the highest Share of Search on Amazon during Prime Day

    Brand Visibility against the Keywords
    Brand Visibility against the Keywords

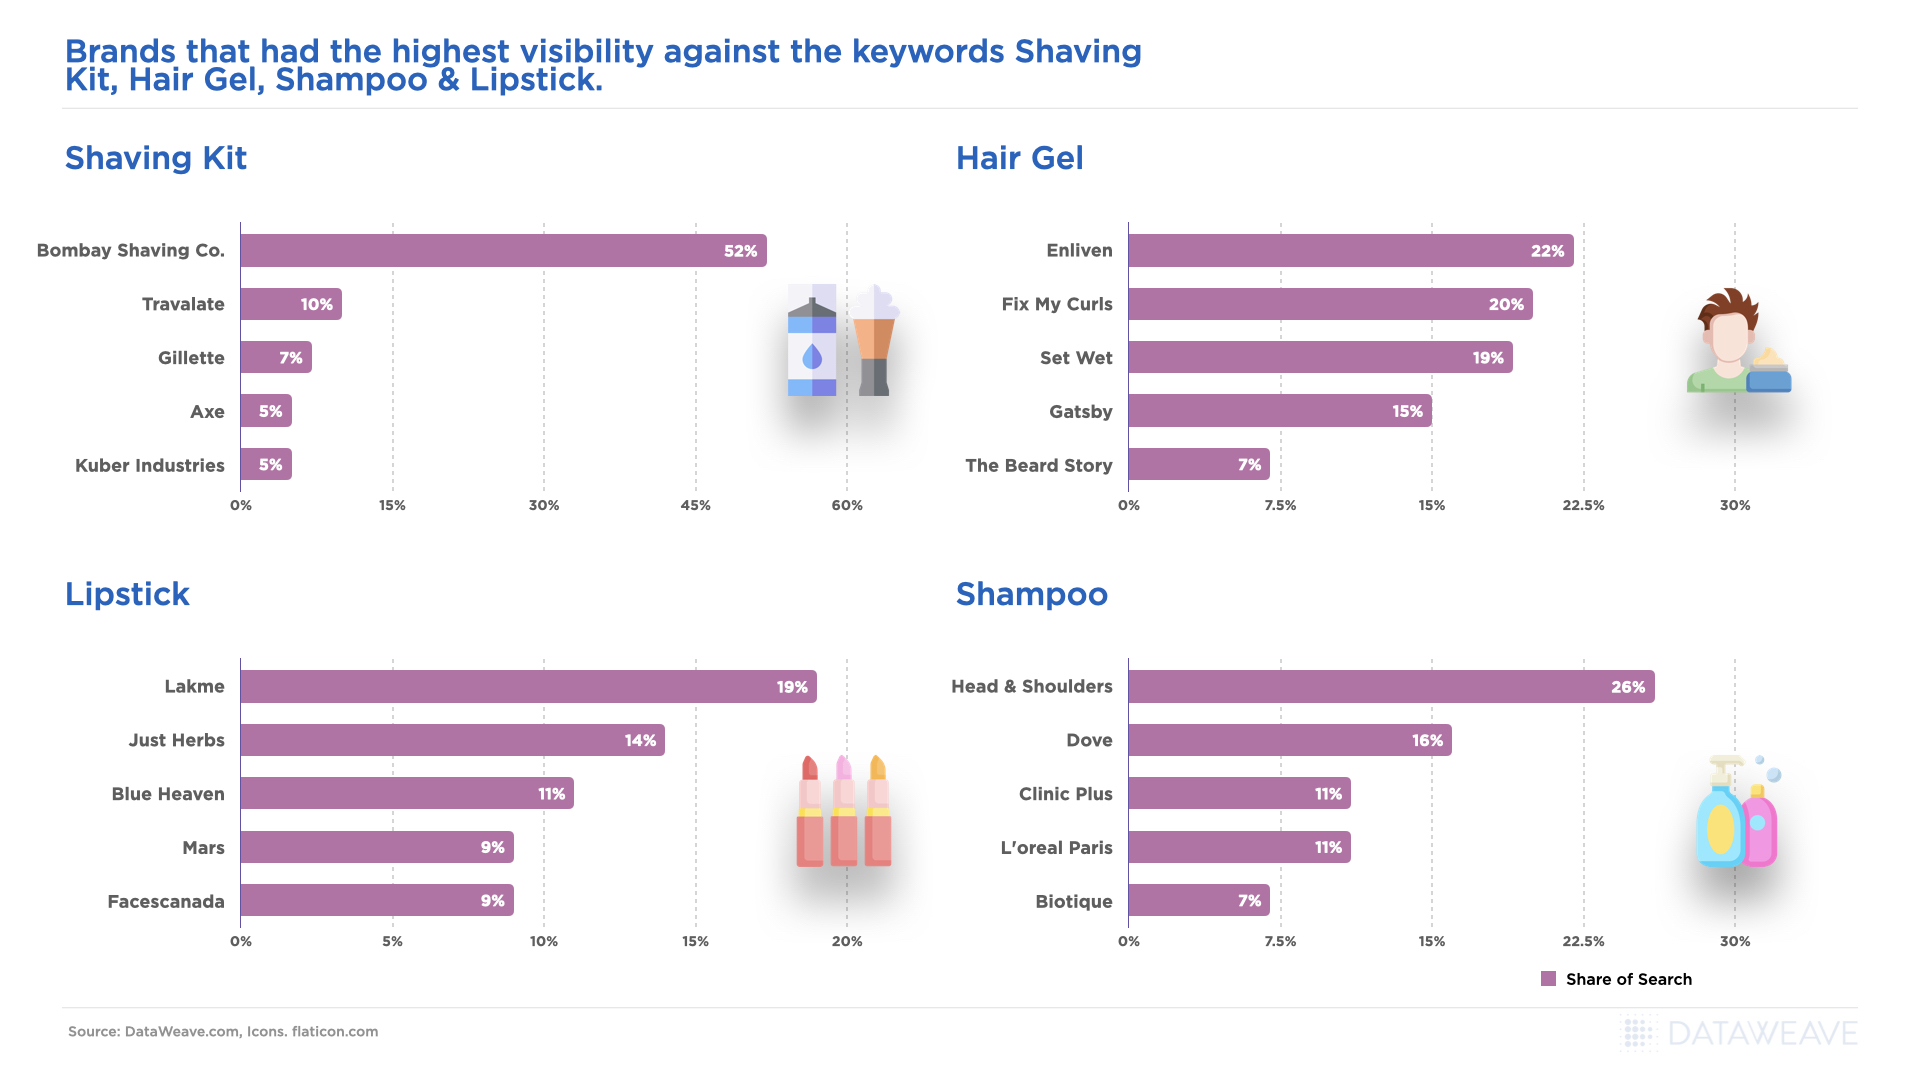
    In the beauty category, Amazon India reported that top-selling brands included Head & Shoulders, Dove, Biotique, L’Oreal, Sugar Cosmetics, and Mamaearth to name a few. Once again, we looked into our data to see the sort of brand visibility & SoS each of these brands had.

    • All the top-selling brand’s Amazon reported on we noticed appeared in the top 5 search results. 
    • Head & Shoulders & Dove were the top 2 listings against the keyword Shampoo at 26% & 16% SoS respectively. Biotique came in at #5 with a 7% SoS
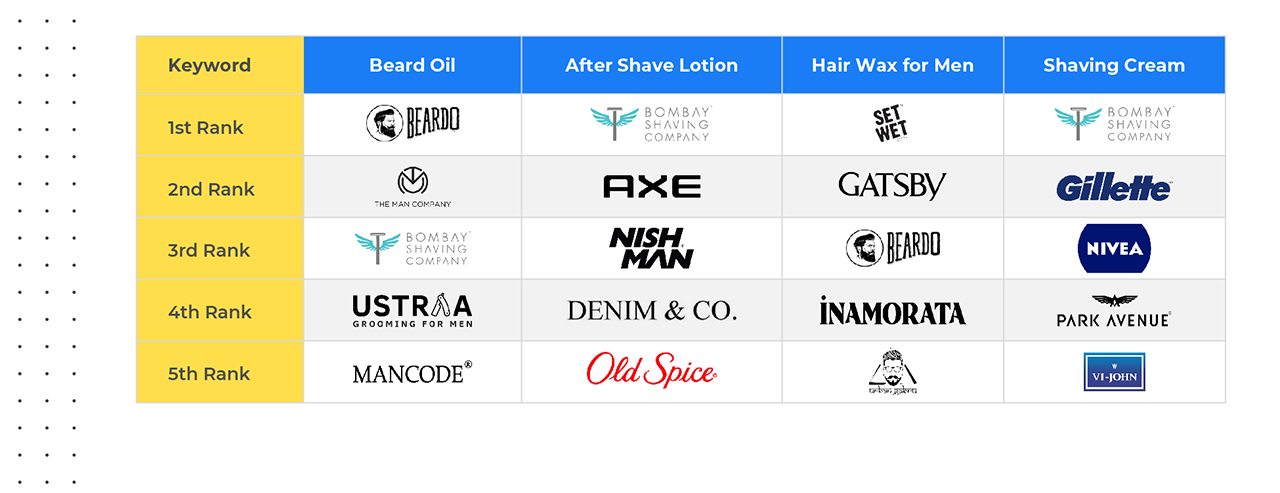
    • Bombay Shaving Company, Gillette, and Axe were the top grooming brands for men in the Shaving Kit category. 
    • Lakme made a clean sweep with a 19% SoS against the keyword lipstick, which speaks volumes, considering the aggressive competition from D2C beauty brands in India today.
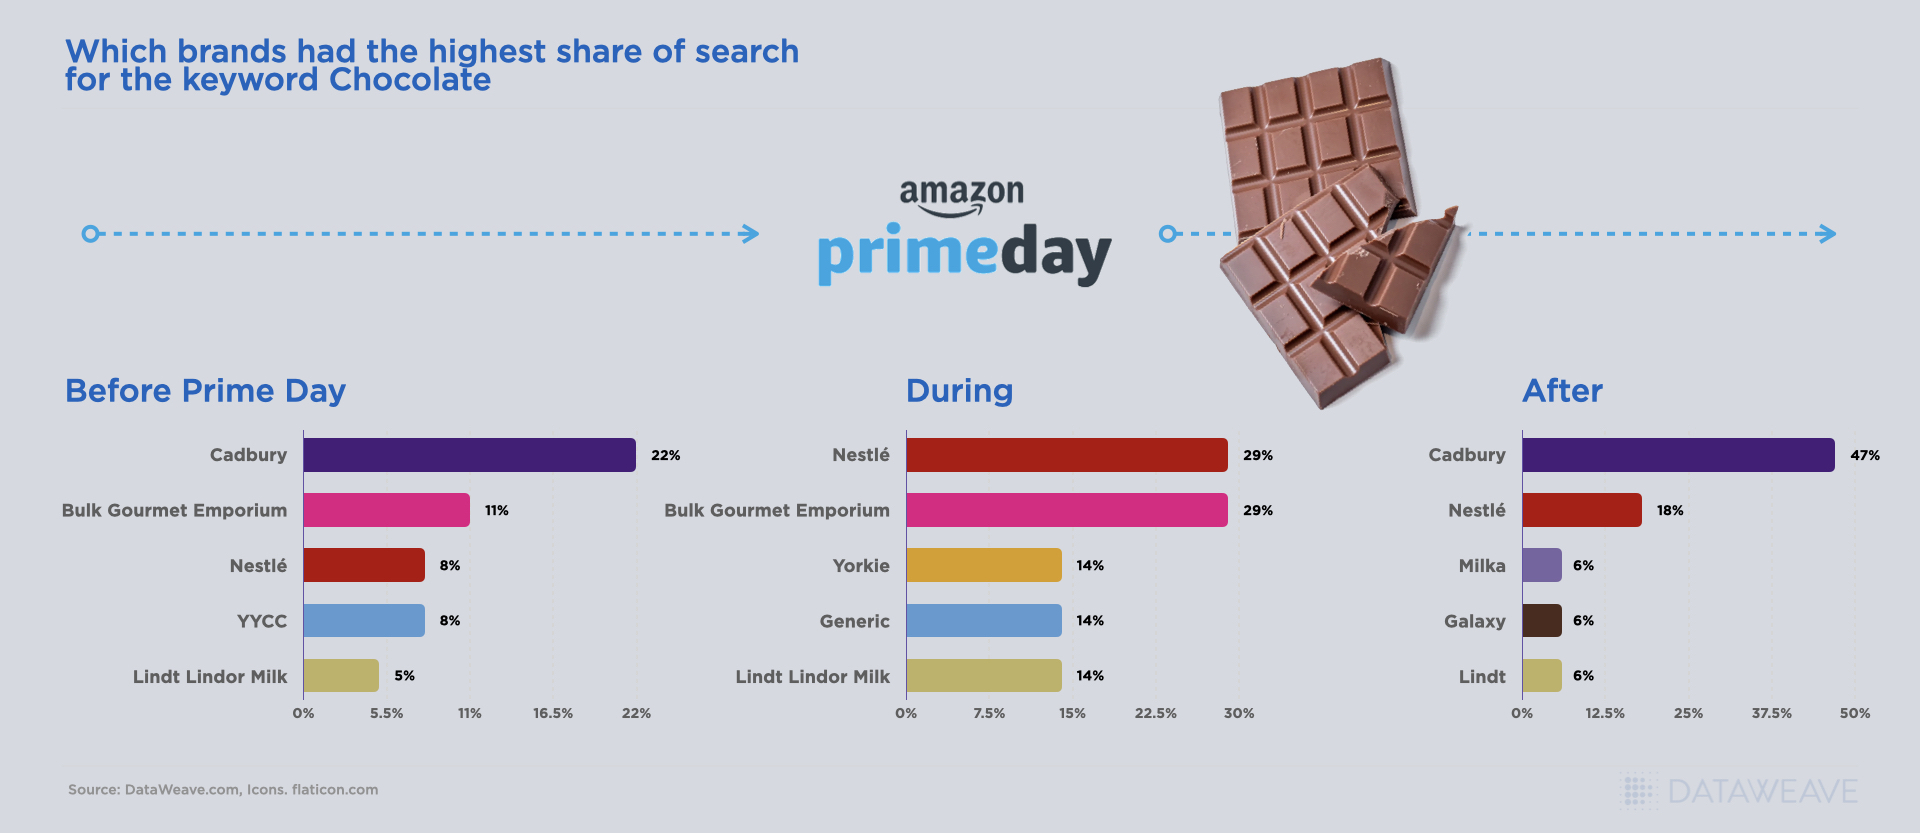
    GROCERY

    According to the New eCommerce in India report by consulting firm Redseer, grocery has been a major contributor to the growth of ecommerce in India & Amazon Fresh used Prime Day to grab a larger piece of that pie! As part of the Prime Day sale, Amazon Fresh also pushed discounts on groceries, as well as fruits and vegetables. We tracked products that fell into the “snack” category, and here’s what we saw.

    Discounts on Snacks on Prime Day
    Discounts on Snacks on Prime Day
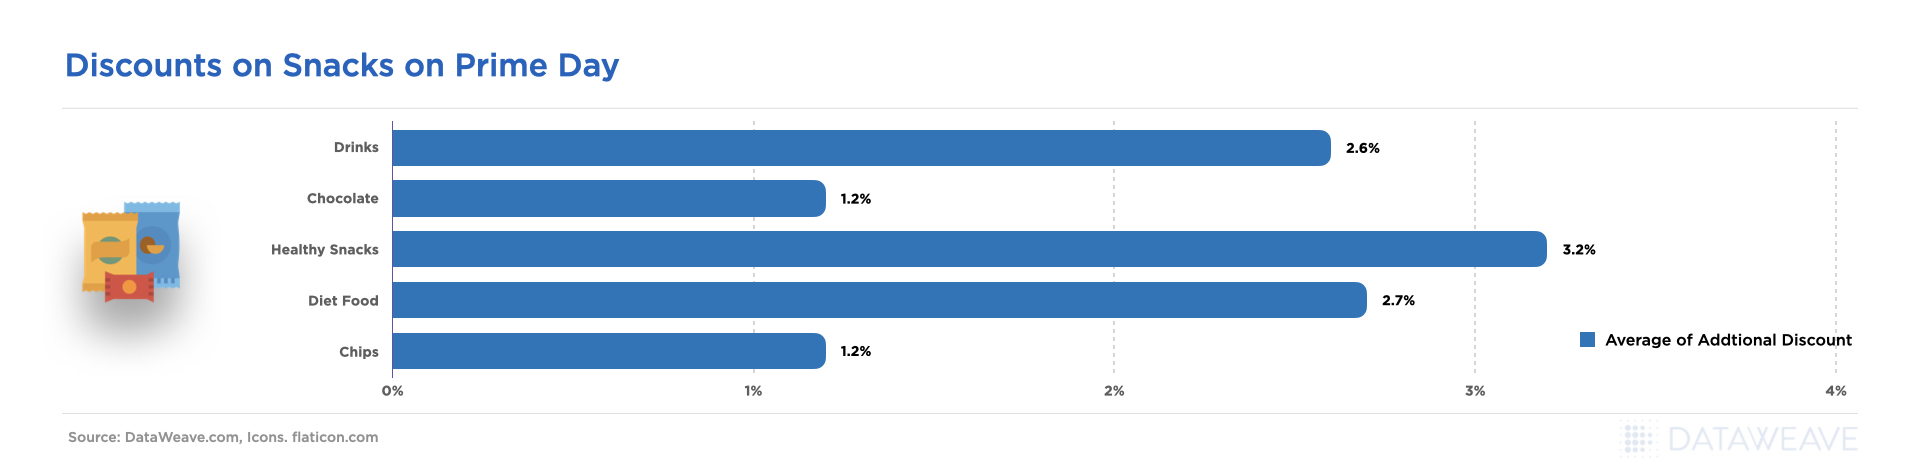
    • Given changing lifestyles & healthy food fads, it was no surprise that we saw the highest additional discounts were given on Healthy Snacks (3.2%) & Diet Food (2.7%)
    • Chocolates and chips saw much lower additional discounts at 1.2% each.
    • Drinks were additionally discounted by 2.5% during Prime Day.

    SNACK Brands that had the highest Share of Search on Amazon during Prime Day

    Brand Visibility against the Keywords
    Brand Visibility against the Keywords
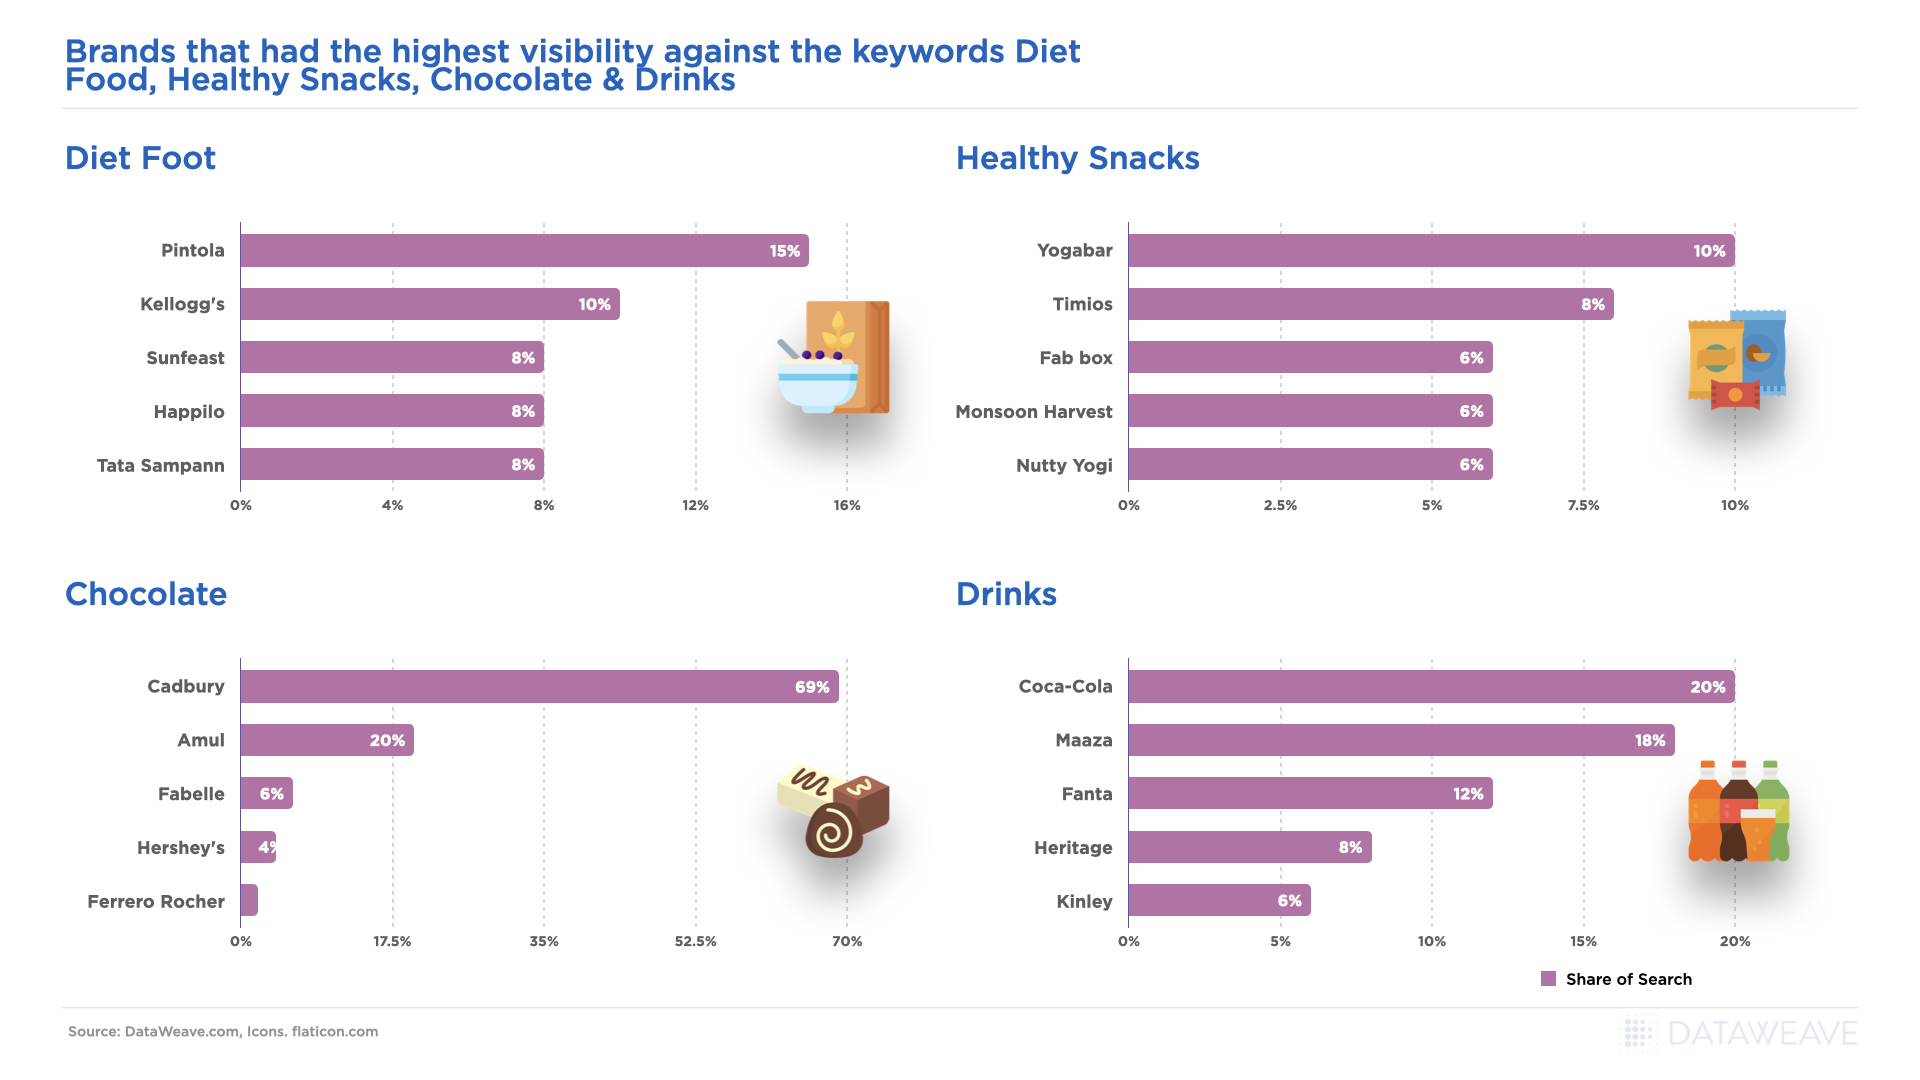
    • Cadbury had a 69% share of search against the keyword Chocolate, leaving some of its key competitors way behind. Amul had a 20% SoS, while Hershey’s was at just 4%. 
    • According to an article in the Economic times, YogaBar tripled sales in FY22, which is why we were not surprised to see the brand at #1 when users were searching for “Healthy Snacks” during Prime Day. YogaBar products typically enjoy high visibility year-round, which clearly helped with brand awareness on Amazon & sales.

    FASHION

    Amazon reported that Men’s t-shirts and polos, denims, Kurtis, tops, and dresses for women, designer wear, and clothing for kids were some of the most-loved fashion categories on Prime Day. We looked into our data to see the trends that emerged.

    Discounts on Fashion on Prime Day
    Discounts on Fashion on Prime Day
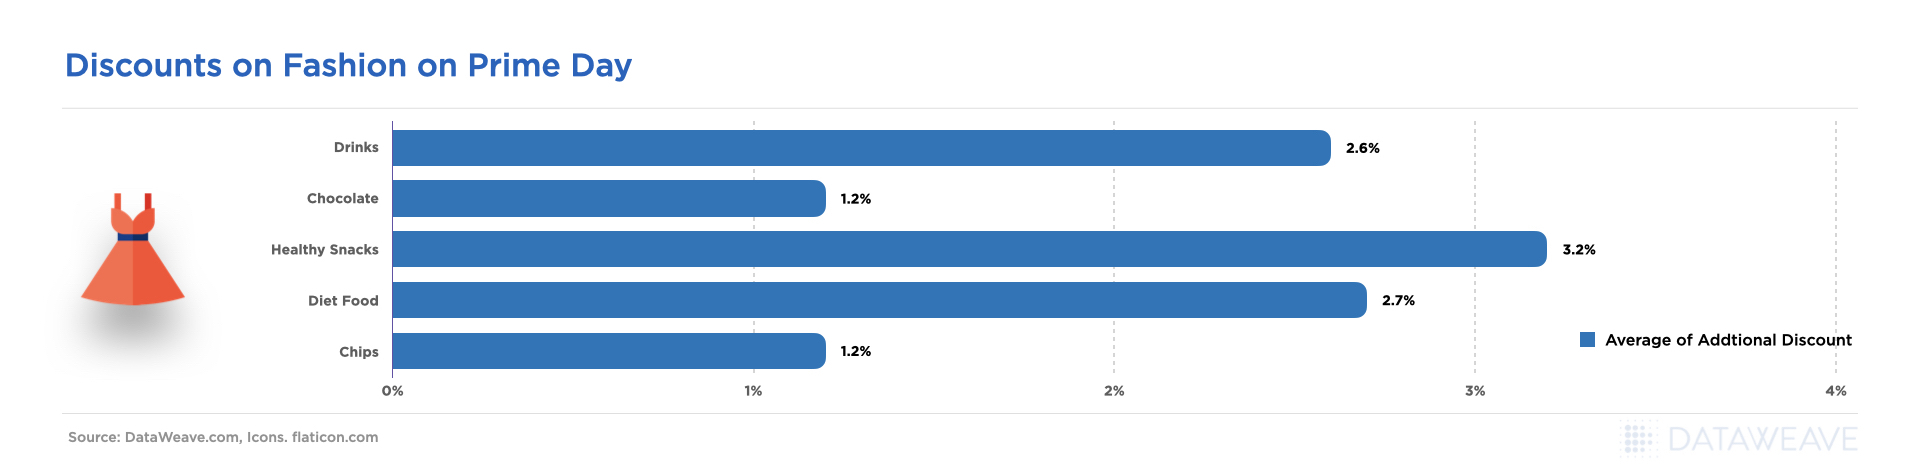
    • From the categories we tracked, women’s handbags had the highest additional discount (11.8%), followed by watches (9.1%)
    • Sneakers & jeans had additional discounts in the ballpark of 7% and sunglasses at 4.4%

    FASHION Brands that had the highest Share of Search on Amazon during Prime Day

    Brand Visibility against the Keywords
    Brand Visibility against the Keywords
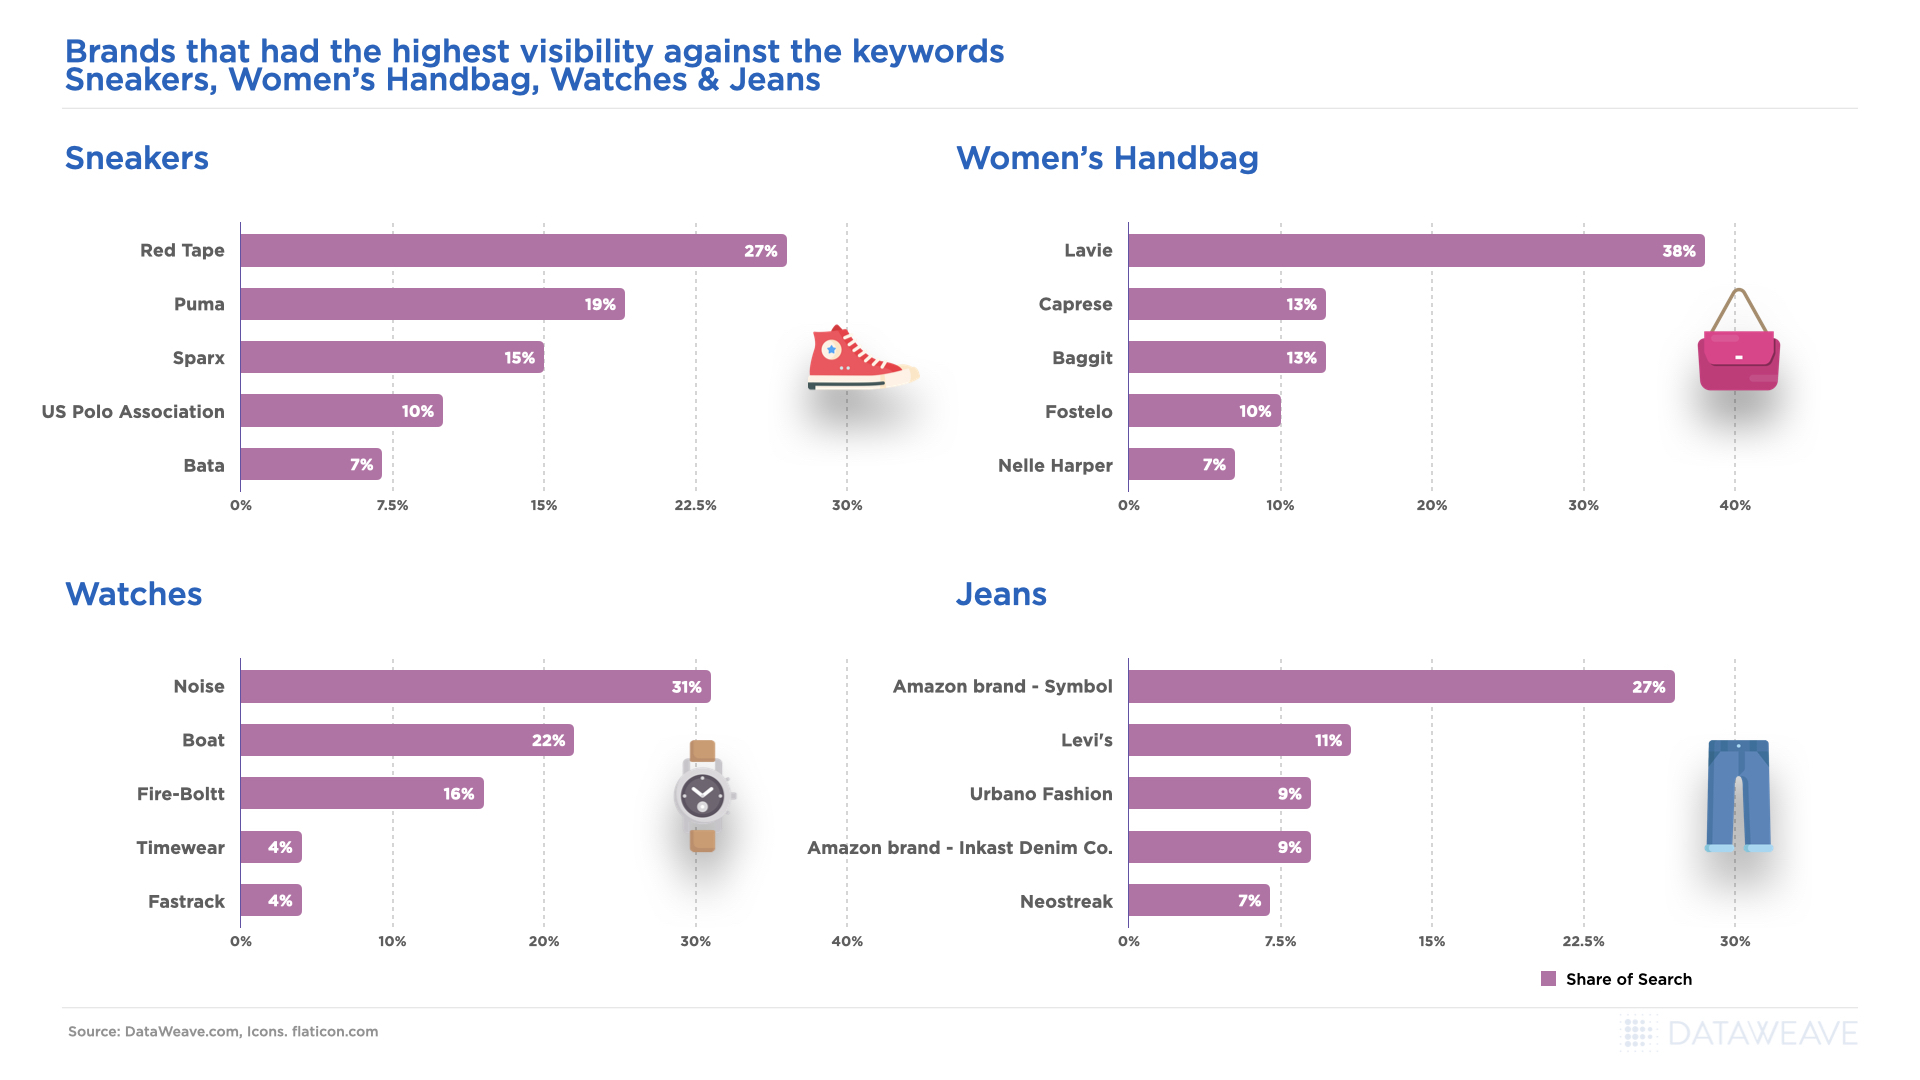
    • Some of the usual suspects made it to the top 5, but what really stood out for us were brands that popped up against the keyword Jeans. While Levi’s came in at #2 with an 11% SoS, 2 Private Label Amazon brands featured in the top 5! Symbol at 27% SoS and Inkast Denim at 9%
    • Against the keyword Handbag, Lavie had a massive lead at 38% v/s the #2 brand – Caprese, at 13%
    • Boat found a #2 spot against the keyword watches, racing way ahead of the age-old popular brand Fastrack at #5 with a 4% SoS.

    Conclusion

    Amazon Prime Day 2022 in India came to a successful close as shoppers across India discovered the joy of the 2 day celebration with the best deals, savings, new launches, and more. Prime members from 95% of pin codes in India made purchases, there were 1000’s of deals and 500+ new product launches from brand partners & sellers. Nearly 18% more sellers grossed sales over INR 1 crore, and close to 38% more sellers grossed sales of over 1 lakh vs Prime Day 2021. Local neighborhood shops that sell on Amazon witnessed 4x sales growth. And start-ups and brands under the Amazon Launchpad program witnessed a growth of 3x. All in all, a successful event for everyone involved! 

  • Prime Day Germany 2022 – highlights from the 2 day annual shopping festival!

    Prime Day Germany 2022 – highlights from the 2 day annual shopping festival!

    In 2022, Amazon sold 300 million products during Prime Day – selling roughly 100,000 items per minute. Since Amazon started Prime Day in 2015 to celebrate its 20th birthday, the shopping festival has grown into a holiday and rivals Black Friday and Cyber Monday in the U.S. and Singles’ Day in China. 

    According to RetailDetail, the leading B2B retail community in Benelux, Amazon is planning a 2nd Prime Day shopping festival in the autumn, just a few months after its annual Prime Day event. The retailer has asked its sales partners to prepare for a promotional event in the autumn where they have until the beginning of September to propose attractive discounts, with at least 20% discounts. This year’s second Prime Day may occur in October, with or without the same name. 

    But before that, let’s examine what happened in Germany this year on Prime Day 2022.

    Methodology

    • We tracked Amazon.de both before & on 12 & 13th July 2022, on Prime Day.
    • Categories Tracked – Electronics, Wine & Spirits, Grocery, Furniture, Fashion, and Beauty. 
    • We looked at Additional Discounts offered on Prime Day: Additional Discount is the extra discount on an item during Prime Day when compared to the Pre-Prime day price.
    • We also looked at Post Prime Day Discounts, which were the discounts offered after the 2-day event ended.

    What kind of Discounts did Amazon.de offer?

    Amazon Prime Day will be significant, especially for customers hoping to get discounts amid soaring inflation. Both Amazon as well as other sources reported that electrical and electronic items were the most popular purchases, followed by general retail products. Electrical and electronics saw the value of transactions soar 90% on the first day. Mobile phones and accessories were the most popular, with transaction values almost doubling to 96% on day one.

    Discounts across Categories on Amazon.de
    Discounts across Categories on Amazon.de
    • Based on trends from past events, Amazon likely knew electronic items were going to be best sellers. Keeping this in mind, they made sure to offer high discounts in the electronics category. They offered a 6.5% additional discount on electronics on Prime Day. And once the sale ended, they continued to discount electronics by 1.3%.
    • The Fashion category also had a fair bit of discounts and came in at a close second at 5.9%
    • Looks like Amazon discounted everyday use items minimally. Groceries had an additional discount of just 1.8% on Prime Day, and wine and spirits had 2% extra discount.  
    Discounts on Electronics Category on Amazon.de
    Discounts on Electronics Category on Amazon.de
    • Within Electronics, in the four categories we tracked, we saw the highest additional discounts were offered on Bluetooth earphones (10.6%) and Smartwatches (9%)
    Discounts on Fashion Category on Amazon.de
    Discounts on Fashion Category on Amazon.de
    • Jeans and Sunglasses had the highest discounts at 8.6% & 7.6% respectively.
    • Sneakers & Watches too had additional discounts of 6.6% on Prime Day.
    • Post the Prime Day event, Amazon retained an average of 1.5% discount across all products in the fashion category instead of pricing them at the original price. 
    • However, in the case of women’s T-Shirts, they increased the price by 1.7% from the pre-event price.

    Discounts across Price Tiers

    Retailers must consider several factors when making strategic discounting decisions, including customer buying behavior, the type of discount offered & the volume of discount offered. The best discounting approach will vary depending on the product and other factors like the original selling price of the product.

    Now let’s compare the discounting strategy Amazon used in the Electronics v/s Fashion category on Prime Day.

    Discounts across Price Ranges
    Discounts across Price Ranges
    • Interestingly, in both the Electronics and Fashion categories, Amazon increased prices for the lowest-end products between the €0-10 range by 3.6% and 13.2%, respectively, during the sale instead of discounting them! Maybe this was a strategy to drive consumers to higher-value products with greater discounts? 
    • Another similarity in strategy was that most of the mid-priced items had maximum discounts. In electronics & fashion both, the maximum discounts were given to products between the € 30-100 range. 
    • Here’s a difference that stood out – for Electronics in the higher price range between €100 – 500, the volume of discounts dropped a bit which meant Amazon gave moderate discounts on high-end electronics. But the trend flipped for Fashion as luxury fashion items were made to look more attractive with higher discounts.

    Monitoring stock availability during key sales days is critical

    Brands need to have the right stock availability, especially during sale events, because more customers shop online during sales. What’s worse, non-availability of products may drive customers to competitors that are stocking the same product.  Out-of-stock situations lead to missed opportunities & lost sales! Let’s take a look at our data and see how Amazon planned product availability across categories on Prime Day. 

    Availability Analysis across Categories on Prime Day
    Availability Analysis across Categories on Prime Day
    • Amazon was betting big on 2 categories – Electronics & Home. This meant they needed to keep a keen eye on availability in these categories, especially since they forecasted the highest sales to be generated here.
      … it was no surprise that the Furniture category had almost 100% availability during Prime Day! Electronics too had a high availability at 94% during the event.
    • Generally, our data showed that availability across multiple categories we tracked seemed robust and above 80% in more cases. Only Beauty & Grocery had 79% availability.

    Conclusion

    Prime Day sales reached an estimated 12 billion U.S. dollars worldwide, 9.8% higher than last year, making it the most successful shopping event in Amazon’s history. If you’re a brand selling on Amazon or a retailer trying to compete with Amazon, reach out to us at DataWeave to know how we can help!

  • Prime Day UK 2022 – highlights from the 2 day annual shopping festival!

    Prime Day UK 2022 – highlights from the 2 day annual shopping festival!

    Prime Day launched in 2015 as a celebration of the 20th anniversary of Amazon’s founding & has quickly become the biggest shopping event of the year for Amazon. Prime Day is a great opportunity for customers to snag fantastic deals on products they might not otherwise consider buying. Last year, Amazon Prime Day was a tremendous success, with Prime members spending billions of dollars on discounted items. In 2022 alone, global sales during the event reached a new record high of $12 Bn.

    18 countries participated in Prime Day this year, including the US. We did a deep dive into what happened in the UK – the discounts Amazon offered and categories with the highest discounts as well as checked to see if other retailers tweaked their pricing strategy to compete with Amazon on Prime Day.

    Methodology

    • In addition to Amazon UK, we tracked some key retailers on 12 & 13th July 2022, on Prime Day.
      Retailers tracked – eBay UK, OnBuy, Selfridges, ASOS.com, Net-A-Porter 
    • Categories tracked – Electronics, Wine & Spirits, Grocery, Furniture, Fashion, Beauty. 
    • We looked at Additional Discounts offered on Prime Day: Additional Discount is the extra discount on an item during Prime Day when compared to the Pre-Prime day price. 
    • We also looked at Post Prime Day Discounts, which were the discounts offered after the 2-day event ended.

    Did other retailers compete with Amazon on Prime Day?

    Traditionally, as Amazon’s Prime Day sale approaches, other retailers adjust their prices by offering summer deals or getting creative with offers. However, we did not see aggressive strategies from other retailers this year. In the US, Walmart always has a sale during Amazon’s Prime Day. The Wall Street Journal reported that Walmart announced there wouldn’t be an annual promotional event on Prime Day 2022 this year.

    Another report published by Forrester stated that major retailers scaled back their promotions, and overall offers from other retailers were less than impressive. We took a look at the data we gathered in the UK to see if this trend aligned. 

    Discounts offered on Prime Day on Amazon v/s other retailers
    Discounts offered on Prime Day on Amazon v/s other retailers
    • Our data showed that most retailers we tracked offered negligible discounts (in the range of 0.1 – 1.5%) and did not really try and compete or match the discounts Amazon was offering. 
    • However, ASOS was the one retailer that competed heavily with Amazon in the Fashion & Beauty category. While Amazon offered an average additional discount of 7.7% in the Fashion category, ASOS offered 13.2%. And in the beauty category, Amazon offered 6.7%, while ASOS offered 15.2%.
    • When we looked at post-prime day discounts, we saw that as soon as Prime Day ended, ASOS went back to the original price and stopped offering a discount which clearly shows they were keeping an active eye on out their competitors pricing. In fact, ASOS was offering up to 80% off almost everything on the site until Prime Day.

    Which were the popular categories that offered the most discounts?

    During Prime Day, shoppers saw tons of deals on essential gadgets. Tech deals were a massive hit and saw big discounts on everything from TVs, laptops, smartwatches, phones, and tablets. We look at the data we collected to see if we saw a similar trend. 

    Discounts on Amazon UK across categories
    Discounts on Amazon UK across categories
    • Amazon offered discounts across categories and reported that some of the best-selling categories were Consumer Electronics & Home. 
    • Our data too showed that the highest additional discounts were offered in electronics – Bluetooth Earphones at 18.4%, followed by Smartwatches at 14.9% and Laptops as well as Cameras, both at 12%.
    • Low discounts were offered on Alcohol, with Beer at 0.9% and Wine at 1.3%, respectively.
    • Relatively attractive discounts were seen in the Fashion & Beauty category – Sunglasses (9.1%), Shampoo (9.7%), & Watches (9.4%)
    Discounts on Amazon UK in the Electronics category
    Discounts on Amazon UK in the Electronics category

    Electronics being the hot favorite – we wanted to deep dive into the data and get more insights on Amazon’s pricing & discounting strategy here. Discounts can entice customers to buy more, encourage customer loyalty, or clear out old inventory. However, businesses must be careful since too much discounting can eat into profits. They also have to be mindful of which products should be discounted and by how much. 

    • Our data showed that the highest discounts (between 13 – 18%) were given on electronics priced between the £ 20-100 price range.
    • Electronics priced higher, between the £ 100 – 500 pound price range, were discounted less than 10%
    • However, high-value premium electronics over £ 500 were discounted slightly above 10%

    How did Amazon manage stock availability during Prime Day?

    Keeping track of inventory is especially important during big sales like Prime Day when thousands of customers are actively looking for deals.  There’s nothing worse than them finding the item they wanted is out of stock (OOS). OOS leads to lost sales, a situation that must be avoided at all costs. Read about how a small short term stock out on Amazon led to long term negative impacts for one of our customers. And let’s also look at the data and see what product availability looked like on Prime Day.

    • Overall, Amazon maintained robust availability across categories, and re-stocking was constant both before, during & after the event. 
    • Furniture, Fashion & Electronics had the highest availability. No surprise there since Amazon estimated that Home/ Furniture would be one of the best-selling categories.
    • Grocery saw average availability – perhaps cause some of these products are perishables, so it’s best to be mindful about overstocking.

    Which Brands Won on Prime Day?

    If there is one thing to remember about improving your product visibility on Amazon, it’s that it all boils down to the usage of the right keywords. Using relevant keywords makes your product appear higher up in search when customers are running searches on Amazon for those products. And the higher up a product appears in search, the higher the chances of a sale! 

    Let’s take a look at some popular categories and which brands had the highest Share of Search (SoS) during Prime Day.

    • Corona, San Miguel, and Becks were the top 3 brands optimized for the keyword Beer. However, what’s really important to note is both Corona & Becks had 20% SoS that was completely organic. San Miguel had a 20% SoS too, but it was sponsored ads that gave them this artificial boost. 
    • While a whole bunch of other brands had a 10% SoS most of them achieved this via Sponsored Ads. Youngever was the only brand that achieved this completely organically. They must have made sure they optimized key KPIs like content, ratings & reviews & product availability to achieve this result.
    • There were deep discounts on a wide range of Lenovo laptops. For example, the Lenovo IdeaPad duet Chromebook and Lenovo IdeaPad Flex 3 Chromebook were available at £100 off. Our data, too saw Lenovo & Asus fight for the top spot.
    • Asus sponsored 28% of products before Prime Day, hoping to capitalize on the pre-sale frenzy. During the event, they sponsored only 13% of products, bringing down their total SoS from 31% before the event to 13% during the event. 
    • Lenovo followed the opposite strategy; they sponsored just 6% of products before the event and during the event sponsored a whopping 25% which made them “almost” dominate the Laptop category during Prime Day.
    • Then there was Microsoft, with the highest SoS at 38%, of which all of it was organic!
    • The Smartphone SoS battle was clearly between Samsung & Xiaomi. Samsung was a consistent #1 at all 3 time periods (Before, During & After Prime Day) with the highest total SoS. Xiaomi came in at a close second. 
    • Samsung had an exciting strategy – they went heavy on sponsorships before and after the event. Their sponsored SoS was 31% & 39% respectively. And SoS of 13% during the event. 
    • Xiaomi’s strategy was just the opposite. Their sponsored SoS was 16% before the event. And 17% after the event, which was moderate compared to their Sponsored SoS during the event at 25%, which was much higher than Samsung’s 13%
    • Critical to note, Xiaomi’s organic search visibility before, during, and after the event was 0%. It definitely should be a concern area for any brand.
    Share of search
    Share of search
    • Both before & after the event, Cadbury had the highest visibility for the keyword Chocolate. During the event, they were not in the top 5 brands.
    • During Prime Day, Nestle won the top spot and had a 29% SoS. However, before the event, they were at #3 and after at #2. Artificially boosting visibility might’ve had something to do with this.

    Conclusion

    Prime Day sales reached an estimated 12 billion U.S. dollars worldwide, 9.8% higher than last year, making it the most successful shopping event in Amazon’s history. If you’re a brand selling on Amazon or a retailer trying to compete with Amazon, reach out to us at DataWeave to know how we can help!

  • U.S. Prime Day Deals 2022: Promotion Intelligence First Look

    U.S. Prime Day Deals 2022: Promotion Intelligence First Look

    As inflation hits another 40-year high at 9.1 percent, U.S. consumers geared up for their first sign of hope and relief in the form of anticipated discount buys – 2022 Amazon Prime Days, or so we thought. While Prime Days have grown to become a promotional period almost as important as Black Friday to digital shoppers, the combination of economic uncertainty, inflationary pressures, and supply chain challenges seemed to alter the discount strategy expected given activity seen during 2021 Prime Days.

    Our analyst team has been hard at work aiming to provide a ‘first look’ at 2022 Prime Day Promotional Insights, tracking discounts offered across 46,000+ SKUs within key categories like Electronics, Clothing, Health & Beauty and Home, on seven major retailer websites – Amazon, Target, Best Buy, Sephora, Ulta, Lowe’s and Home Depot. Our analysis compares prices seen during Amazon Prime Day 2022 on July 12th, to pre-Prime Day maximum value prices seen in the ten days leading up to Prime Days, to determine the average change in discounts offered during the promotional period. Below is a summary of our findings.

    Competitive Promotions Give Amazon a Run for their Money

    Amazon offered the greatest average discount enhancements for Electronics at 5.6 percent followed by Health & Beauty items at 5.1 percent, and Home products at 4.2 percent versus pre-Prime Day discounts seen across the categories considered within our analysis. The only category reviewed where average discounts were greater on a competitor’s website was on Target.com within the Clothing category. As seen below, Clothing on Target.com average discounts were 6.8 percent greater than pre-Prime Day offers, which was 2.6 percent higher than the average discounts offered for Clothing on Amazon.

    Target Capitalizes on Growth Opportunity in Clothing Category

    Diving deeper into the details of where Target won within the Clothing category, you can see a majority of their promotional activity took place within Women’s Accessories where discounts offered were 18.5 percent greater than those seen pre-Prime Day 2022, which was almost 15 percent greater than the discount enhancements seen on Amazon for Women’s Accessories. In fact, Women’s Shoes and Sneakers were the only two categories where the average discounts offered were greater on Amazon than on Target.com.

    Overall, the discounts offered on Target.com within the Clothing category were primarily concentrated within items priced $40 and lower, but what was most interesting is that within the $10 and under price bucket, Target offered average discounts of over 11 percent whereas Amazon increased prices for these items on average by over 9 percent.

    While most of the Clothing available on both Amazon and Target.com during Prime Days 2022 were offered without a price change, the greatest discount percentages tracked were within the range of 10-25 percent off on Amazon whereas Target chose to offer the bulk of their promotions at 25 percent off an up.

    Strategic Promotional Strategies Defined at the Electronics Subcategory Level

    When it comes to the Electronics category on Prime Day, the big question is always who will win the battle of the brands. Below shows the difference in average pricing and promotions discounts offered between products manufactured by Samsung versus Apple across each retailer platform, noting discounts were almost 3 percent greater on average for Apple versus Samsung products on Amazon, and Apple discounts were almost 5 percent greater on Amazon versus than those seen on Target.com.

    Amazon wasn’t going all in on Apple however, as we saw ‘Alexa’ devices (Amazon products) available on Best Buy and Target websites also, but the discounts were almost 4 percent greater on Amazon versus Target and over 7 percent greater than the discounts seen on BestBuy.com.

    While the average discounts offered within the Electronics category were greatest on Amazon (5.6 percent) versus Best Buy (3.9 percent) and Target (3.4 percent) as noted within the first chart of this blog and across brands and technologies considered above, the discounts offered on Amazon were strategically focused between 10-25 percent as seen below.

    Amazon’s Electronics promotions were also targeted at smaller price points, items priced between $20-500, whereas Best Buy and Target offered greater promotions for electronics priced $500 and up than Amazon.

    Below is a snapshot of price buckets tracked for Electronics available on BestBuy.com, highlighting where most of the promotional activity was targeted at products priced $50 and up during Prime Days 2022, with discounts ranging from 10 percent up to greater than 25 percent greater than pre-Prime day prices.

    The standout categories were TVs on Target.com with discounts averaging nearly 12 percent greater than those seen pre-Prime day, and smartphones on BestBuy.com with discounts averaging just over 11 percent greater than those seen pre-Prime Day. The category with the greatest average discount enhancements seen on Amazon during Prime Days 2022 was for Wireless Headphones with an average discount of 8.7 percent.

    Home is Where Amazon’s Heart Was on Prime Day

    Amazon dominated offers within the Home categories, especially for products within mid ($40-100) and higher price ranges (items priced $200-500), with the bulk of the discounts offered between 10-25 percent. There was little to no promotional activity seen across all price points on Lowe’s or Home Depot’s websites within the categories we tracked, and most other competitive offers on Home products were seen on BestBuy.com for products priced from $50-500. Even a subcategory like Tools offered deeper average discounts on Amazon (4.7 percent) than discounts seen on HomeDepot.com (1.1 percent) or Lowes.com (0 percent).

    For Large Appliances, Amazon was the only retailer to off any significant discount across each major subcategory with the greatest average discount being on Ovens at 6 percent, followed by Refrigerators at 4 percent. One caveat with this category, when we reviewed Large Appliance prices two weeks prior to Prime Days, we saw average price increases around 16.7 percent occurring on Amazon.

    During Prime Days 2022 however, Amazon also offered top average discounts for small appliances, except for on Instant Pots which appeared to have greater average discounts on Target.com (5.9 percent versus 4.2 percent on Amazon), and Vacuum Cleaners which appeared to have the best promotion of appliances small and large at 13.8 percent average discount on BestBuy.com. Another subcategory deeply discounted on BestBuy.com was weighted blankets, which averaged discounts around 18.5 percent versus Amazon’s average discount at only 6.2 percent.

    Health & Beauty Retailer Pricing Strategies Revealed

    Given the importance Health & Beauty Brands placed on Prime Day sales last year, we had anticipated to see more offers, especially within pure-play beauty retail channels, than we did for this booming category.

    Amazon drove most of the Health & Beauty offers seen averaging 5.1% discounts versus other retailers only offering less than 1% on average, but discounts were aimed at a targeted group of SKUs on Amazon, bringing the average discount lower overall. Most of the promotions offered on Amazon fell within mid-range price points ($20-50) and were discounted between 10-25 percent versus pre-Prime Day prices.

    Target.com offered the most comparable discounts to Amazon for Health & Beauty products on average, but their strategy primarily focused on items within the $20 and lower price range with discounts ranging primarily between 10-25 percent.

    More 2022 Prime Day Insights Coming Soon

    We know the significance visibility to critical pricing and promotional insights play in enabling retailers and brands to offer the right discounts to stay competitive, especially during promotional periods like Prime Days. While this blog is intended to provide a ‘sneak peek’ into 2022 Prime Day insights for the U.S. market, we will be providing more extensive, global coverage and will proactively share new insights with the marketplace as they become available throughout the month of July.

    Be sure to also check out our Press page for access to the latest media coverage on Prime Day insights and more. Don’t hesitate to reach out to our team if there is any particular category you are interested in seeing in more detail, or for access to more information on our Commerce Intelligence and Digital Shelf solutions.

  • How short term Stockouts on Amazon can have a long-term impact on your eCommerce business

    How short term Stockouts on Amazon can have a long-term impact on your eCommerce business

    It’s common knowledge that upward of 70% of Amazon customers never scroll past the first page of search results. And that the first 3 products garner 64% of business generated. This is why it is critical for brands and businesses to make sure they rank well on Amazon. A good search ranking helps customers find your product with ease. And findability is fundamental! Having a better ranking is also a driver of the “flywheel effect” at online retailers. According to this effect, products that sell more tend to rank better in search results, and products that rank well in search results tend to sell more.

    Negative impact on Sales Ranking due to Stockouts

    If you want to stay on top of search rankings on Amazon, one of the things you need to keep an eye out for is your product stock availability. It’s not the ideal customer experience to have to click on a product listing only to find out it’s currently out of stock. This is why Amazon will not rank products at the top if they’re not available & customers cannot buy them immediately. Not only does this lead to a lost sale for a brand, to make things worse, but customers also end up buying a competitor’s product instead. 

    We were tracking product availability on Amazon for one of our customers in the CPG space. We tracked availability for products across varying ranks & looked at how going out of stock impacted their search rankings.

    Product Availability
    Product Availability

    Impact on products with a Search Rank between 1 to 10:

    • Our data showed that when products that ranked between 1-10 went out of stock for just 1 day, their rank fell by over 28%. After 3+ days of being out of stock, their rank fell by 83% and after being out of stock for over 10 days their rank fell by close to 150%! 
    • This clearly illustrates that when the longer top-ranking products are out of stock, the greater the impact on search rank and product discoverability.

    Impact on products with a Search Rank between 10 to 20:

    • The impact of being out of stock on products that ranked lower, i.e. between 10 to 20 was much lower. After being stocked out for 1 day, the ranking fell 17% compared to the 28% dip for products in the top 10 ranks. 
    • Incremental change was minimal, too. After 3+ days of being OOS, search rank dropped by 22% and by 53% after 10+ days v/s close to 150% for higher-ranked products.

    Impact on products with a Search Rank between 20 to 30:

    • These products had the least impact but there was an impact nonetheless. 
    • After being OOS for 5+ days, search ranking fell by close to 8% and to close to 30% after 10 days of product unavailability.

    Avoiding Stockouts with better Inventory Management

    Customers can buy your product only when it is available. Failing to provide products at the right time will lead to losing sales to your competitors. If your products become unavailable, you’ll notice a drop in customers’ overall satisfaction and shopping experience too in addition to a lost sales rank on Amazon. In fact, your reputation and sales will take a beating long term in case of consistent product unavailability. Moreover, once the product is back in stock, the climb back to the top ranking is a slow and not-so-easy process. This is why brands need to maximize conversions by tracking product availability on a constant basis.

    Conclusion

    Stockout is a critical issue that has a significant impact on sales, brand image, and customer loyalty. Items ranking higher on eCommerce platforms take the biggest hit when they get out of stock. Brands can recapture their search share after restocking their inventory. 

    Want to maximize sales by reducing latency periods between stock replenishment? Reach out to our Digital Shelf Experts to know how! 

  • The Future of eCommerce is Social: Demystifying the Social Commerce Revolution

    The Future of eCommerce is Social: Demystifying the Social Commerce Revolution

    Social commerce is the selling of goods and services within a social media platform. Brands use social platforms such as Instagram, Facebook, Snapchat, and Twitter to promote and sell products. These platforms have become an integral part of consumers’ everyday life because they continue to engage users with relatable content, making them scroll their feeds for hours. 

    The Social Commerce model capitalizes on this high user engagement & moves social media beyond its traditional role in the top-of-the-funnel marketing process by encouraging users to shop without leaving their preferred apps. According to the Social Media Investment Report, 91% of executives agree that social commerce is driving an increasing portion of their marketing revenue, and 85% report that social data will be a primary source of business intelligence.

    Let’s talk a little bit about why brands should consider selling via social media platforms:

    Social Commerce vs. eCommerce vs. QCommerce

    While they may fall under the same umbrella of online selling, social commerce, quick commerce, and eCommerce are three very different concepts

    • eCommerce refers to online shopping via a (retailer or brand) website or app. Customers can access these platforms via desktop or mobile devices. However, the sales funnel generally looks the same. These brands and retailers use top-of-the-funnel tactics like social media content, digital ads, and other marketing strategies to encourage customers to visit the online store. There are three main types of eCommerce businesses: Business-to-Business (Alibaba, Amazon Business, eWorldTrade), Business-to-Consumer (websites such as Amazon, Rakuten, and Zalando), and Consumer-to-Consumer (platforms such as eBay & Etsy).
    • Quick Commerce (or QCommerce) refers to eCommerce businesses that deliver goods within a couple of hours or even minutes. Although it’s sometimes used interchangeably with on-demand delivery or instant commerce, the idea of quick commerce has been around in the food industry for ages now. It has been recently ushered into the mainstream by evolving consumer preferences for quicker delivery of groceries and FMCG goods.
    • Social commerce brings the store to the customer rather than redirecting customers to an online store. It removes unnecessary steps and simplifies the buying process by letting the customer checkout directly through social media platforms, creating a frictionless buying journey for the customer. Additionally, social media platforms are mobile-friendly, a huge benefit for brands because increasingly more and more customers are accessing the internet through mobile devices.
    Social Commerce
    Social Commerce

    Rise of Social Commerce

    First used in 2005 by Yahoo!, ‘social commerce’ refers to collaborative shopping tools such as user ratings, shared pick lists, and user-generated content. Social media networks snowballed throughout the 2000s and 2010s, alongside a general increase in eCommerce, leading customers and merchants to quickly recognize the benefits of buying and selling through social media networks. Social media platforms have since evolved from merely a showcase tool for brands. They now serve as virtual storefronts and extensions of a company’s website or brick and mortar stores, capable of handling the buying experience.

    Top Social Commerce Platforms

    Social media platforms aim to keep visitors engaged on their platforms for as long as possible. Increased time in-app or on-site maximizes their opportunity to serve ads, a primary source of revenue generation. Social media platforms have millions of active users and they have a great power to help companies and individuals build their brands, interact with consumers, and support after-sales. Here are the top social commerce platforms:

    • Facebook

    Facebook introduced Facebook Shops to capitalize on the commercial opportunity by allowing vendors to advertise and sell directly through the platform. Facebook integrates social commerce with shopping, allowing users to purchase products smoothly. Facebook shops offer a smooth user experience where users can review products and get recommendations from trusted acquaintances. Customers can directly interact with the merchant’s customer service department post-purchase. 

    • Instagram

    60% of people discover new products on Instagram. Owned by Facebook, Instagram facilitates in-app shopping and handles the entire transactions within the app itself. Users scrolling on Instagram often wants to follow trends and replicate the looks of their role models or favorite influencers. By offering purchasing options in the app, Instagram benefits from the platform’s rich visual imagery and videos, allowing businesses to sell an idea rather than the traditional process of selling a product. 

    • TikTok

    Shopify partnered with TikTok to introduce shopping and drive sales through the younger and seemingly ever-expanding TikTok audience. With TikTok for Business Ads Manager, brands and merchants can create in-feed video-based content depending on their product offering. This partnership allows Shopify merchants to expand to the TikTok audience.

    • Snapchat

    Snapchat has recently launched Brand profiles, a feature that allows users to scroll through a merchant’s products and buy them in-app. This new experience is powered by Shopify too. Merchants can create Brand Profiles or Native Stores that allow users to purchase products from the app. 

    Pinterest users are there for Shopping Inspiration
    Pinterest users are there for Shopping Inspiration
    • Pinterest

    Pinterest is also an image-based platform where users create boards of their favorite wedding accessories, home decor, fashion trends, etc. Pinterest doesn’t specifically offer social commerce for the global audience. Rather, it allows business accounts to create ‘Product Pins’ that are displayed in the brand’s Pinterest shop. Only U.S. customers can purchase within the app. Users from other countries are redirected to the eCommerce site to complete the sale. We have added Pinterest to this list because 89% of Pinterest users are there for shopping inspiration.

    Pinterest is an image-based platform where users create boards
    Pinterest is an image-based platform where users create boards

    Why Should Brands Care About Social Commerce

    • To enhance social media presence and brand awareness

    If your target demographic is in the 18-to-34 age range, they’re already on social media and waiting to shop while they scroll. According to Sprout Social, over 68% of consumers have already purchased directly from social media and nearly all (98%) consumers plan to make at least one purchase through social or influencer commerce this year. You can enhance brand awareness by selling on social media platforms. Influencer marketing is an amazing way to build brand awareness since customers are now seeking authenticity from micro-influencers rather than big-name celebrities. 

    • To generate social proof

    90% of online shoppers say that they read online reviews before making an online purchase. Whether it’s an automated follow-up email or a message through the social media platform, ask for a review after your product has been delivered to the customer. You can also offer incentives like a contest to encourage previous customers to weigh in and share their experiences. These steps will allow you to collect social proof since it’s vital to build a positive reputation online. You can also ask customers to create small product review videos that you can share on your social feeds in creative ways. You can also post user-generated content, create a carousel of positive comments, or host a live video with happy customers.

    Social Proof
    Social Proof
    • To simplify the buying process for consumers

    Traditional eCommerce involves several steps. It starts with displaying ads on social media platforms and customers being redirected to the business website for completing the transaction. To complete the transaction, customers also have to create an account or manually fill in the credit card details and delivery address. On the other hand, social is only a three-step process — find, click and buy. 

    Counterfeit Products
    Counterfeit Products

    Conclusion

    While social commerce is proliferating, it also has a few setbacks like the rise of counterfeit products. Counterfeiting has expanded into social media and has become an under-reported but vital hub for counterfeiters. A counterfeit detection solution can help brands and merchants identify & remove fake and unauthorized products. Technologies like image recognition can help in counterfeit detection by capturing fake logos and discrepancies. Removing counterfeit products will help brands safeguard customer loyalty and prevent fake products from harming your bottom line. 

    Here’s how DataWeave helped Classic Accessories, a leading manufacturer of high-quality furnishings & accessories identify counterfeit products across multiple retail marketplace websites eliminating 22 hours of time spent per week conducting manual audits – read the case study here

    Are you a brand or a retailer worried about counterfeits? Sign up for a demo with our team to know how we can help you track, identify and eliminate fakes! 

  • Top 7 strategies to sell effectively on Amazon

    Top 7 strategies to sell effectively on Amazon

    According to MarketingCharts, 63% of online shoppers start their buying journey on Amazon. This shows that customers believe they will find the products they are looking for with competitive prices and excellent customer service on Amazon. Amazon is one of the most dominant eCommerce marketplaces with 197 million users and 112 million Amazon Prime members. Brands can sell on Amazon to capitalize on this vast customer base by showcasing and promoting their products properly. 

    In this article, we’re going to take a look at the top 7 strategies to sell effectively on Amazon:

    1. Boost Product Discoverability using Ads

    Amazon Advertising helps sellers, brands, and agencies to drive profitability by making sure product discoverability is high & shoppers are able to find their brand with ease. The ads on Amazon fuel product discovery and improve conversion rate. The advertising options on Amazon are designed to help brands increase exposure, generate incremental sales, boost organic rankings, and drive growth.

    Amazon has three PPC programs: sponsored product ads, sponsored brands ads, and sponsored display ads. Brands can increase visibility on Amazon with these three paid campaigns. You can sponsor products or your brand for related searches on Amazon. Businesses only pay for clicks received. 

    Sponsored products are for individual product listings that appear on shopping results pages and product detail pages. Sponsored brands are for showcasing brand portfolios such as logo, custom headline, and a selection of products on the shopping results page. The last is sponsored display, a self-service advertising solution for displaying ads on and off Amazon. 

    Promotions for Brand and SKU's
    Promotions for Brand and SKU’s

    2. Improve your Amazon SEO using effective Product Descriptions

    To effectively sell on Amazon, businesses first have to understand the A9 algorithm. Amazon uses A9 Algorithm to decide which products are ranked in search results, emphasizing sales conversions. This algorithm helps Amazon promote listings that are more likely to result in sales. 

    Keywords in product descriptions are one of the main driving factors that the Amazon A9 algorithm looks for in determining relevance to search queries and setting rankings on its results pages. Therefore, brands must integrate high volume and significantly relevant keywords as part of their listings. Crafting product descriptions with the right keywords will provide compelling reasons for buyers to purchase the product and for the A9 algorithm to better rank the brands. Brands can analyze and optimize their content to improve discoverability across Amazon. Accurate product descriptions help users make informed decisions and allow brands to deliver a consistent customer experience.

    Detailed Descriptions and Highlights
    Detailed Descriptions and Highlights

    3. Improve your Product Visuals

    Avoid using standard visuals when displaying your products in Amazon’s image gallery. Product images are the hook that encourages visitors to click on your products. However, Amazon has specific image requirements that you’ll need to adhere to while presenting products. When shopping on Amazon, potential buyers are looking for high-definition and clearly visible photos. Thus, you will need diversity in images if you want your product and photos to stand out.

    In addition to images, brands can make their product descriptions better through video content. Videos help your brand to stand out, build a more personal relationship with customers, and lead to increased sales. One study on eCommerce sellers found that using product videos increases sales for online stores by 144%.

    Product Images
    Product Images

    4. Switch to Intelligent Pricing & Win the Buy Box

    Intelligent and competitive pricing is the most essential lever for revenue growth. With advanced technology like AI and analytics, brands can get insights into competitive pricing and develop an intelligent pricing strategy to calculate real-time changes in pricing optimally

    Amazon wants to give the consumer the best value for their money and thus has a Buy Box option. The white box on the right side of the Amazon product detail page is called the Buy Box, and customers can directly add items for purchase to their cart. However, not all sellers are eligible to win the Buy Box. 

    Thanks to Amazon’s customer-obsessed approach and high competition, only businesses with excellent seller metrics have a chance to win a share of Buy Box. Amazon weighs low prices with high seller metrics. If your brand has near-perfect performance metrics, having higher prices can still get you a share of the Buy Box. In contrast, brands with mid-range metrics will probably need to focus on offering the most competitive price.

    But, why is the Buy Box important? According to BigCommerce, 82% of sales on Amazon go through the Buy Box, and the rate is even higher for mobile purchases. Getting insights into your competitor’s pricing with our Digital Shelf Solution will help you improve seller metrics and find the right pricing strategy for your products.

    5. Provide Plenty of Social Proof

    Testimonials can increase sales page conversions by 34%. Social proof has emerged to be of great importance in the eCommerce world, and it isn’t limited to recommendations from people customers know in the “real world.” A survey conducted by BrightLocal revealed that 31% of consumers reported that they read more online reviews in 2020 than ever due to Covid-19. 

    Product ratings and reviews on Amazon are at the center of the recommended products section, product listing page, and search results. Interestingly, customer feedback also has a huge impact on a brand’s ODR or Order Defect Rate. It is one of the most critical measurements tracked by Amazon. ODR is a measure of customers who have had a negative experience with you as a seller. Amazon uses it to assess a brand’s health as a seller. The ODR indicator is driven by customer feedback, so review management is the primary step for brands to avoid an Amazon ODR warning and improve their order defect. 

    6. Go Global

    The Amazon marketplace is available in countries and markets worldwide, allowing brands to explore new territories and sell their products globally. Each foreign territory has a unique Amazon site that resonates with its culture and audience, making it easy for global sellers to compete with other brands. If your eCommerce brand has the operation capacity to expand globally, Amazon offers state-of-the-art international logistic capabilities. 

    Brands can expand in European countries like France, Italy, Netherlands, Germany, Spain, etc., and Asia Pacific locations like India, Japan, and Australia. Amazon is also available in emerging eCommerce locations like the Middle East, Brazil, Turkey, and Singapore. 

    7. Build a Branded Store

    One of the best strategies to stand out on Amazon is to feature your products on a branded Store. Amazon has free tools that allow grants to build an online store where brands and sellers can showcase products and connect with customers. These stores look different from the typical Amazon listing layout and also have the option to create detailed pages with A+ content. 

    Build your Brand Page
    Build your Brand Page

    For instance, Netgear, a company that offers technology-related products has an excellent branded store on Amazon. The brand has embedded images and videos that address buyers’ needs and how users’ lives are affected by using their products. The most attractive feature about this store is that they have integrated the value offered by their products into new use cases because of the current pandemic. For example, they’ve used phrases like “Make Online Learning fast and fun” and “Work from office at office speed.” Additionally, the categories and search tab help buyers search for specific products easily.

    Creating branded stores allows you to build a beautiful brand experience for customers and offers a multi-page, immersive shopping experience. Brands can pick unique designs, integrate promotions, and use rich media to create a custom curation of handpicked products. 

    Conclusion

    Amazon has 9.7 million sellers worldwide, of which 1.9 million are actively selling on the marketplace. The competition on Amazon is fierce, and it’s continuously increasing. Despite a large number of active sellers on Amazon, only a tiny fraction generates a significant portion of its total sales. Fewer than one in ten active Amazon sellers generated over $100,000 in annual sales, and only one percent of them hit the $1 million sales mark. Use these strategies to develop a comprehensive understanding of the Amazon platform and how to sell effectively on the platform while maximizing your presence amid rising competition. 

  • eCommerce Performance Analytics for CPG Private Label

    eCommerce Performance Analytics for CPG Private Label

    The combination of economic uncertainty, inflation, and perceived affordability has increased consumer’s willingness to buy and try more private label products, challenging National brands to differentiate their eCommerce strategies, especially those related to price positioning, in other ways.

    Our previously released report, Inflation Accelerates Private Label Share and Penetration, confirmed 8 out of 10 brands with the highest SKU count carried across all grocery retailer websites to be private label, signaling the strength of their digital Share of Voice. Given the growing shift in consumer preference toward private label brands, we are providing access to the latest trends seen from September 2021 through March 2022. Below you will find a summary of what the data revealed about the growing presence of private label brands on the Digital Shelf.

    Private Label Account and Category Penetration

    We analyzed private label penetration at an account level to understand which private label brands have the greatest presence on retailer digital shelves, and to see which retailers may be leaving product assortment opportunities on the table.

    Private Label Penetration Across Retail Grocer Websites

    As a retailer, it is important to understand how your private label penetration stacks up against the industry average at a category level, especially given the performance tracked for retailers included within our analysis and the vast number of SKUs they offer online (over 20,000).

    Private Label Penetration by Category Across Retail Grocer Websites

    The Private Label and National Brand Price Gap Widens

    Private label brands tried out of necessity mid-pandemic increased in popularity as grocery prices continued to rise, providing an opportunity for retailers to increase brand affinity and loyalty for their online shoppers. Retailers alike were able to keep affordability at the forefront of their strategies and maintain a price gap of 23% or more, despite inflationary pressures to increase prices.

    Private Label / National Brand Price Gap by Retailer

    Looking at the results at a category level, we can see that Meat is the only category found within our analysis where private label brands are priced higher than National brands at an average of 8% greater. The Alcohol & Beverages category tends to always see the greatest price gap between private label and National brands given the price variances by unit (ranging from under $10 to over $100), in this case averaging a 148% price gap.

    Private Label & National Brand Price Gap by Category

    Private Label Total Basket Value Comparison Across Retailers

    While SKU-level pricing is extremely important to product strategy, for a retailer, it is equally as important to be as mindful of the total basket value even more so now as consumers further their private label loyalty across various categories. A few SKU-level missteps in pricing decisions can exacerbate cart abandonment and negatively impact shopper loyalty in a world where prices can be compared instantly in the palm of your hand.

    Based on our analysis, Walmart and H-E-B private label products offered the lowest priced total basket of goods at $42.90 and $45.06 respectively, whereas AmazonFresh and Safeway offered the highest total at $73.19 and $69.52 respectively.

    Private Label Item Level Price Comparison by Retailer

    Inflation-driven Price Changes are on the Rise with Room to Grow

    Based on the 20,000+ SKUs analyzed, we saw a continual price increase every month since September 2021 when comparing future monthly prices to those we tracked in September. The greatest price increase happened in March 2022 at 12.5% on average, however, there are still 48% of SKUs that have yet to see a price increase even as inflationary pressures rise.

    When viewing the split between National and private label brand price increases in March 2022 versus September 2021, we saw National brands increased prices on average by 13% where private label brand prices only increased an average of 7%.

    Private Label & National Brand Price Change
    Private Label & National Brand Price Change (%)

    Price decreases are still occurring across all categories, despite inflation, but to varying degrees ranging from 5% for Deli items to 17% for Dairy & Eggs. Within the Dairy & Eggs and Pantry categories, private label brands reduced prices for an additional 10% of total SKUs compared to National brands.

    The greatest category of opportunity for price increases within private label were found within Beauty & Personal Care with 67% of private label products yet to see a price change since September 2021.

    Price Change (%) by Category and Brand Type

    Private Label Price Change Correlation to Product Availability

    The category with the greatest magnitude of price increase seen within private label brands occurred within Baby at 16.3% followed by Home at 14.3% on average. Private label products within Home and Baby categories were also showing the lowest availability rates, 75.9% and 79.5% respectively, indicating a high demand for these items even as prices increased.

    The private label categories with the smallest price increase on average were Dairy & Eggs at 2.4% and Other Foods and Pantry at 3.4% and 3.6%, respectively.

    Private Label Price Change Magnitude & Availability
    Private Label Price Change Magnitude & Availability

    While in many accounts both private label and National brands struggled with stock availability in March 2022, National brand availability is much lower (around 10% on average) than private label availability.

    H-E-B had the lowest overall product availability at 76% across both private label and National brands on average. Only Walmart had lower availability for Private Label at 75% compared to 93% for National brands, but they also had the greatest price gap between private label and National brands.

    Private Label & National Brand Product Stock Availability

    The Future of eCommerce Growth for Private Label

    Our greatest learning from this analysis is that it’s time for retailers to start thinking and planning more like the National brands they carry when it comes to positioning their private label brands for success. Successful retailers are taking this time to reset their private-label strategies and transfer short-term switching behavior into long-term customer loyalty.

    Retailers playing catch up have the opportunity to address some of the gaps highlighted throughout this analysis, for example, relative to pricing and assortment changes. Below are some of the highlighted opportunities:

    • Though inflation is driving price hikes, more than 50% of products analyzed have yet to see a price increase indicating an opportunity to protect margin
    • Narrowing the price gap between a store’s brand and National brands should not be the only focus as competitive private label brands are becoming a greater threat at a category and basket level
    • Modifying and expanding assortments as demand increases for private label can improve customer retention and loyalty, especially for cross-shopping consumers

    According to The Food Industry Association (FMI), only 20% of food retailers currently promote private brands on their homepages, and only 48% include detailed product descriptions indicating even more opportunities left on the table for retailers to optimize private label digital performance.

    Many leading retailers are leveraging real-time digital marketplace insights and eCommerce analytics solutions like ours to further their online brand presence and optimize sales performance. This report highlights only a small sample of the types of near real-time insights we provide our clients to effectively build competing strategies, make smarter pricing and merchandising decisions, and accomplish eCommerce growth goals. Be sure to reach out to our Retail Analytics experts for access to more details regarding the above analysis.

    For access to a previously recorded webinar presented in partnership with the Private Label Manufacturers Association and conducted by DataWeave’s President and COO, Krish Thyagarajan, click here.

  • Quick Commerce in 2022: An Era of Hyperlocal Delivery

    Quick Commerce in 2022: An Era of Hyperlocal Delivery

    Busy lifestyles, urbanization, aging populations, and smaller households led to the preference for convenience and efficiency in eCommerce deliveries. However, the Covid-19 pandemic caused a massive shift in customer demand and buying decisions. The modern consumer journey moved from takeaway food to online shopping to quick or same-day deliveries. With evolving digital touchpoints, customers now favor fast deliveries and convenience. 

    According to a 2020 survey by KPMG in the UK, 43% of consumers chose next-day delivery, a 4% increase from last year. Interestingly, 17% of consumers abandoned a brand if they faced a longer delivery. Standard delivery time has shortened from 3 to 4 days and two-day shipping to next-day or same-day delivery. This increasing trend of quick delivery has led to the boom of quick commerce or Q-Commerce. Quick commerce or on-demand delivery refers to retailers that deliver goods in under an hour or as quickly as 10 minutes. The rise of Q-commerce is caused by changing consumer behavior and rising expectations since the pandemic. 

    In this blog, you’ll learn about quick commerce or Q-Commerce and its benefits. You’ll also read about factors to consider for quick commerce and tips to implement this business model. 

    1. What is Quick Commerce?

    on-demand delivery
    On-Demand Delivery

    Quick commerce or on-demand delivery is a set of sales and logistics processes that empowers eCommerce businesses, restaurants, grocery chains, and manufacturers to deliver products in less than 24-hours. A study shows that 41% of consumers are willing to pay for same-day delivery while 24% of customers will pay more to deliver their items within a one- or two-hour window.  

    Changing lifestyles and customer behavior directly impacted the rise of Q-Commerce. The takeaway food industry had used quick commerce for many years. But with Q-Commerce businesses consistently cutting delivery time, quick commerce for instant grocery delivery has become a new trend. For instance, India-based online grocery delivery firm Grofers rebranded to BlinkIt amid rising competition, promising 10-minute instant delivery. 

    2. How quick is Quick Commerce?

    The post-pandemic lifestyle & the rise in the number of small and single-person households has led to an increase in demand for products in small quantities that need to be delivered sooner than later. Sometimes in as little as 10 minutes! This trend is oriented towards specific products such as packed or fresh foods, Groceries, Food delivery, Gifts, Flowers, Medicines to name a few.

    quick delivery service
    Quick Commerce Categories

    Local shops that can reach more customers with less friction have swapped traditional brick-and-mortar warehouses to cater to an urban population. These online Q-Commerce stores can deliver goods from favorite stores and offer a vast choice of products that are available 24/7. However, it requires real-time inventory management, data-driven pricing management, innovative logistics technology, a fantastic rider community, and a proper assortment. 

    3. Factors to consider for Quick Commerce

    q commerce
    Competitive Assortment & Pricing

    a. Assortment

    With growing competition, getting product assortment right isn’t easy for quick commerce businesses, yet it’s critical to their success. To optimize assortment for quick commerce stores, they need to understand how demand differs between demographics and various stores. Since quick delivery involves packed and fresh products, it is even more essential to carry a unique assortment for each store. 

    Data analytics will help Q-Commerce businesses understand which products are repeatedly purchased in every store. It also helps identify high-demand gaps in your competitors’ platforms. Assortment analytics can help distinguish shifts in customer behavior across short- and long-term demands. The key to increasing sales is shaping inventory to match the overlap between market opportunity and consumer interest. With assortment analytics, they can determine the optimal mix of products for their daily inventory. 

    b. Pricing

    Pricing information is readily available on quick commerce businesses, allowing customers to compare prices before making purchase decisions. Before deciding on a product, shoppers actively track the best deals on platforms across various Q-Commerce delivery platforms. According to a survey, 31% of consumers rated price comparisons as the essential aspect of their shopping experience. Understanding price perception can help quick commerce companies to optimize their pricing strategy while remaining competitive. 

    A competitive pricing strategy does not imply that Q-Commerce businesses have to cut prices. Instead, it’s about adjusting prices relative to your competitors but not significantly impacting the bottom line. Competitive pricing provides real-time pricing updates, allowing quick commerce platforms to drive sales by nailing their pricing strategy. 

    c. Delivery Time

    delivery time
    Grocery Delivery Race In India

    Delivery time has become the game-changer in quick commerce, with platforms fighting over shorter delivery times. Unpredictable factors such as specific delivery windows, last-minute customer requests, and traffic congestion can wreak havoc in your planning. Optimizing your delivery time can improve operational efficiency through faster delivery, quick route planning, and driver monitoring. 

    Big eCommerce platforms like Amazon offer same-day or next-day delivery to prime members with no extra fee on minimum order criteria. The only demand of customers who do not worry about discounts or lower wholesale prices is quick delivery. The demand for quick delivery services has led to many global retailers offering same-day delivery to meet those expectations.

    d. Demand Forecasting

    Since quick commerce is a viable solution for certain products, businesses must determine what customers want and when they want it. Q-Commerce businesses can use historical data to predict future sales patterns with demand forecasting. It ensures that Q-Commerce businesses can limit wastages and their inventory can cater to a targeted market. Demand forecasting also helps to replenish stock based on real-time data. Furthermore, companies can identify bottlenecks and points of wastage in the supply chain with a demand-driven system in place.

    4. Benefits of Quick Commerce

    same day delivery
    Q-Commerce Benefits

    a. Competitive USP

    Q-Commerce businesses get new value propositions because customers that need immediate delivery are willing to try new brands and order from new stores. It also allows online Q-Commerce businesses to compete with global marketplaces and brick-and-mortar stores. 

    We at DataWeave have helped quick-service restaurants (QSRs) that are going the Q-Commerce route & selling via food aggregator apps to increase their revenue significantly. Our AI-Powered Food Analytic solutions have helped QSRs diagnose improvement areas, monitor key metrics, and drive 10-15% growth. Our data has helped them understand availability during peak times, monitor product visibility by region, track competitors, and choose suitable banners for promotion. Read more about that here.

    b. Increase margins

    A study from Deloitte suggests that 50% of online shoppers spend extra money to get convenient delivery of the products they need during the pandemic. These customers also paid extra for on-demand fulfillment and bought online pick-up in-store options. 

    Since the assortment of products in quick commerce is relatively small, Q-Commerce businesses can drive sales for their most profitable product lines. There is a potential for greater margins because wealthier demographics often require convenience. For instance, time-stranded professionals value convenience over discounts. 

    c. Customer experience is paramount

    With quick commerce, retailers can meet customer expectations and exceed them, fostering brand loyalty. Quick commerce addresses customer pain points such as running out of food before a small party or getting a birthday present for your friends. It can simply help people who cannot make it to the shop or stock up essentials.

    5. How to implement Quick Commerce

     quick delivery
    Implementation of Quick Commerce

    a. The need for local hubs

    To pack and deliver products in under an hour, businesses must be located close to the customers. Therefore, quick commerce relies on local warehouses that can serve customers in immediate proximity. Since the duration of two-wheelers is less likely to be impacted by heavy traffic or parking spaces, delivery services employ riders to deliver products.

    b. Ensure you have the right analytics in place

    Another essential part of running a quick commerce business is to have a web or phone application that can facilitate online ordering and offer accurate stock information to customers. Q-Commerce businesses also need a real-time inventory management tool that will provide insights into stock levels and allow for quick reordering and redistribution of products. This will also prevent deadstock and stockouts. 

    DataWeave’s Food Delivery Analytics product suite helps companies to increase order volumes, understand inventory, and optimize prices. It also provides access to discounts, offers, delivery charges, inventory, and final cart value across all your competitors. 

    c. It’s all about stock availability & assortment

    Q-Commerce in the Grocery Delivery space is excellent for specific product niches like packed or fresh foods and vegetables, drinks, gifts, cosmetics, and other CPG products that customers use every day.

    The stock assortment is as important in the Food Delivery space with restaurant chains like McDonald’s or Burger King that generate as much as 75% of their sales from online orders. These businesses have to make sure they’re carrying the most in-demand product assortment there is. 

    Conclusion

    same day delivery
    Same Day Delivery

    The rise of quick commerce represents the next big change in eCommerce, accompanied by a shift in consumer behavior towards online grocery shopping and food ordering. When positioned with proper assortment and pricing, instant delivery services can allow Q-Commerce businesses to capture the influx of consumers looking for speedy delivery. By tapping into big data from quick commerce markets, Q-Commerce businesses can gain insights into consumer demands. 

    If you’re a Q-Commerce business in the Food Delivery or Grocery Delivery space, reach out to our experts at DataWeave to learn how our solutions can help you understand the best Pricing Strategy, Delivery Time SLAs, Assortment Mix you need in order to successfully sell on Q-Commerce platforms. 

  • Beauty & Grooming Brands that are dominating on Amazon India

    Beauty & Grooming Brands that are dominating on Amazon India

    Growing awareness of personal hygiene and changing lifestyles has contributed to a significant development of India’s cosmetics, beauty, and personal care products. The Indian cosmetic industry reached a value of USD $26.1 bn in 2020. The major boom in sales is because of rising digitization, social media marketing, and the advent of eCommerce beauty platforms. However, the increase in demand and technological advancements has led to a competitive landscape for Indian and international brands competing for digital and physical channels. As of February 2019, 18.92% of respondents spent between 700 to 1700 rupees, and 43.9% spent up to 700 rupees monthly on cosmetics and personal care products in India.

    Personal care products in India
    Monthly spend on Personal Care Products in India

    Shattering stereotypes and gender norms, India is also seeing a revolution in the male grooming industry, which is expected to reach INR 319.82 bn by 2024. The D2C market is expanding beyond metropolitan cities, and at present both D2C brands and startups have launched over 177 new products for men. “We realized there is an opportunity to create India’s first experiential brand exclusive for men,” says Hitesh Dhingra, Co-founder, The Man Company. He adds ecommerce business has grown almost by 200 percent. In a similar vein, Shantanu Deshpande, founder, and CEO, Bombay Shaving Company, concurs and adds the pandemic boosted online sales. He says that it has become easier for the company to compete with big brands on marketplaces like Amazon and Flipkart.

    With the onset of the pandemic, it has become more and more important for these D2C brands to have a strong digital presence and an even stronger Digital Shelf when selling on platforms like Amazon, Flipkart, Nykaa, and the likes. On these marketplaces, brands need to track critical KPIs like product discoverability, stock status & availability, reviews and ratings, pricing & promotions to make sure they’re optimizing product performance across all online channels to amplify their eCommerce growth. 

    So which beauty and grooming brands and categories have a strong Digital Shelf and are dominating on Amazon? Let’s take a look. 

    Men's Grooming Brands and Categories Categories
    Men’s Grooming Brands and Categories

    Methodology

    • We tracked the first 250 products on Amazon against certain keyword searches specific to India’s Beauty & Grooming space. 
      – Keywords specific to women’s grooming: anti-aging Cream, Face Mask, Paraben-free Shampoo, Onion Hair Oil, Body Wash, Moisturizer
      – Keywords specific to male grooming: Beard Oil, Hair Wax for men, Shaving Cream, After Shave Lotion, Beard Trimmer
    • Share of Search (SoS) – The percentage of products that appeared on the search results page on Amazon belonging to a brand against a specific keyword or category. 
    • Data Scrape time period: From 14th Oct 2021 to 10th Nov 2021

    THE BEAUTY IS IN THE DATA

    On Amazon, brands use sponsored ads to increase visibility and drive more sales. When we looked at the product category with the most aggressive ad spends, products in the men’s grooming category came out on top and had the maximum number of sponsored products. 26% of beard trimmers were sponsored, followed by Beard Wax and Beard Oil at 25%. During the lockdown, more men started searching online for new products and watching instructional videos on how to groom their beards or how to get a salon-like shave at home. Demand for razors and trimmers is up by 50% compared to last year,” said Sidharth S Oberoi, founder and CEO, LetsShave. In contrast, we saw that only 11% of after-shave lotions and 15% shaving creams were discounted. 

    Sponsered Items per Product Category
    Percentage of Sponsered Items per Product Category

    For women, we saw a similar trend. 24% of products in the Paraben-free Shampoos and Onion Oil category was sponsored. In contrast, only 5% of anti-aging creams were sponsored. Additionally, 21% of products in the face mask category and 23% in body wash were sponsored. 

    Competition is fierce in these categories, making an artificial boost necessary for increasing discoverability. In fact, we saw that the competition was the fiercest in the face mask category, which had the highest “1st Page Change Rate.” It is an indicator of how much the results on the 1st page for a particular keyword change from time to time. This reflects higher competition and brands constantly updating their digital shelf KPIs to ensure their products appear on page 1. One of the biggest reasons why brands need to constantly gauge their online visibility is to track their sponsored & organic ranking compared to competitors.

    Driving sales using a smart Discounting Strategy

    Price can play a big role in the final purchase decision. So we looked at two things wrt price across all these beauty & grooming products.

    • Which product Category had the maximum number of products on discount? 
    • … & how large were these discounts? 
    Products on Discount
    Percentage of Products on Discount

    We saw that almost 55% of products in the body wash category & 46% of anti-aging creams were available at a discount. Beard Oil & Onion Hair oil had the least number of products discounted at 29% each.

    Magnitude of Discount
    Magnitude of Discount

    How high were these discounts? Let’s take a look.

    The highest discount was seen in the beard oil and moisturizer category, with an average discount of 17% across all products. The average discount trend across most product categories ranged between 14 to 17%, so we did see some consistency there.

    Digital channels provide transparent insights into pricing & promotions, which is why customers are constantly comparing prices across various brands before making a purchase. This is why it is crucial for brands to remain competitive by tracking & comparing promotional strategies with those of their rivals. 

    To Review or Not to Review?

    Consumers worldwide don’t make a purchase decision without reading online reviews. Online reviews and ratings have become a significant milestone in the modern consumer shopping journey, and eCommerce brands can leverage reviews as valuable sales tools. Given a choice between loyalty programs, discounts, reviews, and free shipping, online shoppers say reviews are the most important factor while making a purchase. Consumers trust user-generated content (UGC) more than product information and videos created by brands.  

    Number of  Reviews per  Product Category
    Number of Reviews per Product Category

    We looked at product reviews to check consumers of which categories are actively sharing their experience and found that three categories stood out — beard trimmers, moisturizers, and paraben-free shampoo. At the same time, beard oil was the product category with the least number of reviews. 

    Companies can build consumer trust by identifying and acting on negative feedback. But in order to do that, they first need to de-code and understand the collective sentiment behind these reviews. DataWeave’s AI-Powered solutions can help brands break down & analyze online reviews and give them a wealth of insights to enrich their market research as well as create a seamless customer experience.

    UNDERSTANDING THE COMPETITION ON AMAZON

    When selling on Amazon, brands need to make sure shoppers find their products with ease. Keyword searches are the top ways consumers discover and find products across eCommerce sites. We tracked search visibility for the following keywords to see which brands had the highest share of search and appeared on the 1st page on Amazon. 


    Be in any product category – moisturizers, shampoo, anti-aging cream, Mamaearth & WOW featured against most keywords, showing popularity among customers. WOW Skin Science raised $50 million in April 2021, and Mamaearth raised $50 million in July 2021. These two fresh-faced brands have built credibility among health- and environment-conscious users. They are big competitors when it comes to natural and toxin-free products. It’s their high product visibility in multiple categories that is likely leading to better discoverability, higher sales & increased valuation, and brand value. 

    Beauty and Grooming Brands
    Rankings of Top Brands in various cosmetic categories- (A)

    In the male grooming space, we observed that established brands like Nivea, Old Spice, and Park Avenue had a lower share of search than new D2C brands like Beardo, The Man Company, Bombay Shaving Company, and Ustraa. Here’s clear proof of concept that brands need to evolve and adapt their Digital Shelf to selling online if they want to beat the competition

    Beauty and Grooming Brands
    Rankings of Top Brands in various cosmetic categories– (B)

    Who were the Amazon Bestsellers?

    Products on Amazon that have the highest sales in their respective categories are called Amazon Bestsellers. The Amazon Bestsellers rank is based on product sales and sales history where the list undergoes an hourly update. The bestseller ranking or bestseller badge is available in the product information section on the product page. The rankings are determined by comparing sales and historical data with products in the same category or subcategory. 

    Brands can make it to Amazon’s bestseller list by optimizing their listings, encouraging reviews, and listing products in the relevance of categories. Although Amazon does not consider reviews for product ranking, they help users convince them to buy your product. 

    Here are the Brands we say that made it to #1 on the Amazon BestSeller List for the following product categories.

    Amazon Bestseller List
    Amazon Bestseller List

    Gillette made it to the top in the aftershave lotion and shaving cream category, while D2C brands Ustraa made its mark bearing number 1 on Amazon Bestseller list for hair wax for men and beard oil. 

    Amazon Bestseller List
    Amazon Bestseller List

    Products from Nivea and L’Oreal made it to #1 seller in 2 categories each. Interestingly, in the Paraben-Free shampoo category, when D2C brands like WoW, Mamaearth have a stronger value proposition, traditional brand L’Oreal had the best-selling product. 

    L’Oreal must’ve pulled various levers and built a robust Digital Shelf to get to the top – from optimizing their content, ensuring product availability, tracking ratings and reviews, and proper competitive pricing. 

    Conclusion

    An increase in new D2C brands in popular and trending categories has led to increasing competition. Unless a brand can position itself in front of the target audience and command their attention right away, another brand can step in and grab the sale. Do you know if your brand is prepped and ready to make an impact on marketplaces like Amazon? Or simply just wondering if your Digital Shelf is optimized with the right price, discounts, reviews, and keywords? Our team at DataWeave can help! Reach out to our Digital Shelf experts to learn more!

  • 2021 Cost-Push Inflationary Trends Ran Rampant, Impacting Holiday Discounts

    2021 Cost-Push Inflationary Trends Ran Rampant, Impacting Holiday Discounts

    Business has been anything but usual this holiday season, especially in the digital retail world. The holiday hustle and bustle historically seen in stores was once again occurring online, but not as anticipated given the current strength of consumer demand and the reemergence of COVID-19 limiting in-store traffic. While ‘Cyber Weekend’, Thanksgiving through Cyber Monday, continues to further its importance to retailers and brands, this year’s performance fell short of expectation due to product shortages and earlier promotions that pulled forward holiday demand.

    Holiday promotions were seen beginning as early as October in order to compete with 2020 Prime Day sales, but discounting, pricing and availability took an opposite direction from usual. This shift influenced our team to get a jump start on our 2021 digital holiday analysis to assess how drastic the changes were versus 2020 activity, and to understand how much of this change has been influenced by inflationary pressures and product scarcity.

    Scarcity Becomes a Reality

    Our initial analysis started by reviewing year-over-year product availability and pricing changes from January through September 2021, leading up to the holiday season, as detailed in our 2021 Cyber Weekend Preliminary Insights blog. We reviewed popular holiday categories like apparel, electronics, and toys, to have a broad sense of notable trends seen consistently throughout various, applicable marketplaces. What we found was a consistent decline in product availability over the last six months compared to last year, alongside an increase in prices.

    Although retailers significantly improved stock availability in November and early December 2021, even digital commerce giants like Amazon and Target were challenged to maintain consistent product availability on their website as seen below. While small in magnitude, there is also a declining trend occurring again closer toward the end of our analysis period, post Cyber Weekend, across all websites included in our analysis.

    Inventory Availability 2021 Holidays
    Source: Commerce Intelligence – Product Availability insights for Home & Garden, Jewelry & Watches, Clothing & Shoes, Bed N Bath, Lighting & Ceiling Fans categories

    Greater Discounts, Higher Prices?

    With inflation at a thirty-nine year high, retailers and manufacturers have realized they can command higher prices without impacting demand as consumers have shown their willingness to pay the price, especially when threatened by product scarcity. Our assessment is that while some products and categories have responded drastically, manufacturers’ suggested retail prices (MSRPs) have increased nearly seven percent on average from January to December 2021. MSRP adjustments are not taken lightly either, as this is an indication increased prices will be part of a longer-term shift in product strategy.

    2021 MoM Retail Inflation Tracker
    Source: Commerce Intelligence – Pricing Insights for Bed & Bath, Electronics, Furniture, Healthy & Beauty, and Fashion categories on Amazon.com & Target.com each month in 2021 comparing price increases from January 2021 base

    Our 2021 pre-Cyber Weekend analysis reviewed MSRP changes for select categories (Bed & Bath, Electronics, Furniture, Healthy & Beauty, and Fashion) on Amazon and Target.com, and found around forty-eight percent of products on Amazon and thirty-five percent of products on Target.com have increased their MSRPs year-over-year, but kept pre-holiday discount percentages the same.

    Looking more specifically as to what year-over-year changes occurred on Black Friday in 2021, we observed MSRPs increasing across the board for all categories at various magnitudes. This indicates why 2021 discounts appeared to be greater than or equivalent to 2020 for many categories, when in reality consumers paid a higher price than they would have in 2020 for the same items.

    2021 Black Friday MSRP Increases
    Source: Commerce Intelligence – MSRP Pricing Insights for Bed & Bath, Electronics, Furniture, Healthy & Beauty, and Fashion categories on Black Friday November 27th, 2021, versus average MSRP pricing for the same SKU count from November 20-26th 2021

    On Amazon.com, categories like health & beauty have already increase MSRPs by a much greater percentage and magnitude versus Target.com leading up to and during Black Friday 2021, while other categories like furniture have increased MSRPs evenly on average across both retail websites. The below chart cites a few specific examples of year-over-year SKU-level MSRP, promotional price, and discount changes within found within the electronics, furniture, fashion, and health & beauty categories.

    Black Friday 2021 vs. 2020 SKU-level Price Changes
    Source: Commerce Intelligence – MSRP Pricing Insights for Bed & Bath, Electronics, Furniture, Healthy & Beauty, and Fashion categories on Black Friday November 27th, 2021, versus average MSRP pricing for the same SKUs on Black Friday November 26th, 2020.

    Fewer, but Deeper Discounts

    From October through early November 2021, fewer products were discounted compared to this same period in 2020, and the few that were saw much deeper discounts apart from the home improvement category. The most extreme example we saw in discounts offered was within furniture where only three percent of SKUs were on discount in 2021 compared to twenty-six percent in 2020. Interestingly, the magnitude of discount was also higher pre-Cyber Weekend 2021 versus 2020, but this trend was not exclusive to furniture and was also seen within electronics, health & beauty, and home improvement.

    Pre-Black Friday 2021 and 2020 SKUs on Discount and Magnitude
    Source: Commerce Intelligence – Pricing Insights for Bed & Bath, Electronics, Furniture, Healthy & Beauty, and Fashion categories on Amazon.com & Target.com Pre-Black Friday average selling price during November 20-26th 2021 versus average selling price from November 13-19th 2021 compared to Pre-Black Friday average selling price during November 19-25th 2020 versus average selling price from November 12-18th, 2020.

    Within the furniture category, the subcategories offering the greatest number of SKUs with price decreases on Black Friday 2021 were rugs by a wide margin, followed by cabinets, bed and bath, and entertainment units, but the magnitude of discounts offered were all under twenty percent.

    2021 Black Friday Furniture Category Price Decreases
    Source: Commerce Intelligence – Pricing Insights for Bed & Bath, Electronics, Furniture, Healthy & Beauty, and Fashion categories on Amazon.com and Target.com on Black Friday November 27th, 2021, versus average pricing for the same SKUs from Pre-Black Friday November 20-26th 2021 and Black Friday November 26th, 2020, versus average pricing for the same SKUs from Pre-Black Friday November 19th-25th 2020

    Accounting for this phenomenon could have been retailers’ attempts to clear inventory for SKUs which hadn’t sold even during the period of severe supply chain shortages. With more products selling at higher prices this year, retailers were also able to use fewer SKUs with greater discounts to attract buyer in hopes of filling their digital baskets with more full-priced goods, helping to protect margins heading in to Cyber Weekend. Scarcity threats also encouraged consumers to buy early, even when not on promotion, to ensure they would have gifts in time for the holidays.

    The same trends seen pre-Cyber Weekend 2021 were also seen on Black Friday with a year-over-year decrease in the percentage of SKUs offered on discount versus 2020, and steeper price reductions for the discounted products which can also be attributed to the increase in MSRPs.

    Black Friday 2021 and 2020 SKUs on Discount and Magnitude
    Source: Commerce Intelligence – Pricing Insights for Bed & Bath, Electronics, Furniture, Healthy & Beauty, and Fashion categories on Amazon.com and Target.com on Black Friday November 27th, 2021, versus average pricing for the same SKUs from Pre-Black Friday November 20-26th 2021 and Black Friday November 26th, 2020, versus average pricing for the same SKUs from Pre-Black Friday November 19th-25th 2020

    2021 Black Friday Price Increases?

    We all know Black Friday is all about price reductions, discounts and deals and so it’s rare to see actual price increases, yet for Black Friday 2021, trends ran counter to this. We observed price increases across all categories for around thirteen to nineteen percent of SKUs, with an average price increase of around fifteen percent in 2021 versus an average of only two percent in 2020.

    SKUs with Price Increases Black Friday 2021 and 2020
    Source: Commerce Intelligence – Pricing Insights for Bed & Bath, Electronics, Furniture, Healthy & Beauty, and Fashion categories on Amazon.com and Target.com on Black Friday November 27th, 2021, versus pricing for the same SKUs from Pre-Black Friday November 20-26th 2021 and Black Friday November 26th, 2020, versus average pricing for the same SKUs from Pre-Black Friday November 19th-25th 2020

    At an account level, we noticed a few interesting differences happening on Black Friday 2021 versus 2020 regarding category price changes. On Target.com, almost ninety percent of the bed and bath SKUs analyzed had a price change on Black Friday in 2021 versus 2020 with eighty-two percent presenting a higher price year-over-year versus only around seven percent showing a decrease, where on Amazon nearly forty-four percent of bed and bath SKUs showed an increase in price and around thirty-eight percent showed a decrease. Except for the health and beauty category on Target.com, more than half of the SKUs in each category saw a price increase on Black Friday versus a price decrease.

    2021 YoY Price Changes on Black Friday
    Source: Commerce Intelligence – Pricing Insights for Bed & Bath, Electronics, Furniture, Healthy & Beauty, and Fashion categories on Amazon.com and Target.com on Black Friday November 27th, 2021, versus average pricing for the same SKUs on Black Friday November 26th, 2020.

    The magnitude of year-over-year price changes seen on Black Friday 2021 was significant across all categories, but the magnitude of price increases found on Amazon.com within the health and beauty category outpaced the rest by far. We reviewed three hundred and sixty-five SKUs on Amazon.com within the health & beauty category and saw almost eighty-three percent of them had a price change with around thirty-one percent decreasing prices and around fifty-two percent increasing prices. This means that within the health & beauty category on Amazon.com, more than fifty percent of the SKUs tracked were sold at a one hundred and seventy-six percent higher price on average during Black Friday 2021 versus 2020.

    Magnitude of Black Friday 2021 Price Increases
    Source: Commerce Intelligence – Pricing Insights for Bed & Bath, Electronics, Furniture, Healthy & Beauty, and Fashion categories on Amazon.com and Target.com on Black Friday November 27th, 2021, versus average pricing for the same SKUs on Black Friday November 26th, 2020.

    The subcategories offering the greatest number of SKUs with price increases on Black Friday 2021 were cameras, followed by men’s fragrances, laptops, and desktops & accessories, but the magnitude of discounts offered were all under ten percent.

    2021 Subcategories with Price Increases during Black Friday
    Source: Commerce Intelligence – Pricing Insights for Bed & Bath, Electronics, Furniture, Healthy & Beauty, and Fashion categories on Amazon.com and Target.com on Black Friday November 27th, 2021, versus pricing for the same SKUs from Pre-Black Friday November 20-26th 2021 and Black Friday November 26th, 2020, versus average pricing for the same SKUs from Pre-Black Friday November 19th-25th 2020

    The Aftermath Post-2021 Cyber Weekend

    Extending this analysis beyond the holiday weekend, we analyzed price change activity from December third through the ninth across the top US retailers (chart below) and found that price decreases have been very minimal, comparatively speaking. Though there was a spike in number of price decreases from December 8th to the 9th, the percentage of SKUs with price decreases was still very low (less than three percent). We anticipate this trend will continue into 2022.

    SKUs with Price Decrease Post Cyber Weekend 2021
    Source: Commerce Intelligence – Pricing insights for Home & Garden, Jewelry & Watches, Clothing & Shoes, Bed N Bath, Lighting & Ceiling Fans categories

    A Sign of Things to Come

    A confluence of inflationary trends, product shortages and consumer liquidity have driven many marketplace changes to occur simultaneously. Government programs in the form of stimulus checks, have put extra money in consumers’ hands, and so they’ve been more willing to spend. That, coupled with the shock in the supply chain, has motivated people to buy far ahead of the 2021 holiday season. Hence, retailers have needed to rely much less on across-the-board discounts. Promotions have been more strategic – we’ve seen deeper discounts over fewer products, likely used to draw consumers in to buy certain items, and once they’re there, customers are buying everything else at a non-discount level. When these factors once again normalize, we could see a return to the “race to the bottom” that has occurred since the financial crisis of 2008-2009, but for once, retailers may be able to maintain some pricing power as the 2021 holiday shopping season played out.

    Even though performance was not as anticipated and holiday sales did not grow as rapidly as they did in 2020, Cyber Monday was still the greatest online shopping day in 2021. Through it all, retailers managed to keep their digital shelves stocked and orders filled in time for the holidays for the most part, running the risk of housing aged inventory if goods didn’t arrive in time. Despite predictions for steep promotions in January 2022, with supply chains still challenged and inflationary pressures still full steam ahead, we don’t anticipate much in the way of enhanced discounts to continue beyond the holidays.

    Access to these types of real-time digital marketplace insights can enable retailers and brands to make strategic decisions like how and when to address inflationary pressures, while also supporting many other day-to-day operations and help drive profitable growth in an intensifying competitive environment. Continue to follow us in the coming weeks for a detailed 2021 year-end review across more retailers and categories. Be sure to reach out to our Retail Analytics experts for access to more details regarding the above analysis.         

  • 2021 Cyber Weekend Preliminary Insights

    2021 Cyber Weekend Preliminary Insights

    The exponential growth of eCommerce has forever changed holiday shopping as we know it. What was once led by the launch of Cyber Monday in 2005, has since expanded to ‘Cyber Five’ in 2018, now spans beyond an eight-week period, and is collectively the busiest digital shopping period of the year. Most retail websites have launched a ‘Thanksgiving Comes Early’ sales event for a mosaic of products, causing one to wonder how this ‘early start’ to holiday shopping will impact the traditional promotional cadence consumers have grown to expect to see launch closer to the holidays. Given today’s environmental challenges, threats of scarcity are also encouraging consumers to buy early, which could also impact traffic on the shopping days that have traditionally seen the highest sales volume from digital shoppers.

    In the current environment, the onus will be on consumers to keep a watch for their categories of interest and buy them as and when they appear on sale in their favorite store, because there is no guarantee of sustained availability. Of course, they might return and buy at a different store if a better deal comes up, but there’s a time cost for the dollars saved. More broadly, there has been enough noise made about deals and discounts to keep consumer interest and curiosity going.

    The early promotional start and heightened demand has influenced our team to get a jump start on our 2021 Black Friday analysis to look deeper at trends seen pre-Black Friday 2021 versus 2020. With this assessment, we can track how promotional prices and product availability rates may have changed throughout the event leading in to 2021 Cyber Five, and compare it to last year’s activity to understand how 2021 holiday sales may be impacted.

    We reviewed popular holiday categories like apparel, electronics, and toys (for kids and pets), to have a broad sense of notable trends seen consistently throughout various, applicable marketplaces. What we found is a consistent decline in product availability over the last six months and as compared to last year, alongside an increase in prices.

    We first analyzed availability changes for popular categories on Amazon, noted in the chart below, to understand how inventory may have changed throughout the year, and also compared to 2020. With the exception of batteries and solar power goods and books and maps, there appears to be consistency in greater product availability in 2021 versus 2020, but a slow decline in availability throughout 2021, leading into the holiday season.

    Source: DataWeave Commerce Intelligence – Product Availability in-stock percentage from July 2020 through September 2021 for a sample size of 1000+ products on Amazon.com

    When it came to our pricing analysis, we reviewed select categories on Amazon and Target.com, and found around fifty percent of products on both websites to have seen a price increase year-over-year, while only thirty-seven percent and sixteen percent of products saw a price decrease on Amazon and Target.com, respectively. We also see an increase in the manufacturer’s retail price (MRP) in 2021 versus 2020 for a very high proportion of products (forty-eight percent of products on Amazon and thirty-five percent of products on Target.com), but the discount percentages have remained the same.

    Source: DataWeave Commerce Intelligence – Pricing Intelligence: MRP and promotional pricing for 1000+ products on Amazon and Target.com were analyzed from November 13th – 15th, 2021 versus Pre-Black Friday November 24th & 25th 2020

    *Please reach out to our Retail Analytics experts for access to sub-category details available within the above analysis conducted on Amazon and Target.com.

    This indicates 2021 discounts may appear to be greater than or equivalent to 2020, but in reality, consumers will end up paying higher prices than they would have for the same items in 2020. The remainder of this article highlights our key findings found within each key category reviewed – Electronics, Apparel and Toys.

    Electronics Category Analysis

    The television category showcases a great example of how pricing fluctuations impact holiday promotional cadences. Based on our analysis, we found the average television price to have increased around seven percent from April to October 2021, as seen below and as noted within our analysis conducted with NerdWallet.

    Source: DataWeave Commerce Intelligence – Pricing Intelligence: The change in average price captured for televisions sold on Amazon from May 2021 through October 2021.

    In fact, on Amazon and Target.com, we see around eighty-four percent of the SKUs listed show both an MRP and promotional price increase in 2021 versus 2020 during pre-Black Friday times. One specific example found on Amazon is noted below for Samsung TV model QN65LS03TAFXZA, a 65 inch QLED TV that was priced at $1697 during this analysis at a fifteen percent discount from MRP, but was priced last year at $1497 without a discount from MRP. In essence, even though the TV offers a greater discount this year, it is actually more expensive than it was in 2020 at this same time of year.

    Source: DataWeave Commerce Intelligence – Pricing Intelligence: MRP and promotional pricing analysis on Amazon.com comparing prices from November 13th – 15th, 2021 versus Pre-Black Friday November 24th & 25th 2020

    Unlike TVs, the price of laptops has experienced a decrease over time based on our analysis conducted during the same timeframe, indicating these are a great buy for consumers this holiday season versus promotional offers seen in 2020.

    Source: DataWeave Commerce Intelligence – Pricing Intelligence: The month-over-month change in average price captured for televisions sold on Amazon from April 2021 through September 2021.

    Overall, our prediction is that within the electronics category, promotions during Cyber Five may be equivalent to last year’s offers, however, supply will be limited and the total spend versus last year will be greater to the consumer outside of Doorbuster deals offered on select models.

    Apparel Category Analysis

    The Luxury market is seeing a Roaring 20s-like feeling this season given the Covid-induced changes in work and lifestyle and higher disposable income. Therefore, our prediction is that prices for these goods are likely to remain flat, or offer very little discounts this season both due to supply constraints as well as higher demand. For example, our analysis on shoe pricing changes shows relative stability from April to October 2021.

    Source: DataWeave Commerce Intelligence – Pricing Intelligence: The change in average price captured for shoes sold on Amazon from May 2021 through October 2021.

    Given heightened demand and the Global shipping crisis, we anticipate luxury apparel categories to face out-of-stock challenges this holiday season, and therefore we also anticipate seeing less promotional activity for these items as well during Cyber Five 2021. To dive deeper into the severity of the impact, we looked at availability for clothing, accessories, and footwear categories from August 2020 until present to verify our thesis.

    Focusing only on clothing, accessories, and footwear, these categories followed the same downward trending pattern regarding product availability decreases this year with a decline from June (seventy-six percent versus eighty-six percent in May 2021) to September 2021 (the lowest rate seen at sixty-eight percent availability), followed by a partial recovery in October and November (achieving seventy-seven percent availability).

    Source: DataWeave’s Commerce Intelligence – Product Availability: 10k SKUs tracked across 11 retailers US websites (Farfetch, Brownsfashion, NetAPorter, EndClothing, 24s, Selfridges, Ssense, Harrods, Luisaviaroma, MyTheresa, MrPorter) tracked daily stock status in apparel categories; Availability is calculated as percent of instances when product is in stock against all instances tracked.

    Not all recoveries were the same however, and given this, we predict accessories to have the lowest availability rate and greatest risk of facing out of stocks heading into Cyber Five. From May through November 2021, accessories availability continued to decline significantly from month to month, beginning at eighty-three percent in May and ending at seventy-four percent in November. Given this continued decline and with Black Friday right around the corner, we don’t anticipate inventory levels to increase enough to meet the increased holiday demand.

    Source: DataWeave’s Commerce Intelligence – Product Availability: 10k SKUs tracked across 11 retailers US websites (Farfetch, Brownsfashion, NetAPorter, EndClothing, 24s, Selfridges, Ssense, Harrods, Luisaviaroma, MyTheresa, MrPorter) tracked daily stock status in apparel categories; Availability is calculated as percent of instances when product is in stock against all instances tracked.

    Toys & Games Category Analysis

    As noted by DigitalCommerce360, we also anticipate toys to be one of the greatest impacted categories this holiday season given the continued decline in overall availability for these items on Amazon.com, as one great example. Within our category analysis, we saw a steady decline in availability from March 2021 through June (eighty percent to sixty-one percent), followed by a period of stability from June through August (approximately sixty percent), followed by another decline from September through October, finally reaching the lowest availability of fifty-six percent (down twenty-four percent from March 2021).

    Source: DataWeave’s Commerce Intelligence – Product Availability – hundreds of Toys & Games SKUs tracked on Amazon.com on a weekly basis from March 2021-October 2021

    The biggest sub-category within the toys department on Amazon, Sports and Outdoor Play, followed the same trend as Toys and Games overall through June 2021, also reaching its lowest availability of fifty-six percent. Instead of continuing along that pattern, Sports and Outdoor Play started on a recovery path, ending at a relatively high availability level of sixty-seven percent in October, which is only five percent lower than its highest availability (seventy-two percent in March 2021). Games and Accessories, the second largest sub-category in Toys and Games, had a continuous decline starting with eighty-nine percent in March 2021, reaching its lowest availability of fifty-four percent in October.

    Source: DataWeave’s Commerce Intelligence – Product Availability – hundreds of Toys & Games SKUs tracked on Amazon.com on a weekly basis from March 2021-October 2021

    The sub-category Tricycles, Scooters and Wagons interestingly had its highest availability from July to September 2021 (around eighty percent), unlike other sub-categories which as a whole, had their lowest availability during the same timeframe. From September through October, there was a significant decline (fourteen percent), reaching its lowest availability of sixty-seven percent. The sub-category Babies & Toddlers started on a continuous decline from its highest availability of eighty percent in April to its lowest availability of fifty-six percent in October.

    Source: DataWeave’s Commerce Intelligence – Product Availability – hundreds of Toys & Games SKUs tracked on Amazon.com on a weekly basis from March 2021-October 2021

    *Please reach out to our Retail Analytics experts for access to sub-category details available within the above analysis on the Toys and Games category on Amazon.com.

    Pet Toys Category Analysis

    When it comes to in demand holiday toys, you can’t forget about the needs for gifts for our furry friends and family. We also tracked sub-categories such as dog, cat, and bird toys, following the same methodology as tracked within Toys and Games to track pet toy availability changes.

    Source: DataWeave’s Commerce Intelligence – Product Availability – hundreds of Pet Toys SKUs tracked on Amazon.com on a weekly basis from March 2021-October 2021

    Dog toys, the biggest sub-category out of the three pet toys analyzed, had high availability – ninety percent in March 2021, but started to decline reaching a low of sixty-five percent in October. There was a period of stability from April to August (averaging seventy-seven percent), followed by a significant decline of over thirteen percent in from September to October. Cat toys, the second largest sub-category, also had its highest availability in March (eighty-nine percent) followed by a steady decline to sixty-six percent in June, a recovery from July to August (achieving seventy-three percent), followed by another decline during September and October, reaching its lowest availability of sixty-three percent (down twenty-six percent from eighty-one percent in March). Interestingly, dog toys which has a product count eight times greater than cat toys, had higher availability than cat toys during each of the months considered during the analysis.

    Source: DataWeave’s Commerce Intelligence – Product Availability – hundreds of Pet Toys SKUs tracked on Amazon.com on a weekly basis from March 2021-October 2021

    In Conclusion

    If we consider discounts and availability to be a good indicator of sales for the 2021 holiday season, with the Global shipping crisis looming over this year’s event, we expect retailers to have trouble keeping their inventory well stocked, which might affect growth rates. That being said, while discounts may be muted and popular items may come on very limited sales given constraints, we believe digital sales on Black Friday will see the highest year-over-year growth to date, given a number of supporting factors: scarcity threats increasing demand and the reason to buy, and consumers waiting to see if holiday offers surpass those see in the early start promotions, followed by the sudden rush to buy on Black Friday so as not to risk a given product being out of stock beyond this time period.

    We also anticipate seeing a continued decline in product availability day-to-day as we progress throughout Cyber Five 2021. Given the analysis conducted on 2020 trends, (we tracked nearly a one percent decline in availability on Black Friday 2020 vs. Thanksgiving Day, followed by a two percent decline on Cyber Monday), our data indicates products went out-of-stock at a faster rate then also.

    Ultimately only the digital-savvy retailers and brands will thrive during these opportune times, while others will continue to be in catch-up mode. Access to real-time marketplace insights can enable a first-to-market strategy, while having access to historical patterns can also help react faster to commonly seen future market factors, such as another pandemic or Global shipping crisis. These types of insights also support day-to-day operations, enabling retailers and brands to accelerate eCommerce growth, determine systems to distinguish their online strategies, discover efficiencies and drive profitable growth in an intensifying competitive environment.

    Continue to follow us in the coming weeks to see the insights we track through Cyber Five 2021, and be sure to reach out to our Retail Analytics experts for access to more details regarding the above analysis.

  • Gold, Gift Hampers & Gadgets – brands that sparkled this Diwali!

    Gold, Gift Hampers & Gadgets – brands that sparkled this Diwali!

    The festival of lights symbolized the victory of light over darkness, good over evil & knowledge over ignorance. Over the years, Diwali has become all that and more. It has single-handedly become the biggest shopping season in India! Splurging on a new Smart TV or Fridge, or a furniture upgrade at home has become customary during Diwali. Not to forget buying gold and gifts for all your loved ones! 

    As more and more people are doing their Diwali shopping online, we decided to look at the data, see what people were browsing and buying. And more importantly, which brands spruced up their Digital Shelf & put their best foot forward this Diwali Season. 

    Methodology

    • We tracked the first 250 products on Amazon & Flipkart against specific keyword searches & product categories. 
    • Share of Search (SoS): The percentage of products that appeared on the search results page on Amazon or Flipkart belonging to a brand, against a specific keyword or category. 
    • Dates of Crawl during the Flipkart Big Billion Day / Amazon Great Indian Festival.
      – Pre-sale period: 1st October 2021
      – Sale Period: 3rd to 10th October 2021
      – Post Sale Period: 11th – 18th October 2021

    India’s E-Commerce Gold Rush

    YouGov reported that almost three in ten urban Indians (28%) are planning to spend on gold in the next 3 months. Seven in ten (69%) of these prospective gold buyers agreed with the statement, “Diwali is the best time to buy gold”, highlighting their inclination to spend during the festive season. Also, the same survey showed that Tanishq was the most trusted gold brand. With Kalyan Jewellers, Malabar Gold & Diamonds and PC Jewellers also making it to the top 5 list.

    E-Commerce Gold Rush

    While traditionally Gold was mostly sold offline, that trend has fast changed. We tracked brands that had the highest Share of Search against the keyword “Gold Coin” on both Amazon & Flipkart to see if Tanishq, Malabar Gold, PC Jewellers – the big trusted names in jewellery were making their mark online. 

    Search Insights for Gold Coin
    Search Insights for Gold Coin
    • On Amazon, MMTC-PAMP (a joint venture between Switzerland-based PAMP SA & MMTC Ltd, a Government of India undertaking) and Kundan had the highest visibility for the keyword “Gold Coin” at 10%, followed by Malabar Gold at 9%. (Refer to above graph of Search Visibility on Amazon)
    • MMTC-PAMP used the help of Sponsored ads to get this visibility. They sponsored 9 products during the sale, while ACPL, the largest supplier of silver in India sponsored 26 products and New Delhi-based PC Jewellers sponsored 12 products. (Refer to above graph of Sponsored Products on Amazon)

    As recently as 2 weeks ago, MMTC-PAMP launched their e-commerce portal following in the footsteps of other jewellery brands. According to a report by the World Gold Council, the jewellery industry went through a massive slowdown amid the pandemic and prepping their e-commerce & digital strategies are likely going to be the only way forward.

    • On Flipkart, PC Jewellers, Malabar Gold & Kundan occupied the top 3 spots on the search results page. While PC Jewellers sponsored 12 products on Amazon, on Flipkart they sponsored zero. Malabar Gold on the other hand sponsored a whopping 25 products on Flipkart! Interestingly Malabar Gold sponsored no products on Amazon for the keyword Gold Coin. (Refer to above graph of Sponsored Products on Flipkart)

    Unboxing the love – Branded Diwali Gift Hampers

    Branded-Diwali-Gift-Hampers
    Branded-Diwali-Gift-Hampers

    Now let’s talk about Diwali Gifts. How often have you thought of buying someone a Diwali gift but had absolutely no idea what to get them? You’re not alone! A lot of consumers would simply run a search for “Diwali Gift Hampers” or Diwali Gifts” in the hope to stumble across a great gifting idea and make an instant purchase! Smart brands who know this make sure their products have organic or sponsored visibility against these keywords

    On Amazon, Tied Ribbons, a D2C gift and Décor company had the highest number of Sponsored products (15) against the keyword Diwali Gift followed by the iconic Brand Archies with (14) products.
    Flipkart had a whole bunch of smaller brands and sellers optimizing their products for this keyword. Some bigger, more known brands like Chaayos, Cadbury, D2C Tea brand Vahdam did have visibility for the keywords “Diwali Gift Hampers/ Diwali Gifts” but they were way down on the list, at the bottom of the search results page, or on Page 2.

    Was this a missed opportunity for them?

    Give your home a festive upgrade!

    Diwali is a perfect time to upgrade or buy new electrical appliances for your home. Great prices, new product launches, and an unmatched festive feeling make it even more ideal to make new purchases. If you’re eyeing smart innovative electrical appliances for your home this year and decided to go make your purchase during the Flipkart Big Billion Day or Amazon Great Indian Festival, let’s take a look at which brands made sure they showed up right on top in your online search. 

    We tracked search visibility for 5 keywords in the home appliance space – Smart TV, Washing Machine, Microwave, Air Conditioner & Refrigerators to see which brands had the highest share of search

    Brands with the highest Share of Search on Amazon
    Brands with the Highest Share of Search on Amazon
    • On Amazon, both Samsung & LG had high visibility across all products except Air Conditioners!
    • For ACs, Voltas had the highest share of search even though they sponsored 0 products! And that’s definitely noteworthy. So what really gave them the edge and put them in this winning position?

    We took a look at their product reviews to draw an analysis. Voltas ACs had close to 10k reviews! The highest in the AC category. Ratings & Reviews play a key role in helping brands drive their Digital Shelf experience. Customers trust user-generated content more than information brands share with them. Also, Amazon’s A9 algorithm prioritizes products with better reviews & shows them higher up in search – a low-cost & organic way for brands to get to the top without spending money on Sponsored ads!

    Most loved AC brand
    Most loved Air Conditioner brand
    • When it comes to washing machines, Lloyd & White Westinghouse (trademark by Electrolux) sponsored the maximum number of products in the category, this gave them the highest Sponsored SoS (13%) on the first page. 
    • While their sponsored visibility was high, their overall SoS was low which is why they didn’t organically feature in the top 5. Sponsoring products is a great but expensive way to artificially boost product visibility during sale periods. Brands need to go the Voltas route by optimizing their reviews & rating or content, to organically gain and sustain product visibility.

    … & here are the brands that made it to the top on Flipkart.

    Brands with the highest Share of Search-on-FLIPKART
    Brands with the Highest Share of Search-on-FLIPKART

    Gift-worthy gizmos!

    Buy the latest gadgets and pamper yourself this Diwali or gift them to your loved ones! You could be looking to upgrade your laptop, or buying a fancy DSLR or Smartwatch, buying it online may be your best bet. Discounts have dwindled over the years but you may still get the most lucrative discounts online. Let’s look at the discounts offered on Amazon & Flipkart for some gift-worthy gizmos like Laptops, Cameras, Smart Watches & Headphones this festive season. 

    The platform that offered the highest number of products in their catalog at a discount

    Flipkart had the higher number of gizmos on Discount this Diwali

    On Amazon, during the sale, the headphones category offered a 75% of products on discount as compared to the pre-sales period. That number was just around 51% for cameras. Far more number of products were discounted on Flipkart – 87% for headphones & laptops. And cameras 77%. So if you were looking to shop for gadgets around Diwali, Flipkart would’ve been a better bet. 

    Let’s look at which platform offered the highest percentage of discounts on products. 

    Discounts were higher across all 4 product categories!
    Discounts were higher across all 4 product categories!

    Apart from more products being discounted on Flipkart, Flipkart also offered higher discounts across these 4 categories. Discounts were higher across all 4 product categories!  

    Do you know if your brand is prepped and ready to make an impact on a Big Festival Sale Day? Or simply just wondering if your Digital Shelf is optimized with the right price, discounts, reviews and keywords? Our team can DataWeave can help! Reach out to our Digital Shelf experts to learn more.

  • Discounts continue to fizzle out on Amazon-Flipkart as e-commerce gathers steam

    Discounts continue to fizzle out on Amazon-Flipkart as e-commerce gathers steam

    Around 30 percent of electronic products across Amazon and 19 percent across Flipkart continued to be sold without any discount during October which is ironically seen as the festive month where the two companies make tall claims about deals and discounts offered around Indian festivals.

    Out of the 70-80 percent products where discounts were available, Flipkart surprisingly turned out to be more generous than Amazon during the period under review.

    As per the data exclusively shared with Moneycontrol by digital commerce analytics platform DataWeave, Flipkart on an average offered 26.3 percent discounts across the categories mentioned as compared to Amazon which had just 10.6 percent discounts.

    What makes it more interesting is that while Amazon was officially running its flagship sale The Great Indian Festival for the entire month, Flipkart had concluded its The Big Billion Days on October 10th itself.

    However, it looks like the latter was in no mood to let the competition have it all.

    The pattern is slightly different from the week-long data which was reported by Moneycontrol last month. During the first week of the festive sale, both the two companies offered no additional discounts across 30 percent of the products across the electronics category which houses products like refrigerators, air-conditioners, and laptops.

    While Amazon continues to stick to the trend, Flipkart seems to have become a little aggressive there.

    On a product level, across air conditioners, while Flipkart offered discounts across 84 percent of the products, Amazon offered it only across 73.1 percent of products. Laptops saw at least 87 percent of products on Flipkart having discounts while on Amazon it was across 76.3 percent.

    Smart TV interestingly had a different pattern. While Amazon had 72.1 percent of the products at a discounted price, Flipkart had just 63.7 percent of smart TV’s on discount.

    Interestingly, on Amazon and Flipkart at least 2.5 percent and 3.1 percent of electronic products also had a price hike during the period under review respectively.

    This is a far cry from discounts in the 60-70 percent range that the two companies advertise across electronics and appliances categories on their platforms during the sale period to lure customers.

    “Sellers decide the price of their products on Amazon. Our investment in technology and infrastructure has allowed them to save costs and consistently offer great prices to customers. Our partnership with banks, sellers, and ecosystem partners allow us to add further value through exchange offers, no-cost EMI, instant bank discounts among others, ” said an Amazon spokesperson.

    Flipkart did not respond to queries.

    Bengaluru-based Dataweave counts Japanese ad-tech firm FreakOut Group and domestic venture capital firm Blume Ventures among its investors. The data was shared exclusively with Moneycontrol.

    The price comparisons were made with rates displayed on October 1, the last business-as-usual day before the sale started and the month-long sale period beginning October 3.

    For this analysis, DataWeave crawled pages of the electronics category, which houses products, including air-conditioners, cameras, headphones, laptops, microwave ovens, refrigerators, smart televisions, smartwatches and washing machines. The firm scanned 2,285 products on Amazon and 3,131 on Flipkart.

    According to experts,…Continue reading the article here
    This article was originally published on Moneycontrol on November 3, 2021

  • Amazon-Flipkart sops war in festive sales fizzles out, shows data

    Amazon-Flipkart sops war in festive sales fizzles out, shows data

    Discounts may have been scaled down as the e-commerce market matures and the government looks out for alleged malpractices.

    Radhika Subramanium made umpteen trips to the shiny black Bosch mixer-grinder on her phone in the last few weeks. She put it in her shopping cart and waited for the festive season sale to begin, hoping to get a good deal. At the end of the day, who doesn’t want to save a few extra bucks?

    But, on October 3, the big day when e-commerce giants Amazon and Flipkart locked horns and launched The Great Indian Festival and Big Billion Days, Subramaniam was sorely disappointed. Her cart barely showed any discount. She bought the appliance anyway because it was needed, but her excitement was gone.

    It was largely the same story for Vaibhav Jaiswal. His Boat headphones didn’t even fetch a Rs 200 discount.

    Revati Krishna, in fact, checked out with zero discount on the sit-and-bounce ball she had picked up for her nephew.

    Subramanium, Jaiswal and Krishna are among hundreds of Indians who realised that e-commerce sales no longer offer the lucrative discounts they used to, except for select products such as mobile phones.

    On average, 30 percent of the products sold across the electronics category which houses products like refrigerators, air-conditioners and laptops on Amazon and Flipkart had no discount during their week-long festive sale season, according to a study by a data analytics company.

    Higher prices

    Interestingly, 8-11 percent of the products across categories such as washing machines, microwave ovens and laptops even showed higher prices during the sale across the two platforms.

    The price comparisons were made with rates displayed on October 1, the last business-as-usual day before the sale started.

    The data was compiled by Bengaluru-based digital commerce analytics platform DataWeave, which counts Japanese ad-tech firm FreakOut Group and domestic venture capital firm Blume Ventures among its investors. The data was shared exclusively with Moneycontrol.

    The discounts were lean even on lower-priced products. Amazon dangled a 6.4 percent discount on air-conditioners priced at Rs 33,500-34,000 during the sale, while Flipkart offered barely a 5 percent discount, according to the data.

    This is a far cry from discounts in the 60-70 percent range that used to be advertised across electronics and appliances categories on online marketplaces.

    For this analysis, DataWeave trawled the first five pages of the electronics category, which houses products, including air-conditioners, cameras, headphones, laptops, microwave ovens, refrigerators, smart televisions, smartwatches, and washing machines. The firm scanned 1,184 products.

    Gone are the days when discounts were offered for habit-forming. According to experts, with the markets maturing, companies no longer fancy hoarding deal hunters.

    “As people have got used to buying online, the companies have decided to focus on convenience rather than price,” said Harish HV, managing partner at ECube Investment Advisors. “You won’t even find a significant difference between the price of a product across the two marketplaces Amazon and Flipkart, which have a clear duopoly. It will go on like this unless a big new entrant starts disrupting prices again.”

    According to Harish Bijoor, … Continue reading the article here
    This article was originally published on Moneycontrol on October 27, 2021

  • Amazon Prime Day Secrets all Brands need to know.

    Amazon Prime Day Secrets all Brands need to know.

    Prime Day or not, brands need to make sure their Digital Shelf is well stocked, highly discoverable in crowded marketplaces, have the right offers and discounts to stay competitive, all while making sure their products have glowing reviews, ratings and optimized content. While this is a year-round effort, brands go the extra mile on Prime Day to make sure they’re putting their best foot forward.

    Methodology
    To understand how brands adapted their digital shelf for Prime Day, we examined data insights across Amazon in 6 markets and compared the following brand KPIs:

    • Share of voice (SOV): The percentage of a brands products that appear in the search results page for relevant keywords on Amazon.
    • Availability: The percentage of products in stock on Amazon for Prime Day.
    • Additional discounts: The reduction in the listing price of a product during Prime Day compared to before or after the event to see how brands adapted their pricing strategies to stand out from rivals

    Winning brands made sure their products were ‘highly’ discoverable

    With all the global lockdowns, home entertainment hit a new high. So we looked at the word “TV” to see which brand had the highest share against this keyword during the Prime Day event.

    • In the US – Samsung won hands down with close to 15% SOV. LG came in at a not so close 2nd with 9% SOV.
    • In the UK – Samsung won again with a whooping 16.7% SOV with Sharp at # 2 at 12%.

    Now let’s look at some key European markets

    • On Amazon Italy we saw a similar trend – Samsung & LG, neck to neck at 22% & 19% respectively.
    • Amazon Germany was no different – Samsung had the highest SOV at 15% and Philips far behind at 7%.

    Samsung has such a strong association with the keyword TV. This means, when customers are searching for TVs on Amazon in these regions – the brand that has the largest selection up on display for them to choose from is Samsung! That’s definitely going to have a positive impact on sales, don’t you think?

    Do you know which keywords you should be tracking for your brand? And do you know your Brand’s SOV against those keywords?

    … & finally, an outlier!

    • In Amazon France, LG took the lead for a change – with 15% SOV. But we have Samsung not far behind at 13%.

    Kudos to team Samsung!

    Winning Brands kept a close eye on product availability

    Poor product availability leads to lost sales. But not on Amazon Prime Day! Bigger brands that sell over 500 products created artificial scarcity by listing a chunk of products out of stock before the sale. And restocked aggressively during the sale.

    In contrast, the smaller brands that sold fewer than 100 products didn’t dare make such bold moves and stayed stocked up even pre-event to avoid even a single day of lost sales.

    Let’s look at some data from the US

    • The average availability for bigger brands selling 500+ products before the sale was 41% and then went up dramatically to 81.4% the day of the sale when they aggressively restocked.

    Similar trend in the UAE

    • Availability pre-sale was 26.2% and during the sale shot up to 87.6%!

    Various other markets displayed similar patterns. And this was only possible because these brands were able to track their availability with precision and plan their stock levels accordingly.

    How are you tracking your availability across marketplaces? Do you know when your products are out of stock and are in immediate need of replenishment?

    Winning Brands made strategic pricing and discounting decisions

    Discounts matter. Period. And brands that use discounts strategically, win.

    Let’s look at Airpods on Amazon in the US.

    • During the event, Apple had the highest SOV for the keyword Airpod at 7.5% followed by SkullCandy, an American audio accessory manufacturer at 5.6%. 
    • Here’s the interesting part – during the sale Apple offered just 3.4% additional discounts while SkullCandy offered 32.1% additional discount to try and win sales from Apple. And looks like it worked! Apples SOV dropped from 13.5% before the event to 7.5% during the event and SkullCandy’s SOV improved 

    Now let’s look at the same data cut in the UAE – a market where Apple products have a fair penetration, but not as high as in the US. They needed a more aggressive discounting strategy in this market.

    • In the US, during the sale, Apple offered additional discounts on just 30% of products. However, in the UAE that number rose to 90% – a clear strategy to make their product pricing more attractive to customers to win sales

    Discounts and markdowns aren’t always the answer to improving sales, but when used strategically can drive significant impact to your bottom line.

    Are you tracking your competitor pricing? Do you know if they’re keeping tabs on your pricing strategy to get ahead of you?

    Winning Brands made it to the Amazon Best Seller list

    Amazon Best Sellers are products that have the highest sales on Amazon. Products with a higher Amazon Best Seller Rank have higher sales.

    • In the US, Nintendo had the highest share in the Electronics Best Seller category during the sale at 18.6%. Before the sale their share stood at 22.5% – so they lost ground a little ground with a 27.2% drop in their Best Seller share. While they gave additional discounts of 17%, only 27% of their catalogue was discounted.
    • But here’s a brand that knocked it out of the park! The Razer had an SOV of just 1.18% before the sale and during Prime Day it shot up to 6%! A clear indication that sales for the Razer spiked exponentially during Prime Day. Could this be because Razer offered 100% of their catalogue on an additional discount of 31%? It’s a bold move that could have paid off and contributed to super high sales. 

    Now let’s look at France – the Fashion Capital of the World and which brand came out on top in the Fashion Best Seller Category

    • Footwear brand Havaianas had the highest SOV on Prime Day (13.48%) Not too surprising because before the sale they were at 14.09%
    • Now let’s look at the Best Seller Rank – Lacoste secured BSR #1 at the event. Pat on the back for them because before the sale they were at Rank 46! And post-sale they dropped to #6. Definitely a combination of techniques involved here that got them from #46 to #1 at super speed!

    What techniques have you tried to boost sales for your products on Amazon?

    Brands that do not optimize their Digital Shelf risk losing out on their share of basket. If you’ve been thinking about how to optimize your Brands Digital Shelf, then get in touch & learn how DataWeave can help!

  • Amazon Prime Day 2021 Discounts Set Home Leaders Apart

    Amazon Prime Day 2021 Discounts Set Home Leaders Apart

    Home is where the shopping cart is.

    After last year’s blistering pace of e-commerce sales growth in the home category, we at DataWeave wanted to know how Prime Day 2021 discounts on home products would impact retailers and brands around the world.

    We focused our analysis on how international retailers adapted their Prime Day pricing strategies to distinguish their offerings across eight home subcategories, including bed & bath, kitchen and pet supplies.

    Our Methodology
    We tracked the pricing of products among 21 leading retailers in nine countries across five regions, including:

    • The US (Ace Hardware, Amazon US, Best Buy, Home Depot, Lowe’s, Petco, PetSmart, Target and Wayfair US)
    • The UK (Amazon UK, Ebay, Etsy, OnBuy and Wayfair UK)
    • Europe (Amazon France, Amazon Germany and Amazon Italy)
    • The Middle East (Amazon Saudi Arabia and Amazon UAE)
    • Asia (Amazon Japan and Amazon Singapore)

    The results showed some surprising differences among retailers and regions. See how retailers used pricing as a competitive strategy to win Prime Day sales in the home category, as well as international home brands that stood out for the discounts on their products.

    Percentage of items with a price decrease

    The US retailer with the overall highest percentage of home products with a price decrease for Prime Day was Amazon US (26.4%).

    Home subcategories with the highest percentage of items with a price decrease per US retailer were:

    Ace Hardware: Power & hand tools (21.2%)
    Amazon US: Furniture (36.3%), appliances (34.1%) and kitchen (28.3%)
    Best Buy: Appliances (0.9%)
    Home Depot: Power & hand tools (0.2%)
    Lowe’s: Furniture (29.2%), power & hand tools (5.5%) and appliances (4.1%)
    Petco: Pet supplies (11.6%)
    Target: Bed & bath (37.9%), furniture (32.5%) and kitchen (11.5%)
    Wayfair US: Pet supplies (31.9%), home & garden (25.6%) and bed & bath (24.8%)

    The UK retailer with the overall highest percentage of items with a price decrease for Prime Day was Amazon UK (36.4%).

    Home subcategories with the highest percentage of items with a price decrease per UK retailer were:

    Amazon UK: Appliances (41.7%), power & hand tools (39.5%) and furniture (36.4%)
    Ebay: Smart home (10.5%), bed & bath (10.1%) and furniture (8.3%)
    Etsy: Bed & bath (1.7%), kitchen and pet supplies (both 1.5%)
    Wayfair UK: Kitchen (17.7%), bed & bath (10.8%) and home & garden (5.9)

    In Europe, Amazon Germany had the overall highest percentage of items with a price decrease for Prime Day (27.3%).

    Home subcategories with the highest percentage of items with a price decrease per European retailer were:

    Amazon France: Appliances (15.9%), power & hand tools (15.8%) and furniture (14.2%)
    Amazon Germany: Power & hand tools (40.0%), appliances (33.7%) and pet supplies (28.4%)
    Amazon Italy: Furniture (11.8%)

    Across the Middle East & Asia, Amazon UAE had the overall highest percentage of items with a price decrease for Prime Day (41.6%).

    Home subcategories with the highest percentage of items with a price decrease per retailer were:

    Amazon Saudi Arabia: Power & hand tools (53.8%), pet supplies (33.3%) and appliances (30.4%)
    Amazon UAE: Appliances (55.8%), kitchen (49.9%) and pet supplies (49.0%)
    Amazon Japan: Appliances (15.3%), power & hand tools (10.8%) and furniture (9.0%)
    Amazon Singapore: Bed & bath (35.4%), appliances (30.2%) and power & hand tools (27.2%)

    Magnitude of price decrease

    The US retailer with the greatest overall magnitude of price decrease for Prime Day was Target (20.3%).

    The home subcategories with the greatest magnitude of price decrease per US retailer were:

    Ace Hardware: Power & hand tools (14.3%)
    Amazon US: Kitchen (21.0%), appliances and pet supplies (both 18.3%) and furniture (15.1%)
    Best Buy: Appliances (8.7%)
    Home Depot: Power & hand tools (17.7%)
    Lowe’s: Power & hand tools (13.4%), furniture (13.0%) and appliances (10.8%)
    Petco: Pet supplies (17.2%)
    Target: Bed & bath (28.9%), smart home and kitchen (both 19.1%) and furniture (18.5%)
    Wayfair US: Pet supplies (4.6%), kitchen (4.4%) and bed & bath (4.1%)

    Brands with the greatest magnitude of price decreases per US retailer included:

    Ace Hardware: Zircon (48.6%), Smith\u0027s (36.1%) and DMT (30.0%)
    Amazon US: Supply Guru (56.3%), Seresto (55.4%) and Advantage (53.4%)
    Best Buy: Panasonic (29.1%), Farberware (16.6%) and Insignia™ (14.0%)
    Home Depot: Husky (17.7%)
    Lowe’s: Metabo HPT (43.2%), Dewalt (27.8%) and GZMR (26.5%)
    Petco: Seresto (50.0%), Open Road Brands (45.4%) and Starmark (42.1%)
    Target: Little Tikes (50.0%), Bobsweep (43.9%) and Shark (42.2%)
    Wayfair US: Sorbus (57.8%), GE Appliances (45.9%) and Nu Steel (42.1%)

    The UK retailer with the greatest overall magnitude of price decrease for Prime Day was Etsy UK (19.8%).

    The home subcategories with the greatest magnitude of price decrease per UK retailer were:

    Amazon UK: Furniture (21.8%), power & hand tools (21.5%) and appliances (20.8%)
    Ebay: Pet supplies (12.2%), appliances and furniture (both 12.0%) and bed & bath (10.0%)
    Etsy: Pet supplies (44.3%), kitchen (18.1%) and bed & bath (14.2%)
    Wayfair UK: Home & garden (12.2%), bed & bath (9.2%) and furniture (8.9%)

    Brands with the greatest magnitude of price decreases across home sub-categories per UK retailer included:

    Amazon UK: Tefal (54.0%), Caterpack (51.6%) and Nylabone (49.9%)
    Ebay: Bob Martin (59.8%), Fridgemaster (57.5%) and Tetramin (49.3%)
    Etsy: Celebnails and vitrifiedstudio (both 49.5%), Deco-Den UK Supplies (46.5%) and Caxo Beauty (36.9%)
    Wayfair UK: Breakwater Bay (41.1%), Zipcode Design (33.3%) and Heritage Brass (29.7

    Among European retailers, Amazon Italy offered the greatest overall magnitude of price decrease for Prime Day (29.9%) among a total of 49 products.

    The home subcategories with the greatest magnitude of price decrease per European retailer were:

    Amazon France: Bed & bath (11.7%), pet supplies (11.2%) and appliance (9.2%)
    Amazon Germany: Kitchen (23.4%), power & hand tools (22.3%) and furniture (20.2%)
    Amazon Italy: Furniture (29.9%)

    Brands with the greatest magnitude of price decreases per European retailer included:

    Amazon France: Thermobaby (47.6%), Sinogoods (44.6%) and Tractive (40.0%)
    Amazon Germany: Sage Appliances (56.5%), Nasum (51.7%) and Hikenture (49.2%)
    Amazon Italy: Gifort (55.1%) and Wokkol (4.8%)

    Across the Middle East and Asia, Amazon UAE offered the greatest overall magnitude of price decrease for Prime Day (15.3%).

    The home subcategories with the greatest magnitude of price decrease per retailer were:

    Amazon Saudi Arabia: Furniture (18.0%), pet supplies (15.9%) and power & hand tools (15.8%)
    Amazon UAE: Pet supplies (17.8%), appliances (16.4%) and kitchen (16.2%)
    Amazon Japan: Kitchen (25.4%), furniture (14.5%) and bed & bath (13.6%)
    Amazon Singapore: Kitchen (14.0%), furniture (11.1%) and appliances (8.0%)

    Brands with the greatest magnitude of price decreases per retailer in the Middle East and Asia included:

    Amazon Saudi Arabia: American Baby Company (55.5%), Charmcollection (49.0%) and LG (46.9%)
    Amazon UAE: Knorr (54.0%), Ocean Patio (50.0%) and Bikuul (48.2%)
    Amazon Japan: キングジム (King Jim) (59.1%), Skylight (52.0%) and Cozyone, Hbada and Bauhutte (バウヒュッテ) (all 50.0%)
    Amazon Singapore: Trademark Home (59.8%), Gaggia (54.5%) and Ely’s & Co. (46.8%)

    Discounts before, during and after the event

    The US retailer with the biggest overall home discount before Prime Day was Amazon US (27.0%). Amazon’s biggest pre-event discounts were on power & hand tools (28.6%), kitchen (28.3%) and furniture (28.0%).

    Ace Hardware offered the biggest discounts on power & hand tools during and after the event (both 34.1%).

    Amazon UK stood out for discounts this Prime Day. It was the UK retailer with the biggest overall home discount before (26.1%) Prime Day, with the deepest discounts on appliances (29.0%), power & hand tools (27.1%) and pet supplies (25.9%).

    During Prime Day, Etsy and Amazon UK offered the biggest discounts (29.7% and 29.6%, respectively).
    Etsy’s top discounts were on pet supplies (40.0%), kitchen (32.5%) and bed & bath (28.1%), while Amazon UK’s top discounts were on power & hand tools (32.3%), appliances (31.4%) and pet supplies (28.9%).

    After the event, Etsy had the biggest discount (29.8%), led by kitchen (34.3%), pet supplies (32.9%) and bed & bath (28.9%).

    In Europe, Amazon Italy offered the biggest overall home discount before (31.6%) and during (29.4%) Prime Day. Amazon France offered the biggest discount after (21.4%) Prime Day.

    In the pre-sales event, Amazon Italy gave the most generous discounts on pet supplies (31.6%) and appliances (9.3%).

    During Prime Day, Amazon Italy offered the biggest discounts on pet supplies (31.6%), furniture (28.3%) and appliances (9.3%).

    After Prime Day, Amazon France offered the biggest discounts on kitchen (24.6%), appliances (22.9%) and pet supplies (21.4%).

    Popularity

    In the US, among home products with high popularity, Amazon US offered the highest percentage of items with a price decrease (26.8%) and Target offered the greatest magnitude of price decrease (23.6%).

    For home items with moderate popularity, Amazon US offered the highest percentage of items with a price decrease (26.9%) and Target offered the greatest magnitude of price decrease (18.9%).

    Among home merchandise with low popularity, Amazon US offered both the highest percentage of items with a price decrease (23.8%) and the greatest magnitude of price decrease (15.9%).

    Amazon UK stood out in this analysis of product popularity. In the UK, among home products with high popularity, Amazon UK offered the highest percentage of items with a price decrease (37.1%) and Etsy offered the greatest magnitude of price decrease (20.9%).

    For home items with medium popularity, Amazon UK offered the highest percentage of items with a price decrease (35.9%) and Etsy offered the greatest magnitude of price decrease (24.4%).

    Among home merchandise with low popularity, Amazon UK offered both the highest percentage of items with a price decrease (34.9%) and the greatest magnitude of price decrease (21.7%).

    In Europe, Amazon Germany stood out for discounts for home products across all levels of popularity.

    Among home goods with high popularity, Amazon Germany offered both the highest overall percentage of items with a price decrease (29.1%) and the greatest overall magnitude of price decrease (19.1%).

    For home items with medium popularity, Amazon Germany offered both the highest percentage of items with a price decrease (28.4%) and the greatest magnitude of price decrease (19.8%).

    Among home merchandise with low popularity, Amazon Germany offered the highest percentage of items with a price decrease (22.5%) and Amazon Italy offered the greatest magnitude of price decrease (55.1%) related to a product count of 9.

    In Middle East & Asia, among home items with high popularity, Amazon Singapore offered the highest overall percentage of items with a price decrease (35.6%) and Amazon Saudi Arabia had the greatest overall magnitude of price decrease (19.4%).

    For home products with medium popularity, Amazon UAE offered both the highest percentage of items with a price decrease (47.5%) and the greatest magnitude of price decrease (16.0%).

    Among home goods with low popularity, Amazon UAE offered the highest percentage of items with a price decrease (43.3%) and Amazon Japan had the greatest magnitude of price decrease (15.5%).

    Prime Day 2021 hit a global home run

    Overall, Prime Day 2021 offered consumers many generous deals on home products across every region.

    According to our analysis, the retailers whose Prime Day pricing stood the most were Amazon US and Target in the US, Amazon UK and Etsy in the UK, Amazon Germany and Amazon Italy in Europe, Amazon UAE in the Middle East and Amazon Japan in Asia.

    Check out our Prime Day 2021 pricing insights across other categories, including health & beauty, fashion and electronics.

  • Prime Day 2021’s Best Fashion Discounts Around the World

    Prime Day 2021’s Best Fashion Discounts Around the World

    Consumers are moving beyond yoga pants. After a long year of pandemic lockdowns and the casual comfort of a homebody lifestyle, shoppers are giving their wardrobes a makeover. During this year’s Prime Day sales event, retailers around the world were well prepared for fashion shoppers’ enthusiasm for a fresh look.

    That’s why we at DataWeave wanted to know how Prime Day 2021 discounts played a role in fashion marketing. We focused our analysis on how global retailers adapted their Prime Day pricing strategies to distinguish their offerings across seven fashion subcategories, including men’s and women’s shoes, and clothing & accessories.

    Our Methodology
    We tracked the pricing of products among 16 leading retailers in nine countries across five regions, including:

    • The US (Amazon US, Nordstrom, Target, Walmart and Zappos)
    • The UK (Amazon UK, Ebay, Etsy and OnBuy)
    • Europe (Amazon France, Amazon Germany and Amazon Italy)
    • The Middle East (Amazon Saudi Arabia and Amazon UAE)
    • Asia (Amazon Japan and Amazon Singapore)

    This year’s results showed some impressive discounts among retailers and across regions. Let’s see how retailers used pricing as a competitive strategy to win Prime Day sales in the fashion category, as well as international fashion brands that stood out for the generous discounts on their products.

    Percentage of items with a price decrease

    The US retailer with the overall highest percentage of fashion products with a price decrease for Prime Day was Amazon US (34.5%).

    Fashion subcategories with the highest percentage of items with a price decrease per US retailer were:

    Amazon US: Watches (43.1%), men’s clothing & accessories (34.0%) and men’s shoes and women’s shoes (both 32.8%)
    Nordstrom: Men’s clothing & accessories (5.2%), women’s shoes (2.1%) and women’s clothing & accessories (1.5%)
    Target: Women’s shoes (28.3%), men’s shoes (13.0%) and women’s clothing & accessories (7.2%)
    Walmart: Watches (6.8%), women’s clothing & accessories (6.4%) and men’s shoes (4.2%)
    Zappos: Women’s shoes (28.2%), men’s clothing & accessories (13.6%) and men’s shoes (6.5%

    By far, the UK retailer with the overall highest percentage of items with a price decrease for Prime Day was Amazon UK (30.7%).

    Fashion subcategories with the highest percentage of items with a price decrease per UK retailer were:

    Amazon UK: Women’s shoes (38.5%), watches (33.5%) and men’s shoes (25.0%)
    Ebay: Men’s shoes (7.6%), women’s clothing & accessories (6.0%) and women’s shoes (5.5%)
    Etsy: Jewellery & accessories (4.7%), men’s clothing & accessories (4.3%) and women’s clothing & accessories (2.4%)

    In Europe, Amazon Germany had the overall highest percentage of items with a price decrease for Prime Day (35.0%).

    Fashion subcategories with the highest percentage of items with a price decrease per European retailer were:

    Amazon France: Women’s clothing & accessories (27.6%), watches (24.2%) and men’s shoes (19.4%)
    Amazon Germany: Women’s shoes (38.7%), watches (37.6%) and men’s shoes (36.7%)

    Across the Middle East & Asia, Amazon UAE had the overall highest percentage of fashion items with a price decrease for Prime Day (49.1%).

    Fashion subcategories with the highest percentage of items with a price decrease per retailer were:

    Amazon Saudi Arabia: Men’s clothing & accessories (54.0%), watches (52.0%) and men’s shoes (47.0%)
    Amazon UAE: Watches (55.8%), men’s clothing & accessories (54.3%) and men’s shoes (51.0%)
    Amazon Japan: Women’s clothing & accessories (17.5%) and men’s clothing & accessories (2.6%)
    Amazon Singapore: Women’s clothing & accessories (50.0%), men’s shoes (44.8%) and women’s shoes (40.9%)

    Magnitude of price decrease

    The US retailer with the greatest overall magnitude of price decrease for Prime Day was Nordstrom (29.3%).

    The fashion subcategories with the greatest magnitude of price decrease per US retailer were:

    Amazon US: Women’s clothing & accessories (16.3%), watches (14.6%) and men’s clothing & accessories (14.3%)
    Nordstrom: Women’s clothing & accessories (35.0%), women’s shoes (29.3%) and men’s clothing & accessories (28.4%)
    Target: Men’s clothing & accessories (21.9%), women’s clothing & accessories (19.3%) and women’s shoes (18.6%)
    Walmart: Men’s clothing & accessories (23.5%), women’s shoes (16.7%) and women’s clothing & accessories (11.5%)
    Zappos: Women’s clothing & accessories (11.9%), men’s clothing & accessories (10.6%) and women’s shoes (6.6%)

    Brands with the greatest magnitude of price decreases on fashions per US retailer included:

    Amazon US: Free Soldier (57.3%), Rockport (52.0%) and Alvaq (48.9%)
    Nordstrom: Little Words Project (60.0%), Robert Barakett and Nordstrom (50.0%) and Bonobos (49.1%)
    Target: Cowboy Bebop, Avatar: The Last Airbender, YuYu Hakusho, Dragon Ball Z and Naruto (all 40.0%)
    Walmart: Tredsafe (42.2%), C. Wonder and Crocs (both 30.0%) and Deer Stags (26.1%)
    Zappos: Volcom (25.9%), O’Neill (20.8%) and Bandolino (20.5%)

    In the UK, Ebay and Etsy tied for the greatest overall magnitude of price decrease on fashion products for Prime Day (both 14.7%).

    The fashion subcategories with the greatest magnitude of price decrease per UK retailer were:

    Amazon UK: Women’s shoes (27.9%), men’s shoes (27.5%) and men’s clothing & accessories (18.2%)
    Ebay: Men’s clothing & accessories (19.1%), men’s shoes (17.7%) and watches (17.6%)
    Etsy: Women’s shoes (30.2%), men’s shoes (17.1%) and jewellery & accessories (16.3%)

    Brands with the greatest magnitude of price decreases across fashion sub-categories per UK retailer included:

    Amazon UK: Invicta (43.9%), Boss (42.7%) and Accurist (41.2%)
    Ebay: Dickies (55.6%), Havaianas (55.0%) and Branded (46.7%)
    Etsy: Mirugb (50.0%), LilisLeatherShop (41.6%) and OnaieShop (40.0%)

    Among European retailers, Amazon Germany offered the greatest overall magnitude of price decrease on fashion products for Prime Day (16.1%).

    The fashion subcategories with the greatest magnitude of price decrease per European retailer were:

    Amazon France: Women’s shoes (22.4%), men’s clothing & accessories (12.1%) and watches (9.1%)
    Amazon Germany: Women’s clothing & accessories (17.7%), watches (17.3%) and men’s clothing & accessories (15.0%)

    Brands with the greatest magnitude of price decreases per European retailer included:

    Amazon France: Converse (58.3%), Alsino (43.2%) and Scuderia Ferrari (35.6%)
    Amazon Germany: Truth & Fable Damen Kleider (59.6%), Victorinox (59.5%) and Sockenkauf24 (56.7%)

    Across the Middle East and Asia, Amazon Japan offered the greatest overall magnitude of price decrease on fashion products for Prime Day (18.4%).

    The fashion subcategories with the greatest magnitude of price decrease per retailer were:

    Amazon Saudi Arabia: Men’s clothing & accessories (20.3%), men’s shoes (18.4%) and women’s shoes (16.7%)
    Amazon UAE: Men’s shoes (20.5%), men’s clothing & accessories (19.0%) and women’s shoes (18.9%)
    Amazon Japan: Men’s clothing & accessories (23.7%) and women’s clothing & accessories (18.0%)
    Amazon Singapore: Women’s shoes (12.2%), watches (7.6%) and men’s shoes (5.0%)

    Brands with the greatest magnitude of price decreases per retailer in the Middle East and Asia included:

    Amazon Saudi Arabia: Dorina (48.7%), Cole Haan (40.2%) and Boss (39.7%)
    Amazon UAE: Aldo (53.2%), Mvmt (51.4%) and Inkast Denim Co. (39.4%)
    Amazon Japan: Face Trick Glasses (30.2%), モアプレッシャー (More Pressure) (23.7%) and
    アツギ (Atsugi) (21.7%)
    Amazon Singapore: Bloch (49.0%), Adidas (38.5%) and Chums (31.4%)

    Discounts before, during and after the event

    Nordstrom was the US retailer with the biggest overall fashion discount before (39.0%), during (40.5%) and after (41.2%) Prime Day.

    Nordstrom’s biggest pre-event discounts were on women’s shoes (44.2%), women’s clothing & accessories (36.6%) and men’s clothing & accessories (36.1%).

    Women’s shoes (43.1%), men’s shoes (42.6%) and men’s clothing & accessories (39.5%) were the leading subcategories for Nordstrom’s discounts during Prime Day.

    After the event, Nordstrom’s biggest discounts were for women’s shoes (42.5%), men’s shoes (42.2%) and men’s clothing & accessories (41.5%).

    In the UK, Ebay offered the highest discounts before (43.7%), during (42.1%) and after (42.3%) Prime Day.

    Before Prime Day, Ebay biggest discounts were on men’s clothing & accessories (47.9%), men’s shoes (43.9%) and watches (43.3%).

    Ebay’s top discounts during Prime Day were on men’s clothing & accessories (45.3%), men’s shoes (44.6%) and women’s shoes (39.5%).

    After the event, Ebay had the biggest discounts on men’s clothing & accessories (45.6%), women’s shoes (42.9%) and men’s shoes (41.9%).

    In Europe, Amazon Germany dominated with the biggest overall fashion discounts before (27.1%), during (31.8%) and after (26.5%) Prime Day.

    In the pre-sales event, Amazon Germany offered its most generous discounts on watches (27.5%), women’s shoes (12.6%) and men’s shoes (5.7%).

    During Prime Day, Amazon Germany’s biggest discounts were on women’s clothing & accessories (36.8%), men’s clothing & accessories (32.5%) and watches (32.0%).

    After Prime Day, Amazon Germany had the highest discounts on women’s clothing & accessories (34.1%), men’s clothing & accessories (27.6%) and watches (26.6%).

    Popularity

    In the US, among fashion products with high popularity, Amazon US offered the highest percentage of items with a price decrease (36.8%) and Nordstrom offered the greatest magnitude of price decrease (29.8%).

    For fashion items with medium popularity, Amazon US offered the highest percentage of items with a price decrease (35.2%), and Nordstrom offered the greatest magnitude of price decrease (28.1%).

    Among fashion merchandise with low popularity, Amazon US offered the highest percentage of items with a price decrease (27.2%) and Nordstrom offered the greatest magnitude of price decrease (31.6%).

    In the UK, among fashion products with high popularity, Amazon UK offered the highest percentage of items with a price decrease (31.6%) and Ebay offered the greatest magnitude of price decrease (14.3%).

    For fashion items with medium popularity, Amazon UK offered the highest percentage of items with a price decrease (32.5%) and Ebay offered the greatest magnitude of price decrease (17.6%).

    Among fashion merchandise with low popularity, Amazon UK offered the highest percentage of items with a price decrease (24.5%) and Etsy offered the greatest magnitude of price decrease (23.1%).

    In Europe, Amazon Germany dominated discounts for Prime Day 2021 across all levels of popularity.

    Among fashion goods with high popularity, Amazon Germany offered both the highest overall percentage of items with a price decrease (40.5%) and the greatest overall magnitude of price decrease (16.3%).

    For fashion items with medium popularity, Amazon Germany offered both the highest percentage of items with a price decrease (32.5%) and the greatest magnitude of price decrease (16.5%).

    Among fashion merchandise with low popularity, Amazon Germany offered the highest percentage of items with a price decrease (30.8%) and the greatest magnitude of price decrease (15.1%).

    In Middle East & Asia, among fashion items with high popularity, Amazon Saudi Arabia offered the highest overall percentage of items with a price decrease (55.9%) and Amazon UAE had the greatest overall magnitude of price decrease (20.6%).

    For fashion products with medium popularity, Amazon UAE offered both the highest overall percentage of items with a price decrease (49.3%) and the greatest overall magnitude of price decrease (17.8%).

    Among fashion items with low popularity, Amazon UAE offered the highest percentage of items with a price decrease (46.1%) and Amazon Japan had the greatest magnitude of price decrease (21.5%).

    Prime Day fashion deals galore

    Overall, Prime Day 2021 gave global shoppers an abundance of generous discounts on fashion items.

    According to our analysis, the retailers whose Prime Day pricing stood out the most were Amazon US and Nordstrom in the US, Amazon UK and Ebay in the UK, Amazon Germany in Europe, Amazon UAE in the Middle East and Amazon Japan in Asia.

    For more global Prime Day 2021 pricing insights, see our analysis of electronics and health & beauty products.

  • Prep, Prime and Plenish For Prime Day India 2021

    Prep, Prime and Plenish For Prime Day India 2021

    After demonetization, Covid-19 has probably been one of the worst scenarios for the retail sector in India. The entire nation went into lockdown and the industry noticed some big changes around the entire globe. From remote working to shopping, everything turned to digital and Bharat witnessed new trends across payments, e-commerce, and more.

    Not surprisingly, D2C has been a favorite amongst businesses thanks to its agility. More than 800 brands have joined the direct-to-consumer bandwagon in order to reach their audience quickly and in an efficient way. Where brands such as MamaEarth, Clovia, Bewakoof, Lenskart have been some of the popular brands in the sector, last year even traditional giants such as LG, Ajanta-Orpat, Piaggio, Havells also adopted the D2C model.

    Ramp up in D2c Brand Activity
    Source: Avendus

    Brands are more focused on making the user experience better and it will be safe to say that this year, D2C will be the highlight of the e-tail ecosystem. Naturally, e-commerce giants such as Amazon, Flipkart have played an important role in this revolution. Amazon, which has over 100 Million registered users in India, announced that it will host its flagship event, Prime Day this year on 26-27 July.

    Let’s look at some of the things brands can do to leave their mark this Prime Day in India.

    Digital Shelf Optimisation: Need Of The Hour

    Given that the pandemic has accelerated online shopping nationwide, Digital Shelf Optimisation (DSO) should be the key lever for any brand to accelerate its digital commerce growth. Events such as Prime day are significant for a brand’s reputation, customer experience, overall sales and can help you build a loyal customer base.

    With that in mind, we have prepared a list of things to consider, in order to help brands stand out from the crowd.

    1. Pricing And Discounting

    Pricing and Discounting
    Pricing and Discounting: Offer discounts and deals to attract customers.

    It is obvious that Prime Day will see a tremendous influx of shoppers. Noticeably, impulsive shopping is a trend during these sales, as everybody loves a good product for a discounted price. Make sure to offer discounts and deals to attract customers.

    Another suggestion is to keep a track of competition, their pricing and promotional strategies and keep an eye on price changes happening across relevant categories or SKU’s (Stock Keeping Unit). Competition analysis is a powerful tool and having accurate data on their sales, market share is a critical part of this.

    2. Optimise Product Visibility

    Product Visibility
    Product Visibility: Lakhs of sellers & brands are vying for the same spot

    Marketplaces are crowded, and getting discovered is already hard. Lakhs of sellers & brands are vying for the same spot. And with more people moving online, it’s going to get increasingly harder for brands to stand out. Optimize your search visibility using the right keywords relevant to your brand, strategically spend on Sponsored Ads to secure high visibility placements on Amazon and lastly make sure your online product packaging via product pages contain attractive images to position your product in the best light.

    3. Product Availability

    Product Availability
    Product Availability: Have plenty of stock available

    Make sure to have plenty of stock available as shoppers are likely to turn to other brands/products in case your product is unavailable. Also, keep in mind that people are generally more open to trying new products during a sale as it offers discounts. Track your products’ stock status to make sure they’re available 24 x 7.

    As the foremost goal during sales is to move inventory as much as possible, offering a large assortment is a good idea. Create product bundles that complement each other.

    4. Use A + Content

    A+ Content
    A+ Content is King: The new age packaging for your product

    Content is the new age packaging for your product. Content is crucial to change consumer shortlists & considerations into conversions.

    Your content tells your product story & gives customers the information they need to make a purchase. Use high resolution and accurate images, add features, benefits, USPs of your products clearly. It is advisable to use more than one image to show your product more clearly. Make sure all your brand & product pages on Amazon are optimized.

    5. Ratings And Reviews

    Ratings and Reviews
    Reviews and Ratings: Feedback is a very important e-commerce tool.

    Why would shoppers rely on word-of-mouth when they can take help from millions of people from the community? Not said enough, feedback is a very important e-commerce tool. Amazon’s A9 algorithm presents the choices to the consumers but reviews and star ratings still play an influential role in the journey from consideration to conversion.

    Brands could consider partnering with Dataweave, to keep track of reviews and manage negative ratings on Amazon.

    Summary

    According to a report by EY-IVCA Trend Book 2021, “ The e-commerce industry in India is expected to reach $99 Bn by 2024 and penetration of retail is expected to be 10.7% by 2024, compared to 4.7% in 2019.”

    Internet penetration rate in India 2007-2021 Published by Sandhya Keelery, Apr 27, 2021  Internet penetration rate in India went up to nearly around 45 percent in 2021, from just about four percent in 2007. Although these figures seem relatively low, it meant that nearly half of the population of 1.37 billion people had access to internet that year. This also ranked the country second in the world in terms of active internet users. Internet penetration rate in India from 2007 to 2021
    Source: Statista

    The same report also revealed that India will have 220 Million online shoppers by 2025. With e-commerce growing at an exponential rate, brands are advised to be more statistical & data-driven to win a larger % of online sales. 
    If you think this is the right time to optimize your digital shelf, take a look at our products and services.

    We at DataWeave would be happy to be a part of your e-commerce and digitization journey. You can sign up for a demo with our team to know more

  • Prime Day 2021 Reflected the Global Health & Beauty Category

    Prime Day 2021 Reflected the Global Health & Beauty Category

    As consumers socialize more this year, retailers around the world are competing for sales in the torrid health & beauty category.

    That’s why we at DataWeave wanted to know how Prime Day 2021 discounts played a role in the pricing strategies for health & beauty products. We focused our analysis on how global retailers adapted their Prime Day pricing strategies to distinguish their offerings across seven health & beauty subcategories, including makeup, health care and baby care.

    Our Methodology
    We tracked the pricing of products among 16 leading retailers in nine countries across five regions, including:

    ● The US (Amazon US, Sephora, Target, Ulta and Walmart)
    ● The UK (Amazon UK, Ebay, Etsy and OnBuy)
    ● Europe (Amazon France, Amazon Germany and Amazon Italy)
    ● The Middle East (Amazon Saudi Arabia and Amazon UAE)
    ● Asia (Amazon Japan and Amazon Singapore)

    The results showed some surprising differences among retailers and regions. See how retailers used pricing as a competitive strategy to win Prime Day sales in the health & beauty category, as well as international health & beauty brands that stood out for the discounts on their products.

    Percentage of items with a price decrease

    The US retailer with the overall highest percentage of health & beauty products with a price decrease for Prime Day was Amazon US (23.9%).

    Health & beauty subcategories with the highest percentage of items with a price decrease per US retailer were:

    Amazon US: Fragrance (32.4%), oral care (27.1%) and skin care (22.7%)
    Sephora: Makeup (0.2%)
    Target: Oral care (2.7%), baby care (1.6%) and hair care (0.8%)
    Ulta: Makeup (3.7%), skin care (0.8%) and hair care (0.1%)
    Walmart: Fragrance (35.3%), hair care (27.0%) and skin care (23.1%)

    By far, the UK retailer with the overall highest percentage of items with a price decrease for Prime Day was Amazon UK (41.9%).

    Health & beauty subcategories with the highest percentage of items with a price decrease per UK retailer were:

    Amazon UK: Oral care (62.5%), fragrance (46.2%) and hair care and skin care (both 45.4%)
    Ebay: Makeup (8.1%), fragrance (7.1%) and skin care (4.7%)
    Etsy: Oral care (3.4%), skin care (2.3%) and makeup (0.9%)

    In Europe, Amazon Germany had the overall highest percentage of items with a price decrease for Prime Day (33.1%).

    Health & beauty subcategories with the highest percentage of items with a price decrease per European retailer were:

    Amazon France: Skin care (27.2%), fragrance (25.0%) and hair care (24.4%)
    Amazon Germany: Skin care (49.7%), fragrance (41.3%) and hair care (37.2%)
    Amazon Italy: Skin care (5.9%)

    Across the Middle East & Asia, Amazon UAE had the overall highest percentage of health & beauty items with a price decrease for Prime Day (54.1%).

    Health & beauty subcategories with the highest percentage of items with a price decrease per retailer were:

    Amazon Saudi Arabia: Health care (56.4%), hair care (48.8%) and fragrance (46.2%)
    Amazon UAE: Skin care (64.3%), fragrance (64.0%), and hair care (58.4%)
    Amazon Japan: Oral care (5.3%), skin care (4.5%) and makeup (3.3%)
    Amazon Singapore: Baby care and health care (both 35.6%), makeup (32.6%) and fragrance (31.3%)

    Magnitude of price decrease

    The US retailer with the greatest overall magnitude of price decrease for Prime Day was Ulta (33.3%).

    The health & beauty subcategories with the greatest magnitude of price decrease per US retailer were:

    Amazon US: Hair care (18.0%), baby care (15.5%) and health care (15.4%)
    Sephora: Makeup (24.5%)
    Target: Hair care (46.6%), oral care (28.4%) and skin care and baby care (both 15.0%)
    Ulta: Hair care (40.8%), skin care (34.0%) and makeup (32.5%)
    Walmart: Baby care (11.5%), skin care (11.3%) and hair care (11.0%)

    Brands with the greatest magnitude of price decreases per US retailer included:

    Amazon US: Cerave (54.5%), Aquaphor (54.4%) and Yankee Candle (50.7%)
    Sephora: Nars (25.9%) and Marc Jacobs Beauty (23.1%)
    Target: Kristin Ess (50.0%), Hot Tools (48.6%) and Arc Oral Care (both 40.1%)
    Ulta: KKW Beauty, Lime Crime, Ulta and NYX Professional Makeup (all 50.0%), CoverGirl (47.8%) and Biolage (40.8%)
    Walmart: Whitening Toothpaste (57.6%), Absolute New York (56.7%) and Zdmathe (48.5%)

    The UK retailer with the greatest overall magnitude of price decrease on health & beauty products for Prime Day was Amazon UK (18.6%).

    The health & beauty subcategories with the greatest magnitude of price decrease per UK retailer were:

    Amazon UK: Oral care (23.5%), makeup (22.0%) and skin care (20.2%)
    Ebay: Hair care (16.0%), fragrance (14.4%) and makeup (11.5%)
    Etsy: Makeup (20.0%), oral care (16.1%) and skin care (13.3%)

    Brands with the greatest magnitude of price decreases across health & beauty sub-categories per UK retailer included:

    Amazon UK: Philips Sonicair (56.8%), BaByliss For Men (53.0%) and Dr. PawPaw (52.9%)
    Ebay: Oral-B Braun (50.3%), Clean (50.1%) and Versace (46.0%)
    Etsy: Valdenize (both 48.4%), Allure Wedding Jewelry (32.8%) and Moroccan White (30.0%)

    Among European retailers, Amazon Germany offered the greatest overall magnitude of price decrease on health & beauty products for Prime Day (20.2%).

    The health & beauty subcategories with the greatest magnitude of price decrease per European retailer were:

    Amazon France: Skin care (20.4%), baby care (17.8%) and makeup (16.2%)
    Amazon Germany: Skin care (28.2%), makeup (22.6%) and health care (21.3%)
    Amazon Italy: Skin care (9.9%)

    Brands with the greatest magnitude of price decreases per European retailer included:

    Amazon France: Look Concept (59.8%), Douyao (57.5%) and Eco Styler (57.4% for both hair care and health care)
    Amazon Germany: Le Cuisinier (58.4%), Beurer (47.5%) and Solida (45.9%)
    Amazon Italy: Bezox (9.9%)

    Across the Middle East and Asia, Amazon Japan offered the greatest overall magnitude of price decrease on health & beauty products for Prime Day (18.0%).

    The health & beauty subcategories with the greatest magnitude of price decrease per retailer were:

    Amazon Saudi Arabia: Health care (25.1%), skin care (19.3%) and baby care (16.5%)
    Amazon UAE: Makeup (23.1%), hair care (18.3%) and baby care (18.1%)
    Amazon Japan: Skin care (27.6%), hair care (17.2%) and makeup (14.7%)
    Amazon Singapore: Skin care (10.1%), hair care (8.9%) and health care (8.2%)

    Brands with the greatest magnitude of price decreases per retailer in the Middle East and Asia included:

    Amazon Saudi Arabia: Tide (59.8%), bblüv (58.3%) and Mas (55.0%)
    Amazon UAE: Syoss (59.7%), Vertex (59.1%) and Onesea (58.7%)
    Amazon Japan: ドクターブロナー (Dr. Bronner’s) (54.8%), ゼルマ (Zelma) (50.0%) and いち髪 (47.8%)
    Amazon Singapore: Changing Lifestyles (56.6%), Dynarex (53.0%) and Grohe (52.5%)

    Discounts before, during and after the event

    In the US, specialty beauty retailers’ discounts stood out during Prime Day sales. The US retailer with the biggest overall health & beauty discount before (43.4%), during (39.3%) and after (39.4%) Prime Day was Ulta. During and after Prime Day, Sephora was a close second at 38.2% for both periods.

    Ulta’s biggest pre-event discounts were on makeup (44.2%) and skin care (33.0%). Hair care (40.8%). makeup (39.5%) and skin care (36.0%) were the leading subcategories for Ulta’s discounts during Prime Day. After the event, Ulta’s biggest discounts were for hair care (40.8%), makeup (39.6%) and skin care (37.3%)

    In the UK, OnBuy offered the highest discounts before, during and after Prime Day at 70.0% off baby care products. Yet the total product count was only 2.

    Among the remaining rivals, all of whom had a product count above 1000, Ebay had the highest discounts before (30.8%), during (33.8%) and after (35.0%) Prime Day.

    Before Prime Day, Ebay biggest discounts were on hair care (48.9%), fragrance (23.9%) and makeup (23.4%). Ebay’s top discounts during Prime Day were on hair care (50.3%), makeup (24.9%) and fragrance (24.8%). Similarly, after the event, Ebay had the biggest discounts on hair care (49.9%), makeup (26.7%) and fragrance (26.2%).

    Across retailers in the Middle East & Asia, Amazon UAE offered the biggest overall health & beauty discounts before (26.0%), during (30.7%) and after (26.0%) Prime Day.

    In the pre-sales event, Amazon UAE offered the most generous discounts on makeup (30.7%), fragrance (29.9%) and health care (29.2%).

    During Prime Day, Amazon UAE’s biggest discounts were on makeup (37.2%), fragrance (31.6%) and health care (31.3%).

    During Prime Day, Amazon UAE offered the biggest discounts on fragrance (30.5%), makeup (30.0%) and health care and baby care (both 26.8%).

    Popularity

    In the US, among health & beauty products with high popularity, Amazon US offered the highest percentage of items with a price decrease (24.3%) and Target offered the greatest magnitude of price decrease (29.3%).

    For health & beauty items with medium popularity, Amazon US offered the highest percentage of items with a price decrease (26.0%), and strategic partners Target and Ulta both offered the greatest magnitude of price decrease (33.4%).

    Among health & beauty merchandise with low popularity, Walmart offered the highest percentage of items with a price decrease (18.5%) and Ulta offered the greatest magnitude of price decrease (37.4%).

    Amazon UK stood out among all levels of health & beauty product popularity.

    In the UK, among health & beauty products with high popularity, Amazon UK offered both the highest percentage of items with a price decrease (42.8%) and the greatest magnitude of price decrease (18.6%).

    For health & beauty items with medium popularity, Amazon UK offered the highest percentage of items with a price decrease (42.8%) and Etsy offered the greatest magnitude of price decrease (20.1%).

    Among health & beauty merchandise with low popularity, Amazon UK offered both the highest percentage of items with a price decrease (35.4%) and the greatest magnitude of price decrease (17.6%).

    In Europe, Amazon Germany dominated discounts for health & beauty products across all levels of popularity.

    Among health & beauty goods with high popularity, Amazon Germany offered both the highest overall percentage of items with a price decrease (34.6%) and the greatest overall magnitude of price decrease (20.6%).

    For health & beauty items with medium popularity, Amazon Germany offered both the highest percentage of items with a price decrease (32.7%) and the greatest magnitude of price decrease (20.0%).

    Among health & beauty merchandise with low popularity, Amazon Germany offered the highest percentage of items with a price decrease (33.5%) and the greatest magnitude of price decrease (20.6%).

    In Middle East & Asia, among health & beauty items with high popularity, Amazon UAE offered the highest overall percentage of items with a price decrease (53.0%) and Amazon Saudi Arabia had the greatest overall magnitude of price decrease (18.7%).

    For health & beauty products with medium popularity, Amazon UAE offered the highest overall percentage of items with a price decrease (55.3%) and Amazon Saudi Arabia had the greatest overall magnitude of price decrease (19.7%).

    Among health & beauty goods with low popularity, Amazon UAE offered the highest percentage of items with a price decrease (54.5%) and Amazon Japan had the greatest magnitude of price decrease (18.7%).

    Health & beauty’s stunning Prime Day deals

    Overall, Prime Day 2021 gave shoppers around the world the opportunity to score generous discounts on health & beauty products.

    According to our analysis, the retailers whose Prime Day pricing stood out the most were Amazon US and Ulta in the US, Amazon UK and Ebay in the UK, Amazon Germany in Europe, Amazon UAE in the Middle East and Amazon Japan in Asia.

    Stay tuned for Prime Day 2021 international fashion and home goods pricing insights.