Category: AI

  • Normalizing Size and Color in Fashion Using AI to Power Competitive Price Intelligence

    Normalizing Size and Color in Fashion Using AI to Power Competitive Price Intelligence

    Fashion is as dynamic a market as any—and more competitive than most others. Consumer trends and customer needs are always evolving, making it challenging for fashion and apparel brands to keep up.

    Despite the inherent difficulties fashion and apparel sellers face, this industry is one of the largest grossing markets in the world, estimated at $1.79 trillion in 2024. Global revenue for apparel is expected to grow at an annual rate of about 3.3% over the next four years. That means companies in this space stand to make significant revenue if they can competitively price their products, keep up with the competition, and win customer loyalty with consistent product availability.

    There are three main categories in fashion and apparel. These include:

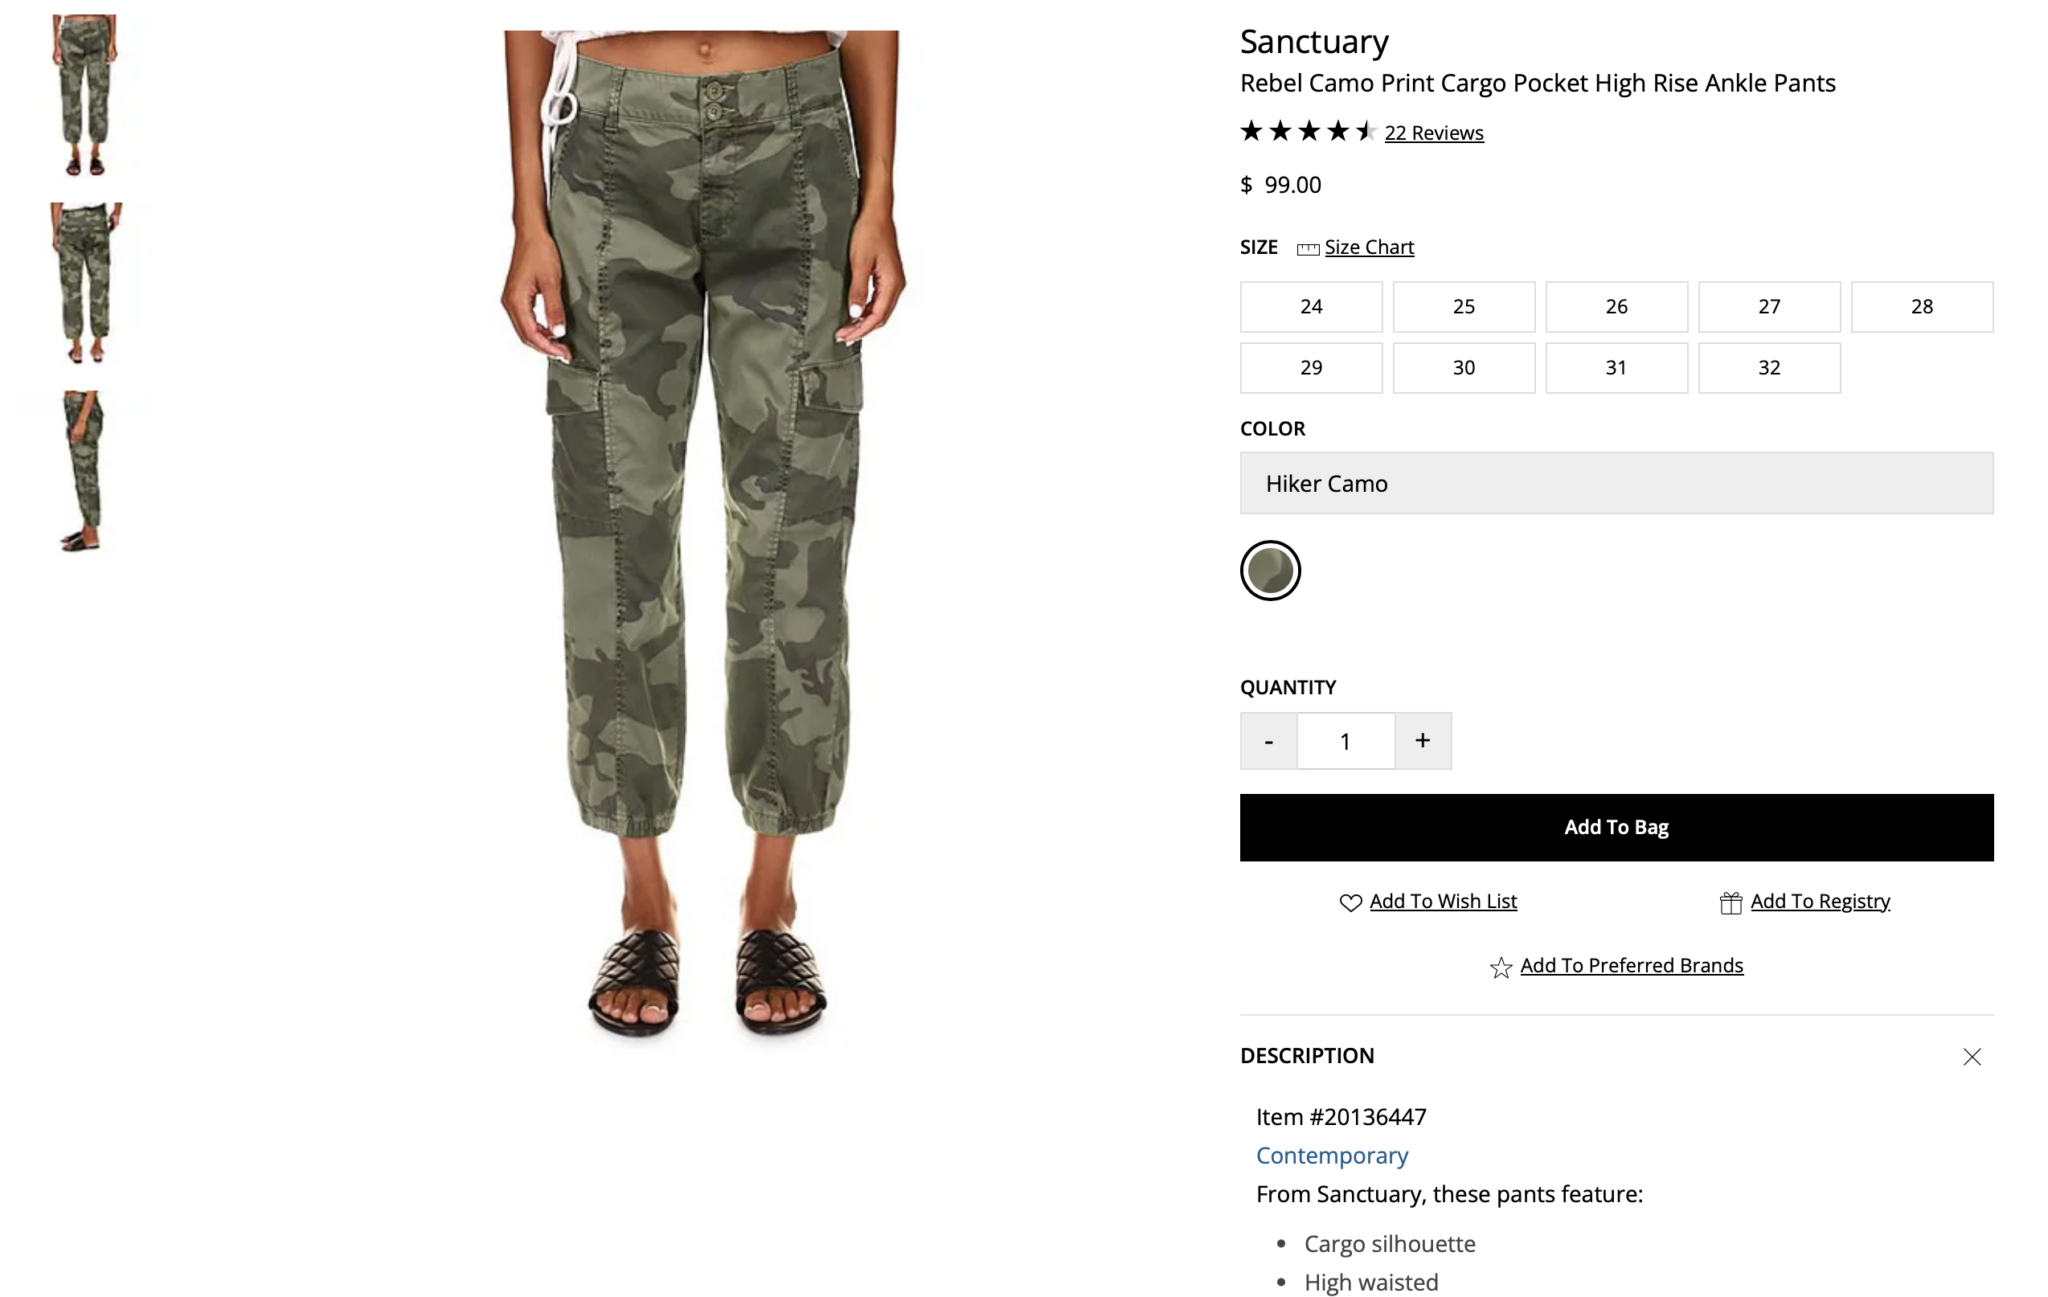
    • Apparel and clothing (i.e., shirts, pants, dresses, and other apparel)
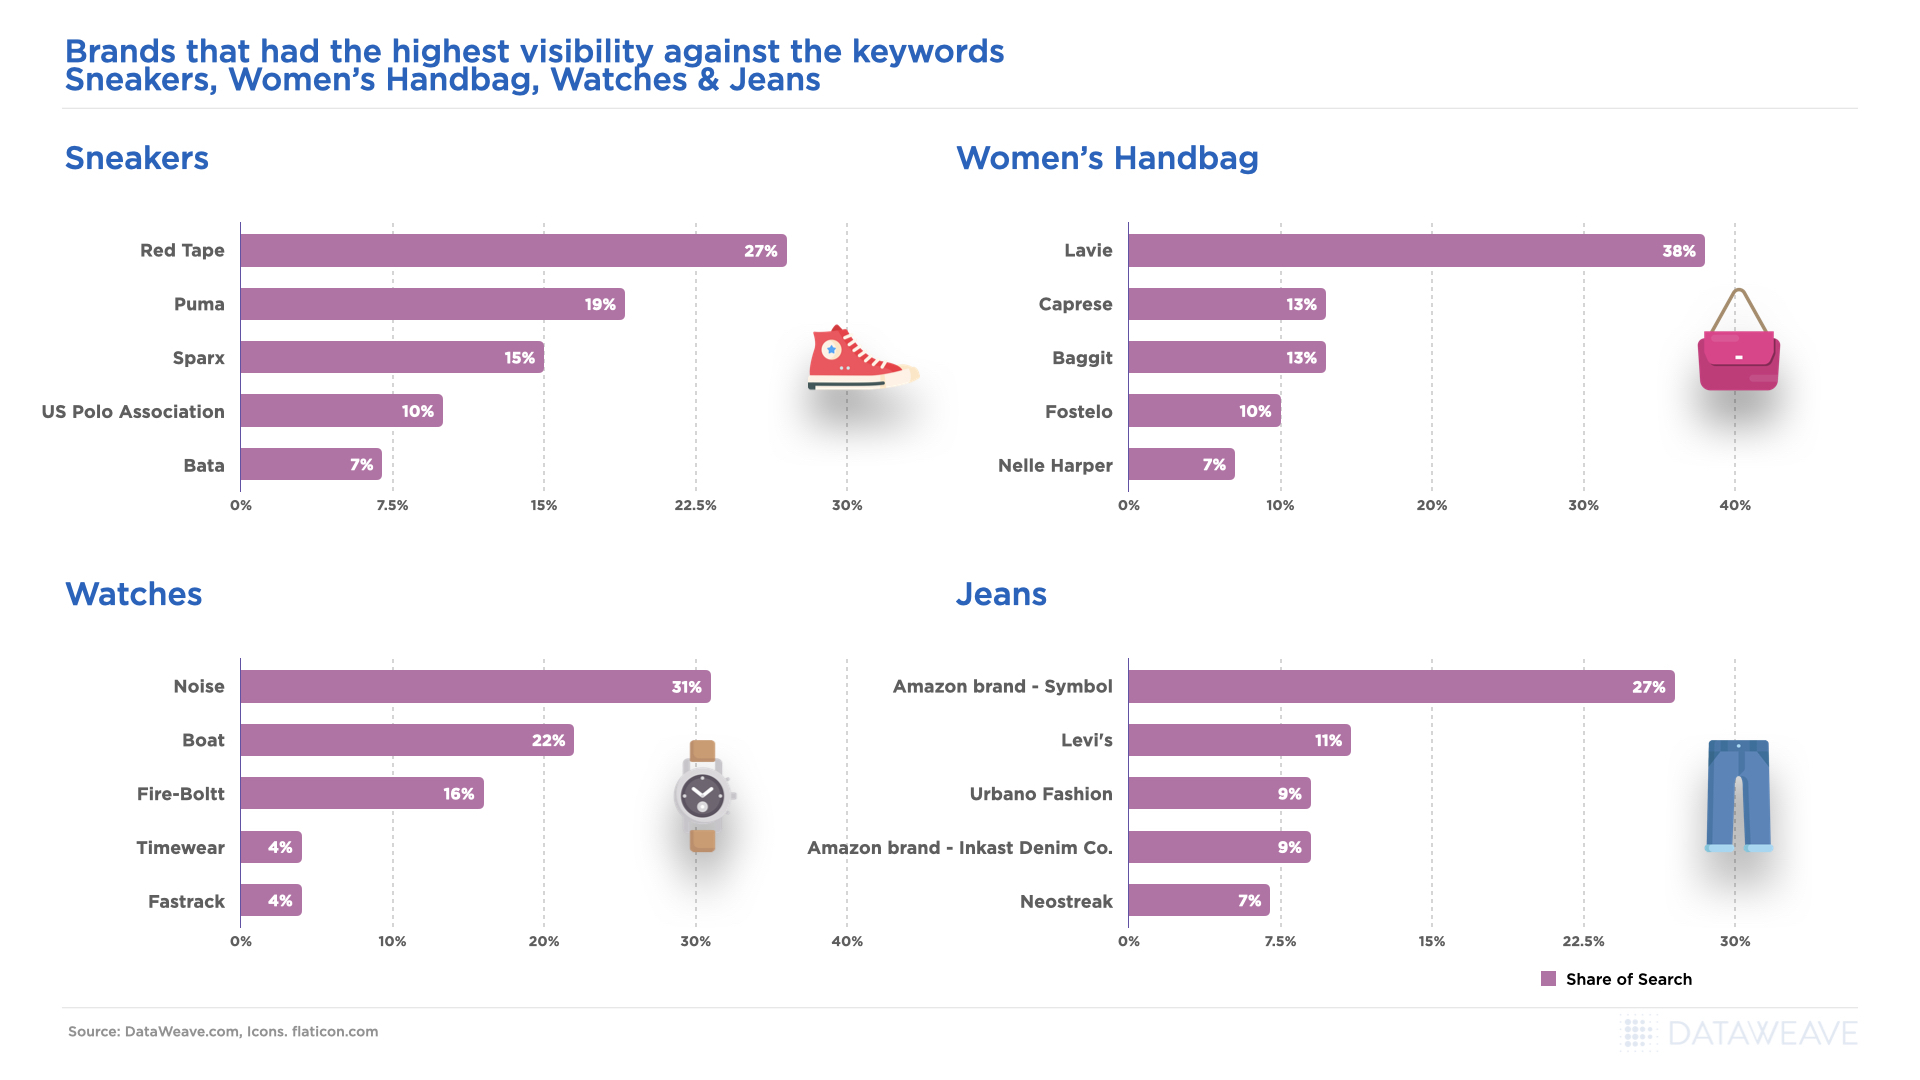
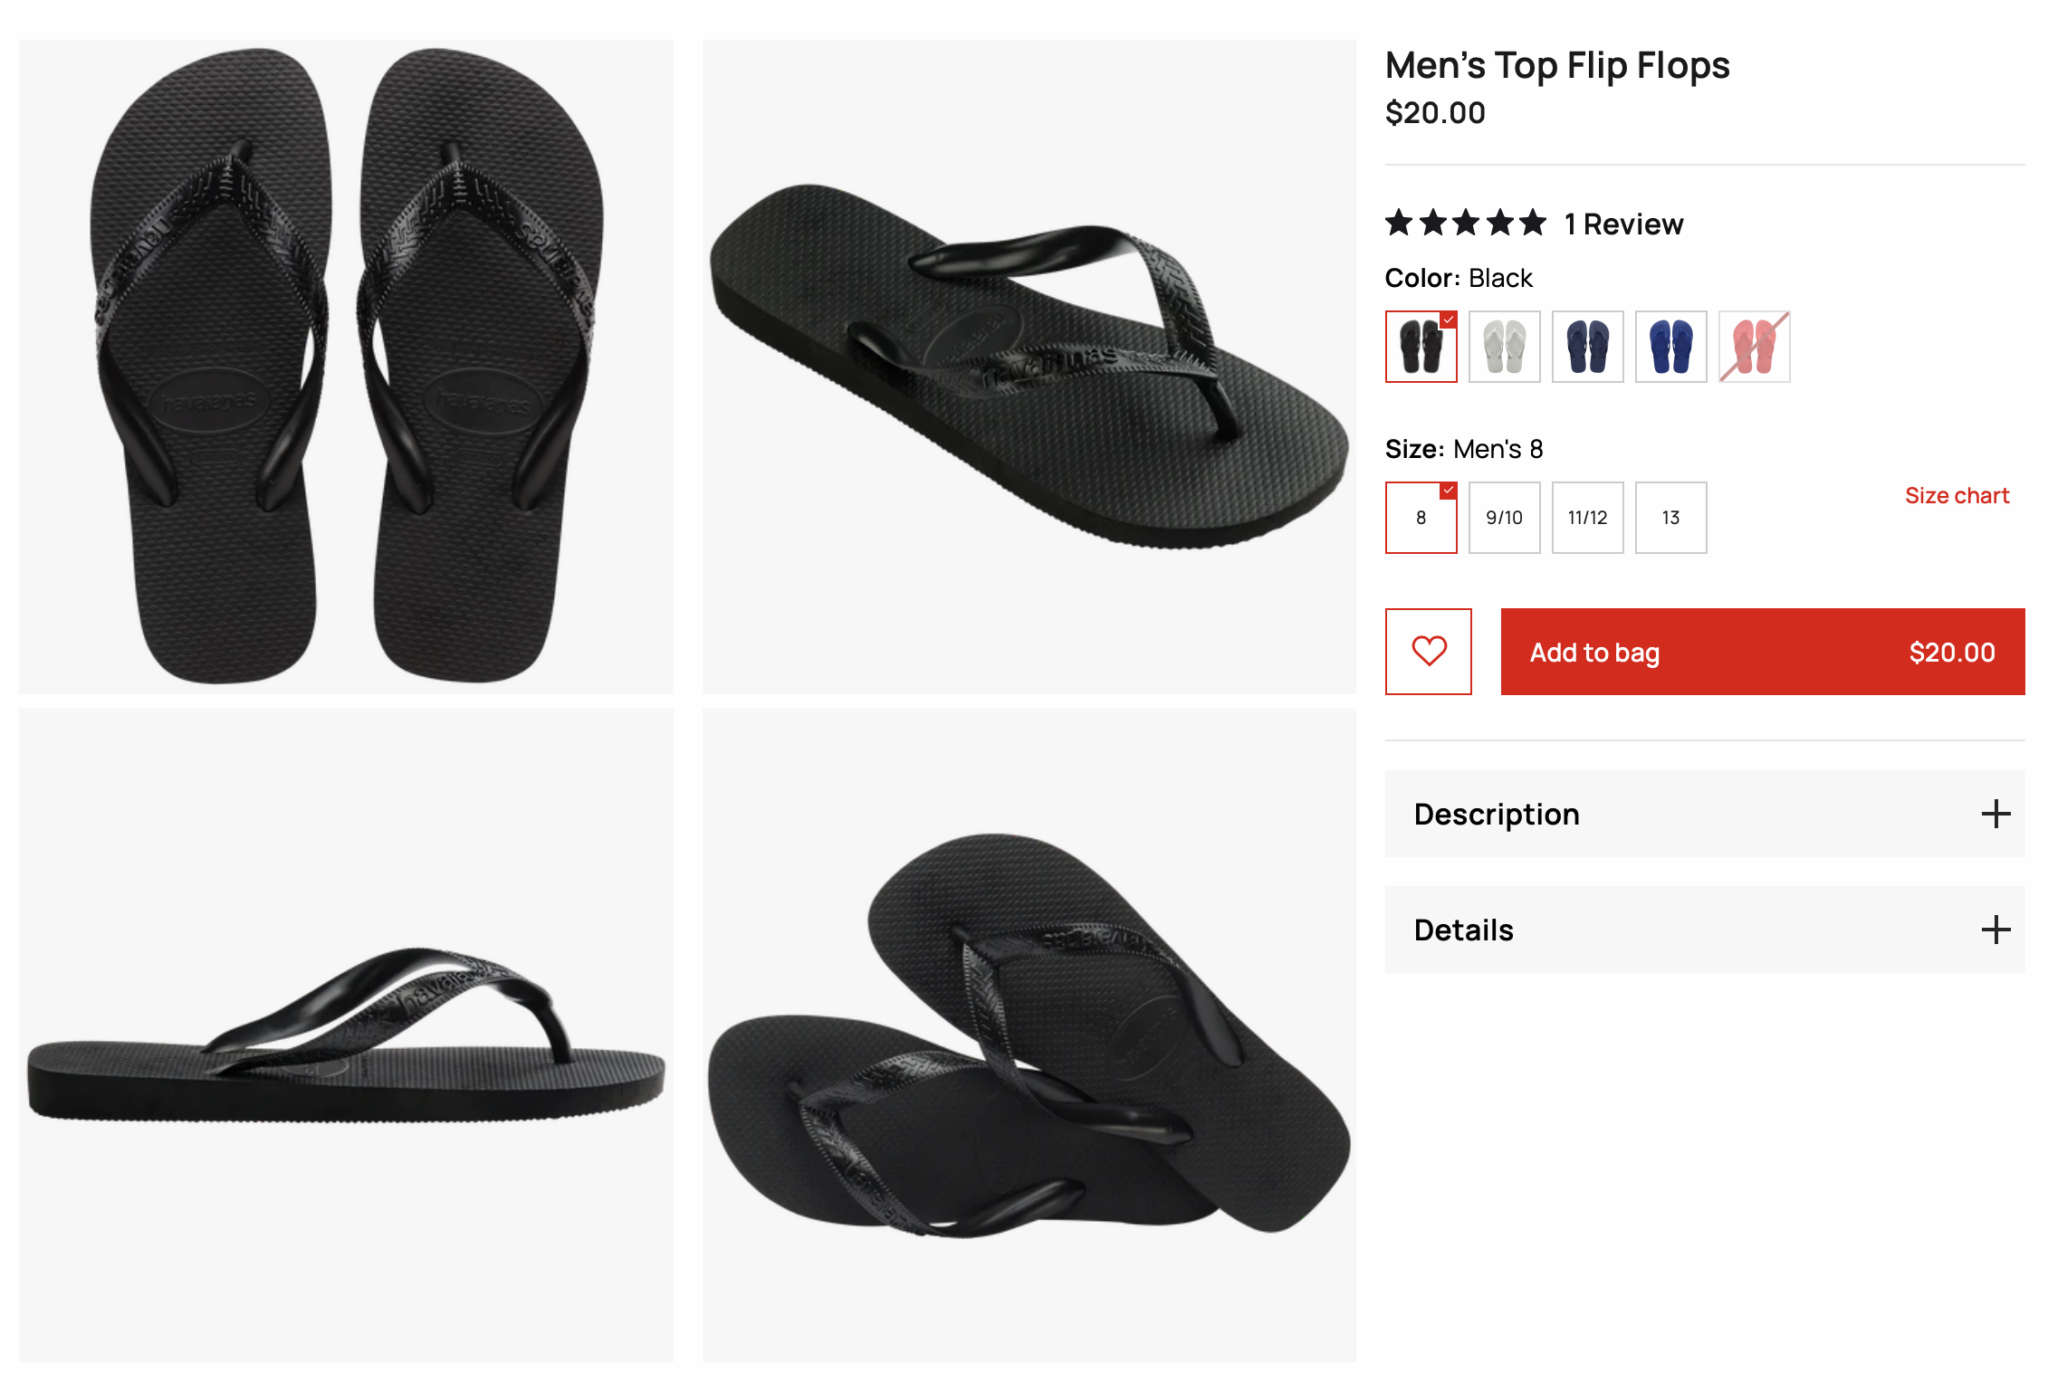
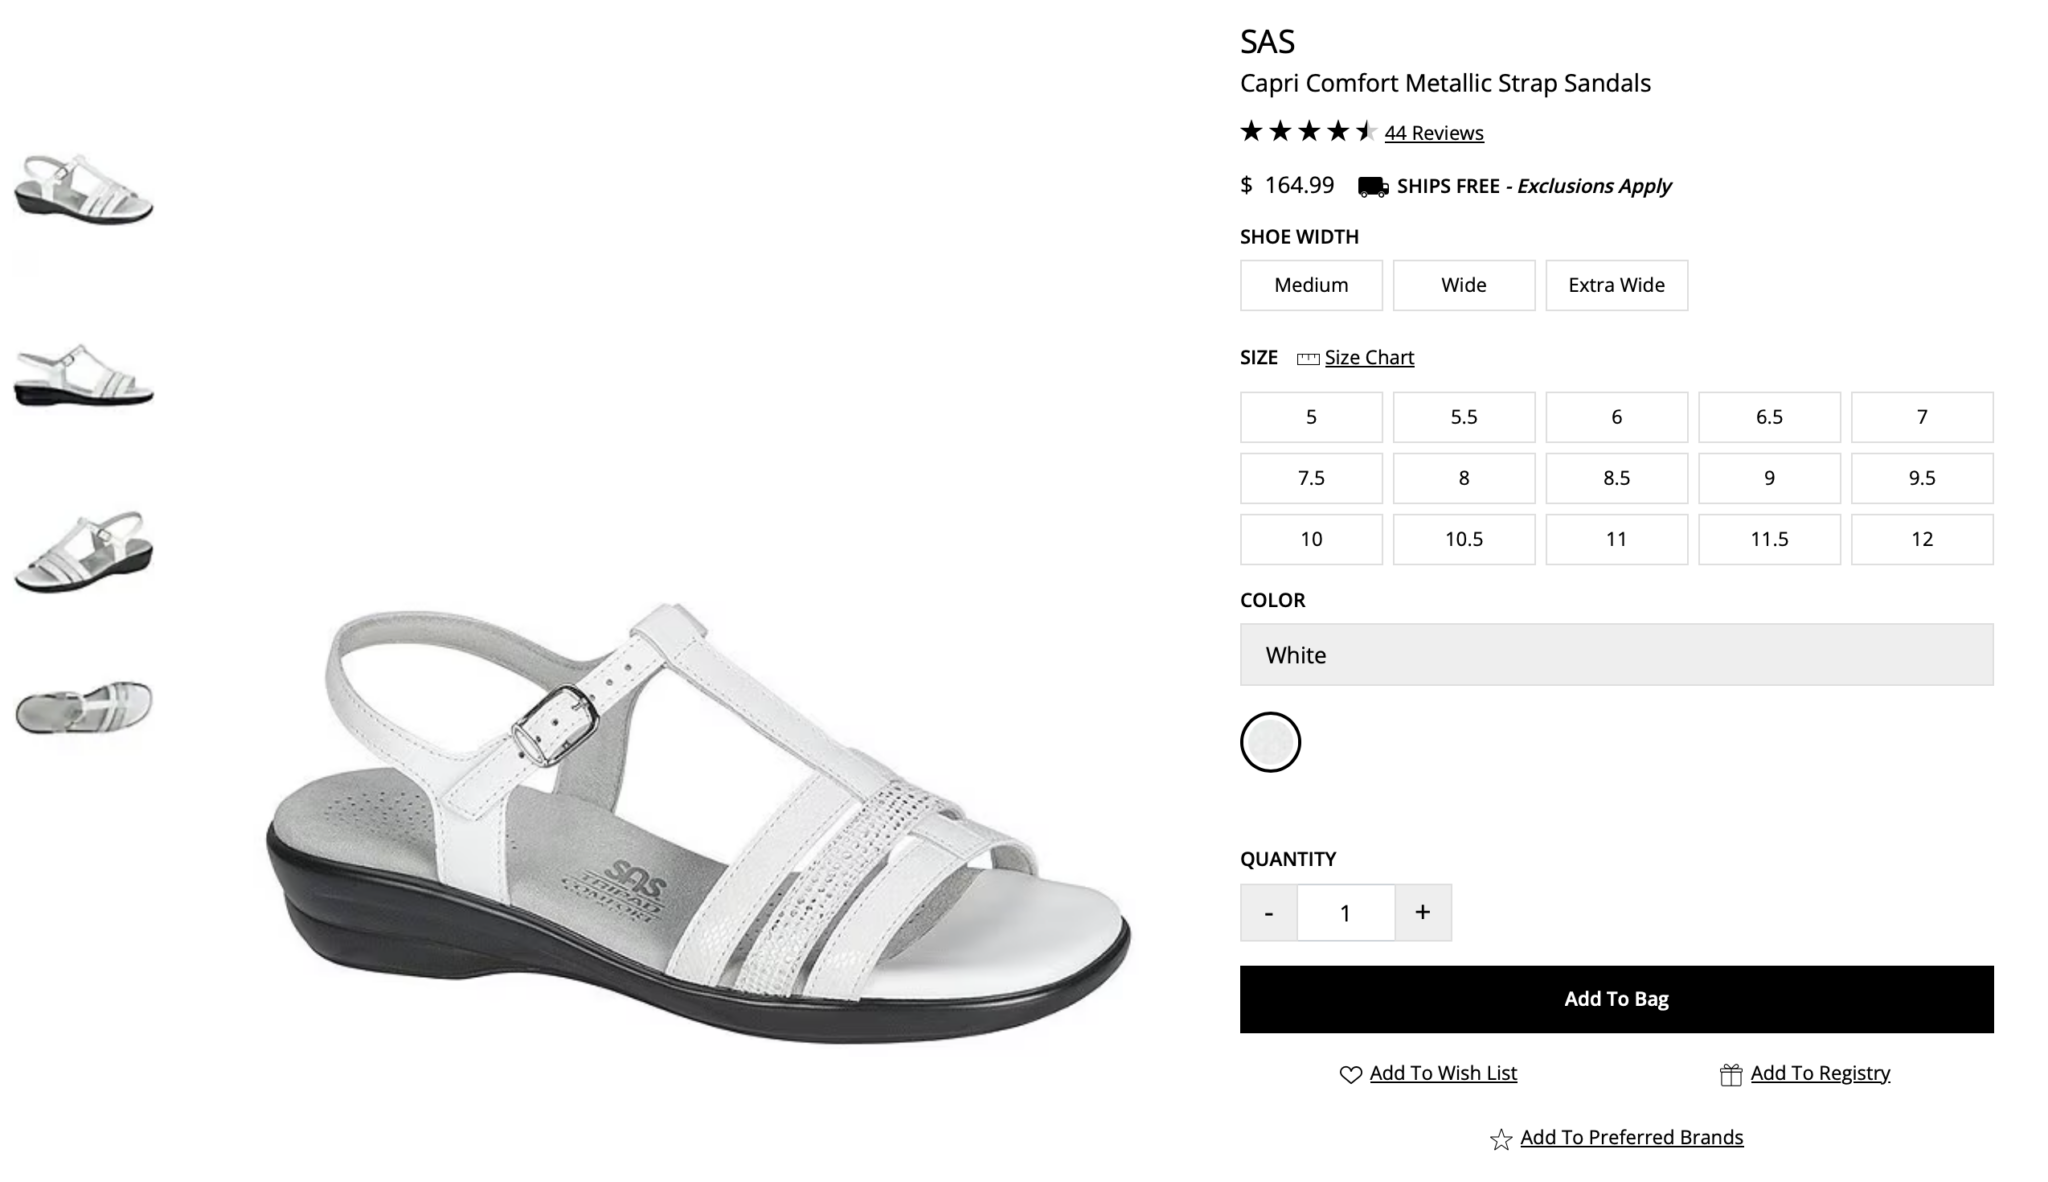
    • Footwear (i.e., sneakers, sandals, heels, and other products)
    • Accessories (i.e., bags, belts, watches, and so on)

    If you look at all of these product types across all sorts of retailers, there is a massive amount of overlapping data based on product attributes like style and size that are difficult to normalize.

    Fashion Attributes

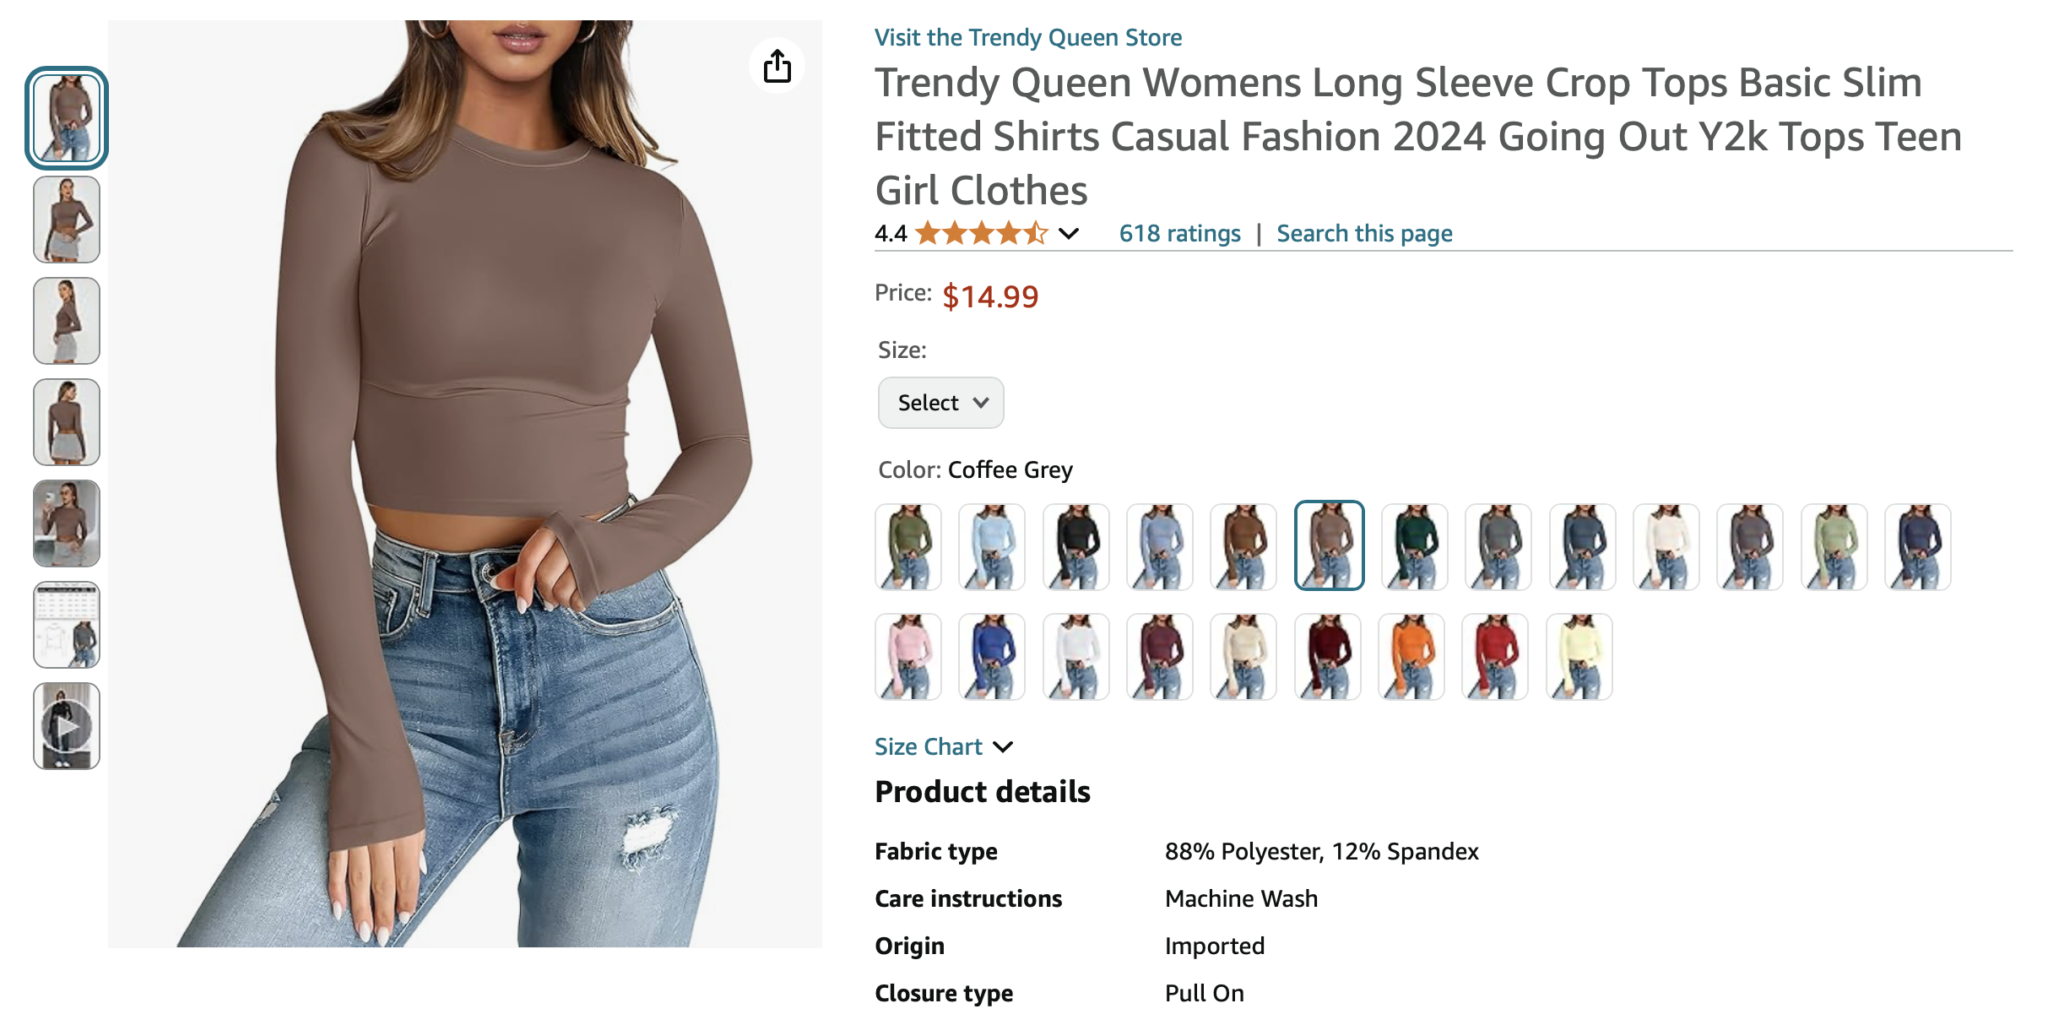
    Style, color, and size are the main attribute categories in fashion and apparel. Style attributes include things like design, look, and overall aesthetics of the product. They’re very dependent on the actual product category of fashion as well. A shirt might have a slim fit attribute associated with it, whereas a belt might have a length. All these different attributes are usually labeled within a product listing and affect the consumer’s decision-making process:

    • Color (red, blue, sea green, etc.)
    • Pattern (solid, striped, checked, floral, etc.)
    • Material (cotton, polyester, leather, denim, silk, etc.)
    • Fit (regular, slim, relaxed, oversized, tailored, etc.)
    • Type (casual, formal, sporty, vintage, streetwear)

    Color Complexity in Fashion

    Color is perhaps the most visually distinctive attribute in fashion, yet it presents unique challenges for retailers. This is because color naming can vary across retailers and marketplaces. There are several major differences in color convention:

    • A single color can be labeled differently across brands (e.g., “navy,” “midnight blue,” “deep blue”)
    • Seasonal color names (e.g., “summer sage” vs. “forest green”)
    • Marketing-driven names (e.g., “sunset coral” vs. “pale orange”)
    Differences in color naming - challenges faced by fashion retail intelligence systems

    Size: The Other Critical Dimension

    Size in fashion refers to the dimensions or measurements that determine how fashion products fit. Depending on whether the product is a clothing item, shoes, or a hat, there will be different sizing options. Types of sizes include:

    • Standard sizes (XS, S, M, L, XL, XXL, XXL)
    • Custom sizes (based on brand, retailer, country, etc.)

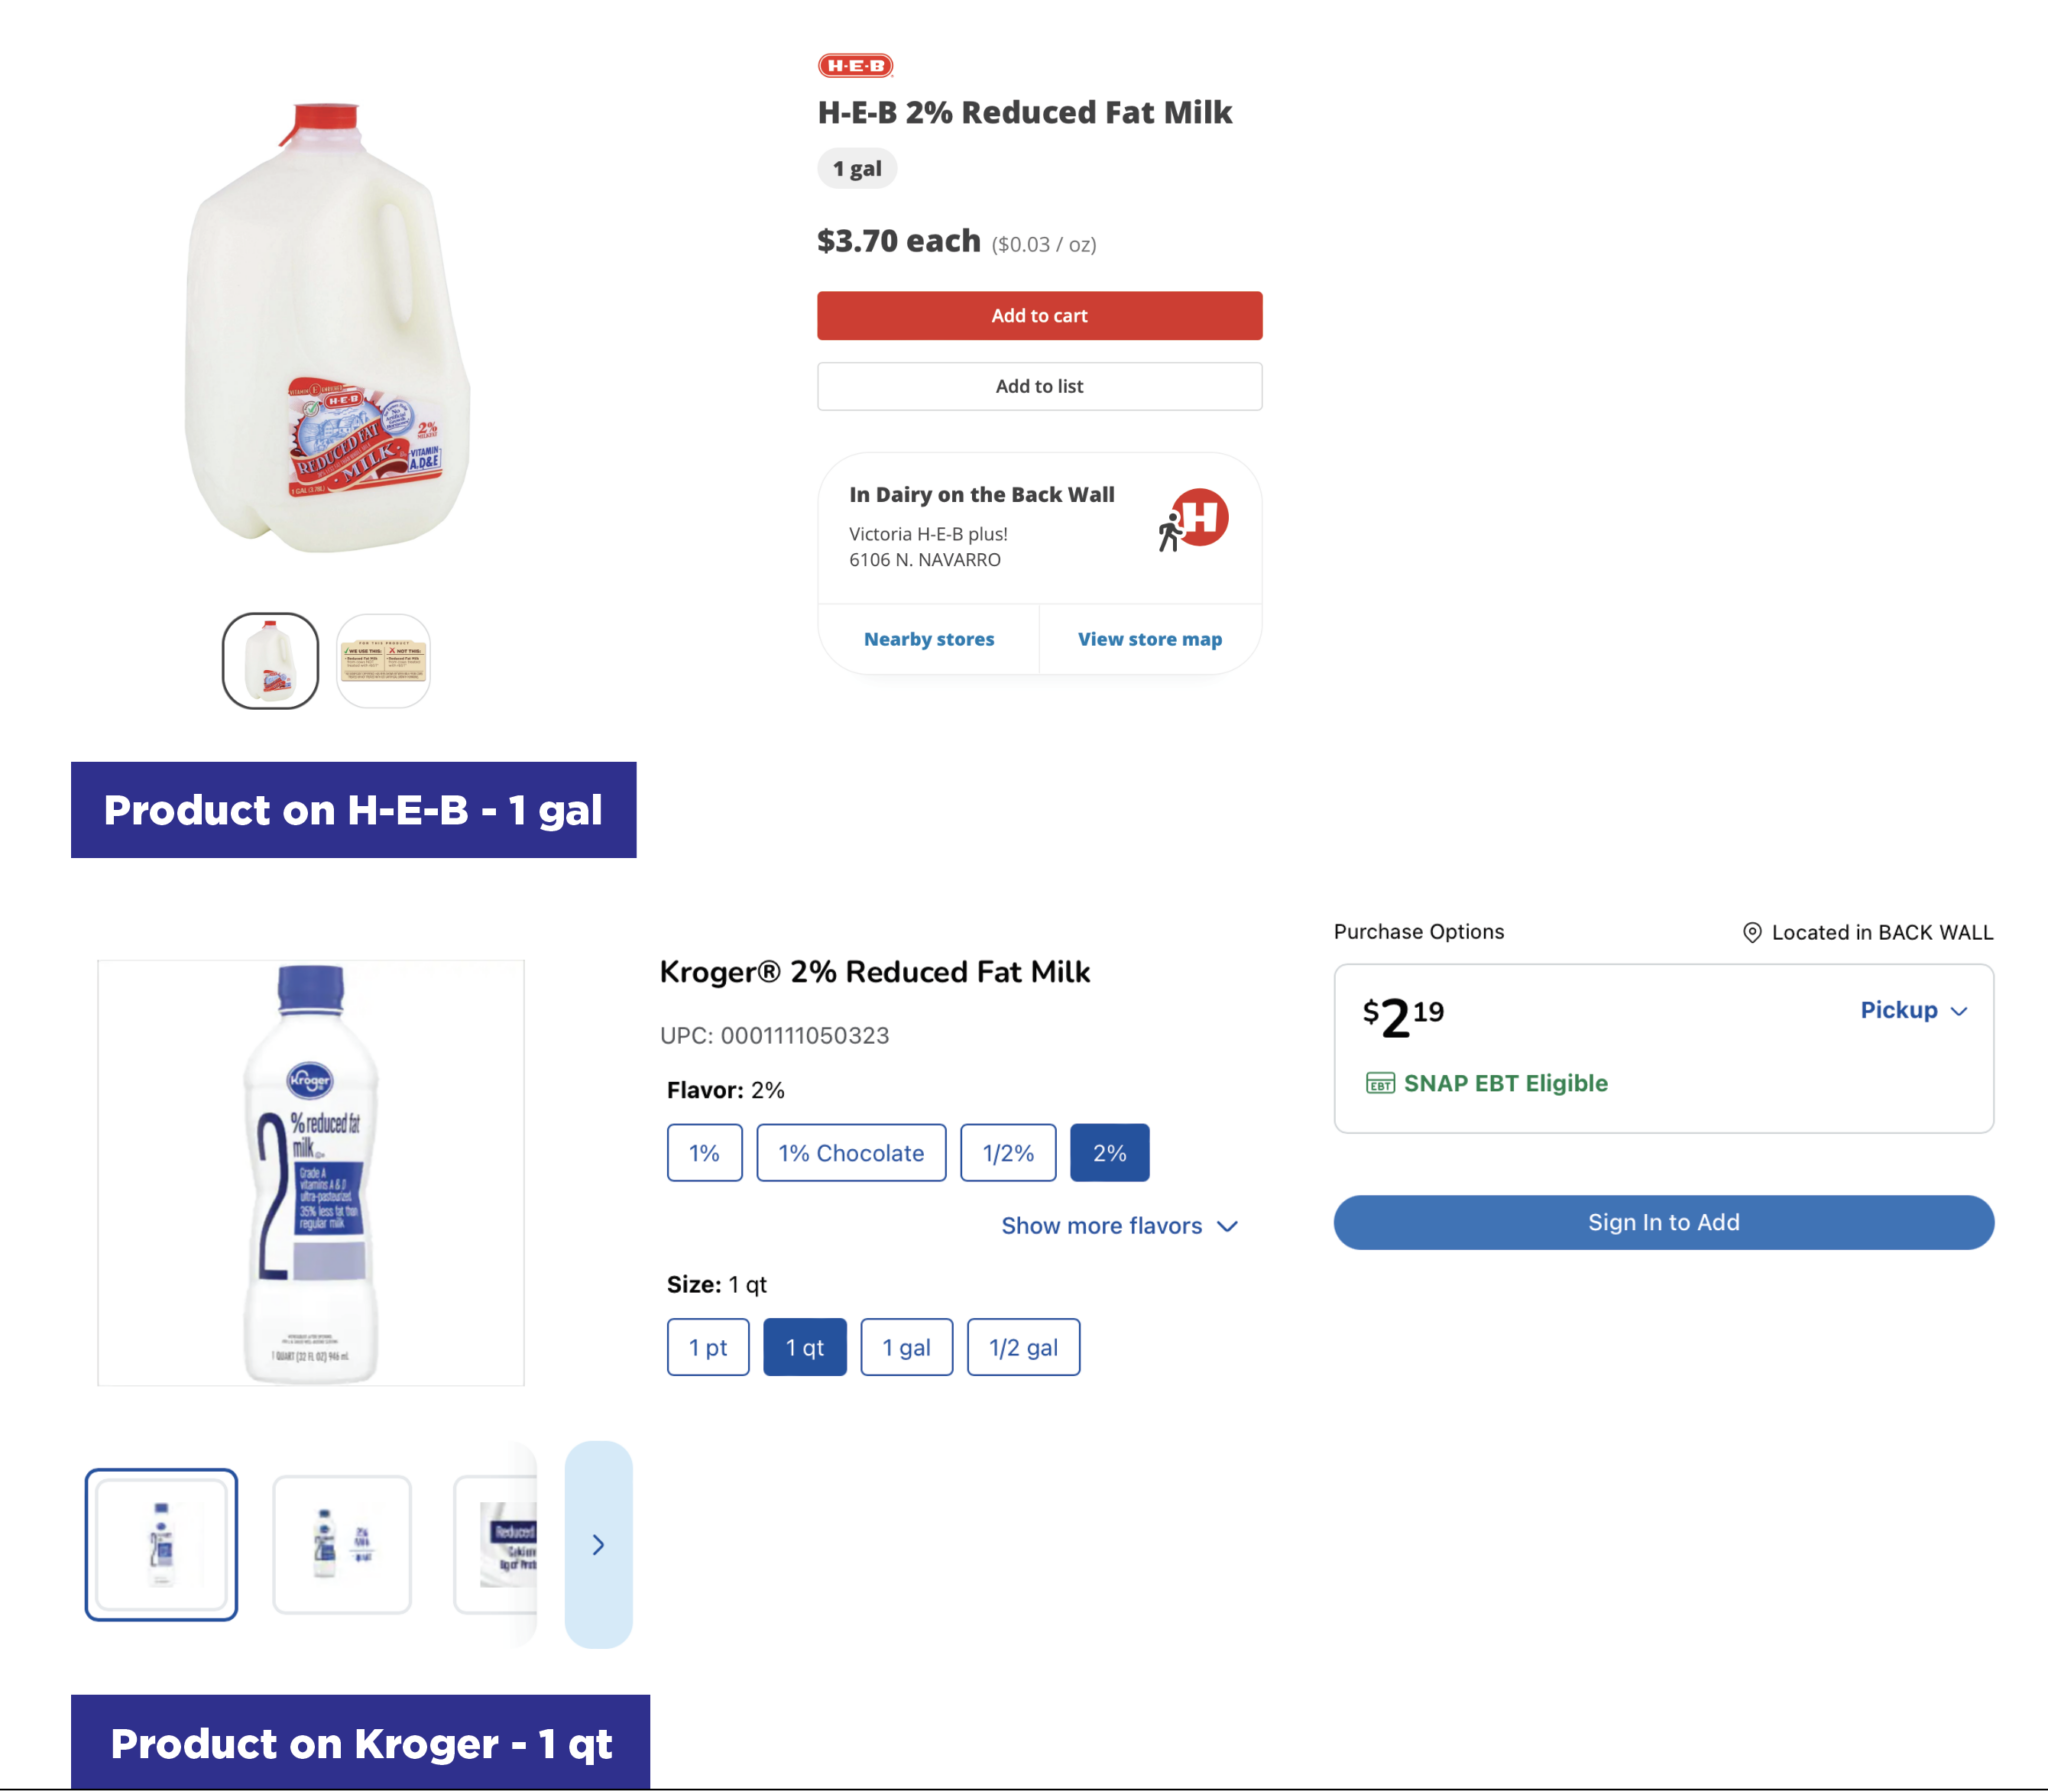
    A single type of product may have different sizing labels. For instance, one pants listing may use traditional S, M, L, XL sizing, while another pants listing may use 24, 25, or 26, to refer to the waist measurement.

    Size Variations - challenges faced by fashion retail intelligence systems
    Size Variations - challenges faced by fashion retail intelligence systems
    Size Variations - challenges faced by fashion retail intelligence systems

    Size is a dynamic attribute that changes based on current trends. For example, there has recently been a significant shift towards inclusive sizing. Size inclusivity refers to the practice of selling apparel in a wide range of sizes to accommodate people of all body types. Consumers are more aware of this trend and are demanding a broader range of sizing offerings from the brands they shop from.

    In the US market, in particular, some 67% of American women wear a size 14 or above and may be interested in purchasing plus-size clothing. There is a growing demand in the plus-size market for more options and a wider selection. Many brands are considering expanding their sizes to accommodate more shoppers and tap into this growing revenue channel.

    Pricing Based on Size and Color

    Many fashion products are priced differently based on size and color. Let’s take a look at an example of what this can look like.

    Different colors may retail at different price points.

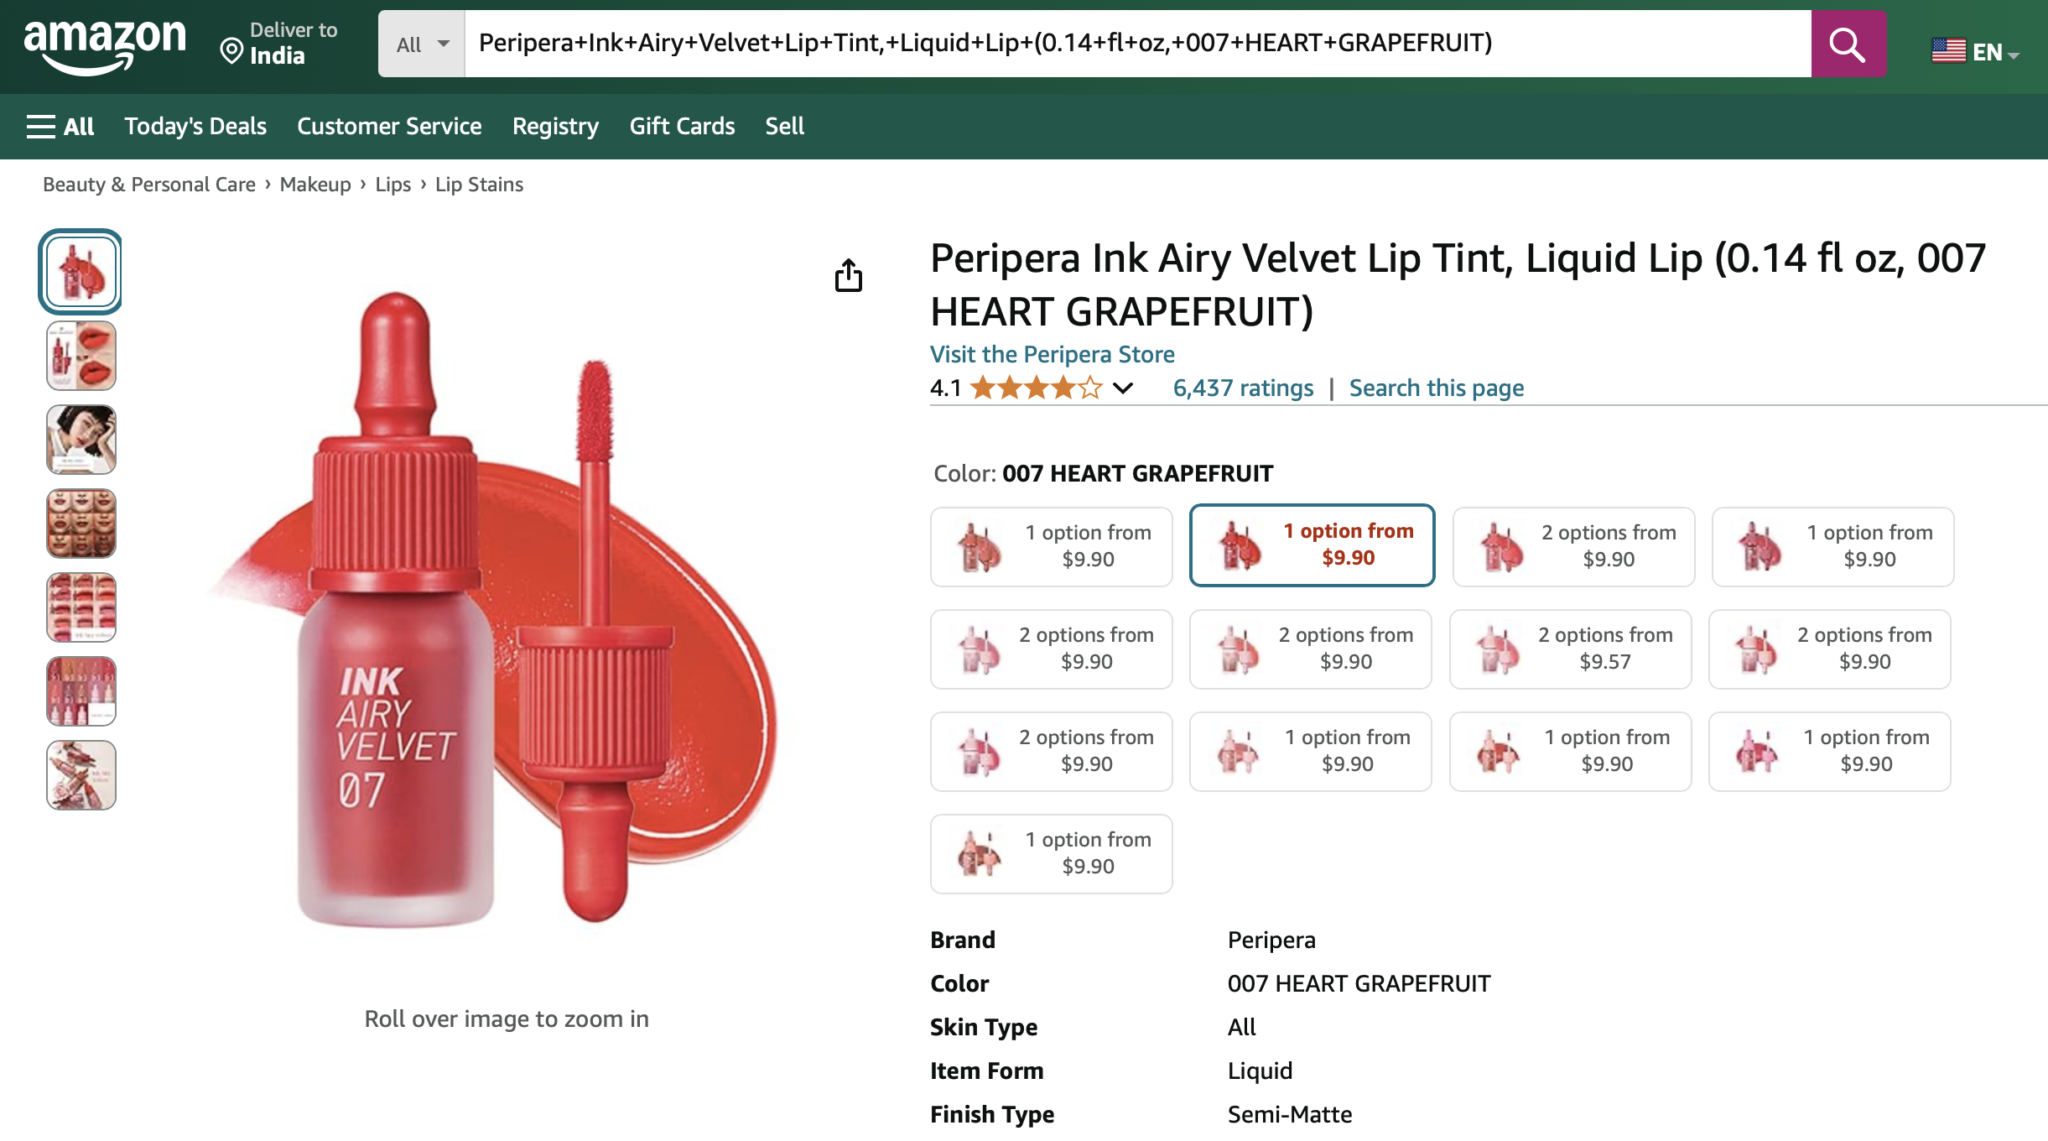
    A popular beauty brand (see image) is known for its viral lip tint. While most of the color variants are priced at $9.90 on Amazon, a specific colorway option, featuring less pigmented options, is priced at $9.57. This price differential is driven by both material costs and market demand.

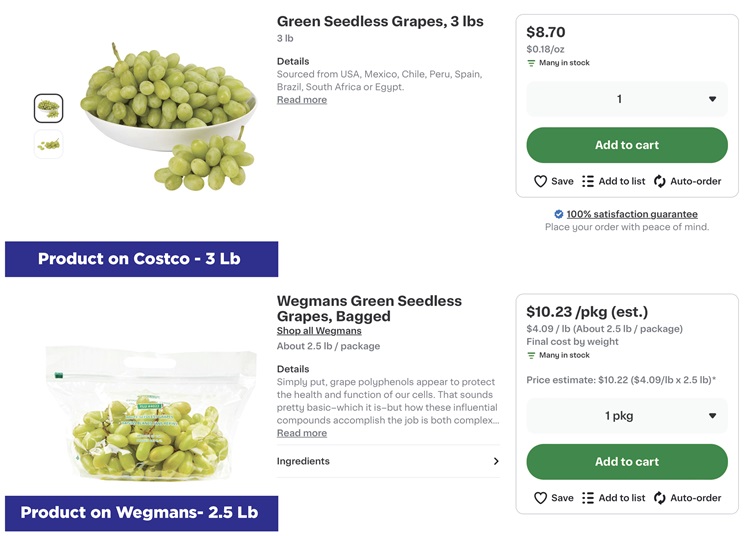
    Different colorways (any of a range of combinations of colors in which a style or design is available) of the same product often command different prices also. This is based on:

    • Dye costs (some colors require more expensive processes)
    • Seasonal demand (traditional colors vs. trend colors)
    • Exclusivity (limited edition colors)

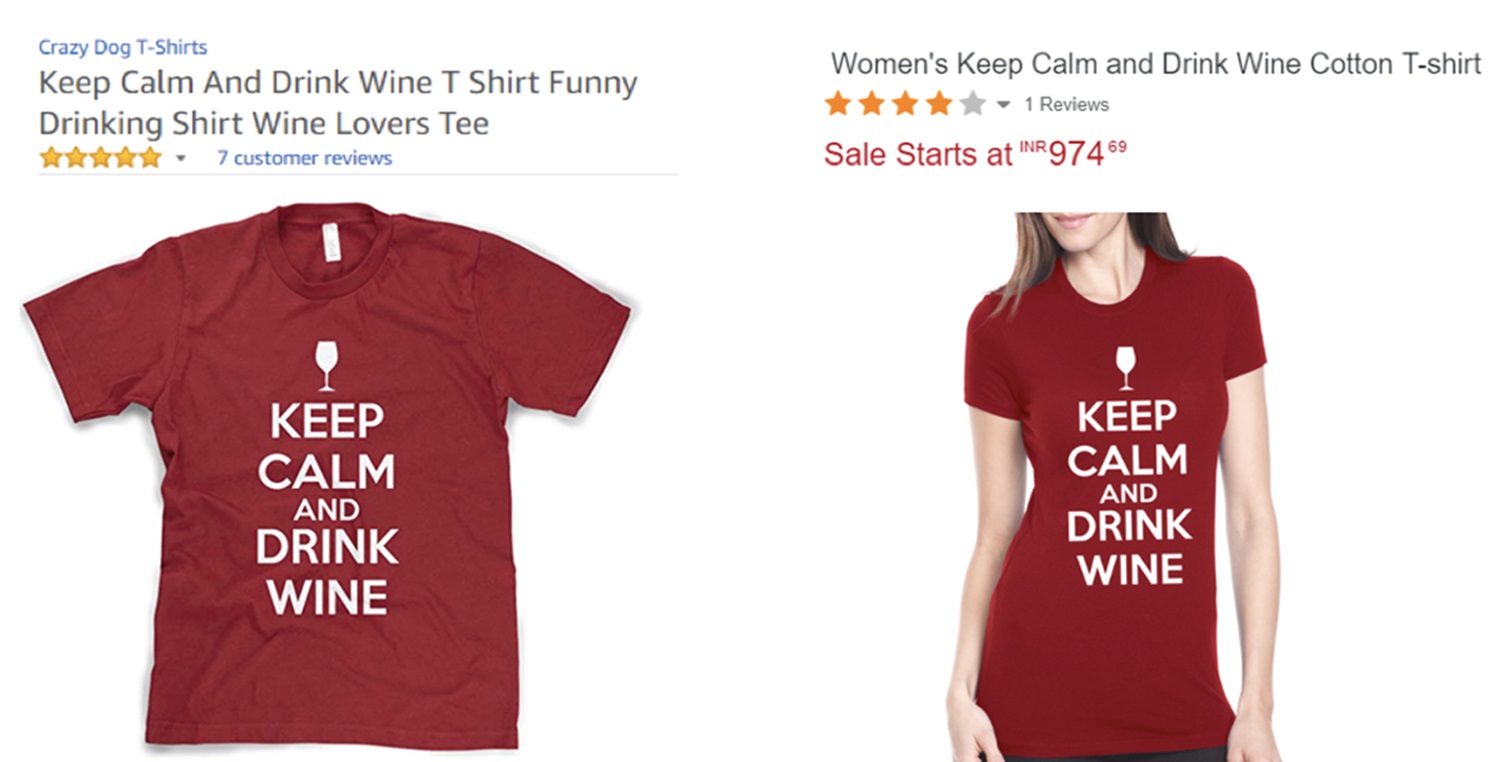
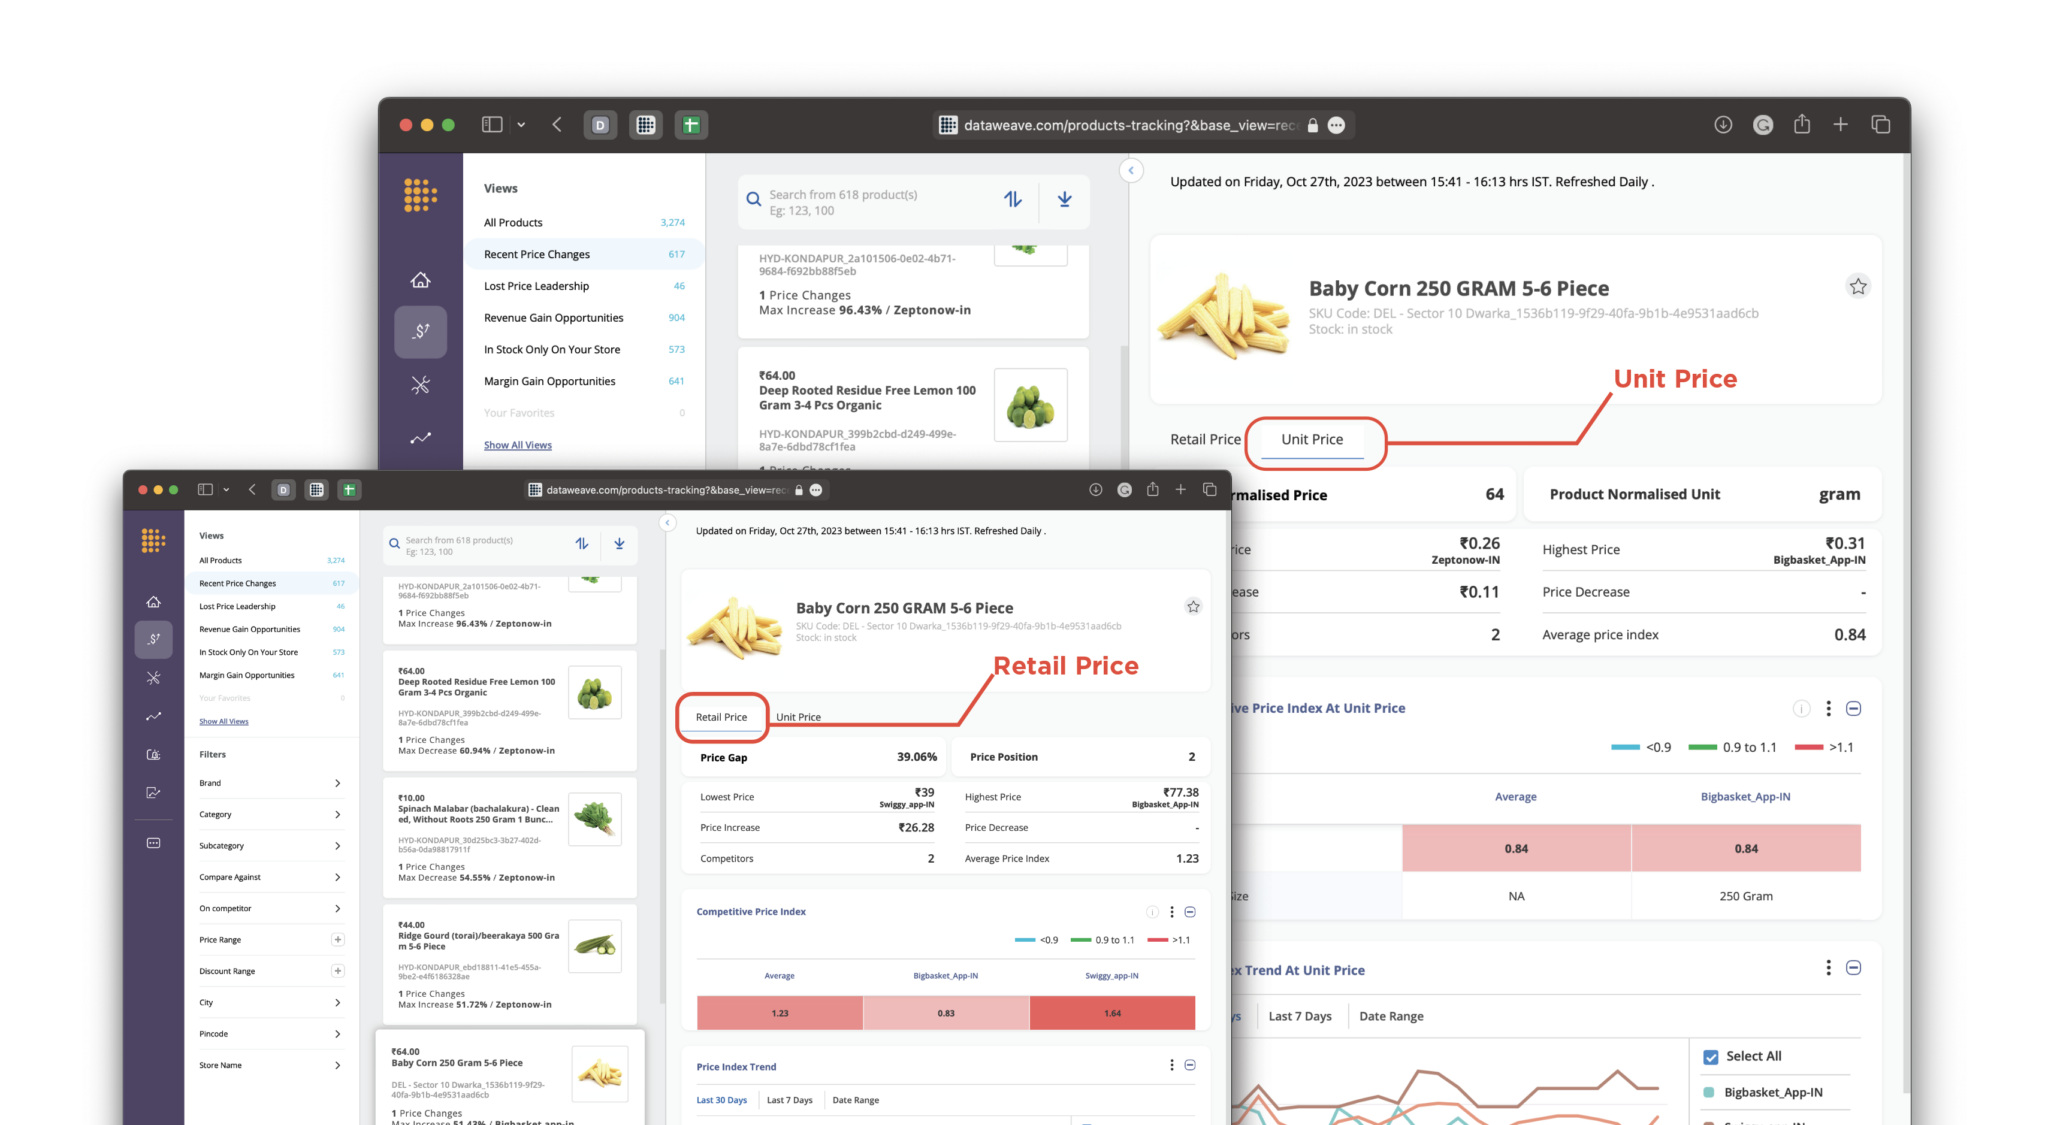
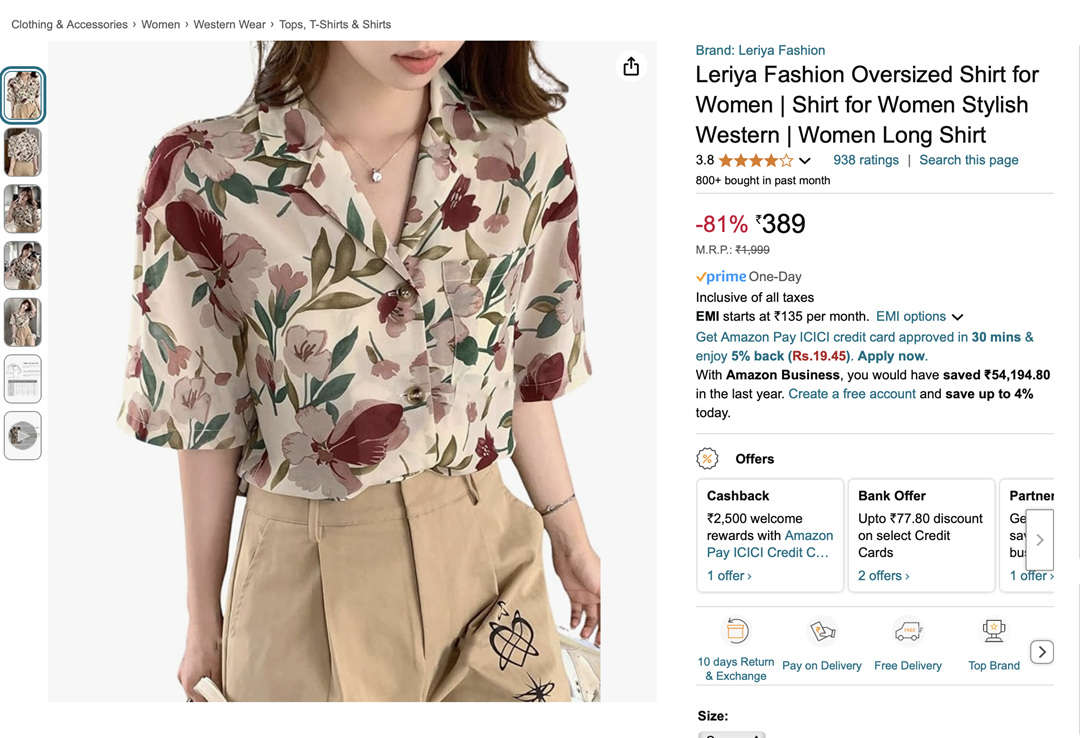
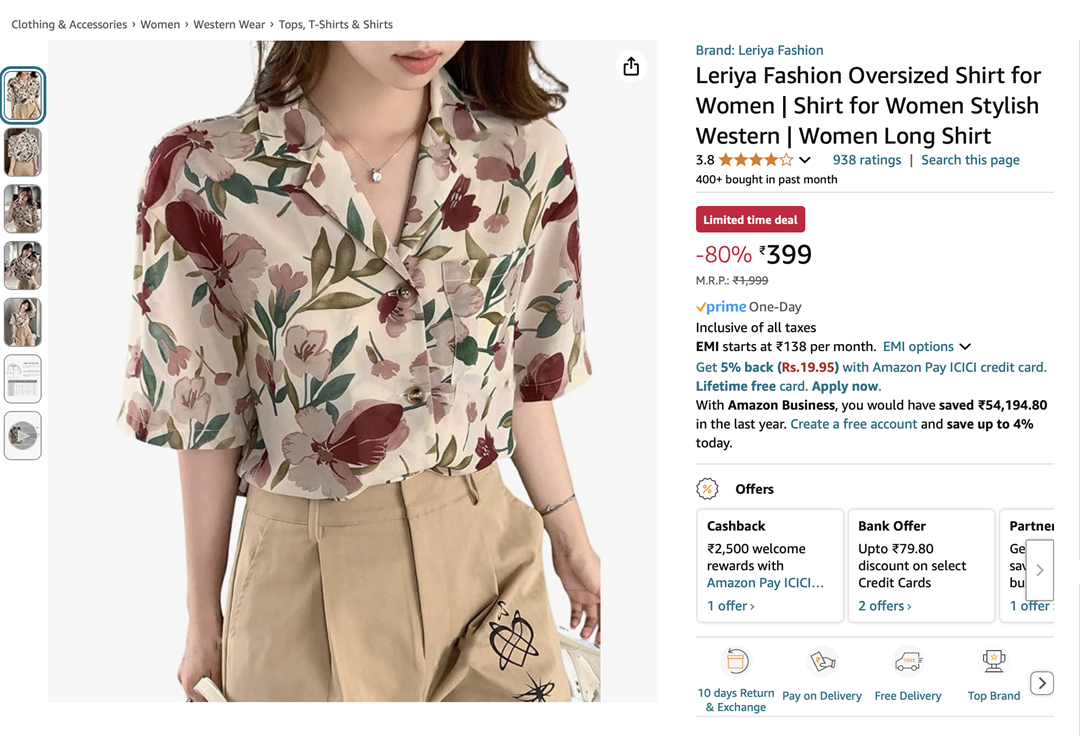
    An example of price variations by size is a women’s shirt that is being sold on Amazon as shown below. For this product, there are no style attributes to choose from. The only parameter the shopper has to select is the size they’d like to purchase. They can choose from S to XL. On the top, we can see that the product in size S is ₹389. Below, the size XL version of this same shirt is ₹399. This price increase is correlated to the change in size.

    Different sizes may retail at different price points.
    Different sizes may retail at different price points.

    So why are these same products priced differently? In an analysis of One Six, a plus-size clothing brand, several reasons for this difference in plus-size clothing were determined.

    • Extra material is needed, hence an increase in production costs
    • Extra stitching costs, hence an increase in production costs
    • Production of plus-size clothing often means acquiring specialized machinery
    • Smaller scale production runs for plus-size clothing means these initiatives often don’t benefit from cost savings

    Some sizes are sold more than others, meaning that in-demand sizes for certain apparel can affect pricing as well. Brands want to be able to charge as much as possible for their listing without risking losing a sale to a competitor.

    The Competitive Pricing Challenge: Normalizing Product Attributes Across Competitors in Apparel and Fashion

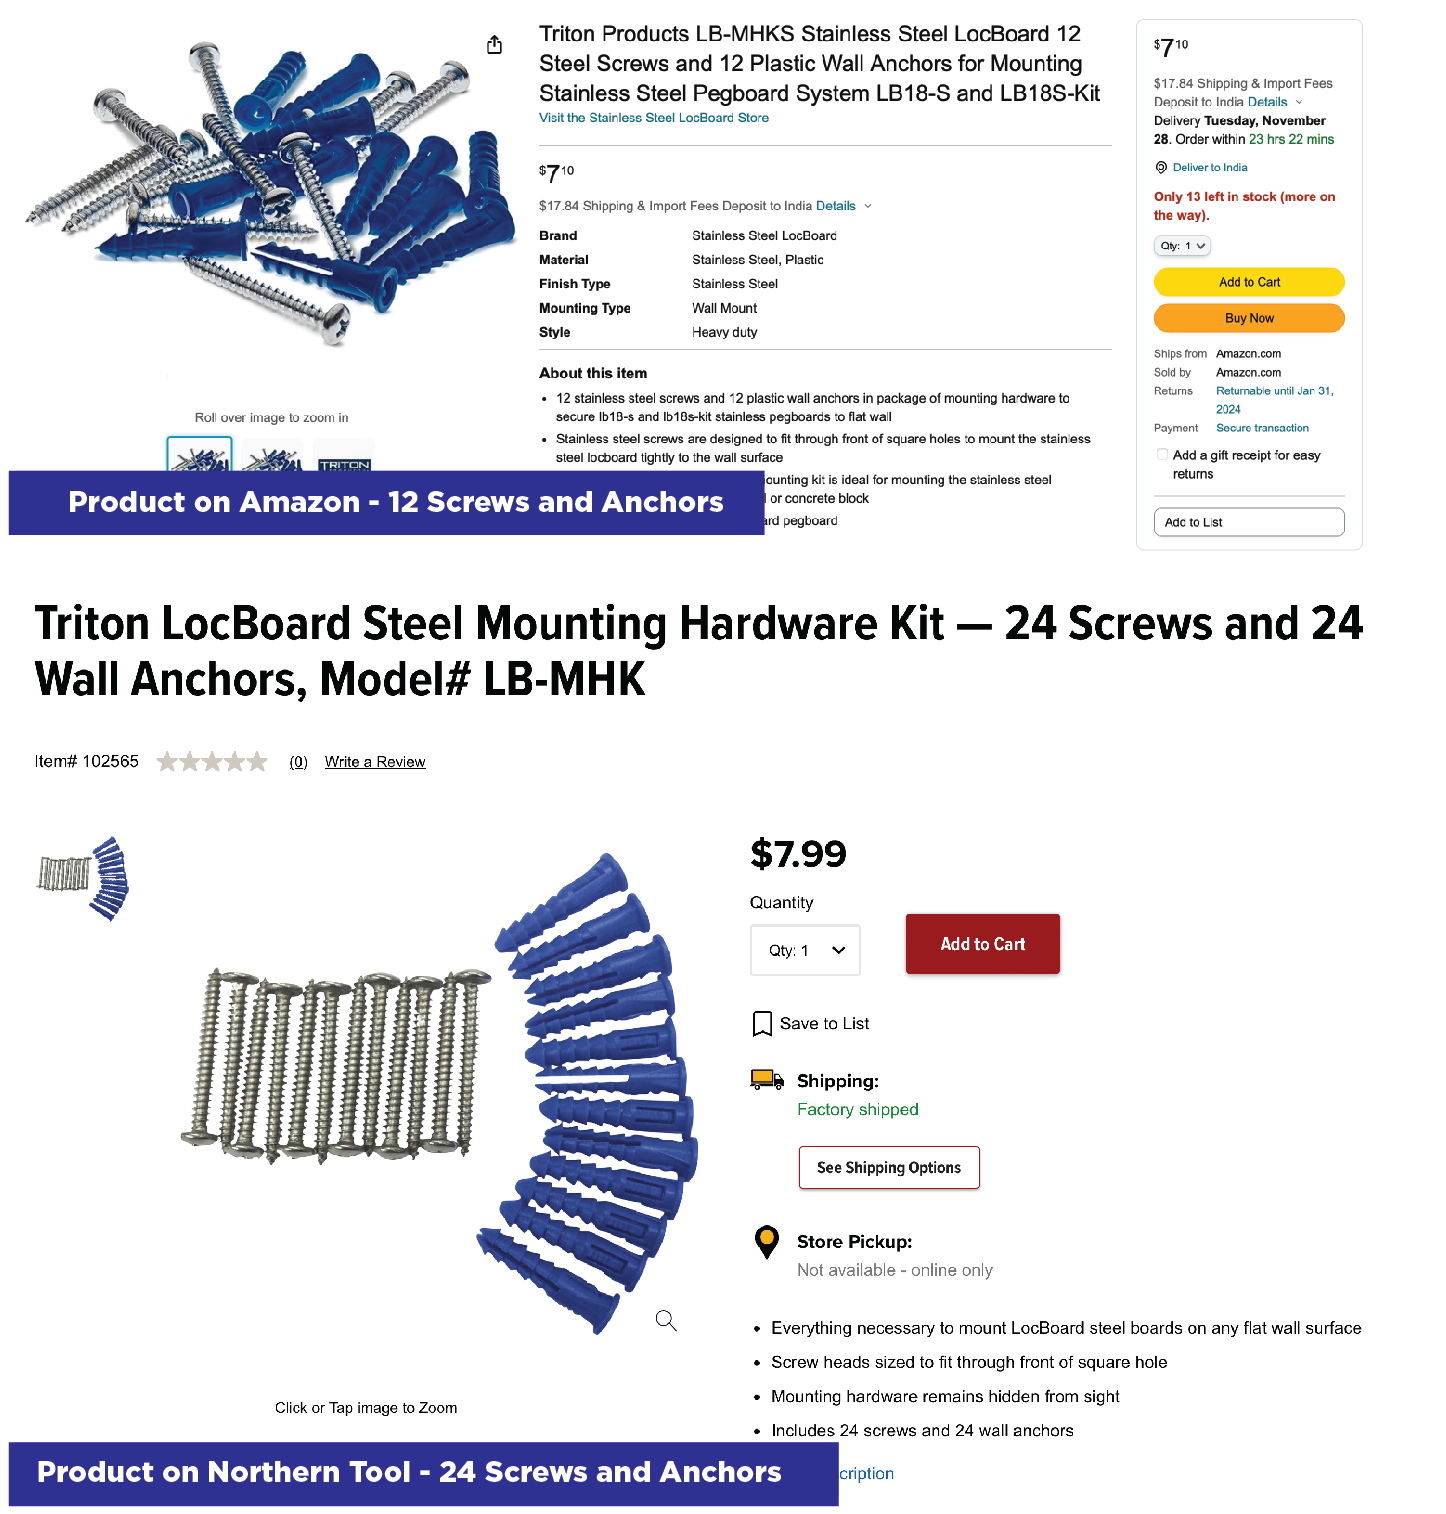
    There are hundreds of possible attribute permutations for every single apparel product. Some retailers may only sell core sizes and basic colors; some may sell a mix of sizes for multiple style types. Most retailers also sell multiple color variants for all styles they have on catalog. Other retailers may only sell a single, in-demand size of the product. Also, when other retailers are selling the product, it’s unlikely that their naming conventions, color options, style options, and sizing match yours one-for-one.

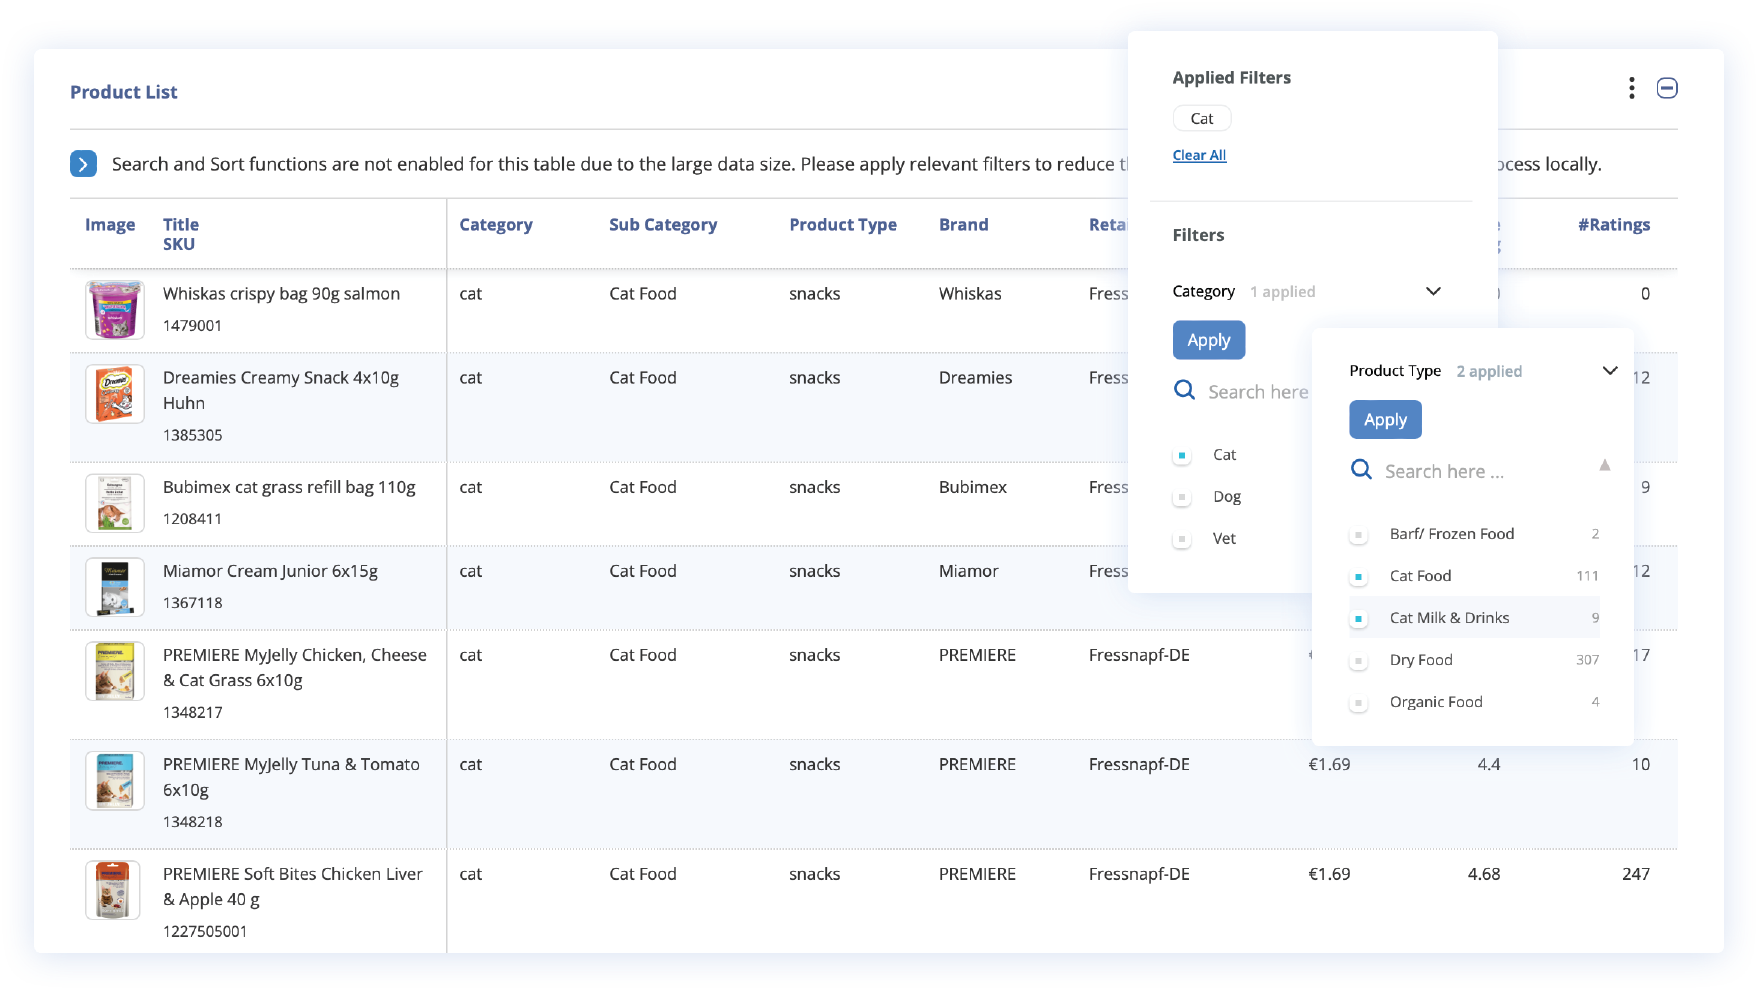
    In one analysis, it was found that there were 800+ unique values for heel sizes and 1000+ unique values for shirts and tops at a single retailer! If you’re looking to compare prices, the effort involved in setting up and managing lookup tables to identify discrepancies when one retailer uses European sizes and another uses USA sizes, for example, is simply too onerous to contemplate doing. Colors only add to the complexity – as similar colors may have new names in different regions and locations as well!

    Even if you managed to find all the discrepancies between product attributes, you would still need to update them any time a competitor changed a convention.

    Still, monitoring your competitors and strategically pricing your listings is essential to maintain and grow market share. So what do you do? You can’t simply eyeball your competitor’s website to check their pricing and naming conventions. Instead, you need advanced algorithms to scan the entire marketplace, identify individual products being sold, and normalize their data and attributes for analysis.

    Getting Color and Size Level Pricing Intelligence

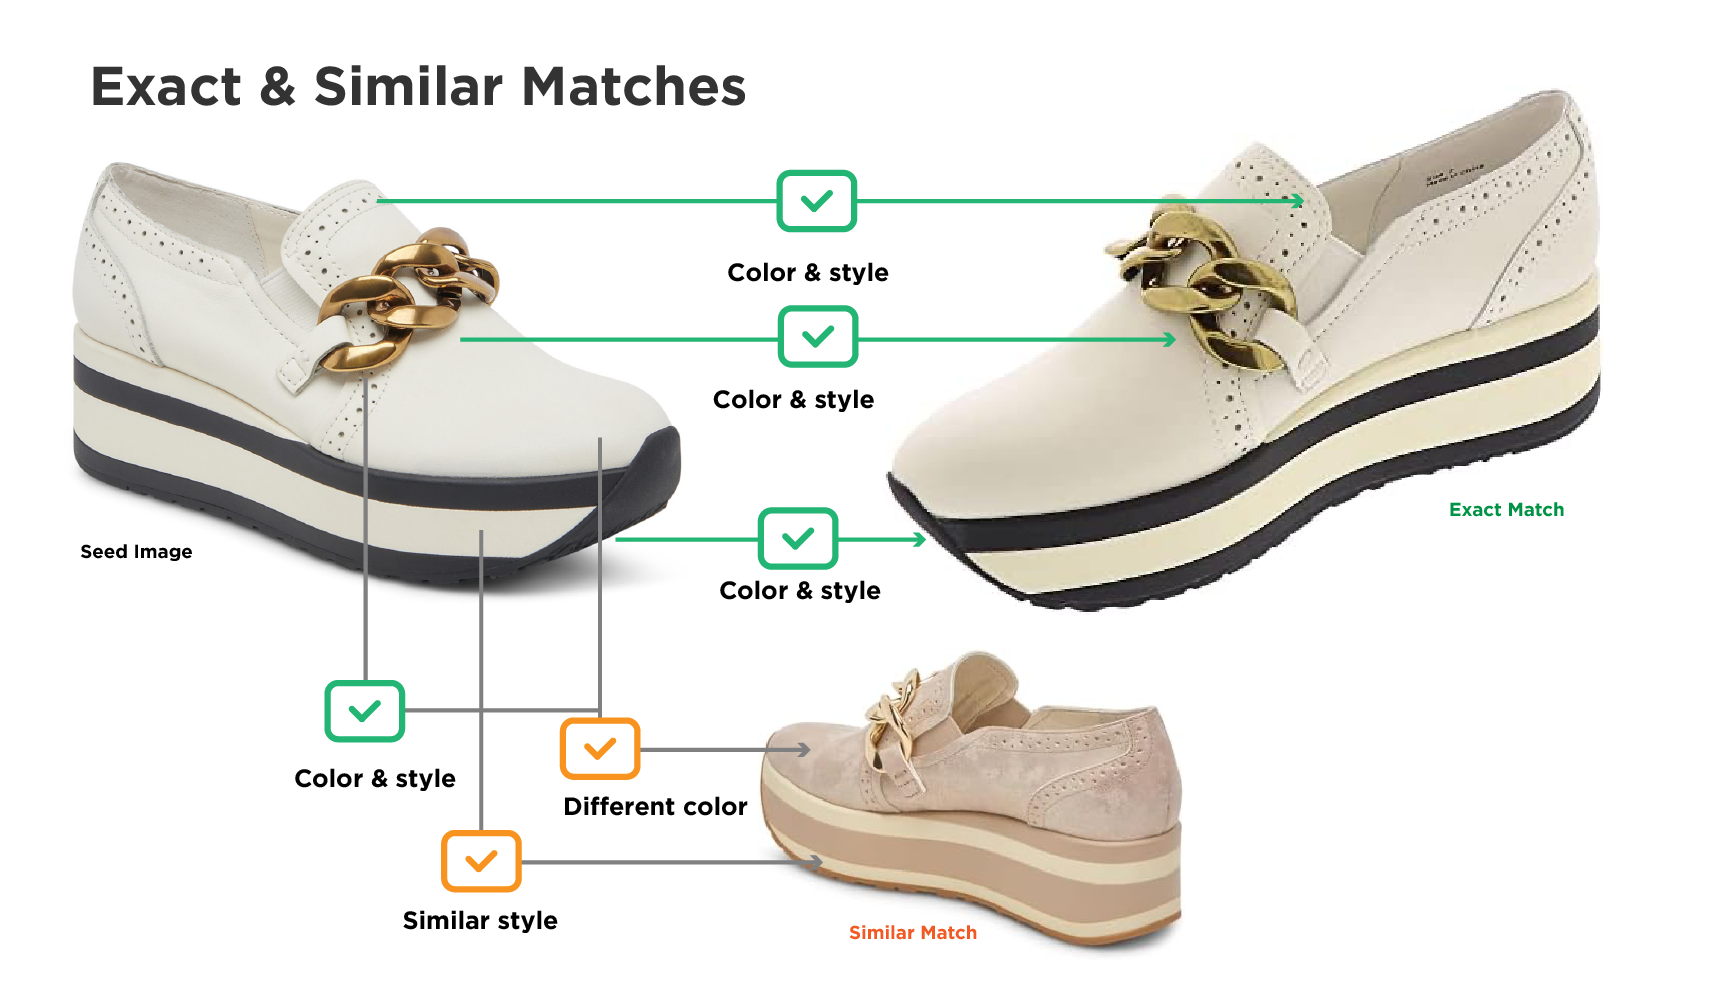
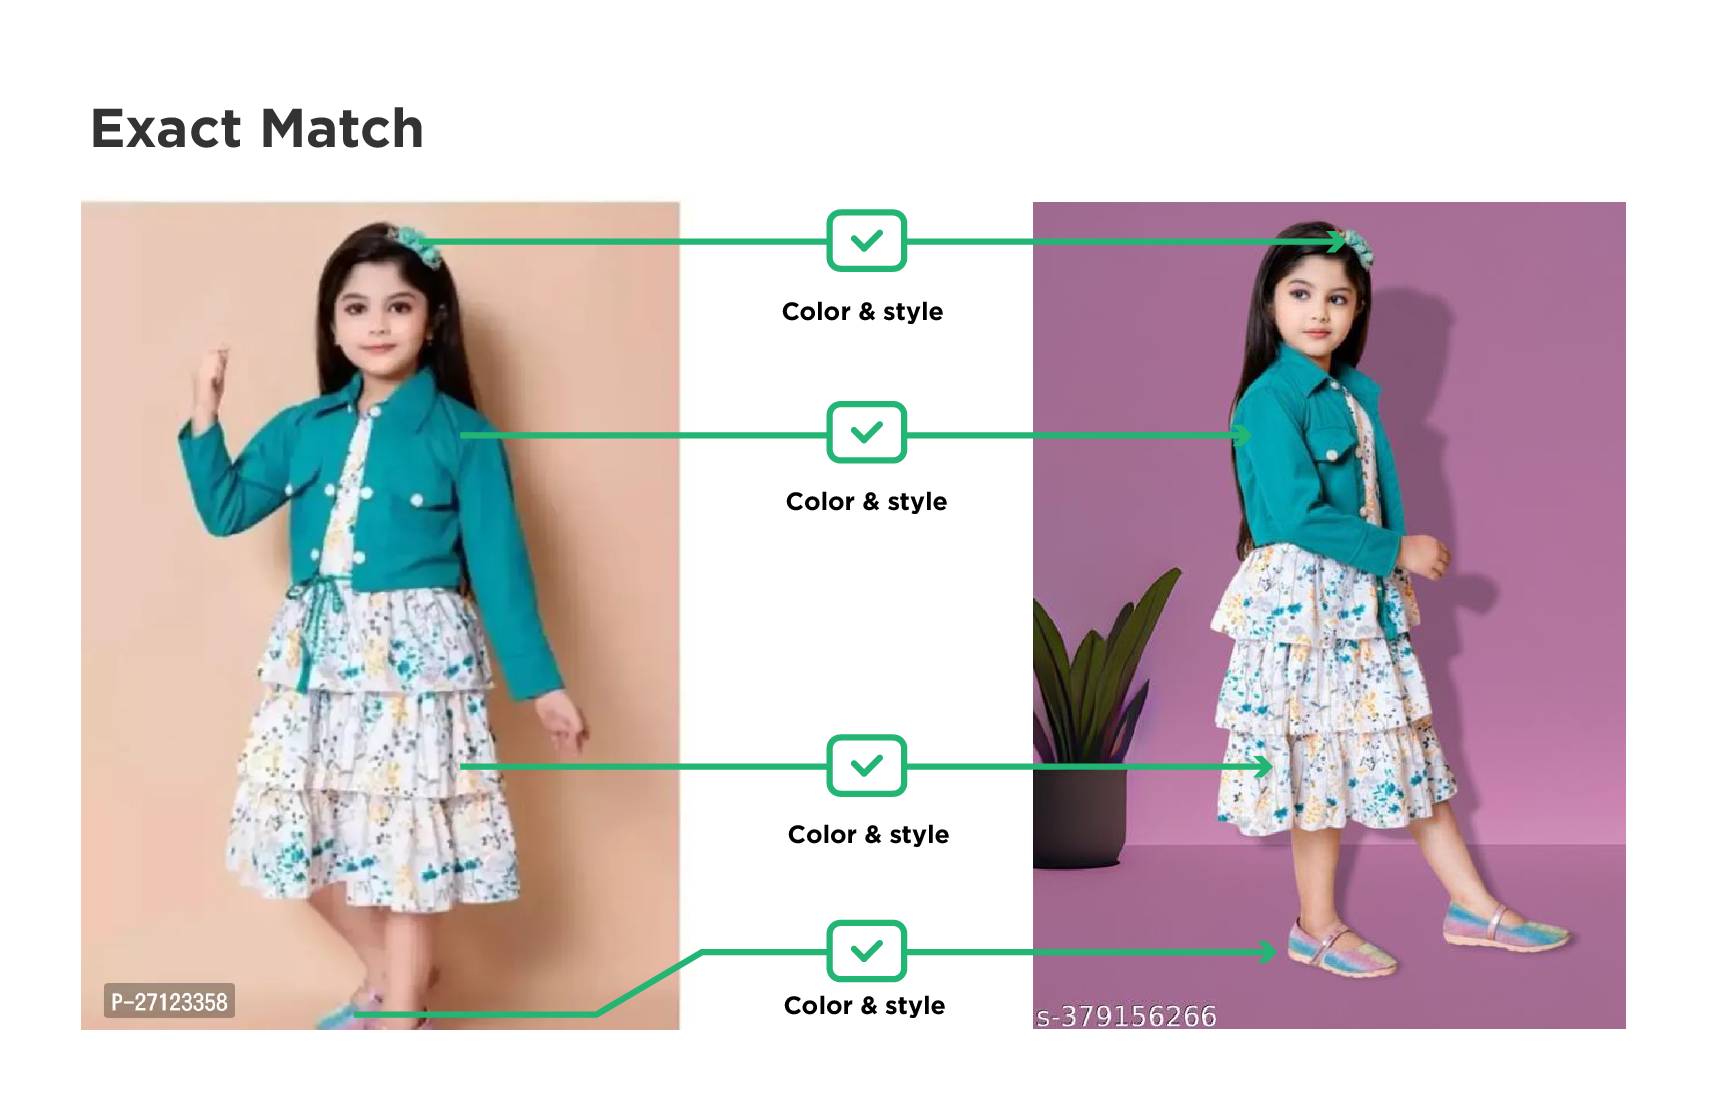
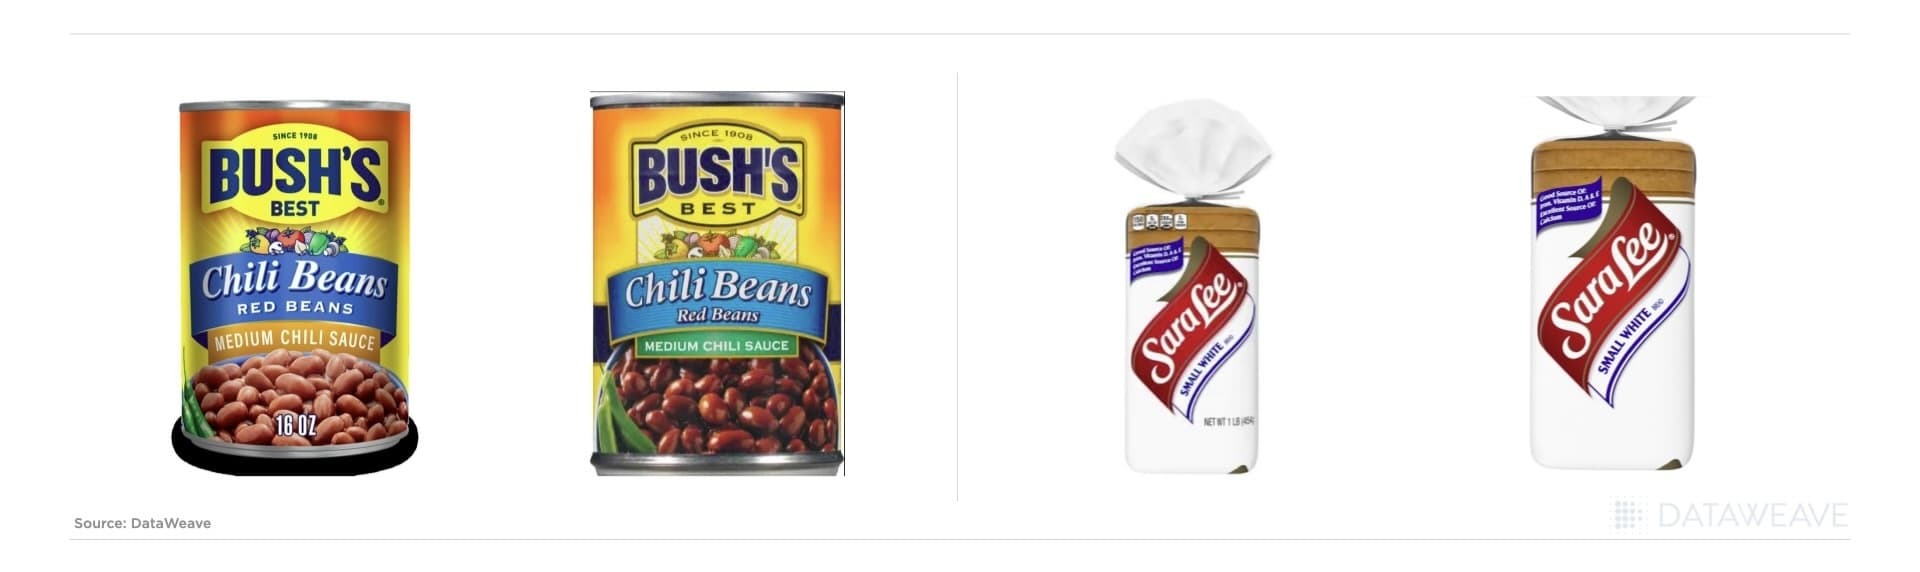
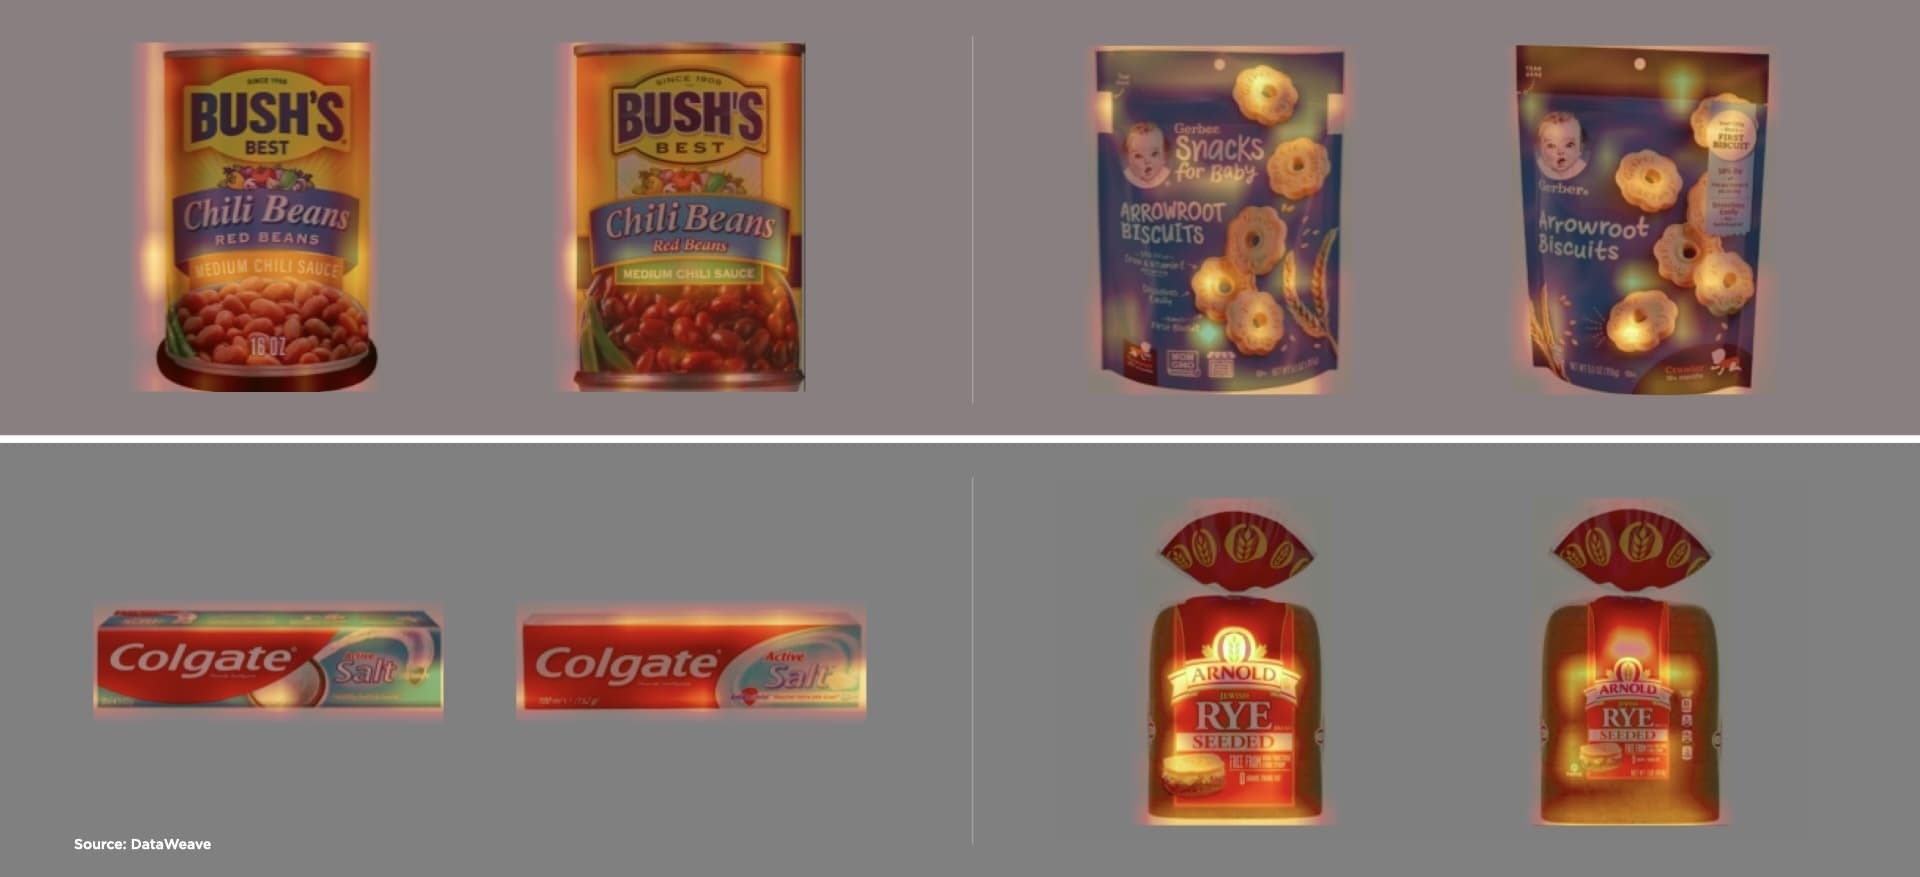
    With DataWeave, size and color are just two of several dimensions of a product instead of an impossible big data problem for teams. Our product matching engine can easily handle color and sizing complexity via our AI-driven approach combined with human verification.

    This works by using AI built on more than 10 years of product catalog data across thousands of retail websites. It matches common identifiers, like UPC, SKU code, and other attributes for harmonization before employing a large language model (LLM) prompts to normalize color variations and sizing to a single standard.

    The data flow DataWeave uses for product sizing and color normalization

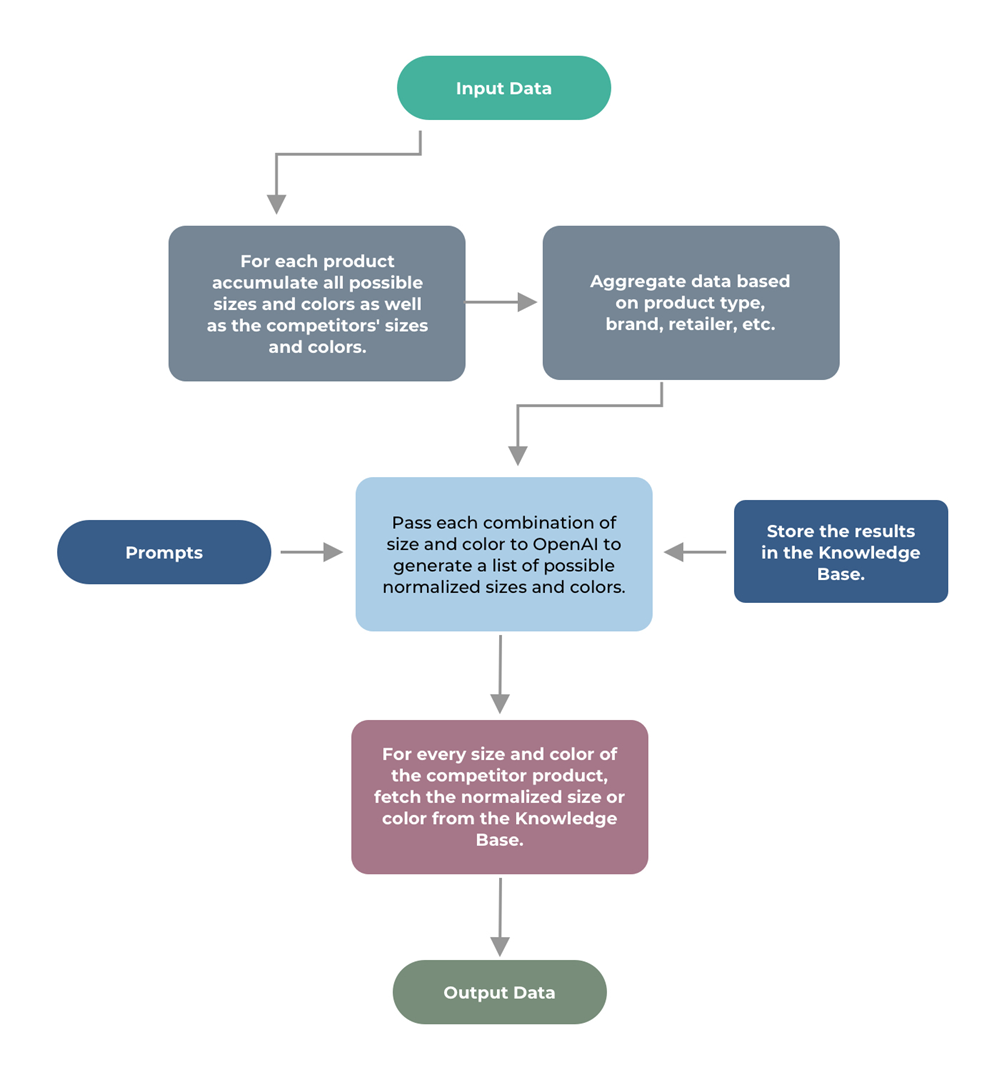
    For example, if a competitor has the smallest size listed as Sm but has your smallest listing identified as S, DataWeave can match those two attributes using AI. Similar classification can be performed on color as well.

    Complex LLM prompts are pre-established so that this process is fast and efficient, taking minutes rather than weeks of manual effort.

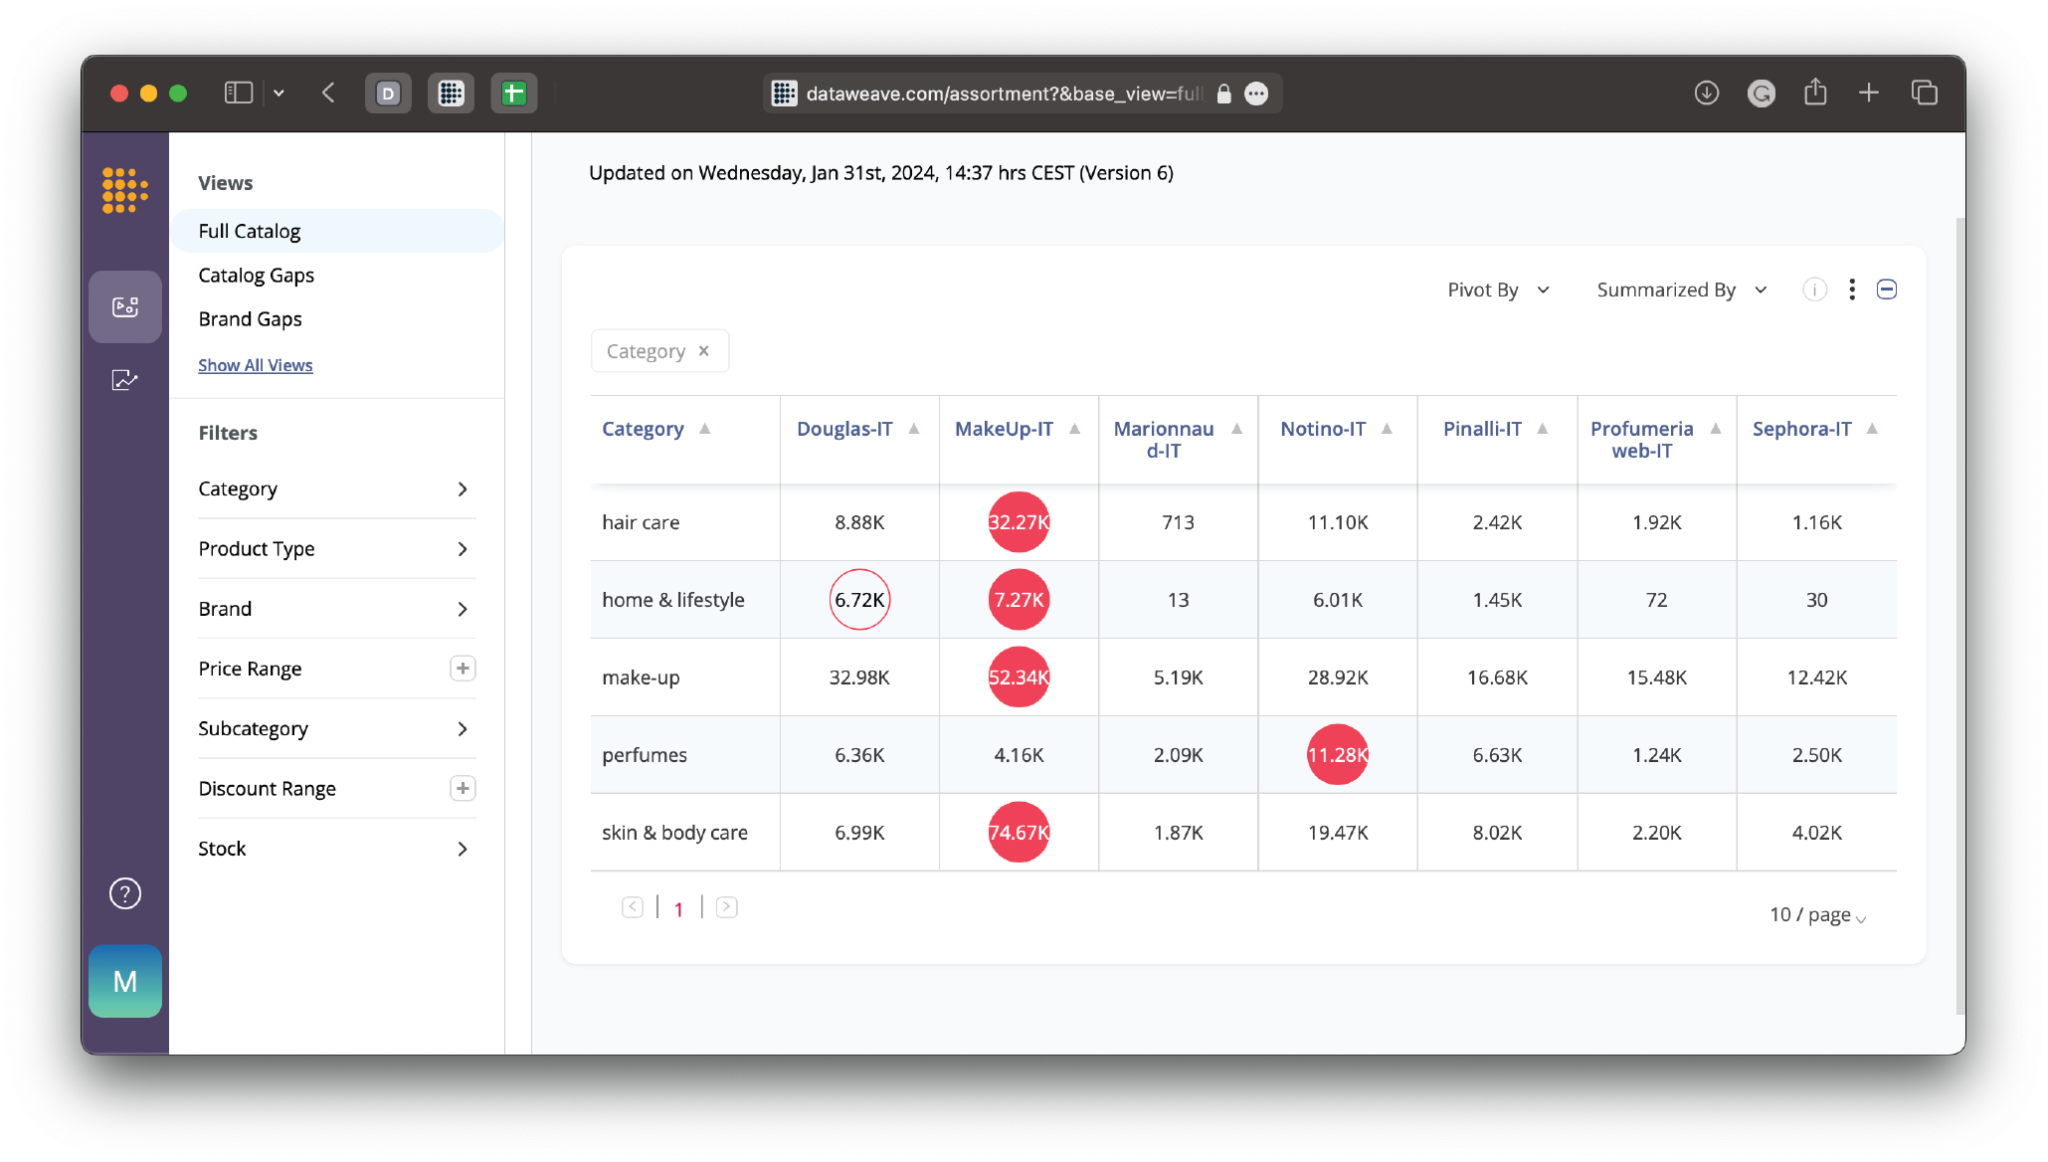
    Harmonizing products along with their color and sizing data across different retailers for further analysis has several benefits. Most importantly, product matching helps teams conduct better competitive analysis, allowing them to stay informed about market trends, competitors’ offerings, and how those competitors are pricing various permutations of the same product. It helps ensure that you’re offering the most competitive assortment of sizing in several colors to win more market share as well. Overall, it’s easier for teams to gain insights and exploit their findings when all the data is clean and available at their fingertips.

    Product Matching Size and Color in Apparel and Fashion

    Color and size are crucial attributes for retailers and brands in the apparel and fashion industry. It adds a level of complexity that can’t be overstated. While it’s a necessity to win consumers (more colors and sizes will mean a wider potential reach), the more permutations you add to your listing, the more complicated it will be to track it against your competition. However, This challenge is worth undertaking as long as you have the right solutions at your disposal.

    With a strategy backed by advanced technology to discover identical and similar products across the competitive landscape and normalize their color and sizing attributes, you can ensure that you are competitively pricing your products and offering the best assortment possible. Employing DataWeave’s AI technology to find competitor listings, match products across variants, and track pricing regularly is the way to go.

    Interested in learning more about DataWeave? Click here to get in touch!

  • The Complete Guide to Competitive Pricing Strategies in Retail and E-commerce

    The Complete Guide to Competitive Pricing Strategies in Retail and E-commerce

    Your budget-conscious customers are hunting for value and won’t hesitate to switch brands or shop at other retailers.

    In saturated and fiercely competitive markets, how can you retain customers? And better yet, how can you attract more customers and grow your market share? One thing you can do as a brand or retailer is to set the right prices for your products.

    Competitive or competition-based pricing can help you get there.

    So what exactly is competitive pricing? Let’s dive into this strategy, its advantages and disadvantages, and how it can be used to stay ahead of the competition.

    What is Competitive Pricing?

    Competitive or competition-based pricing is a strategy where brands and retailers set product prices based on what their competitors charge. This method focuses entirely on the market landscape and sets aside the cost of production or consumer demand.

    It is a good pricing model for businesses operating in saturated markets, such as consumer packaged goods (CPGs) or retail.

    Competitive Pricing Models

    Competitive pricing isn’t a one-size-fits-all strategy. The approach includes various pricing models that can be customized to fit your business goals and market positioning.

    Here’s a closer look at five of the most common competition-based pricing models:

    Price Skimming

    If you have a new product entering the market, you can initially set a high price. Price skimming allows you to maximize margins when competition is minimal.

    This strategy taps into early adopters’ willingness to pay a premium for new project categories. As competitors enter the market, you can gradually reduce the price to maintain competitiveness.

    Premium Pricing

    Premium pricing lets you position your product as high-quality or luxurious goods.

    When you charge more than your competitors, you’re not just selling a product—you’re selling status and an experience. This strategy is effective when your offering is of superior quality or has unique features that justify a higher price point.

    Price Matching

    Price matching—also known as parity pricing—is a defensive pricing tactic.

    By consistently matching your competitors’ prices, you can retain customers who might otherwise, be tempted to switch to an alternative.

    This approach signals your customers that they don’t need to look elsewhere for what they need and can feel comfortable remaining loyal to your brand.

    Penetration Pricing

    Penetration pricing is when you set a low price for a new product to gain market share quickly. The opposite of price skimming, this strategy can be particularly effective in price-sensitive or highly competitive industries.

    By attracting customers early, you can also deter some competitors from entering the market. This bold move can establish your product as a market leader from the get-go.

    Loss Leader Pricing

    Loss leader pricing is a strategic sacrifice that can lead to greater gains in the long run.

    By offering a product at a low price—sometimes even below cost—you can attract new customers to your brand and strengthen your current customers’ loyalty.

    Eventually, you can cross-sell other higher-margin products to your loyal customer base to cover the loss from your loss leader pricing and increase sales of other more profitable products.

    Key Advantages of Competitive Pricing

    Although it’s not the only pricing strategy available, competitive pricing has some significant advantages.

    It is Responsive

    Agility is synonymous with profit in industries where consumer preferences and market conditions shift rapidly.

    Competitive pricing allows you to adapt quickly—if a competitor lowers their prices, you can respond promptly to maintain your positioning.

    It is Simple to Execute and Manage

    Competitive pricing is straightforward, unlike cost-based pricing, which requires complex calculations and spans various factors and facets.

    By closely monitoring competitors’ prices and adjusting your prices accordingly, you can implement this pricing strategy with relative ease and speed.

    It Can Be Combined with Other Pricing Strategies

    Competitive pricing is not a standalone strategy—it’s a versatile approach that can easily be combined with other pricing strategies. For example, say you want to use competitive pricing without losing money on a product. In this case, you could use cost-plus pricing to determine a base price that you won’t go below, then use competitive pricing as long as the price stays above your base price.

    Key Disadvantages of Competitive Pricing

    While competition-based pricing has its advantages, it’s not without its pitfalls. Here are some potential disadvantages of competitive pricing.

    It De-emphasizes Consumer Demand

    If you focus solely on what competitors are charging, you could overlook consumer demand.

    For example, you could underprice items that consumers could be willing to purchase for more. Or, you might overprice items that consumers perceive as low-value, which can reduce sales.

    You Risk Price Wars

    If you and your competition undercut each other for customer acquisition and loyalty, you will eventually erode profit margins and harm the industry’s overall profitability. It’s a slippery slope where everyone loses in the end.

    There’s Potential for Complacency

    When you base your prices on beating those of competitors, you might neglect to differentiate your offerings through innovation and product improvements. Over time, this can weaken your brand’s position and lead to a loss of market share. Staying competitive means more than just matching prices—it means continuously evolving and adding value for the consumer.

    4 Tips for a Successful Competitive Pricing Strategy in Retail

    Here are four competition-based pricing tips for retailers:

    Retailer Tip #1. Know Where to Position Your Products in the Market

    For competitive pricing to work, you must understand your optimal product positioning in the overall market. To gain this understanding, you must regularly compare your offerings and prices with those of your key competitors, especially for high-demand products.

    Then, you can decide which competition-based pricing model is suitable for you.

    Retailer Tip #2. Price Dynamically

    Dynamic pricing is a tactic with which you automatically adjust prices on your chosen variables, such as market conditions, competitor actions, or consumer demand.

    When it comes to competitive pricing, a dynamic pricing system can track your competitors’ price changes and update yours in lockstep.

    Price-monitoring tools like DataWeave allow you to stay ahead of the game with seasonal and historical pricing trend data.

    Retailer Tip #3. Combine Competitive Pricing with Other Pricing Strategies

    Competitive pricing can be powerful, but it doesn’t have to stand alone. You can enhance its benefits with complementary marketing tactics.

    To illustrate, you can bundle products to offer greater value than what your competitors are offering. You can also leverage loyalty programs to offer exclusive discounts or rewards so customers keep returning, even when your competitors offer them lower prices.

    Retailer Tip #4. Stay in Tune with Consumer Demand

    Competition-based pricing aligns you with your competitor, but don’t lose sight of what your customers want. Routinely test your pricing strategy against consumer behavior to ensure that your prices reflect the actual value of your offerings.

    5 Tips for a Successful Competitive Pricing Strategy for Consumer Brands

    If you’re thinking about how to create a competitive pricing strategy for your brand, consider these five tips:

    Brand Tip #1. Identify Competing Products for Accurate Comparisons

    The first step in competitive pricing is to know the value of what you’re selling and how it compares to that of your competitors’ products. This extends to private-label products, similar but not identical products, and use-case products.

    Product matching ensures your pricing decisions are based on accurate like-for-like comparisons, allowing you to compete effectively.

    Brand Tip #2. Understand Your Product’s Relative Value

    Knowing how your product competes on value is key to setting the right price. If your product offers higher value, price it higher; if it offers less, price it accordingly. This ensures your pricing strategy reflects your product’s market placement.

    Brand Tip #3. Consider Brand Perception

    Even if your product is virtually the same as a competitor’s, your brand’s perceived value may be different, which plays a crucial role in pricing.

    If your brand is perceived as premium, you can justify higher prices. Conversely, if customers perceive you as a value brand, your pricing should reflect affordability.

    Brand Tip #4. Leverage Value-Based Differentiation

    When your prices are similar to competitors’, you must differentiate your products by expressing your product value through branding, packaging, quality, or something else entirely.

    This differentiation will compel consumers to choose your product over other similarly priced options.

    Brand Tip #5. Stay Vigilant with Price Monitoring

    Your competitors will update their pricing repeatedly, and you will, too.

    It can be difficult and time-consuming to monitor your competitive pricing, so you’ll need a system like DataWeave to monitor competitors’ pricing and manage dynamic pricing changes.

    This vigilance ensures your brand remains competitive and relevant in real time.

    4 Essential Capabilities You Need to Implement Successful Competition-Based Pricing

    You’ll need four key capabilities to implement a competitive pricing strategy effectively.

    AI-Driven Product Matching

    Product matching means you’ll compare many products (sometimes tens or hundreds) with varying details across multiple platforms. Accurate product matching at that scale requires AI.

    For instance, AI can identify similar smartphones to yours by analyzing features like screen size and processor type. DataWeave’s AI product matches start with 80–90% matching accuracy, and then human oversight can fine-tune the data for near-perfect matches.

    You can make informed pricing decisions once you know which competing products to base your prices on.

    Accurate and Comprehensive Data

    A successful competition-based pricing strategy depends on high-quality, comprehensive product and pricing data from many retailers and eCommerce marketplaces.

    By tracking prices on large online platforms and niche eCommerce sites across certain regions, you’ll gain a more comprehensive market view, which enables you to make quick and confident price changes.

    Normalized Measurement Units

    Accurate price comparisons are dependent on normalized unit measurements.

    For example, comparing laundry detergent sold in liters to laundry detergent sold in ounces requires converting either or both products to a common base like price-per-liter or price-per-ounce.

    This normalization ensures accurate pricing analysis.

    Timely Actionable Insights

    Timely and actionable pricing insights empower you to make informed pricing decisions.

    With top-tier competitive pricing intelligence systems, you get customized alerts, intuitive dashboards, and detailed reports to help your team quickly act on insights.

    In Conclusion

    Competitive pricing or competition-based pricing is a powerful strategy for businesses navigating crowded markets, but you must balance competitive pricing with your brand’s unique value proposition.

    Competitive pricing should complement innovation and customer-centric strategies, not replace them. To learn more, talk to us today!

  • DataWeave’s AI Evolution: Delivering Greater Value Faster in the Age of AI and LLMs

    DataWeave’s AI Evolution: Delivering Greater Value Faster in the Age of AI and LLMs

    In retail, competition is fierce, and in its ever-evolving landscape, consumer expectations are higher than ever.

    For years, our AI-driven solutions have been the foundation that empowers businesses to sharpen their competitive pricing and optimize digital shelf performance. But in today’s world, evolution is constant—so is innovation. We now find ourselves at the frontier of a new era in AI. With the dawn of Generative AI and the rise of Large Language Models (LLMs), the possibilities for eCommerce companies are expanding at an unprecedented pace.

    These technologies aren’t just a step forward; they’re a leap—propelling our capabilities to new heights. The insights are deeper, the recommendations more precise, and the competitive and market intelligence we provide is sharper than ever. This synergy between our legacy of AI expertise and the advancements of today positions DataWeave to deliver even greater value, thus helping businesses thrive in a fast-paced, data-driven world.

    This article marks the beginning of a series where we will take you through these transformative AI capabilities, each designed to give retailers and brands a competitive edge.

    In this first piece, we’ll offer a snapshot of how DataWeave aggregates and analyzes billions of publicly available data points to help businesses stay agile, informed, and ahead of the curve. These fall into four broad categories:

    • Product Matching
    • Attribute Tagging
    • Content Analysis
    • Promo Banner Analysis
    • Other Specialized Use Cases

    Product Matching

    Dynamic pricing is an indispensable tool for eCommerce stores to remain competitive. A blessing—and a curse—of online shopping is that users can compare prices of similar products in a few clicks, with most shoppers gravitating toward the lowest price. Consequently, retailers can lose sales over minor discrepancies of $1–2 or even less.

    All major eCommerce platforms compare product prices—especially their top selling products—across competing players and adjust prices to match or undercut competitors. A typical product undergoes 20.4 price changes annually, or roughly once every 18 days. Amazon takes it to the extreme, changing prices approximately every 10 minutes. It helps them maintain a healthy price perception among their consumers.

    However, accurate product matching at scale is a prerequisite for the above, and that poses significant challenges. There is no standardized approach to product cataloging, so even identical products bear different product titles, descriptions, and attributes. Information is often incomplete, noisy, or ambiguous. Image data contains even more variability—the same product can be styled using different backgrounds, lighting, orientations, and quality; images can have multiple overlapping objects of interest or extraneous objects, and at times the images and the text on a single page might belong to completely different products!

    DataWeave leverages advanced technologies, including computer vision, natural language processing (NLP), and deep learning, to achieve highly accurate product matching. Our pricing intelligence solution accurately matches products across hundreds of websites and automatically tracks competitor pricing data.

    Here’s how it works:

    Text Preprocessing

    It identifies relevant text features essential for accurate comparison.

    • Metadata Parsing: Extracts product titles, descriptions, attributes (e.g., color, size), and other structured data elements from Product Description Pages (PDP) that can help in accurately identifying and classifying products.
    • Attribute-Value Normalization: Normalize attributes names (e.g. RAM vs Memory) and their values (e.g., 16 giga bytes vs 16 gigs vs 16 GB); brand names (e.g., Benetton vs UCB vs United Colors of Benetton); mapping category hierarchies a standard taxonomy.
    • Noise Removal: Removes stop words and other elements with no descriptive value; this focuses keyword extraction on meaningful terms that contribute to product identification.

    Image Preprocessing

    Image processing algorithms use feature extraction to define visual attributes. For example, when comparing images of a red T-shirt, the algorithm might extract features such as “crew neck,” “red,” or “striped.”

    Image Preprocessing using advanced AI and other tech for product matching in retail analytics.

    Image hashing techniques create a unique representation (or “hash”) of an image, allowing for efficient comparison and matching of product images. This process transforms an image into a concise string or sequence of numbers that captures its essential features even if the image has been resized, rotated, or edited.

    Before we perform these activities there is a need to preprocess images to prepare them for downstream operations. These include object detection to identify objects of interest, background removal, face/skin detection and removal, pose estimation and correction, and so forth.

    Embeddings

    We have built a hybrid or a multimodal product-matching engine that uses image features, text features, and domain heuristics. For every product we process we create and store multiple text and image embeddings in a vector database. These include a combination of basic feature vectors (e.g. tf-idf based, colour histograms, share vectors) to more advanced deep learning algorithms-based embeddings (e.g., BERT, CLIP) to the latest LLM-based embeddings.

    Classification

    Classification algorithms enhance product attribute tagging by designating match types. For example, the product might be identified as an “exact match”, “variant”, “similar”, or “substitute.” The algorithm can also identify identical product combinations or “baskets” of items typically purchased together.

    What is the Business Impact of Product Matching?

    • Pricing Intelligence: Businesses can strategically adjust pricing to remain competitive while maintaining profitability. High-accuracy price comparisons help businesses analyze their competitive price position, identify opportunities to improve pricing, and reclaim market share from competitors.
    • Similarity-Based Matching: Products are matched based on a range of similarity features, such as product type, color, price range, specific features, etc., leading to more accurate matches.
    • Counterfeit Detection: Businesses can identify counterfeit or unauthorized versions of branded products by comparing them against authentic product listings. This helps safeguard brand identity and enables brands to take legal action against counterfeiters.

    Attribute Tagging

    Attribute tagging involves assigning standardized tags for product attributes, such as brand, model, size, color, or material. These naming conventions form the basis for accurate product matching. Tagging detailed attributes, such as specifications, features, and dimensions, helps match products that meet similar criteria. For example, tags like “collar” or “pockets” for apparel ensure high-fidelity product matches for hard-to-distinguish items with minor stylistic variations.

    Attributes that are tagged when images are matched for retail ecommerce analytcis.

    Including tags for synonyms, variants, and long-tail keywords (e.g., “denim” and “jeans”) improves the matching process by recognizing different terms used for similar products. Metadata tags categorize similar items according to SKU numbers, manufacturer details, and other identifiers.

    Altogether, these capabilities provide high-quality product matches and valuable metadata for retailers to classify their products and compare their product assortment to competitors.

    User-Generated Content (UGC) Analysis

    Customer reviews and ratings are rich sources of information, enabling brands to gauge consumer sentiment and identify shortcomings regarding product quality or service delivery. However, while informative, reviews constitute unstructured “noisy” data that is actionable only if parsed correctly.

    Here’s where DataWeave’s UGC analysis capability steps in.

    • Feature Extractor: Automatically pulls specific product attributes mentioned in the review (e.g., “battery life,” “design” and “comfort”)
    • Feature Opinion Pair: Pairs each product attribute with a corresponding sentiment from the review (e.g., “battery life” is “excellent,” “design” is “modern,” and “comfort” is “poor”)
    • Calculate Sentiment: Calculates an overall sentiment score for each product attribute
    The user generated content analysis framework used by DataWeave to calculate sentiment.

    The final output combines the information extracted from each of these features, which looks something like this:

    • Battery life is excellent
    • Design is modern
    • Not satisfied with the comfort

    The algorithm also recognizes spammy reviews and distinguishes subjective reviews (i.e., those fueled by emotion) from objective ones.

    DataWeave's image processing tool also analyses promo banners.

    Promo Banner Analysis

    Our image processing tool can interpret promotional banners and extract information regarding product highlights, discounts, and special offers. This provides insights into pricing strategies and promotional tactics used by other online stores.

    For example, if a competitor offers a 20% discount on a popular product, you can match or exceed this discount to attract more customers.

    The banner reader identifies successful promotional trends and patterns from competitors, such as the timing of discounts, frequently promoted product categories or brands, and the duration of sales events. Ecommerce stores can use this information to optimize their promotion strategies, ensuring they launch compelling and timely offers.

    Other Specialized Use Cases

    While these generalized AI tools are highly useful in various industries, we’ve created other category—and attribute-specific capabilities for specialty goods (e.g., those requiring certifications or approval by federal agencies) and food items. These use cases help our customers adhere to compliance requirements.

    Certification Mark Detector

    This detector lets retailers match items based on official certification marks. These marks represent compliance with industry standards, safety regulations, and quality benchmarks.

    Example:

    • USDA Organic: Certification for organic food production and handling
    • ISO 9001: Quality Management System Certification

    By detecting these certification marks, the system can accurately match products with their certified counterparts. By identifying which competitor products are certified, retailers can identify products that may benefit from certification.

    Image analysis based product matching at DataWeave also detects certificate marks.

    Nutrition Fact Table Reader

    Product attributes alone are insufficient for comparing food items. Differences in nutrition content can influence product category (e.g., “health food” versus regular food items), price point, and consumer choice. DataWeave’s nutrition fact table reader scans nutrition information on packaging, capturing details such as calorie count, macronutrient distribution (proteins, fats, carbohydrates), vitamins, and minerals.

    The solution ensures items with similar nutritional profiles are correctly identified and grouped based on specific dietary requirements or preferences. This helps with price comparisons and enables eCommerce stores to maintain a reliable database of product information and build trust among health-conscious consumers.

    Image processing for product matching also extracts nutrition table data at DataWeave.

    Building Next-Generation Competitive and Market Intelligence

    Moving forward, breakthroughs in generative AI and LLMs have fueled substantial innovation, which has enabled us to introduce powerful new capabilities for our customers.

    How Gen AI and LLMs are used by DataWeave to glean insights for analytics

    These include:

    • Building Enhanced Products, Solutions, and Capabilities: Generative AI and LLMs can significantly elevate the performance of existing solutions by improving the accuracy, relevance, and depth of insights. By leveraging these advanced AI technologies, DataWeave can enhance its product offerings, such as pricing intelligence, product matching, and sentiment analysis. These tools will become more intuitive, allowing for real-time updates and deeper contextual understanding. Additionally, AI can help create entirely new solutions tailored to specific use cases, such as automating competitive analysis or identifying emerging market trends. This positions DataWeave to remain at the forefront of innovation, offering cutting-edge solutions that meet the evolving needs of retailers and brands.
    • Reducing Turnaround Time (TAT) to Go-to-Market Faster: Generative AI and LLMs streamline data processing and analysis workflows, enabling faster decision-making. By automating tasks like data aggregation, sentiment analysis, and report generation, AI dramatically reduces the time required to derive actionable insights. This efficiency means that businesses can respond to market changes more swiftly, adjusting pricing or promotional strategies in near real-time. Faster insights translate into reduced turnaround times for product development, testing, and launch cycles, allowing DataWeave to bring new solutions to market quickly and give clients a competitive advantage.
    • Improving Data Quality to Achieve Higher Performance Metrics: AI-driven technologies are exceptionally skilled at cleaning, organizing, and structuring large datasets. Generative AI and LLMs can refine the data input process, reducing errors and ensuring more accurate, high-quality data across all touchpoints. Improved data quality enhances the precision of insights drawn from it, leading to higher performance metrics like better product matching, more accurate price comparisons, and more effective consumer sentiment analysis. With higher-quality data, businesses can make smarter, more informed decisions, resulting in improved revenue, market share, and customer satisfaction.
    • Augmenting Human Bandwidth with AI to Enhance Productivity: Generative AI and LLMs serve as powerful tools that augment human capabilities by automating routine, time-consuming tasks such as data entry, classification, and preliminary analysis. This allows human teams to focus on more strategic, high-value activities like interpreting insights, building relationships with clients, and developing new business strategies. By offloading these repetitive tasks to AI, human productivity is significantly enhanced. Employees can achieve more in less time, increasing overall efficiency and enabling teams to scale their operations without needing a proportional increase in human resources.

    In our ongoing series, we will dive deep into each of these capabilities, exploring how DataWeave leverages cutting-edge AI technologies like Generative AI and LLMs to solve complex challenges for retailers and brands.

    In the meantime, talk to us to learn more!

  • Competitor Price Monitoring in E-commerce: Everything You Need to Know

    Competitor Price Monitoring in E-commerce: Everything You Need to Know

    Picture this: You wake up one morning to discover that your top competitor reduced their prices overnight. And now your shopper traffic has tanked and your sales have taken a hit.

    Unfortunately, this is a common scenario because your customers can compare prices online in seconds—and loyalty lies with the budget.

    So, how can you protect your business? Price monitoring.

    Price monitoring solutions can help you keep abreast of competitor price changes—which, of course, will help you improve your pricing strategies, retain your customers, and maximize your profits.

    How? In this article, we’ll explore:

    • What is price monitoring
    • The key benefits of price monitoring for retailers and brands
    • What a capable price monitoring solution can do

    What Is Price Monitoring?

    Price monitoring is the process of tracking and analyzing your competitor’s prices across various online and offline platforms. By monitoring competitors’ prices, you can understand market price trends and adjust your prices strategically—which, in turn, helps you remain competitive, increase margins, and improve customer retention.

    5 Benefits of Price Monitoring

    Competitor price monitoring can help you:

    1. Gain a competitive edge: Competitor price tracking allows you to adjust your prices to remain attractive to consumers.
    2. Maximize revenue: With timely pricing data, you’re empowered to identify optimum price points that strike a delicate balance between maximizing revenue and maintaining customer loyalty.
    3. Retain customers: Consumers are looking for the most value for their dollar, so maintaining consistently competitive pricing is crucial for retaining loyal customers.
    4. Understand promotional effectiveness: Price monitoring helps businesses evaluate the effectiveness of their promotions and discounts. By comparing the impact of different pricing strategies, businesses can refine their promotional tactics to maximize sales and customer engagement.
    5. Understand market movements: By analyzing historical pricing data, you’re better positioned to anticipate future pricing changes — and adjust your strategies accordingly.

    4 Essential Capabilities of Price Monitoring Software

    Here are four capabilities to look for when choosing a price monitoring system.

    1. AI-Driven Product Matching

    Product matching is the process of identifying identical or similar products across different platforms to ensure accurate price comparisons.

    If your price monitoring solution can’t reliably match your products with competitors’ across various sales channels at scale, you’ll end up with poor data. Inaccurate data will then lead you to make misinformed pricing decisions.

    Product matching needs to be accurate and comprehensive, covering a wide range of products and product variations—even for including private label products.

    For example, AI-driven product matching can recognize a specific brand and model of sneakers across multiple online stores—even if product descriptions and images differ. Here’s how it works in a nutshell:

    • Sophisticated algorithms and deep learning architecture enable AI to identify and match products that aren’t identical but share key characteristics and features.
    • Using unified systems for text and image recognition, the AI matches similar SKUs across hundreds of eCommerce stores and millions of products.
      The AI zeroes in on critical product elements in images, like a t-shirt’s shape, sleeve length, and color.
    • The AI also extracts unique signatures from photos for rapid, efficient identification and grouping across billions of indexed items.

    DataWeave’s AI algorithm can initially match products with 80–90% accuracy. Then, humans can bring contextual judgement and make nuanced decisions that the AI might miss to correct errors quickly and push for accuracy closer to 100%. By integrating AI automation with human validation, you can achieve accurate and reliable product-matching coverage at scale.

    2. Accurate and Comprehensive Data Collection and Aggregation

    The insights you derive are only as good as the data you collect. However, capturing comprehensive pricing data is tough when your competitors operate on multiple platforms.

    For truly effective price monitoring insights, you need consistent, comprehensive, and highly accurate data. This means your chosen price monitoring system should:

    • Scrape data from various sources, such as desktop and mobile sites and mobile applications.
    • Pull data from various online platforms like aggregators, omnichannel retailers, delivery intermediaries, online marketplaces, and more.
    • Handle data from different regions and languages.
    • Collect data at regular intervals to ensure timeliness.

    DataWeave’s online price monitoring software covers all of these bases and more with a fast, automated data source configuration system. It also allows you to painlessly add new data sources to scrape.

    Instead of incomplete or inaccurate data, you’ll have comprehensive and up-to-date data, allowing you to respond quickly to market changes with confidence.

    3. Seamless Normalization of Product Measurement Units

    You can’t compare apples to oranges—or price-per-kilogram to price-per-pound.

    For price monitoring to be accurate, there must be a way to normalize measurement units—so that we’re always comparing price-per-gram to price-per-gram. If we compare prices without taking into account measurement units, our data will be misleading at best.

    Let’s take a closer look. Say that your top competitor sells 12oz cans of beans for $3, and you sell 15oz cans for $3.20. At first glance, your larger cans of beans will appear more expensive—but that’s not true. If we normalize the measurement unit—in this example, an oz—the larger can of beans offers more value to customers.

    Unit of measure normalization facilitates sound price adjustments based on accurate and reliable data. For this reason, every business needs a price tracking tool that can guarantee accurate comparisons by normalizing unit measurements—including weight, volume, and quantity.

    4. Actionable Data and an Intuitive User Experience

    Knowledge is only powerful when applied—and price monitoring insights are only useful when they’re accessible and actionable.

    For this reason, the best price monitoring software doesn’t just provide insights based on accurate and comprehensive data, but it also provides several ways to understand and deploy those insights.

    Ideal price monitoring solutions provide customized pricing alerts, intuitive dashboards, detailed reports, and visuals that are easy to interpret—all tailored to each particular team or a team member’s needs. These features should make it easy for team members to compare prices against those of competitors in specific categories and product groupings.

    Your price tracking tool should also permit flexible API integrations and offer straightforward data export options. This way, you can integrate competitive pricing data with your pricing software, Business Intelligence (BI) tools, or Enterprise Resource Planning (ERP) system.

    4 Ways Retailers Can Leverage Price Monitoring

    Retailers can use price monitoring tools to remain competitive without compromising profitability—here’s how:

    1. Track Competitors’ Prices

    Competitor price monitoring helps you avoid being undercut—and, as a result, maintain market share. By tracking competitor prices in real-time, you can adjust prices to remain competitive, especially in dynamic markets. Ideally, you should monitor both direct competitors selling the same products and indirect competitors selling similar or alternative products. This way, you’ll have a complete picture of market prices and can make more informed pricing adjustments.

    2. Understand Historical and Seasonal Price Trends

    As a retailer, you may want to analyze historical data to identify price patterns and predict future price movements—especially in relation to holidays and seasonal products. Knowing what’s coming, you’re better positioned to plan for pricing changes and promotional campaigns.

    3. Implement Dynamic Pricing

    Dynamic pricing is the process of adjusting prices based on real-time market conditions, product demand, and competitors’ prices—allowing you to respond faster to market changes to maintain optimized prices.

    4. Optimize Promotional Strategies

    Price monitoring tools can track retail promotions across numerous online and offline sales avenues, providing insight into the nature and timing of competitors’ promotions. This data can help you determine which promotions are most effective—and which aren’t—allowing you to improve your own promotions and discounts, and allocate marketing resources where it matters most. This is especially beneficial during peak sales periods.

    3 Ways Brands Can Employ Price Monitoring

    Here are three ways brands can use price monitoring to remain profitable, protect brand equity, and gain a competitive edge.

    1. Maintain Consistent Retail Prices

    Minimum advertised price (MAP) policies are designed to prevent retailers from devaluing a brand while ensuring fair competition among retailers. Price monitoring applications allow your brand to track retailers’ prices to detect MAP policy violations. Data in hand, you can maintain consistent pricing across online sales channels, physical stores, and retail stores’ digital shelves — and, critically, protect your brand equity.

    2. Improve Product and Brand Positioning

    When you understand how your products’ prices compare to those of competitors, you can set prices to improve brand positioning. For example, if you want to position your brand as luxurious and high-quality, you need to set higher product prices than budget-friendly alternative products.

    3. Ensure Product Availability

    You can use a price monitoring solution to track product availability to ensure products are always in stock, even across different physical stores and online marketplaces. If a product is frequently sold out, you can adjust production levels or help retailers to improve their inventory management.

    Key Takeaways: E-commerce Price Monitoring

    Price monitoring software allows you to compare your products’ prices with competitors. This valuable data can help you:

    • Optimize revenue through timely price changes and dynamic pricing
      Avoid being undercut by competitors
    • Improve pricing strategies and promotions to increase sales and retain customers
    • Maintain consistent prices across sales channels

    To learn more, check out our article, What is Competitive Pricing Intelligence: The Ultimate Guide here or reach out and talk to us today!

  • Cracking the Code: How Retailers Can Adapt to Plummeting Egg Prices in 2024

    Cracking the Code: How Retailers Can Adapt to Plummeting Egg Prices in 2024

    Virtually every cuisine in the world uses eggs. They’re in your breakfast, lunch, dinner, and dessert — which is perhaps why the global egg market is expected to generate $130.70 billion in revenue in 2024 and is projected to grow to approximately $193.56 billion by 2029.

    More specifically, the United States is the fourth-largest egg producer worldwide. The country’s egg market is projected to generate $15.75 billion in 2024 and increase to $22.51 billion by 2029.

    This growth is driven by several factors, most notably:

    • Health-consciousness among consumers: Consumers value eggs for their essential nutrients and rich protein content.
    • Demand for convenience foods: Consumers’ preferences are shifting toward quick and easy foods, which drives demand for shell eggs and pre-packaged boiled or scrambled eggs.
    • Population Growth: A growing worldwide population increases the demand for eggs.
    • Affordability and accessibility: Eggs are an affordable and accessible nutrient-dense food source for many.

    Despite these factors contributing to the U.S. egg market’s growth, recent times have seen egg prices fall dramatically.

    Based on a sample of 450 SKUs, DataWeave discovered that egg prices in the U.S. fell by 6.7% between April 2023 and April 2024, dipping to its lowest (-12.6%) in December 2023.

    Egg Price Chart: Egg Prices USA Going Down 98.95% between April 2023 and April 2024

    So, what’s causing the decrease in egg prices?

    The Rise and Fall of Egg Prices: A Recent History

    In 2022, avian influenza severely impacted the United States. The disease affected wild birds in nearly every state and devastated commercial flocks in approximately half of the country.

    The 2022 incident was the first major outbreak since 2015 and led to the culling of more than 52.6 million birds, mainly poultry, to prevent the disease from spreading uncontrollably.

    With almost 12 million fewer egg-laying hens, the United States produced around 109.5 billion eggs in 2022 — a drop of nearly two billion from the previous year.

    Consequently, the cost of eggs soared, peaking at $4.82 a dozen — more than double the price of eggs in the previous year.

    The avian flu continues to affect egg-laying hens and other poultry birds across the United States. As of April 2024, farms have killed a total of 85 million poultry birds in an attempt to contain the disease.

    Despite the disease’s effects, production facilities have made significant efforts to repopulate flocks, leading to a steady increase in supply – and a much anticipated decrease in egg prices.

    According to the U.S. Bureau of Labor Statistics, there was an increase in producer egg prices in 2022, reaching a peak in November 2022, at which point they began to fall.

    Retailer’s egg prices followed suit. The egg price chart below depicts retailers’ declining egg prices over one year, from April 2023 to April 2024, with Giant Eagle showing the most significant price reductions and Walmart the least.

    Egg Price Chart Featuring Leading Retailers 2023-2024

    What Does the Future Hold for Egg Prices?

    The USDA reported recent severe avian flu outbreaks in June 2024. These outbreaks are estimated to have affected 6.23 million birds.

    With a reduction in egg-laying hens, egg prices are likely to increase — time will tell.

    Nonetheless, the annual per capita consumption of eggs in the U.S. is projected to reach 284.4 per person in 2024 from 281.3 per person in 2023. So for now, producers and retailers can rest assured of the growing demand for eggs.

    How Can Retailers Adapt to the Unpredictability of Egg Prices?

    Egg prices were down to $2.69 for a dozen in May 2024. However, they are still significantly higher than consumers were used to just a few years ago—eggs were, on average, $1.46 a dozen in early 2020.

    Additionally, while the avian flu puts pressure on producers, inflation and supply chain disruptions exert pressure on retailers.

    With such challenging egg market conditions, what can retailers do to maintain customer loyalty amid reduced consumer spending while maintaining profitability?

    1. Give the Customer What They Want: Increase Offerings of Organic, Cage-Free, and Free-Range Eggs

    As mentioned, Data Bridge Market Research’s trends and forecast report highlighted a significant increase in consumer health consciousness. Additionally, animal welfare increasingly influences consumers’ purchasing decisions when buying meat and dairy products.

    DataWeave data shows that the prices of organic, cage-free, and free-range eggs—such as those by brands like Happy Eggs and Marketside—have fallen less than those of non-organic, caged egg brands.

    Egg Price Chart Featuring Leading Egg Brand Prices 2023-2024

    2. Increase Private-Label Offerings

    Private labels typically offer retailers higher margins than national brands. These margins can shield consumers from sudden wholesale egg price swings, helping to preserve brand trust and consumer loyalty without sacrificing profitability.

    Moreover, eggs are particularly suited to private labeling, given their uniform appearance and taste and the lack of product innovation opportunities.

    Undoubtedly, this is why sales of private-label eggs dwarf sales of national egg brands in the United States. Statista reports that across three months in 2024, private label egg sales amounted to $1.55 billion U.S. dollars, while the combined sales of the top nine national egg brands totaled just $617.88 million U.S. dollars.

    3. Price Intelligently

    With the current and predicted fluctuations in egg prices over the foreseeable future, price competitiveness is paramount to margin management and customer loyalty.

    This is especially true when lower prices are the primary factor influencing the average consumer’s choice of supermarket for daily essentials purchases.

    AI-driven pricing intelligence tools like DataWeave give retailers valuable highly granular and reliable insights on competitor pricing and market dynamics. In today’s data-motivated environment, these insights are necessary for competitiveness and profitability.

    Final Thoughts

    Egg prices have fluctuated significantly due to the impact of avian flu. Despite recent price drops, future egg price increases are possible due to ongoing outbreaks. Retailers should adapt to unstable egg prices by increasing organic, free-range, cage-free, and private-label egg offerings while leveraging AI-driven pricing tools to maintain margins and customer loyalty.

    Speak to us today to learn more!

  • How Healthy is Your Assortment?

    How Healthy is Your Assortment?

    In 2025, both consumers and retailers continue to prioritize better health – albeit with evolving definitions and expectations.

    The pandemic fundamentally transformed how consumers approach wellness, with this shift becoming entrenched in shopping behaviors years later. As shopping habits have permanently altered, retailers now face increased pressure to rapidly adapt their assortments with in-demand health and wellness products that enhance customer experience across various channels – online and offline.

    Let’s explore how leading retailers are keeping consumers – and their own bottom lines – healthy by responding effectively to market trends to drive online sales and market share.

    Health & Wellness Influence The Product Mix Across Categories

    Consumption habits have changed dramatically since the onset of the pandemic. A McKinsey study shows that 82% and 73% of US, and UK consumers respectively now consider health & wellness a top priority. Typically shoppers adjust grocery shopping and meal planning at the start of the year, with many focusing on fresh, organic, and nutrient-rich foods.

    The influential health and wellness mega-trend spans diverse retail channels, including grocery, pharmacy and mass. It extends across numerous categories like:

    • Food and beverage (natural, organic, vegan, plant-based food)
    • Health and personal care
    • Beauty
    • Cleaning products
    • Fitness equipment 
    • Athleisure (apparel)
    • Consumer electronics like health wearables.

    Today’s health movement is so powerful and compelling that retailers have revised their business strategies to better serve health-conscious consumers. For instance, drugstores are reinventing themselves as healthcare destinations, with CVS and Kroger expanding into personalized care delivery and value-based clinics to enhance their health offerings.

    Major retailers like Amazon, Walmart, and Target report robust sales in health and wellness categories. For example, Walmart saw a 4.6% increase in comparable sales in early 2024, driven significantly by grocery, consumables, and health-related products.

    New product categories are gaining traction:

    • Functional foods and beverages are seeing unprecedented growth, with Target launching over 2,000 wellness items in the category, including exclusive products priced under $10.
    • Personalized nutrition and mental health products are surging, including tailored dietary solutions and stress-reducing items.
    • Health wearables and wellness tech continue to rise in popularity, with over 150 new wellness tech items launched at Target this year, including innovative red-light therapy devices.
    • Transparency and sustainability certifications like organic, non-GMO, and vegan labels are increasingly driving purchasing decisions.
    • Clinically proven benefits offered by health & wellness products are gaining traction among Gen Z.

    Retail’s Survival Of The Fittest Moves Online

    As the omnichannel retail sector continues to grow, more shoppers now make purchase decisions within minutes using just a few clicks rather than physically visiting brick-and-mortar stores. In some cases, AI agents like Operator from Chat-GPT or Gemini (Google’s Chatbot) even make personalized, curated lists and reduce the time taken to make purchase decisions. Traditional retail paradigms are rapidly becoming obsolete as consumers grow savvier, more empowered, and better informed than ever before.

    To stay competitive, more retailers are embracing AI-driven data insights to adjust their assortments to reflect consumer demand for health and wellness products.

    According to industry experts, data insights have emerged as a critical retail strategy that continues to gain momentum. This is because retailers can no longer afford to guess how to approach their omnichannel strategy. They need the accuracy, clarity, and efficiency of data insights to guide their assortment and pricing decisions to outmaneuver competitors, maximize sales, and win market share as shopping evolves online.

    Among its retail best practices, Bain & Company recommends retailers “lead with superior assortments that use a customer-centric lens to reduce complexity and increase space for the products customers love.” Insights can help retailers discover the optimal mix of national brands, private labels, limited-time offers, and value-added bundles.

    Lead with superior assortments …
    increase space for the products consumers love

    ~ Bain & Company

    Determining the optimal mix of products also includes bestsellers and unique items that help retailers distinguish their offerings. Assortment insights help retail executives track competitors’ assortment changes and spot gaps in their own product assortment to adapt to emerging consumer trends and in-demand products.

    Why Effective Assortment Planning Matters

    Assortment planning sits at the heart of retail success, directly influencing profitability, customer satisfaction, and competitive differentiation. In today’s health-conscious market, getting your assortment right means:

    • Meeting Customer Expectations: Today’s health-conscious consumers expect relevant, high-quality products that match their wellness goals. A well-planned assortment signals that a retailer understands its customers’ evolving needs.
    • Optimizing Inventory Investment: Strategic assortment planning ensures capital is allocated to products with the highest return potential while minimizing investments in slow-moving items.
    • Creating Competitive Advantage: A distinctive assortment that includes popular health and wellness products alongside unique offerings helps retailers stand out in a crowded marketplace.
    • Reducing Lost Sales: Effective assortment planning minimizes the risk of stockouts on high-demand health and wellness items, preventing customers from shopping elsewhere.
    • Supporting Omnichannel Strategies: Well-executed assortment planning ensures consistency across physical and digital touchpoints, creating a seamless customer experience.
    • Improving Operational Efficiency: A thoughtfully curated assortment reduces complexity throughout the supply chain, from procurement to warehouse management to in-store operations.

    As health and wellness continues to drive consumer spending, retailers who excel at assortment planning can capitalize on these trends more effectively than their competitors, turning market insights into tangible business results.

    AI-Powered Assortment Analytics Driving Retail Success

    The synergy of AI and data analytics into retail assortment planning is changing how businesses approach inventory management. Retailers using AI-driven predictive analytics have achieved a 36% SKU reduction while increasing sales by 1-2%, showcasing the efficiency of data-driven approaches according to a McKinsey report.

    Retailers face several challenges that can hinder strategic assortment planning:

    • Limited Understanding of Competition: Retailers struggle to gain comprehensive insights into their product assortments relative to competitors, often lacking visibility into their strengths and weaknesses across categories.
    • Data Overload: Assortment planning involves handling vast amounts of data, making it challenging for category managers to extract actionable insights without user-friendly tools and visualization.
    • Cross-Channel Consistency: With omnichannel retailing, ensuring consistency across physical stores, e-commerce, and other channels is complex. Misalignment can lead to customer dissatisfaction and loss of loyalty.
    • Adapting to Changing Market Trends: Identifying top-selling products and tracking consumer preferences is challenging. Balancing the right mix of products is crucial; without analytics, retailers risk lost sales or excess slow-moving inventory.
    • Scalability and Efficiency: As retailers expand into new markets or categories, scaling their assortment planning processes efficiently becomes a challenge. Legacy systems and manual methods often fail to support the agility needed for quick decision-making at scale.

    DataWeave’s Assortment Analytics helps retailers address these challenges by providing a robust, easy-to-use platform that delivers actionable insights into product assortments and competitive positioning. With AI-driven, contextual insights and alerts, retailers can effortlessly identify high-demand, unique products, capitalize on catalog strengths, optimize pricing and promotions, improve stock availability, and refine assortments to maintain a competitive edge.

    Beyond Data: Actionable Insights That Drive Results

    DataWeave’s platform provides a comprehensive, insight-led view into assortments through several key dimensions:

    • Stock Insights: Monitor stock changes across retailers to stay updated on availability.
    • Category and Sub-Category Insights: Analyze assortment changes, identify newly introduced or discontinued categories, and track leading retailers in specific segments.
    • Brand Insights: Identify newly introduced, missing, or discontinued brands, as well as leading brands within chosen categories.
    • Product Insights: Identify bestsellers and evaluate their impact on your portfolio, analyzing pricing and promotions.
    • Personalized Recommendations: Receive suggestions tailored to your behavior and user profile to refine decision-making.
    • User-Configured Alerts: Stay informed with alerts designed to highlight significant changes or opportunities.

    The platform addresses data overload by providing an intuitive, insight-driven view of your assortment. Category managers gain a comprehensive, bird’s-eye perspective of key changes within specified timeframes, allowing them to focus on what matters most.

    Preparing for the Future of Retail Health

    To avoid supply chain bottlenecks, inventory shortages, and out-of-stock scenarios, retailers are strategically using data insights to anticipate fluctuations in demand and proactively plan how to manage disruptions that could affect their assortments.

    For variety that satisfies consumers’ diverse product needs, retailers are using data insights to determine whether to collaborate with nimble suppliers to promptly fill any gaps.

    To further strengthen their assortments’ attractiveness, retailers are using AI-powered pricing analytics to offer the right product at the right price. These analytics help retailers know exactly how they compare to rivals’ pricing moves with relevant data so they can keep up with market fluctuations and stay competitive by earning consumer engagement, sales, and trust.

    To Conclude

    Like nourishing habits that improve consumers’ health, data insights improve retailers’ e-commerce health. Advanced assortment and pricing analytics, powered by artificial intelligence, help retailers make better decisions faster to boost their agility, outmaneuver rivals, and fuel online growth.

    In a retail landscape where consumer preferences for health and wellness continue to evolve rapidly, the retailers who thrive will be those who leverage data and AI to understand, anticipate, and meet these changing demands with the right products at the right time. Reach out to us to know more.

  • Using Siamese Networks to Power Accurate Product Matching in eCommerce

    Using Siamese Networks to Power Accurate Product Matching in eCommerce

    Retailers often compete on price to gain market share in high performance product categories. Brands too must ensure that their in-demand assortment is competitively priced across retailers. Commerce and digital shelf analytics solutions offer competitive pricing insights at both granular and SKU levels. Central to this intelligence gathering is a vital process: product matching.

    Product matching or product mapping involves associating identical or similar products across diverse online platforms or marketplaces. The matching process leverages the capabilities of Artificial Intelligence (AI) to automatically create connections between various representations of identical or similar products. AI models create groups or clusters of products that are exactly the same or “similar” (based on some objectively defined similarity criteria) to solve different use cases for retailers and consumer brands.

    Accurate product matching offers several key benefits for brands and retailers:

    • Competitive Pricing: By identifying identical products across platforms, businesses can compare prices and adjust their strategies to remain competitive.
    • Market Intelligence: Product matching enables brands to track their products’ performance across various retailers, providing valuable insights into market trends and consumer preferences.
    • Assortment Planning: Retailers can analyze their product range against competitors, identifying gaps or opportunities in their offerings.

    Why Product Matching is Incredibly Hard

    But product matching stands out as one of the most demanding technical processes for commerce intelligence tools. Here’s why:

    Data Complexity

    Product information comes in various (multimodal) formats – text, images, and sometimes video. Each format presents its own set of challenges, from inconsistent naming conventions to varying image quality.

    Data Variance

    The considerable fluctuations in both data quality and quantity across diverse product categories, geographical regions, and websites introduce an additional layer of complexity to the product matching process.

    Industry Specific Nuances

    Industry specific nuances introduce unique challenges to product matching. Exact matching may make sense in certain verticals, such as matching part numbers in industrial equipment or identifying substitute products in pharmaceuticals. But for other industries, exactly matched products may not offer accurate comparisons.

    • In the Fashion and Apparel industry, style-to-style matching, accommodating variants and distinguishing between core sizes and non-core sizes and age groups become essential for accurate results.
    • In Home Improvement, the presence of unbranded products, private labels, and the preference for matching sets rather than individual items complicates the process.
    • On the other hand, for grocery, product matching becomes intricate due to the distinction between item pricing and unit pricing. Managing the diverse landscape of different pack sizes, quantities, and packaging adds further layers of complexity.

    Diverse Downstream Use Cases

    The diverse downstream business applications give rise to various flavors of product matching tailored to meet specific needs and objectives.

    In essence, while product matching is a critical component in eCommerce, its intricacies demand sophisticated solutions that address the above challenges.

    To solve these challenges, at DataWeave, we’ve developed an advanced product matching system using Siamese Networks, a type of machine learning model particularly suited for comparison tasks.

    Siamese Networks for Product Matching

    Our methodology involves the use of ensemble deep learning architectures. In such cases, multiple AI models are trained and used simultaneously to ensure highly accurate matches. These models tackle NLP (natural language processing) and Computer Vision challenges specific to eCommerce. This technology helps us efficiently narrow down millions of product candidates to just 5-15 highly relevant matches.

    The Tech Powering Siamese Networks

    The key to our approach is creating what we call “embeddings” – think of these as unique digital fingerprints for each product. These embeddings are designed to capture the essence of a product in a way that makes similar products easy to identify, even when they look slightly different or have different names.

    Our system learns to create these embeddings by looking at millions of product pairs. It learns to make the embeddings for similar products very close to each other while keeping the embeddings for different products far apart. This process, known as metric learning, allows our system to recognize product similarities without needing to put every product into a rigid category.

    This approach is particularly powerful for eCommerce, where we often need to match products across different websites that might use different names or images for the same item. By focusing on the key features that make each product unique, our system can accurately match products even in challenging situations.

    How Siamese Networks Work?

    Imagine having a pair of identical twins who are experts at spotting similarities and differences. That’s essentially what a Siamese network is – a pair of identical AI systems working together to compare things.

    How it works:

    • Twin AI systems: Two identical AI systems look at two different products.
    • Creating ‘fingerprints’ or ‘embedding’: Each system creates a unique ‘fingerprint’ of the product it’s looking at.
    • Comparison: These ‘fingerprints’ are then compared to see how similar the products are.

    Architecture

    The architecture of a Siamese network typically consists of three main components: the shared network, the similarity metric, and the contrastive loss function.

    • Shared Network: This is the ‘brain’ that creates the product ‘fingerprints’ or ‘embeddings.’ It is responsible for extracting meaningful feature representations from the input samples. This network is composed of layers of neural units that work together. Weight sharing between the twin networks ensures that the model learns to extract comparable features for similar inputs, providing a basis for comparison.
    • Similarity Metric: After the shared network processes the inputs, a similarity metric is employed. This decides how alike two ‘fingerprints’ or ‘embeddings’ are. The selection of a similarity metric depends on the specific task and characteristics of the input data. Frequently used similarity metrics include the Euclidean distance, cosine similarity, or correlation coefficient, each chosen based on its suitability for the given context and desired outcomes.
    • Loss Function: For training the Siamese network, a specialized loss function is used. This helps the system improve its comparison skills over time. It guides and trains the network to generate akin embeddings for similar inputs and disparate embeddings for dissimilar inputs.

      This is achieved by imposing penalties on the model when the distance or dissimilarity between similar pairs surpasses a designated threshold, or when the distance between dissimilar pairs falls below another predefined threshold. This training strategy ensures that the network becomes adept at discerning and encoding the desired level of similarity or dissimilarity in its learned embeddings.

    How DataWeave Uses Siamese Networks for Product Matching

    At DataWeave, we use Siamese Networks to match products across different retailer websites. Here’s how it works:

    Pre-processing (Image Preparation)

    • We collect product images from various websites.
    • We clean these images up to make them easier for our AI to understand.
    • We use techniques like cropping, flipping, and adjusting colors to help our AI recognize products even if the images are slightly different.

    Training The AI

    • We show our AI system millions of product images, teaching it to recognize similarities and differences.
    • We use a special learning method called “Triplet Loss” to help our AI understand which products are the same and which are different.
    • We’ve tested different AI structures to find the one that works best for product matching, including ResNet, EfficientNet, NFNet, and ViT. 

    Image Retrieval 

    • Once trained, our AI creates a unique “fingerprint” for each product image.
    • We store these fingerprints in a smart database.
    • When we need to find a match for a product, we:
      • Create a fingerprint for the new product.
      • Quickly search our database for the most similar fingerprints.
      • Return the top matching products.

    Matches are then assigned a high or a low similarity score and segregated into “Exact Matches” or “Similar Matches.” For example, check out the image of this white shoe on the left. It has a low similarity score with the pink shoe (below) and so these SKUs are categorized as a “Similar Match.” Meanwhile, the shoe on the right is categorized as an “Exact Match.”

    Similarly, in the following image of the dress for a young girl, the matched SKU has a high similarity score and so this pair is categorized as an “Exact Match.”

    Siamese Networks play a pivotal role in DataWeave’s Product Matching Engine. Amid the millions of images and product descriptions online, our Siamese Networks act as an equalizing force, efficiently narrowing down millions of candidates to a curated selection of 10-15 potential matches. 

    In addition, these networks also find application in several other contexts at DataWeave. They are used to train our system to understand text-only data from product titles and joint multimodal content from product descriptions.

    Leverage Our AI-Driven Product Matching To Get Insightful Data

    In summary, accurate and efficient product matching is no longer a luxury – it’s a necessity. DataWeave’s advanced product matching solution provides brands and retailers with the tools they need to navigate this complex landscape, turning the challenge of product matching into a competitive advantage.

    By leveraging cutting-edge technology and simplifying it for practical use, we empower businesses to make informed decisions, optimize their operations, and stay ahead in the ever-evolving eCommerce market. To learn more, reach out to us today!

  • Why Strategic Competitive Insights Are Key to Optimizing Your Product Assortment

    Why Strategic Competitive Insights Are Key to Optimizing Your Product Assortment

    For retailers, the breadth and relevance of their product assortment are critical for success. Amid a crowded market filled with countless products clamoring for consumer attention, retailers must find innovative ways to distinguish themselves. While pricing undeniably impacts purchasing decisions, the diversity and distinctiveness of a retailer’s product range can provide a crucial competitive advantage.

    Creating an attractive and profitable assortment that resonates with your target audience requires more than intuition; it demands deep insights into both your own and your competitors’ offerings. A well-curated assortment aligned with current trends can drive higher conversions and foster customer loyalty. However, achieving this perfect balance is a formidable challenge without the right insights.

    This is where a data-driven strategy becomes essential, enabling you to curate a product mix that captivates and converts.

    However, retailers often encounter significant challenges when attempting to strategically plan their assortments:

    • Limited Competitive Insights: Gaining a clear understanding of your competitors’ assortment strengths and weaknesses across various categories is challenging. Without this visibility, it’s difficult to know where you have an edge or where you might be falling behind.
    • Tracking Demand Patterns: Identifying top-sellers and monitoring shifts in consumer demand can be a struggle. Without the ability to easily detect trends or changes in demand, you risk missing opportunities to stock trending items.

    Attempting to navigate these challenges manually is not only arduous but also susceptible to substantial errors.

    How Assortment Analytics Solutions Help

    The ideal Assortment Analytics solution must offer a fact-based approach to:

    • Identify Strengths and Weaknesses: Understand how your assortment measures up against the competition.
    • Stay Trend-Responsive: Keep your product mix fresh and aligned with the latest consumer trends.
    • Boost Conversions: Create a relatively unique, customer-focused assortment that enhances conversions.

    Many retailers attempt to analyze competitor assortments using manual, in-house methods, which inevitably leads to significant blind spots:

    • Variations in product classifications and taxonomies across competitors make meaningful comparisons challenging.
    • Gathering complete and accurate data across a vast competitive landscape is difficult.
    • Inconsistent titles and descriptions hinder reliable product matching without AI assistance.
    • Capturing and comparing detailed product attributes efficiently is nearly impossible without advanced tools.

    To overcome these challenges, retailers need a scalable, accurate Assortment Analysis solution designed specifically for the complexities of modern retail needs.

    DataWeave’s Assortment Analytics Solution

    DataWeave addresses these challenges by providing retailers with a robust platform to gain actionable insights into their product assortments and the competitive landscape. Leveraging advanced analytics and AI-driven algorithms, Assortment Analytics empowers retailers to make informed assortment management decisions, optimize their product offerings, and stay competitive.

    Armed with our insights, retailers can lead with their strengths and stock unique and in-demand products in their assortment. Further, by recognizing the strengths in their product catalog, they can craft effective pricing strategies and optimize their logistics, creating a more competitive and appealing shopping experience for their customers. Here are a few capabilities of DataWeave’s solution:

    In-Depth Competitive Analysis Across Retailers

    The solution offers detailed competitive analysis, revealing insights into competitors’ assortments. It maps competitor products to a common taxonomy, making comparisons accurate and meaningful. Retailers can visualize assortments at granular levels like category, sub-category, and product type.

    The data for these insights is collected at configurable intervals, typically monthly or quarterly, and is consumed not only via dashboard summaries but also raw data files to enable in-depth analysis. Retailers have the flexibility to choose specific competitors, brands, products, and categories for tracking, allowing for a tailored and strategic approach to assortment optimization.

    Brand and Category Views to Assess Your Portfolio

    The solution provides a comprehensive evaluation of your product assortment through brand and category views. In brand views, your portfolio is assessed against competitors at the brand level, highlighting:

    • Newly Introduced Brands: Insights into recently introduced brands, revealing shifts in the brand landscape.
    • Absence or Limited Presence: Identification of brands lacking representation or with minimal presence compared to competitors, indicating areas for improvement.
    • Strong Presence and Exclusivity: Recognition of brands where you excel, including exclusive offerings, showcasing your competitive edge.

    Identifying Top-Selling Competitive Products To Boost Assortment Strategy

    Beyond just comparing assortment numbers, the DataWeave solution surfaces insights into which competitor products are actually performing well. It equips category and assortment managers with indicators that assess competitor products in terms of their popularity and shelf velocity.

    It analyzes metrics like pricing fluctuations, ratings, customer reviews, search rankings, and replenishment rates to pinpoint hot sellers you may want to stock. With these insights, merchandizing managers can pinpoint top-selling products among competitors, enabling informed decisions to enhance their assortment in comparison.

    Sophisticated Attribute Tagging and Analysis

    Using AI-powered attribute tagging, the solution simplifies granular product analysis within specific categories. An Apparel retailer, for instance, can filter the data to compare assortments based on attributes like material, pattern, color, etc.

    Retailers can select attributes relevant to their products and gain detailed insights. These custom filter attributes dynamically populate the panel, facilitating targeted data exploration. Category and merchandizing managers can delve into critical details swiftly, enabling strategic decision-making and comprehensive competitive analysis within their categories.

    You can capitalize on opportunities by stocking in-demand, on-trend items and address assortment gaps quickly. At the same time, you can double down on your strengths by enhancing your exclusive or top-performing product sets.

    In summary, DataWeave’s Assortment Analytics solution provides an invaluable competitive edge. The insights enable evidence-based decisions to attract more customers, encourage bigger baskets, and maximize the value of every assortment choice.

    To learn more, read our detailed product guide here or get on a exploratory call with one of our experts today!

  • Augmenting AI-powered Product Matching with Human Expertise to Achieve Unparalleled Accuracy

    Augmenting AI-powered Product Matching with Human Expertise to Achieve Unparalleled Accuracy

    In today’s expansive omnichannel commerce landscape, pricing intelligence has become indispensable for retailers seeking to stay competitive and refine their pricing strategies. The sheer magnitude of eCommerce, spanning thousands of websites, billions of SKUs, and various form factors, adds layers of complexity. Consequently, ensuring the accuracy and reliability of competitive insights presents a formidable challenge for retailers aiming to leverage pricing data effectively.

    At the core of any robust pricing intelligence system lies product matching. This process enables retailers to recognize identical or similar products across competitors. Once these matches are identified, tracking prices is a relatively more straightforward task, facilitating ongoing analysis and informed decision-making.

    Accurate matching is crucial for meaningful price comparisons and tailoring product assortments. The challenge is matching products is often complicated, especially for non-local brands, niche categories, or items lacking consistent global identifiers. It becomes even trickier when trying to match very similar but not identical products. A comprehensive approach that compares and analyzes multiple attributes like product titles, descriptions, images and more is essential.

    Artificial intelligence algorithms are commonly used to automate product matching, leveraging machine learning techniques to analyze patterns in images and text data. While AI can adapt and improve over time, the question remains: Can it fully address the complexities of product matching on its own?

    The reality is that many retailers still struggle with incomplete, inaccurate, or outdated product data, despite these AI-powered product matching solutions. This can lead to suboptimal pricing decisions, missed opportunities, and reduced competitiveness.

    Challenges in an ‘AI-only’ Approach to Product Matching

    While AI plays a vital role in automated product matching solutions, there are complexities that AI alone cannot fully address:

    Subjectivity in Matching Criteria

    Some product categories have subjective or hard-to-quantify criteria for determining similarity. AI learns from historical data, so it may struggle with nuanced aspects like:

    Aesthetics, style, and design: In the Fashion and Jewellery vertical, for example, products are matched according to attributes like style, aesthetics, design – all of which have some subjectivity involved.

    Quantity/packaging variations: In the grocery sector, variations in product packaging and quantities can introduce complexities that require subjective decision-making. For example, apples may be sold in different packaging like a 0.5 kg bag or a pack of 4 individual apples. Determining if these different packaging options should be considered equivalent often involves making a qualitative judgment call, rather than a clear-cut objective decision.

    Matching product sets: For categories like home furnishings, the focus is often on matching coordinated sets rather than individual items. For example, in the bedroom category, matching may involve grouping together an entire set of complementary furniture like a bed frame, dresser, and wardrobe based on their cohesive design and style. This goes beyond simply making one-to-one product associations, requiring more nuanced judgments about aesthetic coordination.

    Contextual Factor

    Products can have regional preferences, cultural differences, or evolving trends that impact how they are matched. AI may miss important context like Local/regional product names or distinct brand names across countries.

    For instance, in the image we see Sprite (in the US) is branded Xubei in China. Continuous human curation is needed to help AI adapt to this context.

    High Accuracy & Coverage Expectations

    Retailers rely on AI powered and automated pricing adjustments based on product matching for insight. To ensure that pricing recommendations and updates are accurate, accurate product matching is crucial. For this, simply identifying similar top results is not enough – the process must comprehensively capture all relevant matches. While AI excels at finding the top groupings with around 80% accuracy, even small matching errors can have significant consequences.

    As AI matching improves, customer expectations may rise even higher. If AI achieves 90% accuracy, for instance, SLAs may demand over 95%. Reaching such a high level of accuracy is very challenging for AI alone, especially when faced with incomplete data, contextual nuances, evolving trends, and subjective matching criteria across products and categories.

    The solution is to combine the power of AI with human expertise. This is the key to achieving true data veracity – the accuracy, freshness, and comprehensive coverage required for precise and reliable product matching.

    Human-in-the-Loop Approach for Elevated Product Matching

    Human intelligence and quality testing can elevate the AI powered product matching process by addressing key challenges:

    • Matching Validation: AI algorithms may identify product matches with 80-90% accuracy initially. Having humans validate these AI-suggested matches allows for correcting errors and pushing the accuracy close to 100%. As humans flag issues, provide context, and re-label incorrect predictions, it allows the AI model to learn and enhance its reliability for complex, high-stakes decisions.
    • Applying Contextual Judgment: For subjective matching criteria like aesthetics, design, and categorizing product sets, human discernment is needed. Humans can make nuanced judgments beyond just quantitative rules, ensuring meaningful apples-to-apples product comparisons. Their contextual understanding augments AI’s capabilities.
    • Continuous Learning Via Feedback Loop: Product experts possess rich category knowledge across markets. Integrating this human insight through an iterative feedback loop helps AI models quickly learn and adapt to changing trends, preferences, and context. As humans explain their match assessments, the AI continuously enhances its precision over time.

    By combining AI’s automation and scale with human validation, judgment, and knowledge curation, pricing intelligence solutions can achieve the accuracy and coverage demanded for actionable competitive pricing insights.

    DataWeave’s Data Veracity Framework: A Scalable Workflow Combining AI and Human Expertise

    Given the vast number of products, retailers, and brands that exist today, any product matching solution must be highly scalable. At DataWeave, we bring you such a scalable workflow to address these complexities by integrating human expertise with AI-driven automation. The image below outlines our approach for combining AI with human intelligence in a seamless, scalable workflow for accurate product matching:

    Retailers and brands can benefit in several ways with this workflow, as listed below.

    Several Rounds of Data Verification Due to Hierarchical Validation Teams

    The workflow employs a hierarchical validation team of Leads and Executives to efficiently integrate human expertise without creating bottlenecks. Verification Leads play a pivotal role in managing the distribution of product matches identified by DataWeave’s AI model to the Verification Executives.

    The Executives then meticulously validate these AI-suggested matches, adding any missing product associations and removing inaccurate matches. After validation, the matched product groups are sent back to the Leads, who perform random sampling checks to ensure quality.

    Throughout this entire workflow, feedback and suggestions are continuously gathered from both the Executives and Leads. This curated input is then incorporated back into DataWeave’s AI model, allowing it to learn and improve its matching accuracy on an ongoing basis.

    This hierarchical structure ensures that human validation seamlessly scales alongside the AI’s matching capabilities. Leveraging the respective strengths of AI automation and human expertise in an iterative feedback loop prevents operational bottlenecks while steadily elevating overall accuracy.

    Confidence-based Distribution of Matched Articles for Validation

    The AI model assigns confidence scores, differentiating high-confidence (>95%) and low-confidence matches. For high-confidence groups, executives simply remove incorrect matches – a quicker process. Low-confidence matches require more human effort in adding/removing matches.

    As the AI model improves over time with feedback, the share of high-confidence matches increases, making validation more efficient and swift.

    Automated, Standardized Process with Iterative Feedback Loop

    The entire workflow is standardized and automated, with verification metrics seamlessly tracked. At each step, feedback captured from both leads and executives flows back into the AI, enhancing its matching accuracy and coverage iteratively.

    DataWeave’s closed-loop system of AI automation with hierarchical human validation allows product matching to achieve comprehensive accuracy at a vast scale.

    Unleash the Power Accurate and Comprehensive Product Matching

    In summary, combining AI and human expertise in product matching is crucial for retailers navigating the complexities of omnichannel retail. While AI algorithms excel in automation, they often struggle with subjective criteria and contextual nuances. DataWeave’s approach integrates AI-driven automation with human validation, delivering the industry’s most accurate product matching capabilities, enabling actionable competitive pricing insights.

    To learn more, reach out to us today!

  • How AI-Powered Visual Highlighting Helps Brands Achieve Product Consistency Across eCommerce

    How AI-Powered Visual Highlighting Helps Brands Achieve Product Consistency Across eCommerce

    As eCommerce increasingly becomes a prolific channel of sales for consumer brands, they find that maintaining a consistent and trustworthy brand image is a constant struggle. In an ecosystem filled with dozens of marketplaces and hundreds of third-party merchants, ensuring that customers see what aligns with a brand’s intended image is quite tricky. With many fakes and counterfeit products doing the rounds, brands may further struggle to get the right representation.

    One way brands can track and identify inconsistencies in their brand representation across marketplaces is to use Digital Shelf Analytics solutions like DataWeave’s – specifically the Content Audit module.

    This solution uses advanced AI models to identify image similarities and dissimilarities compared with the original brand image. Brands could then use their PIM platform or work with the retailer to replace inaccurate images.

    But here’s the catch – AI can’t always accurately predict all the differences. Relying solely on scores given by these models poses a challenge in tracking the subtle differences between images. Often, image pairs with seemingly high match scores fail to catch important distinctions. Fake or counterfeit products and variations that slip past the AI’s scrutiny can lead to significant inaccuracies. Ultimately, it puts the reliability of the insights that brands depend on for crucial decisions at risk, impacting both top and bottom lines.

    Dealing with this challenge means finding a balance between the number-based assessments of AI models and the human touch needed for accurate decision-making. However, giving auditors the ability to pinpoint variations precisely goes beyond simply sharing numerical values of the match scores with them. Visualizing model-generated scores is important as it provides human auditors with a tangible and intuitive understanding of the differences between two images. While numerical scores are comparable in the relative sense, they lack specificity. Visual interpretation empowers auditors to identify precisely where variations occur, aiding in efficient decision-making.

    How AI-Powered Image Scoring Works

    At DataWeave, our approach involves employing sophisticated computer vision models to conduct extensive image comparisons. Convolutional Neural Network (CNN) models such as Resnet-50 or YOLO, in conjunction with feature extraction models, analyze images quantitatively. This AI-powered image scoring process yields scores that indicate the level of similarity between images.

    However, interpreting these scores and understanding the specific areas of difference can be challenging for human auditors. While computer vision models excel at processing vast amounts of data quickly, translating their output into actionable insights can be a stumbling block. A numerical score may not immediately convey the nature or extent of the differences between images

    In the assessment of these images, all fall within the 70 to 80 range of scores (out of a maximum of 100). However, discerning the nature of differences—whether they are apparent or subtle—poses a challenge for the AI models and human auditors. For example, there are differences in the placement or type of images in the packaging, as well as packing text that are often in an extremely small font size. It is, of course, possible for human auditors to identify the differences in these images, but it’s a slow, error-prone, and tiring process, especially when auditors often have to check hundreds of image pairs each day.

    So how do we ensure that we identify differences in images accurately? The answer lies in the process of visual highlighting.

    How Visual Highlighting Works

    Visual highlighting is a method that enhances our ability to comprehend differences in images by combining sophisticated algorithms with human understanding. Instead of relying solely on numerical scores, this approach introduces a visual layer, resembling a heatmap, guiding human auditors to specific areas where discrepancies are present.

    Consider the scenario depicted in the images above: a computer vision model assigns a score of 70-85 for these images. While this score suggests relatively high similarity, it fails to uncover major differences between the images. Visual highlighting comes into play to overcome this limitation, precisely indicating regions where even subtle differences are seen.

    Visual highlighting entails overlaying compared images and emphasizing areas of difference, achieved through techniques like color coding, outlining, or shading specific regions. The significance of the difference in a particular area determines the intensity of the visual highlight.

    For instance, if there’s a change in the product’s color or a discrepancy in the packaging, these variations will be visually emphasized. This not only streamlines the auditing process but also enables human evaluators to make well-informed decisions quickly.

    Benefits of Visual Highlighting

    • Intuitive Understanding: Visual highlighting offers an intuitive method for interpreting and acting upon the outcomes of computer vision models. Instead of delving into numerical scores, auditors can concentrate on the highlighted areas, enhancing the efficiency and accuracy of the decision-making process.
    • Accelerated Auditing: By bringing attention to specific regions of concern, visual highlighting speeds up the auditing process. Human evaluators can swiftly identify and address discrepancies without the need for exhaustive image analysis.
    • Seamless Communication: Visual highlighting promotes clearer communication between automated systems and human auditors. Serving as a visual guide, it enhances collaboration, ensuring that the subtleties captured by computer vision models are effectively conveyed.

    The Way Forward

    As technology continues to evolve, the integration of visual highlighting methodologies is likely to become more sophisticated. Artificial intelligence and machine learning algorithms may play an even more prominent role in not only detecting differences but also in refining the visual highlighting process.

    The collaboration between human auditors and AI ensures a comprehensive approach to maintaining brand integrity in the ever-expanding digital marketplace. By visually highlighting differences in images, brands can safeguard their visual identity, foster consumer trust, and deliver a consistent and reliable online shopping experience. In the intricate dance between technology and human intuition, visual highlighting emerges as a powerful tool, paving the way for brands to uphold their image with precision and efficiency.

    To learn more, reach out to us today!


    (This article was co-authored by Apurva Naik)

  • How DataWeave Enhances Transparency in Competitive Pricing Intelligence for Retailers

    How DataWeave Enhances Transparency in Competitive Pricing Intelligence for Retailers

    Retailers heavily depend on pricing intelligence solutions to consistently achieve and uphold their desired competitive pricing positions in the market. The effectiveness of these solutions, however, hinges on the quality of the underlying data, along with the coverage of product matches across websites.

    As a retailer, gaining complete confidence in your pricing intelligence system requires a focus on the trinity of data quality:

    • Accuracy: Accurate product matching ensures that the right set of competitor product(s) are correctly grouped together along with yours. It ensures that decisions taken by pricing managers to drive competitive pricing and the desired price image are based on reliable apples-to-apples product comparisons.
    • Freshness: Timely data is paramount in navigating the dynamic market landscape. Up-to-date SKU data from competitors enables retailers to promptly adjust pricing strategies in response to market shifts, competitor promotions, or changes in customer demand.
    • Product matching coverage: Comprehensive product matching coverage ensures that products are thoroughly matched with similar or identical competitor products. This involves accurately matching variations in size, weight, color, and other attributes. A higher coverage ensures that retailers seize all available opportunities for price improvement at any given time, directly impacting revenues and margins.

    However, the reality is that untimely data and incomplete product matches have been persistent challenges for pricing teams, compromising their pricing actions. Inaccurate or incomplete data can lead to suboptimal decisions, missed opportunities, and reduced competitiveness in the market.

    What’s worse than poor-quality data? Poor-quality data masquerading as accurate data.

    In many instances, retailers face a significant challenge in obtaining comprehensive visibility into crucial data quality parameters. If they suspect the data quality of their provider is not up to the mark, they are often compelled to manually request reports from their provider to investigate further. This lack of transparency not only hampers their pricing operations but also impedes the troubleshooting process and decision-making, slowing down crucial aspects of their business.

    We’ve heard about this problem from dozens of our retail customers for a while. Now, we’ve solved it.

    DataWeave’s Data Statistics and SKU Management Capability Enhances Data Transparency

    DataWeave’s Data Statistics Dashboard, offered as part of our Pricing Intelligence solution, enables pricing teams to gain unparalleled visibility into their product matches, SKU data freshness, and accuracy.

    It enables retailers to autonomously assess and manage SKU data quality and product matches independently—a crucial aspect of ensuring the best outcomes in the dynamic landscape of eCommerce.

    Beyond providing transparency and visibility into data quality and product matches, the dashboard facilitates proactive data quality management. Users can flag incorrect matches and address various data quality issues, ensuring a proactive approach to maintaining the highest standards.

    Retailers can benefit in several ways with this dashboard, as listed below.

    View Product Match Rates Across Websites

    The dashboard helps retailers track match rates to gauge their health. High product match rates signify that pricing teams can move forward in their pricing actions with confidence. Low match rates would be a cause for further investigation, to better understand the underlying challenges, perhaps within a specific category or competitor website.

    Our dashboard presents both summary statistics on matches and data crawls as well as detailed snapshots and trend charts, providing users with a holistic and detailed perspective of their product matches.

    Additionally, the dashboard provides category-wise snapshots of reference products and their matching counterparts across various retailers, allowing users to focus on areas with lower match rates, investigate underlying reasons, and develop strategies for speedy resolution.

    Track Data Freshness Easily

    The dashboard enables pricing teams to monitor the timeliness of pricing data and assess its recency. In the dynamic realm of eCommerce, having up-to-date data is essential for making impactful pricing decisions. The dashboard’s presentation of freshness rates ensures that pricing teams are armed with the latest product details and pricing information across competitors.

    Within the dashboard, users can readily observe the count of products updated with the most recent pricing data. This feature provides insights into any temporary data capture failures that may have led to a decrease in data freshness. Armed with this information, users can adapt their pricing decisions accordingly, taking into consideration these temporary gaps in fresh data. This proactive approach ensures that pricing strategies remain agile and responsive to fluctuations in data quality.

    Proactively Manage Product Matches

    The dashboard provides users with proactive control over managing product matches within their current bundles via the ‘Data Management’ panel. This functionality empowers users to verify, add, flag, or delete product matches, offering a hands-on approach to refining the matching process. Despite the deployment of robust matching algorithms that achieve industry-leading match rates, occasional instances may arise where specific matches are overlooked or misclassified. In such cases, users play a pivotal role in fine-tuning the matching process to ensure accuracy.

    The interface’s flexibility extends to accommodating product variants and enables users to manage product matches based on store location. Additionally, the platform facilitates bulk match uploads, streamlining the process for users to efficiently handle large volumes of matching data. This versatility ensures that users have the tools they need to navigate and customize the matching process according to the nuances of their specific product landscape.

    Gain Unparalleled Visibility into your Data Quality

    With DataWeave’s Pricing Intelligence, users gain the capability to delve deep into their product data, scrutinize match rates, assess data freshness, and independently manage their product matches. This approach is instrumental in fostering informed and effective decisions, optimizing inventory management, and securing a competitive edge in the dynamic world of online retail.

    To learn more, reach out to us today!

  • Capturing and Analyzing Retail Mobile App Data for Digital Shelf Analytics: Are Brands Missing Out?

    Capturing and Analyzing Retail Mobile App Data for Digital Shelf Analytics: Are Brands Missing Out?

    Consumer brands around the world increasingly recognize the vital role of tracking and optimizing their digital shelf KPIs, such as Content Quality, Share of Search, Availability, etc. These metrics play a crucial role in boosting eCommerce sales and securing a larger online market share. With the escalating requirements of brands, the sophistication of top Digital Shelf Analytics providers is also on the rise. Consequently, the adoption of digital shelf solutions has become an essential prerequisite for today’s leading brands.

    As brands and vendors continue to delve further and deeper into the world of Digital Shelf Analytics, a significant and often overlooked aspect is the analysis of digital shelf data on mobile apps. The ability of solution providers to effectively track and analyze this mobile-specific data is crucial.

    Why is this emphasis on mobile apps important?

    Today, the battle for consumer attention unfolds not only on desktop web platforms but also within the palm of our hands – on mobile devices. As highlighted in a recent Insider Intelligence report, customers will buy more on mobile, exceeding 4 in 10 retail eCommerce dollars for the first time.

    Moreover, thanks to the growth of delivery intermediaries like Instacart, DoorDash, Uber Eats, etc., shopping on mobile apps has received a tremendous organic boost. According to an eMarketer report, US grocery delivery intermediary sales are expected to reach $68.2 billion in 2025, from only $8.8 billion in 2019.

    In essence, mobile is increasingly gaining share as the form factor of choice for consumers, especially in CPG. In fact, one of our customers, a leading multinational CPG company, revealed to us that it sees up to 70% of its online sales come through mobile apps. That’s a staggering number!

    The surge in app usage reflects a fundamental change in consumer behavior, emphasizing the need for brands to adapt their digital shelf strategies accordingly.

    Why Brands Need To Look at Apps and Desktop Data Differently

    Conventionally, brands that leverage digital shelf analytics rely on data harnessed from desktop sites of online marketplaces. This is because capturing data reliably and accurately from mobile apps is inherently complex. Data aggregation systems designed to scrape data from web applications cannot easily be repurposed to capture data on mobile apps. It requires dedicated effort and exceptional tech prowess to pull off in a meaningful and consistent way.

    In reality, it is extremely important for brands to track and optimize their mobile digital shelf. Several digital shelf metrics vary significantly between desktop sites and mobile apps. These differences are natural outcomes of differences in user behavior between the two form factors.

    One of these metrics that has a huge impact on a brand’s performance on retail mobile apps is their search discoverability. Ecommerce teams are well aware of the adverse impact of the loss of even a few ranks on search results.

    Anyone can easily test this. Searching something as simple as “running shoes” on the Amazon website and doing the same on its mobile app shows at least a few differences in product listings among the top 20-25 ranks. There are other variances too, such as the number of sponsored listings at the top, as well as the products being sponsored. These variations often result in significant differences in a brand’s Share of Search between desktop and mobile.

    Share of Search is the share of a brand’s products among the top 20 ranked products in a category or subcategory, providing insight into a brand’s visibility on online marketplaces.

    Picture a scenario in which a brand heavily depends on desktop digital shelf data, confidently assuming it holds a robust Share of Search based on reports from its Digital Shelf Analytics partner. However, unbeknownst to the team, the Share of Search on mobile is notably lower, causing a detrimental effect on sales.

    To fully understand the scale of these differences, we decided to run a small experiment using our proprietary data analysis and aggregation platform. We restricted our analysis to just Amazon.com and Amazon’s mobile app. However, we did cover over 13,000 SKUs across several shopping categories to ensure the sample size is strong.

    Below, we provide details of our key findings.

    Share of Search on The Digital Shelf – App Versus Desktop

    Our analysis focused on three popular consumer categories – Electronics, CPG, and Health & Beauty.

    In the electronics category, brands like Apple, Motorola, and Samsung, known for their mobile phones, earbuds, headphones, and more, have a higher Share of Search on the Amazon mobile app compared to the desktop.

    Meanwhile, Laptop brands like Dell, Acer, and Lenovo, as well as other leading brands like Google have a higher Share of Search on the desktop site compared to the app. This is the scenario that brands need to be careful about. When their Share of Search on mobile apps is lower, they might miss the chance to take corrective measures since they lack the necessary data from their provider.

    In the CPG category, Ramen brand Samyang, with a lot of popularity on Tiktok and Instagram, shows a higher Share of Search on Amazon’s mobile app. Speciality brands like 365 By Whole Foods, pasta and Italian food brands La Moderna, Divinia, and Bauducco too have a significantly higher Share of Search on the app.

    Cheese and dessert brands like Happy Belly, Atlanta Cheesecake Company, among others, have a lower Share of Search on the mobile app. Ramen brand Sapporo is also more easily discovered on Amazon’s desktop site. Here, we see a difference of more than 5% in the Share of Search of some brands, which is likely to have a huge impact on the brand’s mobile eCommerce sales levels and overall performance.

    Lastly, in the Health & Beauty category, Shampoos and hair care brands like Olaplex, Dove, and Tresemme exhibited a higher Share of Search on the mobile app compared to the desktop.

    On the other hand, body care brands like Neutrogena and Hawaiian Tropic, as well as Beardcare brand Viking Revolution displayed a higher Share of Search on Amazon’s desktop site.

    Based on our data, it is clear that there are several examples of brands that do better in either one of Amazon’s desktop sites or mobile apps. In many cases, the difference is stark.

    So What Must Brands Do?

    Our findings emphasize the imperative for brands to move beyond a one-size-fits-all approach to digital shelf analytics. The striking variations in Share of Search between mobile apps and desktops conclusively demonstrate that relying solely on desktop data for digital shelf optimization is inadequate.

    If brands see that they’re falling behind on the mobile digital shelf, there are a few things they can do to help boost their performance:

    • If a brand’s Share of Search is lower on the mobile app, they can divert their retail spend to mobile in order to inorganically compensate for this difference. This way, any short-term impact due to lower discoverability is mitigated. This is also likely to result in optimized budget allocation and ROAS.
    • Brands also need to ensure their content is optimized for the mobile form factor, with images that are easy to view on smaller screens, and tailored product titles that are shorter than on desktops, highlighting the most important product attributes from the consumer’s perspective. Not only will this help brands gain more clicks from mobile shoppers, but this will also gradually lead to a boost in their organic Share of Search on mobile.
    • CPG brands, specifically, need to optimize their digital shelf for delivery intermediary apps (along with marketplaces). The grocery delivery ecosystem is booming with companies like DoorDash, Delivery Hero, Uber Eats, Swiggy, etc. leading the way. Using Digital Shelf Analytics to optimize performance on delivery apps is quite an involved process with a lot of bells and whistles to consider. Read our recently published whitepaper that specifically details how brands can successfully boost their visibility and conversions on delivery apps.

    But first, brands need to identify and work with a Digital Shelf Analytics partner that is able to capture and analyze mobile app data, enabling tailored optimization approaches for all eCommerce platforms.

    DataWeave leads the way here, providing the world’s most comprehensive and sophisticated digital shelf analytics solution, rising above all other providers to provide digital shelf insights for both web applications and mobile apps. Our data aggregation platform successfully navigates the intricacies of capturing public data accurately and reliably from mobile apps, thereby delivering a comprehensive cross-device view of digital shelf KPIs to our brand customers.

    So reach out to us today to find out more about our digital shelf solutions for mobile apps!

  • Why Unit of Measure Normalization is Critical For Accurate and Actionable Competitive Pricing Intelligence

    Why Unit of Measure Normalization is Critical For Accurate and Actionable Competitive Pricing Intelligence

    Competitive pricing intelligence is pivotal for retailers seeking to analyze their product pricing in relation to competitors. This practice is essential for ensuring that their product range maintains a competitive edge, meeting both customer expectations and market demands consistently.

    Product matching serves as a foundational element within any competitive pricing intelligence solution. Products are frequently presented in varying formats across different websites, featuring distinct titles, images, and descriptions. Undertaking this process at a significant scale is highly intricate due to numerous factors. One such complication arises from the fact that products are often displayed with differing units of measurement on various websites.

    The Challenge of Varying Units

    In certain product categories, retailers often offer the same item in varying volumes, quantities, or weights. For instance, a clothing item might be available as a single piece or in packs of 2 or 3, while grocery brands commonly sell eggs in counts of 6, 12, or 24.

    Consider this example: a quick glance might suggest that an 850g pack of Kellogg’s Corn Flakes priced at $5 is a better deal than a 980g pack of Nestle Cornflakes priced at $5.2. However, this assumption can be deceptive. In reality, the latter offers better value for your money, a fact that only becomes evident through price comparisons after standardizing the units.

    This issue is particularly relevant due to the prevalence of “shrinkflation,” where brands adjust packaging sizes or quantities to offset inflation while keeping prices seemingly low. When quantities, pack sizes, weight, etc. reduce instead of prices increasing, it’s important that this change is considered while analyzing competitive pricing.

    Normalizing Units of Measure

    In order to effectively compare prices among different competitors, retailers must standardize the diverse units of measurement they encounter. This standardization (or normalization) is crucial because price comparisons should extend beyond individual product SKUs to accommodate variations in package sizes and quantities. It’s essential to normalize units, ranging from “each” (ea) for individual items to “dozen” (dz) for sets, and from “pounds” (lb), “kilograms” (kg), “liters” (ltr), to “gallons” (gal) for various product types.

    For example, a predetermined base unit of measure, such as 100 grams for a specific product like cornflakes, serves as the reference point. The unit-normalized price for any cornflake product would then be the price per 100 grams. In the example provided, this reveals that Kellogg’s is priced at $0.59 per 100 grams, while Nestle is priced at $0.53 per 100 grams.

    Various Categories of Unit Normalization

    1. Weight Normalization

    Retailers frequently feature products with weight measurements expressed in grams (g), kilograms (kg), pounds (lbs), or ounces (oz).

    2. Quantity or Pack Size Normalization

    Products are also often featured with varying pick sizes or quantities in each SKU.

    mounting hardware kit

    3. Volume or Capacity Normalization

    Products can also vary in volumes or capacities with units like liters (L) or fluid ounces (fl oz).

    DataWeave’s Unit Normalized Pricing Intelligence Solution

    DataWeave’s highly sophisticated product matching engine can match the same or similar products and normalize their units of measurement, leading to highly accurate and actionable competitive pricing insights. It standardizes different units of measurement, like weight, quantity, and volume, ensuring fair comparisons across similar and exact matched products.

    Retailers have the flexibility to view pricing insights either with retailer units or normalized units. This capability empowers retailers and analysts to perform accurate, in-depth analyses of pricing information at a product level.

    In some scenarios, analyzing unit normalized pricing reflects pricing trends and competitiveness more accurately than retail price alone. This is particularly true for categories like CPG, where products are sold in diverse units of measure. For instance, in the example shown here, we can view a comparison of price position trends for the category of Fruits and Vegetables based on both retail price and unit price.

    The difference is striking: the original retail price based analysis shows a stagnation in price position, whereas unit normalized pricing analysis reflects a more dynamic pricing scenario.

    With DataWeave, retailers can specify which units to compare, ensuring that comparisons are made accurately. For example, a retailer can specify that unit price comparisons apply only to 8, 12, or 16-ounce packs, as well as 1 or 3-pound packs, but not to 10 and 25-pound bags. This precision ensures that products are matched correctly, and prices are represented for appropriately normalized units, leading to more accurate pricing insights.

    To learn more about this capability, write to us at contact@dataweave.com or visit our website today!

  • From Data to Dollars: How Digital Shelf Analytics Drives Tangible Business Impact and ROI for Brands

    From Data to Dollars: How Digital Shelf Analytics Drives Tangible Business Impact and ROI for Brands

    For consumer brands, the digital marketplace presents an unparalleled landscape of opportunities for engaging with consumers and expanding their market presence. Within this dynamic environment, Digital Shelf Analytics has emerged as a crucial pillar in a brand’s eCommerce strategy. This technology provides valuable insights into a brand’s organic and paid visibility on marketplaces, content quality, pricing strategies, promotional efforts, and product availability. These insights help brands gain a comprehensive understanding of their competitive positioning and overall market performance.

    Nevertheless, many brands often grapple with the question of whether this understanding translates into tangible actions that drive real business impact and return on investment (ROI). This uncertainty stems from a lack of clarity about the direct correlation between digital shelf insights and key metrics such as enhanced sales conversions.

    Nonetheless, there is compelling evidence that when these insights are effectively harnessed and strategic actions are taken, brands can realize significant, measurable benefits.

    So, the question arises: does Digital Shelf Analytics genuinely deliver on its promises?

    At DataWeave, we’ve partnered with numerous brands to fuel their eCommerce growth through the application of digital shelf analytics. In this article, we will delve into these insights, uncovering the concrete and quantifiable results that brands can achieve through their investments in digital shelf analytics.

    Digital Shelf KPIs and Their Impact

    Digital Shelf Analytics is a robust system that analyzes specific key performance indicators (KPIs) about the digital shelf, furnishing brands with precise recommendations to not only bolster these KPIs but also to monitor the enhancements over time. The following is a brief explanation of digital shelf KPis and their expected impact areas:

    Product Availability: Ensuring Shoppers Never Hear “Out of Stock” Again

    Timely insights on the availability of products ensures brands reduce replenishment times at scale, which can significantly impact sales, creating an unbreakable link between product availability and revenue. With Digital Shelf Analytics, procurement and replenishment teams can set up notifications to promptly identify low or out-of-stock items and take swift action. This can also be done for specific ZIP codes or individual stores. In addition, availability plays a crucial role in a brand’s Share of Search and search rankings, as online marketplaces often ensure only in-stock products are shown among the top ranks.

    Share of Search: Dominating the Digital Aisles

    If a product isn’t visible, does it even exist? In fact, 70% of consumers never go beyond the first page of search results on major online marketplaces. Therefore, as a brand, the visibility of your products for relevant search keywords and their appearance on the first page can heavily determine your awareness metrics. This is where the concept of Share of Search comes into play. Think of it as securing prime shelf space in a physical store. Digital shelf insights and benchmarking with category leaders for Share of Search help ensure your products command relevant attention on the digital shelf.

    Content Quality: Crafting the Perfect Product Story

    Creating engaging product descriptions and visuals is akin to giving your products a megaphone in a crowded marketplace. By enhancing content quality, including product names, titles, descriptions, and images, brands can climb the search result rankings, leading to increased visibility and subsequently, more sales.

    Ratings and Reviews: The Power of Social Proof

    Public opinion holds immense sway. Research indicates that a single positive review can trigger a 10% surge in sales, while a multitude of favorable reviews can propel your product to a 44% higher trajectory. The correlation between ratings and sales is not surprising—each step up the rating ladder can translate to substantial revenue growth.

    While it’s reasonable to anticipate a connection between these KPIs and downstream impact metrics such as impressions, clicks, and conversions, we were driven to explore this correlation through the lens of real-world data. To do so, we meticulously monitored the digital shelf KPIs for one of our clients and analyzed the improvements in these metrics.

    It’s essential to acknowledge that not all observed impact areas can be solely attributed to enhancements in digital shelf KPIs. Still, it’s evident that a robust correlation exists. The following section presents an in-depth case study, shedding light on the results of this analysis.

    A Success Story: Real-World Impact of Digital Shelf Analytics

    Let’s dive into the journey of one of our clients – a prominent CPG brand specializing in the sale of baked goods and desserts. Through their experience, we will illustrate the transformative impact of our DataWeave Digital Shelf Analytics product suite.

    Over a period of one year, from August 2022 to July 2023, the brand leveraged several key modules of Digital Shelf Analytics for Amazon, including Share of Search, Share of Category, Availability, Ratings and Reviews, and Content Audit. Each of these digital shelf KPIs played a vital role in shaping the brand’s performance across various stages of the buyer’s journey.

    The buyer’s journey is typically delineated into three key stages:

    • Awareness: At this stage, shoppers peruse multiple product options presented on search and category listing pages, gaining an initial understanding of the available choices.
    • Consideration: Here, shoppers narrow down their selections and evaluate a handful of products, moving closer to a purchase decision.
    • Conversion: In this final stage, shoppers make their ultimate product choice and proceed to complete the purchase.

    Let’s now examine the data to understand how digital shelf KPIs helped drive tangible ROI on Amazon for the brand across the stages of the buyer journey.

    Stage 1: Raising Awareness

    Enhancing Share of Search and Share of Category can help brands boost product visibility and raise brand awareness. The following chart demonstrates the steady, incremental improvements in our client’s Share of Search and Share of Category (in the top 20 ranks of each listing page) throughout the analyzed period. These enhancements were achieved through various measures, including product sponsorship, content enhancement, price optimization, promotional initiatives, and more.

    This amplified Share of Search and Share of Category directly translates into improved product discoverability, as evident from the surge in impressions depicted in the chart below.

    Stage 2: All Things Considered

    In the consideration stage, shoppers make their product selections by clicking on items that meet their criteria, which may include factors like average rating, number of ratings, price, product title, and images. For brands, this underscores the importance of crafting meticulously detailed product content and accumulating a substantial number of ratings.

    The subsequent chart illustrates the year-long trend in both average ratings and the number of ratings, both of which have displayed steady improvement over time.

    The enhancements in the number of ratings and the average rating have a direct and positive impact on product consideration. This, in turn, has led to a noticeable year-over-year increase in page views, as indicated in the chart below.

    These improvements are likely to have also been influenced by the overall enhancement of content quality, which is detailed separately in the section below.

    Stage 3: Driving Decisions

    As buyers progress to the next stage, they reach the pivotal point of making a purchase decision. This decision is influenced by multiple factors, including product availability, content quality, and the quality of reviews, reflecting customer sentiment.

    Our client effectively harnessed our Availability insights, significantly reducing the likelihood of potential out-of-stock scenarios and enhancing replenishment rates, as highlighted in the chart below. The same chart also indicates improvements in content quality, measured by the degree to which the content on Amazon aligns with the brand’s ideal content standards.

    Below, you’ll find the year-over-year growth in conversion rates for the brand on Amazon. This metric stands as the ultimate measure of business impact, directly translating into increased revenue for brands.

    As the data uncovers, growth in key digital shelf KPIs cumulatively had a strong correlation with impressions, page views, and conversion rates.

    It is also important to note that the effect of each KPI cannot be viewed in isolation, since they are often interdependent. For example, improvement in content and availability could boost Share of Search. Accurate content could also influence more positive customer feedback. Brands need to consider optimizing digital shelf KPIs holistically to create sustained business impact.

    Impact on eCommerce Sales

    After the implementation of digital shelf analytics, the results spoke for themselves. Sales consistently outperformed the previous year’s records month after month. As shown in the chart below, the diligent application of DataWeave’s recommendations paved the way for an impressive 8.5% year-over-year increase in sales, leaving an indelible mark on the brand’s eCommerce success.

    From boosting product visibility to catapulting conversion rates, Digital Shelf Analytics serves as the key to unlocking unparalleled online success.

    While the success story detailed above does not establish a direct causation between Digital Shelf Analytics and sales revenue, there is undoubtedly a strong correlation. It’s evident that digital shelf KPIs play a pivotal role in optimizing a brand’s eCommerce performance across all stages of the buyer journey. Hence, for brands, it is vital that they collaborate with the right partner and harness digital shelf insights to fine-tune their eCommerce strategies and tactics.

    That said, the eCommerce landscape is in a constant state of flux, and there is still much to learn about how each digital shelf KPI influences brand performance in the online realm. With more data and an increasing number of brands embracing Digital Shelf Analytics, it’s only a matter of time before a direct causation is firmly established.

    Reach out to us today to know more about how your brand can leverage Digital Shelf Analytics to drive higher sales and market share in eCommerce.

  • Revolutionizing Fuel Pricing: How Fuel Retailers and Convenience Stores Can Gain a Winning Edge with DataWeave

    Revolutionizing Fuel Pricing: How Fuel Retailers and Convenience Stores Can Gain a Winning Edge with DataWeave

    Consider this scenario: A retailer establishes its fuel prices using pricing data that’s a few days old, only to subsequently discover that a nearby competitor is offering substantially lower prices. The result? Lost customers, decreased foot traffic, and diminished sales. This serves as a stark reality that retailers must confront and address today.

    In the fiercely competitive realm of retail, where every decision holds weight, maintaining a competitive edge is paramount. The fuel category, frequently underestimated, has the potential to significantly impact a retailer’s revenue stream. This challenge is not unique; retailers worldwide, particularly in North America, grapple with a common hurdle: mastering the intricate art of real-time fuel pricing.

    The Quest For Reliable, Real-Time Fuel Pricing Data

    For retailers, traditional methods for procuring and analyzing fuel price data have proven to be both expensive and error-prone, often relying on manual data collection or third-party data providers. These outdated approaches yield frustrating delays, inaccuracies, and missed opportunities. When it comes to obtaining timely fuel pricing intelligence, the majority of fuel retailers grapple with three central challenges:

    • Low Accuracy: Ensuring that fuel pricing information remains up-to-date, dependable, and actionable, even when sourced from complex web-based platforms.
    • Less Coverage: Acquiring comprehensive data that encompasses all of North America, spanning across retailers, convenience stores, fuel stations, and beyond.
    • High Cost: Effectively managing the substantial costs associated with acquiring and processing this vital information.

    DataWeave’s Fuel Pricing Intelligence Solution

    Comprehensive, accurate, and real-time fuel pricing intelligence can play a huge role in the profitability of retailers throughout North America. DataWeave takes the forefront in delivering this transformative Data-as-a-Service (DaaS) solution to some of the most prominent retailers in the region, including the top 20 fuel retail behemoths.

    With a rich and extensive history spanning over a decade in the realm of competitive intelligence, DataWeave boasts an impressive track record of empowering well-informed decision-making in retail. We leverage state-of-the-art technology to bring an unparalleled level of accuracy, timeliness, and coverage to fuel pricing intelligence.

    The following are some compelling advantages offered by our solution:

    Accurate and Real-Time First Party Data

    We deliver retailers an unparalleled advantage through real-time, first-party fuel price data. Our data originates directly from the retailer’s own channels, encompassing websites and mobile apps, rendering it the industry’s foremost and most reliable source.

    Imagine having access to fuel pricing information that updates as frequently as every 30 minutes. This rapid update cadence guarantees that you, as a retailer, constantly possess the latest pricing insights at your fingertips, empowering you to respond swiftly to market fluctuations and competitor manoeuvres. Our comprehensive data spans a wide spectrum of fuel types, including:

    • Gasoline: Be it regular, mid-grade, super, premium, ethanol-free, ethanol blends, methanol blends, or reformulated gasoline, we have got you covered.
    • Diesel: Our data encompasses biodiesel, biodiesel off-road, biodiesel blends, biodiesel ultra-low sulfur (ULS), diesel ultra-low sulfur (ULS), diesel off-road, standard diesel, and premium diesel.

    Armed with our real-time, first-party data, you can make pricing decisions with unwavering confidence, secure in the knowledge that you possess access to the most current, authoritative, and extensive fuel pricing intelligence in North America.

    The data points we capture directly from relevant web sources include: gas station postal code, store name and code, location, city, state, ZIP code, fuel type, competitor name, regular price, member price (if available), time and date of data capture, and more.

    Click here if you wish to access a sample report of our fuel pricing data.

    Unrivaled Geographical Coverage

    Our extensive coverage of fuel data spans over 30,000 ZIP codes and encompasses the top 100 retailers across the western, mid-western, and eastern regions of the United States.

    Retailers benefit from the flexibility to configure and tailor the solution to their precise needs, whether it involves adding more locations or selectively acquiring specific segments of the data. This far-reaching coverage guarantees that retailers, whether situated in bustling urban centers or remote areas, can readily access the essential data required to maintain their competitive edge.

    Moreover, if you currently source your fuel pricing data from alternative providers, our solution seamlessly integrates, amplifies, and complements your existing array of data sources, ensuring a harmonious and unified approach to data acquisition.

    Optimization of Dynamic Pricing Strategies

    In the world of retail, the importance of timing cannot be overstated. Even a mere difference of a few cents can translate into millions of dollars in revenue impact. With DataWeave, retailers gain the capability to make data-driven decisions that provide them with a competitive edge around the clock, every single day.

    Our platform empowers you to unearth margin gaps by pinpointing opportunities to raise prices while maintaining your competitive pricing position. It also identifies instances where you may be substantially overpriced, prompting necessary price adjustments to ensure competitiveness within the market. All these valuable insights are available at a hyperlocal level, facilitating pricing efficiency and optimization across your various regions of coverage. Equipped with this real-time data, you can swiftly adapt to ever-changing market conditions.

    Furthermore, our comprehensive competitive data seamlessly integrates into your existing pricing systems through APIs, facilitating quick and informed pricing actions based on robust data.

    Reliable and Customer-First Tech Platform

    Our platform boasts a remarkable level of sophistication when it comes to data aggregation, normalization, visualization, and integration capabilities. It stands as a massively scalable system with the capacity to aggregate billions of data points daily, spanning thousands of web sources. This includes the intricate handling of sources like mobile apps and websites known for frequently altering their site structures, among others.

    What truly sets us apart is our proficiency in addressing these challenges through a blend of human expertise and large-scale machine learning. Additionally, our commitment to delivering unmatched service extends to round-the-clock, 24/7 support. This comprehensive approach makes our fuel pricing intelligence solution not only effective but also cost-efficient in meeting your fuel data requirements.

    We also provide a variety of options for you to consume our data, which includes receiving our reports via email, SFTP, S3 buckets, data lakes like Snowflake, and APIs.

    Enhance your Fuel Pricing Strategies with DataWeave

    In the ever-competitive world of retail, staying ahead is not just a goal; it’s a necessity. The fuel pricing landscape, often overlooked, holds immense power to impact a retailer’s profitability. DataWeave’s real-time, comprehensive, and accurate fuel pricing intelligence solution is the key to securing this advantage. Retailers and convenience stores now have a powerful platform at their disposal, offering unparalleled precision, comprehensive coverage, and the agility needed to navigate this landscape.

    Join the ranks of industry leaders who have already harnessed the potential of DataWeave. Reach out to us today to redefine your approach to fuel pricing and propel your business to new heights!

  • 5 Ways DataWeave Helps Brands Drive Growth With Amazon Ads

    5 Ways DataWeave Helps Brands Drive Growth With Amazon Ads

    Consumers are discovering and trialing new eCommerce marketplaces, brands and products at a faster rate than ever before, given the vast amount of choices encountered browsing for products online. A recent analysis shows how events like Amazon Prime Day, Black Friday, and Cyber Monday are especially fruitful for new-to-brand customer advertising, encouraging B2C marketers to increase their digital advertising spend to fuel product discovery, sales and market share for their brands.

    Amazon advertisers grow market share and brand loyalty with ecommerce intelligence
    DataWeave joins Amazon Advertising partner network

    The majority of eCommerce consumers are discovering products via relevant keywords attributable to their needs, with most clicks happening on page one results for the first few products listed. Simplifying the digital shopping experience is critical for brands to be in the consideration set for the majority of consumers who won’t venture past page one results. 

    An internal analysis conducted shows getting a product to page one on retailer websites can improve sales by as much as 50 percent, but figuring out the right levers to pull to get there organically—without paid advertising—is a real challenge, especially given fast-changing algorithms. While more than half of all retail related online browsing sessions are “organic”, sometimes brands need to boost their product visibility by investing in sponsored (paid) opportunities to improve a product’s rank.

    Data analytics can equip brands with intelligence to help them decide when, where, and how to make digital advertising investments profitably, while simultaneously acting on insights that help drive organic growth. Considering a majority of U.S. consumers begin their product discovery on marketplaces like Amazon, it makes sense for brands to prioritize digital advertising opportunities with Amazon.

    Maximize Return on Ad Spend (ROAS) with Amazon Ads

    Brands use Amazon Ads to drive brand awareness, acquire new customers, drive sales and gain market share, with the goal of furthering their marketing return on investment. Top performing advertisers average 40 percent greater year-on-year (YoY) sales growth, 50 percent greater YoY growth in customer product page viewership on Amazon, and 30 percent higher returns on ad spend (ROAS) with Amazon Ads, according to a recent analysis. Sponsored Products, Sponsored Brands, Amazon DSP and Sponsored Display are among the types of Amazon Ads options cited that produce maximum return.

    Ensuring your product listings appear at the top of page one results on Amazon for the most relevant discovery keywords is therefore the most important determinant for maximizing ROAS. DataWeave has become a vetted partner and measurement provider in the Amazon Advertising Partner Network, with the goal of supporting brands to optimize digital advertising campaigns by providing visibility to Digital Shelf Analytics (DSA) key performance indicators (KPIs), like Share of Search, Pricing and Product Availability, Content Audits, Ratings and Reviews, and Sales Performance and Market Share.

    Below is a summary of how our Digital Shelf solutions, in partnership with Amazon Ads, can improve the performance of your Amazon Ads campaigns

    1. Keyword Recommendations Improve Share of Search

    With the DataWeave Share of Search solution, brands can monitor their placement of both organic and paid discovery keywords relative to their competition. Once your keywords are determined, you are also provided a weighted Share of Search score that helps measure how well each keyword performs relative to product discoverability. Below is an example of insights you’d gain.

    Share of Keyword Search

    Brands can provide their own list of keywords to monitor, or through our Amazon Ads collaborative solution, learn which keywords are the “best” for them to measure in the realm of Amazon. Performance results are based on data that shows which keywords consumers are actually using when browsing online alongside other keywords brands request to measure. Users are able to see exactly which keywords are most popular, competitive (and even unexpected), and relevant at an Amazon Standard Identification Number (ASIN) level of granularity. 

    We can also estimate the degree of relevance and estimated traffic for the recommended keywords. Brands can then use these insights to adjust campaign strategies based on these parameters, which can boost product discoverability and rank visibility. A brand could assume people find its products by brand name, yet traffic insights may reveal a majority of people look for a generic product type before they end up buying that particular brand. 

    2. Content Audits Increase Discovery Relevancy Scores

    Strong product content is critical to succeeding on Amazon. Thorough, accurate, and descriptive content leads to better click through rates (CTR), conversion rates, more positive reviews, and fewer returns, which results in increased discoverability. DataWeave’s Content Audit solution reviews existing copy and images on a per-attribute basis to highlight any gaps essential to improving visibility, as seen in the example below.

    Content Analysis

    To further growth, it is equally as important that your product content aligns with your advertising strategy. With Amazon Ads partner add-on, our solution can also audit your content to measure how effectively you are incorporating Amazon Ads keywords into your product content to enhance discovery relevancy.

    3. Discover More Opportunities with Pricing and Product Availability Insights

    Quality content and keyword updates will only get you so far if your products are not consistently available and priced competitively. With DataWeave’s Pricing and Promotions and Product Availability modules, advertisers can monitor their selling prices and availability trends alongside their competitors to uncover more opportunities to incorporate into advertising campaigns, as seen in the Pricing and Promotions dashboard example below.

    Promotion Analysis

    Additionally, product targeting recommendations can be utilized to target a competitor’s ASIN that may be overpriced or that is having issues staying in stock. Alternatively, broaden your strategy to target specific brands, complementary products, or category listing pages.

    You can also create alerts on your own products to monitor when items are low on inventory or out of stock to ensure key products are consistently available when customers are shopping.

    4. Leverage Ratings and Reviews to Increase Conversion

    Product ratings and reviews are also a critical component to running a successful Amazon Ads campaign. A large number of reviews and a positive star rating will provide customers with the confidence to purchase, resulting in higher conversion rates. Conversely, negative feedback can have a detrimental impact, resulting in lost sales and wasted ad spend. DataWeave’s Ratings and Reviews module can help you monitor your reviews and extract attribute-level insights on your products. This information can then be utilized to further optimize your advertising strategy.

    If you see consistent feedback in your reviews on aspects of a product not meeting customer expectations, address them in your product content to prevent potential misplaced expectations. Alternatively, if customer reviews are raving about certain product features, ensure these are promoted and relevant keywords are populated throughout your descriptions and feature bullets. Below is an example of insights seen within the DSA Ratings & Reviews dashboard.

    Ratings and Reviews

    5. Correlate Digital Shelf KPIs to Sales Performance and Market Share

    The newest DSA module, Sales Performance and Market Share, provides SKU, sub-category, and brand-level sales and market share estimates on Amazon for brands and their competitors, via customer defined taxonomies, to easily benchmark performance results.

    This data can also be correlated with other Digital Shelf KPIs, like Content Audit and Product Availability, giving brands an easy way to check the effect of attribute changes and how they impact sales and market share. Similarly, brands can see how search rank, both organic and sponsored, affects sales and market share estimates.

    Understanding the correlation between your advertising campaigns and your Digital Shelf brand visibility will help you identify which areas to prioritize to drive sales and win more market share.

    Digital Shelf Insights Help Brands Win with Amazon Ads

    The need for access to flexible, actionable eCommerce insights is growing exponentially as a way to help brands drive growth, increase their Share of Voice, and to gain a competitive edge. As a result, more global brands are seeking Digital Shelf Analytics for access to near real-time marketplace changes and to develop data-driven growth strategies that leverage pricing, merchandising, and competitive insights at scale.

    By monitoring, measuring and analyzing key performance indicators (KPIs) like Sales Performance and Market Share, Share of Search, Content Audits, Product Availability, Pricing and Promotions and Ratings and Reviews alongside competitors, brands will know what actions to take to boost brand visibility, customer satisfaction, and online sales. 

    DataWeave’s acceptance into the Amazon Advertising Partner Network enables Amazon advertisers to effectively build their Amazon growth strategies and determine systems that enable faster and smarter advertising and marketing decision-making to optimize product discoverability and overall results.

    Connect with us now to learn how we can scale with your brand’s analytical needs, or for access to more details regarding our Amazon Ads Partnership or Digital Shelf solutions.

    UPDATED: Read the full press release here

  • Prime Day India 2022 – highlights from the 2 day annual shopping festival!

    Prime Day India 2022 – highlights from the 2 day annual shopping festival!

    Amazon India’s much-awaited annual two-day shopping event, Prime Day, kicked off with a bang on July 23rd & 24th this year & was one of the most successful Prime Day events yet! Amazon reported that more than 32,000 sellers saw their highest ever sales day during the event. Interestingly 70% of these sellers who received orders during Prime Day were based in Tier 2 cities in India, further validating how the post-pandemic eCommerce boom has spread across the country. Also, Indian exporters saw 50% business growth on Amazon on Prime Day as customers across markets like North America, Europe, Australia, and Japan continued to purchase Made In India products.
    It was a great 2 days for Indian sellers, but what about customers who were waiting in anticipation for the great deals typically offered on Prime Day? We dug into our data to take a look at the deals, discounts, and brands that shone bright on Prime Day in India.

    Methodology

    • In addition to Amazon IN, we also tracked Flipkart on 23 & 24th July 2022, on Prime Day.
    • Categories tracked – Electronics, Grocery, Fashion & Beauty.
    • We looked at Additional Discounts offered on Prime Day: Additional Discount is the extra discount on an item during Prime Day when compared to the Pre-Prime Day price. 
    • We also looked at Post Prime Day Discounts, which were the discounts offered after the 2-day event ended.

    Amazon v/s Flipkart – who offered better discounts?

    Prime Day discounts are legendary. And across the globe, during Prime Day retailers try and compete to see if they can offer better deals than Amazon. Forbes even published an article on the 36 Prime Day competitor sales that were way more enticing than what Amazon had to offer. In India, we wanted to see if Amazon’s homegrown rival Flipkart might give it a tough fight, so we tracked the volume of discounts across categories on both retailers. 

    Discounts on Amazon & Flipkart across categories
    Discounts on Amazon & Flipkart across categories
    • Out of the 4 categories we tracked, in spite of Prime Day, Amazon offered discounts higher than Flipkart in only 2 categories – Electronics & Beauty. 
    • … while Flipkart offered higher discounts than Amazon in the Grocery & Fashion category. For groceries, Flipkart offered a 3.2% additional discount v/s 2.2% on Amazon. However, in the Fashion category, the difference was marginal – 8.1% on Amazon v/s 8.6% on Flipkart
    • Post-event, both Amazon & Flipkart went back to the original pre-event prices. This made it clear that Flipkart was tracking and making price changes based on their closest competitor. It’s what smart eCommerce businesses do to stay ahead in the race. 
    • Interestingly, post-event, in the fashion category, not only did Amazon revert to the original pre-event price, they even increased prices by close to 2%.

    Let’s take a look at discounts across 4 categories & the Brands that WON in each category.

    From Electronics to Fashion, Beauty & Groceries, let’s deep dive into the data to see which products were highly discounted within each category and brands that sprinted ahead to win the race on Amazon on Prime Day 2022.

    ELECTRONICS

    Tech publication Gadgets360 reported on the biggest Smartphone deals right from Brands like Samsung, Redmi, Oppo, and more. There were some fab deals on earphones too with Boat taking the lead. We wanted to take a look at electronics on Amazon and see which products had the heaviest discounts & if discounts were more lucrative than Prime Day 2021

    Discounts on Electronics on Prime Day
    Discounts on Electronics on Prime Day
    • Amazon India released highlights from Prime Day and reported that Smartphones & Electronics were among the categories that saw the most success in terms of units sold.
    • From the 6 product categories we tracked within electronics, we saw the highest additional discounts on Smartwatches (13.4%), followed by Bluetooth headphones (10.5%)
    • TV, Smartphones, cameras, and laptops had an additional discount of between 3 – 5.5%

    ELECTRONICS Brands that had the highest Share of Search on Amazon during Prime Day

    Research shows that on Amazon, the first 3 products garner 64% of business generated. This is why it is critical for brands to appear in the top few listings when consumers are searching for products. Being on top helps shoppers find your brand with ease & increases the chances of a sale. 

    On Prime Day 2022, Amazon India reported that the top-selling consumer electronics brands were HP, Lenovo, Asus, and Boat to name a few. Our assumption is, these brands must’ve had a high Share of Search (SoS), which played a massive role in increasing sales, so we looked into our data to see which brands had the highest SoS against specific keywords related to electronics. 

    Brand Visibility against the Keywords
    Brand Visibility against the Keywords
    • Our data aligned with what Amazon reported. HP had high sales, perhaps because they occupied the premium #1 spot in the laptop category with a 44% SoS! Simply put, this means of the 100 laptops that appeared on a page, against a search for the keyword laptop, 44 products were listed by HP! Consumers always gravitate towards buying products they can find with ease
    • Lenovo had a 32% SoS for Laptops. Asus at 14% 
    • The top selling smartphone brands reported by Amazon included OnePlus, Redmi, Samsung, Realme & iQOO – our data showed that 3 out of these 5 brands were in the top 5 listings on Prime Day! Redmi had a whopping 30% SoS against the keyword smartphone, Samsung at 15%, and iQOO at 5% – clear validation that a high SoS can positively impact sales.

    BEAUTY & GROOMING

    Now let’s look at discounts in the beauty & grooming category. 

    Discounts on Beauty Products on Prime Day
    Discounts on Beauty Products on Prime Day
    • The highest additional discounts were given on shampoos (9.3%), followed by Lipsticks (6.6%)
    • Shaving kits for men were at an additional discount of 3.4%. Hair gel at 4.9% & Face Masks at 4.3%

    BEAUTY Brands that had the highest Share of Search on Amazon during Prime Day

    Brand Visibility against the Keywords
    Brand Visibility against the Keywords

    In the beauty category, Amazon India reported that top-selling brands included Head & Shoulders, Dove, Biotique, L’Oreal, Sugar Cosmetics, and Mamaearth to name a few. Once again, we looked into our data to see the sort of brand visibility & SoS each of these brands had.

    • All the top-selling brand’s Amazon reported on we noticed appeared in the top 5 search results. 
    • Head & Shoulders & Dove were the top 2 listings against the keyword Shampoo at 26% & 16% SoS respectively. Biotique came in at #5 with a 7% SoS
    • Bombay Shaving Company, Gillette, and Axe were the top grooming brands for men in the Shaving Kit category. 
    • Lakme made a clean sweep with a 19% SoS against the keyword lipstick, which speaks volumes, considering the aggressive competition from D2C beauty brands in India today.

    GROCERY

    According to the New eCommerce in India report by consulting firm Redseer, grocery has been a major contributor to the growth of ecommerce in India & Amazon Fresh used Prime Day to grab a larger piece of that pie! As part of the Prime Day sale, Amazon Fresh also pushed discounts on groceries, as well as fruits and vegetables. We tracked products that fell into the “snack” category, and here’s what we saw.

    Discounts on Snacks on Prime Day
    Discounts on Snacks on Prime Day
    • Given changing lifestyles & healthy food fads, it was no surprise that we saw the highest additional discounts were given on Healthy Snacks (3.2%) & Diet Food (2.7%)
    • Chocolates and chips saw much lower additional discounts at 1.2% each.
    • Drinks were additionally discounted by 2.5% during Prime Day.

    SNACK Brands that had the highest Share of Search on Amazon during Prime Day

    Brand Visibility against the Keywords
    Brand Visibility against the Keywords
    • Cadbury had a 69% share of search against the keyword Chocolate, leaving some of its key competitors way behind. Amul had a 20% SoS, while Hershey’s was at just 4%. 
    • According to an article in the Economic times, YogaBar tripled sales in FY22, which is why we were not surprised to see the brand at #1 when users were searching for “Healthy Snacks” during Prime Day. YogaBar products typically enjoy high visibility year-round, which clearly helped with brand awareness on Amazon & sales.

    FASHION

    Amazon reported that Men’s t-shirts and polos, denims, Kurtis, tops, and dresses for women, designer wear, and clothing for kids were some of the most-loved fashion categories on Prime Day. We looked into our data to see the trends that emerged.

    Discounts on Fashion on Prime Day
    Discounts on Fashion on Prime Day
    • From the categories we tracked, women’s handbags had the highest additional discount (11.8%), followed by watches (9.1%)
    • Sneakers & jeans had additional discounts in the ballpark of 7% and sunglasses at 4.4%

    FASHION Brands that had the highest Share of Search on Amazon during Prime Day

    Brand Visibility against the Keywords
    Brand Visibility against the Keywords
    • Some of the usual suspects made it to the top 5, but what really stood out for us were brands that popped up against the keyword Jeans. While Levi’s came in at #2 with an 11% SoS, 2 Private Label Amazon brands featured in the top 5! Symbol at 27% SoS and Inkast Denim at 9%
    • Against the keyword Handbag, Lavie had a massive lead at 38% v/s the #2 brand – Caprese, at 13%
    • Boat found a #2 spot against the keyword watches, racing way ahead of the age-old popular brand Fastrack at #5 with a 4% SoS.

    Conclusion

    Amazon Prime Day 2022 in India came to a successful close as shoppers across India discovered the joy of the 2 day celebration with the best deals, savings, new launches, and more. Prime members from 95% of pin codes in India made purchases, there were 1000’s of deals and 500+ new product launches from brand partners & sellers. Nearly 18% more sellers grossed sales over INR 1 crore, and close to 38% more sellers grossed sales of over 1 lakh vs Prime Day 2021. Local neighborhood shops that sell on Amazon witnessed 4x sales growth. And start-ups and brands under the Amazon Launchpad program witnessed a growth of 3x. All in all, a successful event for everyone involved! 

  • The Role of eCommerce in Sustainable Fashion

    The Role of eCommerce in Sustainable Fashion

    Today, environmental damage is rapidly occurring on a global scale. And there are many reasons and causes for this. Global warming is one, deforestation, over population are some others. The list is long. In a small way, the retail & clothing industry contributes to environmental damage too. The good news is that sustainable fashion addresses this issue. Sustainable clothing is designed using sustainable fabrics like organic cotton, hemp, and Pima cotton that have less of a negative impact on the planet. 

    sustainable clothing and its benefits
    Sustainable clothing and its benefits

    In this blog, we will discuss the rise of sustainable clothing and its benefits. We will also discuss marketplaces for sustainable fashion.

    Benefits of Sustainable Fashion

    a. Reduces carbon footprint

    The fashion industry emits numerous greenhouse gases annually. Most clothes are made from fossil fuels and require significantly more energy in production. Sustainable brands often use natural or recycled fabrics that require less chemical treatment, water, and energy. Organic fabrics such as linen, hemp, and organic cotton are biodegradable and environmentally sound.

    b. Saves animal lives

    Leather isn’t a by-product of the meat industry, and it’s estimated that it alone is slaughtering and killing over 430 million animals annually. Sustainable fashion brands are increasingly embracing the use of cruelty-free alternatives. Various alternatives include polyester made with ocean trash, plant-based compostable sneakers, bags from recycled seatbelts, silk created from yeast, and bio-fabricated vegan wool. Another interesting leather alternative comes from pineapples, where the fabric is produced using the leaves of pineapples.

    c. Requires less water

    Water is used in the dyeing and finishing process for nearly all items in the fashion industry. It takes 2,700 liters of water to produce a single T-shirt. Cotton is highly dependent on water but is usually grown in hot and dry areas. Linen, hemp, Refibra, and recycled fibers are some other sustainable fabrics that require little to no water during production.

    d. Supports safer working conditions

    Endless working hours, unacceptable health & safety conditions, and minimum wages, are the reality for most garment workers in the fast fashion sector. A few informative documentaries like “The True Cost” or “Fashion Factories Undercover” document the social injustices of the fast fashion industry. Eco-ethical brands advocate for sustainable fashion, health care, humane working conditions, and fair wages for their workers. 

    e. Healthy for people and the environment

    Fast fashion products often undergo an intense chemical process where 8,000 types of chemicals are used to bleach, dye, and wet process garments. Those chemicals often lead to diseases or fatal accidents for workers and inflict serious congenital disabilities on their children. These chemicals harm our health, as our skin absorbs anything we put on it.

    5 Sustainable & Ethical Online Marketplaces

    Here is a list of five earth-minded and socially responsible marketplaces that have sustainable and fair trade brands for the discerning and mindful shopper:

    1. thegreenlabels

    Netherlands-based webshop thegreenlabels is a sustainable fashion retailer that sells sneakers, womenswear, and accessories from various “green labels” brands. Founded in 2018, this is a marketplace where people can buy products from brands that care about a positive impact on the environment. All brands featured here guarantee fair working conditions and represent at least one of these 4 values – “CLEAN PROCESS” environmentally friendly production, clothes that support “LOCAL” communities, “VEGAN” brands to assure no animals were harmed and “WASTE REDUCTION”

    2. LVRSustainable

    LVRSustainable
    LVRSustainable

    Luisa Via Roma started as a family-owned boutique in the early 1900s. They have grown into a luxury e-retailer and created an LVRSustainable section for people trying to insert sustainability into their wardrobes. They have brands rated ‘Good’ or ‘Great.’ The site offers a wide range of products like bags, accessories, sports, shoes, lingerie, and much more for men, women, and kids. You can find organic, vegan, eco-friendly, ethical, and recycled & upcycled items here.

    3. Brothers We Stand

    Brothers We Stand
    Brothers We Stand

    Brothers We Stand is a retailer set up in solidarity with the people who make our clothes. This retailer conducts rigorous research to ensure that every product in their collection meets the following three standards: designed to please, ethical production, and created to last. It’s a great platform to shop for ethical and sustainable menswear. They also have their private clothing line along with other brands.

    4. Labell-D 

    Labell-D was launched with a clear mission to reduce the negative impact of fast fashion on the planet. This retailer wants to make Responsible Fashion the new norm. They intend to make sustainable clothing and fashion easy for both brands and consumers. Labell-D has a transparent accreditation process where they evaluate the brand’s carbon footprint and environmental impact. Their verification assessment includes animal welfare, emissions, materials, production processes, chemical usage, waste management, and traceability.

    5. Cerqular

    Cerqular wants to make sustainable shopping affordable and accessible for all. The retailer promises that every product and seller is verified as organic, recycled, sustainable, carbon-neutral, eco-friendly, vegan, or circular. They have a wide range of sellers and do not limit products only from luxury brands, so sustainable shopping is no longer expensive or inconvenient.

    Conclusion

    The fashion industry is a contributor to worldwide carbon emissions. Sustainable fashion is the new big thing giving rise to more and more sustainable brands and marketplaces. 

    To stand out and shine in the crowded eCommerce space is not easy. Having a robust Digital Shelf becomes critical for brands. A brand’s Digital Shelf is all of the ways their customers digitally interact with the brand, not only on marketplaces but on the brand’s DTC website & shoppable social media. This is why brands need to closely track & optimize their Digital Shelf KPIs like assortment, availability, pricing, ratings & reviews, product discoverability & product content to increase their online sales.

    Want to learn how DataWeave can help you win the Digital Shelf? Sign up for a demo with our team to know more.

  • U.S. Prime Day Deals 2022: Promotion Intelligence First Look

    U.S. Prime Day Deals 2022: Promotion Intelligence First Look

    As inflation hits another 40-year high at 9.1 percent, U.S. consumers geared up for their first sign of hope and relief in the form of anticipated discount buys – 2022 Amazon Prime Days, or so we thought. While Prime Days have grown to become a promotional period almost as important as Black Friday to digital shoppers, the combination of economic uncertainty, inflationary pressures, and supply chain challenges seemed to alter the discount strategy expected given activity seen during 2021 Prime Days.

    Our analyst team has been hard at work aiming to provide a ‘first look’ at 2022 Prime Day Promotional Insights, tracking discounts offered across 46,000+ SKUs within key categories like Electronics, Clothing, Health & Beauty and Home, on seven major retailer websites – Amazon, Target, Best Buy, Sephora, Ulta, Lowe’s and Home Depot. Our analysis compares prices seen during Amazon Prime Day 2022 on July 12th, to pre-Prime Day maximum value prices seen in the ten days leading up to Prime Days, to determine the average change in discounts offered during the promotional period. Below is a summary of our findings.

    Competitive Promotions Give Amazon a Run for their Money

    Amazon offered the greatest average discount enhancements for Electronics at 5.6 percent followed by Health & Beauty items at 5.1 percent, and Home products at 4.2 percent versus pre-Prime Day discounts seen across the categories considered within our analysis. The only category reviewed where average discounts were greater on a competitor’s website was on Target.com within the Clothing category. As seen below, Clothing on Target.com average discounts were 6.8 percent greater than pre-Prime Day offers, which was 2.6 percent higher than the average discounts offered for Clothing on Amazon.

    Target Capitalizes on Growth Opportunity in Clothing Category

    Diving deeper into the details of where Target won within the Clothing category, you can see a majority of their promotional activity took place within Women’s Accessories where discounts offered were 18.5 percent greater than those seen pre-Prime Day 2022, which was almost 15 percent greater than the discount enhancements seen on Amazon for Women’s Accessories. In fact, Women’s Shoes and Sneakers were the only two categories where the average discounts offered were greater on Amazon than on Target.com.

    Overall, the discounts offered on Target.com within the Clothing category were primarily concentrated within items priced $40 and lower, but what was most interesting is that within the $10 and under price bucket, Target offered average discounts of over 11 percent whereas Amazon increased prices for these items on average by over 9 percent.

    While most of the Clothing available on both Amazon and Target.com during Prime Days 2022 were offered without a price change, the greatest discount percentages tracked were within the range of 10-25 percent off on Amazon whereas Target chose to offer the bulk of their promotions at 25 percent off an up.

    Strategic Promotional Strategies Defined at the Electronics Subcategory Level

    When it comes to the Electronics category on Prime Day, the big question is always who will win the battle of the brands. Below shows the difference in average pricing and promotions discounts offered between products manufactured by Samsung versus Apple across each retailer platform, noting discounts were almost 3 percent greater on average for Apple versus Samsung products on Amazon, and Apple discounts were almost 5 percent greater on Amazon versus than those seen on Target.com.

    Amazon wasn’t going all in on Apple however, as we saw ‘Alexa’ devices (Amazon products) available on Best Buy and Target websites also, but the discounts were almost 4 percent greater on Amazon versus Target and over 7 percent greater than the discounts seen on BestBuy.com.

    While the average discounts offered within the Electronics category were greatest on Amazon (5.6 percent) versus Best Buy (3.9 percent) and Target (3.4 percent) as noted within the first chart of this blog and across brands and technologies considered above, the discounts offered on Amazon were strategically focused between 10-25 percent as seen below.

    Amazon’s Electronics promotions were also targeted at smaller price points, items priced between $20-500, whereas Best Buy and Target offered greater promotions for electronics priced $500 and up than Amazon.

    Below is a snapshot of price buckets tracked for Electronics available on BestBuy.com, highlighting where most of the promotional activity was targeted at products priced $50 and up during Prime Days 2022, with discounts ranging from 10 percent up to greater than 25 percent greater than pre-Prime day prices.

    The standout categories were TVs on Target.com with discounts averaging nearly 12 percent greater than those seen pre-Prime day, and smartphones on BestBuy.com with discounts averaging just over 11 percent greater than those seen pre-Prime Day. The category with the greatest average discount enhancements seen on Amazon during Prime Days 2022 was for Wireless Headphones with an average discount of 8.7 percent.

    Home is Where Amazon’s Heart Was on Prime Day

    Amazon dominated offers within the Home categories, especially for products within mid ($40-100) and higher price ranges (items priced $200-500), with the bulk of the discounts offered between 10-25 percent. There was little to no promotional activity seen across all price points on Lowe’s or Home Depot’s websites within the categories we tracked, and most other competitive offers on Home products were seen on BestBuy.com for products priced from $50-500. Even a subcategory like Tools offered deeper average discounts on Amazon (4.7 percent) than discounts seen on HomeDepot.com (1.1 percent) or Lowes.com (0 percent).

    For Large Appliances, Amazon was the only retailer to off any significant discount across each major subcategory with the greatest average discount being on Ovens at 6 percent, followed by Refrigerators at 4 percent. One caveat with this category, when we reviewed Large Appliance prices two weeks prior to Prime Days, we saw average price increases around 16.7 percent occurring on Amazon.

    During Prime Days 2022 however, Amazon also offered top average discounts for small appliances, except for on Instant Pots which appeared to have greater average discounts on Target.com (5.9 percent versus 4.2 percent on Amazon), and Vacuum Cleaners which appeared to have the best promotion of appliances small and large at 13.8 percent average discount on BestBuy.com. Another subcategory deeply discounted on BestBuy.com was weighted blankets, which averaged discounts around 18.5 percent versus Amazon’s average discount at only 6.2 percent.

    Health & Beauty Retailer Pricing Strategies Revealed

    Given the importance Health & Beauty Brands placed on Prime Day sales last year, we had anticipated to see more offers, especially within pure-play beauty retail channels, than we did for this booming category.

    Amazon drove most of the Health & Beauty offers seen averaging 5.1% discounts versus other retailers only offering less than 1% on average, but discounts were aimed at a targeted group of SKUs on Amazon, bringing the average discount lower overall. Most of the promotions offered on Amazon fell within mid-range price points ($20-50) and were discounted between 10-25 percent versus pre-Prime Day prices.

    Target.com offered the most comparable discounts to Amazon for Health & Beauty products on average, but their strategy primarily focused on items within the $20 and lower price range with discounts ranging primarily between 10-25 percent.

    More 2022 Prime Day Insights Coming Soon

    We know the significance visibility to critical pricing and promotional insights play in enabling retailers and brands to offer the right discounts to stay competitive, especially during promotional periods like Prime Days. While this blog is intended to provide a ‘sneak peek’ into 2022 Prime Day insights for the U.S. market, we will be providing more extensive, global coverage and will proactively share new insights with the marketplace as they become available throughout the month of July.

    Be sure to also check out our Press page for access to the latest media coverage on Prime Day insights and more. Don’t hesitate to reach out to our team if there is any particular category you are interested in seeing in more detail, or for access to more information on our Commerce Intelligence and Digital Shelf solutions.

  • 7 Key Metrics that QSRs want (but may not get) from Food Delivery Apps

    7 Key Metrics that QSRs want (but may not get) from Food Delivery Apps

    The Quick Service Restaurant market is projected to be valued at $691 billion by 2022. As the QSR industry grows and the market becomes even more competitive, restaurant chains continuously seek ways to increase sales via food aggregators to market their business. To improve ROI and sales, having data and insights into key metrics could help QSRs to boost their success rate.

    QSRs would like to know how they stack up against their competition regarding discoverability on cluttered food aggregator apps. Restaurants want to know the gaps in their product assortment to understand what drives customers to their competitors. Getting insights into delivery time and competitors’ delivery fees will help QSR improve delivery ETAs and optimize fees. They can also set competitive pricing with insights into their competitors’ pricing. In addition, they can use data to optimize their ad spending on food apps and improve marketing ROI.

    In this blog, we will discuss the relationship between QSRs and food aggregators and how getting data about key metrics from these food delivery platforms can help QSRs scale their revenue. 

    Data: The Key Ingredient to increasing sales

    According to Statista, online food ordering revenue is expected to grow at a robust CAGR of 10.39% between 2021 and 2025. Food Aggregators apps like Uber Eats, DoorDash, and GrubHub offer convenient meal delivery options from various QSRs within a single app. Food aggregators provide a multitude of benefits for QSRs. They give access to a huge customer base, quick delivery, and an easy entry into quick commerce, helping QSRs increase visibility. Although QSRs rely on food aggregator platforms for hassle-free ordering, tracking, and delivery, they can’t always rely on them to share critical data that could help them optimize their operations & increase sales. 

    Online food ordering revenue
    Online food ordering revenue

    1. Data on Product Assortment

    QSRs need assortment insights to understand their competitor’s menu assortment. Assortment analytics plays a crucial role in ensuring that QSRs aren’t losing sales because their competitors are offering cuisines and dishes that they aren’t. Understanding gaps in menus helps QSRs to better plan their menu. However, food aggregator apps can’t share competitors’ assortment data with QSRs for a multitude of reasons, guidelines, and privacy laws. Thankfully, at DataWeave, our QSR intelligence solution can! We help restaurants improve their assortment by sharing insights into the dishes and cuisines their competitors’ have on display.

    Menu Assortment
    Menu Assortment

    2. Data on QSR Discoverability

    QSRs would love to know how to increase discoverability on food aggregators, as it will help them to appear ahead in search results and beat the competition. Improving visibility on these apps directly impacts sales and drives more orders for restaurants. Some aggregators offer discoverability information but give it on demand, usually after 20-30 days, making it irrelevant due to the enormous time gap. They also don’t provide information about the change in the discoverability of your competition. All these data points are so critical, and understandably so, Food Apps can’t share this level of information with restaurants. However, DataWeave’s QSR Intelligence solution can! It provides real-time discoverability insights into your restaurant and competitor’s visibility so that the data is actionable, and QSRs can use insights to improve visibility

    Read how DataWeave’s QSR Intelligence helped an American QSR Chain and how their ranking on search results page on Ube rEats, DoorDash & Grubhub impacted outlet discoverability & sales!

    3. Data on Pricing & Promotions

    Pricing a QSR’s menu is tricky. If you price too high, you’ll turn off new customers. If you price too low, you’ll cut margins & may even come off as low-qualify. Customer Price Perception is greatly influenced by the Price-Quality relationship. To add to this, restaurants are often up against stiff competition from restaurants with similar cuisine offerings so it’s critical that prices are competitive. Understanding competitor pricing doesn’t imply that you have to beat their prices. You can compensate for any price differences by offering higher quality cuisines, better customer service, and quicker delivery. Once again, food apps can’t share competitors’ pricing data with QSRs. But DataWeave’s QSR & Pricing Intelligence solution can! QSRs can use these insights to drive more revenue & margins by pricing their menu right.

    4. Data on Delivery Time

    QSRs must be able to deliver hot meals, in a timely manner to customers because customers want to quickly dig into the delicious food they ordered. Quicker deliveries within the ETA will also help earn the trust and loyalty of customers. However, food aggregators don’t share information on the delivery times with restaurants – not their own delivery time or their competitors. DataWeave can help QSRs to understand their peak hours and optimize their service to ensure quick ETAs. They can also get detailed insights into competitors’ delivery times to make sure they’re competitive. This is important because customers will often pick restaurants with quicker ETAs.


    Read how DataWeave’s QSR Intelligence helped an American QSR Chain understand the correlation between delivery time & sales volumes

    Delivery time trend by urbanity
    Delivery time trend by urbanity

    5. Data on Delivery Fee

    As a thumb rule, customers will always compare delivery fees across apps. They’re conscious of delivery dollars included in their bill and often choose a restaurant with lesser delivery fees. This makes it even more critical for restaurants to understand how they stack up against their competitors. Understanding competitors’ delivery fees could potentially help QSRs to optimize their rates. And once again, food aggregators can’t share information on competitors’ delivery fees with restaurants. However, DataWeave’s QSR Intelligence can provide all delivery-related insights – be it Delivery etas or fees. 

    Delivery fee trend by urbanity
    Delivery fee trend by urbanity

    6. Data on Ad Performance & ROI

    Getting ad analytics will help QSRs better manage their budgets & increase the ROI on their Ad spends. For example, wouldn’t it be great if QSRs were able to understand which ad formats or promotions led to the most sales? Or which carousal ads had the most visibility in key zip codes where your QSR is expected to do maximum business? Or even insights into a competitor’s ads and promotions on food apps. Knowing this information will help restaurants spend sensibly when buying media on Food Apps & get the most bang for their advertising buck. Food apps do provide standard ad analytics – a number of clicks, CTR, and so on, but for more complex, insightful & actionable insights, there’s DataWeave’s QSR Intelligence

    Read how DataWeave’s QSR Intelligence helped an American QSR Chain understand the ROI delivered on ad spends across Food Delivery apps.

    Insightful & actionable insights for QSR Chains
    Insightful & actionable insights for QSR Chains
    Insightful & actionable insights for QSR Chains
    Insightful & actionable insights for QSR Chains

    7. Data on Outlet Availability / Availability Audit

    To avoid lost sales, being available & “open for business” on Food Apps during peak lunch & dinner hours is critical. Also on weekends, when order volumes are usually high. Sometimes because of technical glitches, QSR outlets appear unavailable on Food Apps. A glitch like that can lead to lost business, and the longer the glitch stays undiscovered, the greater the impact on revenue. While Food Aggregators do their best to make sure all QSRs are up and running on their app, using DataWeave’s QSR Intelligence, restaurants can now do an outlet audit to make sure that’s the case. With just a mere 2.8% unavailability, we saw a 28% drop in the sales for one of our QSR customers! That’s how critical Availability insights are. 

    Conclusion

    Analyzing and optimizing sales, delivery, discoverability, availability & customer data is one of the fastest ways to help grow your QSRs revenue. However, the biggest challenge QSRs face is that it isn’t always easy to get this information. With DataWeave’s QSR Intelligence now some of that data is a little more accessible as we discussed in this blog. And additionally, here are the 7 Tricks we recommend QSRs to use to win on Food Apps