Author: Vaibhav Khaparde

  • 10 SEO Tactics to Help Retail Brands Win More Search Visibility on Amazon

    10 SEO Tactics to Help Retail Brands Win More Search Visibility on Amazon

    Today, the first name that comes to anybody’s mind when they hear about online shopping is Amazon. In the US alone, Amazon accounted for over 37.6 percent of total online retail sales in 2023 with the second place Walmart not even managing to win double-digit numbers on the same scale.

    Amazon leads retail eCommerce in the USA

    With such a phenomenal market share, it is not surprising that any retail brand would want to have their products listed on Amazon for sale. However, as enticing as the potential exposure could be, the overwhelming presence of brands selling similar products on Amazon is so huge that getting fair visibility for your products may require some heavy-lifting support.

    Will the Same SEO You Use for Google Work with Amazon?

    Unfortunately, no, as Google and Amazon have different objectives when it comes to search rankings on their respective customer platforms. Google makes the lion’s share of its revenue from search advertising, whereas Amazon makes money when customers buy products listed on its platform by sellers.

    Relying on traditional search engine optimization (SEO) techniques may not get the desired results as they are more optimized for search engines like Google. Amazon embraces its unique DNA when it comes to product display rankings on its search option.

    How Does SEO Work in Amazon?

    Over the years, Amazon amassed data about shopping experiences that billions of customers globally had on its platform. With this data, they developed their custom search algorithm named A9. Contrary to the gazillion objectives that Google has for its intelligent search algorithms, Amazon has tasked A9 with just a simple straightforward target—when a customer keys in a search query, provide the best choice of products that they will most probably purchase, as search results.

    A9 works to fulfill the mission of guiding shoppers to the right product without worrying about semantics, context, intent, mind mapping, etc. of the search query in contrast to what Google does. As with Google search, Amazon does have paid advertising and sponsored results options such as Amazon PPC, Headline ads, etc. but their SEO algorithms are aware of how to support and boost search rankings of genuine products and brands that have taken an effort to follow best practices in Amazon SEO as well as have a great offering with attractive prices.

    As additional knowledge, Amazon also has clear guidelines on what it prioritizes for search rankings. Known in the SEO world as Amazon ranking signals, these are core factors that influence how a product is ranked for search queries. Some of the top Amazon ranking signals that carry heavy influence on search rankings include on-page signals, off-page signals, sales rank, best sellers rank, etc.

    What Brands Need to Strategize to Master the Amazon SEO Algorithms

    From a broad perspective, we can classify the actions brands need to take in this regard in 3 core stages:

    Pre-Optimization

    This deals with getting first-hand knowledge about both customers who are likely to purchase your product and the competitors who are vying for sales from these very same customers. Filtering your target customer or audience is essential to ensure that you get the most ROI from marketing initiatives and that sales cycles are accelerated. For example, if your product is a premium scented candle, there is no point in wasting advertising dollars trying to win attention from customers who are not likely to ever spend on luxury home décor items.

    Knowing how your competitors are performing on Amazon search, the keywords, and SEO strategies they have adapted is critical to ensure that you stay one step ahead.

    Product Listing Page Optimization

    This includes strategies that a brand can adopt so that its product description page gets the much-needed content optimizations to sync with Amazon’s A9 algorithm. It has a mix of keyword-integrated content, relevant images, descriptions in easy-to-understand language, localized content flavors to resonate with target buyers, etc. For example, a kitchen tool like a grater might be used for different kinds of food preparation techniques in different regions of the same country.

    Product Listing Optimization For Amazon SEO

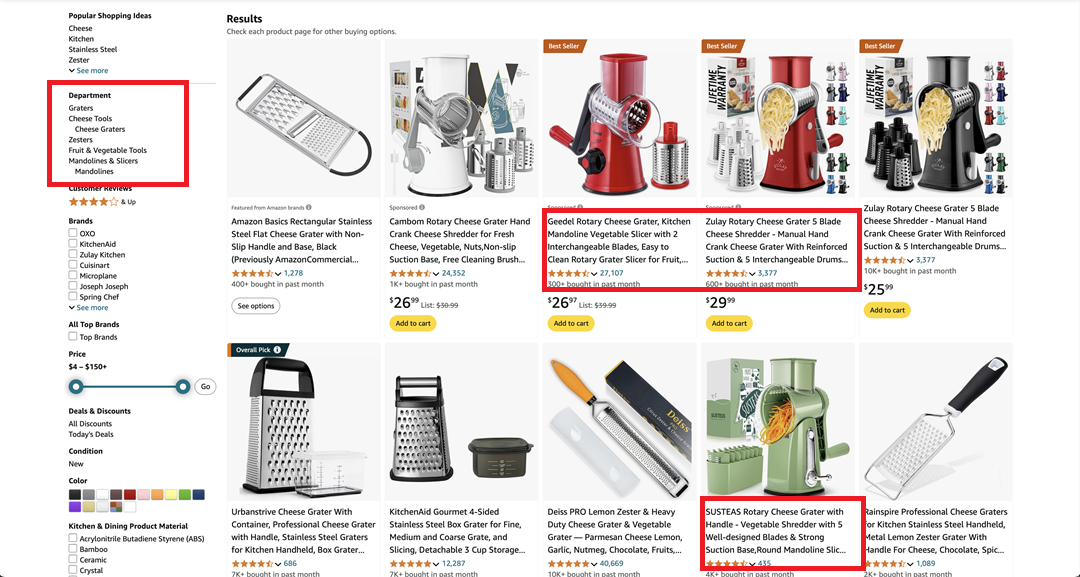
    The brand must ensure that the description adequately localizes the linguistic or usage preference representation of the target audience. If the grater is used for grating coconut shells to extract the fibrous pulp in the Midlands and for grating ginger skin in the Far East, both use cases should be part of the product description if the target customers are from both regions.

    Sales Optimization

    This deals with options that have more sales strategies integrated into their core. For example, blogs on popular websites with the Amazon purchase link embedded in the content, collaboration with social media influencers, paid advertising on Amazon itself as well as on search engines, video ads, banner and display ads, etc.

    The key intent here is to drive organic and inorganic traffic to the Amazon product listing page and ultimately win sales.

    How Can Your Products Rank High in Amazon Search Results? Top 10 Tactics

    Now that you have a clear understanding of the strategies that help in mastering Amazon’s ranking algorithms, here are some great tips to help achieve higher search rankings for your products on Amazon search:

    1. Target Relevant Keywords

    You need to figure out the best keywords that match what customers put as queries into the Amazon search bar. Your brand needs to clearly understand customer behavior when they arrive on Amazon to search for a product or category of products. The best place to begin looking for the same would be on competitor pages on Amazon. The keywords that helped them rank well on Amazon can help you as well. Manually investigating such a large pool of competitors is nearly impossible but with the right tools, you can easily embrace capabilities to know which keywords can help you in mimicking the success of your competitors.

    2. Focus on Product Titles

    Every single part of the content in your brand’s Amazon storefront or product page needs dedicated focus. Beginning with the product titles, effort needs to be made to ensure that they include the brand name, key product category or features, and other relevant keyword information.

    Product Title Optimized for Amazon SEO

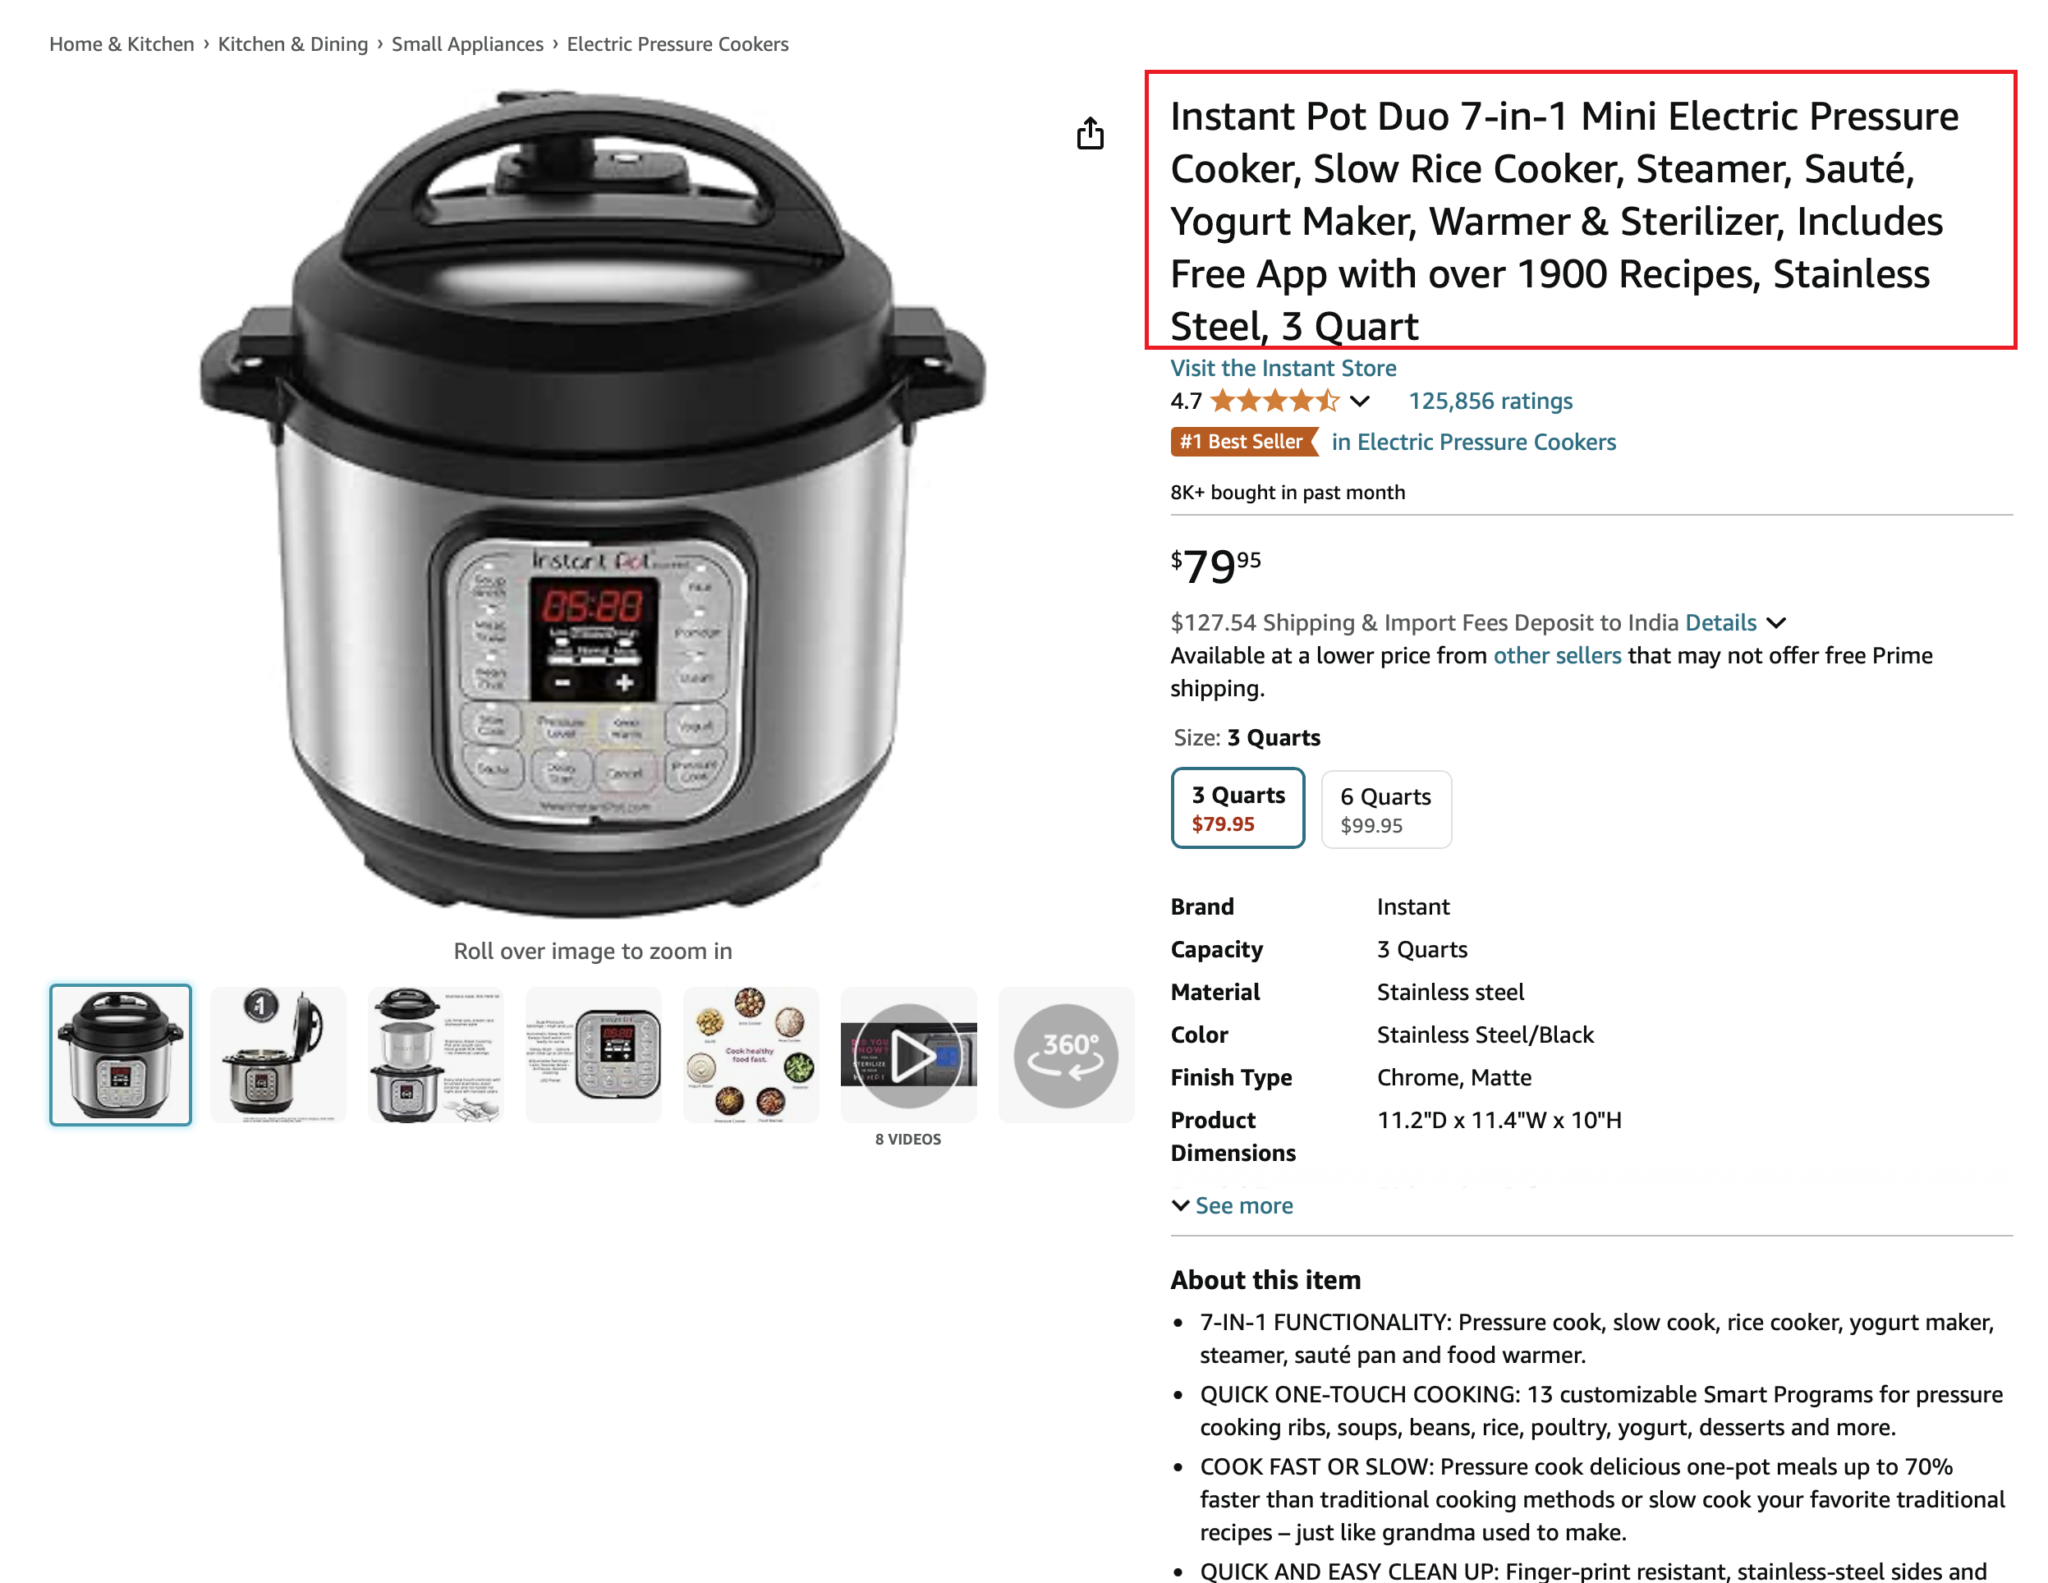
    In other words, product titles must be optimized for searchability. This searchability for product titles needs to be optimized for both mobile and desktop screens.

    3. Create Product Descriptions that Resonate with the Audience

    For product descriptions on your Amazon webpage, you need to figure out the optimal quality levels needed for the intended audience. Effective content can help achieve better search ranking visibility and convince the incoming traffic of shoppers to make a purchase. It is important to periodically review and modify your page content to suit the interests of visitors from both web and mobile devices.

    Product Description Optimized for Amazon SEO

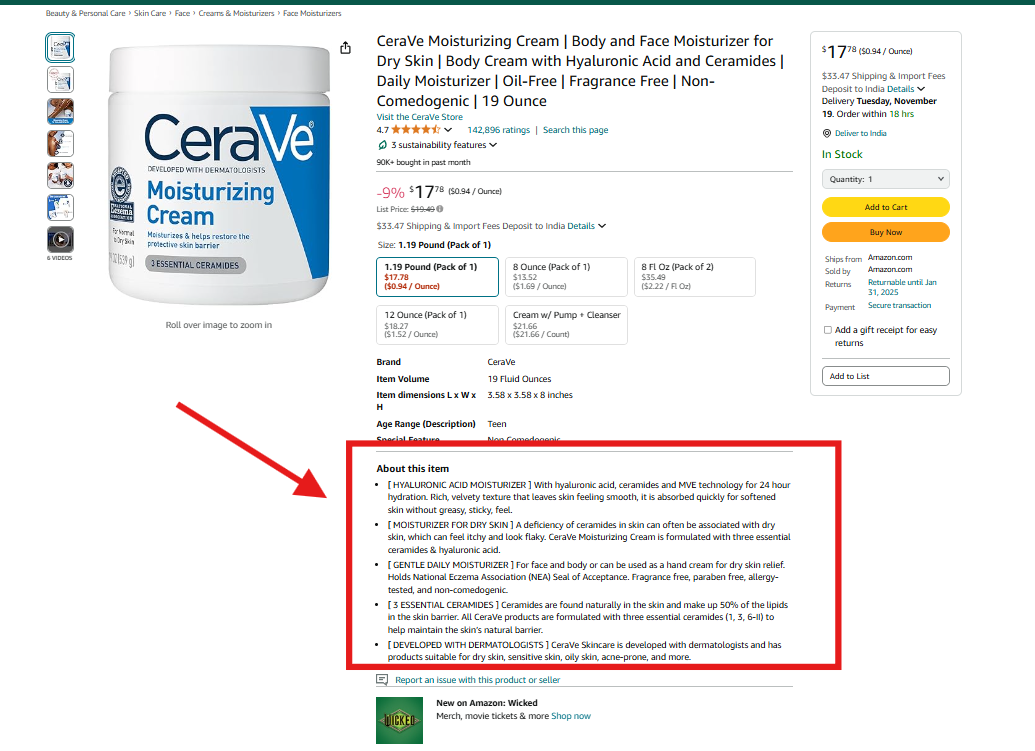
    Leveraging solutions like DataWeave can help with regular content audits to ensure you are putting out the best product content that will delight shoppers and deliver on sales conversion targets.

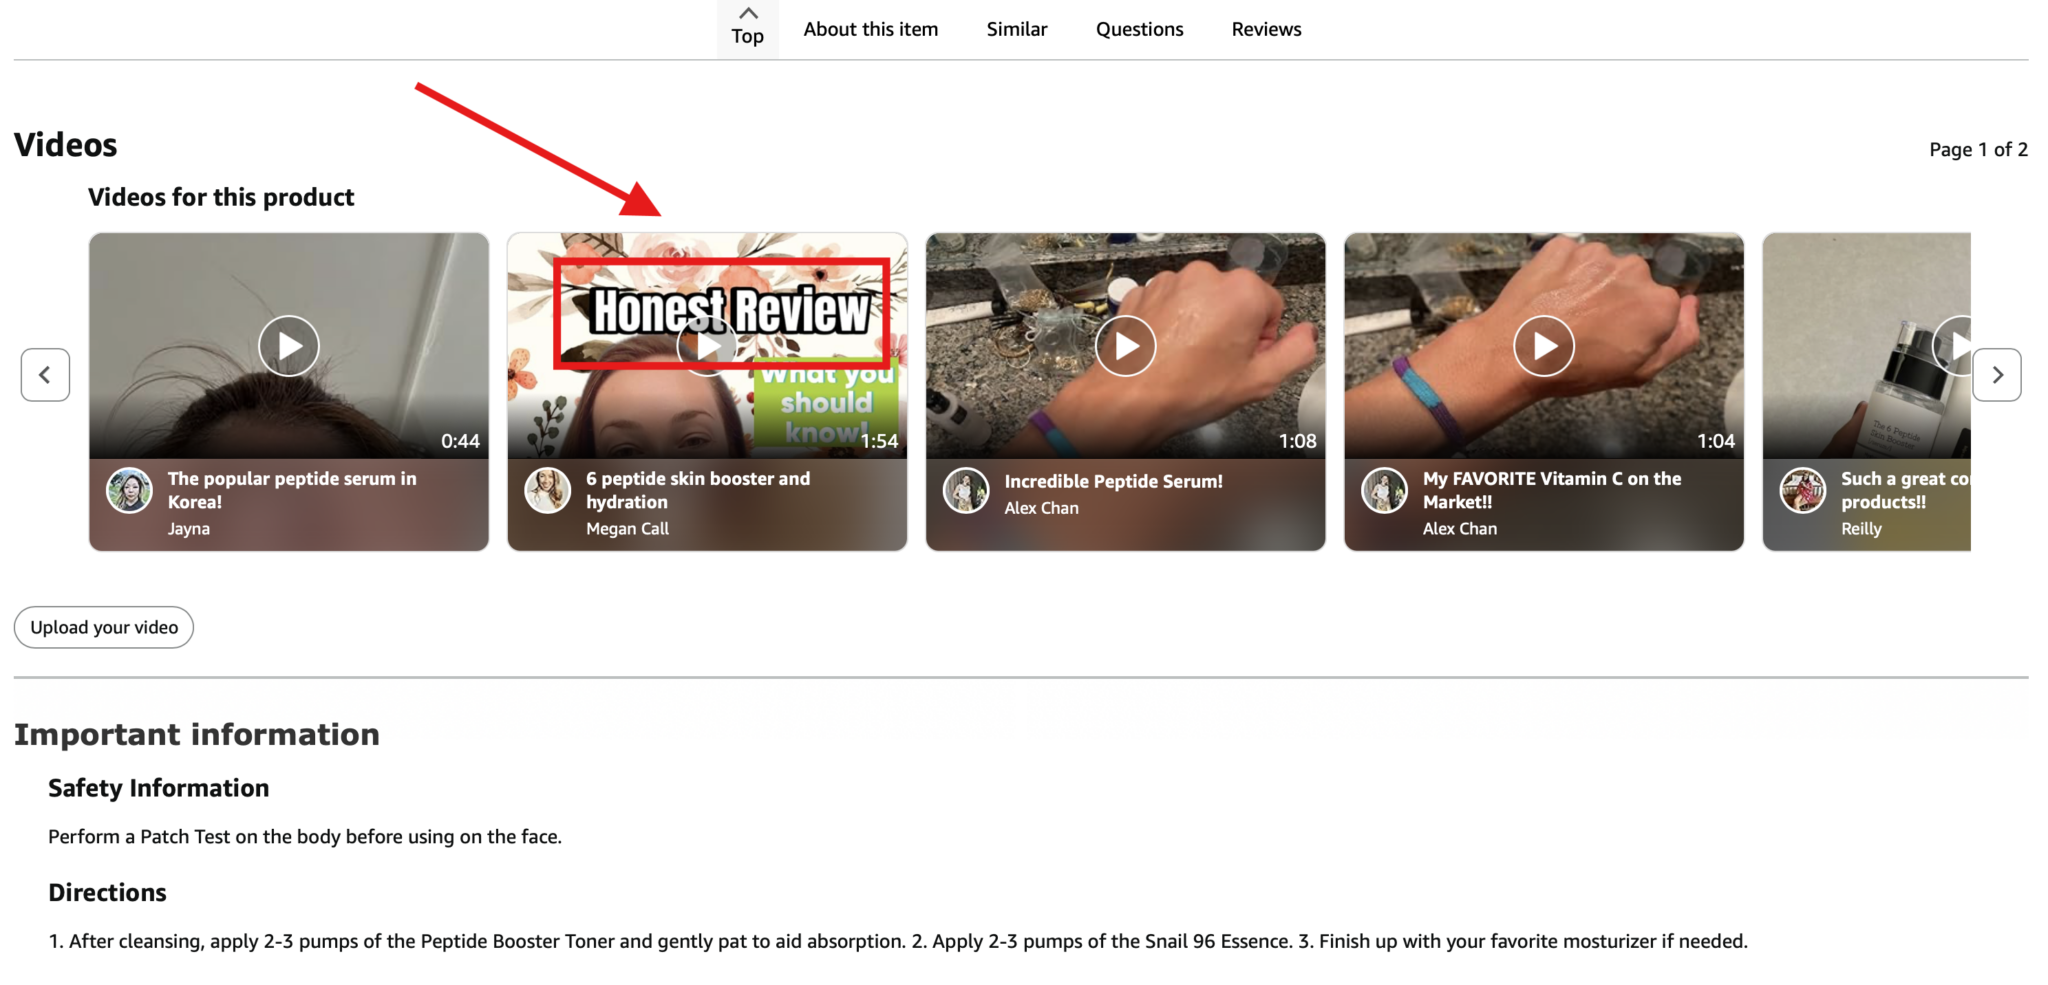
    4. Use High-Quality Media Assets like Images and Videos

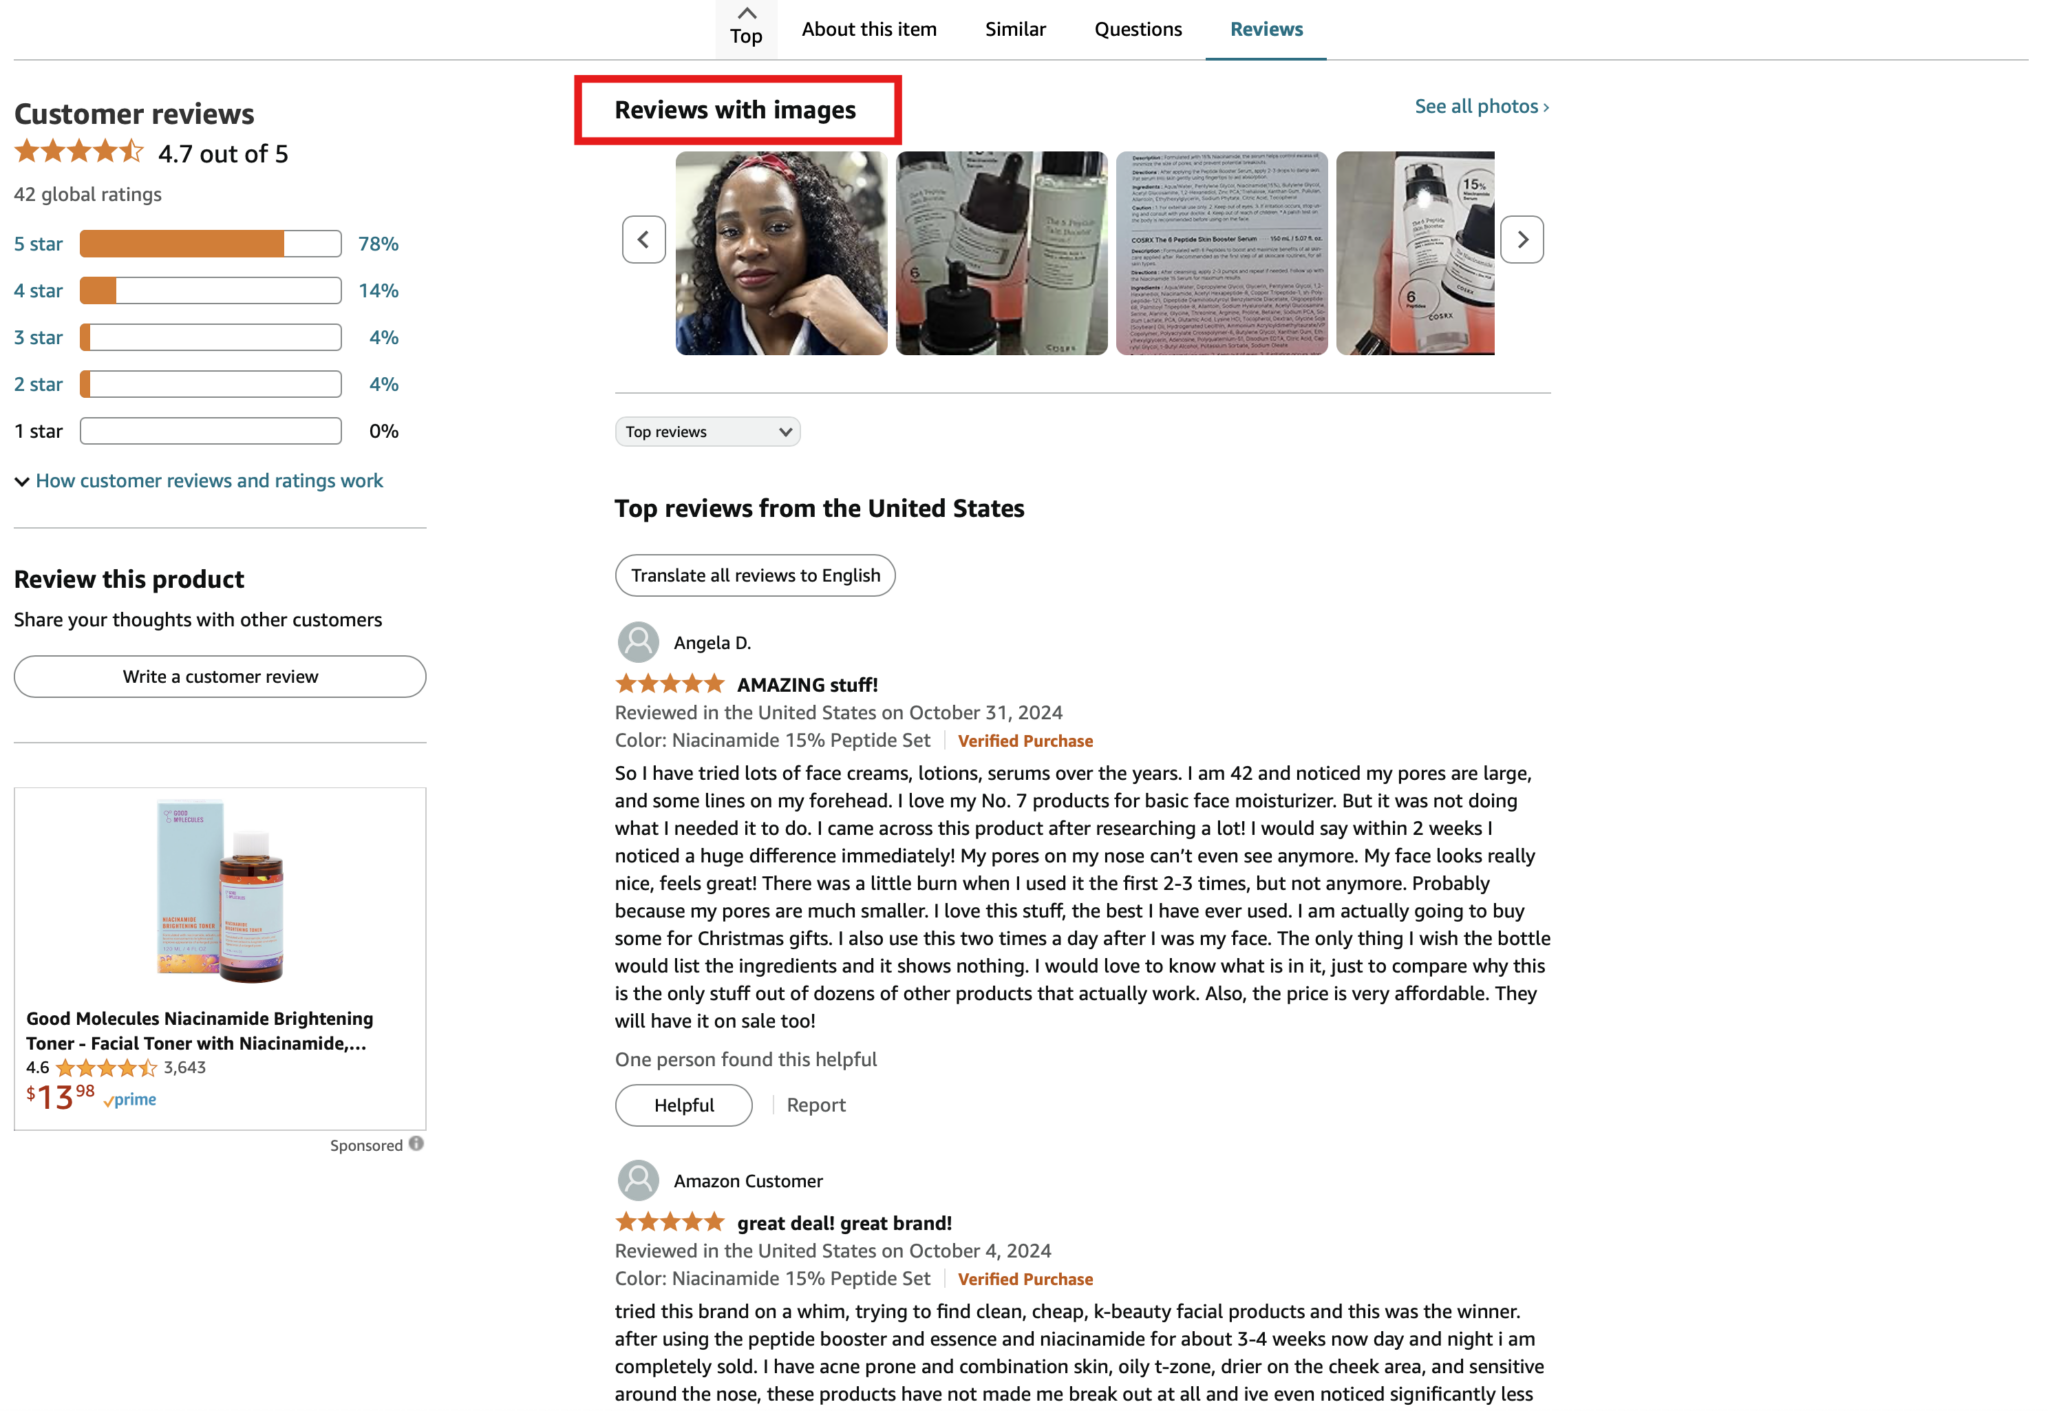
    Promoting your product doesn’t have to be restricted to just textual content in Amazon product description sections. You can use other multimedia assets of high quality. These include images, videos, brochure images, etc. Every content asset must aim to educate shoppers on why your product should be their number one choice. For example, look at this detailed product description for the viral K-Beauty product COSRX Mucin Essence.

    Product Description with Images Optimized for Amazon SEO

    Moreover, images can help attract more attention span from visitors, thereby increasing the probability of purchases.

    5. Strengthen the Backend Keywords As Well

    Amazon also supports hidden backend keywords that sellers add to their product listings. They help add more relevance to products similar to meta descriptions and titles in traditional SEO for search engines like Google. A typical backend keyword may comprise synonyms, misspelled keywords, textual variations, etc. However, knowing how to pick the right ones is crucial. By analyzing your keyword rankings against competitors and higher-ranking product results in search, the platform can help you consistently optimize your content backend to help grow visibility.

    6. Focus on Reviews and Ratings

    Reviews and ratings on product pages are key insights that help customers with their purchasing decisions. So, it is natural for brands to keep a close eye on how their products are faring in this regard. Reviews and ratings are a direct indication of the trustworthiness of your product. When previous buyers rate you high and leave favorable reviews on your product, it will directly promote trust and help you secure a better rapport with new customers.

    Reviews with Videos and Images Optimized for Amazon SEO
    Requesting reviews or leveraging user generated reviews and ratings to optimize Amazon SEO

    This upfront advantage can help boost sales conversions better. Leveraging solutions like DataWeave can help you understand the sentiments that customers have for your products by intelligently analyzing reviews and ratings.

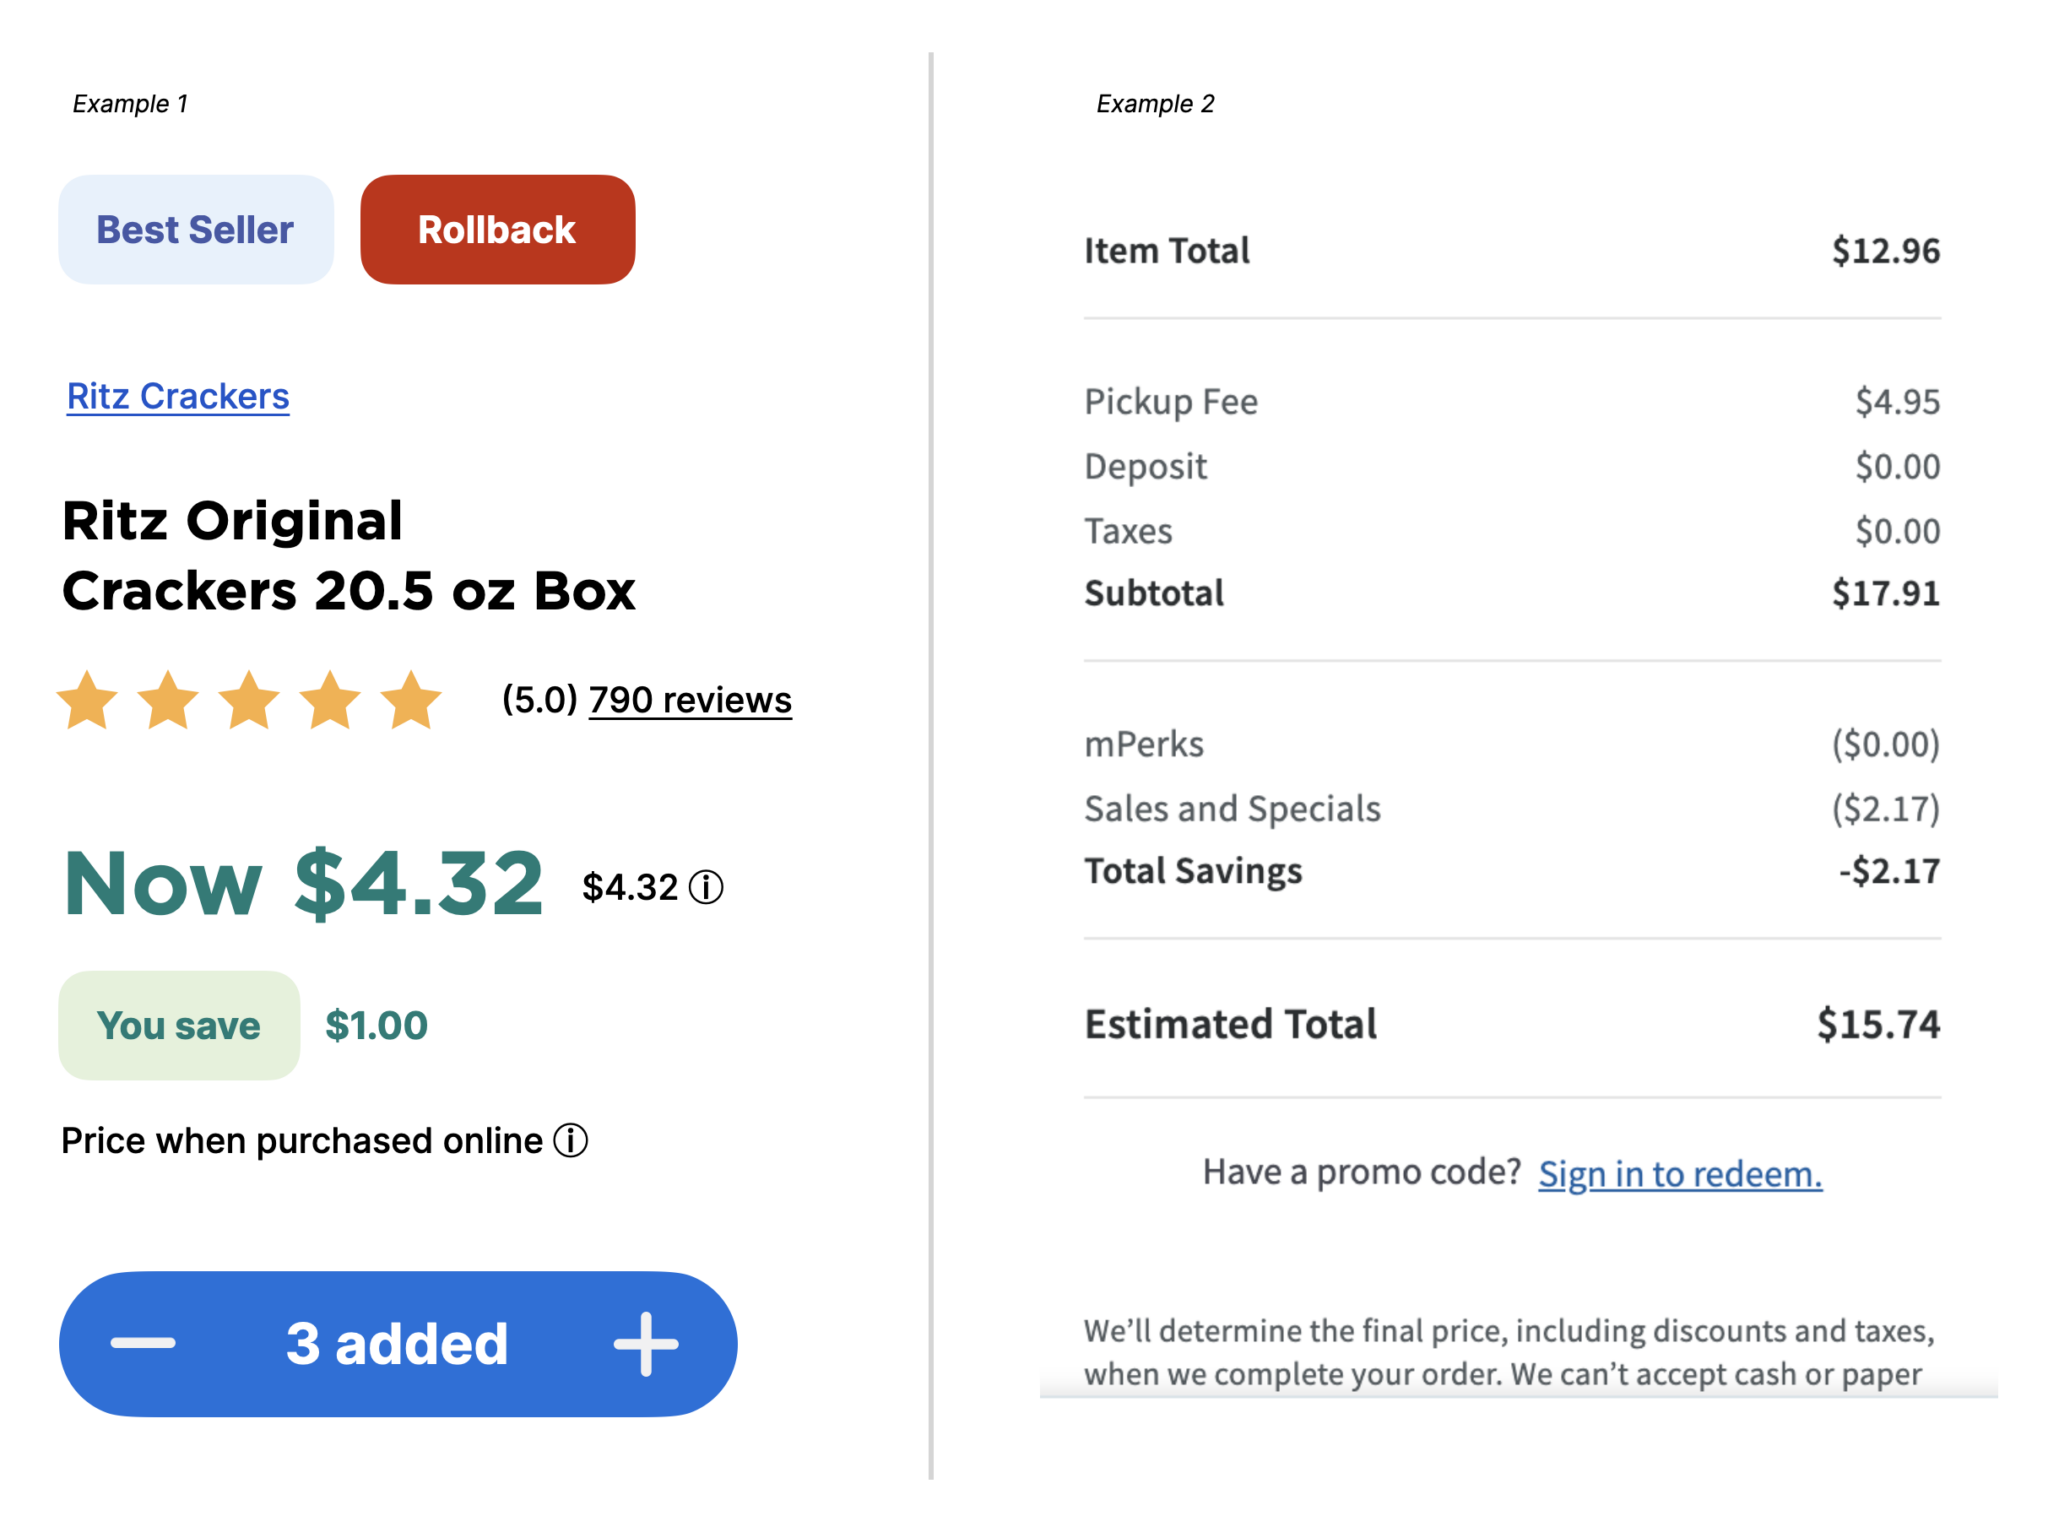
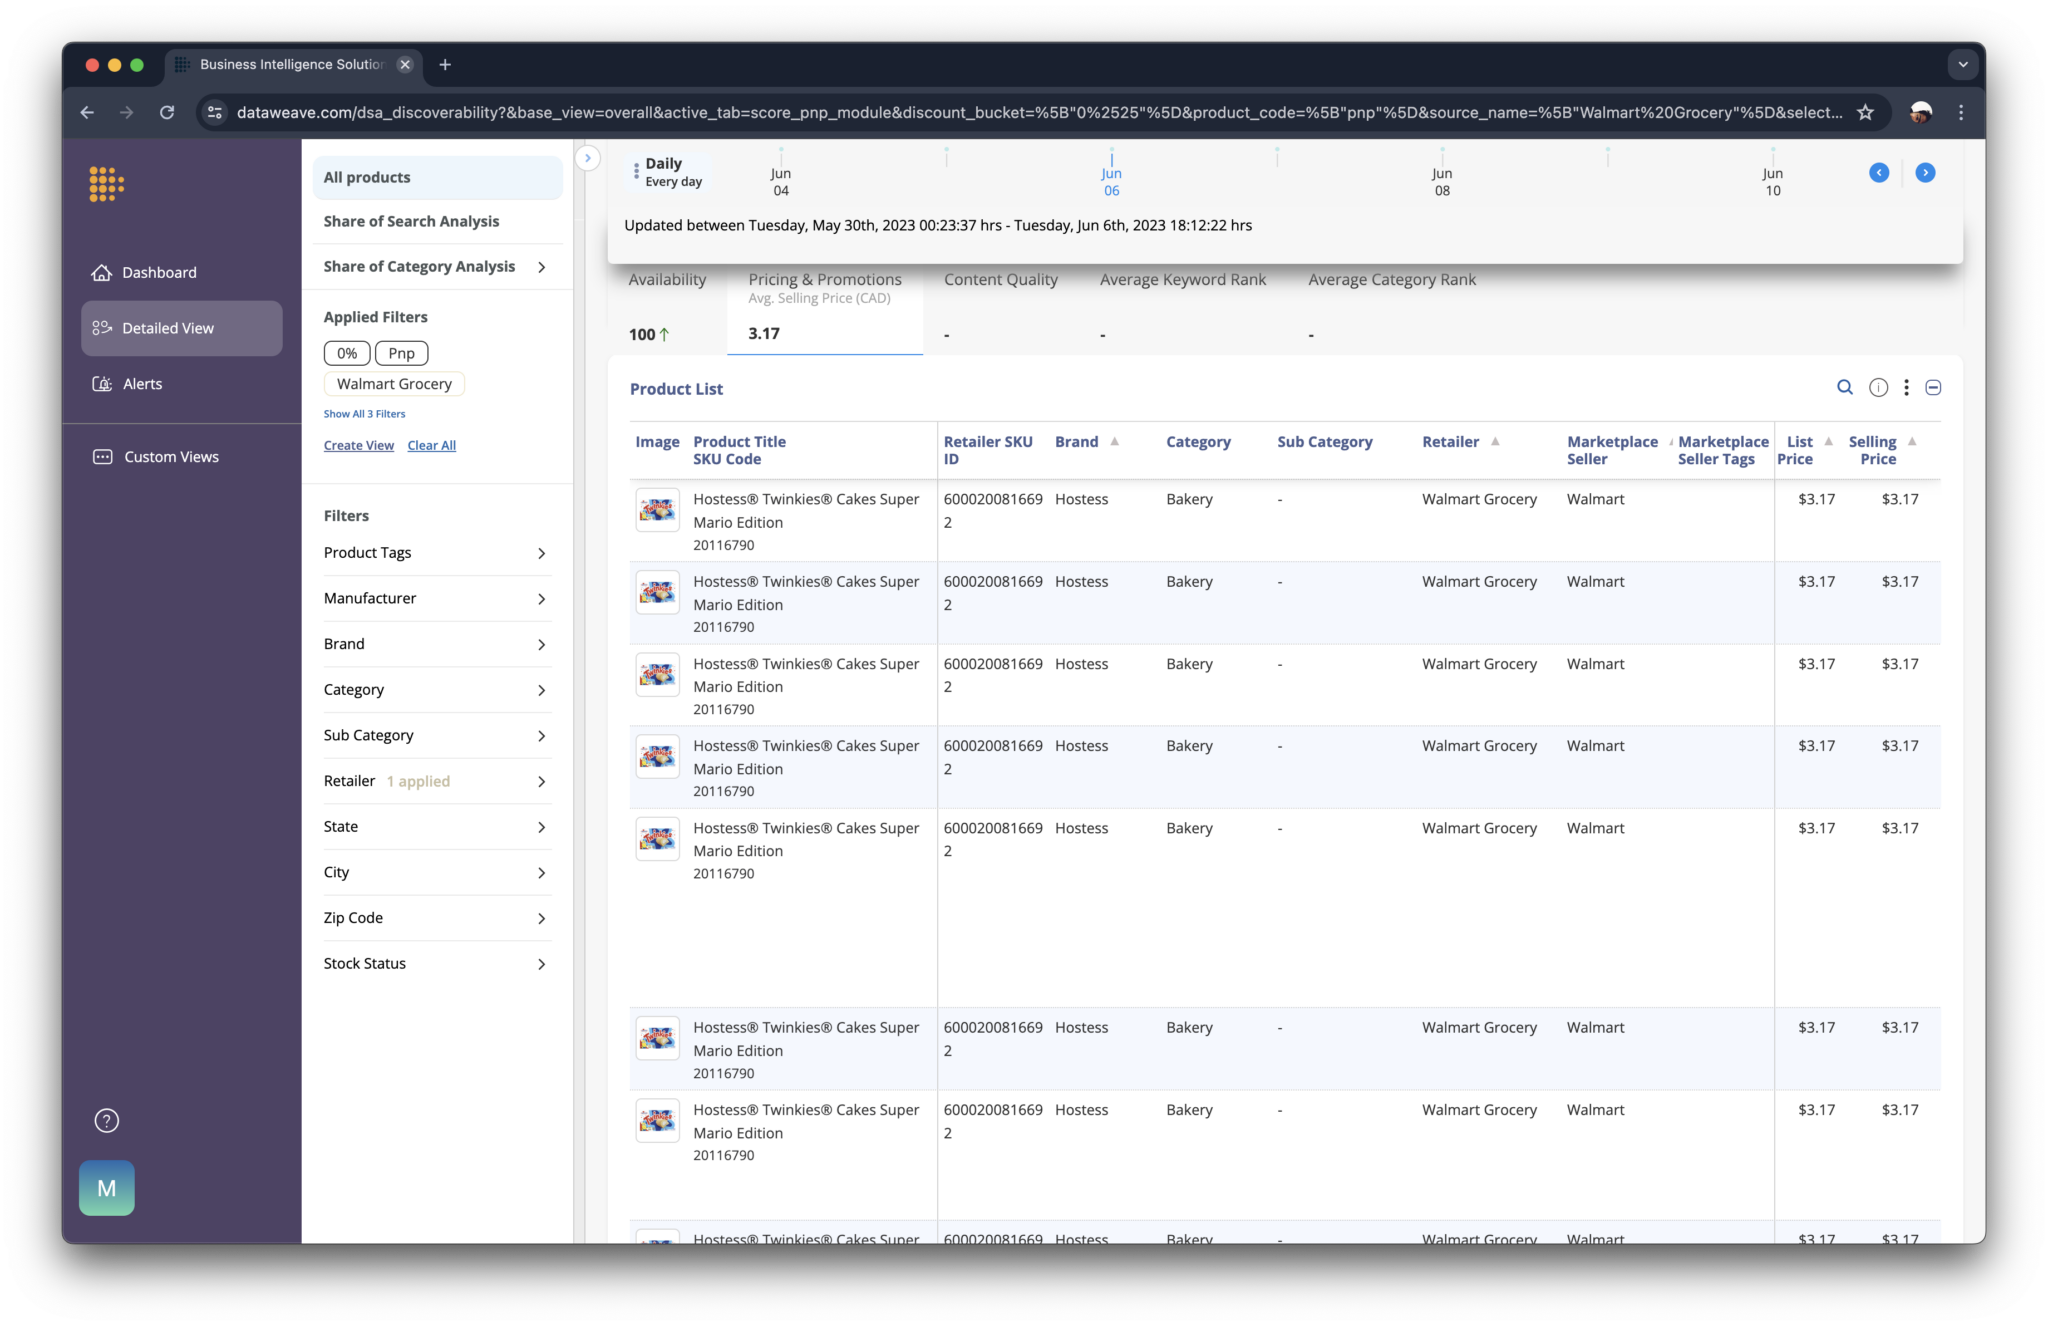
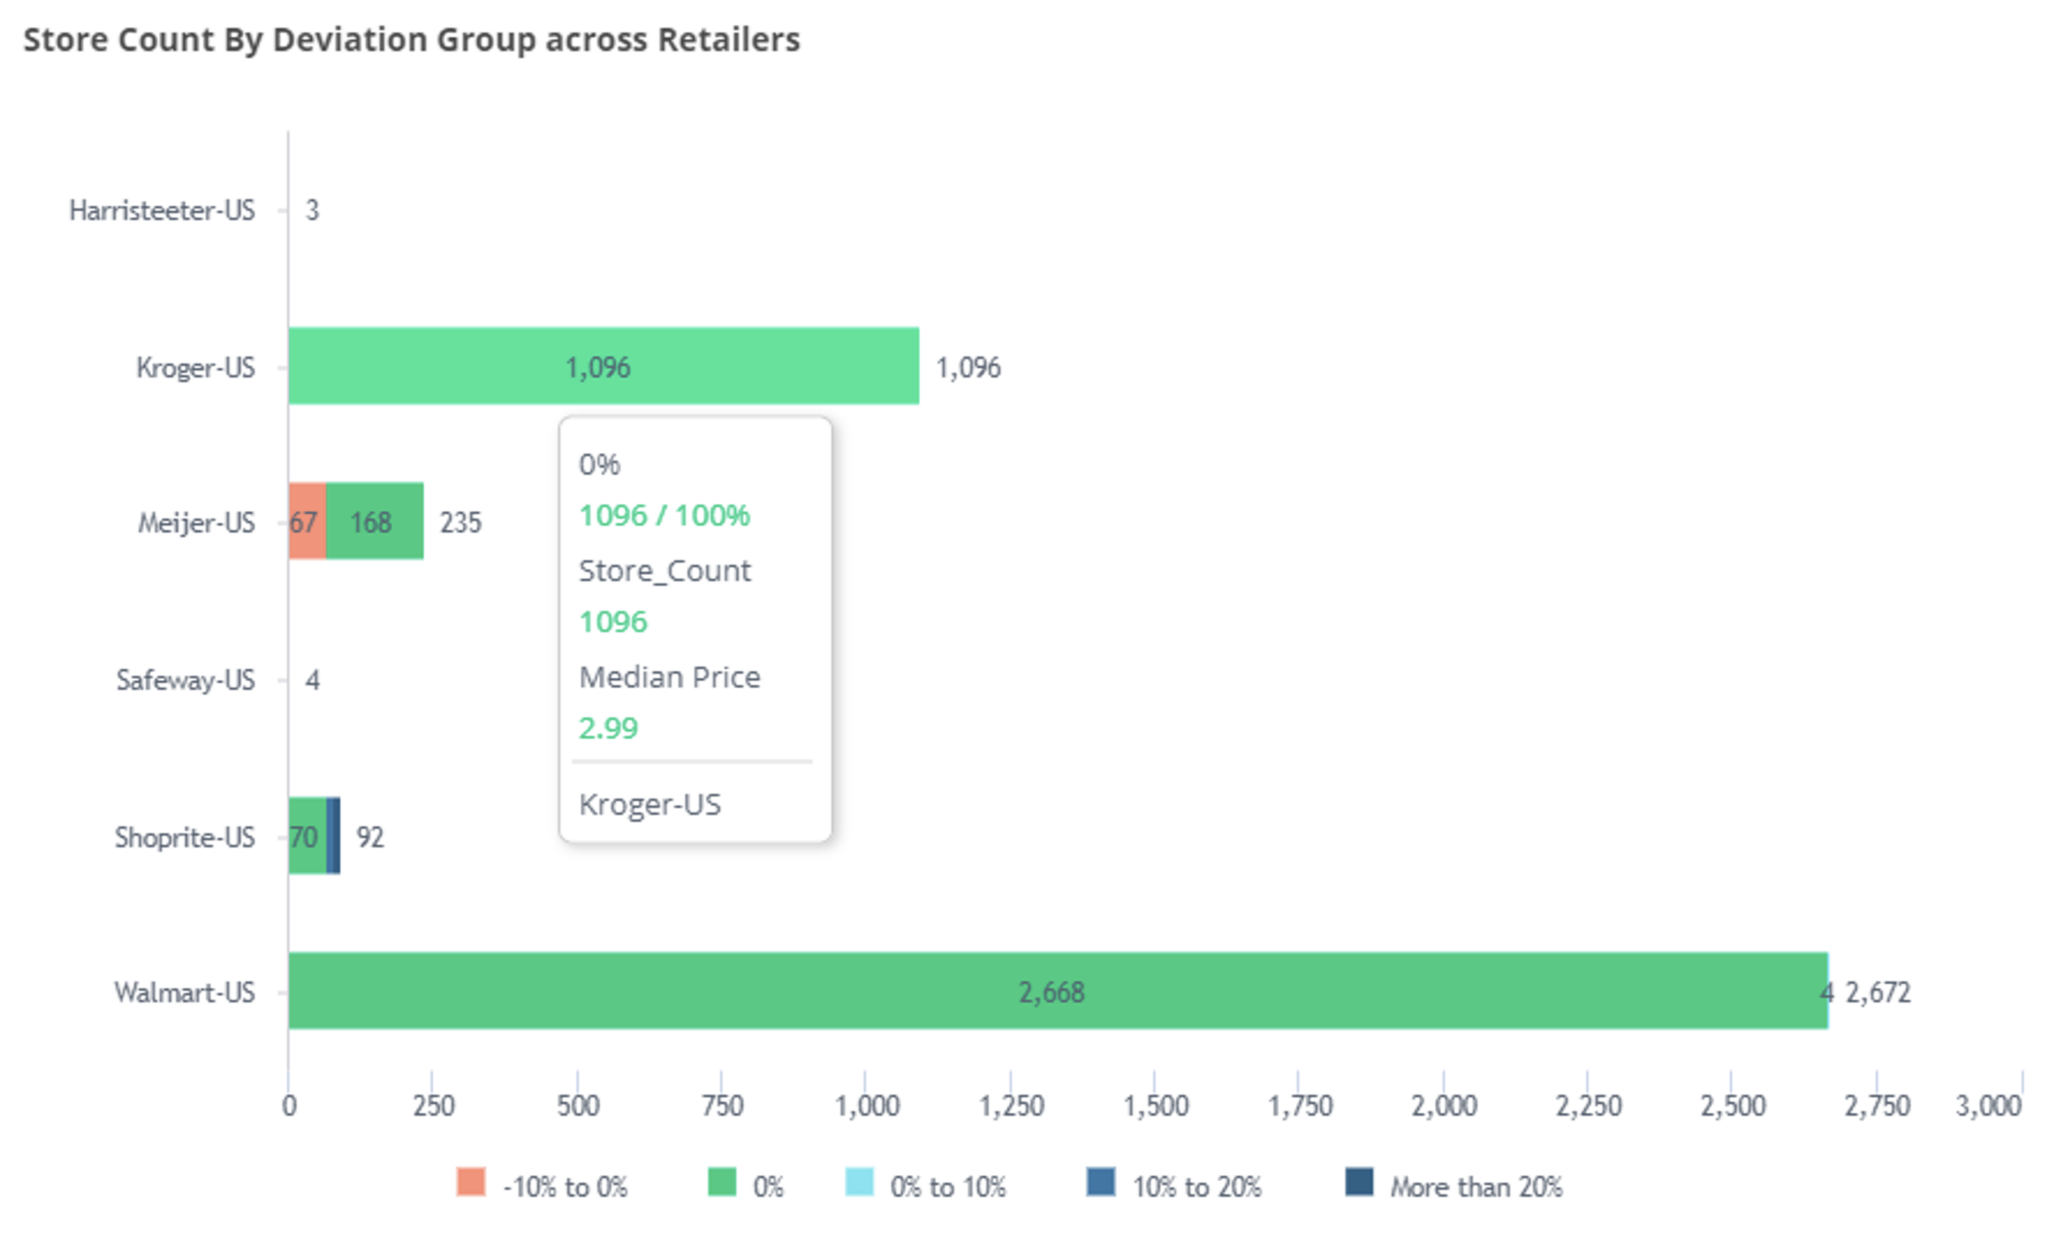
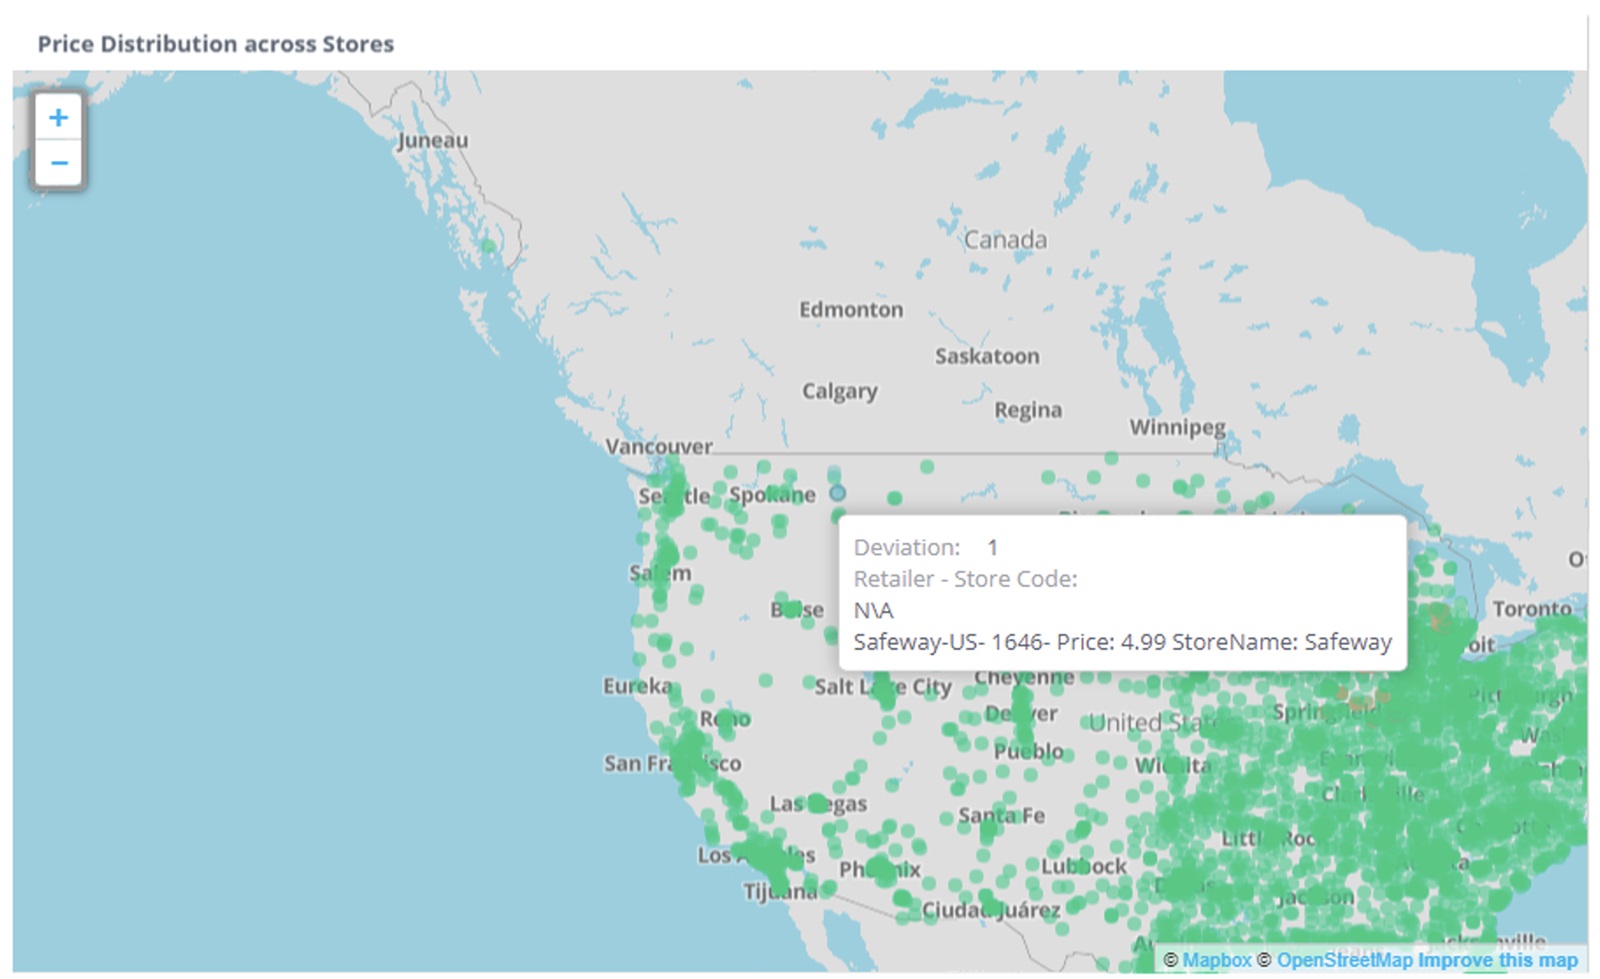
    7. Implement Competitive Pricing Strategies

    The goal of most customers when shopping online is to get their desired product at the most affordable prices. The eCommerce price wars every year are growing in scale today and getting your product pricing right is crucial for sales. However, there is a need to gain comprehensive insights into how your competitors are pricing their offerings and how the market responds to specific price ranges. Solutions like DataWeave help your brand access specific insights into pricing. By analyzing competitor pricing, you can create a winning price model that is sustainable for your brand and favorable for target customers.

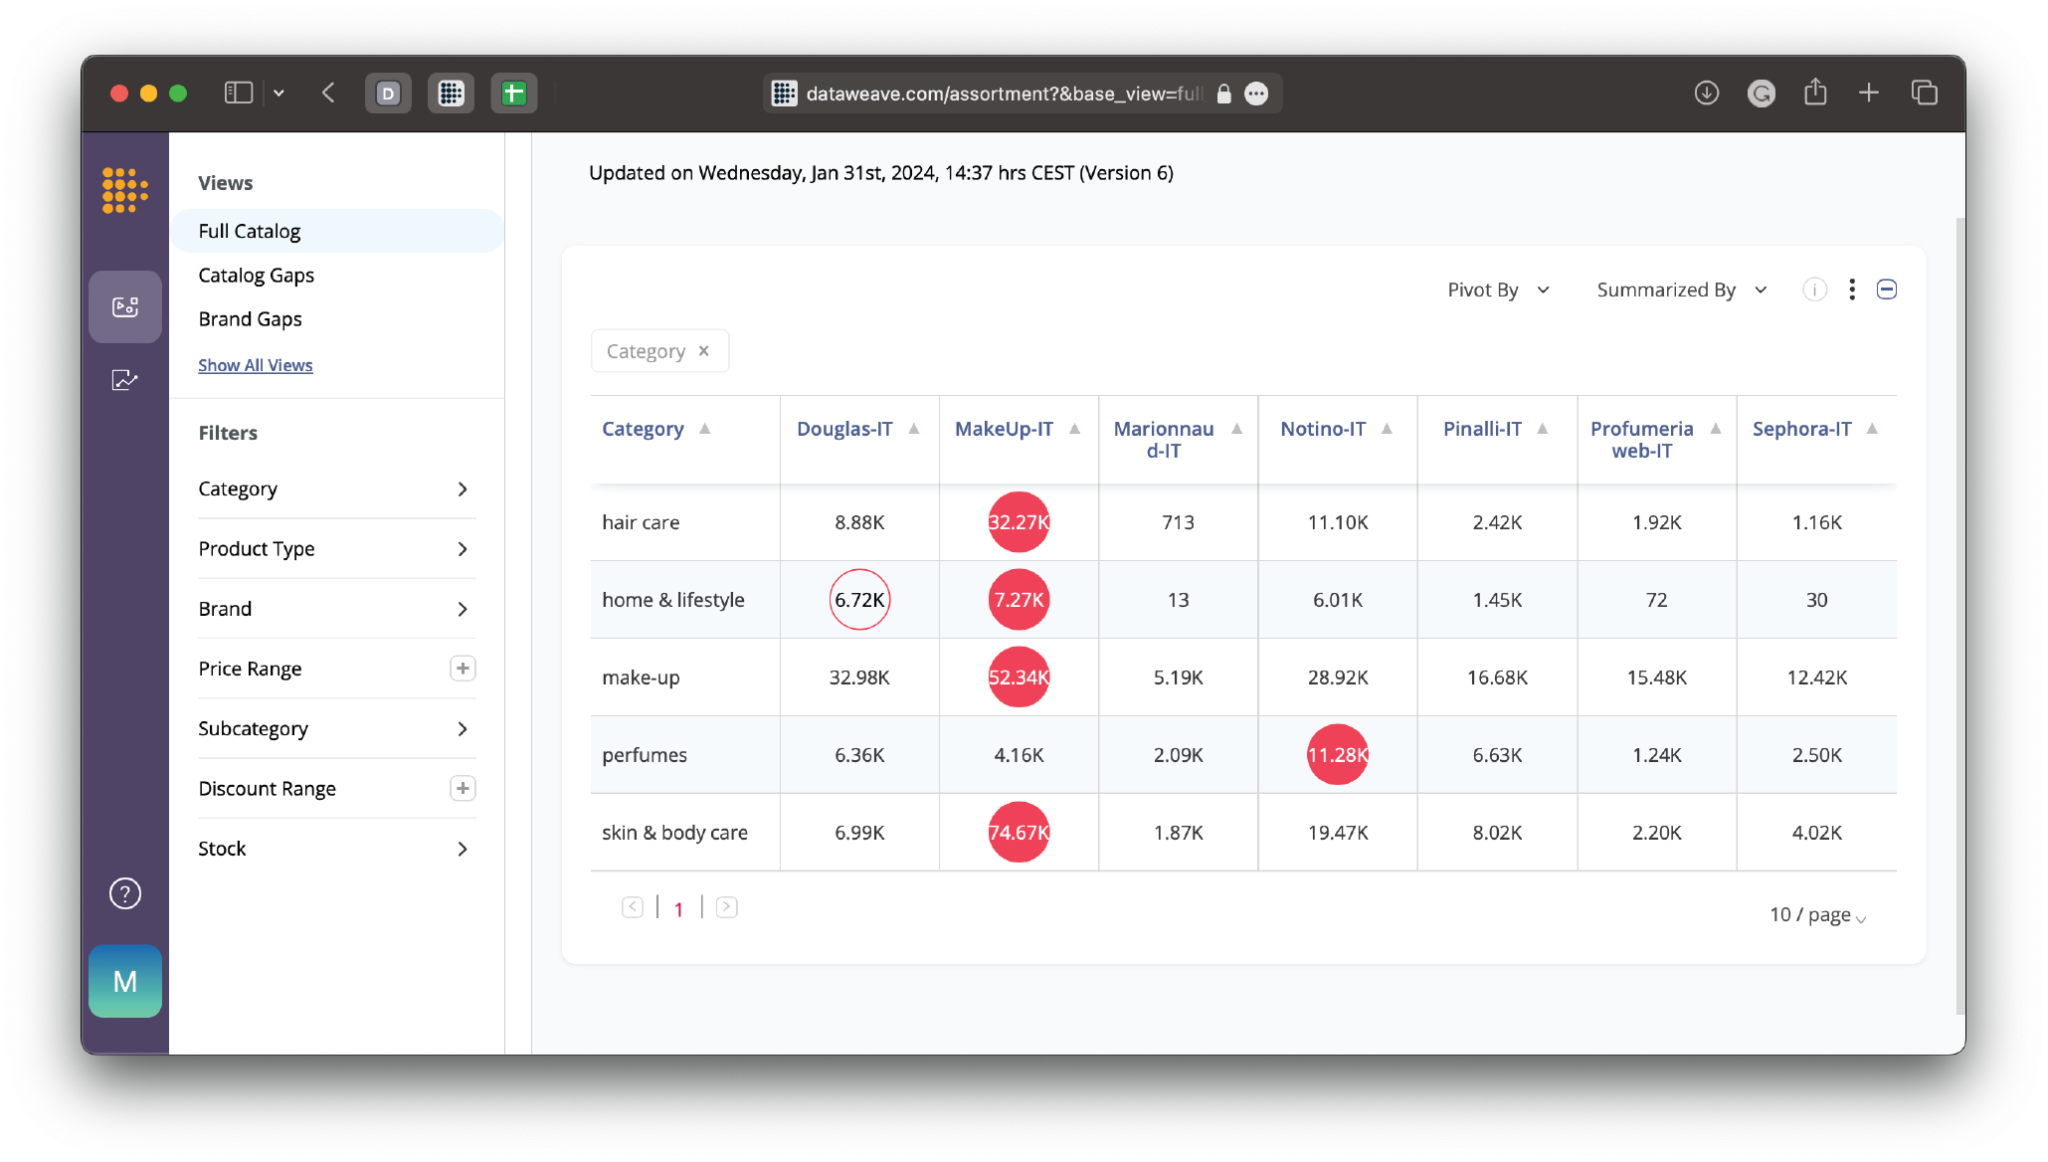
    8. Track Share of Search

    Content and other SEO activities will help improve your search rankings on Amazon. However, it is equally important to know how well your products are performing periodically against your competitors for the same set of specific keyword searches. You need to understand the share of search that your products are achieving to formulate improvement strategies. DataWeave’s Digital Shelf Analytics solution provides share of search insights helping you uncover deep knowledge on your discoverability on Amazon (and other marketplaces) for your vital search keywords.

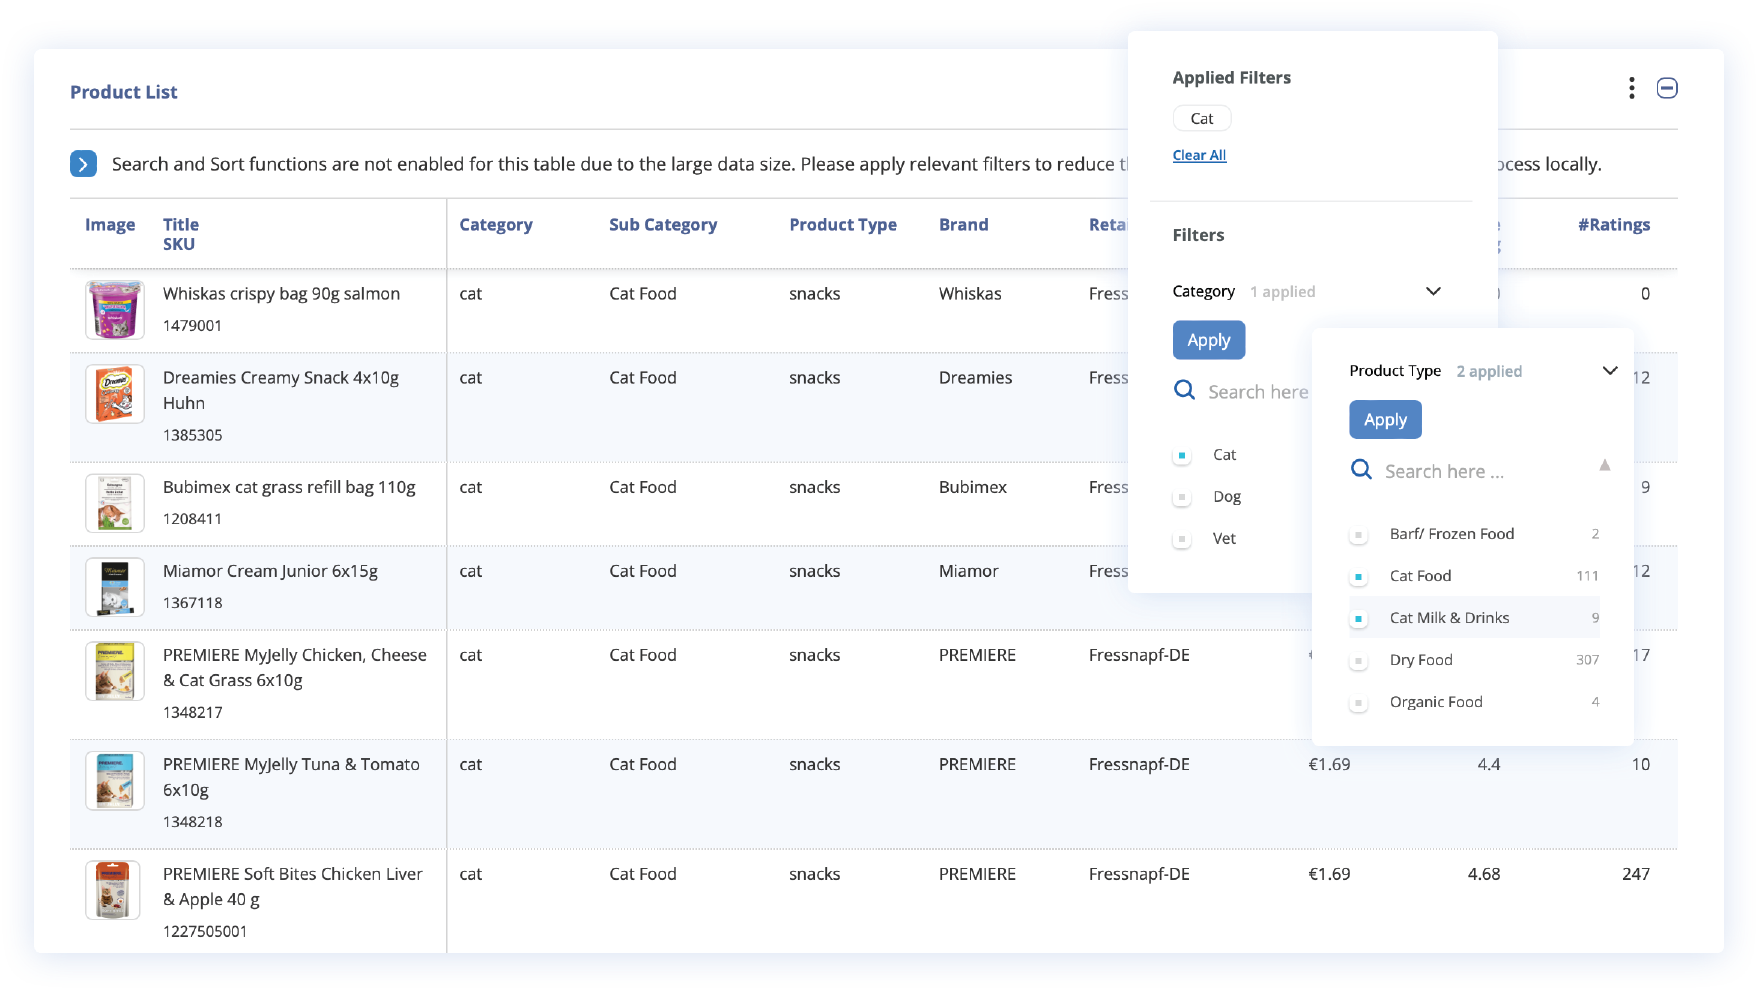
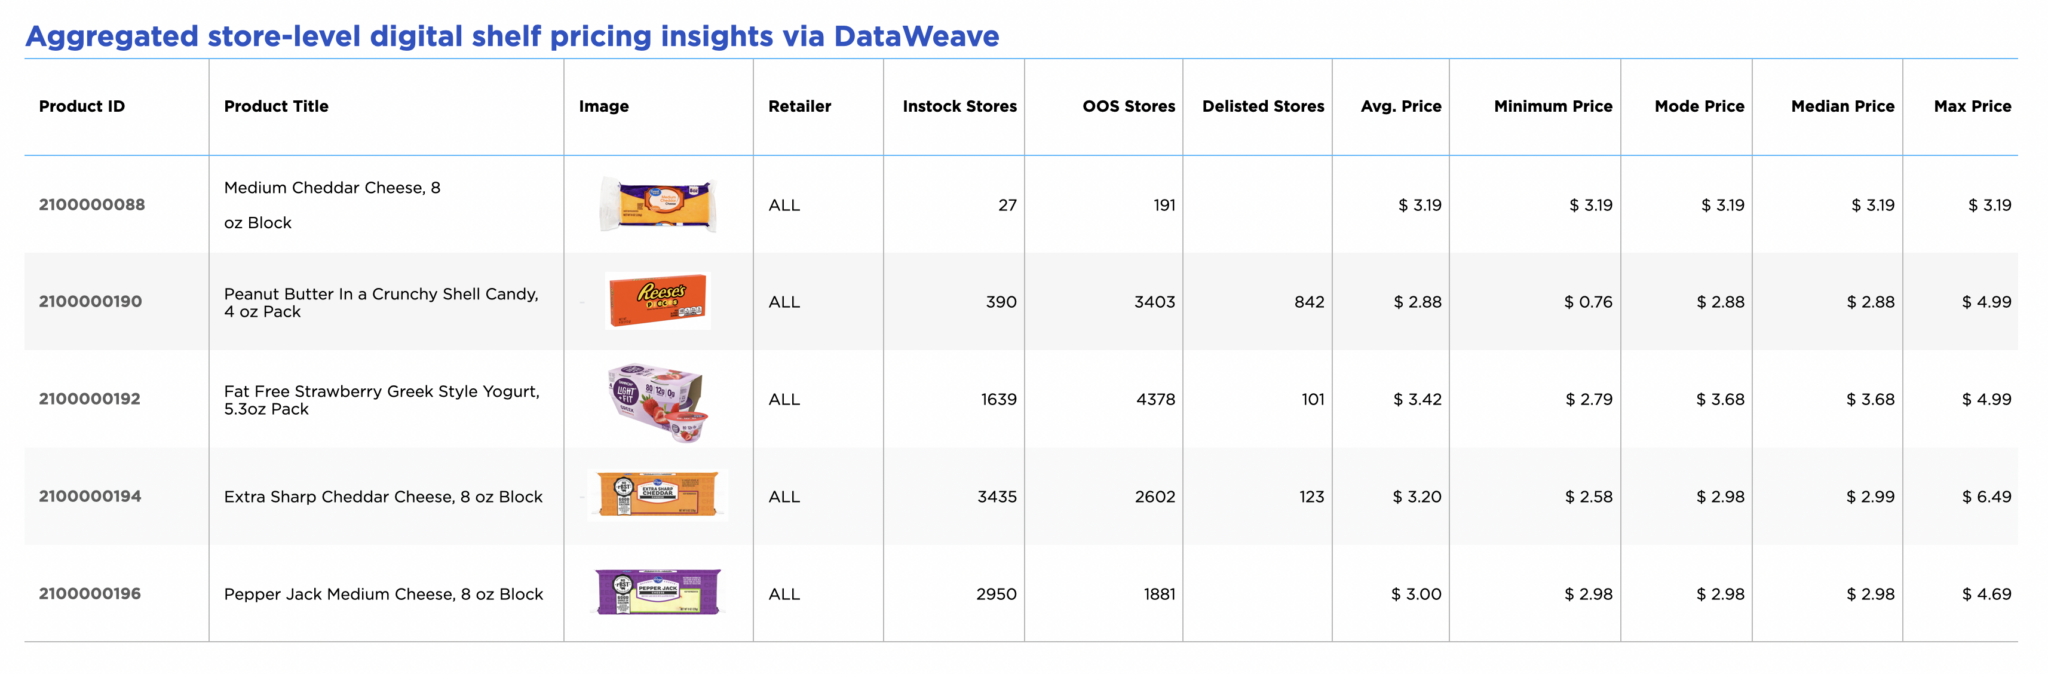
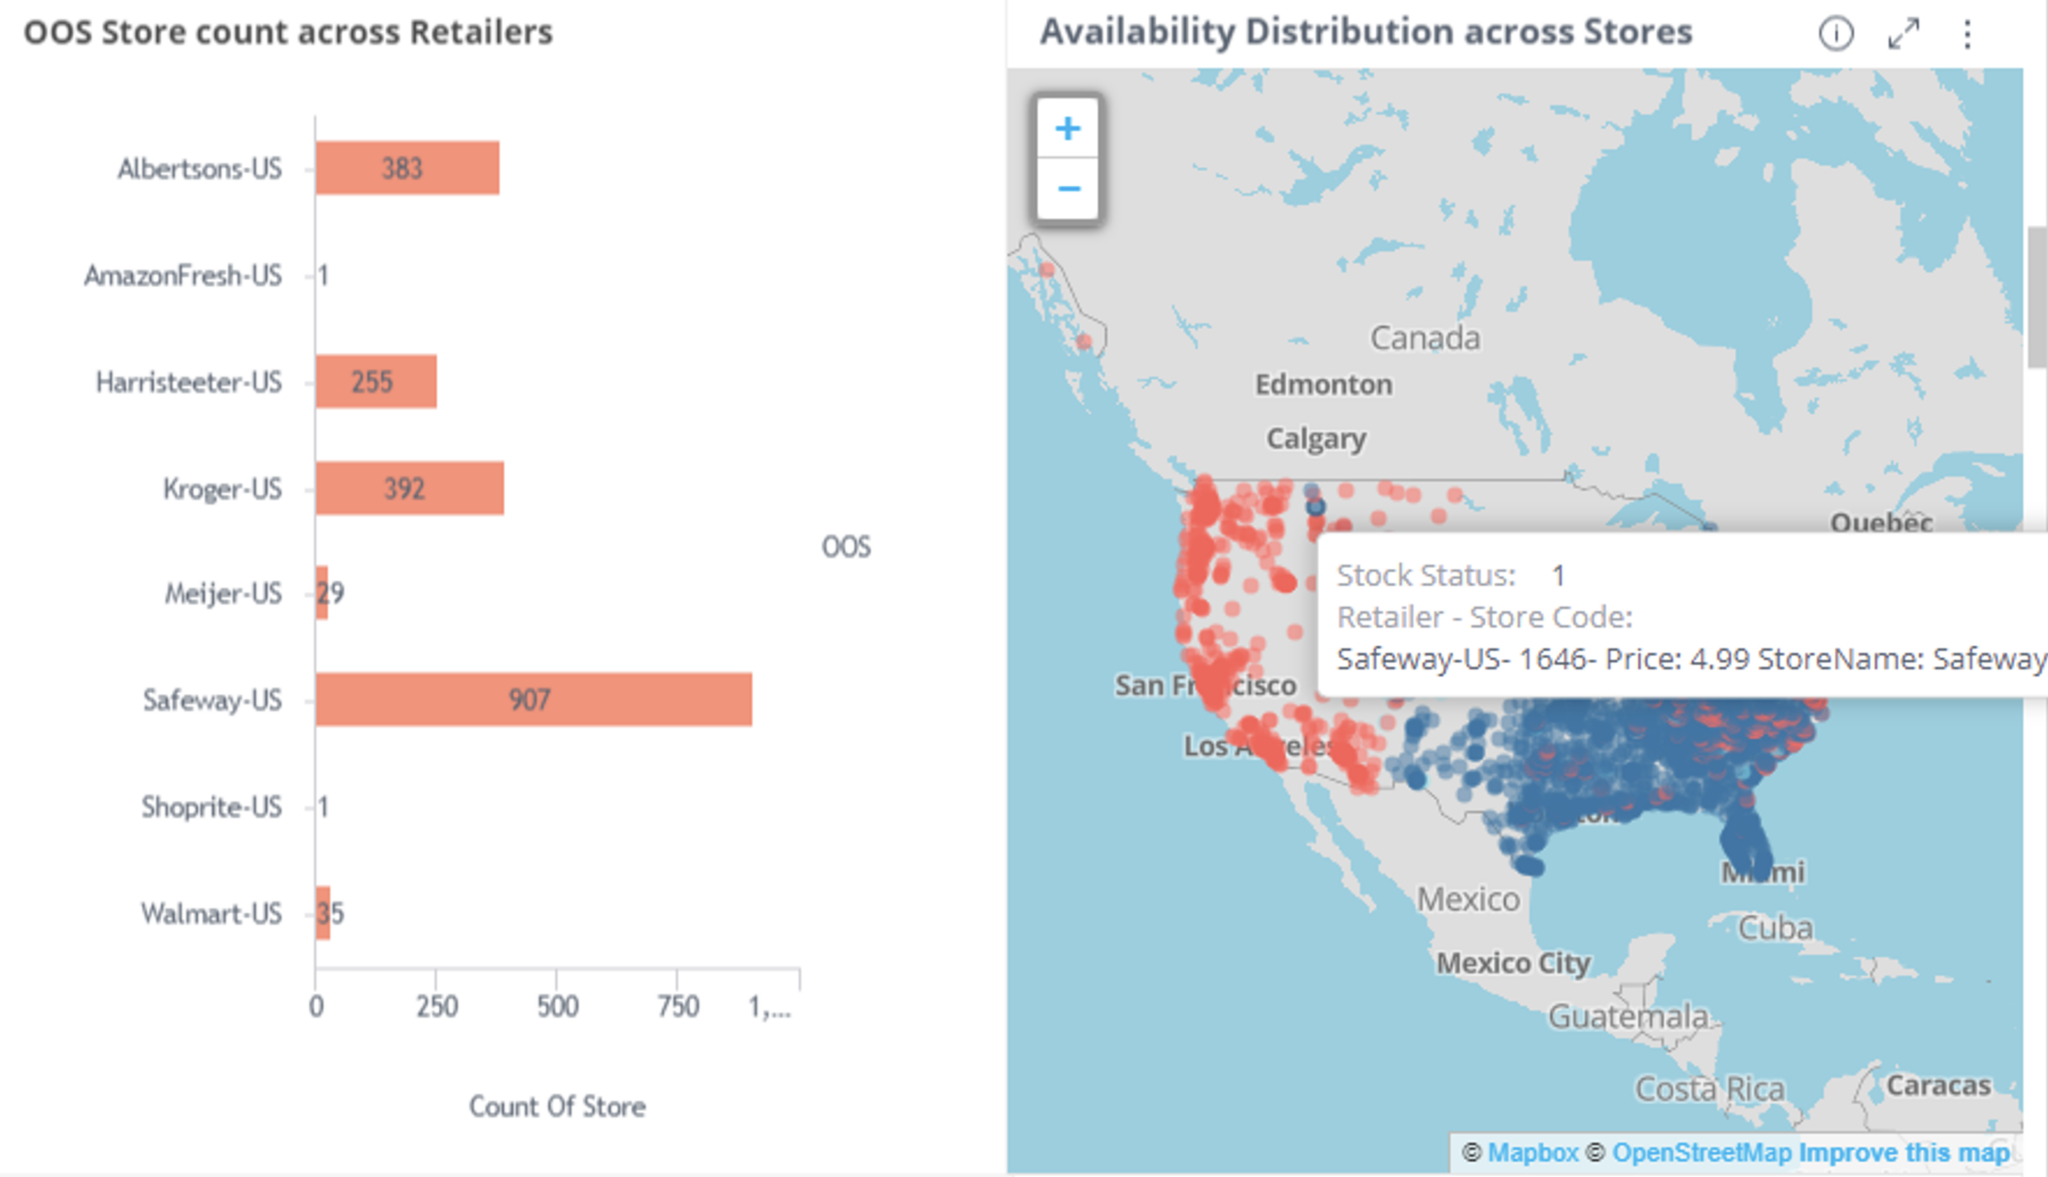
    9. Ensure Stock Availability

    To achieve better ranking results, brands need to ensure that the relevant products matching the search keywords are available for quick delivery at the desired ZIP codes where users are more likely to search and order them. Out-of-stock items seldom show up high on search results. Certain products, especially if they’re popular, can get stocked out frequently in certain locations. Keeping a close eye on your stock availability across the map can help minimize these scenarios.

    10. Optimize Your Brand Presence

    While optimizing content and other key areas within the Amazon webpage for your product is critical, there are other avenues to help boost search rankings. One such option includes registering in the Amazon Brand Registry, which provides more beneficial features like protection against counterfeits and ensuring that your brand page is optimized according to Amazon storefront standards.

    The Bottom Line

    Winning the top spot in Amazon search ranking is crucial for brands that aim to capitalize on online sales revenue to grow their business. Knowing your workaround for Amazon’s proprietary SEO frameworks and algorithms is the first step to succeeding. The key element of success is your ability to gain granular insights into the areas we covered in this blog post such as competitor prices, sentiments of customers, market preferences, and content optimization requirements.

    This is where DataWeave’s Digital Shelf Analytics solution becomes the biggest asset for your eCommerce business. Contact us to explore how we can empower your business to build the most visible and discoverable Amazon storefront that guarantees higher search rankings and ultimately increased sales. Talk to us for a demo today.

  • Why Strategic Competitive Insights Are Key to Optimizing Your Product Assortment

    Why Strategic Competitive Insights Are Key to Optimizing Your Product Assortment

    For retailers, the breadth and relevance of their product assortment are critical for success. Amid a crowded market filled with countless products clamoring for consumer attention, retailers must find innovative ways to distinguish themselves. While pricing undeniably impacts purchasing decisions, the diversity and distinctiveness of a retailer’s product range can provide a crucial competitive advantage.

    Creating an attractive and profitable assortment that resonates with your target audience requires more than intuition; it demands deep insights into both your own and your competitors’ offerings. A well-curated assortment aligned with current trends can drive higher conversions and foster customer loyalty. However, achieving this perfect balance is a formidable challenge without the right insights.

    This is where a data-driven strategy becomes essential, enabling you to curate a product mix that captivates and converts.

    However, retailers often encounter significant challenges when attempting to strategically plan their assortments:

    • Limited Competitive Insights: Gaining a clear understanding of your competitors’ assortment strengths and weaknesses across various categories is challenging. Without this visibility, it’s difficult to know where you have an edge or where you might be falling behind.
    • Tracking Demand Patterns: Identifying top-sellers and monitoring shifts in consumer demand can be a struggle. Without the ability to easily detect trends or changes in demand, you risk missing opportunities to stock trending items.

    Attempting to navigate these challenges manually is not only arduous but also susceptible to substantial errors.

    How Assortment Analytics Solutions Help

    The ideal Assortment Analytics solution must offer a fact-based approach to:

    • Identify Strengths and Weaknesses: Understand how your assortment measures up against the competition.
    • Stay Trend-Responsive: Keep your product mix fresh and aligned with the latest consumer trends.
    • Boost Conversions: Create a relatively unique, customer-focused assortment that enhances conversions.

    Many retailers attempt to analyze competitor assortments using manual, in-house methods, which inevitably leads to significant blind spots:

    • Variations in product classifications and taxonomies across competitors make meaningful comparisons challenging.
    • Gathering complete and accurate data across a vast competitive landscape is difficult.
    • Inconsistent titles and descriptions hinder reliable product matching without AI assistance.
    • Capturing and comparing detailed product attributes efficiently is nearly impossible without advanced tools.

    To overcome these challenges, retailers need a scalable, accurate Assortment Analysis solution designed specifically for the complexities of modern retail needs.

    DataWeave’s Assortment Analytics Solution

    DataWeave addresses these challenges by providing retailers with a robust platform to gain actionable insights into their product assortments and the competitive landscape. Leveraging advanced analytics and AI-driven algorithms, Assortment Analytics empowers retailers to make informed assortment management decisions, optimize their product offerings, and stay competitive.

    Armed with our insights, retailers can lead with their strengths and stock unique and in-demand products in their assortment. Further, by recognizing the strengths in their product catalog, they can craft effective pricing strategies and optimize their logistics, creating a more competitive and appealing shopping experience for their customers. Here are a few capabilities of DataWeave’s solution:

    In-Depth Competitive Analysis Across Retailers

    The solution offers detailed competitive analysis, revealing insights into competitors’ assortments. It maps competitor products to a common taxonomy, making comparisons accurate and meaningful. Retailers can visualize assortments at granular levels like category, sub-category, and product type.

    The data for these insights is collected at configurable intervals, typically monthly or quarterly, and is consumed not only via dashboard summaries but also raw data files to enable in-depth analysis. Retailers have the flexibility to choose specific competitors, brands, products, and categories for tracking, allowing for a tailored and strategic approach to assortment optimization.

    Brand and Category Views to Assess Your Portfolio

    The solution provides a comprehensive evaluation of your product assortment through brand and category views. In brand views, your portfolio is assessed against competitors at the brand level, highlighting:

    • Newly Introduced Brands: Insights into recently introduced brands, revealing shifts in the brand landscape.
    • Absence or Limited Presence: Identification of brands lacking representation or with minimal presence compared to competitors, indicating areas for improvement.
    • Strong Presence and Exclusivity: Recognition of brands where you excel, including exclusive offerings, showcasing your competitive edge.

    Identifying Top-Selling Competitive Products To Boost Assortment Strategy

    Beyond just comparing assortment numbers, the DataWeave solution surfaces insights into which competitor products are actually performing well. It equips category and assortment managers with indicators that assess competitor products in terms of their popularity and shelf velocity.

    It analyzes metrics like pricing fluctuations, ratings, customer reviews, search rankings, and replenishment rates to pinpoint hot sellers you may want to stock. With these insights, merchandizing managers can pinpoint top-selling products among competitors, enabling informed decisions to enhance their assortment in comparison.

    Sophisticated Attribute Tagging and Analysis

    Using AI-powered attribute tagging, the solution simplifies granular product analysis within specific categories. An Apparel retailer, for instance, can filter the data to compare assortments based on attributes like material, pattern, color, etc.

    Retailers can select attributes relevant to their products and gain detailed insights. These custom filter attributes dynamically populate the panel, facilitating targeted data exploration. Category and merchandizing managers can delve into critical details swiftly, enabling strategic decision-making and comprehensive competitive analysis within their categories.

    You can capitalize on opportunities by stocking in-demand, on-trend items and address assortment gaps quickly. At the same time, you can double down on your strengths by enhancing your exclusive or top-performing product sets.

    In summary, DataWeave’s Assortment Analytics solution provides an invaluable competitive edge. The insights enable evidence-based decisions to attract more customers, encourage bigger baskets, and maximize the value of every assortment choice.

    To learn more, read our detailed product guide here or get on a exploratory call with one of our experts today!

  • How Monitoring and Analyzing  End-User Prices can Help Retailers and Brands Gain a Competitive Edge

    How Monitoring and Analyzing  End-User Prices can Help Retailers and Brands Gain a Competitive Edge

    Retailers and brands are constantly engaged in a fierce battle over prices and discounts. Whether it’s major events like Amazon Prime Day, brand-led sales, or everyday price wars, they depend on pricing intelligence and digital shelf analytics to fine-tune their strategies. With a variety of offers such as sales, promotions, and bundles, determining the actual cost to the customer becomes a complex task. The price set by the brand, the retailer’s offer, and the final amount paid by the customer often vary significantly.

    In their analysis, retailers and brands frequently focus on the listed price or the final sale price, overlooking a critical factor: the “end-user price.” This includes all discounts, taxes, and shipping costs, providing a more accurate picture of what customers are truly willing to pay at checkout.

    Grasping this end-user price is vital for both retailers and brands. For retailers, it helps them stay competitive and refine their promotional strategies. For brands, it offers insights into competitive positioning, net revenue management, and shaping customer price perception.

    However, emphasizing the end-user price is challenging, as it involves comprehending all the intricate elements of pricing.

    How end-user pricing is calculated

    The list price, also known as the manufacturer’s recommended retail price (MSRP), is the initial price set by the brand. This may not always be displayed on marketplaces, especially in categories like grocery. The selling price, on the other hand, is the amount at which a retailer offers the product, often reduced from the list price. The end-user price is the actual amount the customer pays at checkout, which includes taxes, promotions, and other factors that affect the final cost.

    The process involves 3 key stages:

    Step 1: Identifying and categorizing promotional offers

    The first critical step in calculating end-user pricing is to identify and categorize the various promotional offers available for a given product that can reduce the final amount paid by the consumer. These promotions span a wide range of types:

    • Bank Offers: Involving discounts or cash back incentives when paying with specific bank credit or debit cards. For instance, a customer may receive 10% cashback on their purchase by using a specific bank’s card.
    • Bundled Deals: Combining multiple products or services at a discounted bundle price. A common example is a smartphone bundle including the phone itself, a protective case, and earphones at a reduced total cost.
    • Promo Codes/Coupons: Customers can enter promo codes or coupons during checkout to unlock special discounted prices or percentage-off offers, like 20% off a hotel booking, or even a special brand discount personalized for their needs (think loyalty offers and in-app promotions).
    • Shipping Offers: These include free shipping or reduced shipping fees for certain products or orders, such as free delivery on orders above a set amount.
    • TPRs (Temporary Price Reductions): TPRs play a significant role in the strategies of most retailers. Brands and retailers use them to encourage shoppers to purchase more of a product or to try a new product they wouldn’t usually buy. A TPR involves reducing the price of a product by more than 5% from its regular shelf price.

    By accurately identifying and classifying each type of promotion available, brands can then calculate the potential end-user pricing points.

    Step 2: Accounting for location and fulfilment nuances (delivery, in-store pickup) that impact final pricing

    Product pricing and promotional offers can vary based on the consumer’s location or ZIP code. Additionally, customers may opt for different fulfilment modes like delivery, shipping, or in-store pickup, which can further impact the final cost. Accurately calculating the end-user price necessitates considering these location-based pricing nuances as well as the chosen fulfilment method.

    In the example below, the selling price is $4.32 for one retailer (on the left in the image) after a discount for online purchase. In another case with Meijer, the item total shows $17.91, but the consumer ends up paying $15.74 after taxes and fees are applied (on the right in the image).

    Step 3: Applying each eligible promotion or offer to the selling price to determine potential end-user price points

    With the various promotional offers and discounts categorized in the previous steps, retailers and brands can now apply each eligible promotion to the product’s selling price. This involves deducting percentages for bank cashback, implementing bundled pricing, applying coupon code discounts, and incorporating shipping promotions.

    For retailers, this step allows them to calculate their true effective selling price to customers after all discounts and promotions. They can then compare this end-user price against competitors to ensure they remain competitively priced.

    For brands, by systematically layering every applicable offer onto the baseline selling price, they can accurately calculate the multiple potential end-user price points a customer may pay at checkout for their products across different retailers and regions.

    Why the end-user price matters

    Optimizing pricing strategies using the end-user price can benefit retailers and brands in several ways:

    • Price Competitiveness: By monitoring end-user pricing, retailers can adjust for discounts and promotional offers to attract customers, while brands can refine their pricing models to stay ahead in the market.
    • Customer Acquisition and Loyalty: Offers, promotions, and discounts directly impact the final price paid by customers, playing a crucial role in attracting new customers and retaining existing ones. For example, Walmart’s competitive pricing in groceries boosts customer loyalty and repeat purchases.
    • Consumer Perception: End-user pricing significantly shapes how consumers perceive both retailers and brands. Competitive pricing and promotional transparency enhance reputation and conversion rates. Amazon, for instance, is known for its competitive pricing and fast deliveries, which strengthen its consumer perception and satisfaction.
    • Sales Volumes: The final checkout price influences affordability and perceived value, directly affecting sales volumes. Both retailers and brands benefit from understanding this, as it guides consumer purchasing decisions and drives revenue streams.
    • Brand Perception: Consistent and transparent pricing enhances the perception of both the retailer and the brand. This not only strengthens the value proposition but also builds consumer trust and fosters long-term loyalty.

    While the listed and selling prices are readily available, calculating the true end-user price is quite complex. It involves meticulous tracking and application of various types of promotions, offers, location-based pricing nuances, and fulfillment costs – an uphill task without robust technological solutions.

    Track and Analyze end-user prices with DataWeave

    DataWeave’s end-user price tracking capability empowers retailers and brands with the insights and tools necessary to comprehend the complexities of pricing dynamics. For retailers, it offers the ability to monitor end-user pricing across various products and categories compared to competitors, ensuring competitiveness after all discounts and enabling optimization of promotional strategies. Brands benefit from informed pricing decisions, optimized strategies across retail channels, and a strengthened position within their industries.

    Our intuitive dashboard presents classified promotions and corresponding end-user prices across retailers, providing both retailers and brands with a transparent, comprehensive view of the end-user pricing landscape.

    Within the detailed product view of DataWeave’s dashboard, the Price and Promotions panel showcases diverse promotions available across different retailers for each product, along with the potential end-user price post-promotions.

    Harness the power of DataWeave’s sophisticated Pricing Intelligence and Digital Shelf Analytics to gain an accurate, real-time understanding of your end-user pricing dynamics. Make data-driven pricing decisions that resonate with customers and propel your brand toward sustained success.

    Find out how DataWeave can empower your eCommerce pricing strategy – get in touch with us today or write to us at contact@dataweave.com!

  • Why Localized, Store-Specific Pricing and Availability Insights is Critical for Consumer Brands

    Why Localized, Store-Specific Pricing and Availability Insights is Critical for Consumer Brands

    Brands are becoming increasingly proficient in monitoring and refining their presence on online marketplaces, utilizing Digital Shelf Analytics to gather and analyze data on their online performance. These tools offer invaluable insights into enhancing visibility, adjusting pricing strategies, and improving content quality on eCommerce sites.

    Yet, as the retail landscape shifts towards a more integrated omnichannel approach, it’s crucial for brands, particularly those in CPG, to apply similar strategies to their offline channels. For brands that count physical stores among their primary sales channels, gaining localized insights is key to boosting in-store sales performance.

    Collecting shelf data from offline channels presents more challenges than online. Traditional methods, such as physical store visits, often fall short in reliability, timeliness, scale, and level of coverage.

    However, the world of eCommerce provides a solution. As part of the effort to facilitate options like buy-online-pickup-in-store (BOPIS) for shoppers, major retailers make store-specific product details available online. Consumers often go online and select their nearest store to make purchases digitally before choosing a fulfillment option like picking up at the store or direct delivery. Aggregating this store-level information offers brands critical insights into pricing and inventory across a vast network of stores, enabling them to make informed decisions that improve pricing strategies and supply chain efficiency, thus minimizing stockouts in crucial markets.

    Further, as consumers increasingly seek flexibility in how they receive their purchases—be it through in-store pickup, delivery, or shipping—brands need to adeptly monitor pricing and availability for these different fulfilment options. Such granular insight empowers brands to adapt swiftly and maintain a competitive edge in today’s dynamic retail environment.

    Why does monitoring pricing and availability data across stores matter to brands?

    • Hyperlocal Competitive Strategy: This allows brands to adjust their pricing strategies based on regional competition. By understanding the local market, brands can decide whether to position themselves as cost leaders or premium offerings. In particular, this is indispensable for Net Revenue Management (NRM) teams.
    • Targeted Marketing Initiatives: Understanding regional price and availability enables brands to customize their marketing efforts for specific markets. By aligning their strategies with local demand trends and inventory levels, brands can more effectively engage their target audiences.
    • Efficient Inventory Management: By keeping a close eye on store-level data, brands can better manage their stock, ensuring high-demand products are readily available while minimizing the risk of overstocking or running out of stock.
    • Minimum Advertised Price (MAP) Monitoring: While brands cannot directly control retail pricing, staying updated on pricing trends helps them adjust their MAP to reflect the competitive landscape, consumer expectations, cost considerations, and regional differences. A strategic approach to MAP management supports brand competitiveness and profitability in a fluctuating market.

    DataWeave’s Digital Shelf Analytics solutions equip brands with the necessary data and insights to do all of the above.

    DataWeave’s Digital Shelf Analytics is location-aware

    DataWeave’s Digital Shelf Analytics platform stands out with its sophisticated location-aware capabilities, enabling the aggregation and analysis of localized pricing, promotions, and availability data. Our platform defines locations using a range of identifiers, including latitudes and longitudes, ZIP codes, or specific stores, and can aggregate this data for particular states or regions.

    The strength of the platform lies in its robust data collection and processing framework, which operates seamlessly across thousands of stores and regions. This system is designed to operate at configurable intervals—daily, weekly, or monthly—allowing brands to keep a vigilant eye on product availability, pricing strategies, and delivery timelines based on the selected fulfillment option.

    Unlike many other providers, who may provide limited insights from a sample of stores, our solution delivers exhaustive analytics from every storefront. This comprehensive approach grants brands a strategic edge, facilitating efficient inventory tracking, precise pricing adjustments, and rapid responses to fluctuating market dynamics. It cultivates brand consistency and loyalty by enabling brands to adapt proactively to the changing landscape.

    Aggregated store-level digital shelf insights via DataWeave

    In the summarized view shown above, a brand can track how its various products are positioned across stores and retailers like Walmart, Amazon, Meijer, and others in the US.

    Using DataWeave, brands can easily see important metrics like availability levels, prices, and other metrics across these stores gaining immediate visibility without having to physically audit them. the brand can track the same metrics for products across competitor brands and inform its own pricing, stock, and assortment decisions.

    Store-level availability insights

    We provide a comprehensive view of product availability, highlighting the distribution of out-of-stock (OOS) scenarios across various retailers and pinpointing the availability status throughout a brand’s network of stores. This capability enables swift identification of widespread availability issues, offering a bird’s-eye view of where shortages are most pronounced. By simply hovering over a specific location, detailed information about stock status and pricing for individual stores becomes accessible.

    Such insights are crucial for brands to adapt their strategies, mitigate risks, and ensure they meet consumer needs despite the ever-changing retail ecosystem.

    Store-level pricing insights

    Retailers often adopt different pricing strategies to deal with margin pressure, local competition, and surplus stock. Grasping these pricing dynamics at a hyperlocal level enables brands to tailor their strategies effectively to maintain a competitive edge.

    Our platform offers an in-depth look at how prices vary among retailers, across different stores, and throughout various regions. This analysis reveals the nuanced pricing tactics employed by retailers on a regional scale.

    For example, brands might see that some retailers, like Kroger and Walmart in the chart below, maintain consistent pricing across their outlets, demonstrating a uniform pricing strategy. In contrast, others, such as Meijer and Shoprite, might adjust their prices to match local market conditions, indicating a more localized approach to pricing.

    With DataWeave, brands can dive deeper into the pricing landscape of a specific retailer, examining a price map that provides detailed information on pricing at the store level upon hovering over a given location.

    By presenting a historical analysis of average selling prices across different retailers, we equip brands with the insights needed to understand past pricing strategies and anticipate future trends, helping them to strategize more effectively in an ever-evolving market.

    Digital Shelf Analytics that work for both eCommerce and brick-and-mortar store data

    While established brands have made strides in gathering online pricing and availability data through Digital Shelf Analytics solutions, integrating comprehensive insights from both brick-and-mortar and eCommerce channels often remains a challenge.

    DataWeave stands out for its capacity to collect data across diverse digital platforms, including desktop sites, mobile sites, and mobile applications. This capability ensures that omnichannel brands can have a holistic view of their pricing, promotional, and inventory strategies across all locations and digital landscapes.

    Leveraging localized Digital Shelf Analytics to understand the intricacies of pricing and availability at the store level allows brands to fine-tune their approaches, swiftly adapt to local market shifts, and uphold a unified brand presence across the digital and offline spheres. This strategic agility places them in a favorable competitive position, enhancing customer satisfaction and trust, which are crucial for sustained success.

    Know more about DataWeave’s Digital Shelf Analytics here.

    Schedule a call with a specialist to see how it can work for your brand.

  • Capturing and Analyzing Retail Mobile App Data for Digital Shelf Analytics: Are Brands Missing Out?

    Capturing and Analyzing Retail Mobile App Data for Digital Shelf Analytics: Are Brands Missing Out?

    Consumer brands around the world increasingly recognize the vital role of tracking and optimizing their digital shelf KPIs, such as Content Quality, Share of Search, Availability, etc. These metrics play a crucial role in boosting eCommerce sales and securing a larger online market share. With the escalating requirements of brands, the sophistication of top Digital Shelf Analytics providers is also on the rise. Consequently, the adoption of digital shelf solutions has become an essential prerequisite for today’s leading brands.

    As brands and vendors continue to delve further and deeper into the world of Digital Shelf Analytics, a significant and often overlooked aspect is the analysis of digital shelf data on mobile apps. The ability of solution providers to effectively track and analyze this mobile-specific data is crucial.

    Why is this emphasis on mobile apps important?

    Today, the battle for consumer attention unfolds not only on desktop web platforms but also within the palm of our hands – on mobile devices. As highlighted in a recent Insider Intelligence report, customers will buy more on mobile, exceeding 4 in 10 retail eCommerce dollars for the first time.

    Moreover, thanks to the growth of delivery intermediaries like Instacart, DoorDash, Uber Eats, etc., shopping on mobile apps has received a tremendous organic boost. According to an eMarketer report, US grocery delivery intermediary sales are expected to reach $68.2 billion in 2025, from only $8.8 billion in 2019.

    In essence, mobile is increasingly gaining share as the form factor of choice for consumers, especially in CPG. In fact, one of our customers, a leading multinational CPG company, revealed to us that it sees up to 70% of its online sales come through mobile apps. That’s a staggering number!

    The surge in app usage reflects a fundamental change in consumer behavior, emphasizing the need for brands to adapt their digital shelf strategies accordingly.

    Why Brands Need To Look at Apps and Desktop Data Differently

    Conventionally, brands that leverage digital shelf analytics rely on data harnessed from desktop sites of online marketplaces. This is because capturing data reliably and accurately from mobile apps is inherently complex. Data aggregation systems designed to scrape data from web applications cannot easily be repurposed to capture data on mobile apps. It requires dedicated effort and exceptional tech prowess to pull off in a meaningful and consistent way.

    In reality, it is extremely important for brands to track and optimize their mobile digital shelf. Several digital shelf metrics vary significantly between desktop sites and mobile apps. These differences are natural outcomes of differences in user behavior between the two form factors.

    One of these metrics that has a huge impact on a brand’s performance on retail mobile apps is their search discoverability. Ecommerce teams are well aware of the adverse impact of the loss of even a few ranks on search results.

    Anyone can easily test this. Searching something as simple as “running shoes” on the Amazon website and doing the same on its mobile app shows at least a few differences in product listings among the top 20-25 ranks. There are other variances too, such as the number of sponsored listings at the top, as well as the products being sponsored. These variations often result in significant differences in a brand’s Share of Search between desktop and mobile.

    Share of Search is the share of a brand’s products among the top 20 ranked products in a category or subcategory, providing insight into a brand’s visibility on online marketplaces.

    Picture a scenario in which a brand heavily depends on desktop digital shelf data, confidently assuming it holds a robust Share of Search based on reports from its Digital Shelf Analytics partner. However, unbeknownst to the team, the Share of Search on mobile is notably lower, causing a detrimental effect on sales.

    To fully understand the scale of these differences, we decided to run a small experiment using our proprietary data analysis and aggregation platform. We restricted our analysis to just Amazon.com and Amazon’s mobile app. However, we did cover over 13,000 SKUs across several shopping categories to ensure the sample size is strong.

    Below, we provide details of our key findings.

    Share of Search on The Digital Shelf – App Versus Desktop

    Our analysis focused on three popular consumer categories – Electronics, CPG, and Health & Beauty.

    In the electronics category, brands like Apple, Motorola, and Samsung, known for their mobile phones, earbuds, headphones, and more, have a higher Share of Search on the Amazon mobile app compared to the desktop.

    Meanwhile, Laptop brands like Dell, Acer, and Lenovo, as well as other leading brands like Google have a higher Share of Search on the desktop site compared to the app. This is the scenario that brands need to be careful about. When their Share of Search on mobile apps is lower, they might miss the chance to take corrective measures since they lack the necessary data from their provider.

    In the CPG category, Ramen brand Samyang, with a lot of popularity on Tiktok and Instagram, shows a higher Share of Search on Amazon’s mobile app. Speciality brands like 365 By Whole Foods, pasta and Italian food brands La Moderna, Divinia, and Bauducco too have a significantly higher Share of Search on the app.

    Cheese and dessert brands like Happy Belly, Atlanta Cheesecake Company, among others, have a lower Share of Search on the mobile app. Ramen brand Sapporo is also more easily discovered on Amazon’s desktop site. Here, we see a difference of more than 5% in the Share of Search of some brands, which is likely to have a huge impact on the brand’s mobile eCommerce sales levels and overall performance.

    Lastly, in the Health & Beauty category, Shampoos and hair care brands like Olaplex, Dove, and Tresemme exhibited a higher Share of Search on the mobile app compared to the desktop.

    On the other hand, body care brands like Neutrogena and Hawaiian Tropic, as well as Beardcare brand Viking Revolution displayed a higher Share of Search on Amazon’s desktop site.

    Based on our data, it is clear that there are several examples of brands that do better in either one of Amazon’s desktop sites or mobile apps. In many cases, the difference is stark.

    So What Must Brands Do?

    Our findings emphasize the imperative for brands to move beyond a one-size-fits-all approach to digital shelf analytics. The striking variations in Share of Search between mobile apps and desktops conclusively demonstrate that relying solely on desktop data for digital shelf optimization is inadequate.

    If brands see that they’re falling behind on the mobile digital shelf, there are a few things they can do to help boost their performance:

    • If a brand’s Share of Search is lower on the mobile app, they can divert their retail spend to mobile in order to inorganically compensate for this difference. This way, any short-term impact due to lower discoverability is mitigated. This is also likely to result in optimized budget allocation and ROAS.
    • Brands also need to ensure their content is optimized for the mobile form factor, with images that are easy to view on smaller screens, and tailored product titles that are shorter than on desktops, highlighting the most important product attributes from the consumer’s perspective. Not only will this help brands gain more clicks from mobile shoppers, but this will also gradually lead to a boost in their organic Share of Search on mobile.
    • CPG brands, specifically, need to optimize their digital shelf for delivery intermediary apps (along with marketplaces). The grocery delivery ecosystem is booming with companies like DoorDash, Delivery Hero, Uber Eats, Swiggy, etc. leading the way. Using Digital Shelf Analytics to optimize performance on delivery apps is quite an involved process with a lot of bells and whistles to consider. Read our recently published whitepaper that specifically details how brands can successfully boost their visibility and conversions on delivery apps.

    But first, brands need to identify and work with a Digital Shelf Analytics partner that is able to capture and analyze mobile app data, enabling tailored optimization approaches for all eCommerce platforms.

    DataWeave leads the way here, providing the world’s most comprehensive and sophisticated digital shelf analytics solution, rising above all other providers to provide digital shelf insights for both web applications and mobile apps. Our data aggregation platform successfully navigates the intricacies of capturing public data accurately and reliably from mobile apps, thereby delivering a comprehensive cross-device view of digital shelf KPIs to our brand customers.

    So reach out to us today to find out more about our digital shelf solutions for mobile apps!

  • From Data to Dollars: How Digital Shelf Analytics Drives Tangible Business Impact and ROI for Brands

    From Data to Dollars: How Digital Shelf Analytics Drives Tangible Business Impact and ROI for Brands

    For consumer brands, the digital marketplace presents an unparalleled landscape of opportunities for engaging with consumers and expanding their market presence. Within this dynamic environment, Digital Shelf Analytics has emerged as a crucial pillar in a brand’s eCommerce strategy. This technology provides valuable insights into a brand’s organic and paid visibility on marketplaces, content quality, pricing strategies, promotional efforts, and product availability. These insights help brands gain a comprehensive understanding of their competitive positioning and overall market performance.

    Nevertheless, many brands often grapple with the question of whether this understanding translates into tangible actions that drive real business impact and return on investment (ROI). This uncertainty stems from a lack of clarity about the direct correlation between digital shelf insights and key metrics such as enhanced sales conversions.

    Nonetheless, there is compelling evidence that when these insights are effectively harnessed and strategic actions are taken, brands can realize significant, measurable benefits.

    So, the question arises: does Digital Shelf Analytics genuinely deliver on its promises?

    At DataWeave, we’ve partnered with numerous brands to fuel their eCommerce growth through the application of digital shelf analytics. In this article, we will delve into these insights, uncovering the concrete and quantifiable results that brands can achieve through their investments in digital shelf analytics.

    Digital Shelf KPIs and Their Impact

    Digital Shelf Analytics is a robust system that analyzes specific key performance indicators (KPIs) about the digital shelf, furnishing brands with precise recommendations to not only bolster these KPIs but also to monitor the enhancements over time. The following is a brief explanation of digital shelf KPis and their expected impact areas:

    Product Availability: Ensuring Shoppers Never Hear “Out of Stock” Again

    Timely insights on the availability of products ensures brands reduce replenishment times at scale, which can significantly impact sales, creating an unbreakable link between product availability and revenue. With Digital Shelf Analytics, procurement and replenishment teams can set up notifications to promptly identify low or out-of-stock items and take swift action. This can also be done for specific ZIP codes or individual stores. In addition, availability plays a crucial role in a brand’s Share of Search and search rankings, as online marketplaces often ensure only in-stock products are shown among the top ranks.

    Share of Search: Dominating the Digital Aisles

    If a product isn’t visible, does it even exist? In fact, 70% of consumers never go beyond the first page of search results on major online marketplaces. Therefore, as a brand, the visibility of your products for relevant search keywords and their appearance on the first page can heavily determine your awareness metrics. This is where the concept of Share of Search comes into play. Think of it as securing prime shelf space in a physical store. Digital shelf insights and benchmarking with category leaders for Share of Search help ensure your products command relevant attention on the digital shelf.

    Content Quality: Crafting the Perfect Product Story

    Creating engaging product descriptions and visuals is akin to giving your products a megaphone in a crowded marketplace. By enhancing content quality, including product names, titles, descriptions, and images, brands can climb the search result rankings, leading to increased visibility and subsequently, more sales.

    Ratings and Reviews: The Power of Social Proof

    Public opinion holds immense sway. Research indicates that a single positive review can trigger a 10% surge in sales, while a multitude of favorable reviews can propel your product to a 44% higher trajectory. The correlation between ratings and sales is not surprising—each step up the rating ladder can translate to substantial revenue growth.

    While it’s reasonable to anticipate a connection between these KPIs and downstream impact metrics such as impressions, clicks, and conversions, we were driven to explore this correlation through the lens of real-world data. To do so, we meticulously monitored the digital shelf KPIs for one of our clients and analyzed the improvements in these metrics.

    It’s essential to acknowledge that not all observed impact areas can be solely attributed to enhancements in digital shelf KPIs. Still, it’s evident that a robust correlation exists. The following section presents an in-depth case study, shedding light on the results of this analysis.

    A Success Story: Real-World Impact of Digital Shelf Analytics

    Let’s dive into the journey of one of our clients – a prominent CPG brand specializing in the sale of baked goods and desserts. Through their experience, we will illustrate the transformative impact of our DataWeave Digital Shelf Analytics product suite.

    Over a period of one year, from August 2022 to July 2023, the brand leveraged several key modules of Digital Shelf Analytics for Amazon, including Share of Search, Share of Category, Availability, Ratings and Reviews, and Content Audit. Each of these digital shelf KPIs played a vital role in shaping the brand’s performance across various stages of the buyer’s journey.

    The buyer’s journey is typically delineated into three key stages:

    • Awareness: At this stage, shoppers peruse multiple product options presented on search and category listing pages, gaining an initial understanding of the available choices.
    • Consideration: Here, shoppers narrow down their selections and evaluate a handful of products, moving closer to a purchase decision.
    • Conversion: In this final stage, shoppers make their ultimate product choice and proceed to complete the purchase.

    Let’s now examine the data to understand how digital shelf KPIs helped drive tangible ROI on Amazon for the brand across the stages of the buyer journey.

    Stage 1: Raising Awareness

    Enhancing Share of Search and Share of Category can help brands boost product visibility and raise brand awareness. The following chart demonstrates the steady, incremental improvements in our client’s Share of Search and Share of Category (in the top 20 ranks of each listing page) throughout the analyzed period. These enhancements were achieved through various measures, including product sponsorship, content enhancement, price optimization, promotional initiatives, and more.

    This amplified Share of Search and Share of Category directly translates into improved product discoverability, as evident from the surge in impressions depicted in the chart below.

    Stage 2: All Things Considered

    In the consideration stage, shoppers make their product selections by clicking on items that meet their criteria, which may include factors like average rating, number of ratings, price, product title, and images. For brands, this underscores the importance of crafting meticulously detailed product content and accumulating a substantial number of ratings.

    The subsequent chart illustrates the year-long trend in both average ratings and the number of ratings, both of which have displayed steady improvement over time.

    The enhancements in the number of ratings and the average rating have a direct and positive impact on product consideration. This, in turn, has led to a noticeable year-over-year increase in page views, as indicated in the chart below.

    These improvements are likely to have also been influenced by the overall enhancement of content quality, which is detailed separately in the section below.

    Stage 3: Driving Decisions

    As buyers progress to the next stage, they reach the pivotal point of making a purchase decision. This decision is influenced by multiple factors, including product availability, content quality, and the quality of reviews, reflecting customer sentiment.

    Our client effectively harnessed our Availability insights, significantly reducing the likelihood of potential out-of-stock scenarios and enhancing replenishment rates, as highlighted in the chart below. The same chart also indicates improvements in content quality, measured by the degree to which the content on Amazon aligns with the brand’s ideal content standards.

    Below, you’ll find the year-over-year growth in conversion rates for the brand on Amazon. This metric stands as the ultimate measure of business impact, directly translating into increased revenue for brands.

    As the data uncovers, growth in key digital shelf KPIs cumulatively had a strong correlation with impressions, page views, and conversion rates.

    It is also important to note that the effect of each KPI cannot be viewed in isolation, since they are often interdependent. For example, improvement in content and availability could boost Share of Search. Accurate content could also influence more positive customer feedback. Brands need to consider optimizing digital shelf KPIs holistically to create sustained business impact.

    Impact on eCommerce Sales

    After the implementation of digital shelf analytics, the results spoke for themselves. Sales consistently outperformed the previous year’s records month after month. As shown in the chart below, the diligent application of DataWeave’s recommendations paved the way for an impressive 8.5% year-over-year increase in sales, leaving an indelible mark on the brand’s eCommerce success.

    From boosting product visibility to catapulting conversion rates, Digital Shelf Analytics serves as the key to unlocking unparalleled online success.

    While the success story detailed above does not establish a direct causation between Digital Shelf Analytics and sales revenue, there is undoubtedly a strong correlation. It’s evident that digital shelf KPIs play a pivotal role in optimizing a brand’s eCommerce performance across all stages of the buyer journey. Hence, for brands, it is vital that they collaborate with the right partner and harness digital shelf insights to fine-tune their eCommerce strategies and tactics.

    That said, the eCommerce landscape is in a constant state of flux, and there is still much to learn about how each digital shelf KPI influences brand performance in the online realm. With more data and an increasing number of brands embracing Digital Shelf Analytics, it’s only a matter of time before a direct causation is firmly established.

    Reach out to us today to know more about how your brand can leverage Digital Shelf Analytics to drive higher sales and market share in eCommerce.