Author: Praveen Sheethalnath

  • Why Unit of Measure Normalization is Critical For Accurate and Actionable Competitive Pricing Intelligence

    Why Unit of Measure Normalization is Critical For Accurate and Actionable Competitive Pricing Intelligence

    Competitive pricing intelligence is pivotal for retailers seeking to analyze their product pricing in relation to competitors. This practice is essential for ensuring that their product range maintains a competitive edge, meeting both customer expectations and market demands consistently.

    Product matching serves as a foundational element within any competitive pricing intelligence solution. Products are frequently presented in varying formats across different websites, featuring distinct titles, images, and descriptions. Undertaking this process at a significant scale is highly intricate due to numerous factors. One such complication arises from the fact that products are often displayed with differing units of measurement on various websites.

    The Challenge of Varying Units

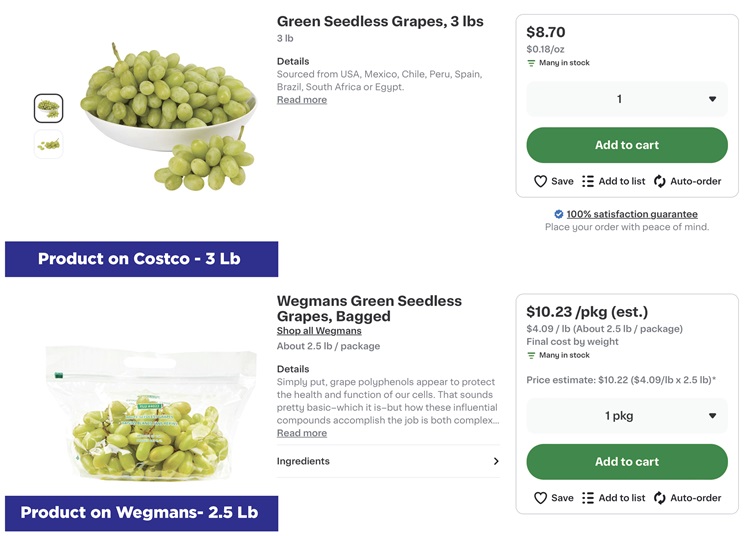
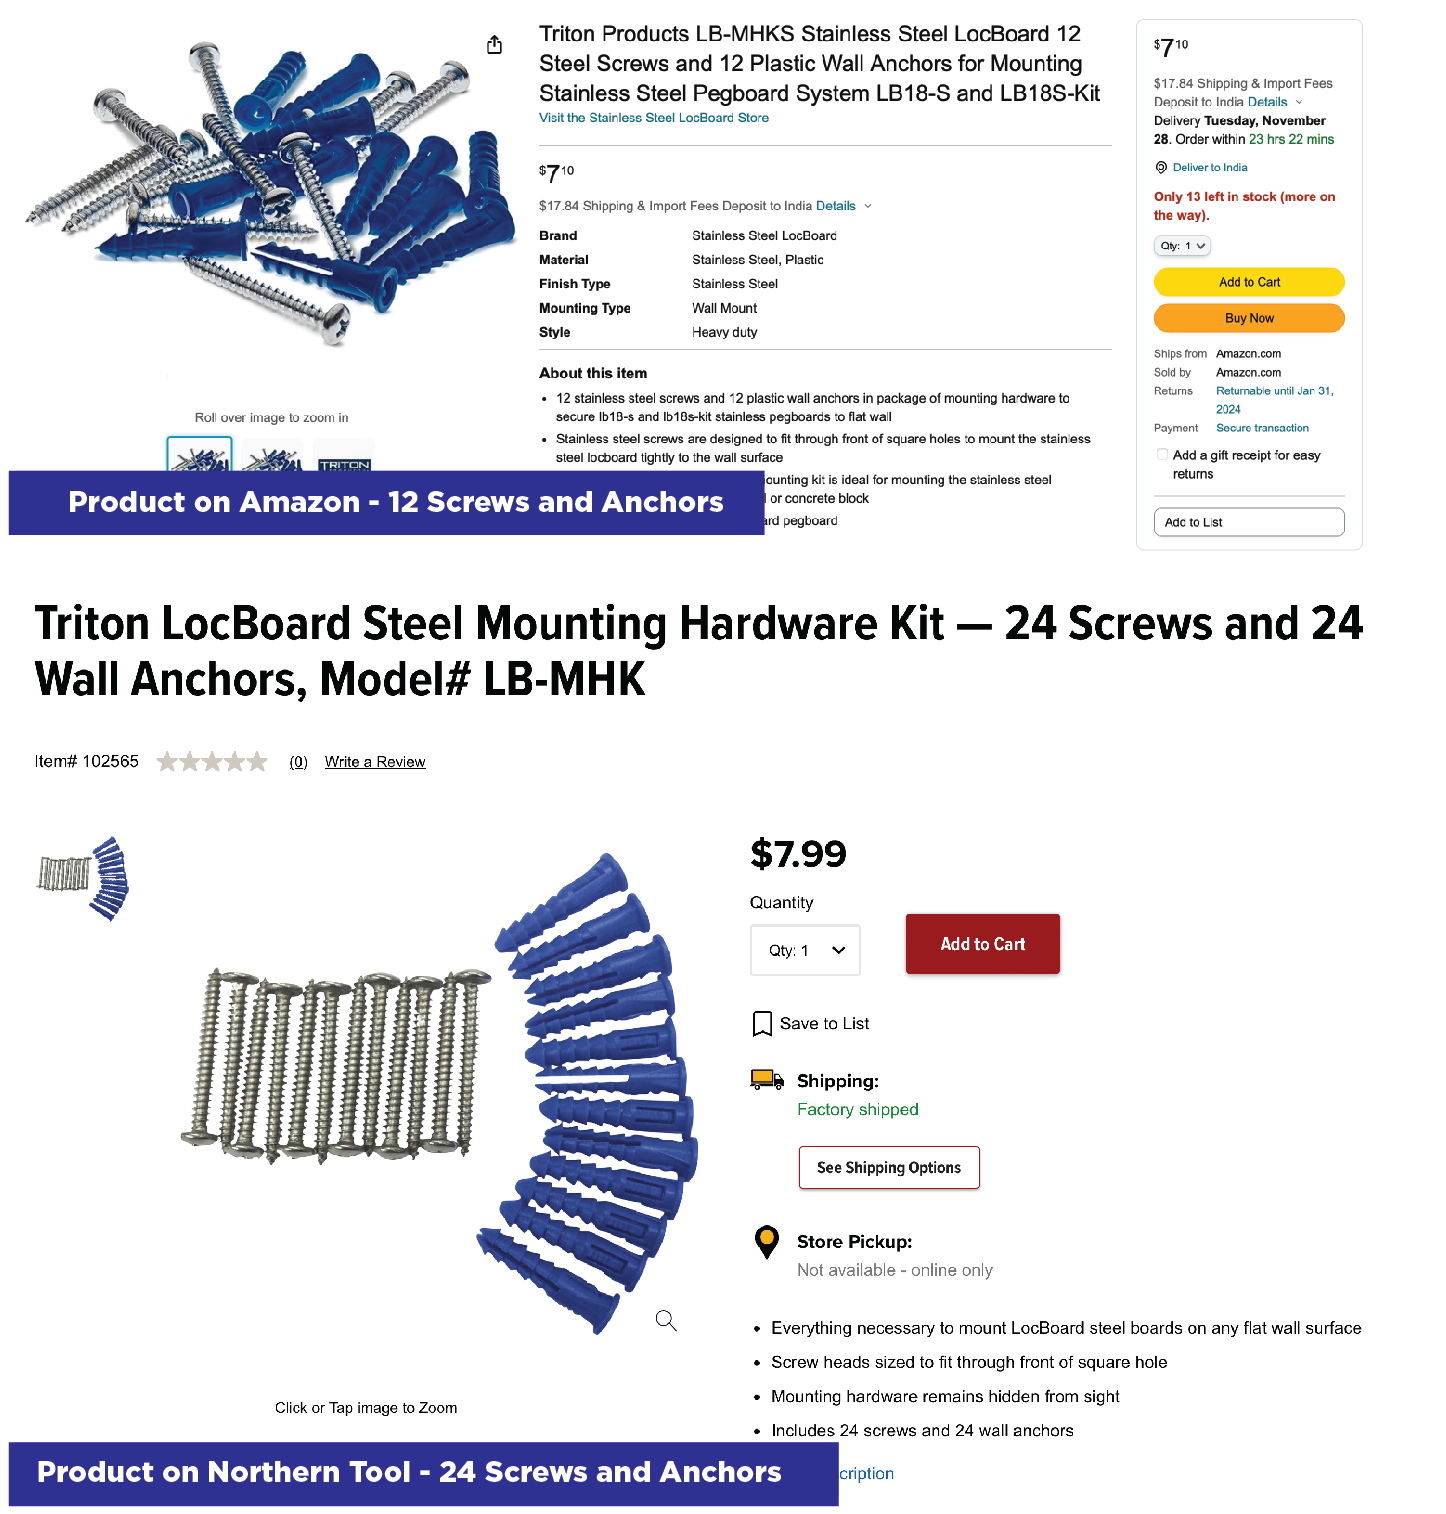
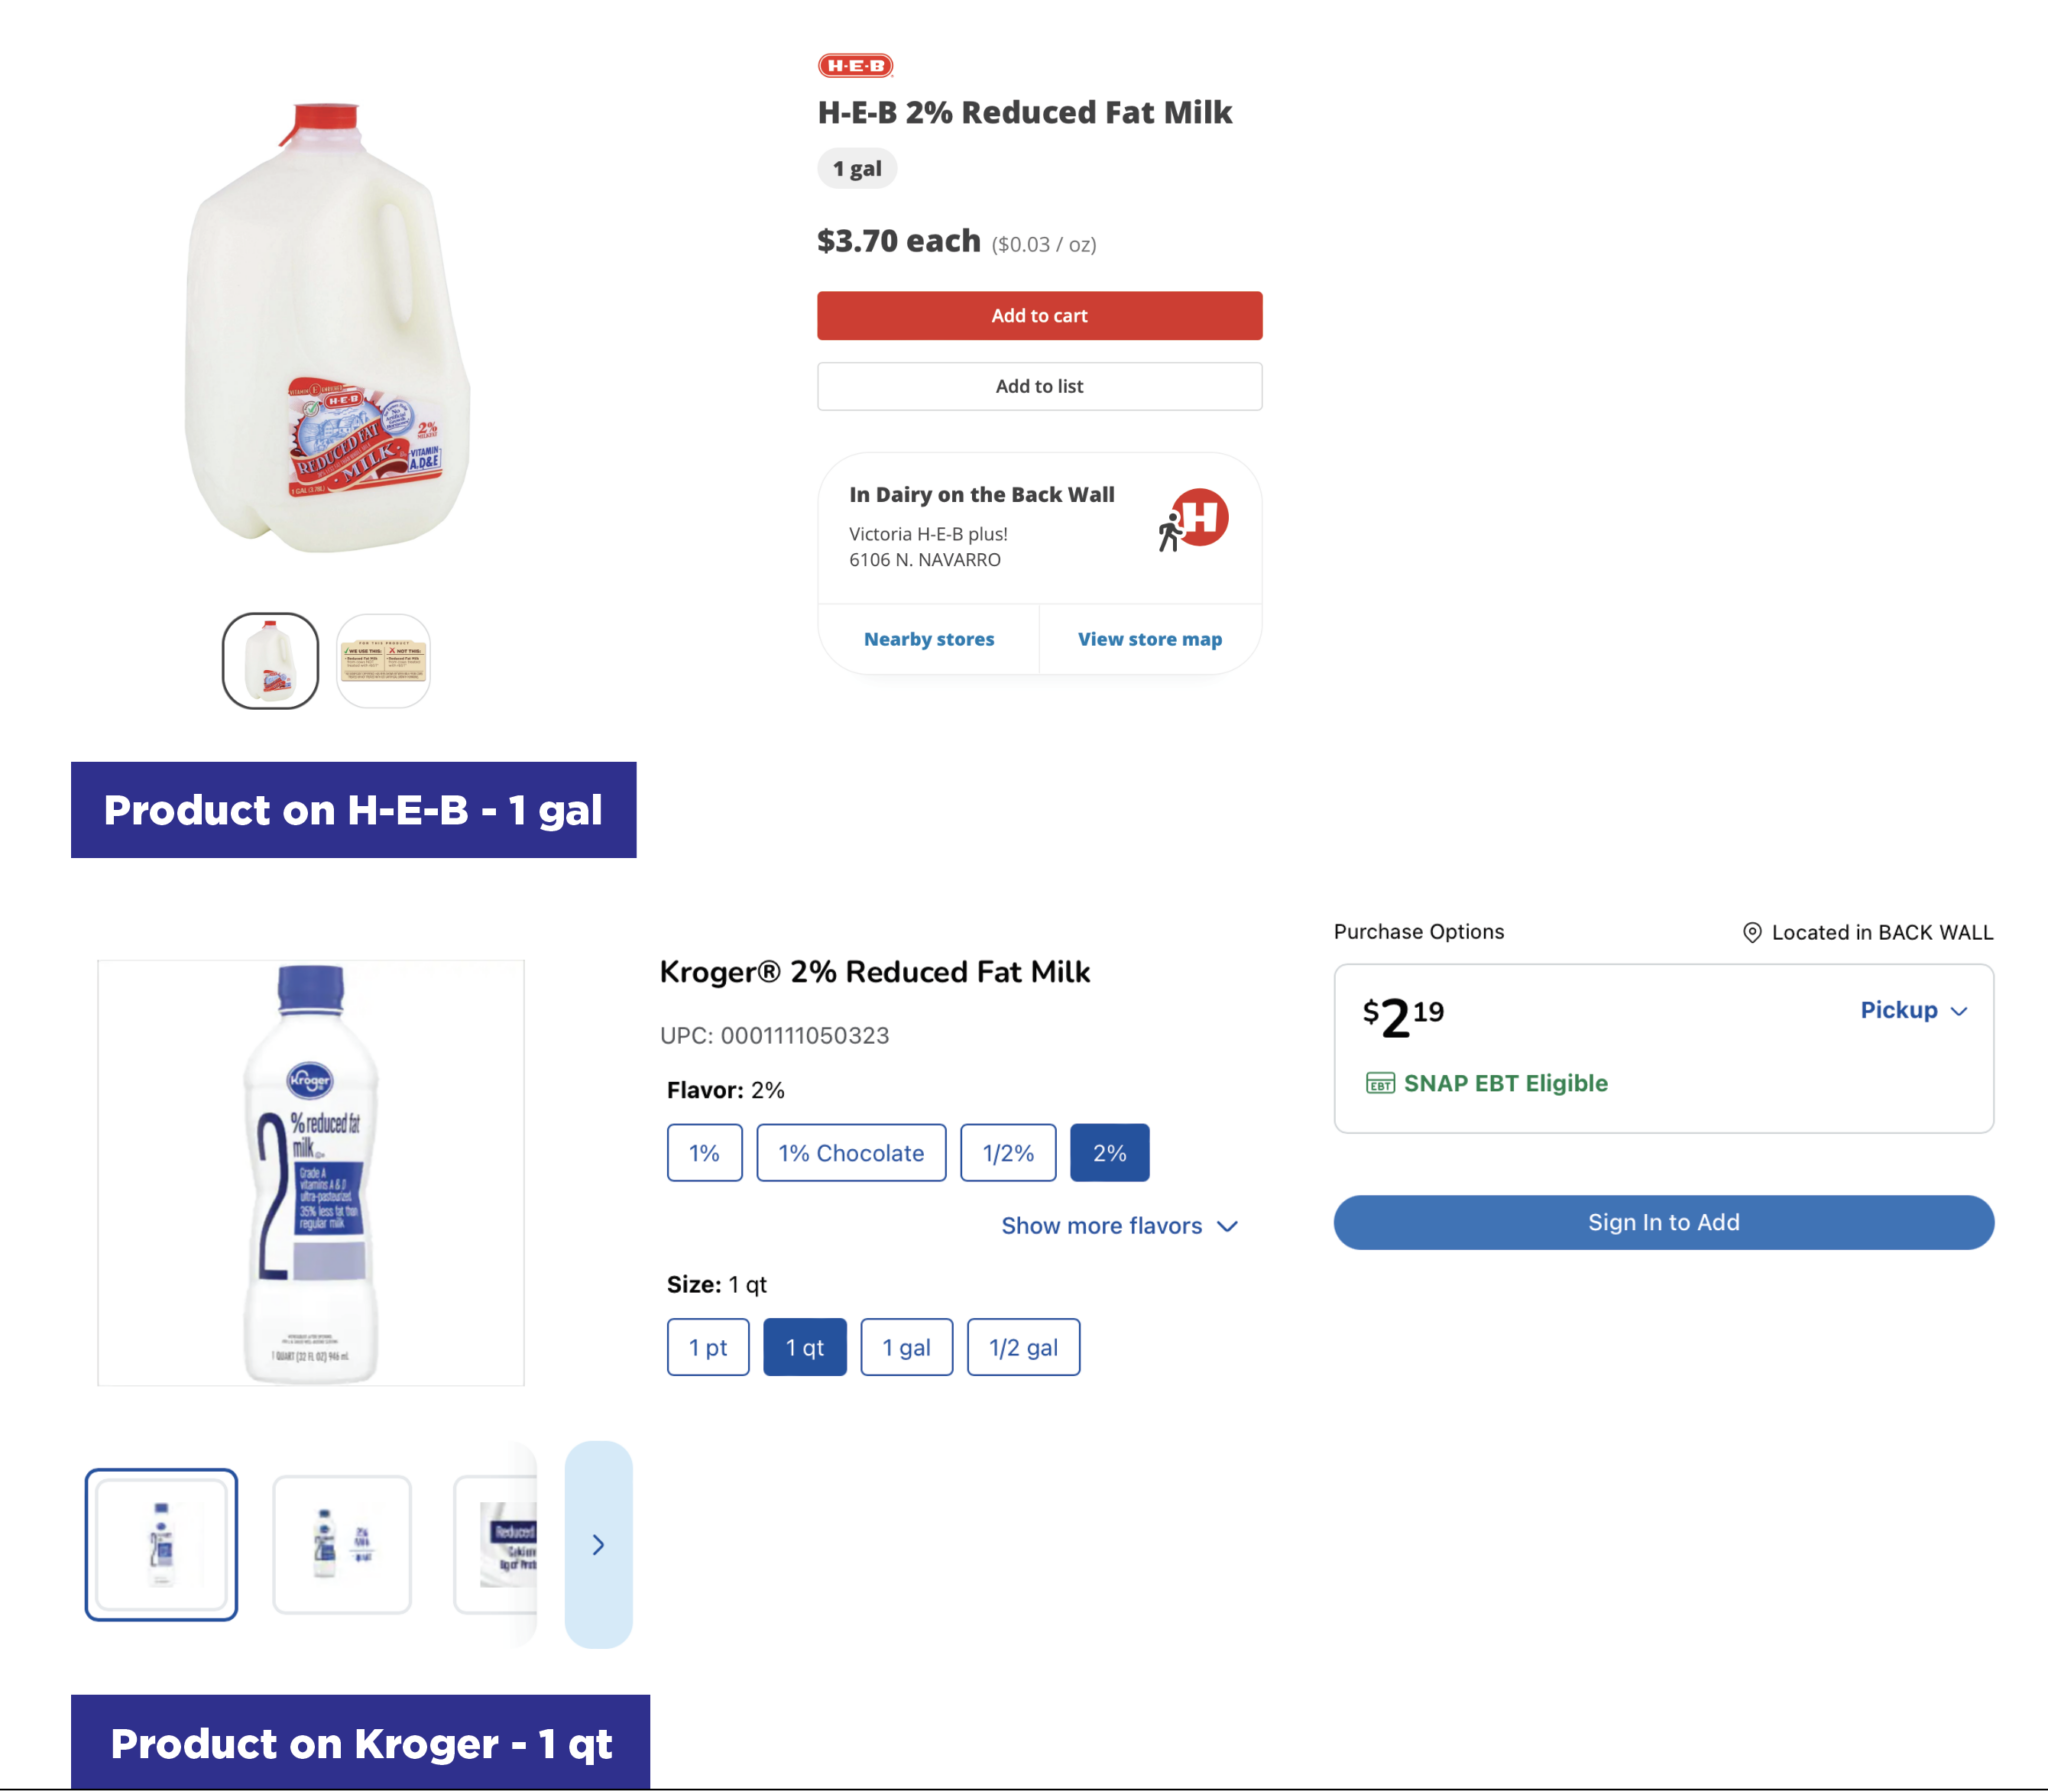
    In certain product categories, retailers often offer the same item in varying volumes, quantities, or weights. For instance, a clothing item might be available as a single piece or in packs of 2 or 3, while grocery brands commonly sell eggs in counts of 6, 12, or 24.

    Consider this example: a quick glance might suggest that an 850g pack of Kellogg’s Corn Flakes priced at $5 is a better deal than a 980g pack of Nestle Cornflakes priced at $5.2. However, this assumption can be deceptive. In reality, the latter offers better value for your money, a fact that only becomes evident through price comparisons after standardizing the units.

    This issue is particularly relevant due to the prevalence of “shrinkflation,” where brands adjust packaging sizes or quantities to offset inflation while keeping prices seemingly low. When quantities, pack sizes, weight, etc. reduce instead of prices increasing, it’s important that this change is considered while analyzing competitive pricing.

    Normalizing Units of Measure

    In order to effectively compare prices among different competitors, retailers must standardize the diverse units of measurement they encounter. This standardization (or normalization) is crucial because price comparisons should extend beyond individual product SKUs to accommodate variations in package sizes and quantities. It’s essential to normalize units, ranging from “each” (ea) for individual items to “dozen” (dz) for sets, and from “pounds” (lb), “kilograms” (kg), “liters” (ltr), to “gallons” (gal) for various product types.

    For example, a predetermined base unit of measure, such as 100 grams for a specific product like cornflakes, serves as the reference point. The unit-normalized price for any cornflake product would then be the price per 100 grams. In the example provided, this reveals that Kellogg’s is priced at $0.59 per 100 grams, while Nestle is priced at $0.53 per 100 grams.

    Various Categories of Unit Normalization

    1. Weight Normalization

    Retailers frequently feature products with weight measurements expressed in grams (g), kilograms (kg), pounds (lbs), or ounces (oz).

    2. Quantity or Pack Size Normalization

    Products are also often featured with varying pick sizes or quantities in each SKU.

    mounting hardware kit

    3. Volume or Capacity Normalization

    Products can also vary in volumes or capacities with units like liters (L) or fluid ounces (fl oz).

    DataWeave’s Unit Normalized Pricing Intelligence Solution

    DataWeave’s highly sophisticated product matching engine can match the same or similar products and normalize their units of measurement, leading to highly accurate and actionable competitive pricing insights. It standardizes different units of measurement, like weight, quantity, and volume, ensuring fair comparisons across similar and exact matched products.

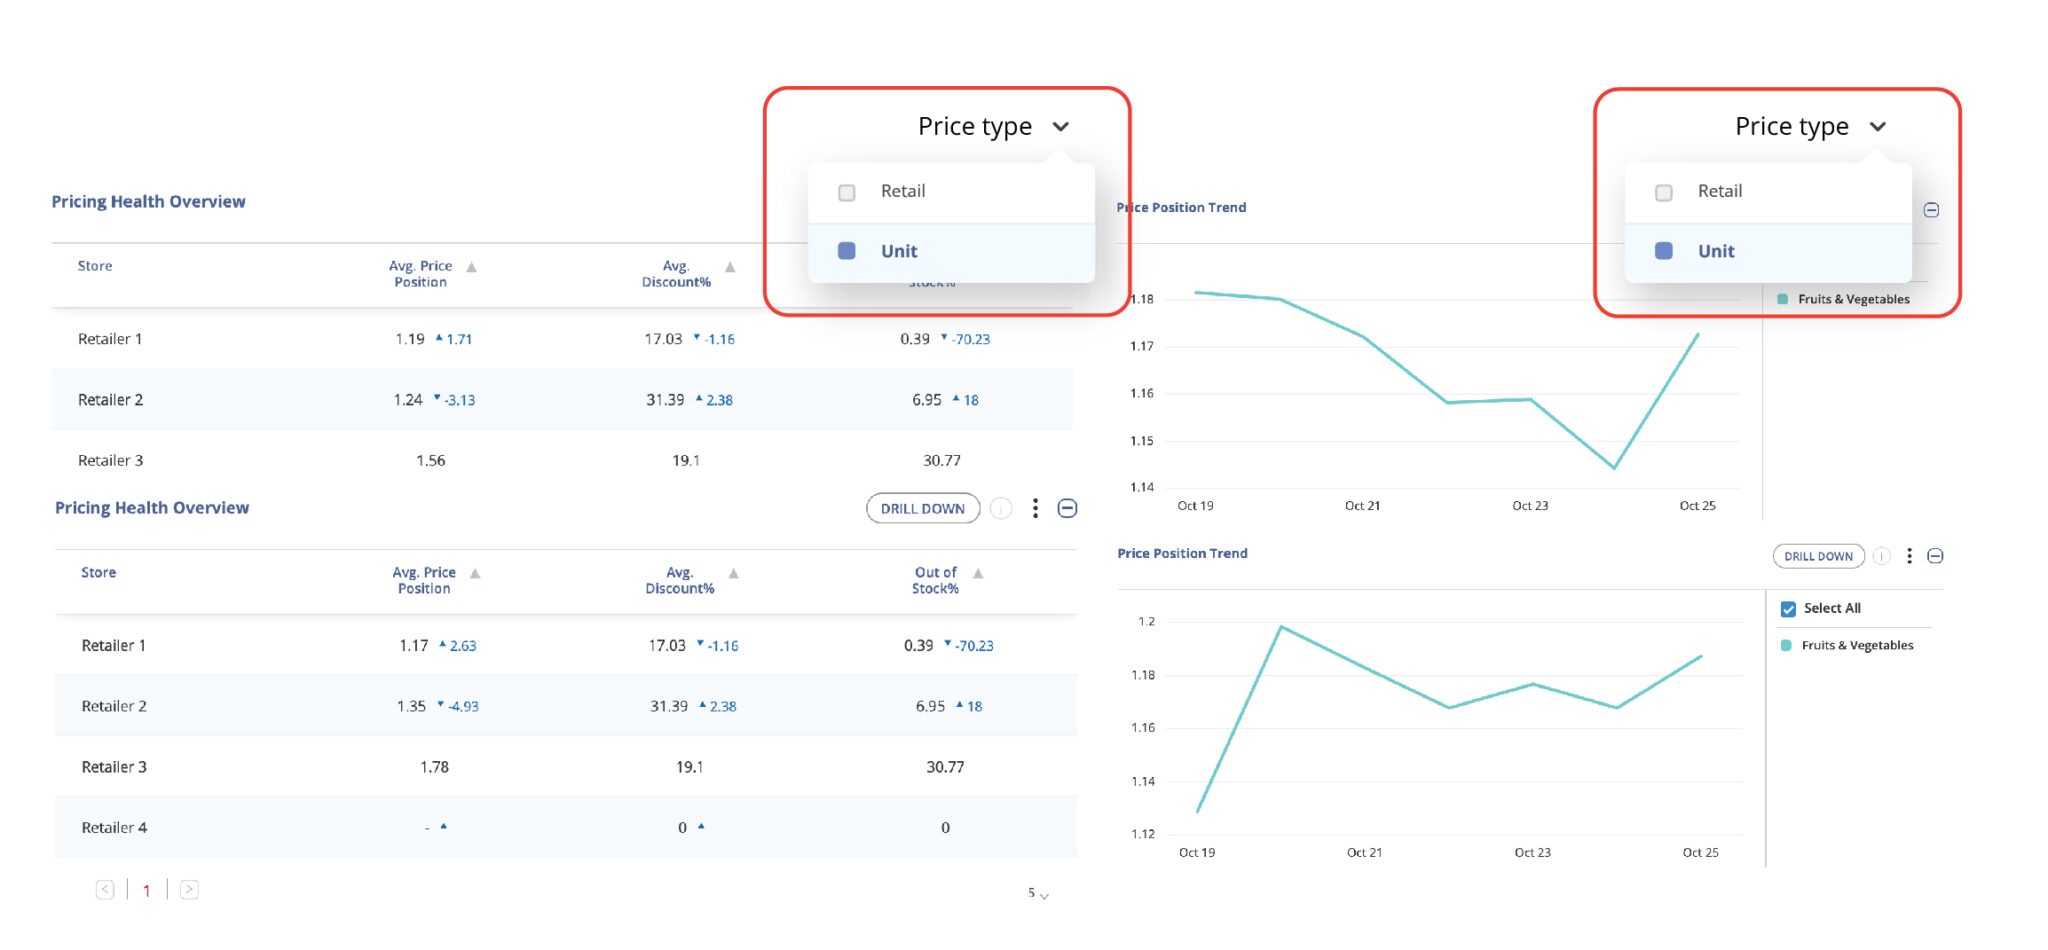
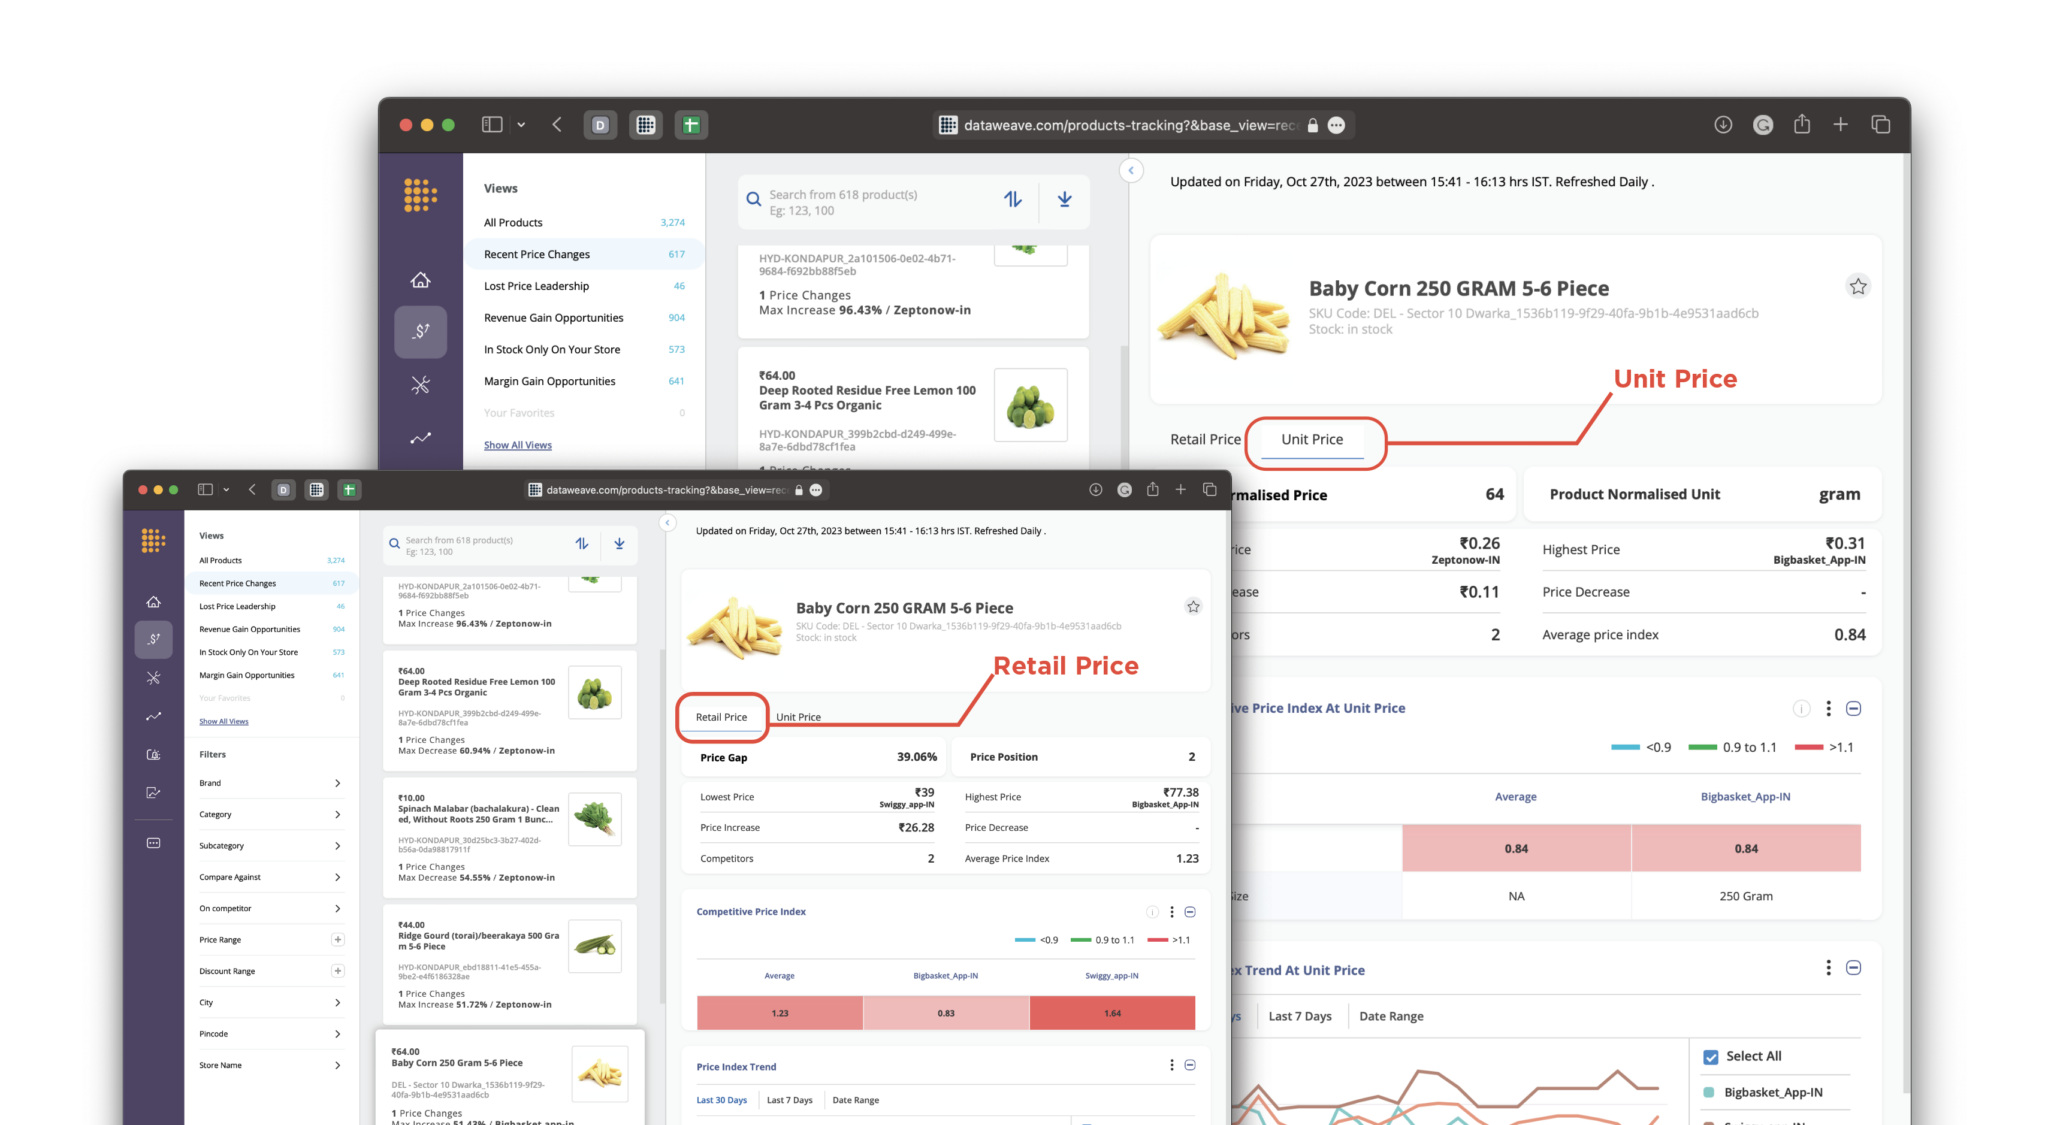
    Retailers have the flexibility to view pricing insights either with retailer units or normalized units. This capability empowers retailers and analysts to perform accurate, in-depth analyses of pricing information at a product level.

    In some scenarios, analyzing unit normalized pricing reflects pricing trends and competitiveness more accurately than retail price alone. This is particularly true for categories like CPG, where products are sold in diverse units of measure. For instance, in the example shown here, we can view a comparison of price position trends for the category of Fruits and Vegetables based on both retail price and unit price.

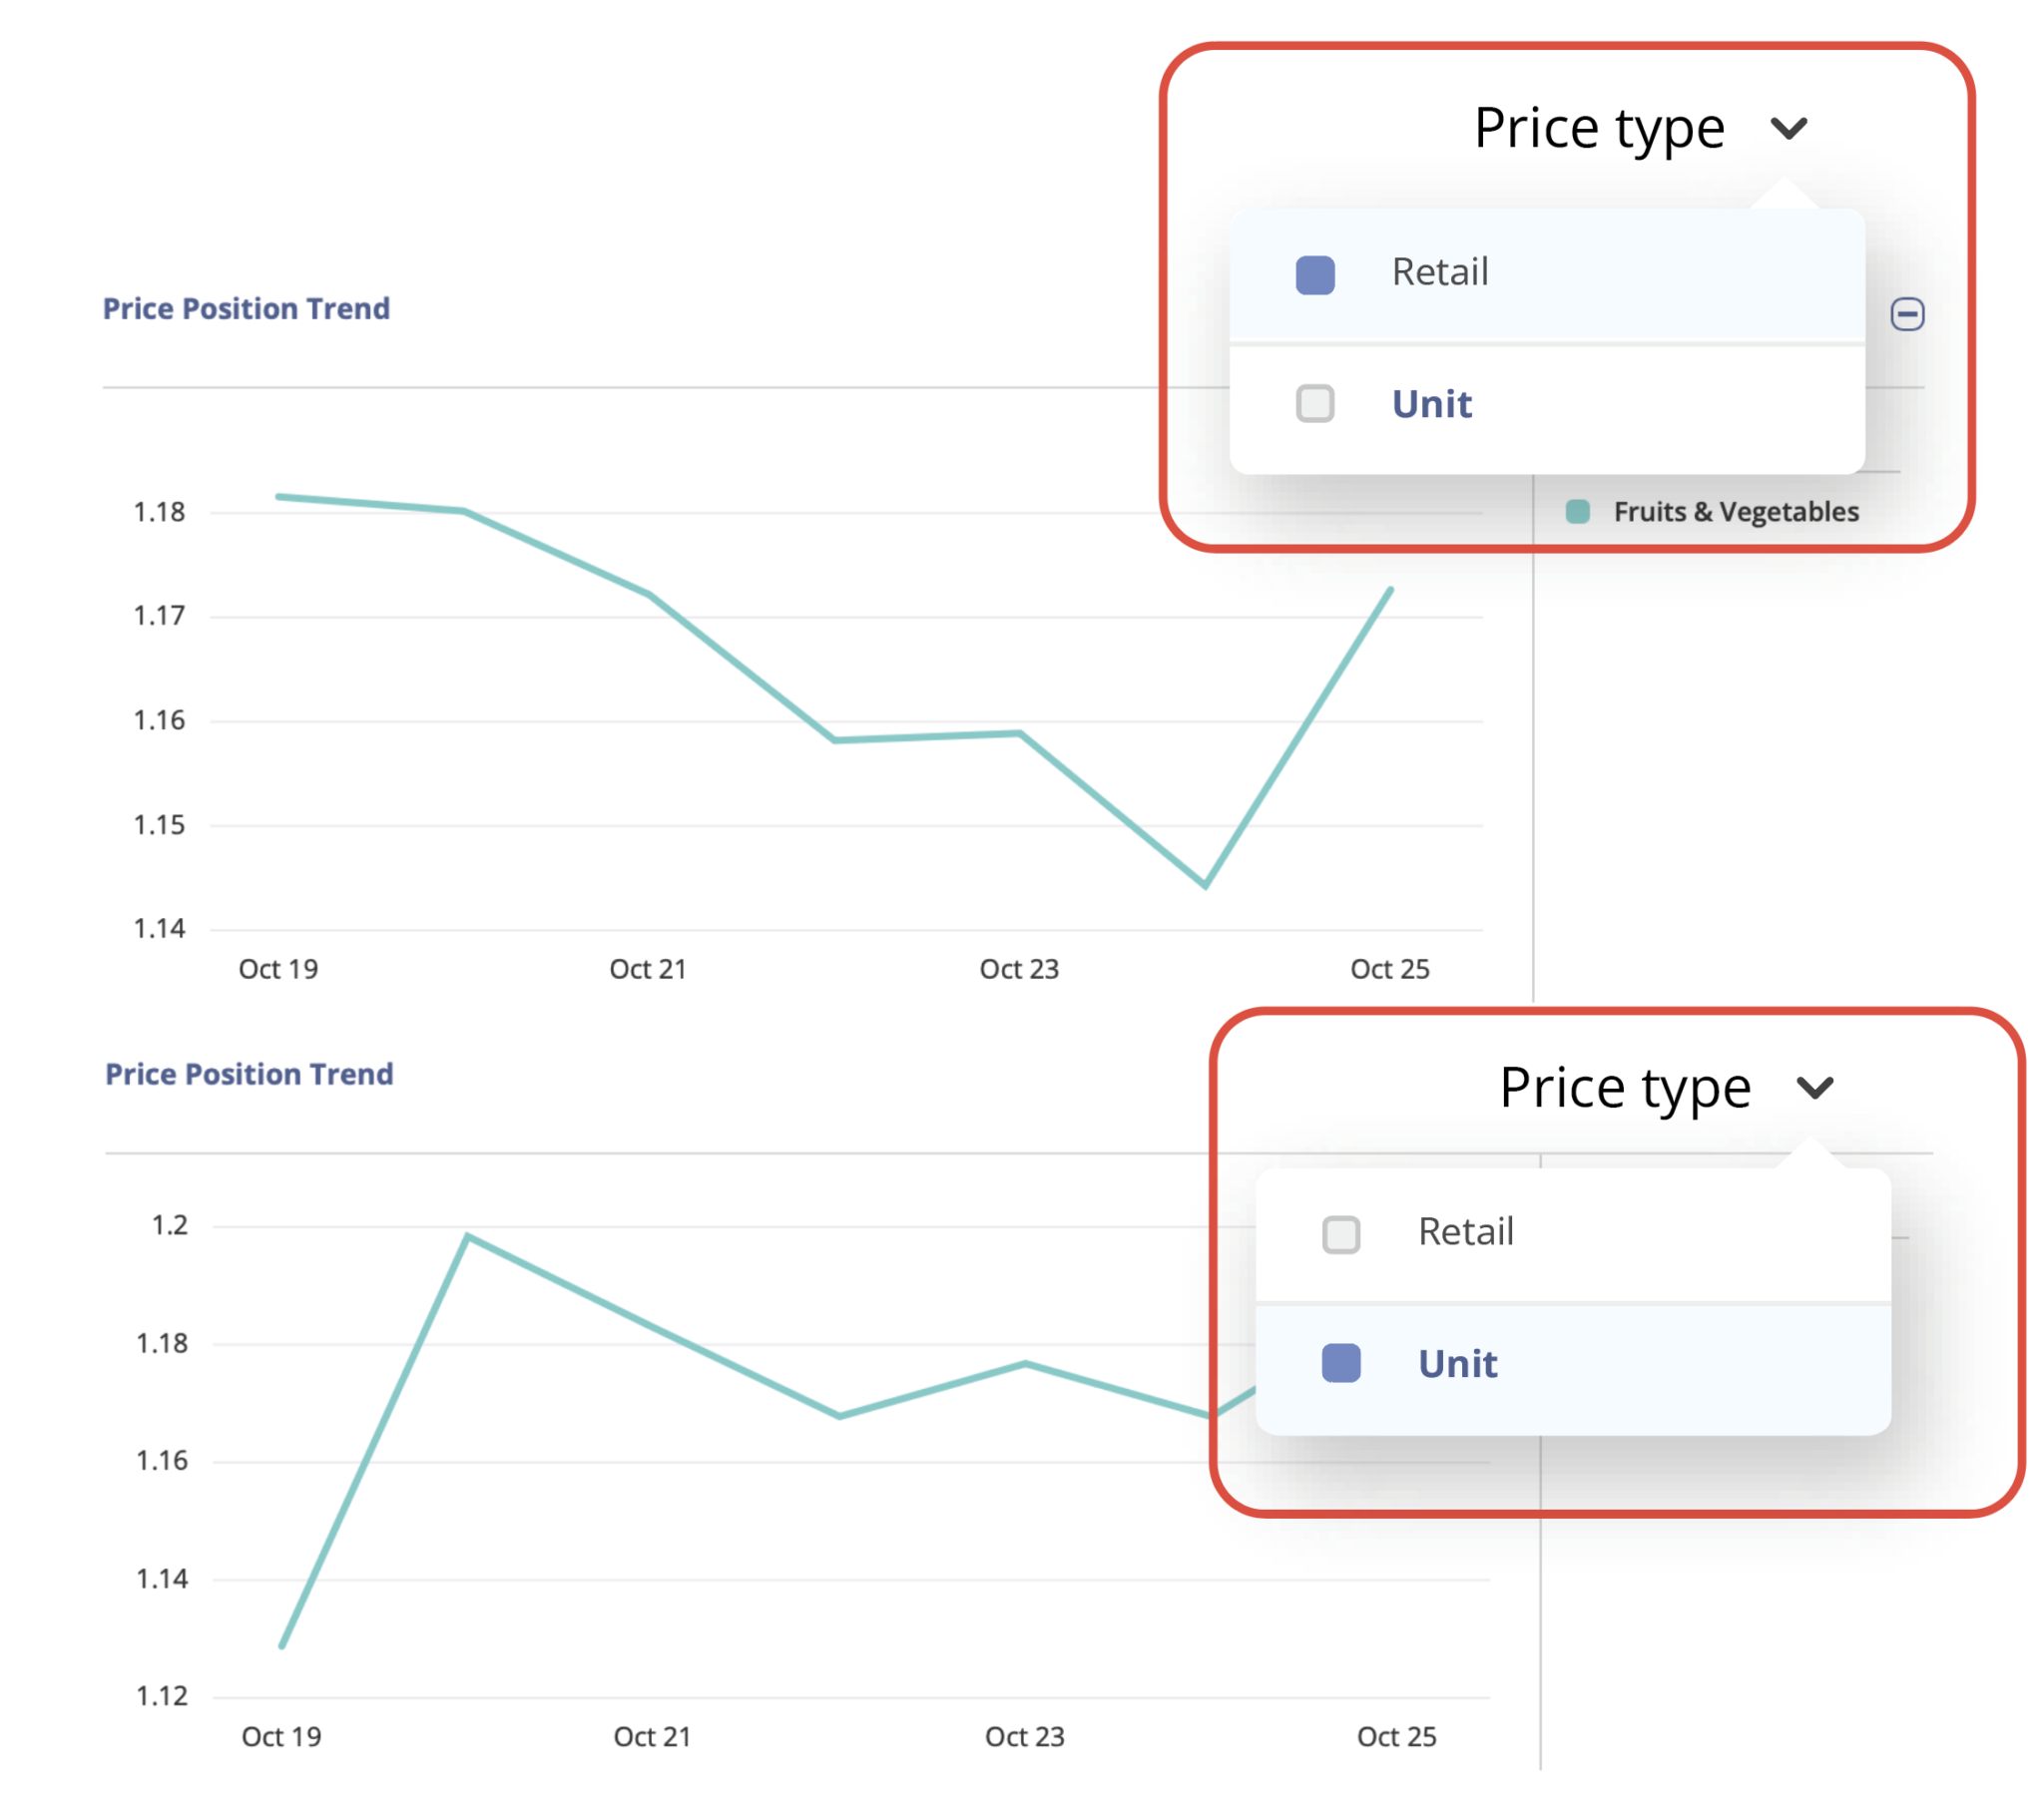
    The difference is striking: the original retail price based analysis shows a stagnation in price position, whereas unit normalized pricing analysis reflects a more dynamic pricing scenario.

    With DataWeave, retailers can specify which units to compare, ensuring that comparisons are made accurately. For example, a retailer can specify that unit price comparisons apply only to 8, 12, or 16-ounce packs, as well as 1 or 3-pound packs, but not to 10 and 25-pound bags. This precision ensures that products are matched correctly, and prices are represented for appropriately normalized units, leading to more accurate pricing insights.

    To learn more about this capability, write to us at contact@dataweave.com or visit our website today!

  • DataWeave Launches PricingPulse: Empowering Retail Leaders With Comprehensive and Strategic Pricing Insights

    DataWeave Launches PricingPulse: Empowering Retail Leaders With Comprehensive and Strategic Pricing Insights

    In the evolving retail landscape, success often hinges on a singular focal point: pricing. A recent Statista survey revealed that 70% of US online users prioritize competitive pricing in their digital shopping choices. In this cutthroat arena, where surpassing rivals is paramount, a deep comprehension of pricing nuances is no longer just an edge, but a necessity.

    Retailers are increasingly adopting pricing intelligence solutions that meticulously dissect competitor pricing data in comparison to their own, down to the SKU level. This analysis empowers their pricing teams with the insights they need to price their products competitively on a day-to-day basis.

    However, in a landscape where a staggering 50 million price changes occur daily, reliance on a reactive pricing intelligence solution, though effective in many ways, often falls short. To develop a strategic and predictive pricing engine, retailers also need the ability to track historical pricing relative to market conditions, competitor actions, seasonality, promptness of competitor pricing actions, and more. This would be particularly useful for senior retail pricing and business unit leaders as they look to gain a strategic perspective on their competitive pricing health. However, even today’s leading providers of retail pricing intelligence solutions lack in this area. This results in a relatively myopic view of competitive pricing even in large retail organizations.

    Introducing DataWeave’s PricingPulse

    DataWeave’s PricingPulse helps retail leaders better understand their competitive pricing strategies in comparison to relevant market dynamics over time. The capability bridges the gap between day-to-day competitive pricing operations and long-term strategic pricing analysis and actions, enabling senior retail pricing leaders to untangle the complexities of their pricing strategies. Delivered as a dashboard, the view offers an elevated vantage point for industry-wide pricing dynamics, empowering retailers with the foresight needed to navigate market shifts, predict vulnerabilities, and capitalize on new opportunities.

    PricingPulse is provided to all DataWeave retail customers as an add-on to our Pricing Intelligence solution.

    The insights offered by PricingPulse enable retailers to answer pivotal questions about competitor pricing behaviors, price leadership across categories, timing of price changes, and the effectiveness of capitalizing on price improvement opportunities. Some of the questions that PricingPulse offers answers to include:

    • How frequently are my competitors changing prices and for which products?
    • How does my price leadership vary across key product categories?
    • Which day of the week or month do my competitors change their pricing most and least frequently?
    • How well do I seize on price improvement opportunities over time?

    Strategic Pricing Views Via PricingPulse

    In the following section, we share a few views available to retail leaders via our PricingPulse dashboard. For a complete list of insights available on the dashboard, request a demo today.

    Competitive Price Leadership Across Retailers and Categories

    This view provides retailers with an overview of the price leaders across various product categories and how it changes with time. More often than not, retailers would aim to gain price leadership in certain categories, while maintaining healthy margins in others.

    Retailers can also gauge their consistency and effectiveness in maintaining a competitive edge for key categories over time. They can fortify areas of strength and identify opportunity areas to optimize their pricing.

    In addition, the dashboard tracks a retailer’s price index across categories, a measure that determines its price competitiveness.

    The price index is determined by dividing the retailer’s price by the lowest price offered by any of its competitors. A ratio lesser than 1 indicates that the retailer is the lowest priced in the market. This measure is also presented for competitors, providing insights into competitors that are most attractively priced in the market. A timeline trend of this metric helps track how price leadership among retailers changes over time.

    Price Change Trends

    This view provides a summary of the level of price changes by a retailer and its competitors over a period of time, which includes the average magnitude of price changes as well as the proportion of the retailer’s assortment that underwent these price changes.

    In addition, the number of price changes each month are provided for each retailer. This is further broken down into the total number of price changes during each day of the week.

    These insights help retailers determine which competitors are most and least active in their pricing activities, how aggressive the pricing actions are, and if there are any specific price change patterns followed in terms of the days of the week or month.

    Price Improvement Opportunities and Actions

    The dashboard actively reports on price improvement opportunities, which could include either a price increase opportunity or a price decrease opportunity, for a retailer and its competitors across categories over time. A price increase opportunity occurs when a product is significantly under priced (by more than 2%) and a price decrease opportunity occurs when a product is significantly overpriced (by more than 2%).

    Further, the retailer gains insight into how many price improvement opportunities were actually acted on within 15 days of the opportunity presenting itself. This “action rate” helps retailers quantify how well they seize on price improvement opportunities, which eventually result in higher sales and margins. The dashboard also reports on the average number of days it took for a retailer to act on a price improvement opportunity, thereby quantifying the responsiveness and agility of pricing teams.

    This is especially useful for pricing leaders to “audit” or evaluate the performance of their pricing teams. When similar insights are viewed for a set of competitors as well, retailers can better understand the level of sophistication of their competitors’ pricing operations.

    Ready to Elevate Your Pricing Game?

    The launch of DataWeave’s PricingPulse marks a significant advancement in the realm of pricing solutions for retail leaders. As the retail landscape undergoes continuous transformation, the significance of precise pricing strategies cannot be overstated. PricingPulse is the first and only pricing view in the industry to bridge the gap between tactical pricing decisions and comprehensive strategic analysis.

    In a world where agility and foresight are crucial, PricingPulse equips retail leaders with the ability to predict competitor actions, optimize pricing strategies, and stay ahead of the competition.

    If you are a senior pricing leader or retail business unit head, reach out to us today to either sign up or learn more!

  • 5 Ways DataWeave Helps Brands Drive Growth With Amazon Ads

    5 Ways DataWeave Helps Brands Drive Growth With Amazon Ads

    Consumers are discovering and trialing new eCommerce marketplaces, brands and products at a faster rate than ever before, given the vast amount of choices encountered browsing for products online. A recent analysis shows how events like Amazon Prime Day, Black Friday, and Cyber Monday are especially fruitful for new-to-brand customer advertising, encouraging B2C marketers to increase their digital advertising spend to fuel product discovery, sales and market share for their brands.

    Amazon advertisers grow market share and brand loyalty with ecommerce intelligence
    DataWeave joins Amazon Advertising partner network

    The majority of eCommerce consumers are discovering products via relevant keywords attributable to their needs, with most clicks happening on page one results for the first few products listed. Simplifying the digital shopping experience is critical for brands to be in the consideration set for the majority of consumers who won’t venture past page one results. 

    An internal analysis conducted shows getting a product to page one on retailer websites can improve sales by as much as 50 percent, but figuring out the right levers to pull to get there organically—without paid advertising—is a real challenge, especially given fast-changing algorithms. While more than half of all retail related online browsing sessions are “organic”, sometimes brands need to boost their product visibility by investing in sponsored (paid) opportunities to improve a product’s rank.

    Data analytics can equip brands with intelligence to help them decide when, where, and how to make digital advertising investments profitably, while simultaneously acting on insights that help drive organic growth. Considering a majority of U.S. consumers begin their product discovery on marketplaces like Amazon, it makes sense for brands to prioritize digital advertising opportunities with Amazon.

    Maximize Return on Ad Spend (ROAS) with Amazon Ads

    Brands use Amazon Ads to drive brand awareness, acquire new customers, drive sales and gain market share, with the goal of furthering their marketing return on investment. Top performing advertisers average 40 percent greater year-on-year (YoY) sales growth, 50 percent greater YoY growth in customer product page viewership on Amazon, and 30 percent higher returns on ad spend (ROAS) with Amazon Ads, according to a recent analysis. Sponsored Products, Sponsored Brands, Amazon DSP and Sponsored Display are among the types of Amazon Ads options cited that produce maximum return.

    Ensuring your product listings appear at the top of page one results on Amazon for the most relevant discovery keywords is therefore the most important determinant for maximizing ROAS. DataWeave has become a vetted partner and measurement provider in the Amazon Advertising Partner Network, with the goal of supporting brands to optimize digital advertising campaigns by providing visibility to Digital Shelf Analytics (DSA) key performance indicators (KPIs), like Share of Search, Pricing and Product Availability, Content Audits, Ratings and Reviews, and Sales Performance and Market Share.

    Below is a summary of how our Digital Shelf solutions, in partnership with Amazon Ads, can improve the performance of your Amazon Ads campaigns

    1. Keyword Recommendations Improve Share of Search

    With the DataWeave Share of Search solution, brands can monitor their placement of both organic and paid discovery keywords relative to their competition. Once your keywords are determined, you are also provided a weighted Share of Search score that helps measure how well each keyword performs relative to product discoverability. Below is an example of insights you’d gain.

    Share of Keyword Search

    Brands can provide their own list of keywords to monitor, or through our Amazon Ads collaborative solution, learn which keywords are the “best” for them to measure in the realm of Amazon. Performance results are based on data that shows which keywords consumers are actually using when browsing online alongside other keywords brands request to measure. Users are able to see exactly which keywords are most popular, competitive (and even unexpected), and relevant at an Amazon Standard Identification Number (ASIN) level of granularity. 

    We can also estimate the degree of relevance and estimated traffic for the recommended keywords. Brands can then use these insights to adjust campaign strategies based on these parameters, which can boost product discoverability and rank visibility. A brand could assume people find its products by brand name, yet traffic insights may reveal a majority of people look for a generic product type before they end up buying that particular brand. 

    2. Content Audits Increase Discovery Relevancy Scores

    Strong product content is critical to succeeding on Amazon. Thorough, accurate, and descriptive content leads to better click through rates (CTR), conversion rates, more positive reviews, and fewer returns, which results in increased discoverability. DataWeave’s Content Audit solution reviews existing copy and images on a per-attribute basis to highlight any gaps essential to improving visibility, as seen in the example below.

    Content Analysis

    To further growth, it is equally as important that your product content aligns with your advertising strategy. With Amazon Ads partner add-on, our solution can also audit your content to measure how effectively you are incorporating Amazon Ads keywords into your product content to enhance discovery relevancy.

    3. Discover More Opportunities with Pricing and Product Availability Insights

    Quality content and keyword updates will only get you so far if your products are not consistently available and priced competitively. With DataWeave’s Pricing and Promotions and Product Availability modules, advertisers can monitor their selling prices and availability trends alongside their competitors to uncover more opportunities to incorporate into advertising campaigns, as seen in the Pricing and Promotions dashboard example below.

    Promotion Analysis

    Additionally, product targeting recommendations can be utilized to target a competitor’s ASIN that may be overpriced or that is having issues staying in stock. Alternatively, broaden your strategy to target specific brands, complementary products, or category listing pages.

    You can also create alerts on your own products to monitor when items are low on inventory or out of stock to ensure key products are consistently available when customers are shopping.

    4. Leverage Ratings and Reviews to Increase Conversion

    Product ratings and reviews are also a critical component to running a successful Amazon Ads campaign. A large number of reviews and a positive star rating will provide customers with the confidence to purchase, resulting in higher conversion rates. Conversely, negative feedback can have a detrimental impact, resulting in lost sales and wasted ad spend. DataWeave’s Ratings and Reviews module can help you monitor your reviews and extract attribute-level insights on your products. This information can then be utilized to further optimize your advertising strategy.

    If you see consistent feedback in your reviews on aspects of a product not meeting customer expectations, address them in your product content to prevent potential misplaced expectations. Alternatively, if customer reviews are raving about certain product features, ensure these are promoted and relevant keywords are populated throughout your descriptions and feature bullets. Below is an example of insights seen within the DSA Ratings & Reviews dashboard.

    Ratings and Reviews

    5. Correlate Digital Shelf KPIs to Sales Performance and Market Share

    The newest DSA module, Sales Performance and Market Share, provides SKU, sub-category, and brand-level sales and market share estimates on Amazon for brands and their competitors, via customer defined taxonomies, to easily benchmark performance results.

    This data can also be correlated with other Digital Shelf KPIs, like Content Audit and Product Availability, giving brands an easy way to check the effect of attribute changes and how they impact sales and market share. Similarly, brands can see how search rank, both organic and sponsored, affects sales and market share estimates.

    Understanding the correlation between your advertising campaigns and your Digital Shelf brand visibility will help you identify which areas to prioritize to drive sales and win more market share.

    Digital Shelf Insights Help Brands Win with Amazon Ads

    The need for access to flexible, actionable eCommerce insights is growing exponentially as a way to help brands drive growth, increase their Share of Voice, and to gain a competitive edge. As a result, more global brands are seeking Digital Shelf Analytics for access to near real-time marketplace changes and to develop data-driven growth strategies that leverage pricing, merchandising, and competitive insights at scale.

    By monitoring, measuring and analyzing key performance indicators (KPIs) like Sales Performance and Market Share, Share of Search, Content Audits, Product Availability, Pricing and Promotions and Ratings and Reviews alongside competitors, brands will know what actions to take to boost brand visibility, customer satisfaction, and online sales. 

    DataWeave’s acceptance into the Amazon Advertising Partner Network enables Amazon advertisers to effectively build their Amazon growth strategies and determine systems that enable faster and smarter advertising and marketing decision-making to optimize product discoverability and overall results.

    Connect with us now to learn how we can scale with your brand’s analytical needs, or for access to more details regarding our Amazon Ads Partnership or Digital Shelf solutions.

    UPDATED: Read the full press release here

  • How Brands Can Outperform Rivals With Next-Gen Digital Shelf Analytics

    How Brands Can Outperform Rivals With Next-Gen Digital Shelf Analytics

    As eCommerce grows in complexity, brands need new ways to grow sales and market share. Right now, brands face urgent market pressures like out-of-stocks, an influx of new competition and rising inflation, all of which erode profitability. As online marketplaces mature, more brands need to make daily changes to their digital marketing strategies in response to these market pressures, shifts in demand, and competitive trends.

    eMarketer forecasts 2021 U.S. eCommerce will rise nearly 18% year-over-year (vs. 6.3% for brick-and-mortar), led by apparel and accessories, furniture, food and beverage, and health and personal care. The eCommerce industry is also undergoing fundamental changes with newer entities emerging and traditional business models evolving to adapt to the changed environment. For example, sales for delivery intermediaries such as Doordash, Instacart, Shipt, and Uber have gone from $8.8 billion in 2019 to an estimated $35.3 billion by the end of 2021. Similarly, many brands have established or are building out a Direct to Consumer (D2C) model so they can fully own and control their customer’s experiences.

    In response, DataWeave has launched the next generation of our Digital Shelf Analytics suite to help brands across retail categories directly address today’s costly market risks to drive eCommerce growth and gain a competitive advantage.

    Our new enhancements help brands improve online search rank visibility and quantify the impact of digital investments – especially in time for the busy holiday season.”  
    ~ Karthik Bettadapura, CEO and co-founder, DataWeave

    The latest product enhancements provide brands access to tailored dashboard views that track KPI achievements and trigger actionable alerts to improve online search rank visibility, protect product availability and optimize share of search 24/7. Dataweave’s Digital Shelf Analytics platform works seamlessly across all forms of eCommerce platforms and models – marketplaces, D2C websites and delivery intermediaries.

    Dashboard for Multiple Functions

    While all brands share a common objective of increasing sales and market share, their internal teams are often challenged to communicate and collaborate, given differing needs for competitive and performance data across varying job functions. As a result, teams face pressure to quickly grasp market trends and identify what’s holding their brands back.

    In response, DataWeave now offers executive-level and customized scorecard views, tailored to each user’s job function, with the ability to measure and assess marketplace changes across a growing list of online retail channels for metrics that matter most to each user. This enhancement enables data democratization and internal alignment to support goal achievement, such as boosting share of category and content effectiveness. The KPIs show aggregated trends, plus granular reasons that help to explain why and where brands can improve.

    Brands gain versatile insights serving users from executives to analysts and brand and customer managers.

    Prioritized, Actionable Insights

    As brands digitize more of their eCommerce and digital marketing processes, they accumulate an abundance of data to analyze to uncover actionable insights. This deluge of data makes it a challenge for brands to know exactly where to begin, create a strategy and determine the right KPIs to set to measure goal accomplishment.

    DataWeave’s Digital Shelf Analytics tool enables brands to effectively build a competitive online growth strategy. To boost online discoverability (Share of Search), brands can define their own product taxonomies across billions of data points aggregated across thousands of retailer websites. They can also create customized KPIs that track progress toward goal accomplishment, with the added capability of seeing recommended courses of action to take via email alerts when brands need to adjust their eCommerce plans for agility.

    “Brands need an integrated view of how to improve their discoverability
    and share of search by considering all touchpoints in the digital commerce ecosystem.”

    ~ Karthik Bettadapura, CEO and co-founder, DataWeave

    Of vital importance, amid today’s global supply chain challenges, brands gain detailed analysis on product inventory and availability, as well as specific insights and alerts that prompt them to solve out-of-stocks faster, which Deloitte reports is a growing concern of consumers (75% are worried about out-of-stocks) this holiday season.

    User and system generated alerts provide clarity to actionable steps to improving eCommerce effectiveness.
    You also have visibility to store-level product availability, and are alerted to recurring out-of-stock experiences.

    Scalable Insights – From Bird’s Eye to Granular Views

    DataWeave’s Digital Shelf Analytics allows brands to achieve data accuracy at scale, including reliable insights from a top-down and bottom-up perspective. For example, you can see a granular view of one SKUs product content alongside availability, or you can monitor a group of SKUs, say your best selling ones, at a higher level view with the ability to drill down into more detail.

    Brands can access flexible insights, ranging from strategic overviews to finer details explaining performance results.

    Many brands struggle with an inability to scale from a hyper-local eCommerce strategy to a global strategy. Most tools available on the market solve for one or the other, addressing opportunities at either a store-level basis or top-down basis – but not both.

    According to research by Boston Consulting Group and Google, advanced analytics and AI can drive more than 10% of sales growth for consumer packaged goods (CPG) companies, of which 5% comes directly from marketing. With DataWeave’s advanced analytics, AI and scalable insights, brands can set and follow global strategies while executing changes at a hyper-local level, using root-cause analysis to drill deeper into problems to find out why they are occurring.

    As more brands embrace eCommerce and many retailers localize their online assortment strategies, the need for analytical flexibility and granular visibility to insights becomes increasingly important. Google reports that search terms “near me” and “where to buy” have increased by more than 200% among mobile users in the last few years, as consumers seek to buy online locally.

    e-Retailers are now fine-tuning merchandising and promotional strategies at a hyper-local level based on differences seen in consumer’s localized search preferences, and DataWeave’s Digital Shelf Analytics solution provides brands visibility to retailer execution changes in near real-time.

    Competitive Benchmarking

    Brand leaders cannot make sound decisions without considering external factors in the competitive landscape, including rival brands’ pricing, promotion, content, availability, ratings and reviews, and retailer assortment. Dataweave’s Digital Shelf Analytics solution allows you to monitor share of search, search rankings and compare content (assessing attributes like number of images, presence of video, image resolution, etc.) across all competitors, which helps brands make more informed marketing decisions.

    Brands are also provided visibility into competitive insights at a granular level, allowing them to make actionable changes to their strategies to stay ahead of competitors’ moves. A new module called ‘Sales and Share’ now enables brands to benchmark sales performance alongside rivals’ and measure market share changes over time to evaluate and improve competitive positioning.

    Monitor competitive activity, spot emerging threats and immediately see how your performance compares to all rivals’, targeting ways to outmaneuver the competition.

    Sales & Market Share Estimates Correlated with Digital Shelf KPIs

    In a brick-and-mortar world, brands often use point of sale (POS) based measurement solutions from third party providers, such as Nielsen, to estimate market share. In the digital world, it is extremely difficult to get such estimates given the number of ways online orders are fulfilled by retailers and obtained by consumers. Dataweave’s Digital Shelf Analytics solution now provides sales and market share estimates via customer defined taxonomy, for large retailers like Amazon. Competitive sales and market share estimates can also be obtained at a SKU level so brands can easily benchmark their performance results.

    Additionally, sales and market share data can also be correlated with digital shelf KPIs. This gives an easy way for brands to check the effect of changes made to attributes, such as content and/or product availability, and how the changes impact sales and market share. Similarly, brands can see how modified search efforts, both organic and sponsored, correspond to changes in sales and market share estimates.

    Take Your Digital Shelf Growth to the Next Level

    The importance of accessing flexible, actionable insights and responding in real-time is growing exponentially as online is poised to account for an increasing proportion of brands’ total sales. With 24/7 digital shelf accessibility among consumers comes 24/7 visibility and the responsibility for brands to address sales and digital marketing opportunities in real-time to attract and serve online shoppers around the clock.

    Brands are turning to data analytics to address these new business opportunities, enhance customer satisfaction and loyalty, drive growth and gain a competitive advantage. Companies that adopt data-driven marketing strategies are six times more likely to be profitable year-over-year, and DataWeave is here to help your organization adopt these practices. To capitalize on the global online shopping boom, brands must invest in a digital shelf analytics solution now to effectively build their growth strategies and track measurable KPIs.

    DataWeave’s next-gen Digital Shelf Analytics enhancements now further a brand’s ability to monitor, analyze, and determine systems that enable faster and smarter decision-making and sales performance optimization. The results delight consumers by helping them find products they’re searching for, which boosts brand trust.

    Connect with us to learn how we can scale with your brand’s analytical needs. No project or region is too big or small, and we can start where you want and scale up to help you stay agile and competitive.