Author: Nadir Islam

  • eCommerce Performance Analytics for CPG Private Label

    eCommerce Performance Analytics for CPG Private Label

    The combination of economic uncertainty, inflation, and perceived affordability has increased consumer’s willingness to buy and try more private label products, challenging National brands to differentiate their eCommerce strategies, especially those related to price positioning, in other ways.

    Our previously released report, Inflation Accelerates Private Label Share and Penetration, confirmed 8 out of 10 brands with the highest SKU count carried across all grocery retailer websites to be private label, signaling the strength of their digital Share of Voice. Given the growing shift in consumer preference toward private label brands, we are providing access to the latest trends seen from September 2021 through March 2022. Below you will find a summary of what the data revealed about the growing presence of private label brands on the Digital Shelf.

    Private Label Account and Category Penetration

    We analyzed private label penetration at an account level to understand which private label brands have the greatest presence on retailer digital shelves, and to see which retailers may be leaving product assortment opportunities on the table.

    Private Label Penetration Across Retail Grocer Websites

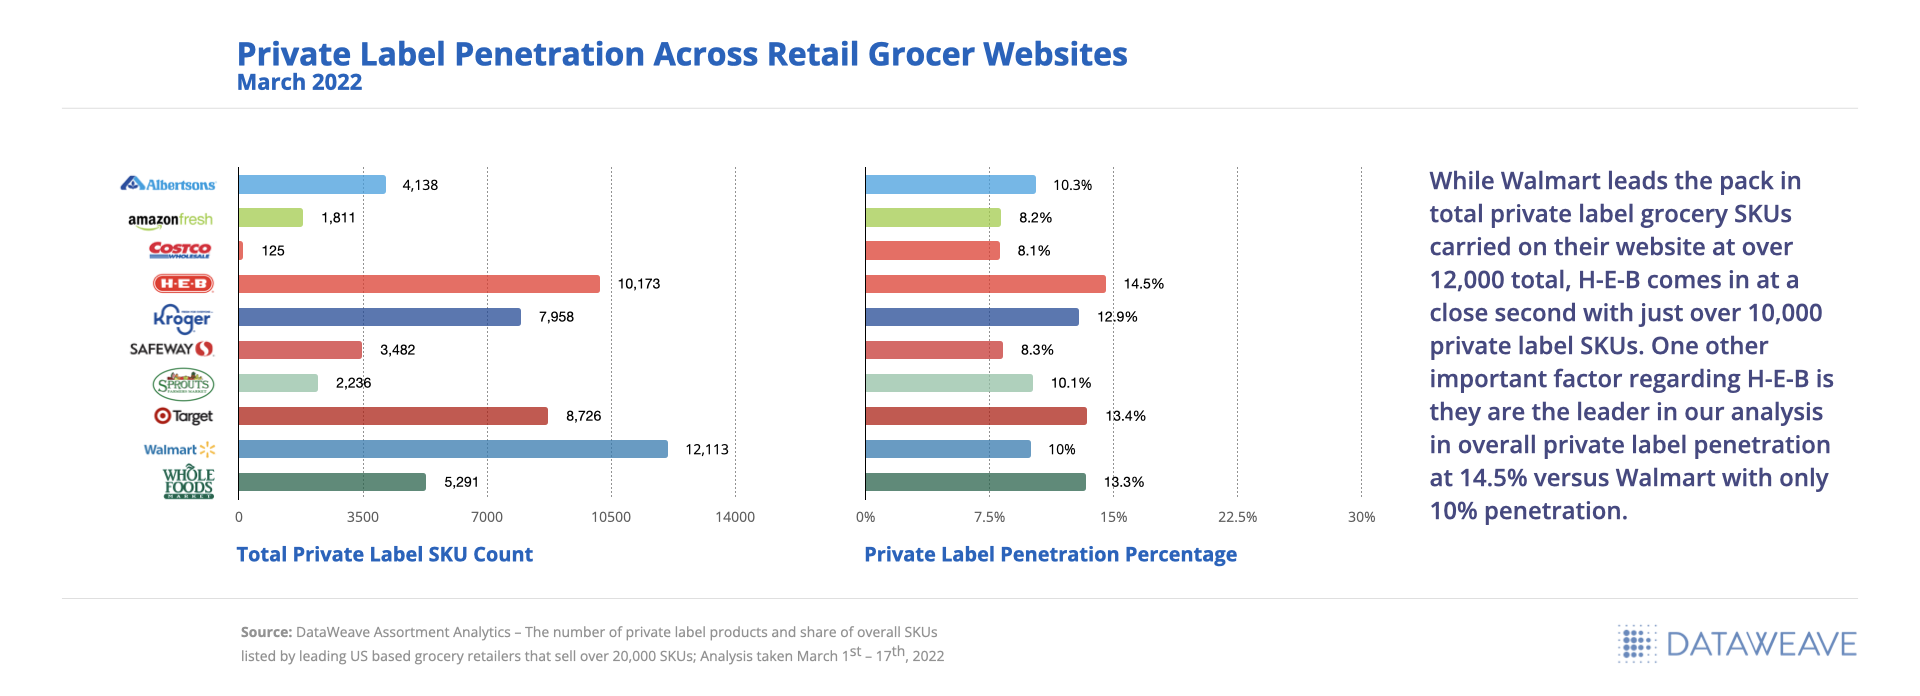
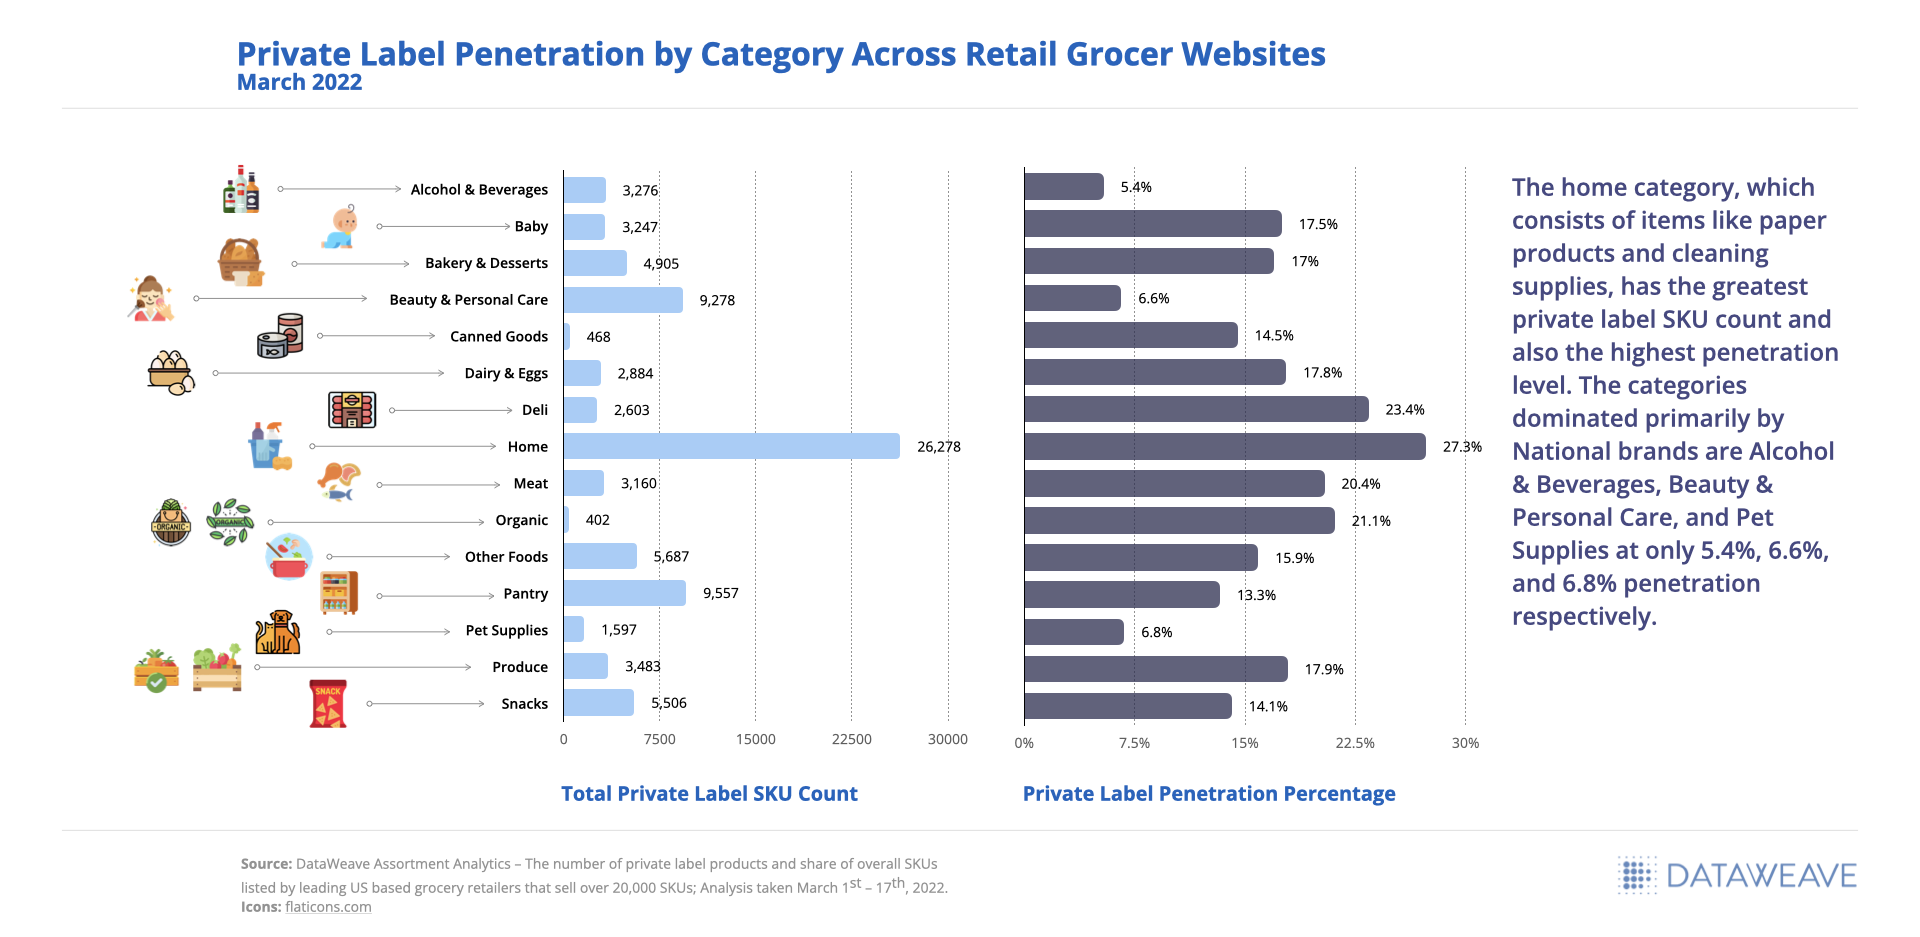
    As a retailer, it is important to understand how your private label penetration stacks up against the industry average at a category level, especially given the performance tracked for retailers included within our analysis and the vast number of SKUs they offer online (over 20,000).

    Private Label Penetration by Category Across Retail Grocer Websites

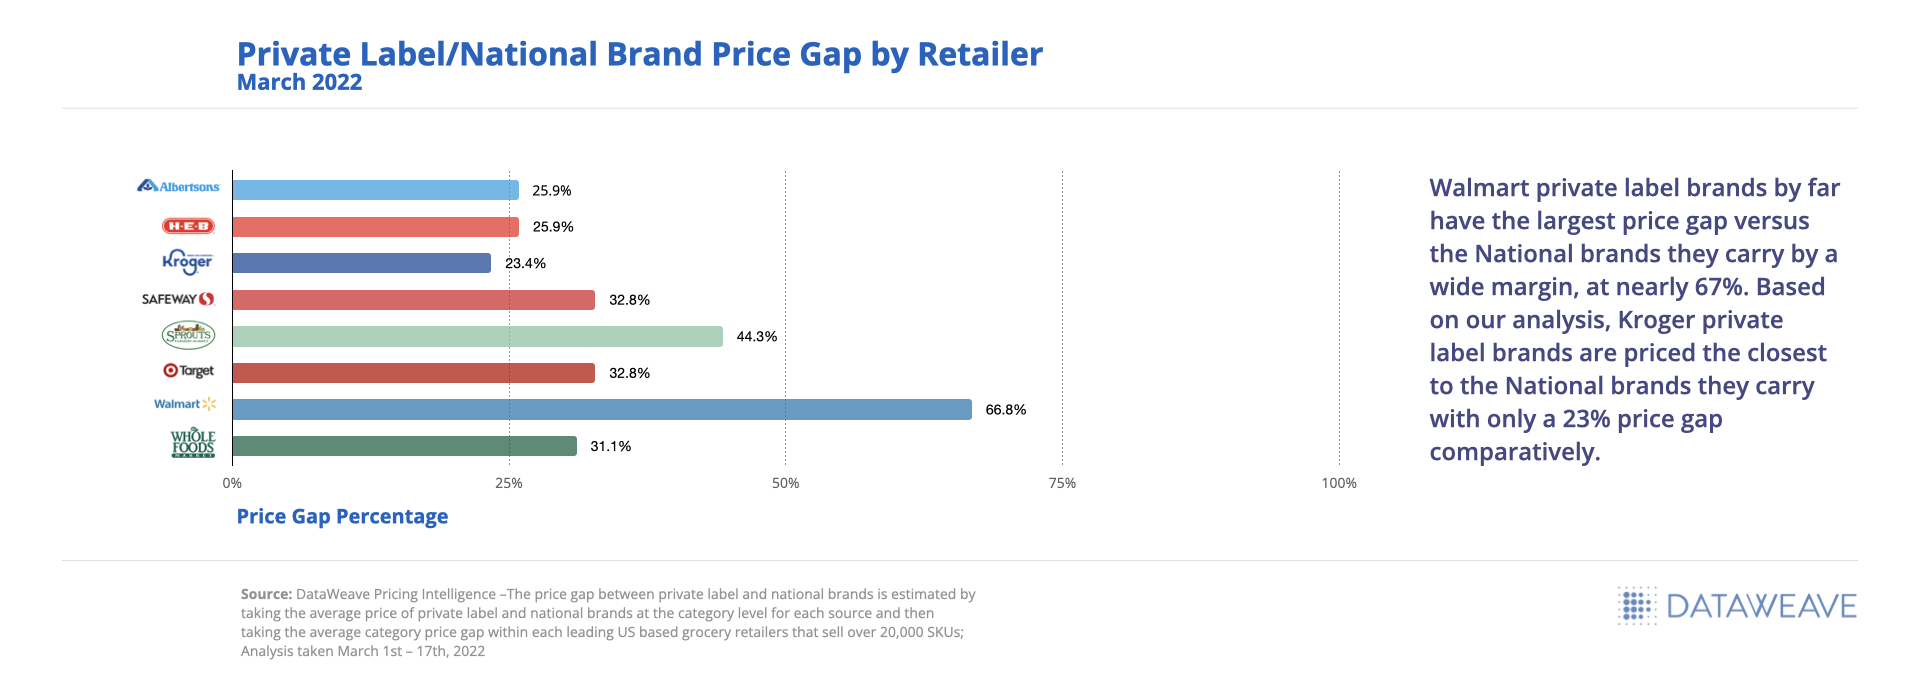
    The Private Label and National Brand Price Gap Widens

    Private label brands tried out of necessity mid-pandemic increased in popularity as grocery prices continued to rise, providing an opportunity for retailers to increase brand affinity and loyalty for their online shoppers. Retailers alike were able to keep affordability at the forefront of their strategies and maintain a price gap of 23% or more, despite inflationary pressures to increase prices.

    Private Label / National Brand Price Gap by Retailer

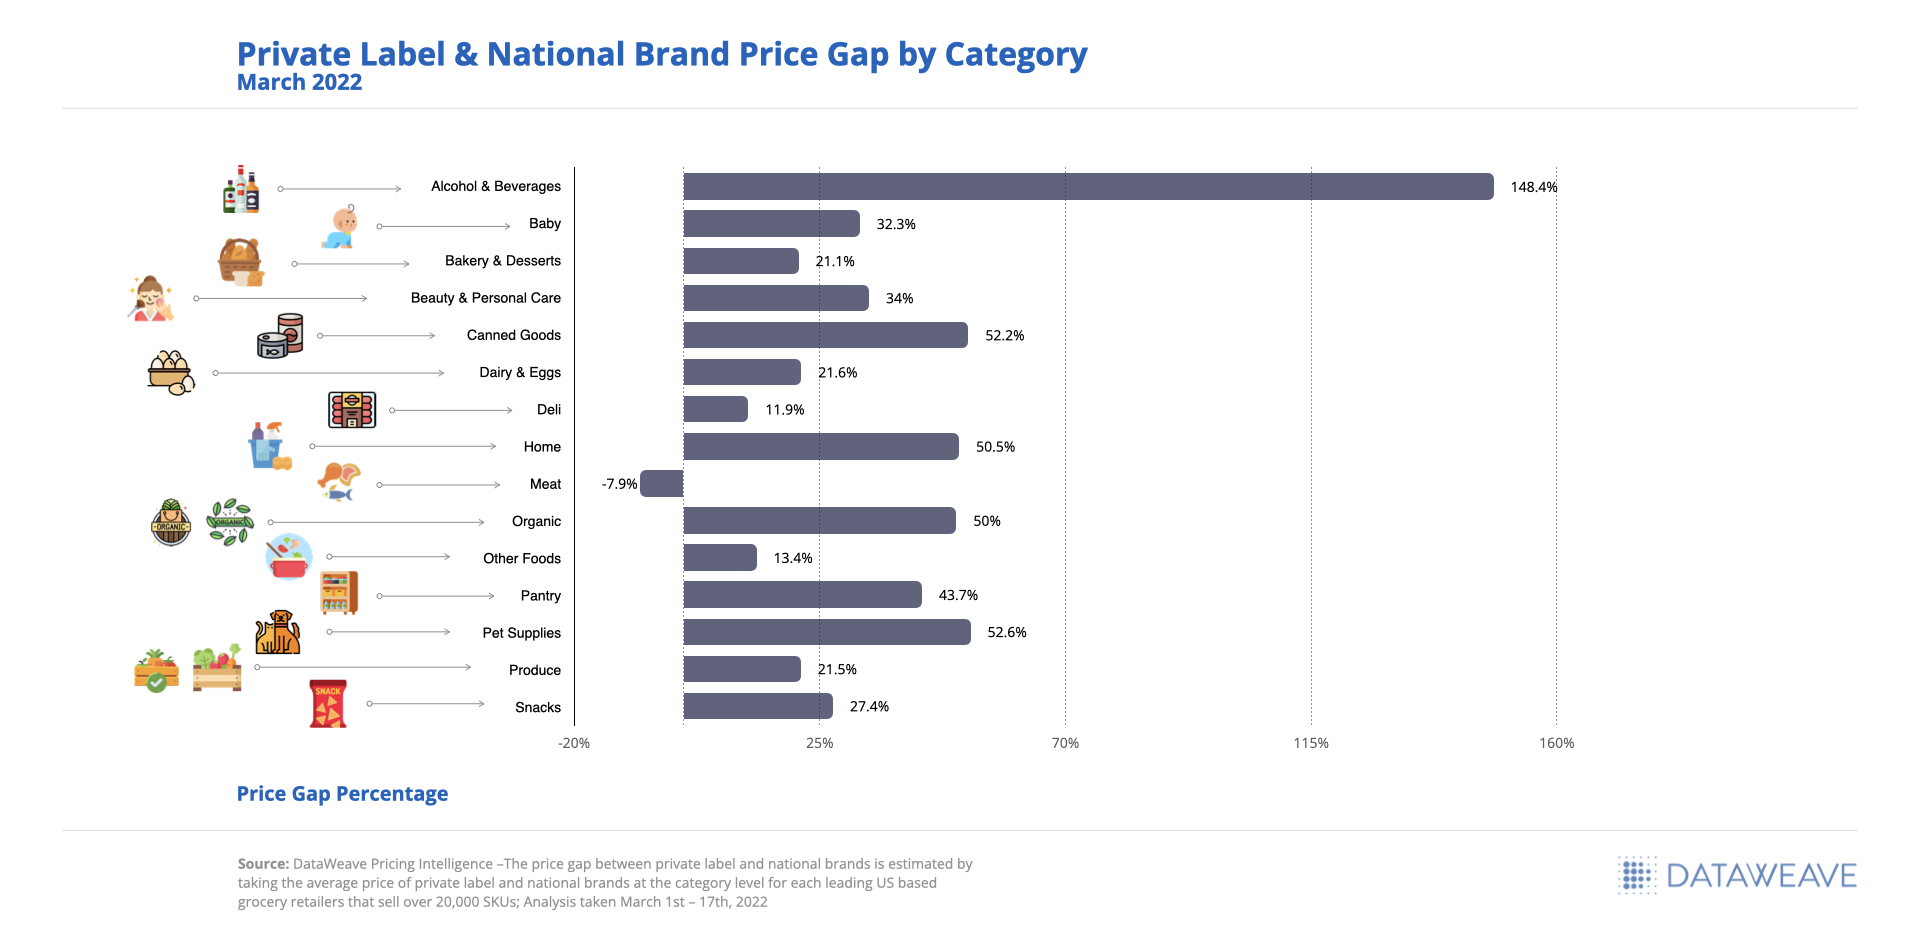
    Looking at the results at a category level, we can see that Meat is the only category found within our analysis where private label brands are priced higher than National brands at an average of 8% greater. The Alcohol & Beverages category tends to always see the greatest price gap between private label and National brands given the price variances by unit (ranging from under $10 to over $100), in this case averaging a 148% price gap.

    Private Label & National Brand Price Gap by Category

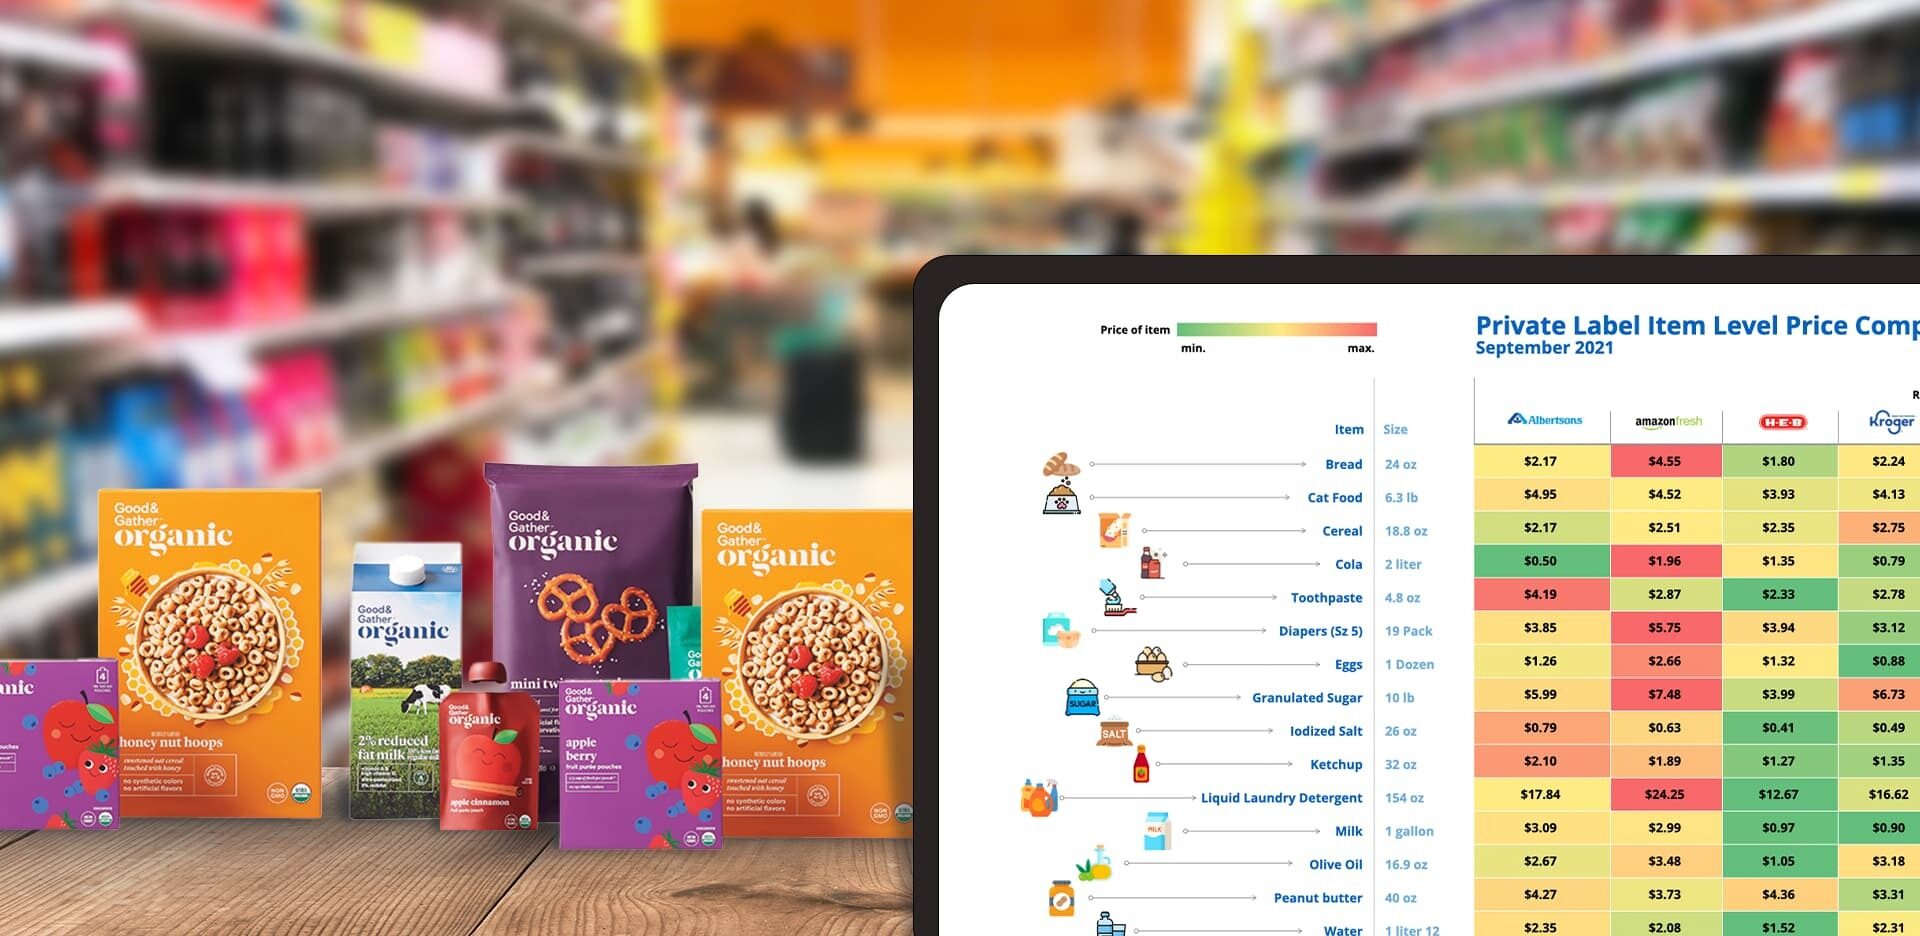
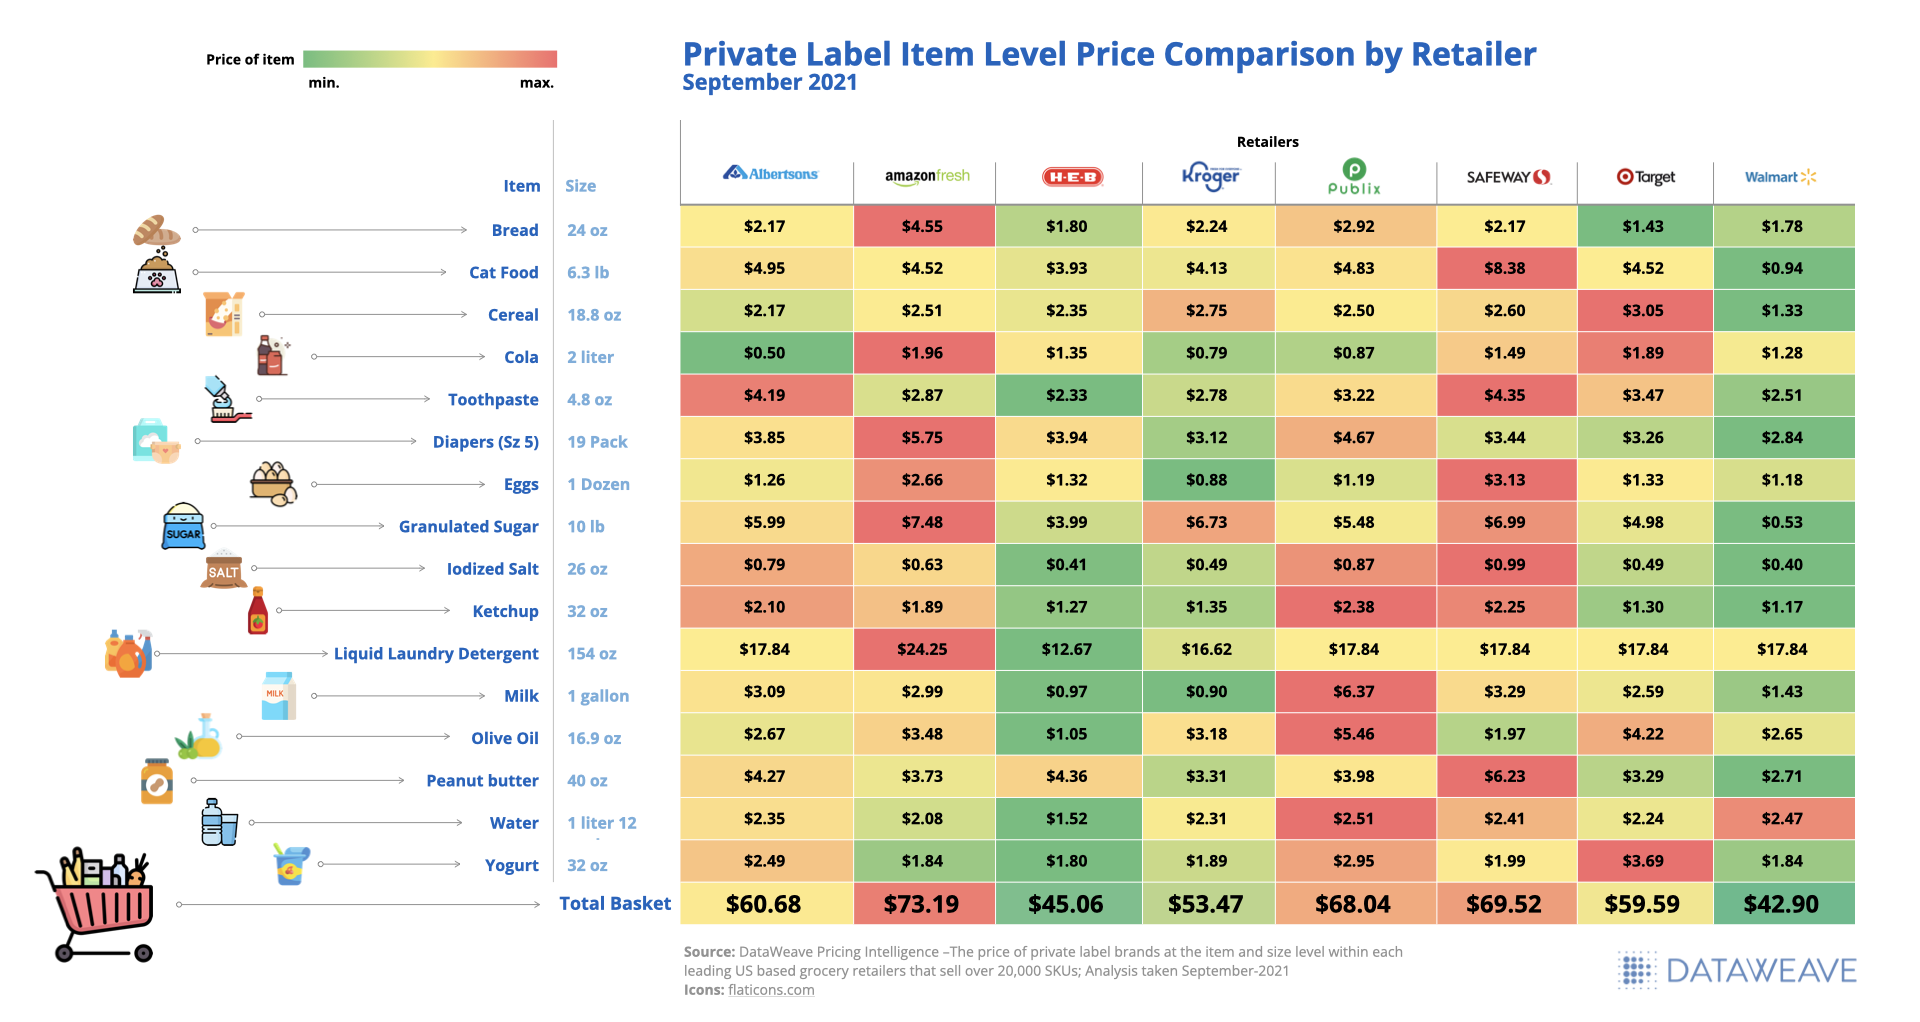
    Private Label Total Basket Value Comparison Across Retailers

    While SKU-level pricing is extremely important to product strategy, for a retailer, it is equally as important to be as mindful of the total basket value even more so now as consumers further their private label loyalty across various categories. A few SKU-level missteps in pricing decisions can exacerbate cart abandonment and negatively impact shopper loyalty in a world where prices can be compared instantly in the palm of your hand.

    Based on our analysis, Walmart and H-E-B private label products offered the lowest priced total basket of goods at $42.90 and $45.06 respectively, whereas AmazonFresh and Safeway offered the highest total at $73.19 and $69.52 respectively.

    Private Label Item Level Price Comparison by Retailer

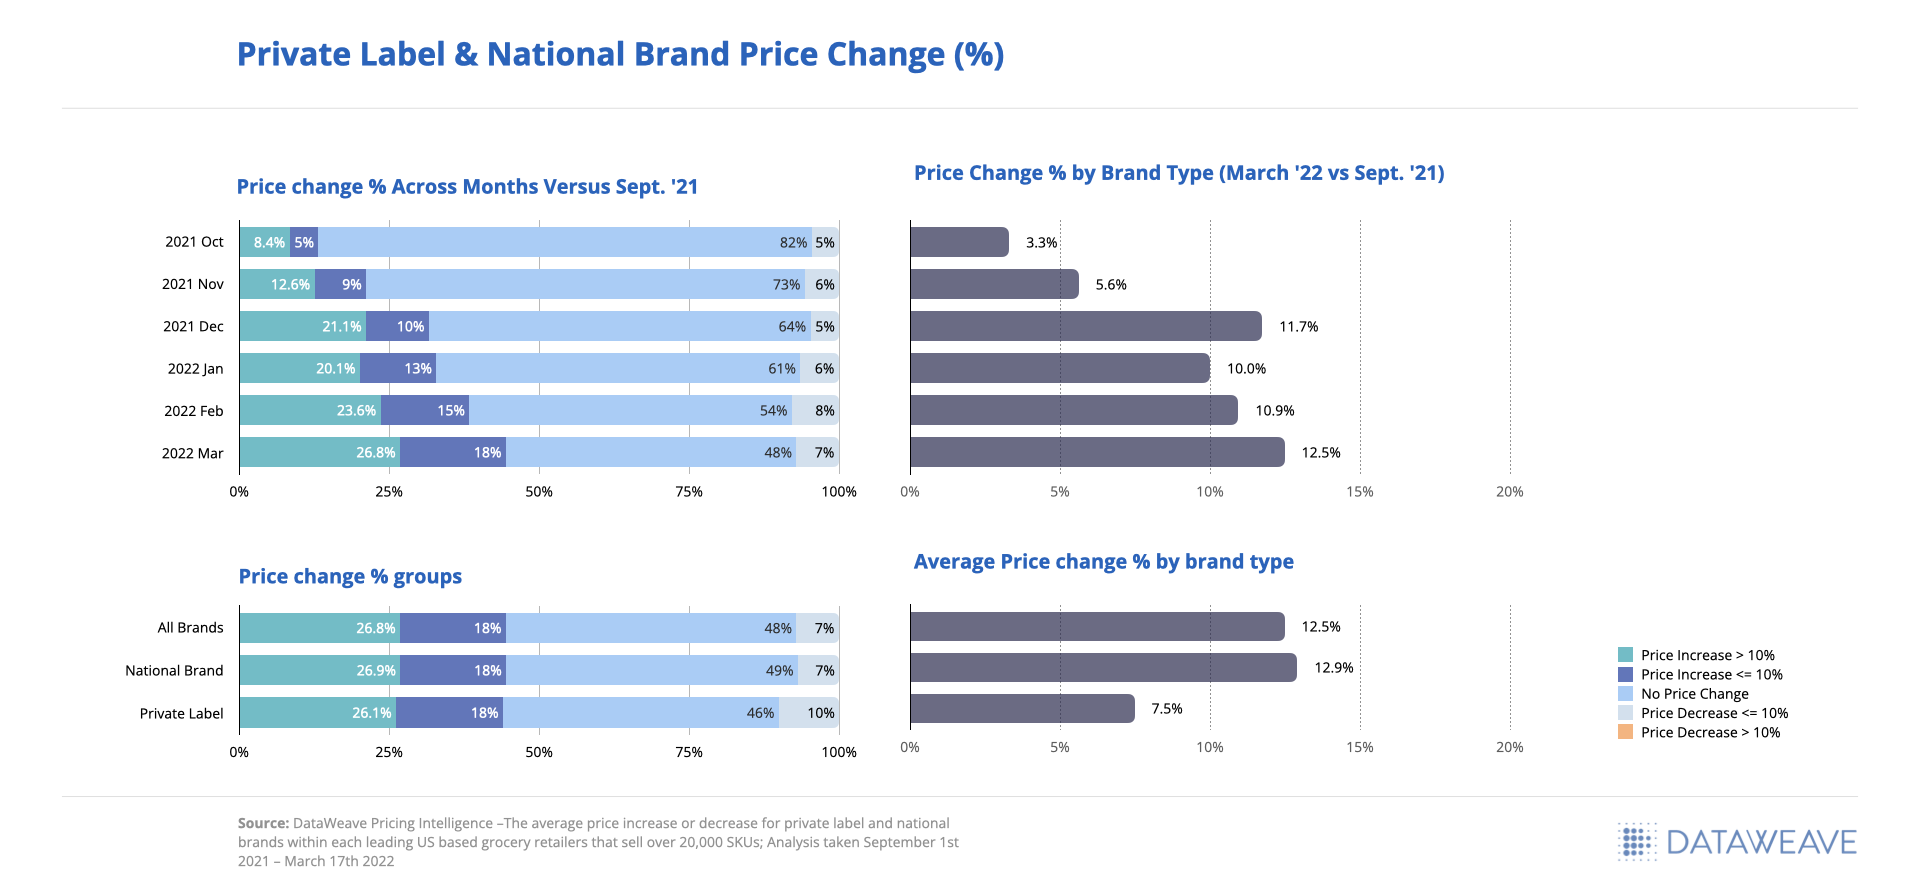
    Inflation-driven Price Changes are on the Rise with Room to Grow

    Based on the 20,000+ SKUs analyzed, we saw a continual price increase every month since September 2021 when comparing future monthly prices to those we tracked in September. The greatest price increase happened in March 2022 at 12.5% on average, however, there are still 48% of SKUs that have yet to see a price increase even as inflationary pressures rise.

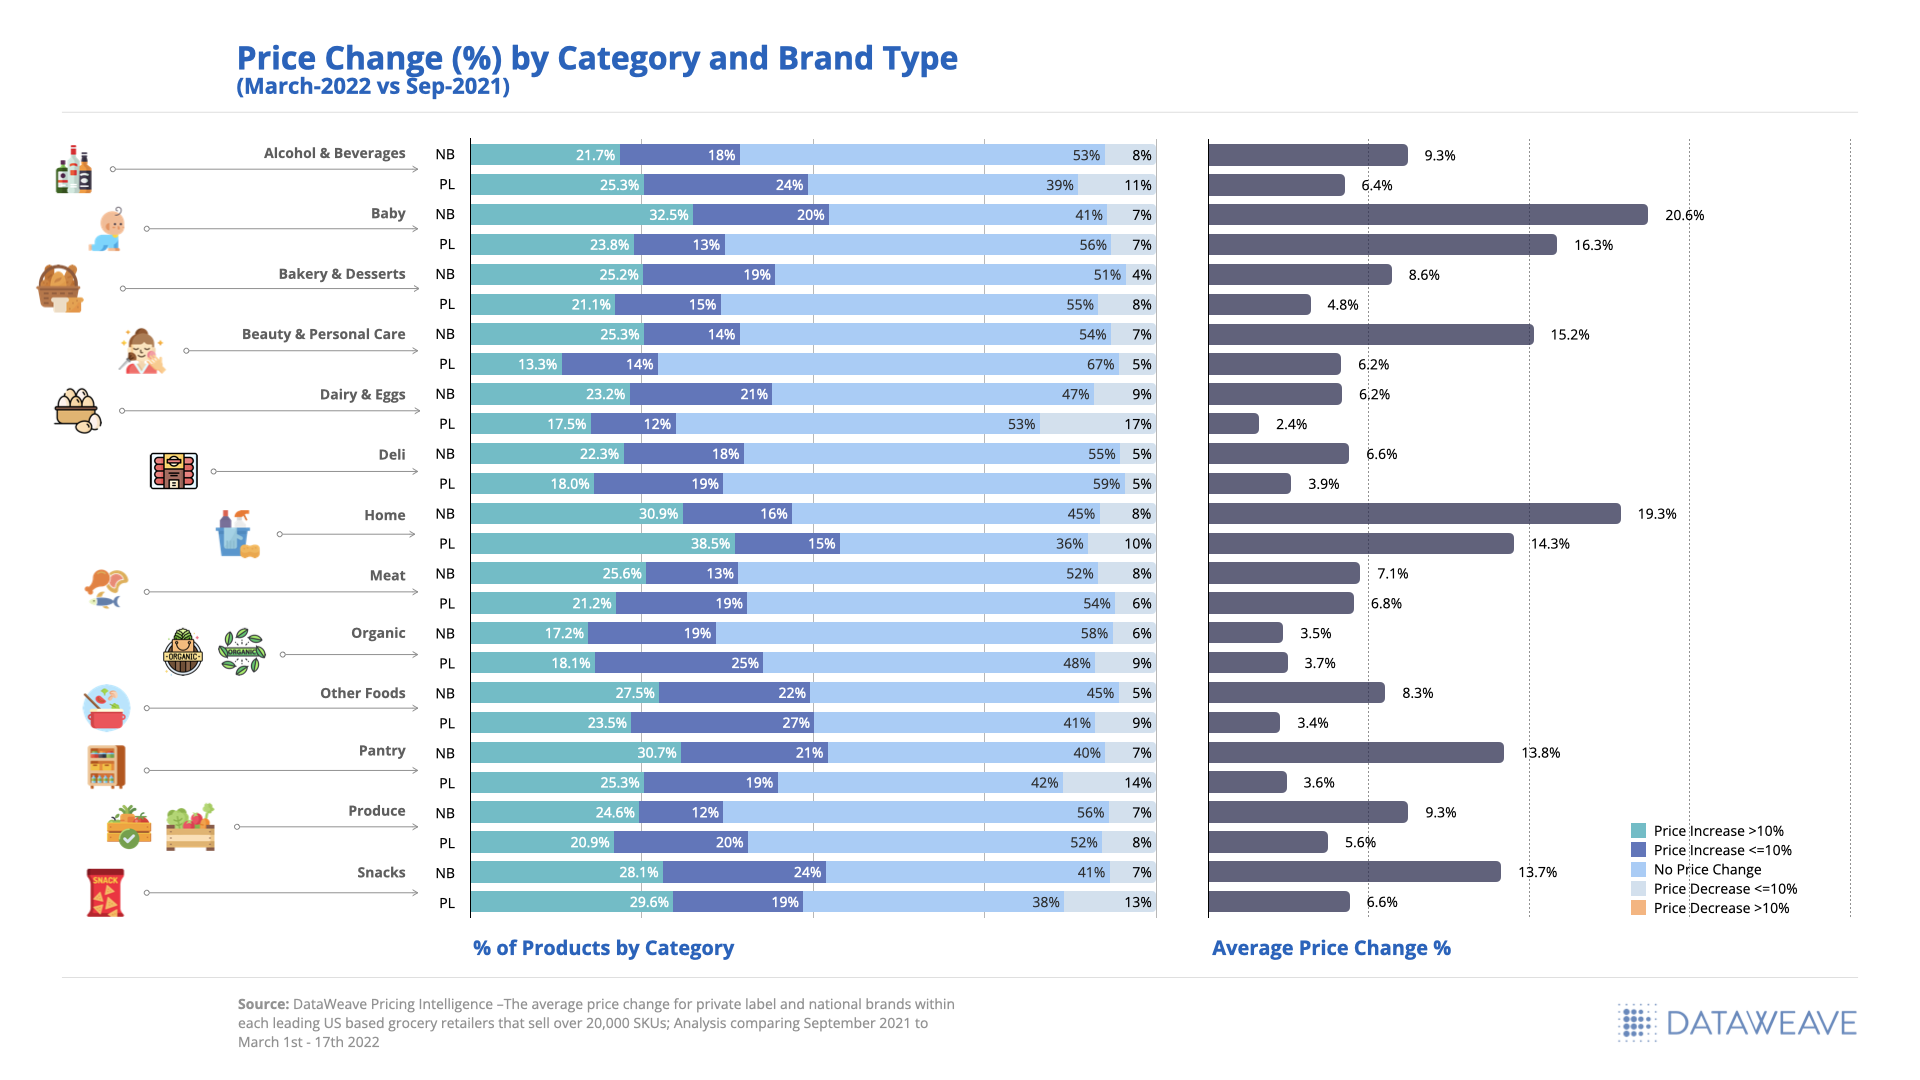
    When viewing the split between National and private label brand price increases in March 2022 versus September 2021, we saw National brands increased prices on average by 13% where private label brand prices only increased an average of 7%.

    Private Label & National Brand Price Change
    Private Label & National Brand Price Change (%)

    Price decreases are still occurring across all categories, despite inflation, but to varying degrees ranging from 5% for Deli items to 17% for Dairy & Eggs. Within the Dairy & Eggs and Pantry categories, private label brands reduced prices for an additional 10% of total SKUs compared to National brands.

    The greatest category of opportunity for price increases within private label were found within Beauty & Personal Care with 67% of private label products yet to see a price change since September 2021.

    Price Change (%) by Category and Brand Type

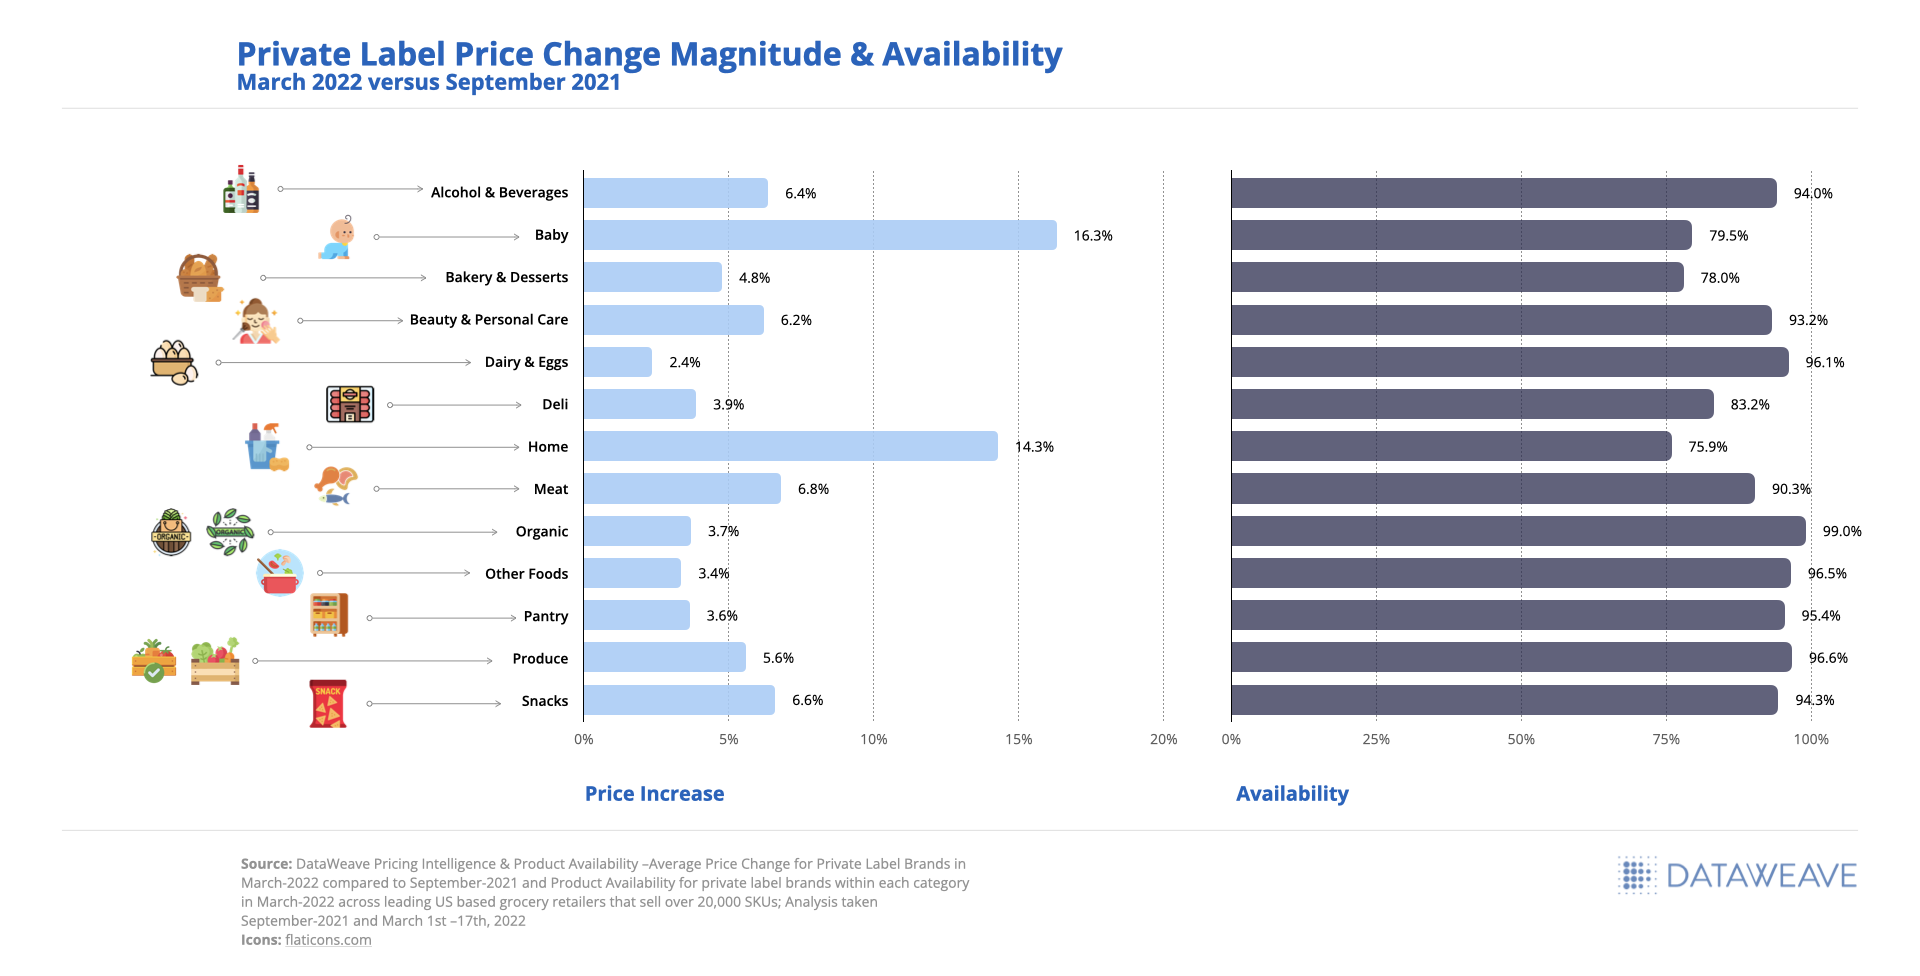
    Private Label Price Change Correlation to Product Availability

    The category with the greatest magnitude of price increase seen within private label brands occurred within Baby at 16.3% followed by Home at 14.3% on average. Private label products within Home and Baby categories were also showing the lowest availability rates, 75.9% and 79.5% respectively, indicating a high demand for these items even as prices increased.

    The private label categories with the smallest price increase on average were Dairy & Eggs at 2.4% and Other Foods and Pantry at 3.4% and 3.6%, respectively.

    Private Label Price Change Magnitude & Availability
    Private Label Price Change Magnitude & Availability

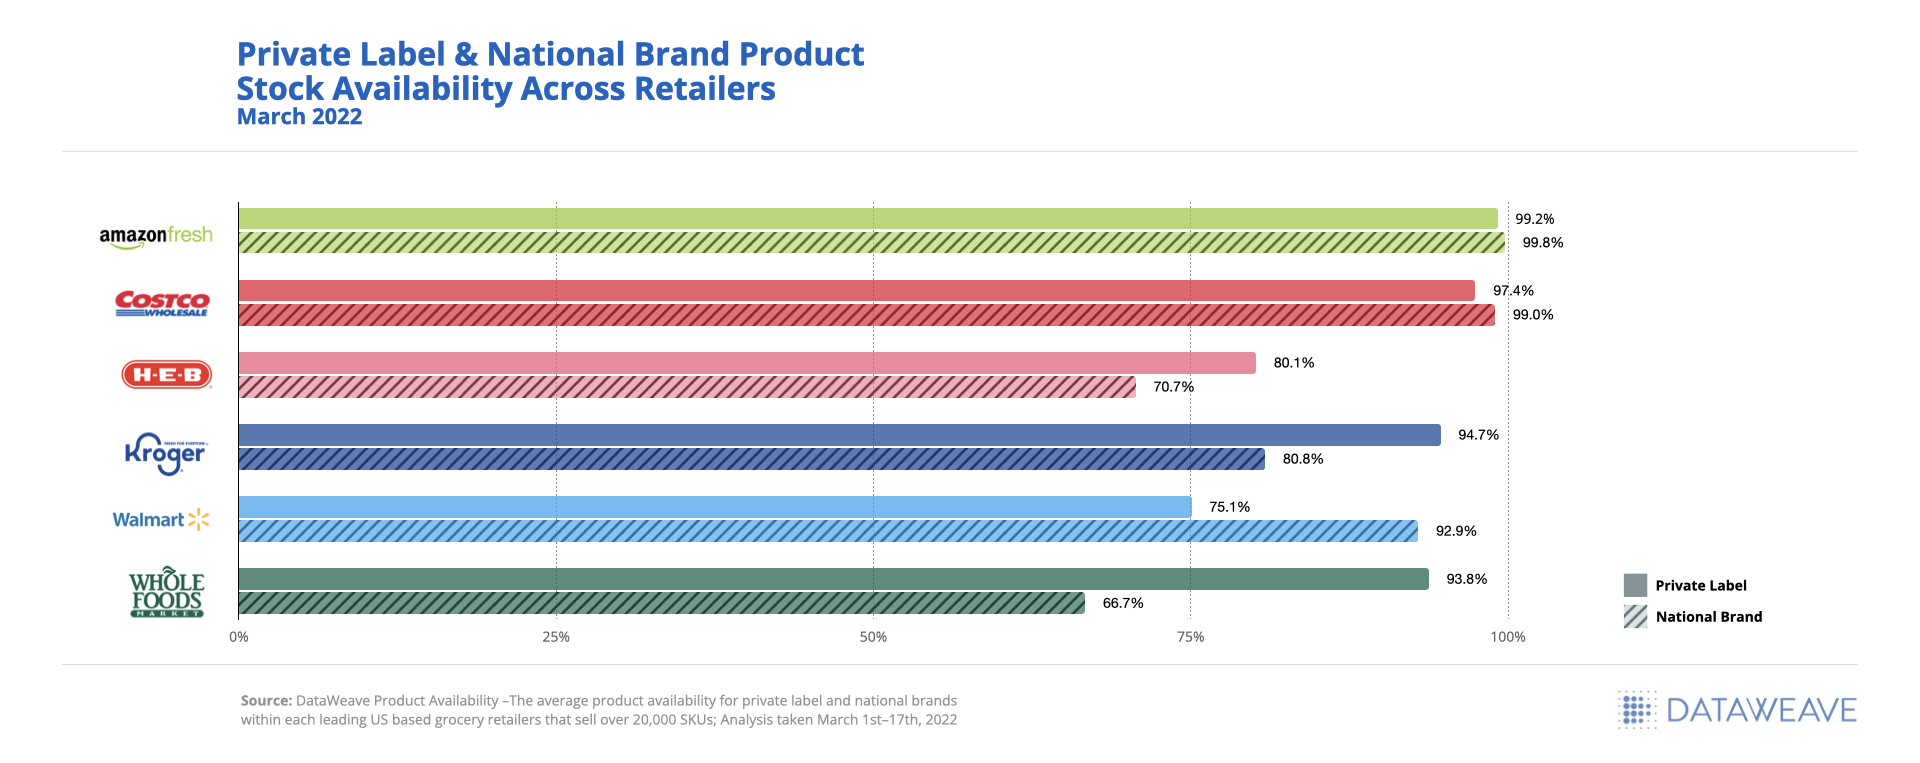
    While in many accounts both private label and National brands struggled with stock availability in March 2022, National brand availability is much lower (around 10% on average) than private label availability.

    H-E-B had the lowest overall product availability at 76% across both private label and National brands on average. Only Walmart had lower availability for Private Label at 75% compared to 93% for National brands, but they also had the greatest price gap between private label and National brands.

    Private Label & National Brand Product Stock Availability

    The Future of eCommerce Growth for Private Label

    Our greatest learning from this analysis is that it’s time for retailers to start thinking and planning more like the National brands they carry when it comes to positioning their private label brands for success. Successful retailers are taking this time to reset their private-label strategies and transfer short-term switching behavior into long-term customer loyalty.

    Retailers playing catch up have the opportunity to address some of the gaps highlighted throughout this analysis, for example, relative to pricing and assortment changes. Below are some of the highlighted opportunities:

    • Though inflation is driving price hikes, more than 50% of products analyzed have yet to see a price increase indicating an opportunity to protect margin
    • Narrowing the price gap between a store’s brand and National brands should not be the only focus as competitive private label brands are becoming a greater threat at a category and basket level
    • Modifying and expanding assortments as demand increases for private label can improve customer retention and loyalty, especially for cross-shopping consumers

    According to The Food Industry Association (FMI), only 20% of food retailers currently promote private brands on their homepages, and only 48% include detailed product descriptions indicating even more opportunities left on the table for retailers to optimize private label digital performance.

    Many leading retailers are leveraging real-time digital marketplace insights and eCommerce analytics solutions like ours to further their online brand presence and optimize sales performance. This report highlights only a small sample of the types of near real-time insights we provide our clients to effectively build competing strategies, make smarter pricing and merchandising decisions, and accomplish eCommerce growth goals. Be sure to reach out to our Retail Analytics experts for access to more details regarding the above analysis.

    For access to a previously recorded webinar presented in partnership with the Private Label Manufacturers Association and conducted by DataWeave’s President and COO, Krish Thyagarajan, click here.

  • 2021 Cost-Push Inflationary Trends Ran Rampant, Impacting Holiday Discounts

    2021 Cost-Push Inflationary Trends Ran Rampant, Impacting Holiday Discounts

    Business has been anything but usual this holiday season, especially in the digital retail world. The holiday hustle and bustle historically seen in stores was once again occurring online, but not as anticipated given the current strength of consumer demand and the reemergence of COVID-19 limiting in-store traffic. While ‘Cyber Weekend’, Thanksgiving through Cyber Monday, continues to further its importance to retailers and brands, this year’s performance fell short of expectation due to product shortages and earlier promotions that pulled forward holiday demand.

    Holiday promotions were seen beginning as early as October in order to compete with 2020 Prime Day sales, but discounting, pricing and availability took an opposite direction from usual. This shift influenced our team to get a jump start on our 2021 digital holiday analysis to assess how drastic the changes were versus 2020 activity, and to understand how much of this change has been influenced by inflationary pressures and product scarcity.

    Scarcity Becomes a Reality

    Our initial analysis started by reviewing year-over-year product availability and pricing changes from January through September 2021, leading up to the holiday season, as detailed in our 2021 Cyber Weekend Preliminary Insights blog. We reviewed popular holiday categories like apparel, electronics, and toys, to have a broad sense of notable trends seen consistently throughout various, applicable marketplaces. What we found was a consistent decline in product availability over the last six months compared to last year, alongside an increase in prices.

    Although retailers significantly improved stock availability in November and early December 2021, even digital commerce giants like Amazon and Target were challenged to maintain consistent product availability on their website as seen below. While small in magnitude, there is also a declining trend occurring again closer toward the end of our analysis period, post Cyber Weekend, across all websites included in our analysis.

    Inventory Availability 2021 Holidays
    Source: Commerce Intelligence – Product Availability insights for Home & Garden, Jewelry & Watches, Clothing & Shoes, Bed N Bath, Lighting & Ceiling Fans categories

    Greater Discounts, Higher Prices?

    With inflation at a thirty-nine year high, retailers and manufacturers have realized they can command higher prices without impacting demand as consumers have shown their willingness to pay the price, especially when threatened by product scarcity. Our assessment is that while some products and categories have responded drastically, manufacturers’ suggested retail prices (MSRPs) have increased nearly seven percent on average from January to December 2021. MSRP adjustments are not taken lightly either, as this is an indication increased prices will be part of a longer-term shift in product strategy.

    2021 MoM Retail Inflation Tracker
    Source: Commerce Intelligence – Pricing Insights for Bed & Bath, Electronics, Furniture, Healthy & Beauty, and Fashion categories on Amazon.com & Target.com each month in 2021 comparing price increases from January 2021 base

    Our 2021 pre-Cyber Weekend analysis reviewed MSRP changes for select categories (Bed & Bath, Electronics, Furniture, Healthy & Beauty, and Fashion) on Amazon and Target.com, and found around forty-eight percent of products on Amazon and thirty-five percent of products on Target.com have increased their MSRPs year-over-year, but kept pre-holiday discount percentages the same.

    Looking more specifically as to what year-over-year changes occurred on Black Friday in 2021, we observed MSRPs increasing across the board for all categories at various magnitudes. This indicates why 2021 discounts appeared to be greater than or equivalent to 2020 for many categories, when in reality consumers paid a higher price than they would have in 2020 for the same items.

    2021 Black Friday MSRP Increases
    Source: Commerce Intelligence – MSRP Pricing Insights for Bed & Bath, Electronics, Furniture, Healthy & Beauty, and Fashion categories on Black Friday November 27th, 2021, versus average MSRP pricing for the same SKU count from November 20-26th 2021

    On Amazon.com, categories like health & beauty have already increase MSRPs by a much greater percentage and magnitude versus Target.com leading up to and during Black Friday 2021, while other categories like furniture have increased MSRPs evenly on average across both retail websites. The below chart cites a few specific examples of year-over-year SKU-level MSRP, promotional price, and discount changes within found within the electronics, furniture, fashion, and health & beauty categories.

    Black Friday 2021 vs. 2020 SKU-level Price Changes
    Source: Commerce Intelligence – MSRP Pricing Insights for Bed & Bath, Electronics, Furniture, Healthy & Beauty, and Fashion categories on Black Friday November 27th, 2021, versus average MSRP pricing for the same SKUs on Black Friday November 26th, 2020.

    Fewer, but Deeper Discounts

    From October through early November 2021, fewer products were discounted compared to this same period in 2020, and the few that were saw much deeper discounts apart from the home improvement category. The most extreme example we saw in discounts offered was within furniture where only three percent of SKUs were on discount in 2021 compared to twenty-six percent in 2020. Interestingly, the magnitude of discount was also higher pre-Cyber Weekend 2021 versus 2020, but this trend was not exclusive to furniture and was also seen within electronics, health & beauty, and home improvement.

    Pre-Black Friday 2021 and 2020 SKUs on Discount and Magnitude
    Source: Commerce Intelligence – Pricing Insights for Bed & Bath, Electronics, Furniture, Healthy & Beauty, and Fashion categories on Amazon.com & Target.com Pre-Black Friday average selling price during November 20-26th 2021 versus average selling price from November 13-19th 2021 compared to Pre-Black Friday average selling price during November 19-25th 2020 versus average selling price from November 12-18th, 2020.

    Within the furniture category, the subcategories offering the greatest number of SKUs with price decreases on Black Friday 2021 were rugs by a wide margin, followed by cabinets, bed and bath, and entertainment units, but the magnitude of discounts offered were all under twenty percent.

    2021 Black Friday Furniture Category Price Decreases
    Source: Commerce Intelligence – Pricing Insights for Bed & Bath, Electronics, Furniture, Healthy & Beauty, and Fashion categories on Amazon.com and Target.com on Black Friday November 27th, 2021, versus average pricing for the same SKUs from Pre-Black Friday November 20-26th 2021 and Black Friday November 26th, 2020, versus average pricing for the same SKUs from Pre-Black Friday November 19th-25th 2020

    Accounting for this phenomenon could have been retailers’ attempts to clear inventory for SKUs which hadn’t sold even during the period of severe supply chain shortages. With more products selling at higher prices this year, retailers were also able to use fewer SKUs with greater discounts to attract buyer in hopes of filling their digital baskets with more full-priced goods, helping to protect margins heading in to Cyber Weekend. Scarcity threats also encouraged consumers to buy early, even when not on promotion, to ensure they would have gifts in time for the holidays.

    The same trends seen pre-Cyber Weekend 2021 were also seen on Black Friday with a year-over-year decrease in the percentage of SKUs offered on discount versus 2020, and steeper price reductions for the discounted products which can also be attributed to the increase in MSRPs.

    Black Friday 2021 and 2020 SKUs on Discount and Magnitude
    Source: Commerce Intelligence – Pricing Insights for Bed & Bath, Electronics, Furniture, Healthy & Beauty, and Fashion categories on Amazon.com and Target.com on Black Friday November 27th, 2021, versus average pricing for the same SKUs from Pre-Black Friday November 20-26th 2021 and Black Friday November 26th, 2020, versus average pricing for the same SKUs from Pre-Black Friday November 19th-25th 2020

    2021 Black Friday Price Increases?

    We all know Black Friday is all about price reductions, discounts and deals and so it’s rare to see actual price increases, yet for Black Friday 2021, trends ran counter to this. We observed price increases across all categories for around thirteen to nineteen percent of SKUs, with an average price increase of around fifteen percent in 2021 versus an average of only two percent in 2020.

    SKUs with Price Increases Black Friday 2021 and 2020
    Source: Commerce Intelligence – Pricing Insights for Bed & Bath, Electronics, Furniture, Healthy & Beauty, and Fashion categories on Amazon.com and Target.com on Black Friday November 27th, 2021, versus pricing for the same SKUs from Pre-Black Friday November 20-26th 2021 and Black Friday November 26th, 2020, versus average pricing for the same SKUs from Pre-Black Friday November 19th-25th 2020

    At an account level, we noticed a few interesting differences happening on Black Friday 2021 versus 2020 regarding category price changes. On Target.com, almost ninety percent of the bed and bath SKUs analyzed had a price change on Black Friday in 2021 versus 2020 with eighty-two percent presenting a higher price year-over-year versus only around seven percent showing a decrease, where on Amazon nearly forty-four percent of bed and bath SKUs showed an increase in price and around thirty-eight percent showed a decrease. Except for the health and beauty category on Target.com, more than half of the SKUs in each category saw a price increase on Black Friday versus a price decrease.

    2021 YoY Price Changes on Black Friday
    Source: Commerce Intelligence – Pricing Insights for Bed & Bath, Electronics, Furniture, Healthy & Beauty, and Fashion categories on Amazon.com and Target.com on Black Friday November 27th, 2021, versus average pricing for the same SKUs on Black Friday November 26th, 2020.

    The magnitude of year-over-year price changes seen on Black Friday 2021 was significant across all categories, but the magnitude of price increases found on Amazon.com within the health and beauty category outpaced the rest by far. We reviewed three hundred and sixty-five SKUs on Amazon.com within the health & beauty category and saw almost eighty-three percent of them had a price change with around thirty-one percent decreasing prices and around fifty-two percent increasing prices. This means that within the health & beauty category on Amazon.com, more than fifty percent of the SKUs tracked were sold at a one hundred and seventy-six percent higher price on average during Black Friday 2021 versus 2020.

    Magnitude of Black Friday 2021 Price Increases
    Source: Commerce Intelligence – Pricing Insights for Bed & Bath, Electronics, Furniture, Healthy & Beauty, and Fashion categories on Amazon.com and Target.com on Black Friday November 27th, 2021, versus average pricing for the same SKUs on Black Friday November 26th, 2020.

    The subcategories offering the greatest number of SKUs with price increases on Black Friday 2021 were cameras, followed by men’s fragrances, laptops, and desktops & accessories, but the magnitude of discounts offered were all under ten percent.

    2021 Subcategories with Price Increases during Black Friday
    Source: Commerce Intelligence – Pricing Insights for Bed & Bath, Electronics, Furniture, Healthy & Beauty, and Fashion categories on Amazon.com and Target.com on Black Friday November 27th, 2021, versus pricing for the same SKUs from Pre-Black Friday November 20-26th 2021 and Black Friday November 26th, 2020, versus average pricing for the same SKUs from Pre-Black Friday November 19th-25th 2020

    The Aftermath Post-2021 Cyber Weekend

    Extending this analysis beyond the holiday weekend, we analyzed price change activity from December third through the ninth across the top US retailers (chart below) and found that price decreases have been very minimal, comparatively speaking. Though there was a spike in number of price decreases from December 8th to the 9th, the percentage of SKUs with price decreases was still very low (less than three percent). We anticipate this trend will continue into 2022.

    SKUs with Price Decrease Post Cyber Weekend 2021
    Source: Commerce Intelligence – Pricing insights for Home & Garden, Jewelry & Watches, Clothing & Shoes, Bed N Bath, Lighting & Ceiling Fans categories

    A Sign of Things to Come

    A confluence of inflationary trends, product shortages and consumer liquidity have driven many marketplace changes to occur simultaneously. Government programs in the form of stimulus checks, have put extra money in consumers’ hands, and so they’ve been more willing to spend. That, coupled with the shock in the supply chain, has motivated people to buy far ahead of the 2021 holiday season. Hence, retailers have needed to rely much less on across-the-board discounts. Promotions have been more strategic – we’ve seen deeper discounts over fewer products, likely used to draw consumers in to buy certain items, and once they’re there, customers are buying everything else at a non-discount level. When these factors once again normalize, we could see a return to the “race to the bottom” that has occurred since the financial crisis of 2008-2009, but for once, retailers may be able to maintain some pricing power as the 2021 holiday shopping season played out.

    Even though performance was not as anticipated and holiday sales did not grow as rapidly as they did in 2020, Cyber Monday was still the greatest online shopping day in 2021. Through it all, retailers managed to keep their digital shelves stocked and orders filled in time for the holidays for the most part, running the risk of housing aged inventory if goods didn’t arrive in time. Despite predictions for steep promotions in January 2022, with supply chains still challenged and inflationary pressures still full steam ahead, we don’t anticipate much in the way of enhanced discounts to continue beyond the holidays.

    Access to these types of real-time digital marketplace insights can enable retailers and brands to make strategic decisions like how and when to address inflationary pressures, while also supporting many other day-to-day operations and help drive profitable growth in an intensifying competitive environment. Continue to follow us in the coming weeks for a detailed 2021 year-end review across more retailers and categories. Be sure to reach out to our Retail Analytics experts for access to more details regarding the above analysis.         

  • Fashion on Black Friday: Decoding Pricing Strategies of Top U.S. Retailers

    Fashion on Black Friday: Decoding Pricing Strategies of Top U.S. Retailers

    Over the last few Thanksgiving Weekend sales, fashion, what was a category once typically reserved for offline purchases, has evolved into a regularly marked down and popular category as shoppers get more comfortable making these purchases online. This can be credited to the ease of purchase that retailers offer – trials, returns, etc. combined with the desire for shoppers to refresh their wardrobe for the new year ahead.

    At DataWeave, we performed an analysis on a sample of 40,000+ products across six of the top fashion retailers – Amazon, Bloomingdale’s, Macy’s, Nordstrom, Target and Walmart. . Twenty product types were covered across both men’s and women’s fashion and the analysis focused on the top 500 ranked products of each product type.

    Additional Markdowns

    For the sake of this analysis, we compared the prices during the sale with the mode of the prices the week before. This gave us a clear picture of the additional markdowns during the sale period and therefore, the additional value to shoppers.

    Dominating the fashion space, Nordstrom and Macy’s came in hot with the most aggressive discounts on the largest share of their product range, 36% and 27% respectively, on more than a quarter of their range. In the women’s lineup, Target offered a 36% markdown, compared to ~22% for its men’s lineup. Across both categories though, this was only on 1% of Target’s range. In what seems to be an expected trend, Amazon and Walmart remained relatively conservative with their additional markdowns, as they tend to be competitively priced even during non-sale periods.

    Drilling down into the product types, we noticed that very aggressive markdowns were being offered on t-shirts and skirts (over 40%). Swimwear, hosiery, handbags, and sunglasses were other product types that were featured with attractive prices across websites.

    Product Premiumness

    We categorized the products across retailers into buckets of how expensive or cheap the product is, relative to the rest of the products hosted by the retailer. Where the MRP was not displayed, the most expensive price of the product during the holiday period prior to Black Friday was considered. We then bucketed products in categories of High, Medium and Low of product premiumness, with High containing the more expensive products by price.

    Amazon, Bloomingdale’s, Macy’s and Nordstrom chose to markdown the more expensive products in their range higher than the rest of their assortment. This aligns well with what one would expect retailers to do as shoppers tend to expect attractive offers on the more expensive range of products. Also, with the more expensive products, retailers and brands likely have more room to be flexible with margins. Amazon shows a consistent strategy here, having provided higher markdowns on a relatively higher portion of its most premium products and vice versa. This trend can only otherwise partially be seen with Macy’s.

    Walmart though, chose to go the other route and provided higher markdowns on its least premium products. This might have been a targeted effort to maintain their perception among shoppers as a destination for affordable goods. Though it’s important to note here that these markdowns were seen only on a small set of cheap goods – just over 5%.

    Price Change Activity

    Walmart, Nordstrom and to an extent, Bloomingdale’s, had an almost consistent number of price changes throughout the week. Nordstrom recorded the most significant dip in the magnitude of the markdowns over time.

    Amazon and to a smaller degree, Macy’s, had more price changes during the week. However, Amazon’s average price variation remained among the lowest whereas Macy’s clocked in the highest by Black Friday at just under 40%.

    Across the board, the price changes dipped on the 28th and then rose again on the 29th. This can be seen as a conscious effort to have more aggressive activity on Black Friday.

    In summary, fashion-first retailers like Macy’s and Bloomingdale’s went all-in during the sale, while Nordstrom, a multi-category retailer, stood out for its aggressive focus on fashion.

    Amazon and Walmart continued to operate within the competitive space that they’ve carved out for themselves as the leading retailers in the US. We observed a similar trend even in the other product categories we’ve analyzed for the sale. Check out our analysis of the Electronics category during Black Friday here.

  • How to Win the Coveted Amazon Buy Box | DataWeave

    How to Win the Coveted Amazon Buy Box | DataWeave

    Did you know that over 80% of purchases on Amazon.com is via the buy box?

    While Amazon is all the rage today, raking in 43% of all eCommerce dollars, thousands of merchants on the online marketplace look to seize every opportunity to attract shoppers and drive sales each day. And for these merchants, getting on the buy box is more than half the battle won.

    Recently, Forbes.com published our study of how online merchants can plot their strategy to win the buy box. In this article, we’ll explore some of the key takeaways from this study.

    What is the Amazon buy box?

    The buy box is the section on the right side of Amazon’s product page, where shoppers can add items for purchase to their cart. Since multiple merchants often offer the same product, they compete to win the buy box spot on the product page, which is where customers typically begin the purchasing process — a huge competitive advantage.

    How can merchants win the buy box spot?

    At DataWeave, we aggregate and analyze billions of data points from the Web to deliver Competitive Intelligence as a Service to retailers and consumer brands. Using our proprietary technology platform, we aggregated data for a large sample of products in the mobile phones, clothing, shoes and jewelry categories on Amazon and collected information on all merchants (over 700 in number) selling these product over a period of 10 days.

    We looked closely at several factors that could possibly impact the choice for the buy box:

    • Was Amazon a merchant or not?
    • The effective price (list price + shipping charges — offer/cashback amount) — after all, a common assumption is that the lowest priced merchant has the best chance of winning.
    • Were Prime benefits offered?
    • The quality of review ratings
    • The stock status
    • The number of products offered by a merchant

    We parsed through the data to unearth some interesting insights and found that some factors influenced the move to the buy box spot more than others.

    We see that when Amazon is a merchant, it’s twice as likely to win the buy box compared to other merchants. Further analysis revealed that for around 95% of instances where Amazon was a merchant but was NOT the in the buy box, Amazon was selling at a price 20% greater than the minimum price.

    When the effective price is the lowest, relative to other merchants, the chances of the merchant winning the buy box increased 2.5-fold. Essentially, for the set of merchants who were the lowest priced for each product, only 26% of them won the buy box.

    Merchants who provided Prime benefits to shoppers were 3.5 times more likely to win compared to other merchants. And lastly, if the percentage of positive reviews for a merchant are decreasing over time, the merchant is 5X less likely to win. All other factors analyzed failed to yield statistically significant results.

    Interestingly, no single factor played an overwhelming role in influencing the buy box criteria. So, with the help of statistical modelling, which considers and weighs all factors, we better understood the relationship between all factors, and traced a path for merchants to win the buy box.

    The Cheat Sheet

    While it isn’t quite possible to develop a fool proof framework, the following flowchart can act as a fairly useful guide.


    Clearly, the path to the buy box is not a straightforward one.

    If Amazon itself is a merchant for a product, chances of other merchants winning the buy box are low (35%). However, if a merchant is looking to compete with Amazon for the buy box spot, offering Prime benefits is key (82% probability). Without offering Prime, chances of winning the buy box are almost negligible, even if the merchant is the lowest priced. It’s interesting to note that when Amazon does occupy the buy box spot, it’s the lowest priced in 79% of the cases.

    When Amazon is not a merchant for a product, and competition is only between third-party merchants, offering Prime benefits is still the most influential factor (78%). When Prime isn’t offered, the price is the primary determinant of the buy box merchant (86%).

    Evidently, reducing the price is not always the best course of action. It appears that offering Prime benefits has the biggest impact on a merchant’s chances of winning the buy box, across various scenarios.

    However, it’s important to keep in mind that moving up the “merchant ladder” is a gradual process, based on how merchants perform consistently over time.

    If you’re interested to learn more about DataWeave’s technology, and how we help retailers and consumer brands optimize their online strategies, visit our website!