We’ve come a long way from face paint and medicinal herbs to multi-billion dollar industries revolving around health and beauty. Customers are getting increasingly bombarded with variety that promises something for everyone. In fact, a recent DataWeave study identified Health & Beauty as one of the most popular CPG categories in the U.S., both in terms of assortment strength and brand concentration. As with most other categories, pricing activity around Health & Beauty is especially abuzz when Thanksgiving weekend comes around.
As part of our series of articles analyzing the pricing of leading retailers across categories on Black Friday, the DataWeave team performed an analysis on a sample of 14,000+ products across six top retailers – Amazon, JC Penney, Macy’s, Nordstrom, Target and Walmart. Seven product types were covered across the category, such as Fragrance, Hair Care, Makeup, etc. and the analysis focused on the top 500 ranked products of each product type.
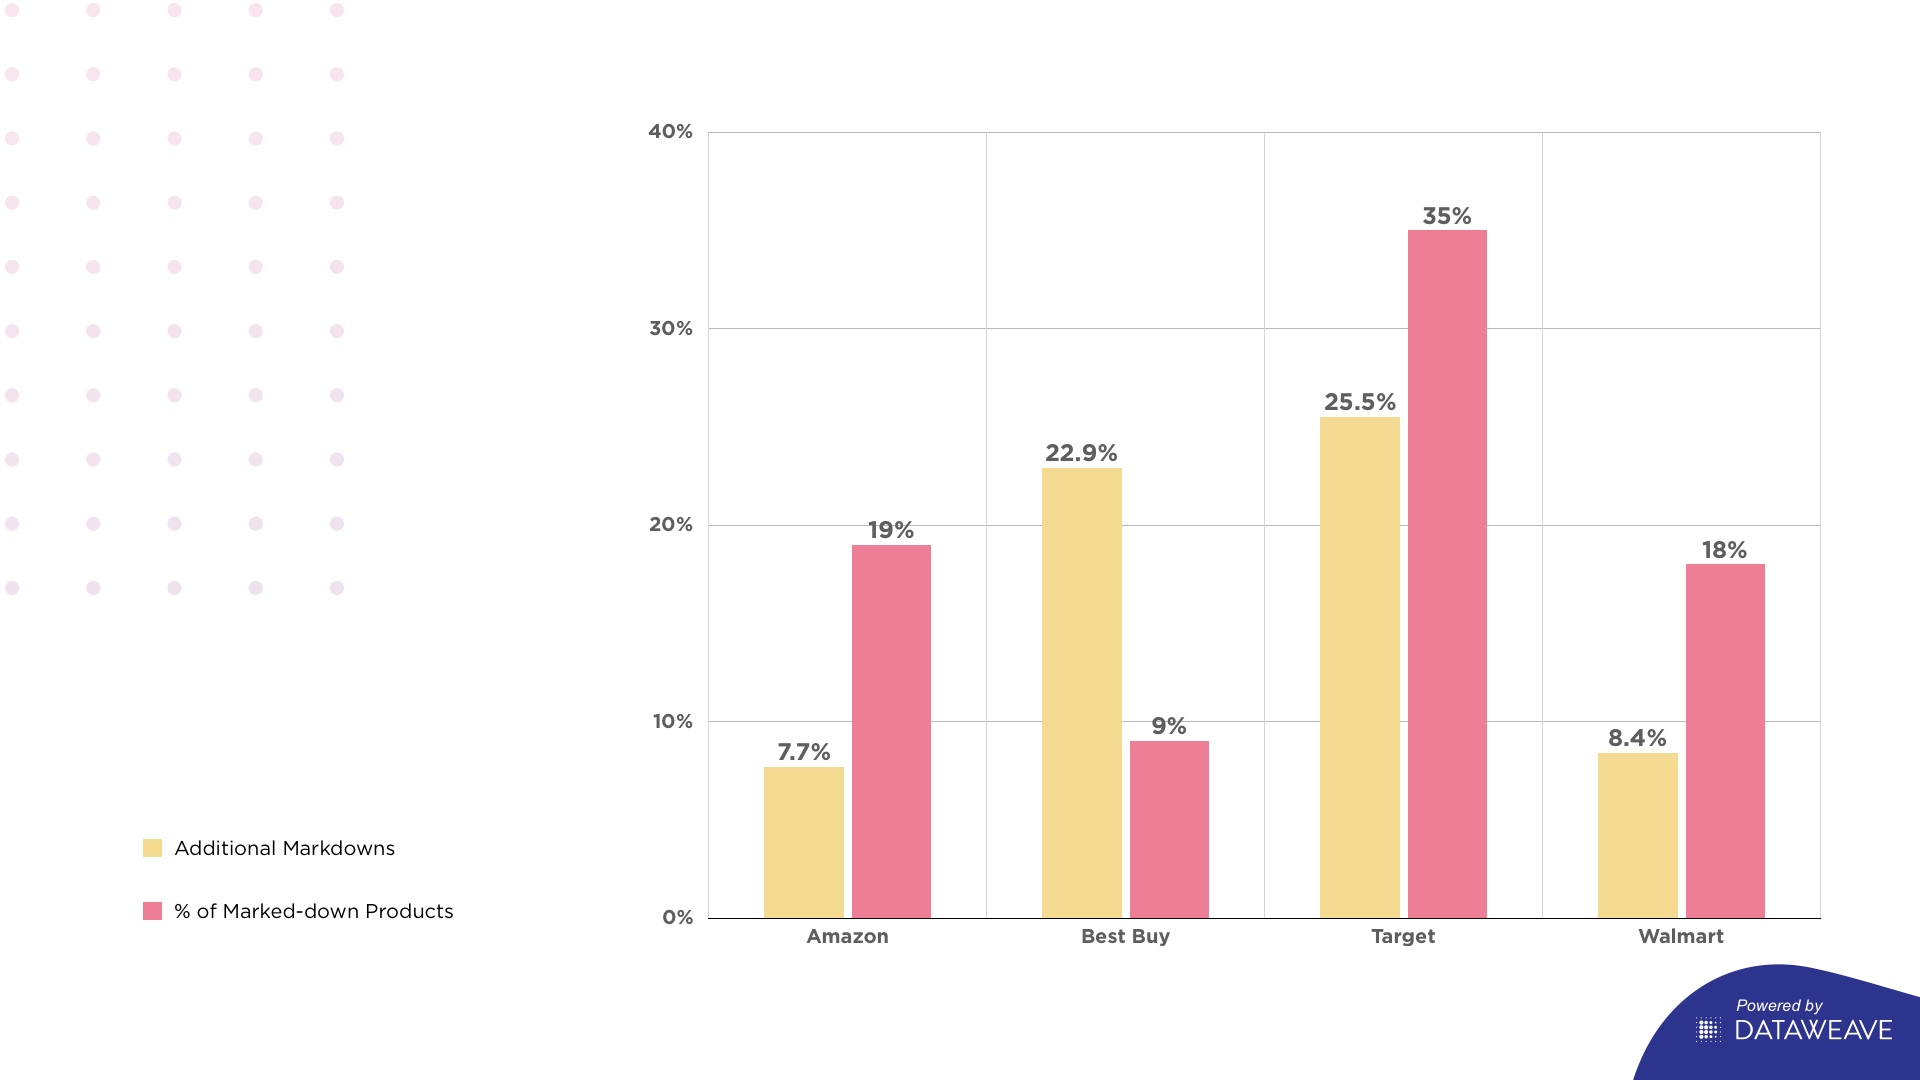
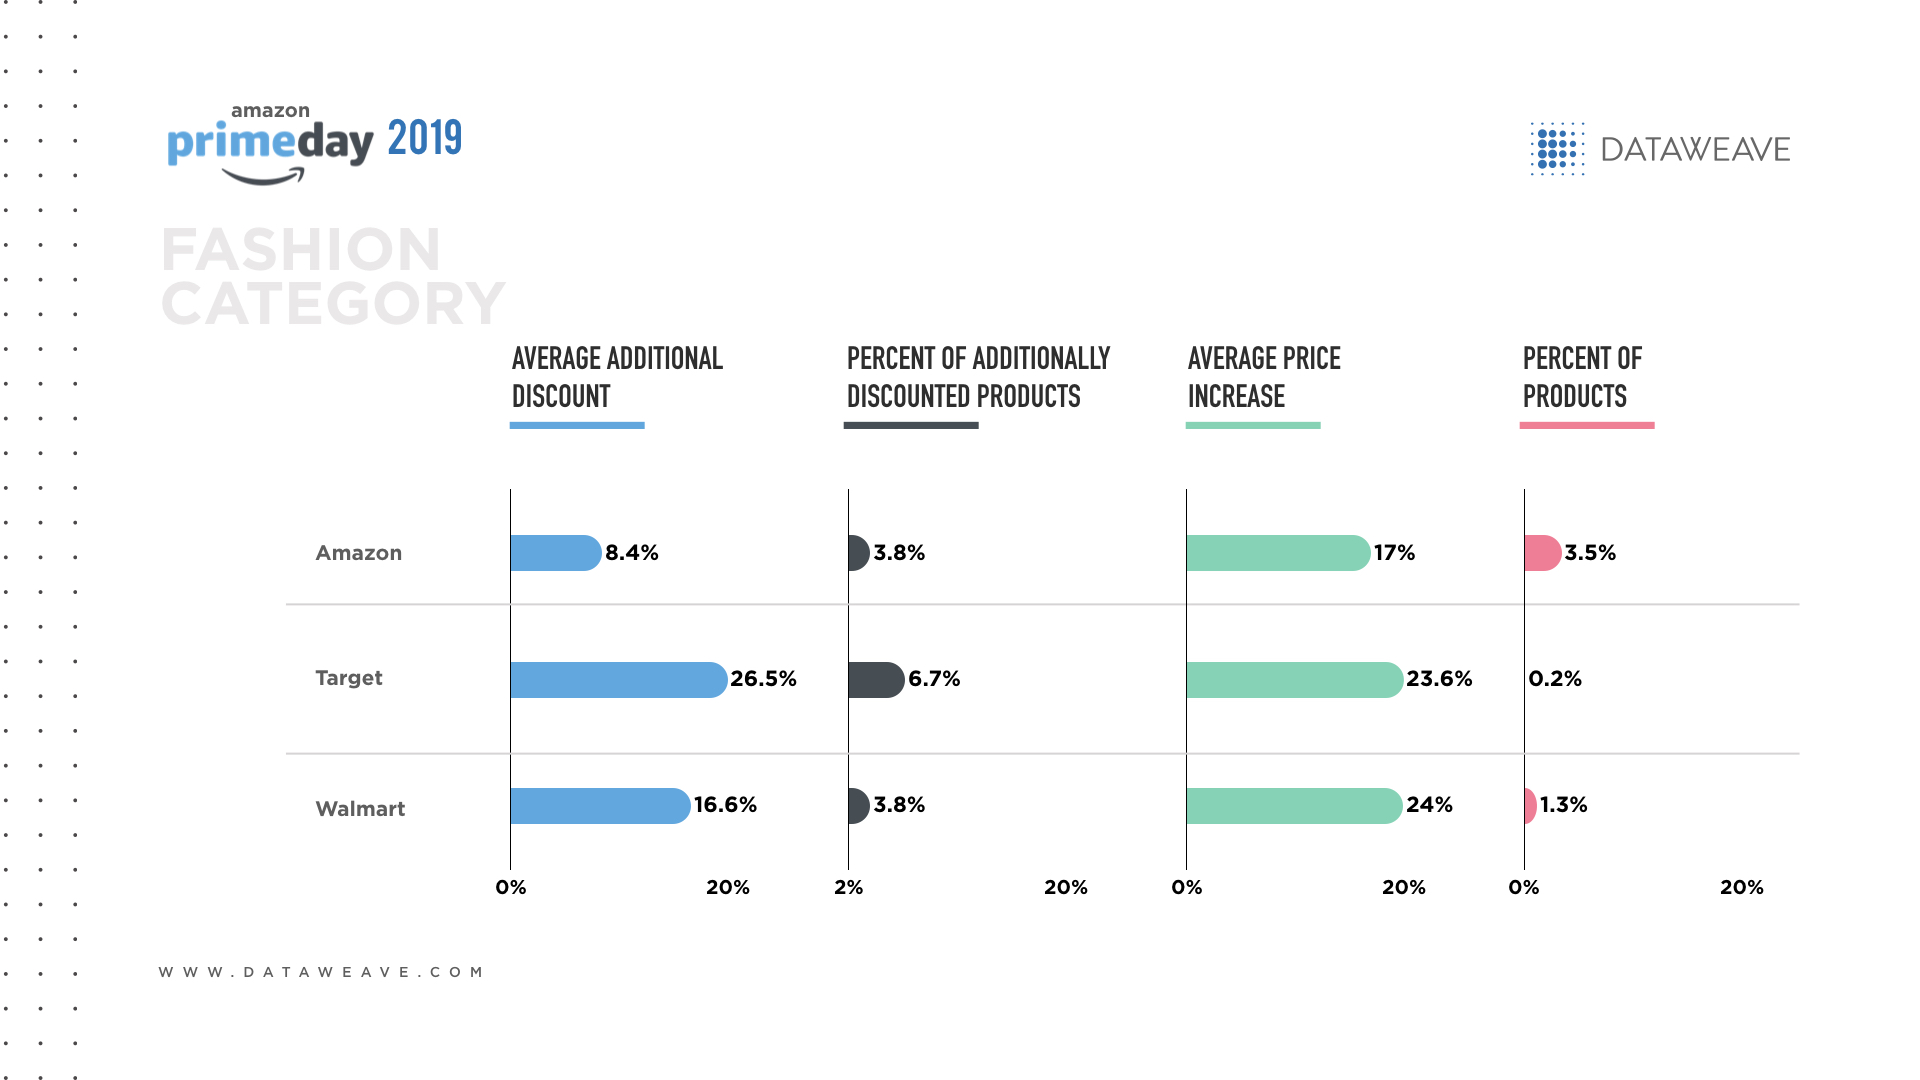
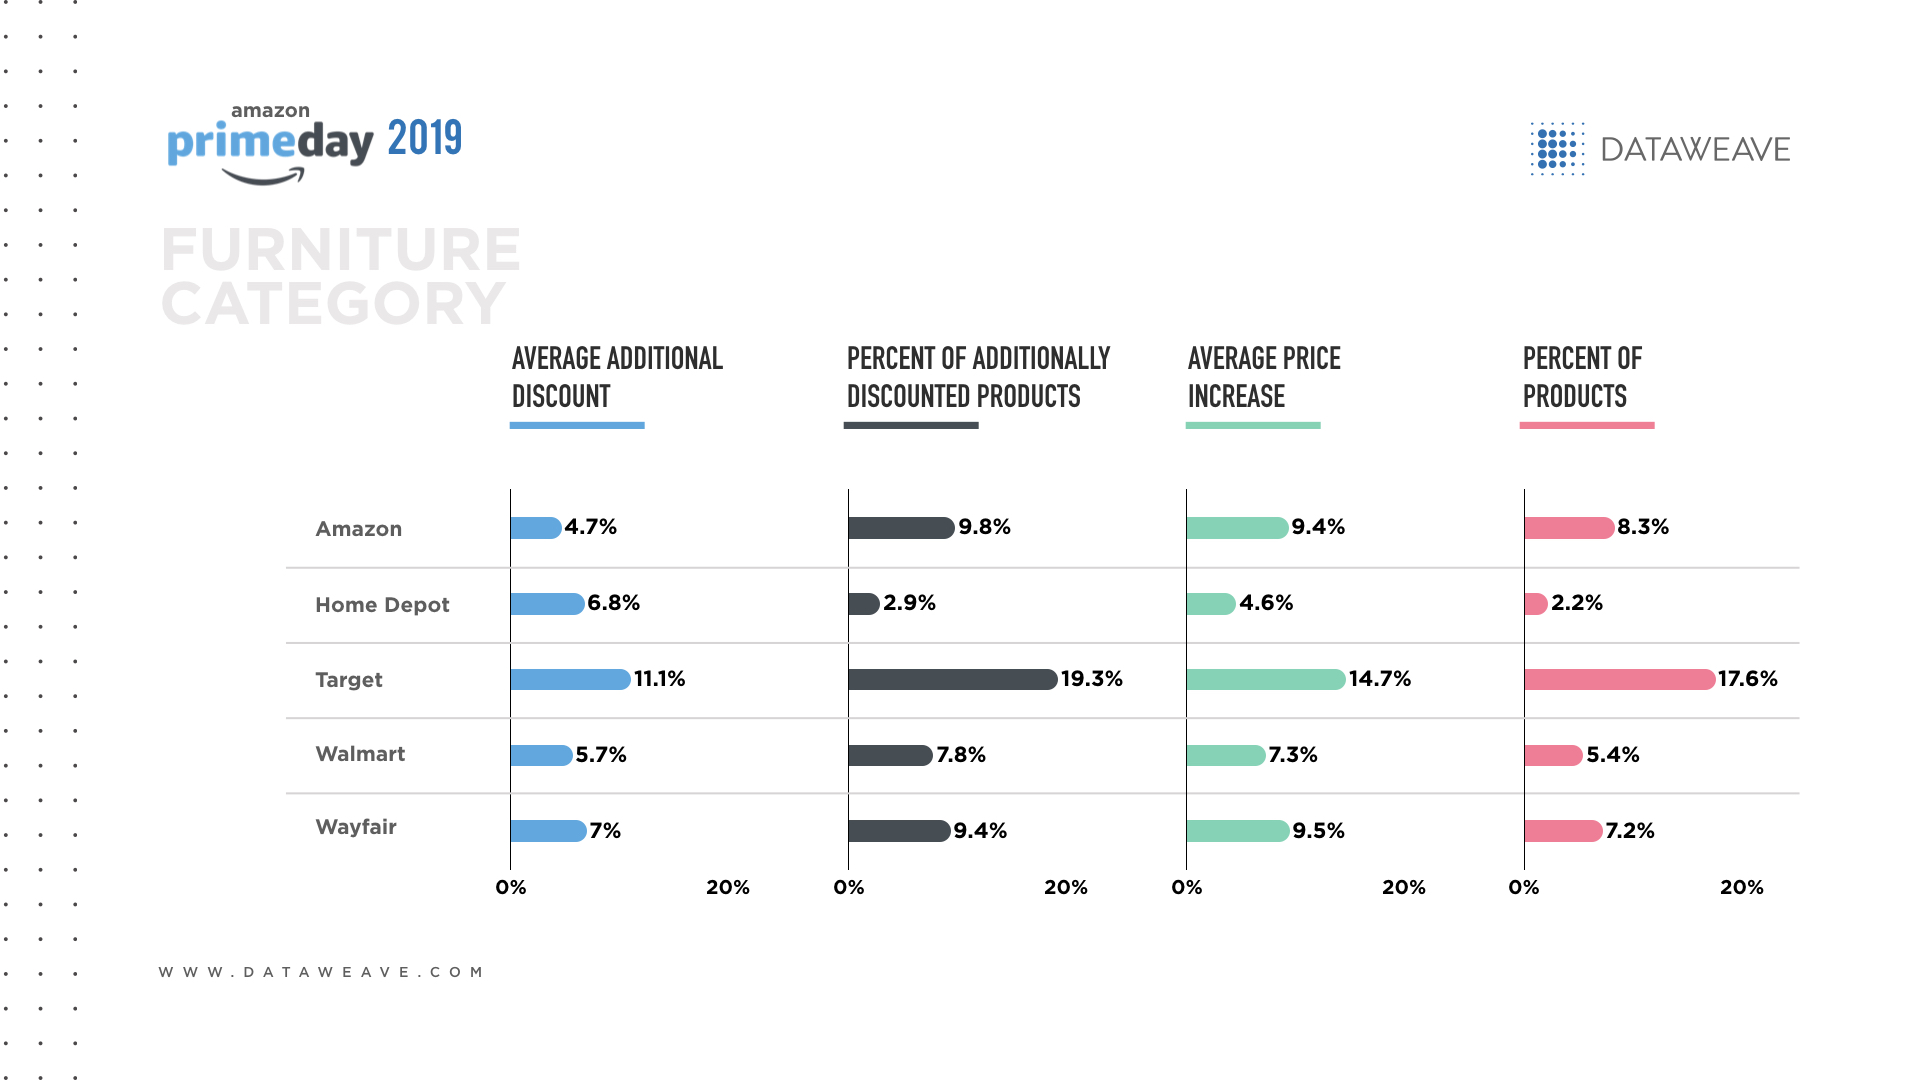
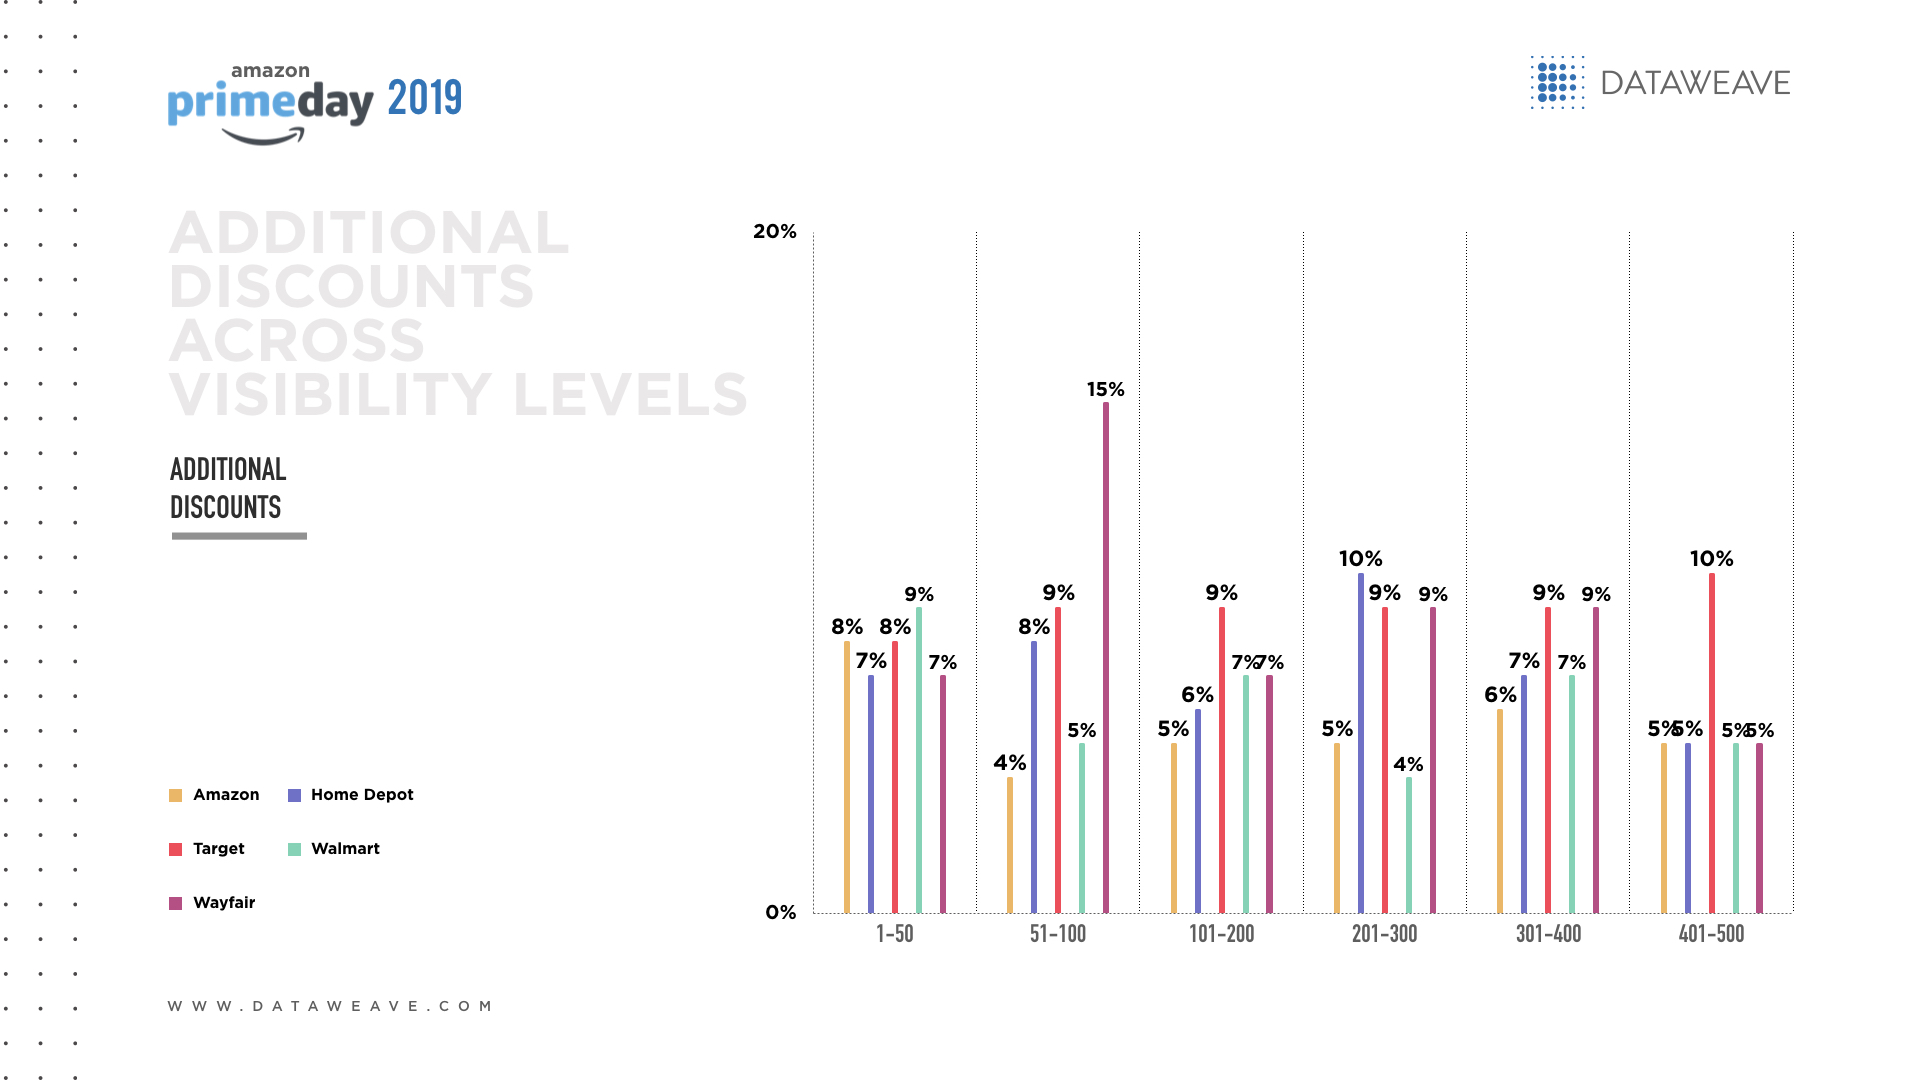
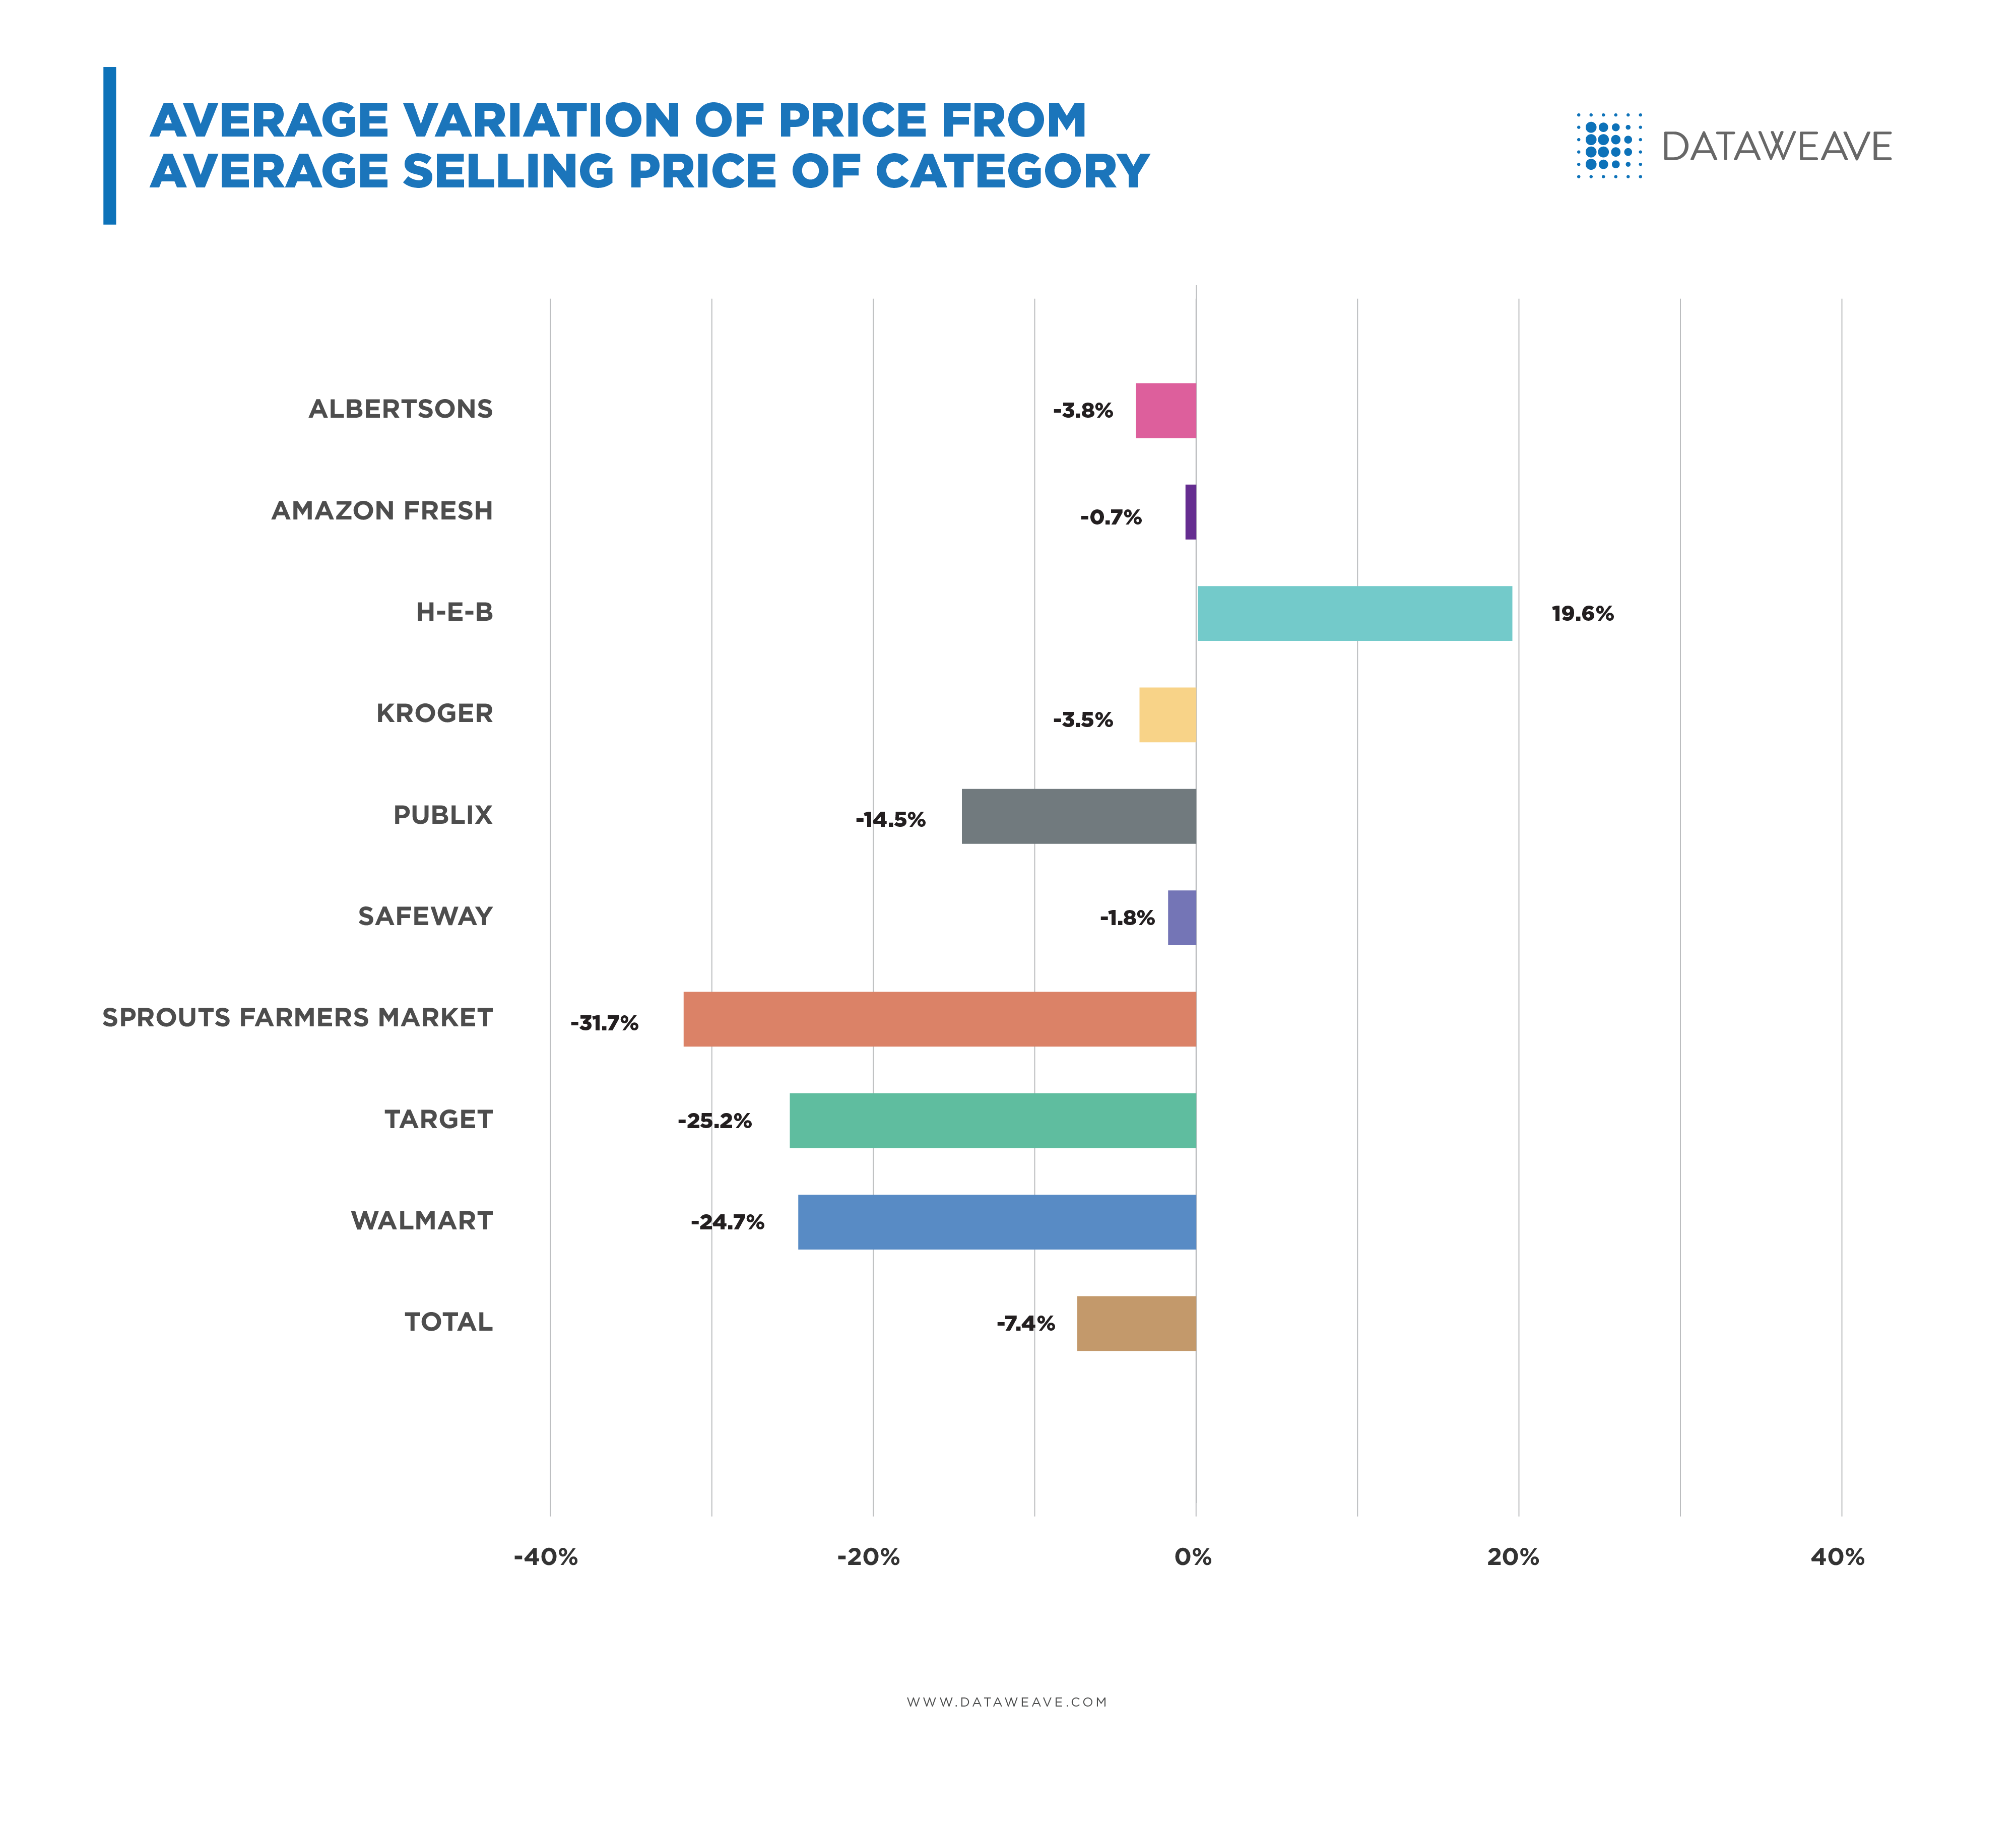
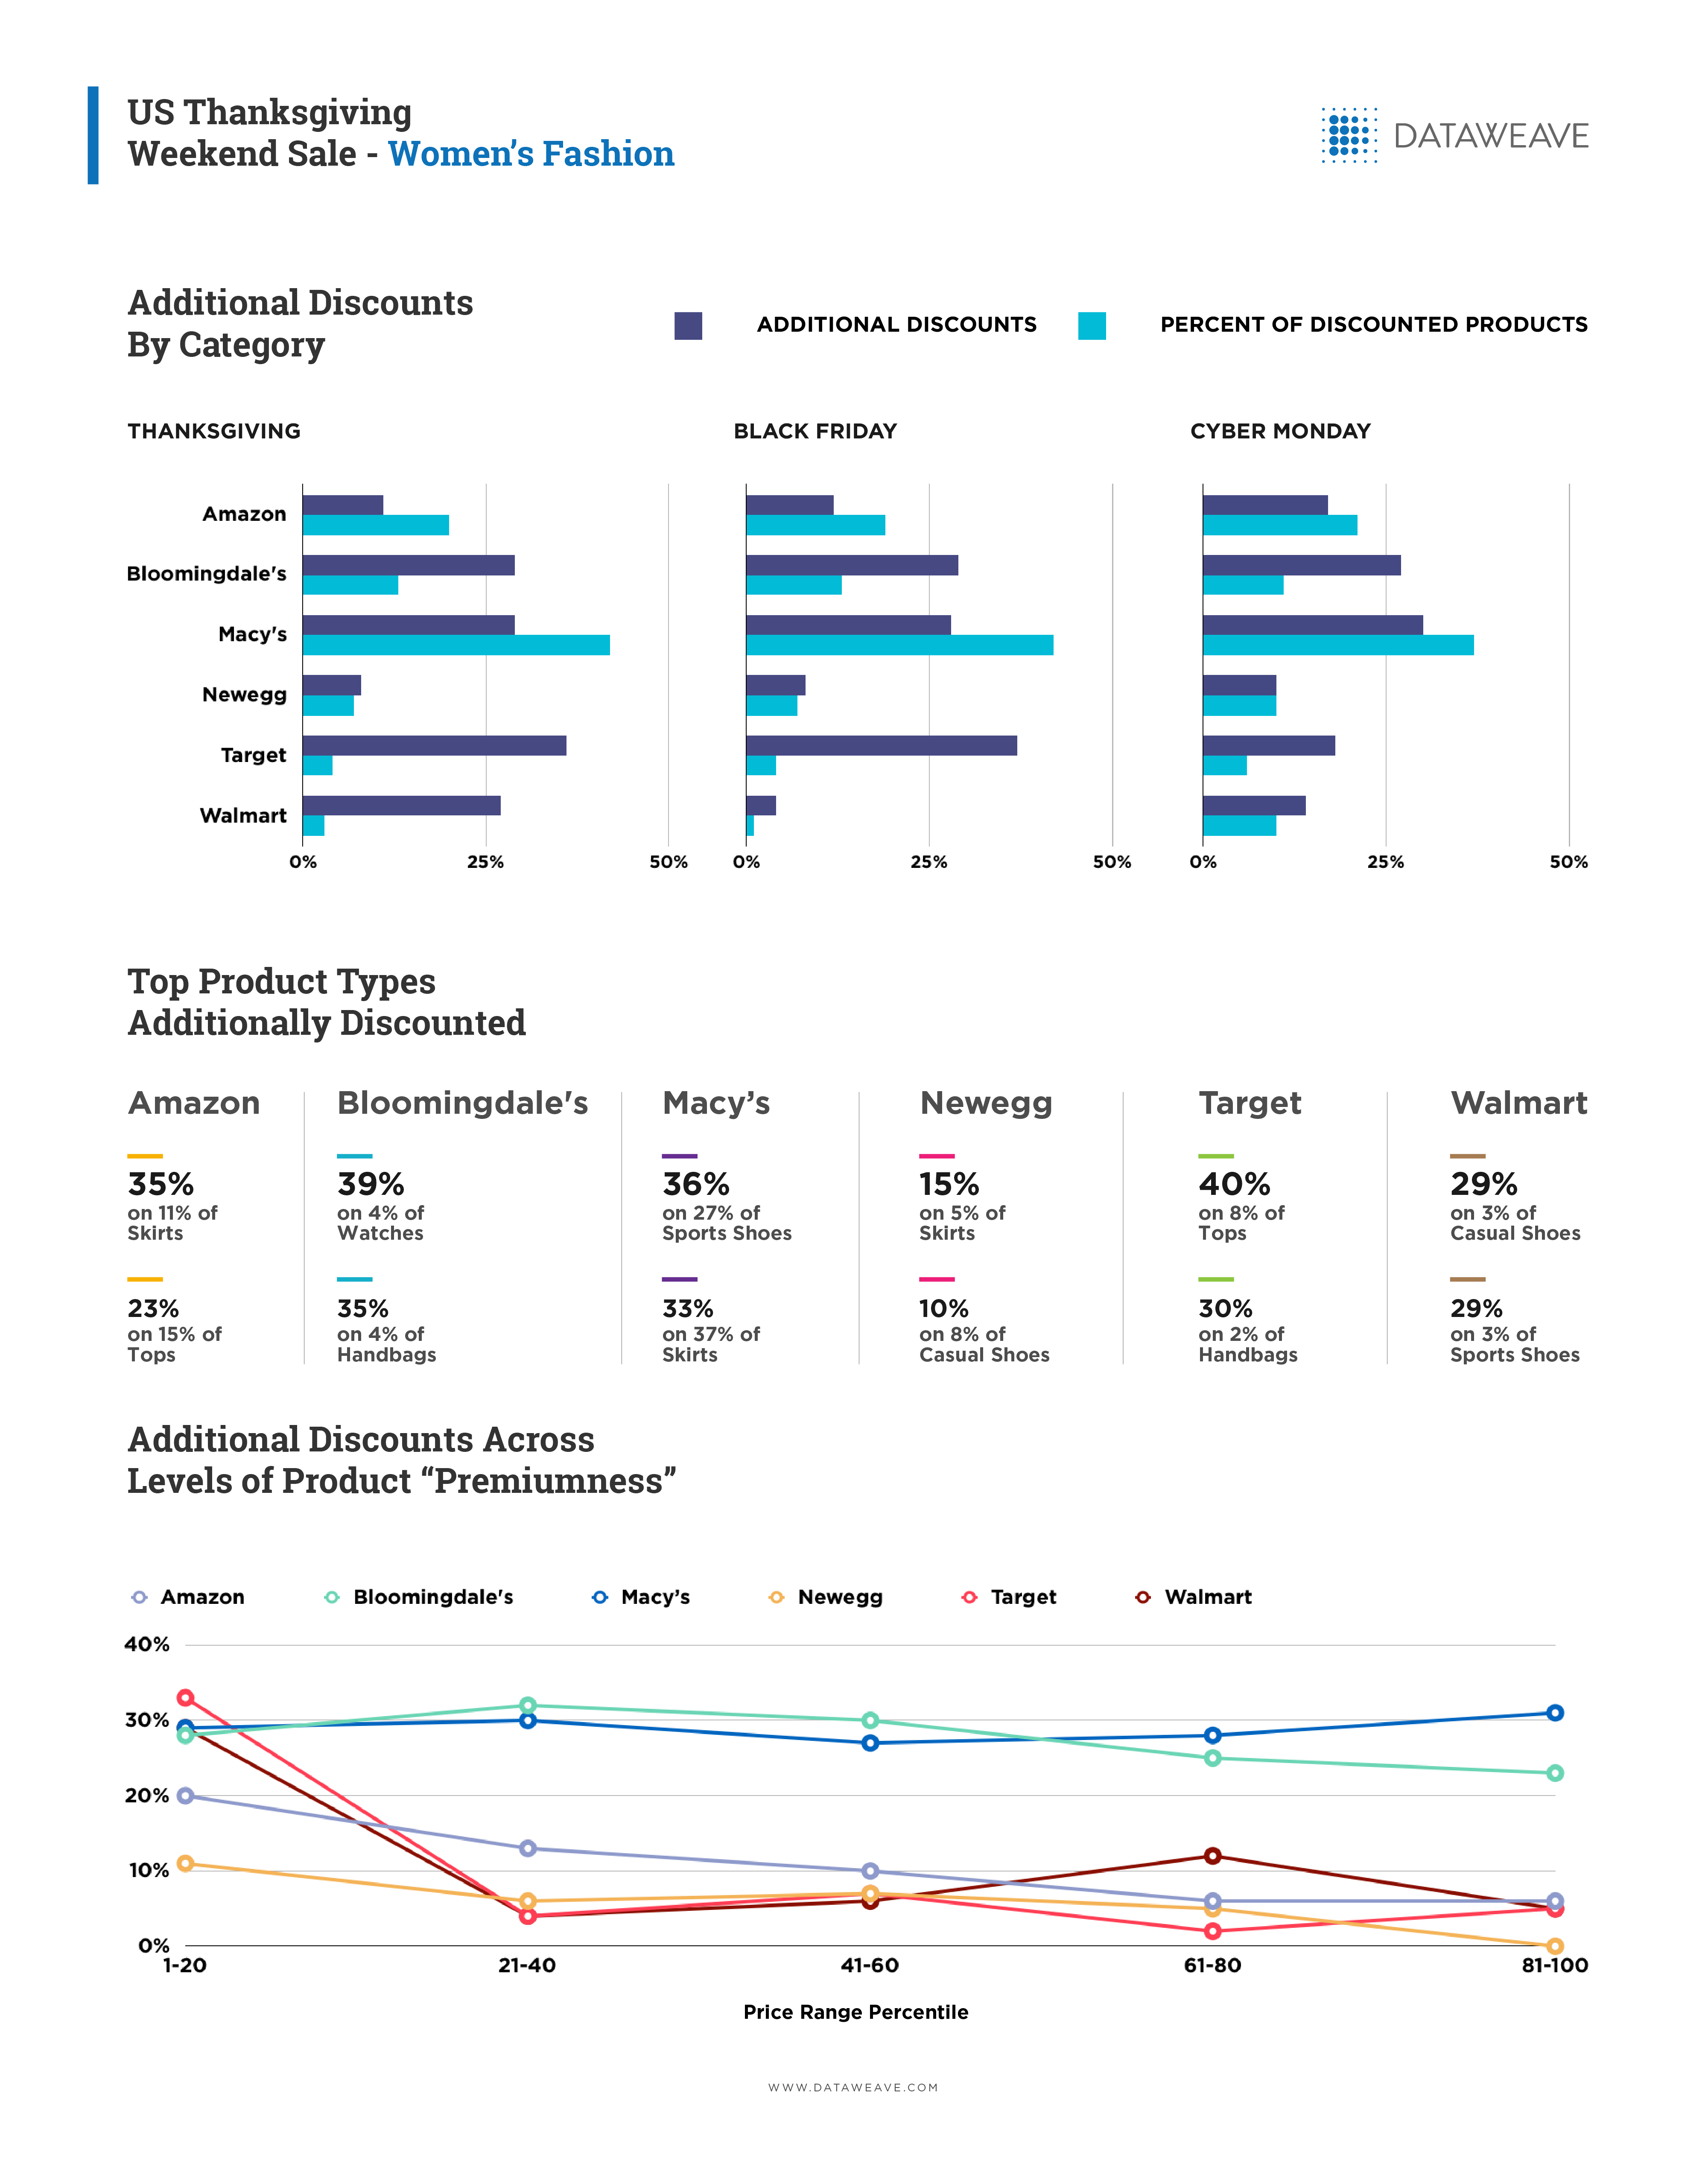
Additional markdowns
For this analysis, we considered the mode of the prices for the week before and compared it with that during the sale. This painted a picture of the additional markdowns for the duration of the sale.
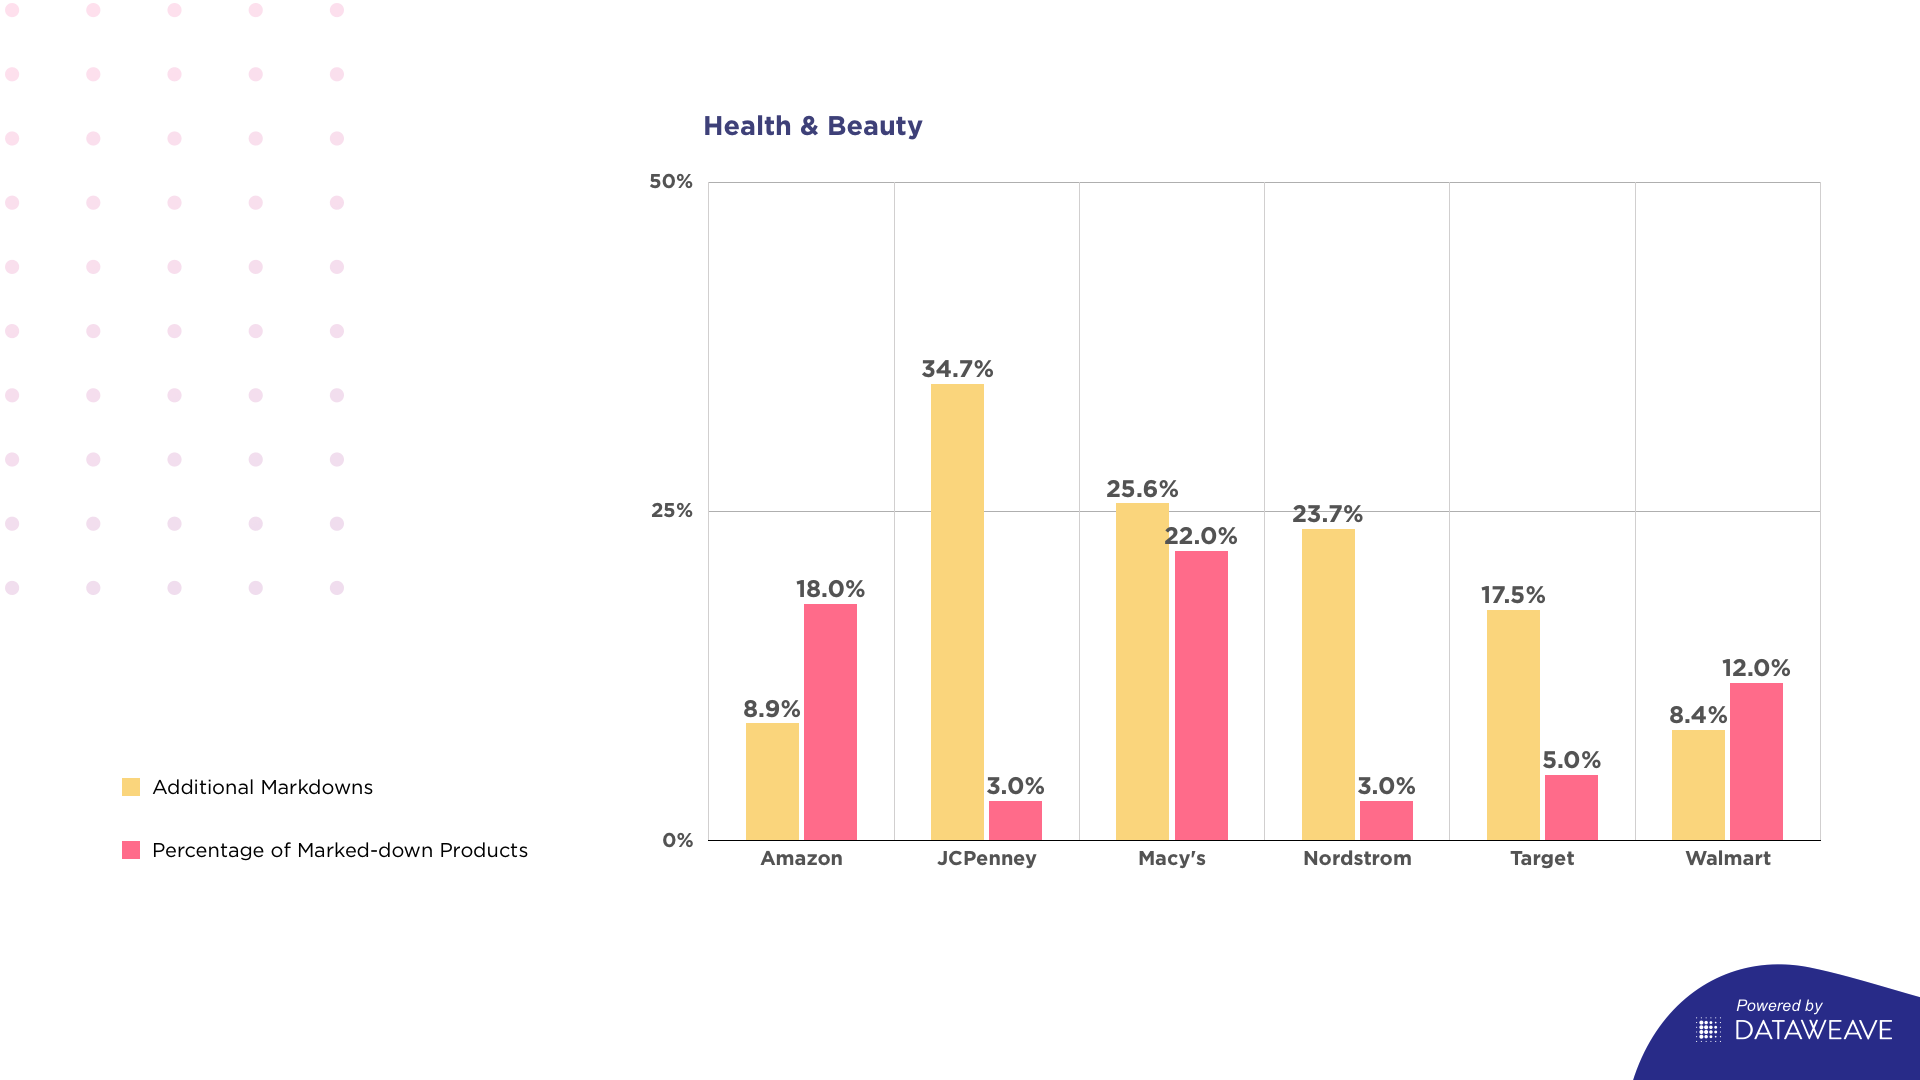
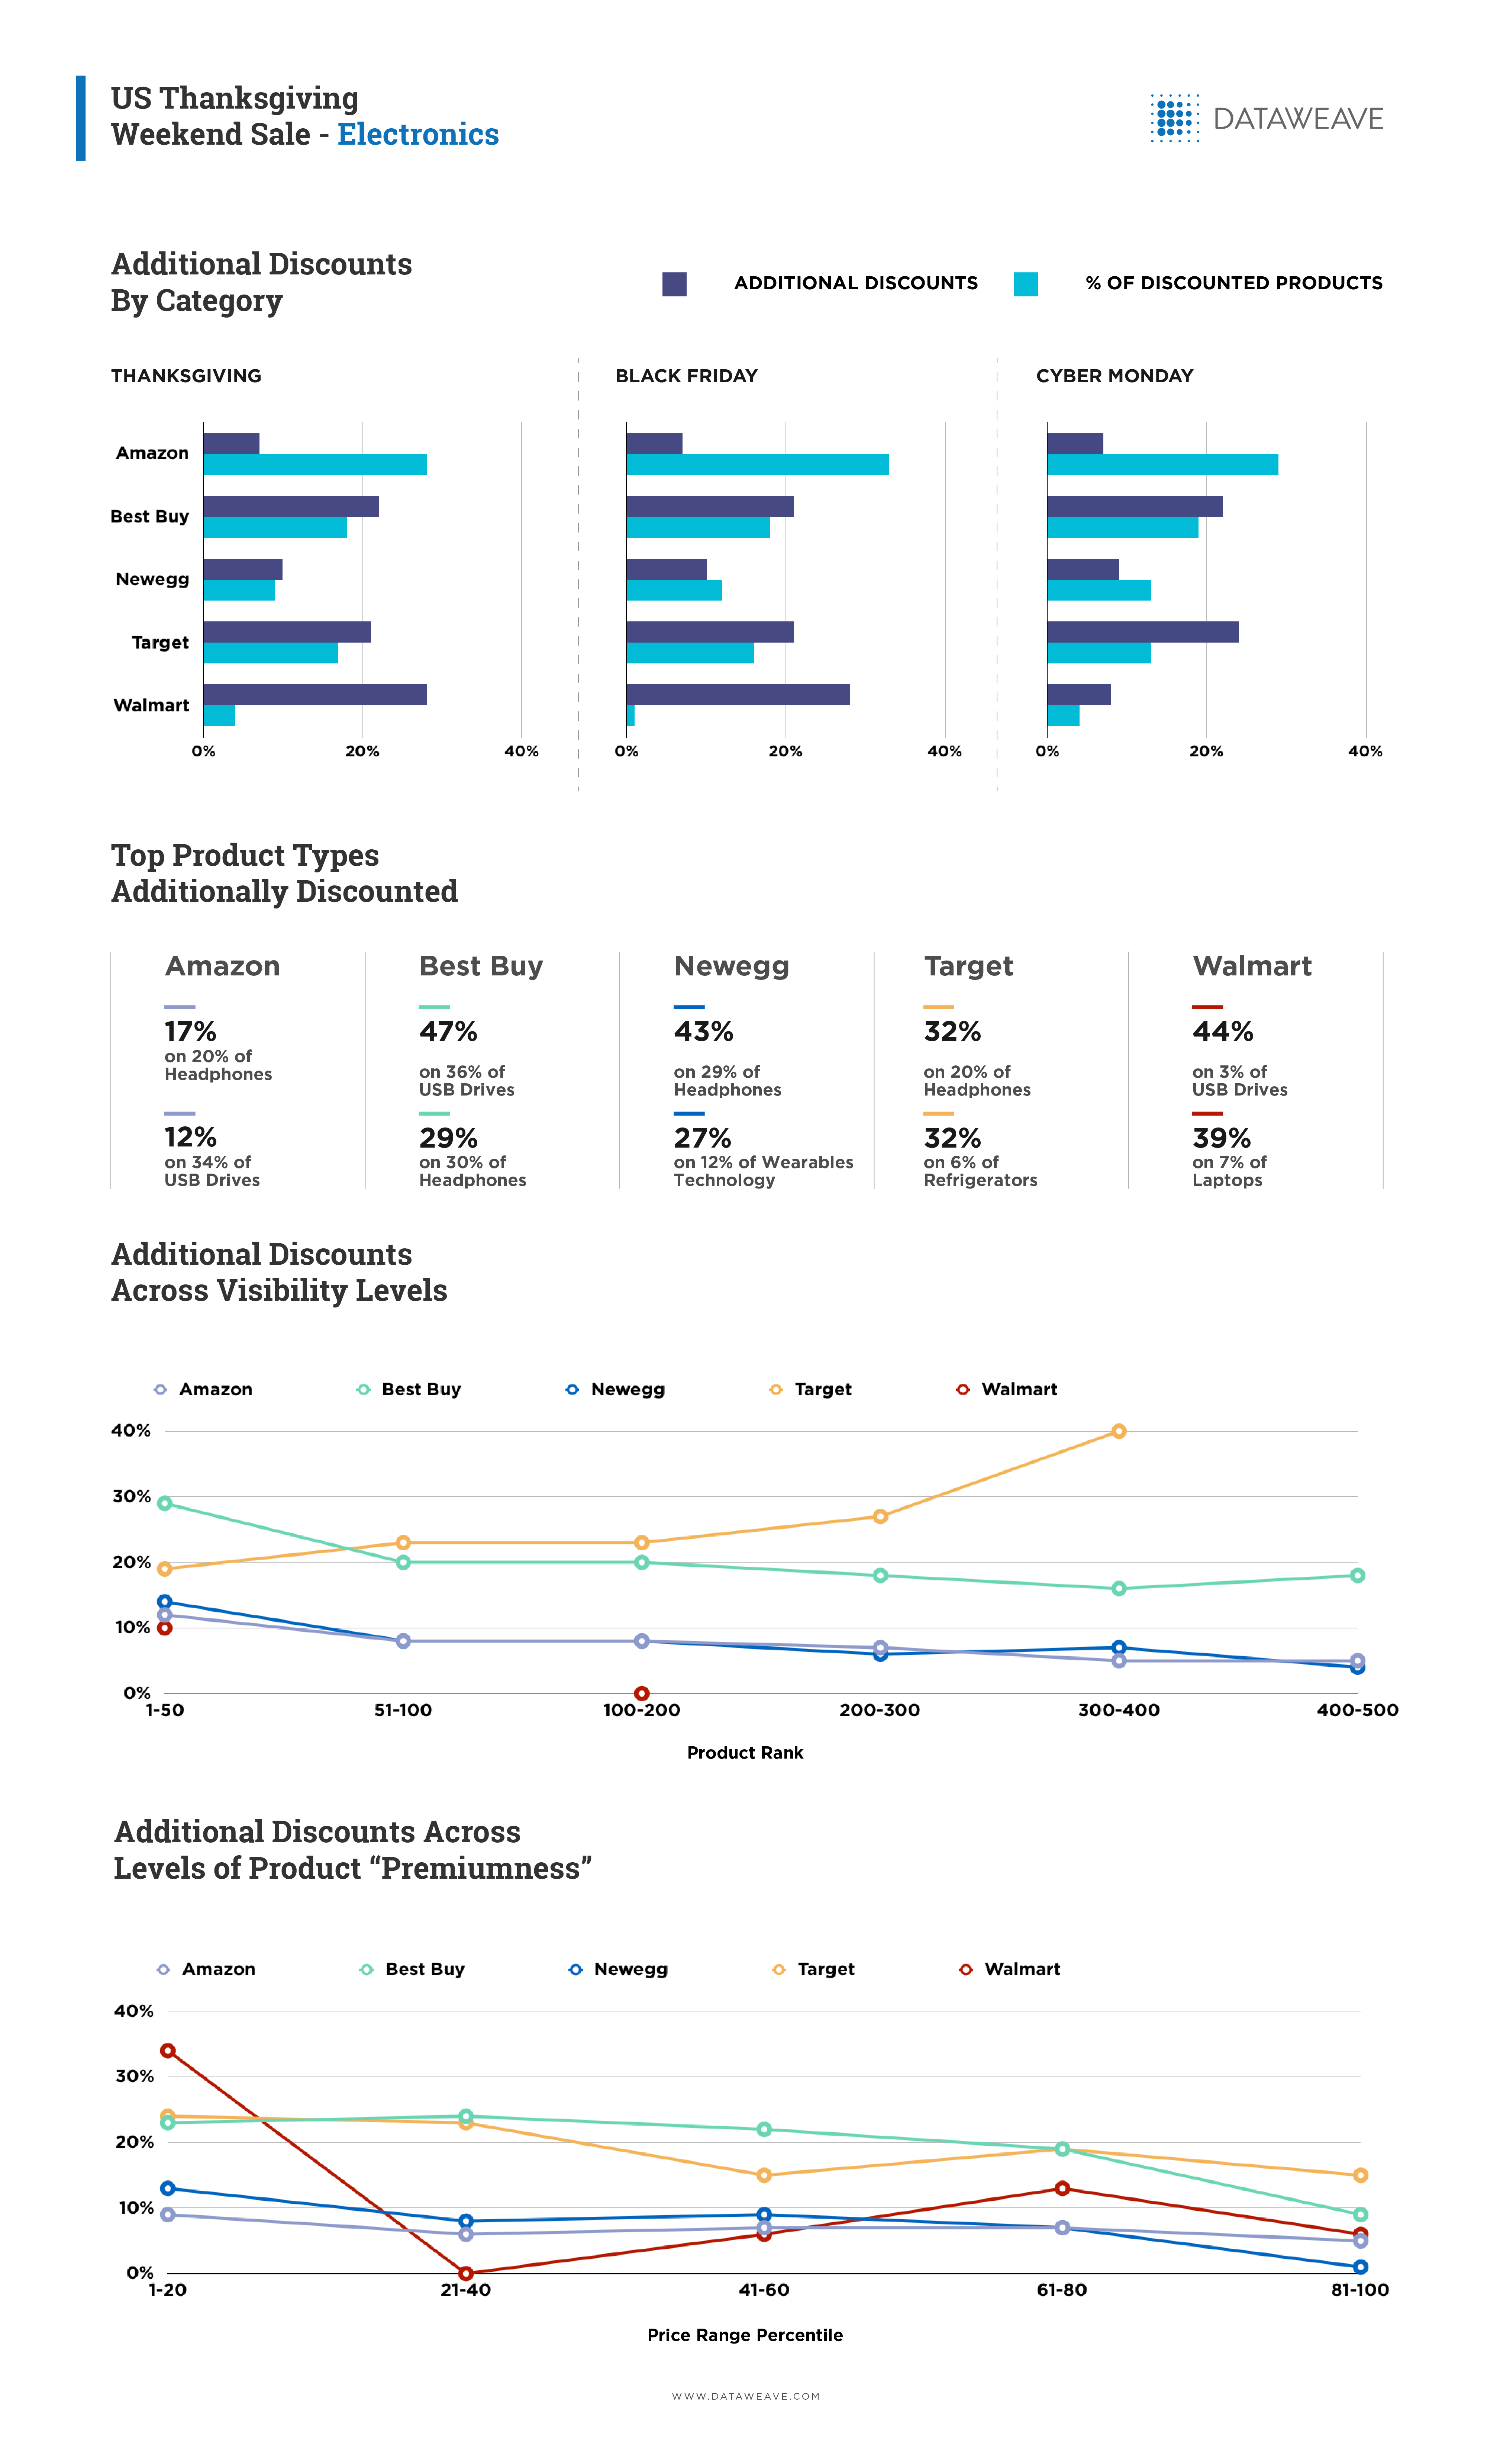
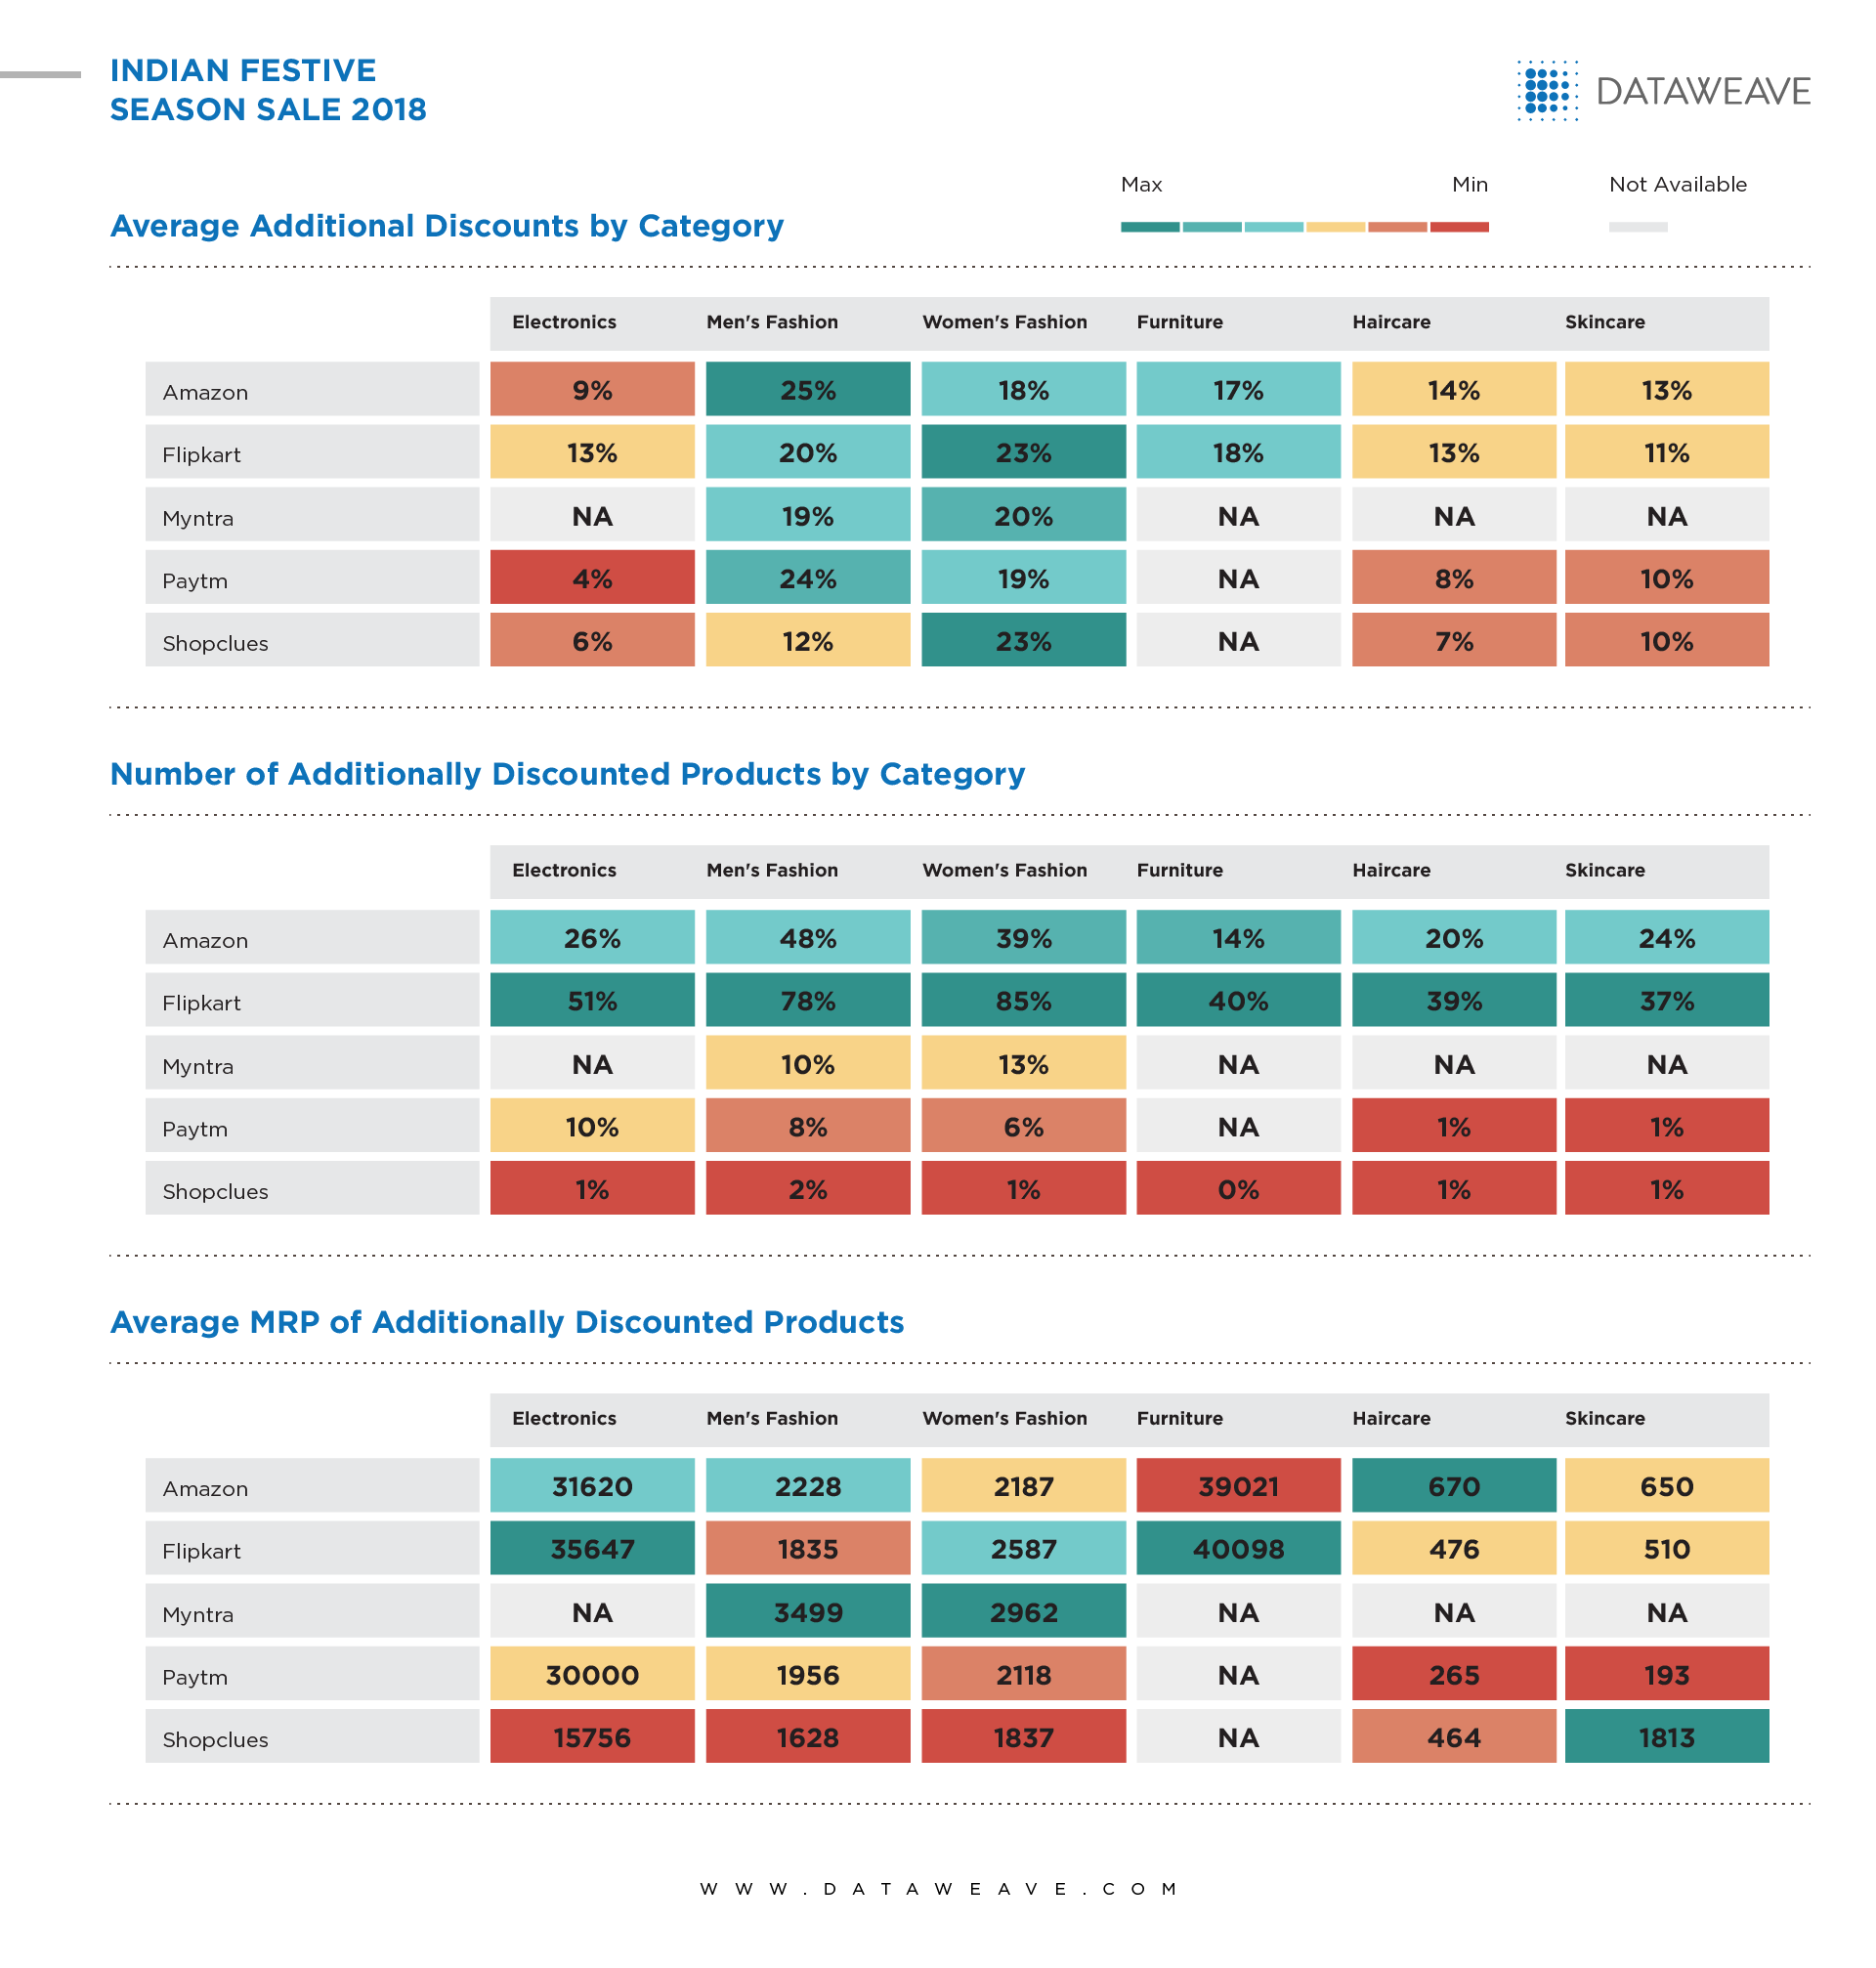
Similar to our prior coverage of the Fashion category during Black Friday, Macy’s had the broadest reach in terms of the marked down products at 25.6%. The average percentage of the markdowns was 22% and was only eclipsed by JC Penney with an average of 34.7%, though this was only offered on 3% of its range. At the other end of the spectrum, Amazon and Walmart had the lowest markdowns at 8.9% and 8.4% respectively but were among the top three in products covered (18% & 12%). Target and Nordstrom offered mid-range markdowns across the board but on a rather conservative selection of products of 5% and 3%, respectively.
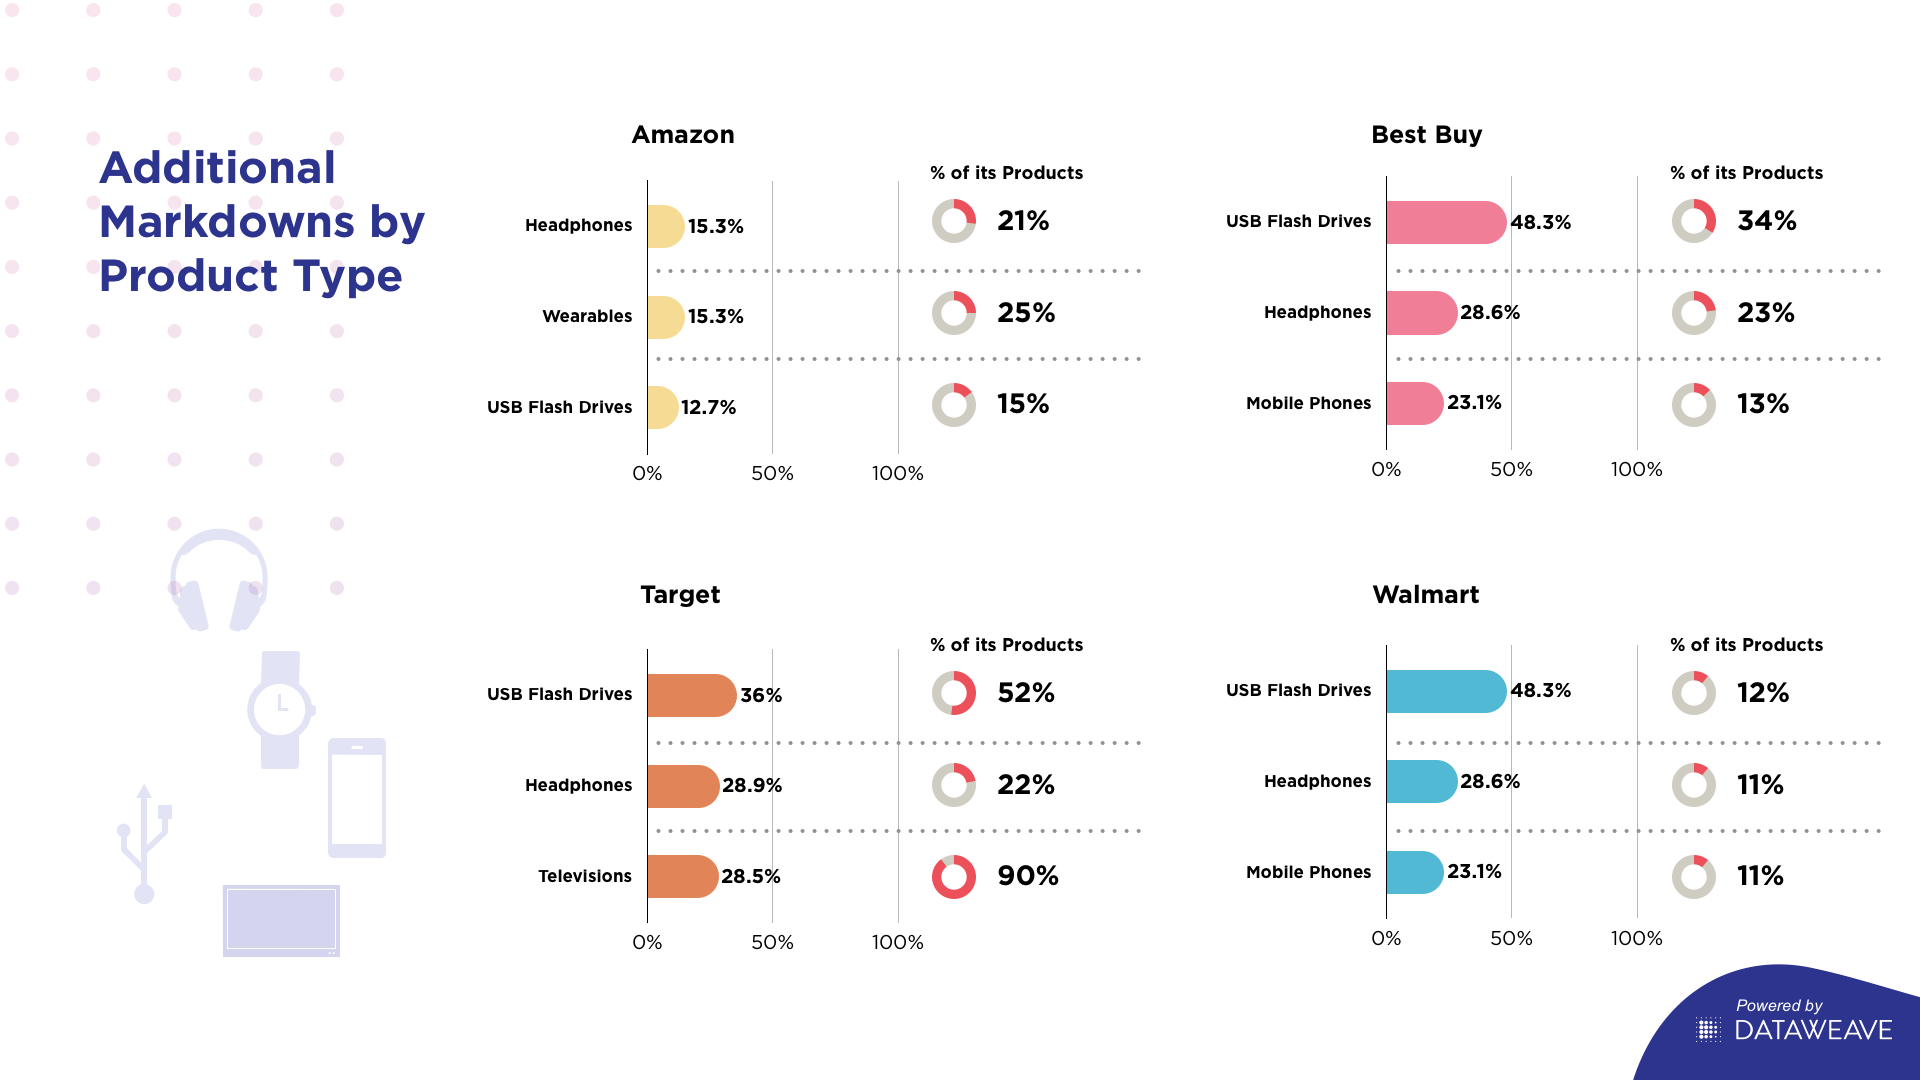
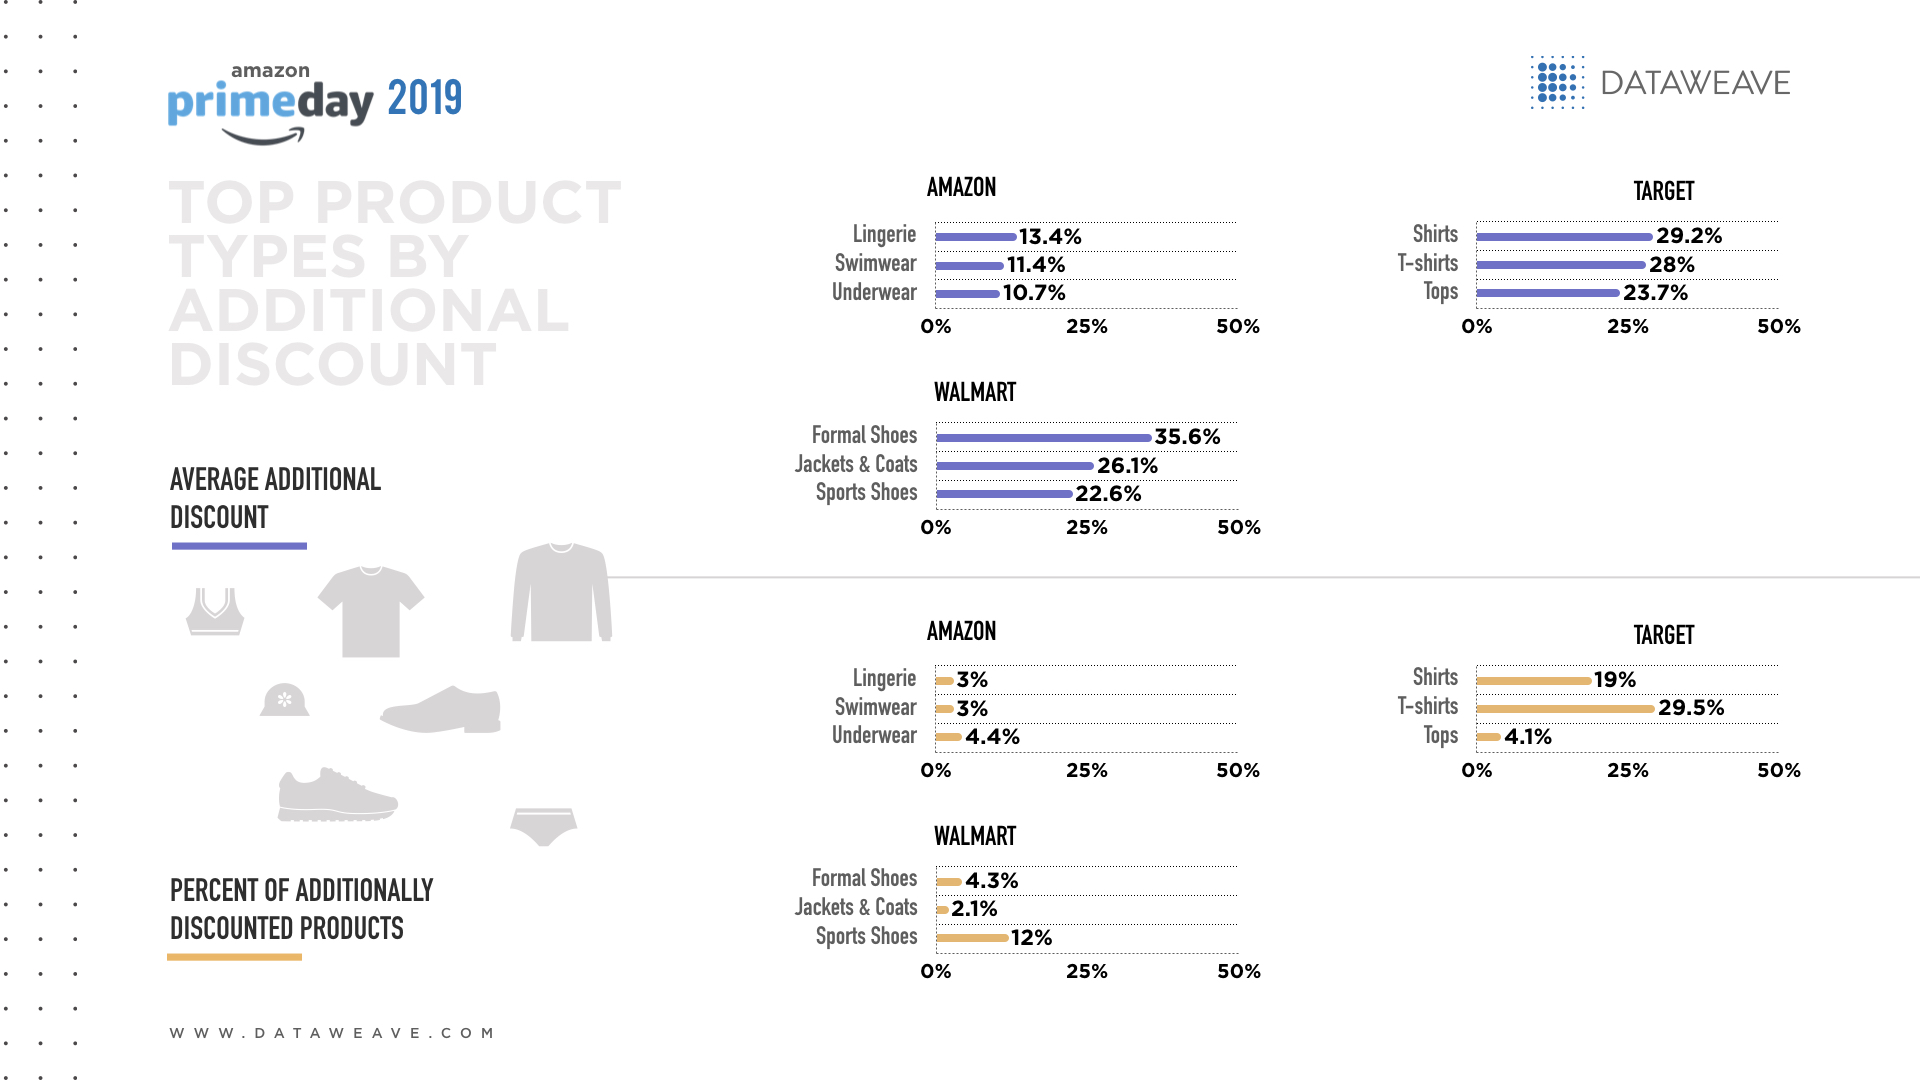
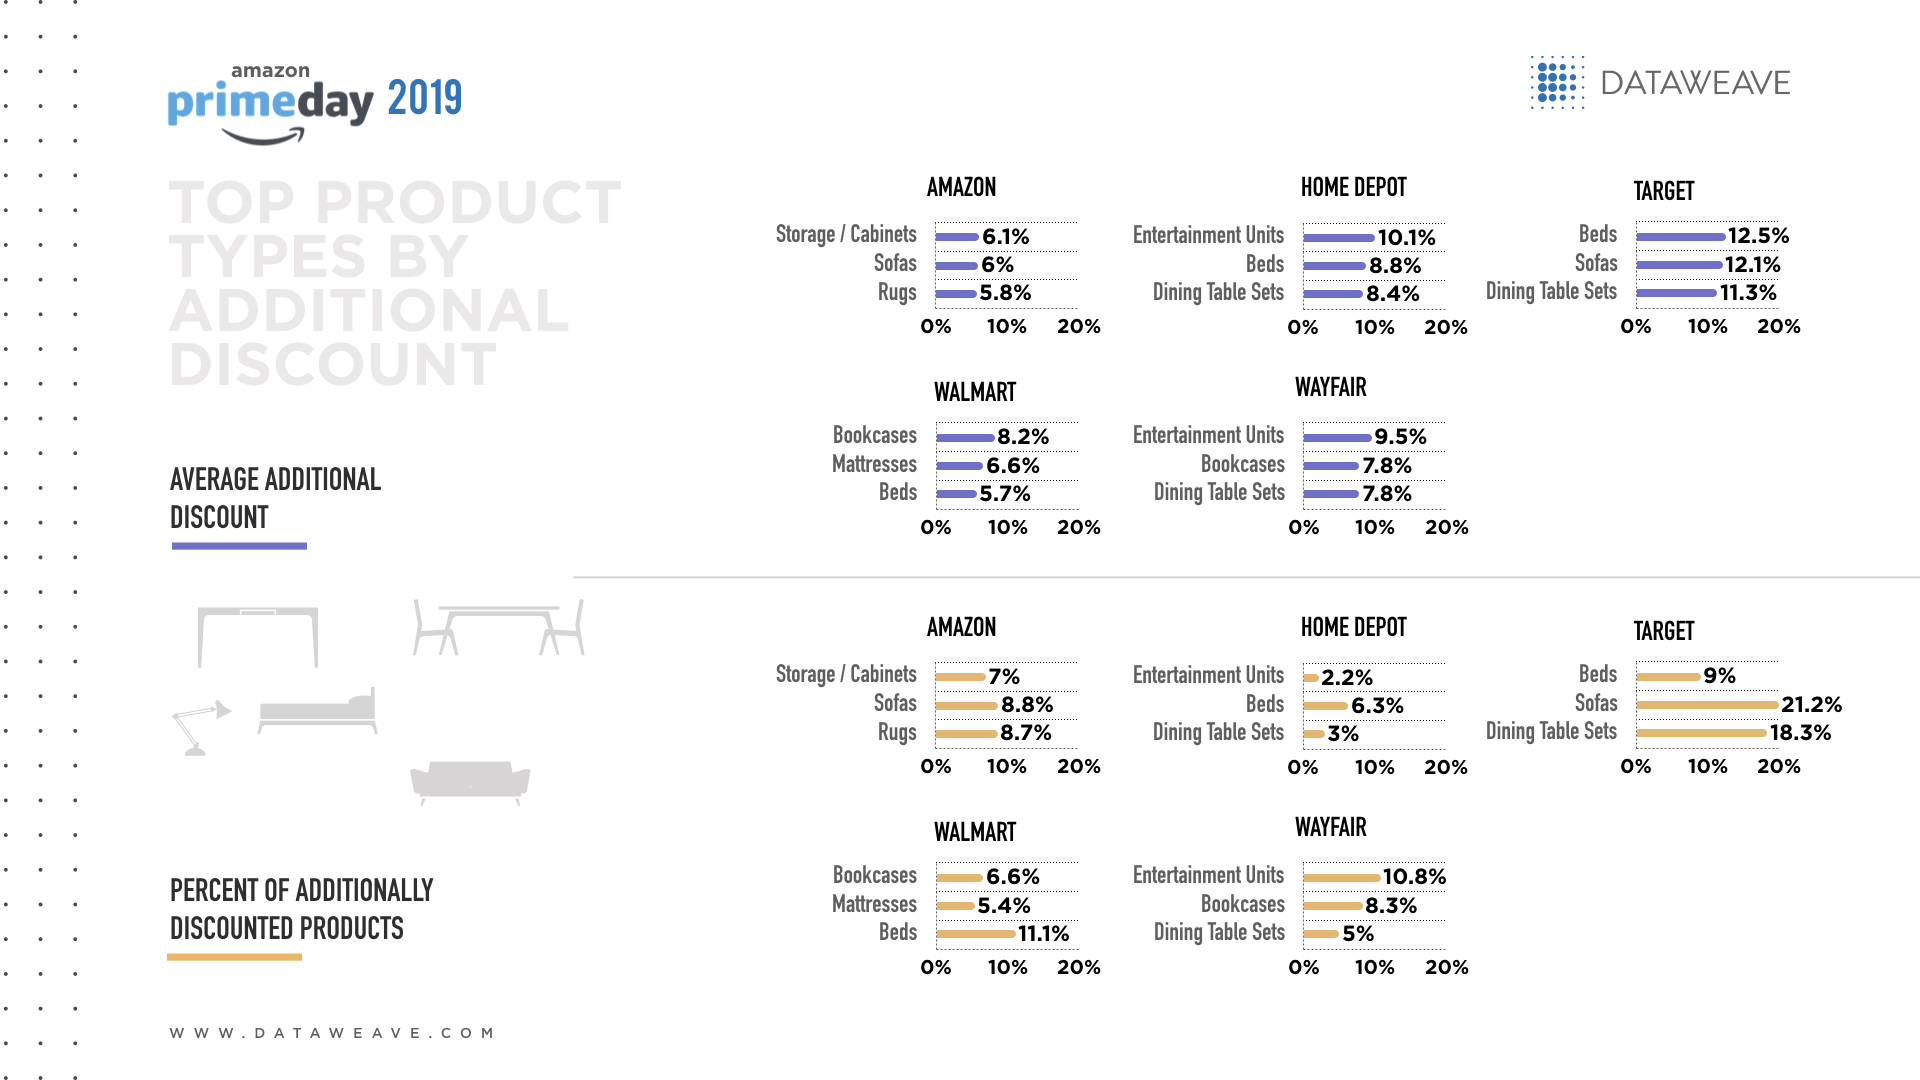
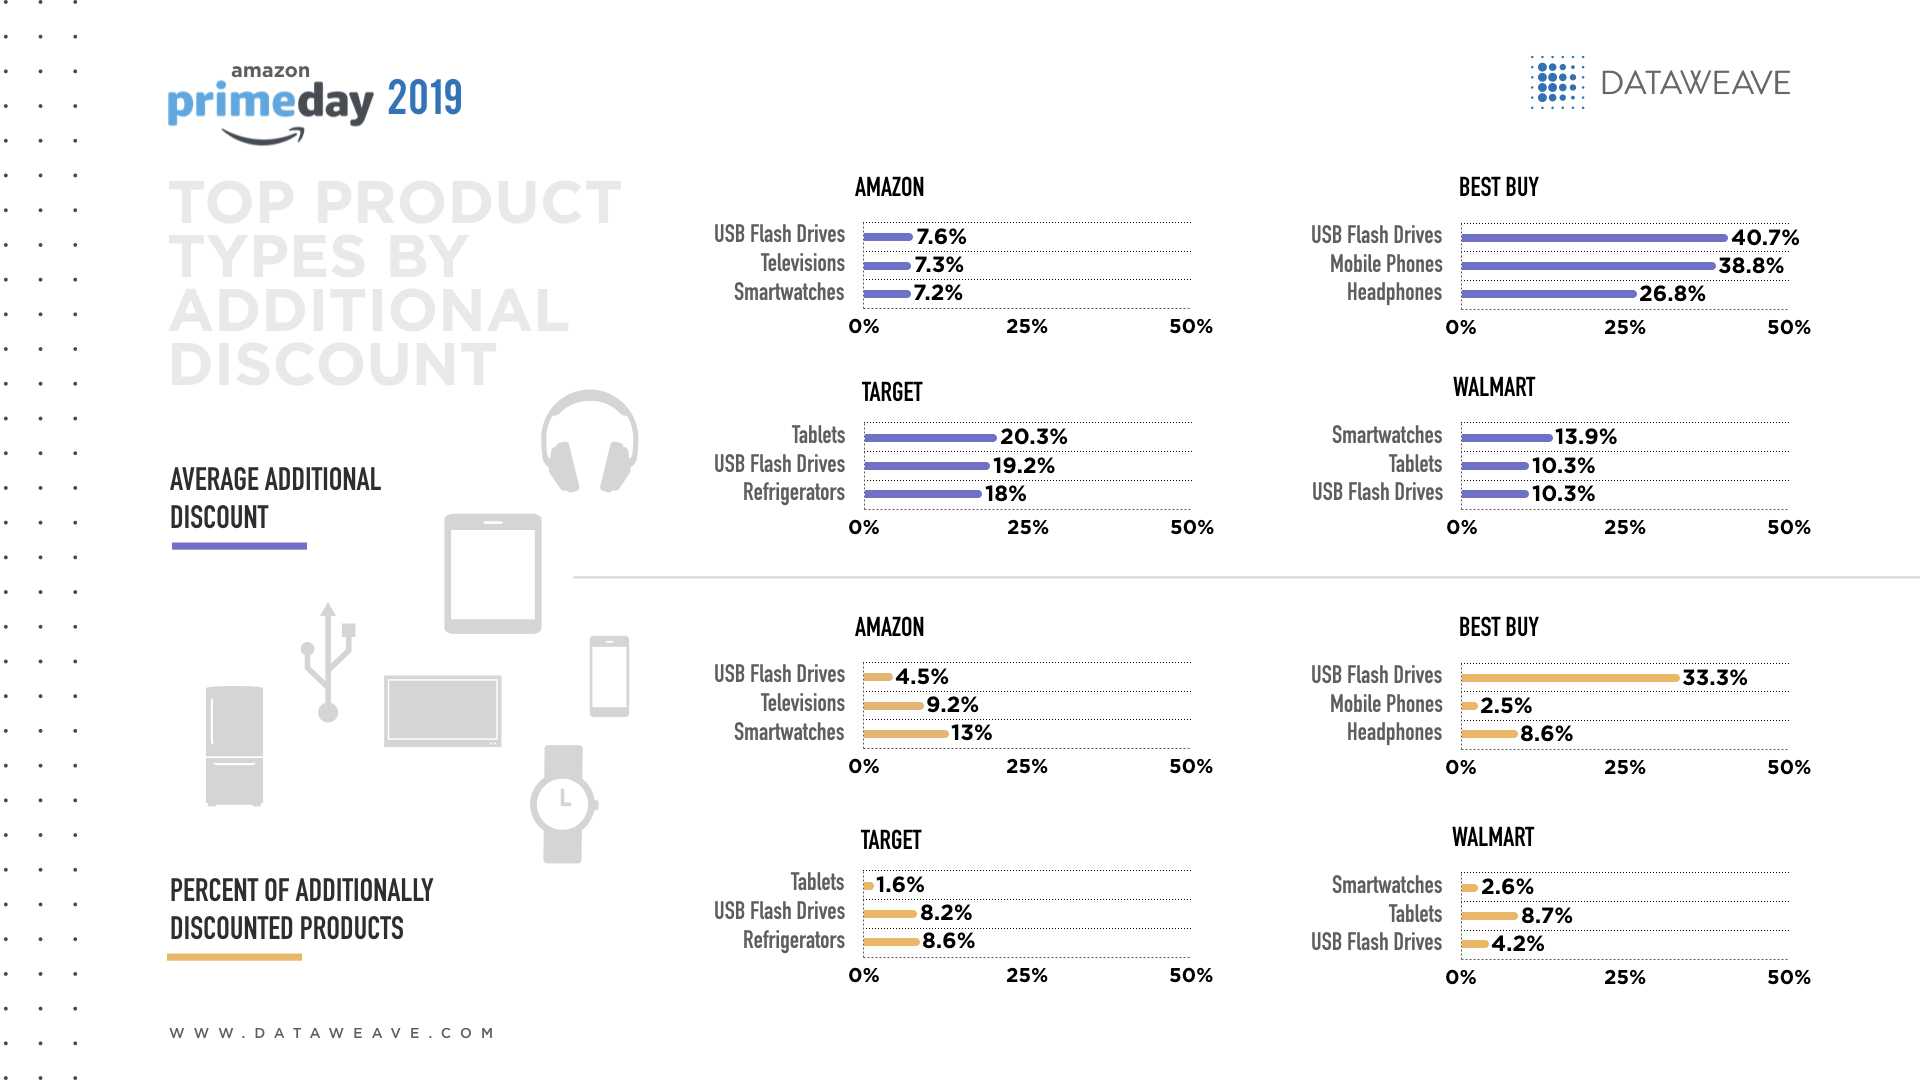
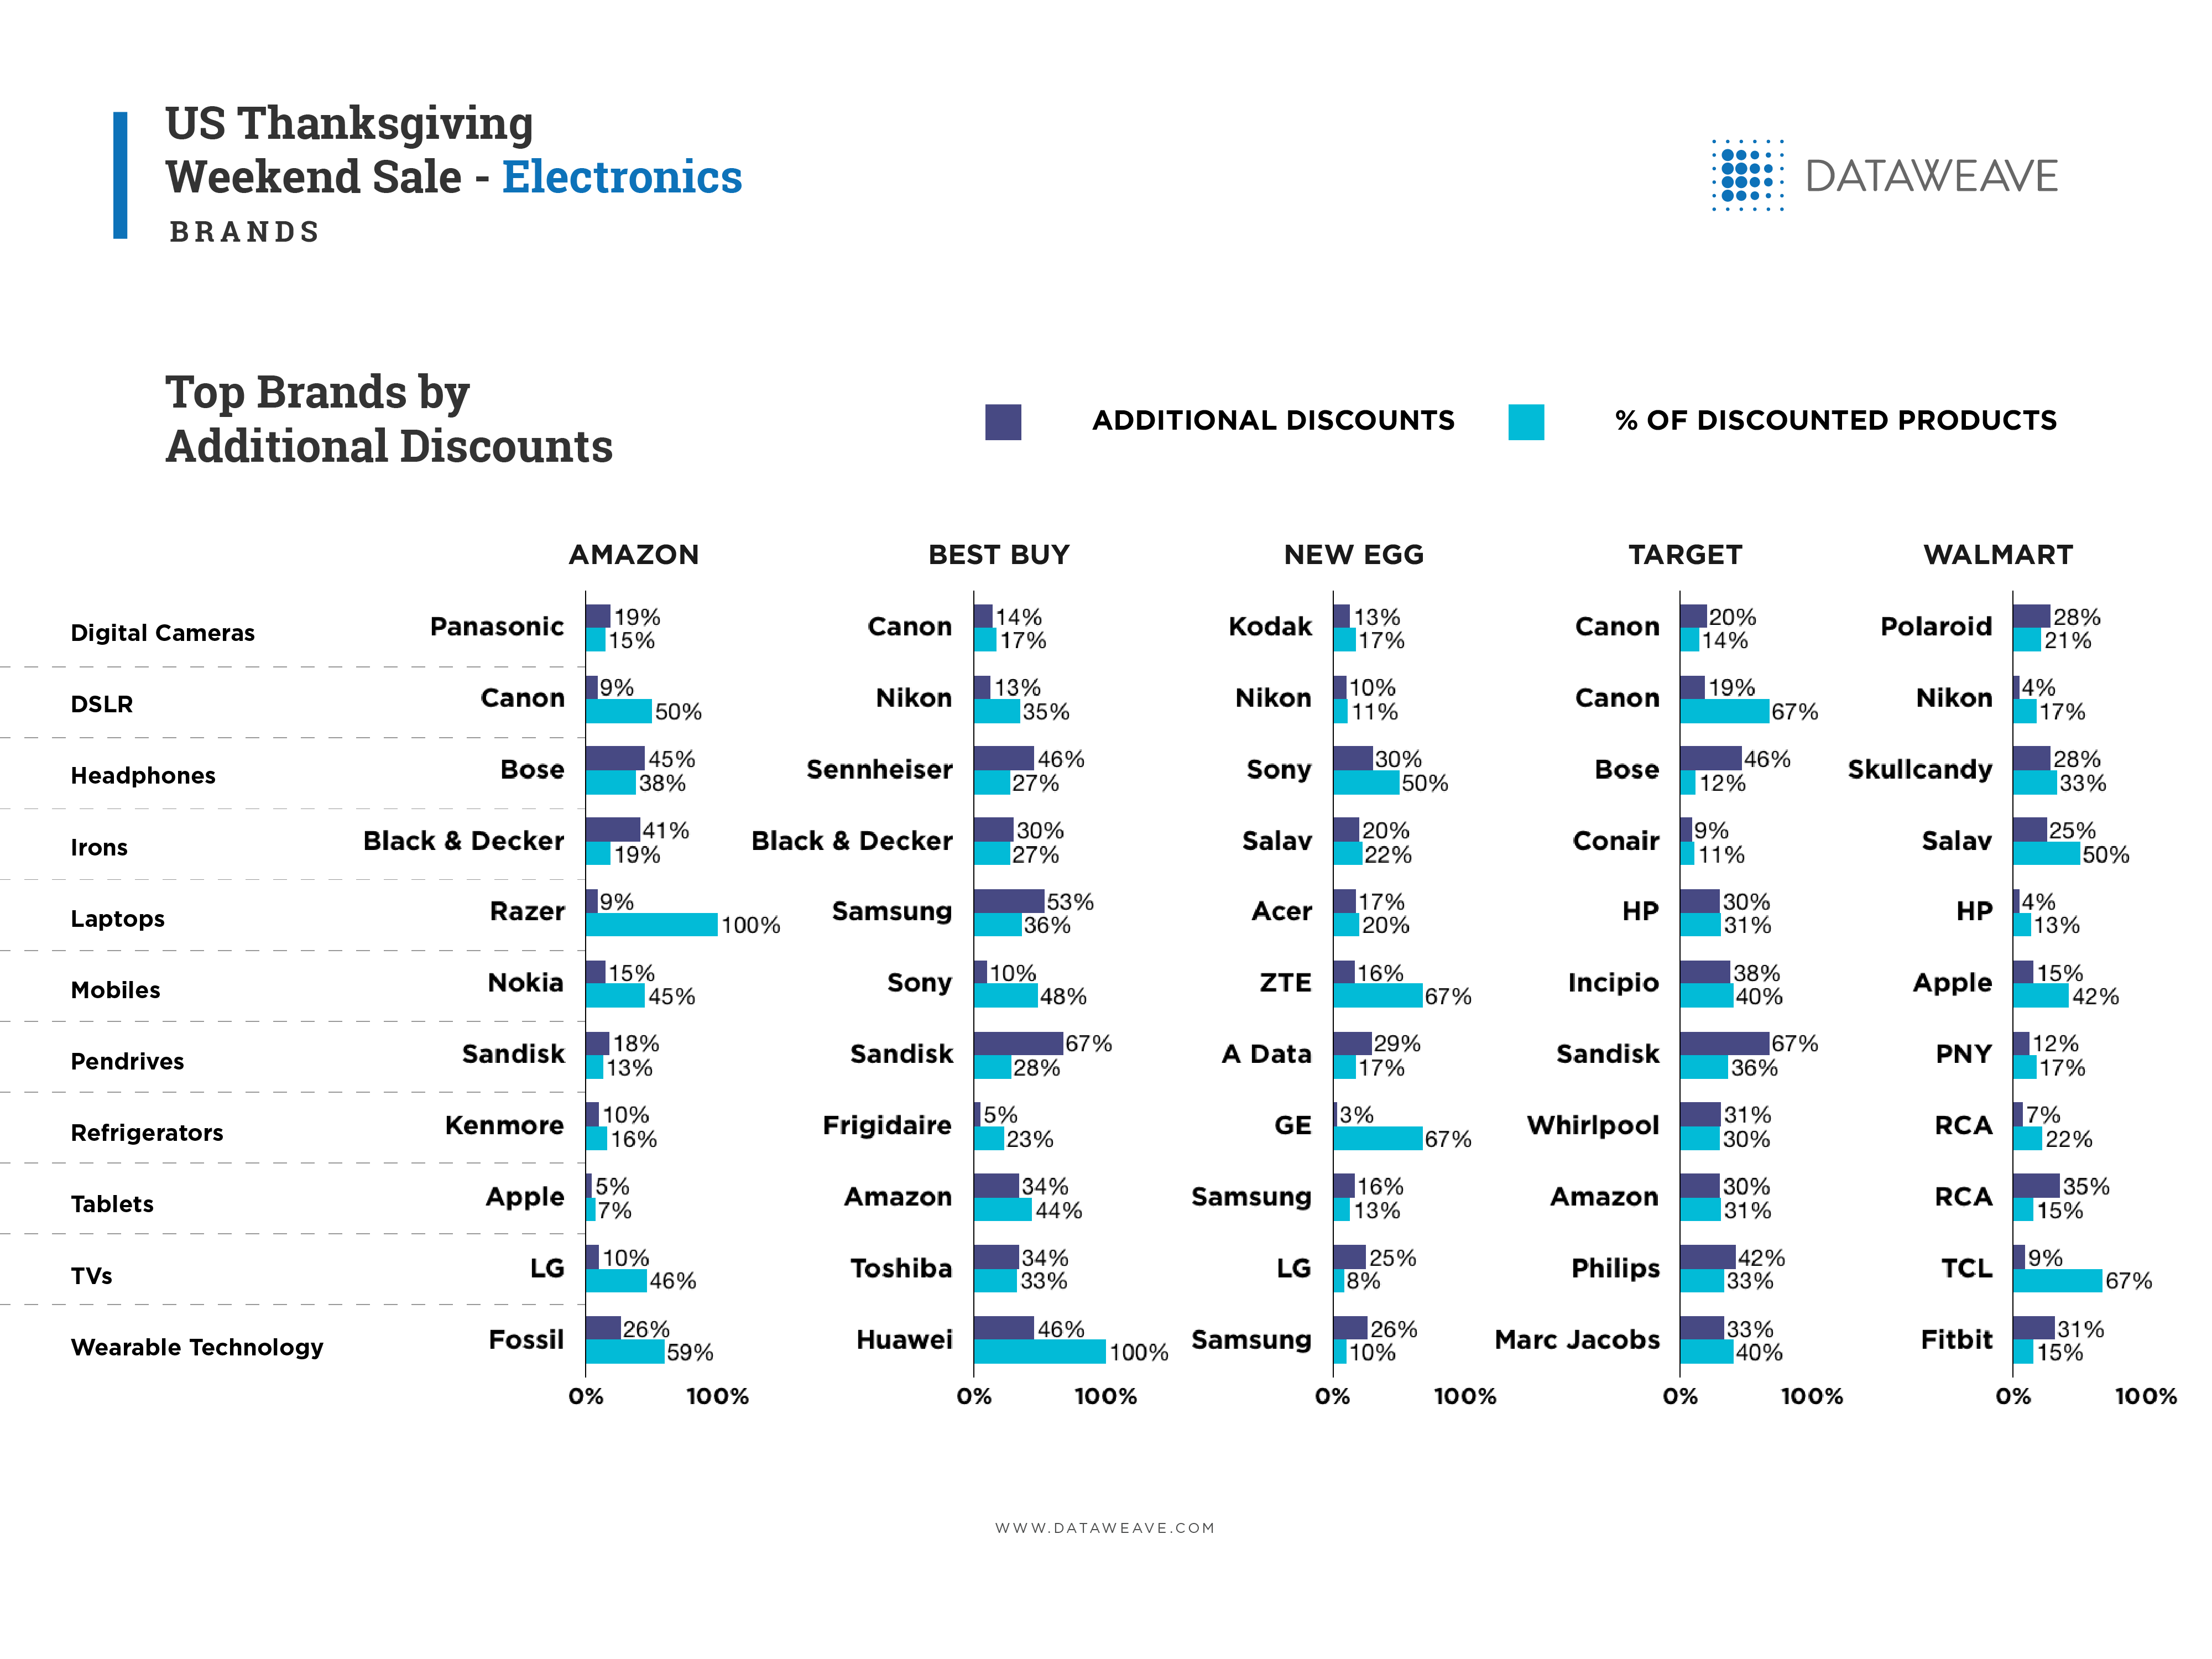
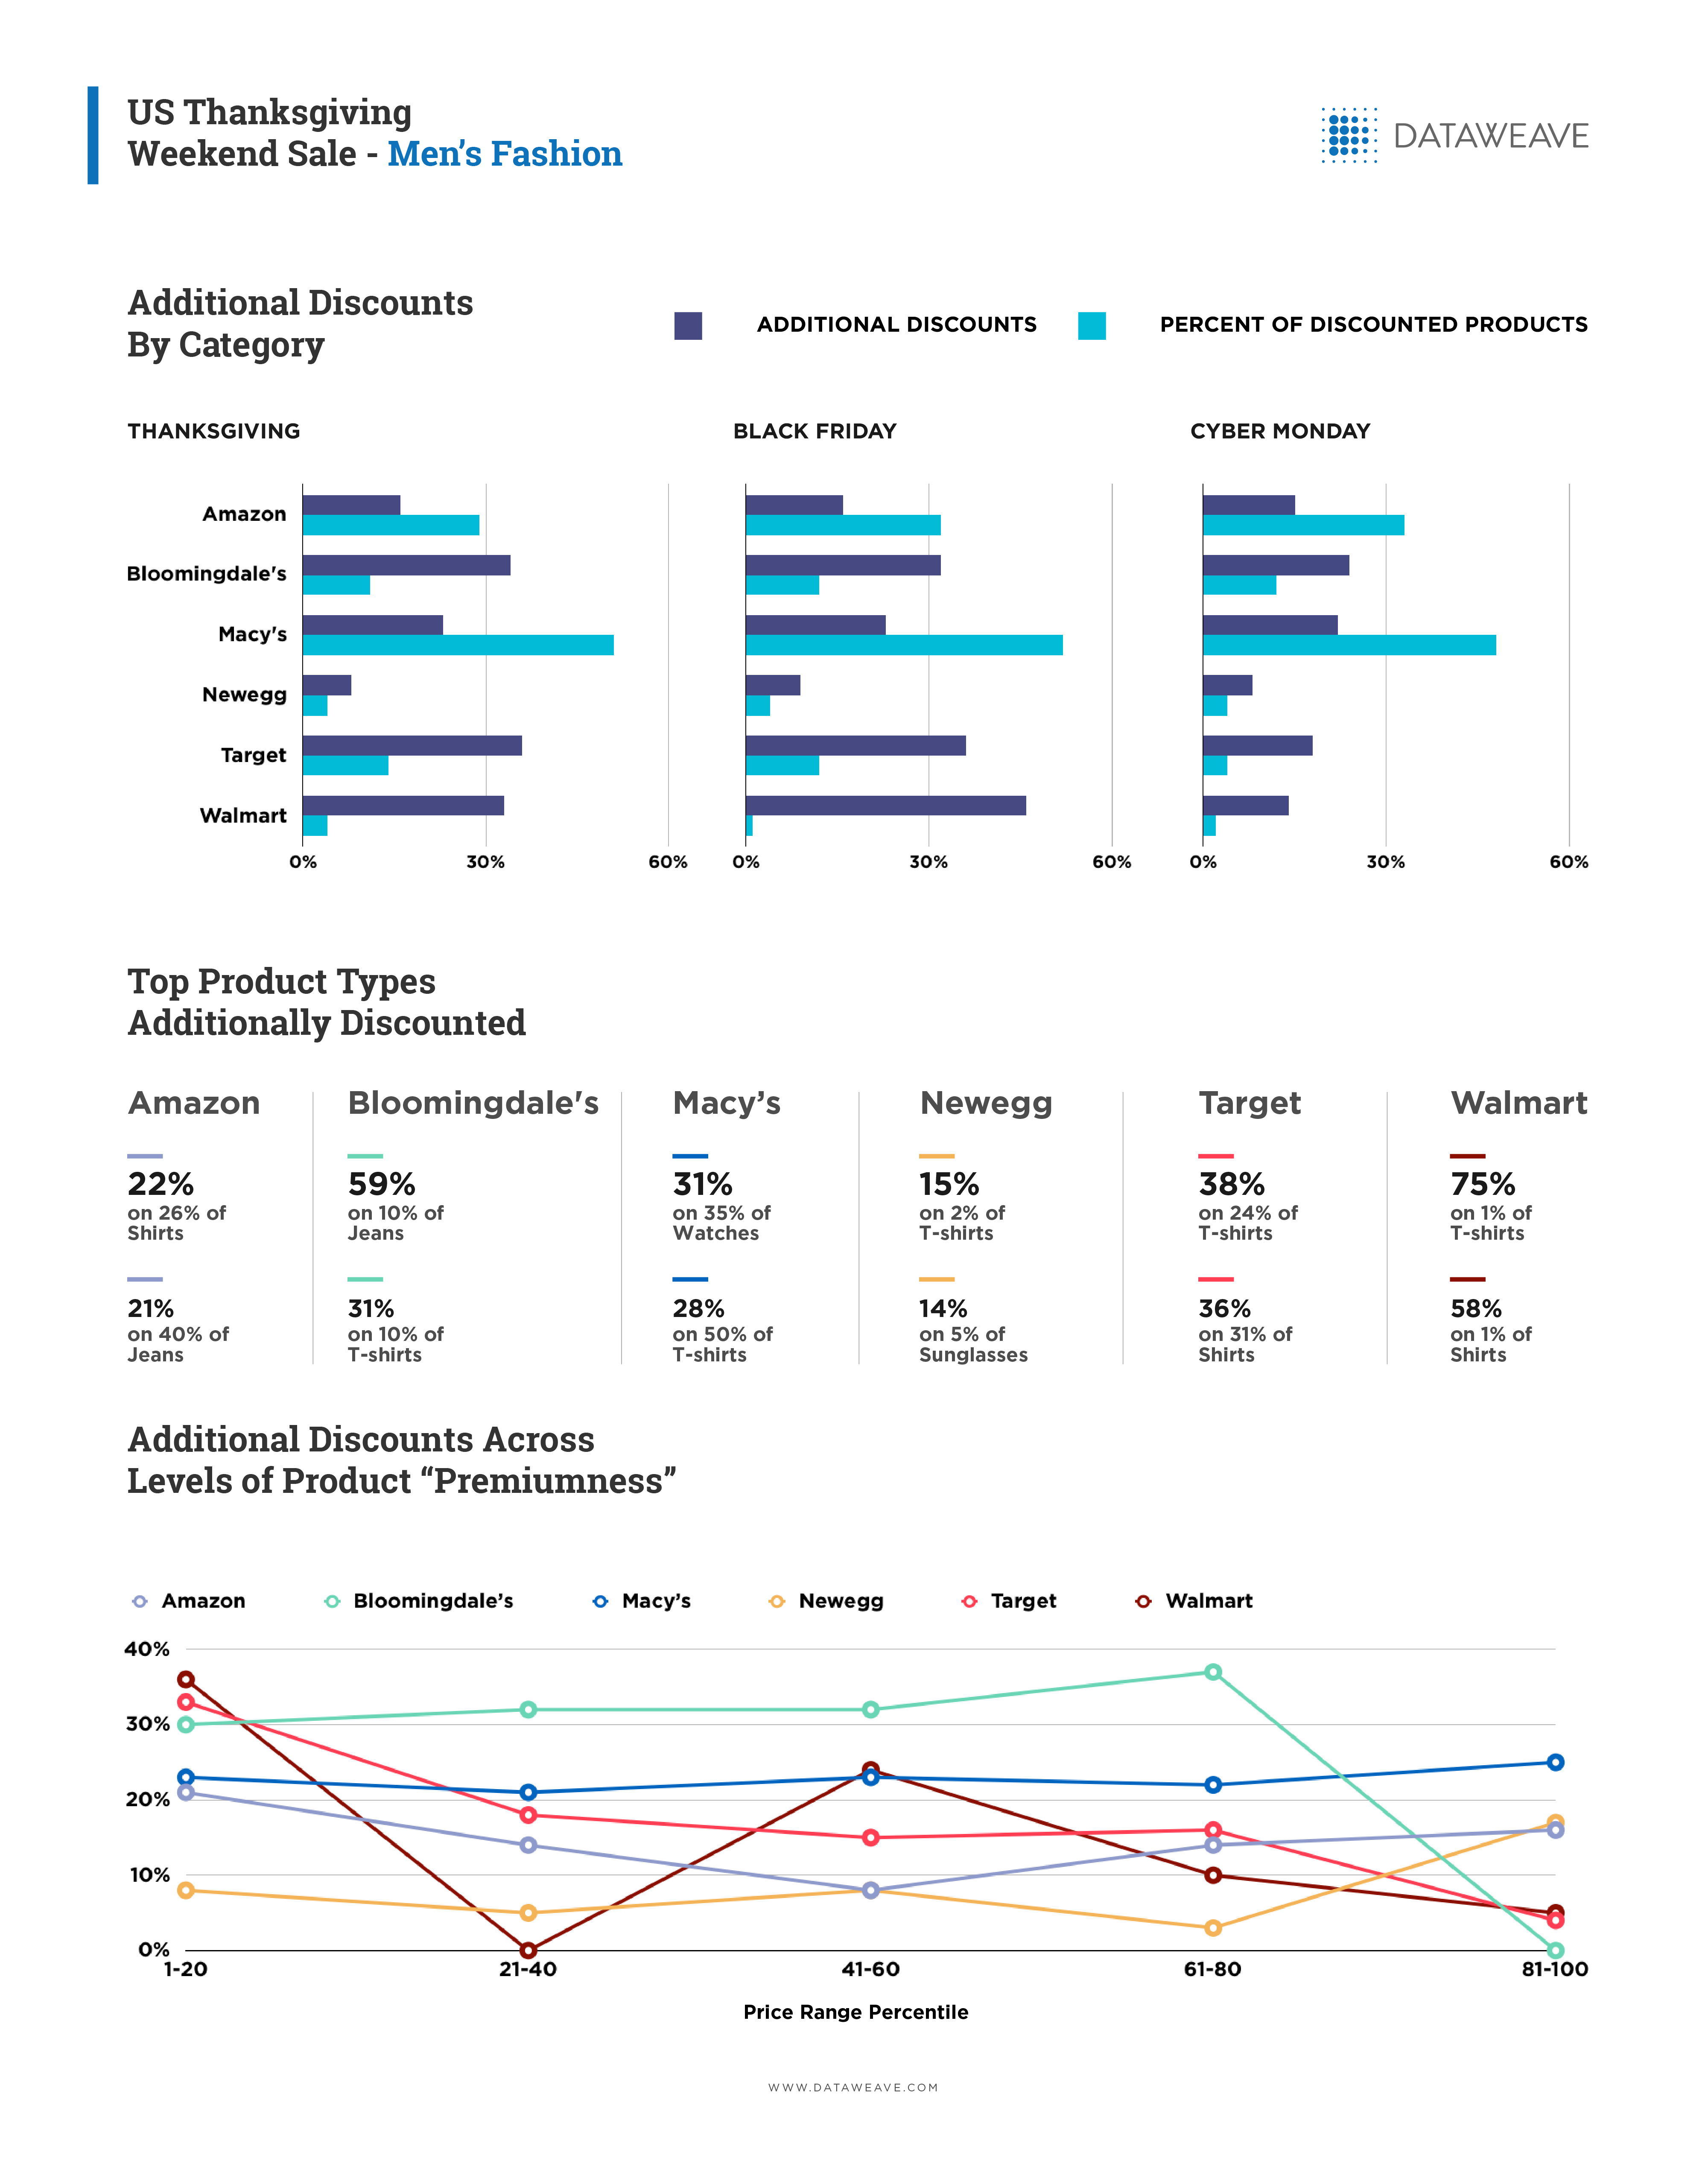
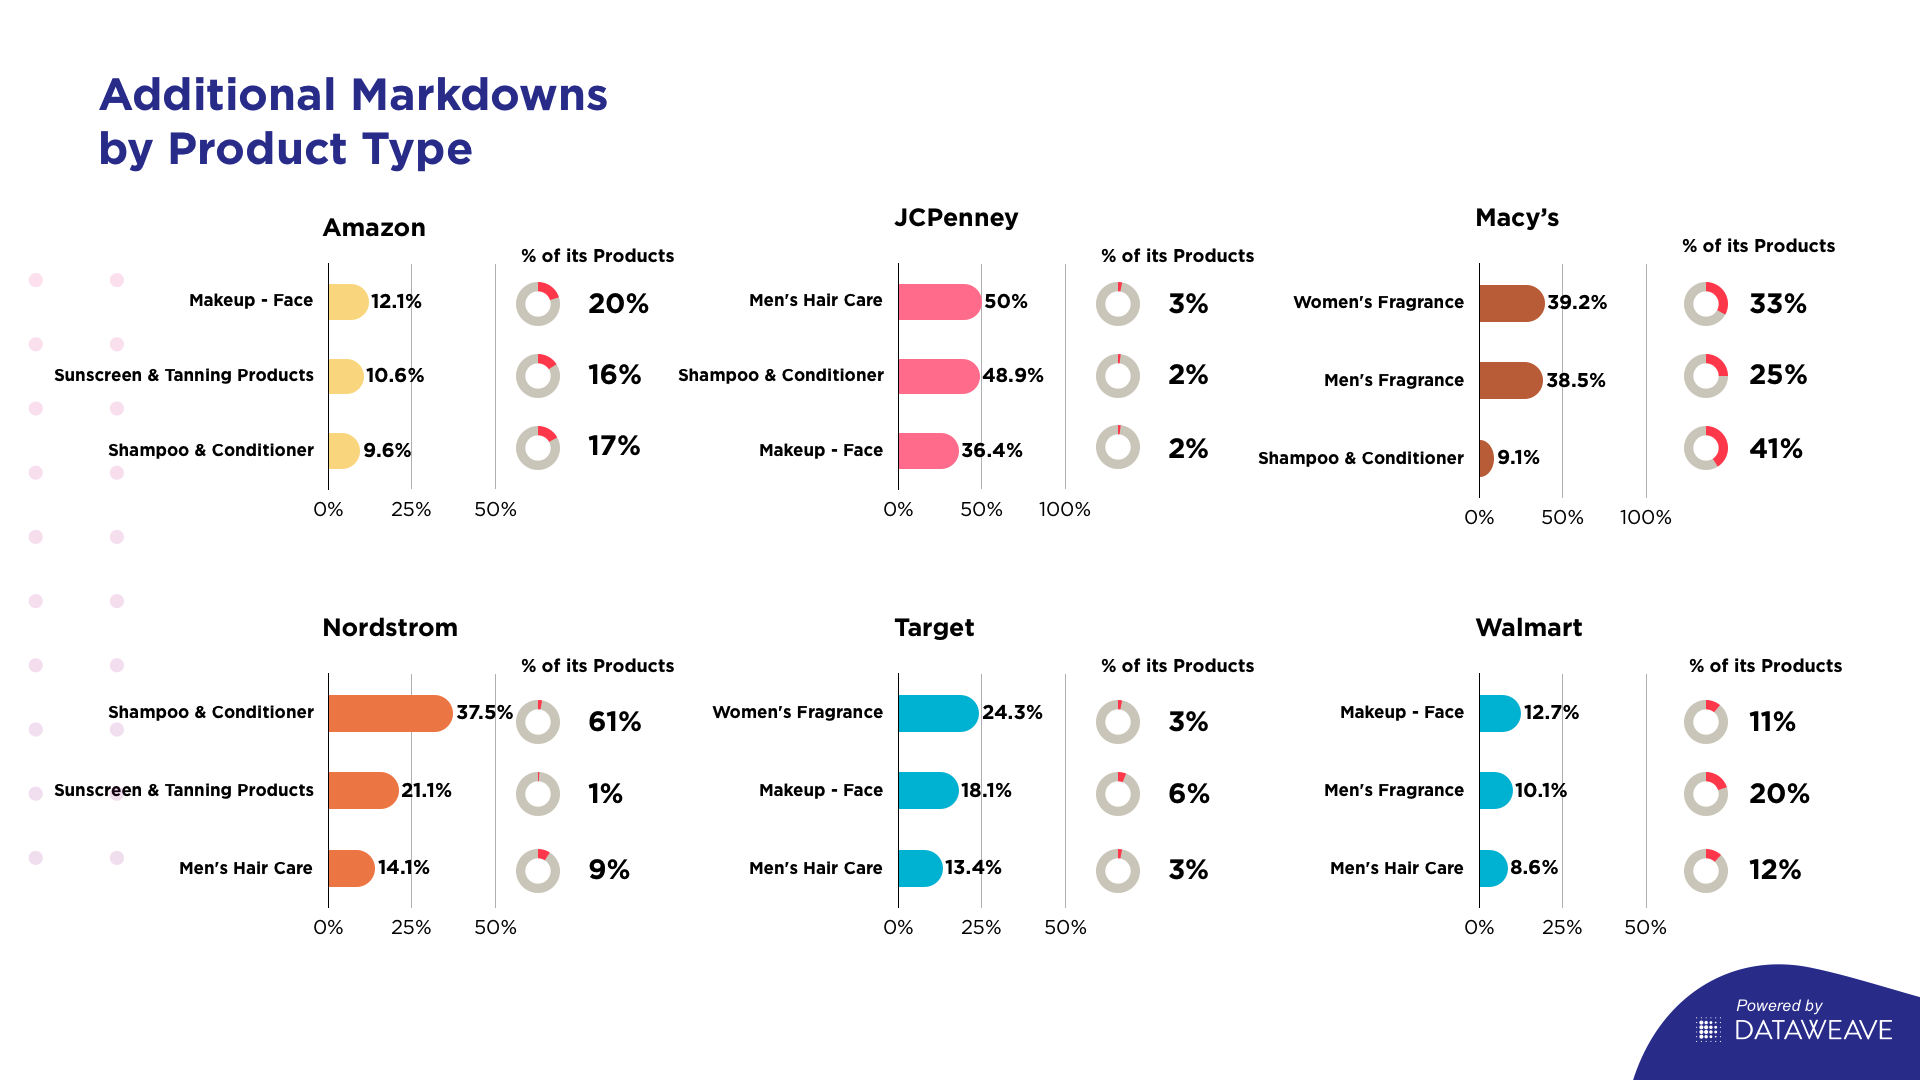
Additional markdowns by product types
When we delved further into the product types, we noticed that a majority of the retailers heavily marked down makeup, shampoo & conditioner and men’s hair care products. The table illustrates the top three discounted categories for each retailer we analyzed.
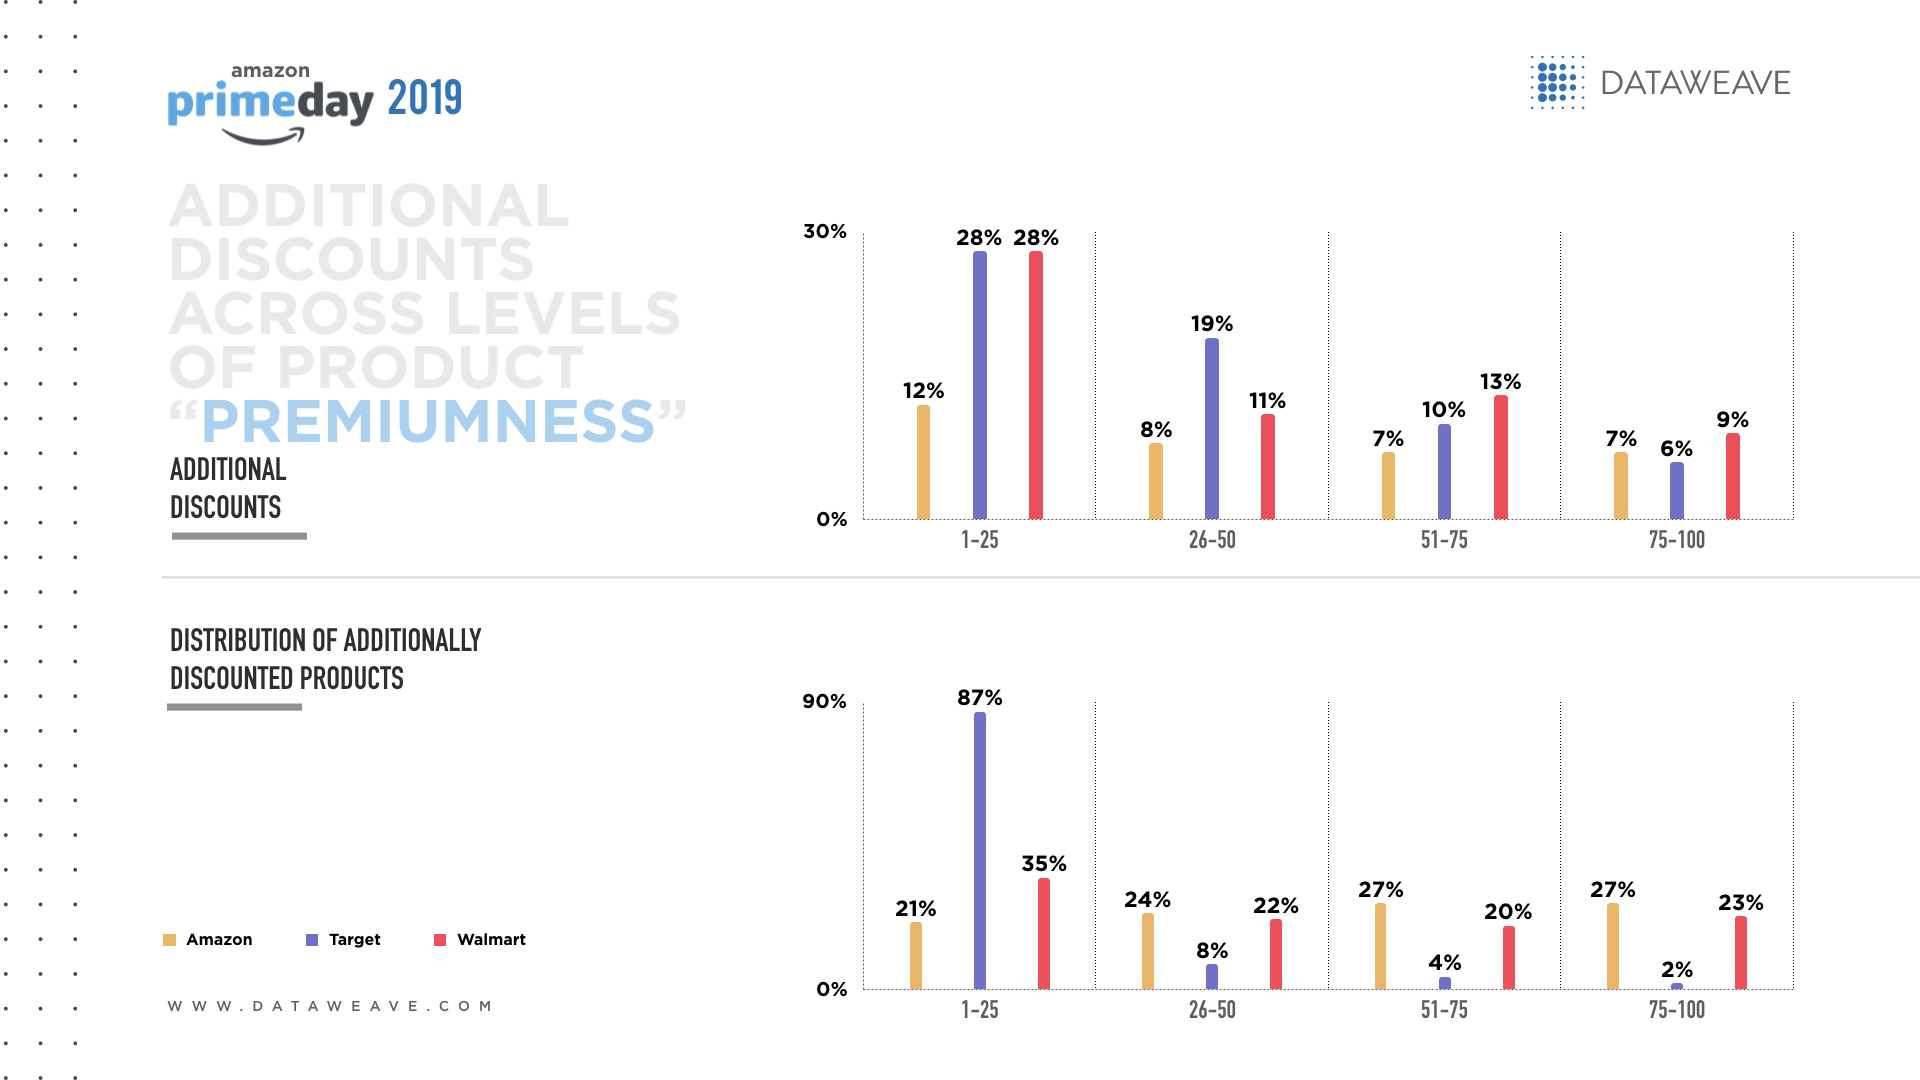
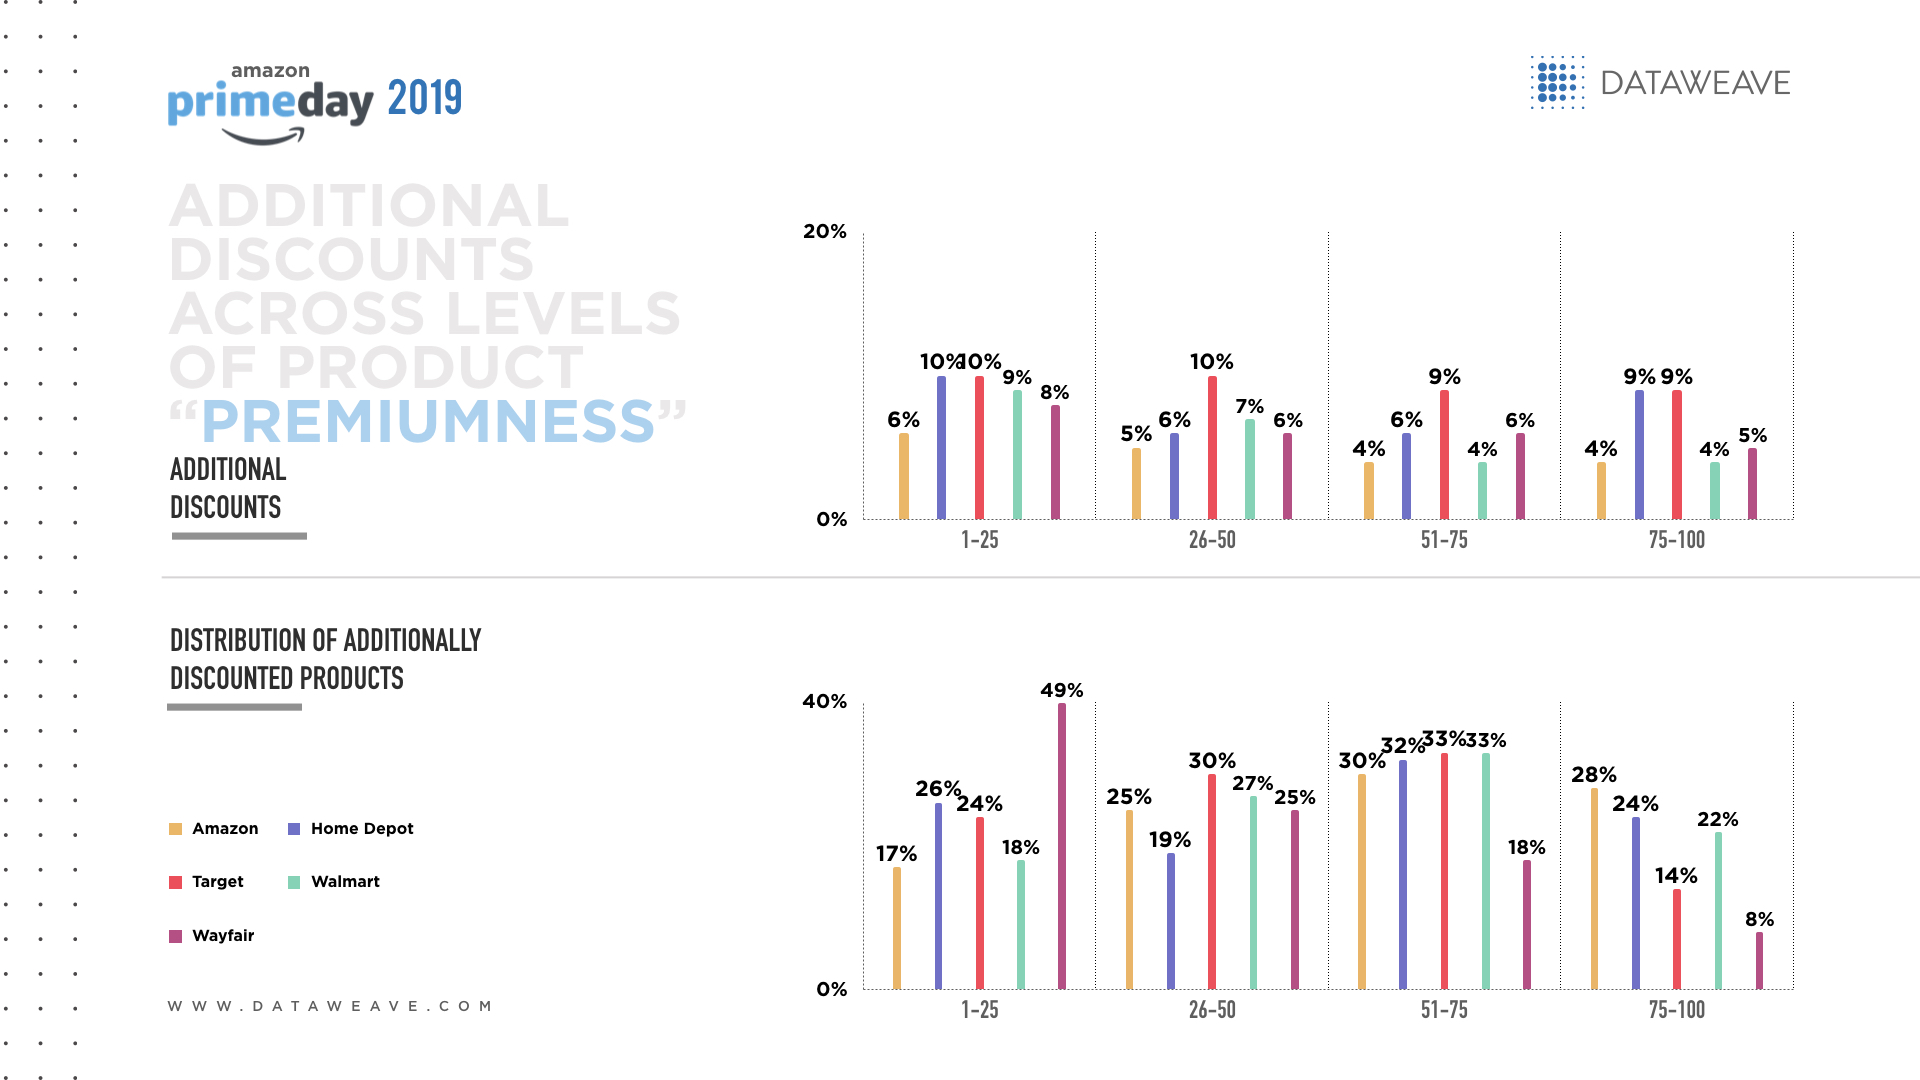
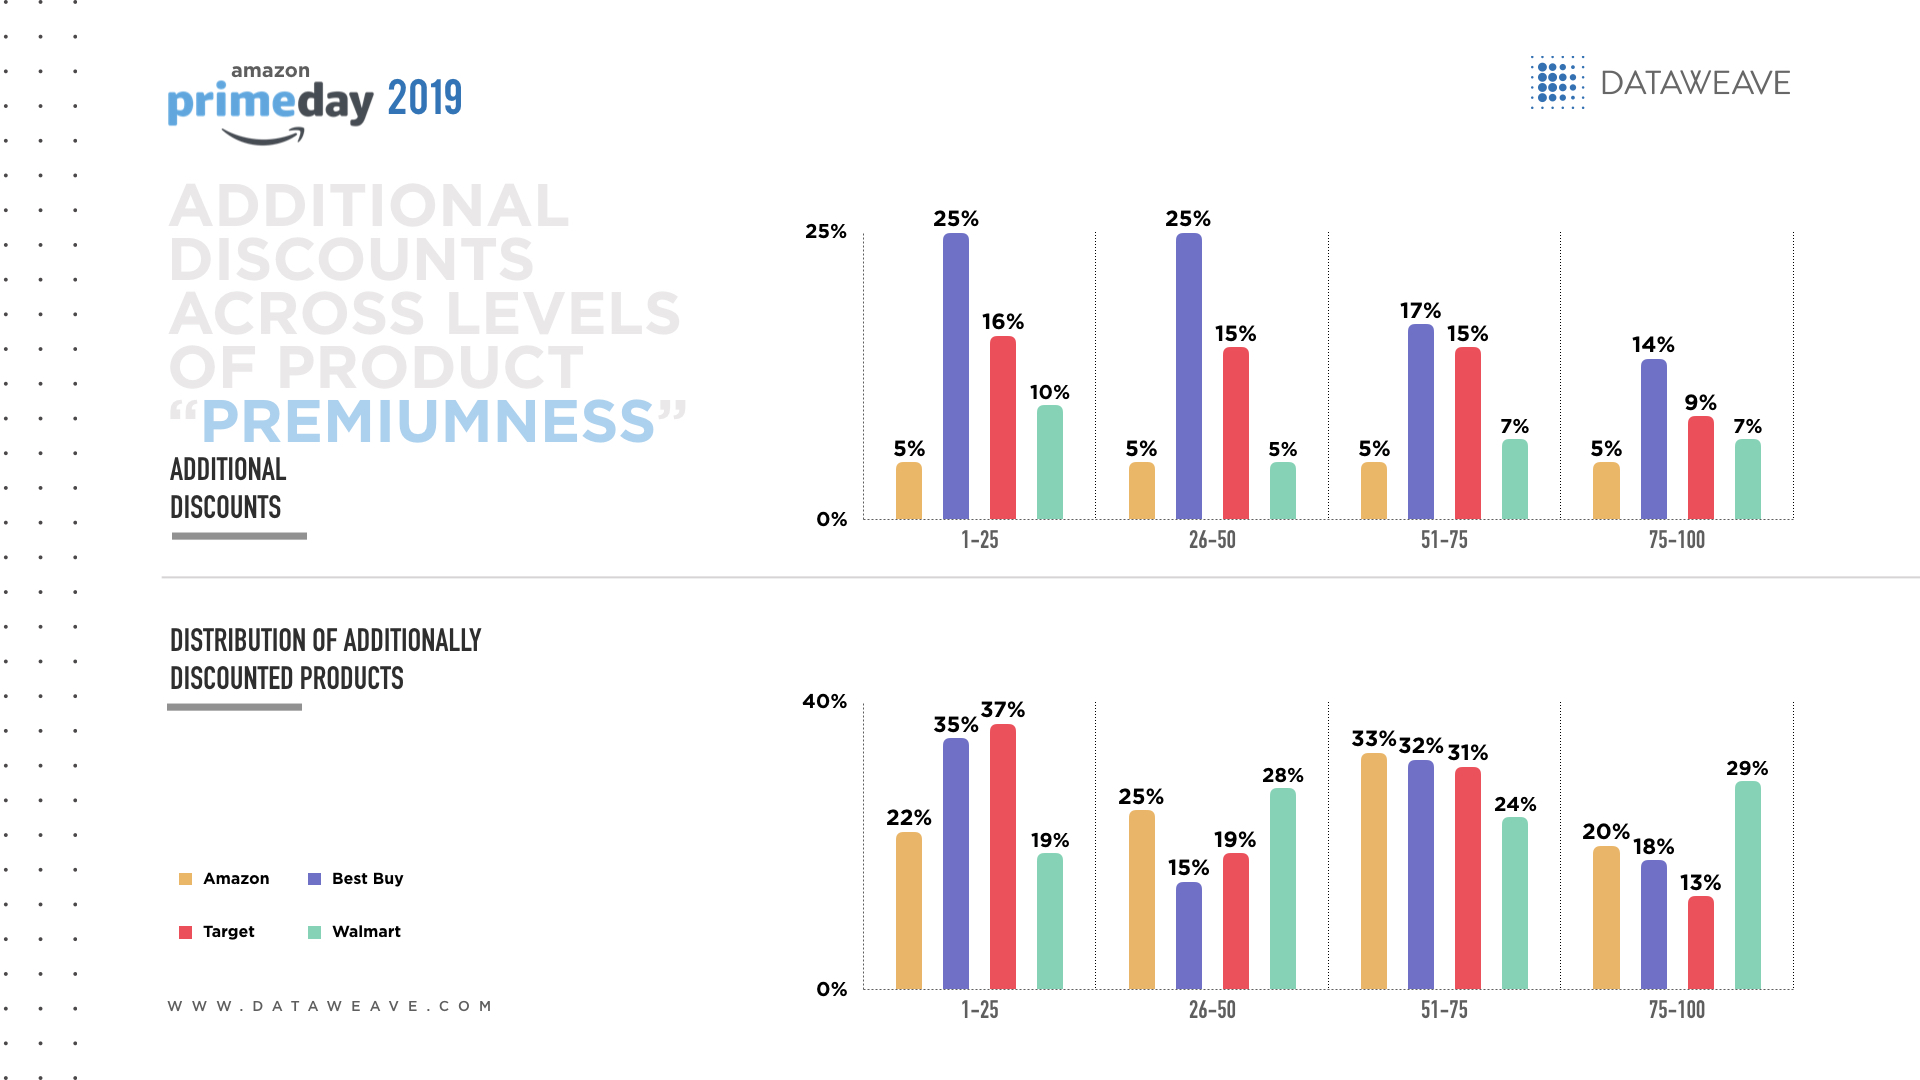
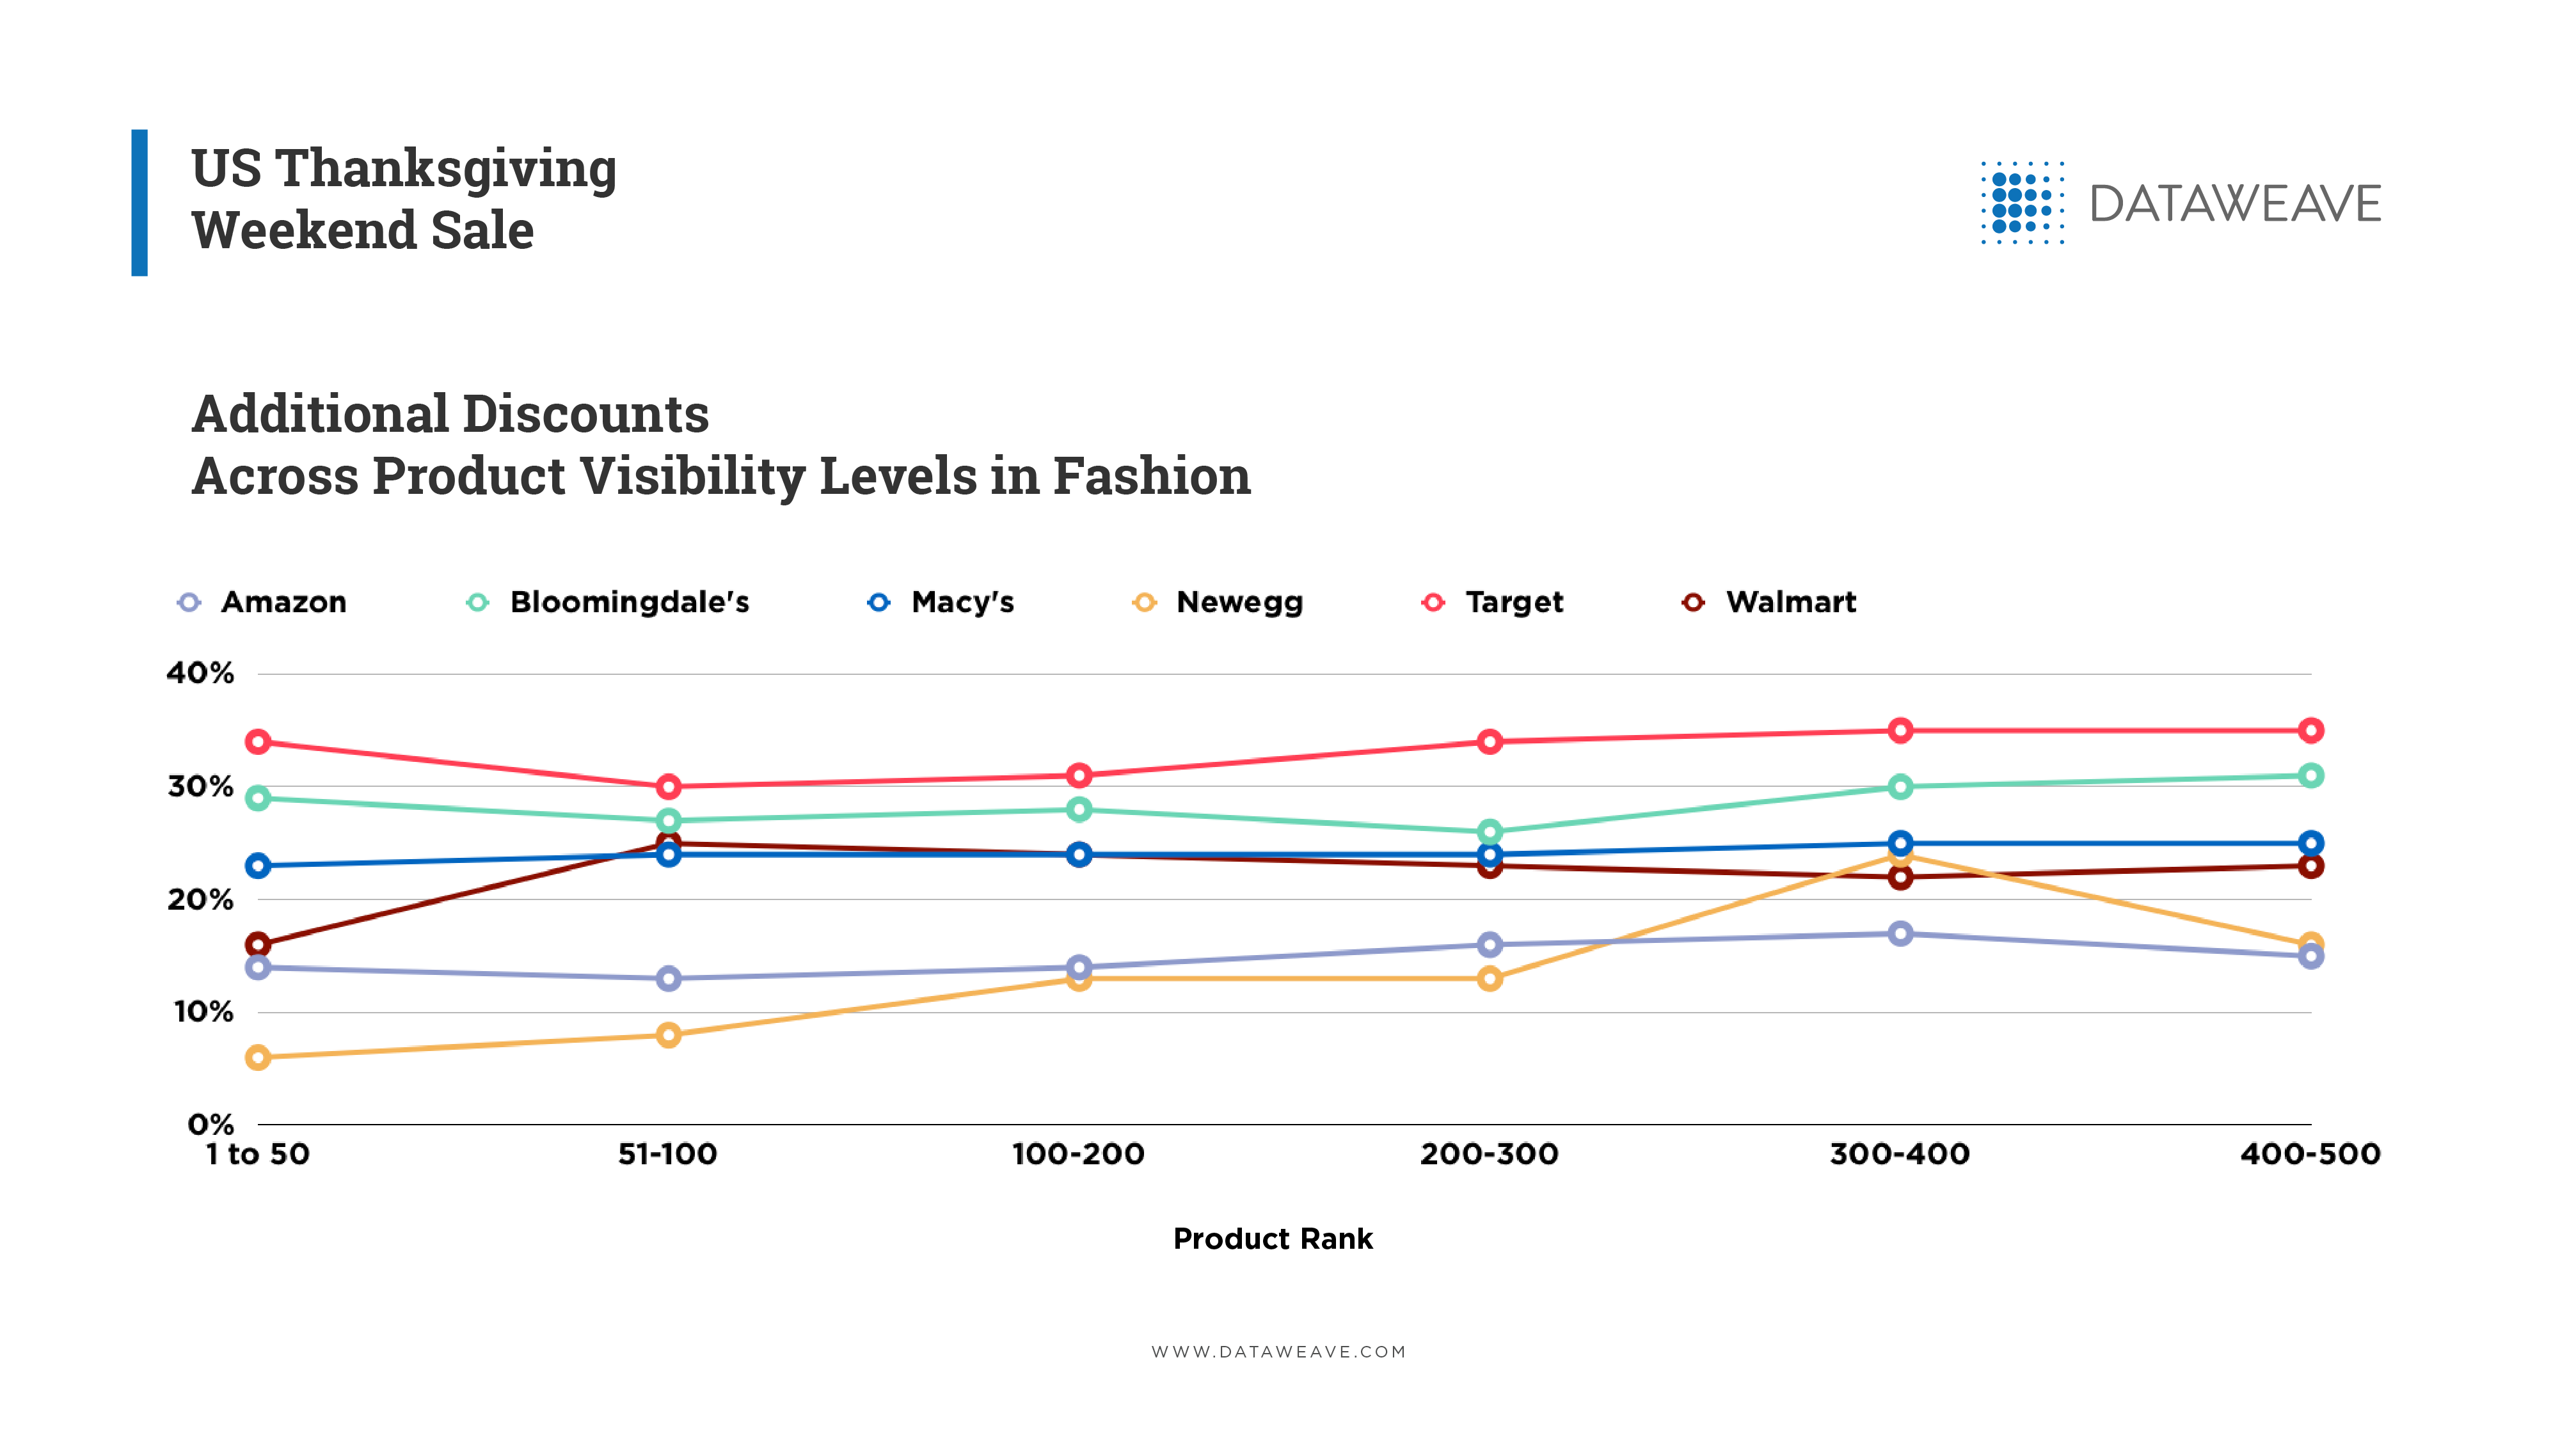
Premiumness
We categorized the products across retailers into buckets of how expensive or cheap a product is, relative to the rest of the products hosted by the retailer in the respective product type. Where the MRP was not displayed, the most expensive price of the product during the holiday period prior to Black Friday was considered for this categorization. We then tagged products as High, Medium and Low in terms of product premiumness, with High referring to the more expensive products.
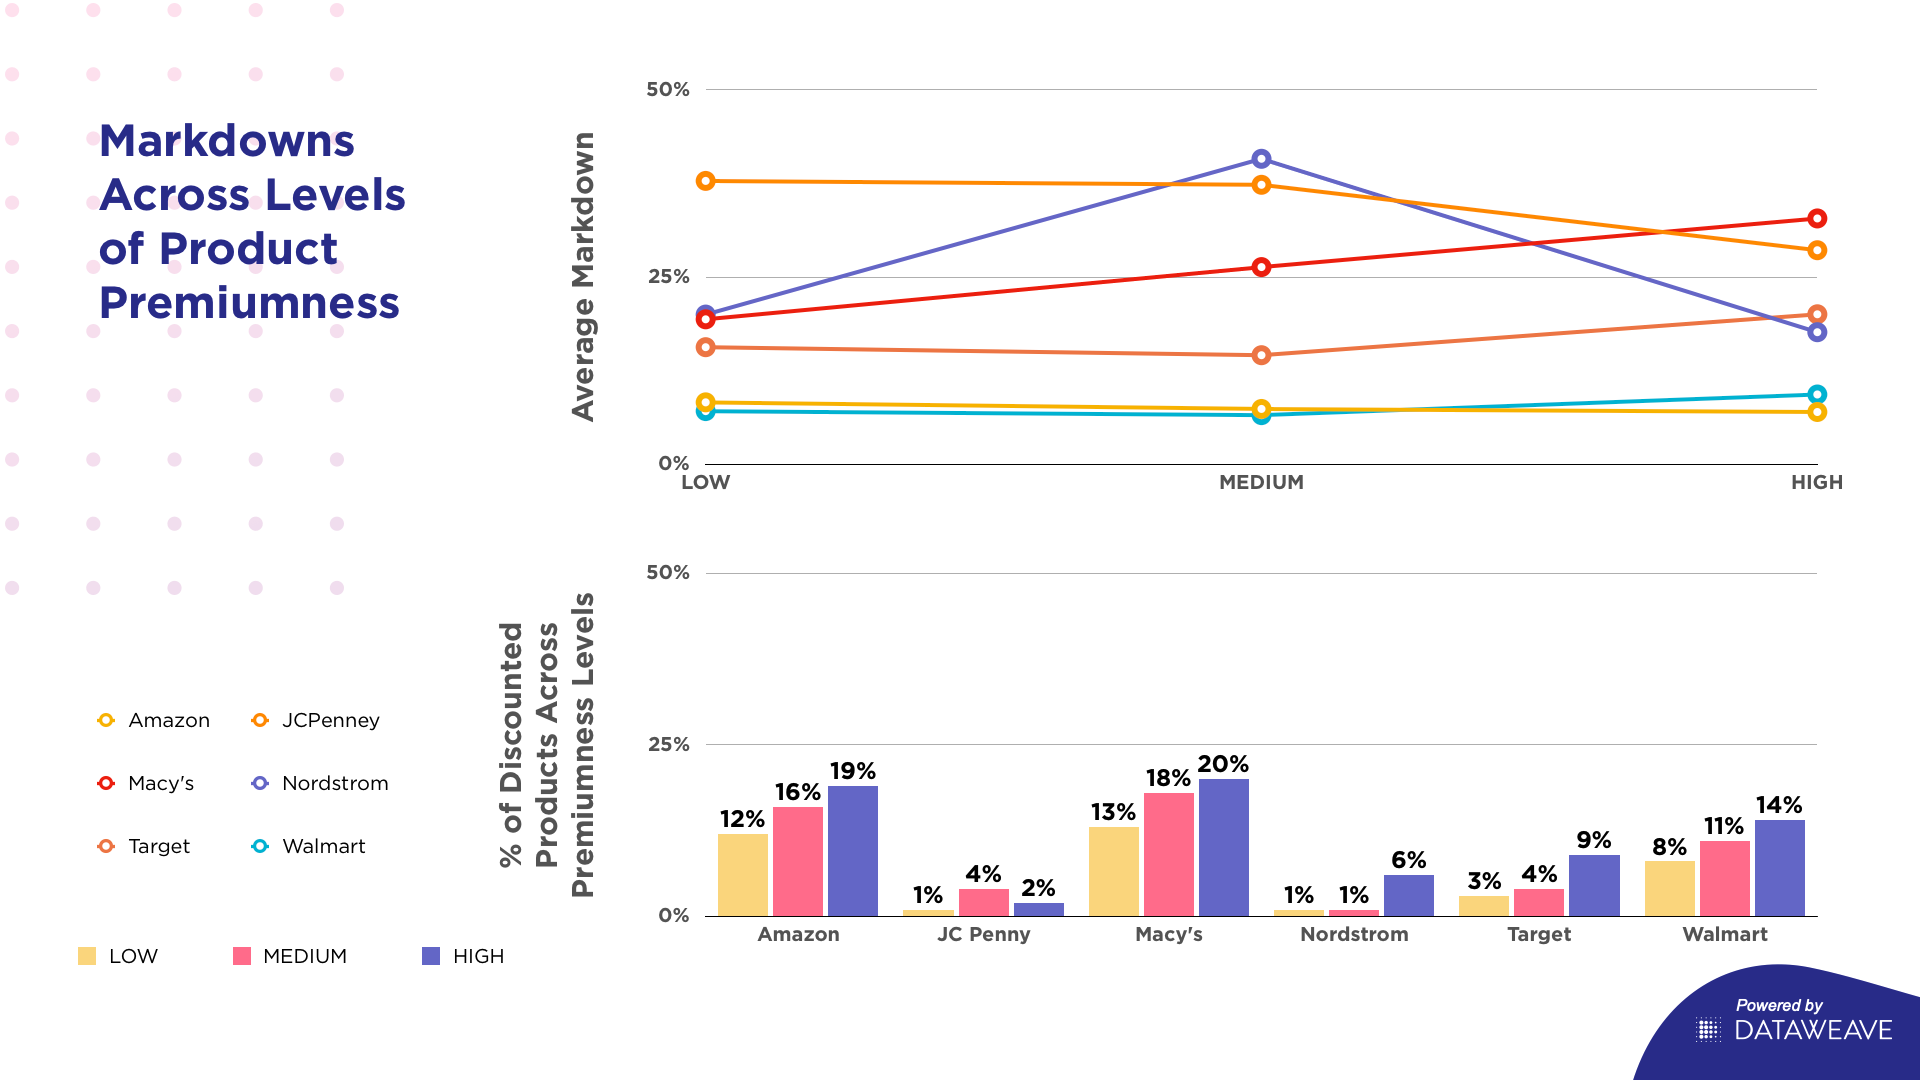
In line with previous trends, Macy’s had the highest markdown on its high level products at 32.8%. It also had the widest coverage for the category at 20%. Amazon, Macy’s, Target, Walmart followed the expected approach of providing higher markdowns on the more premium products, and also on a higher portion of these products. This would be consistent with their goal of providing attractive offers on premium goods while also protecting their margins.
JC Penney and Nordstrom were exceptions here, with JC Penney providing higher markdowns on its cheaper goods, while Nordstrom focused its markdowns on the medium bucket. That being said, it should be reiterated that the portion of products with markdowns for both thee retailers was relatively small.
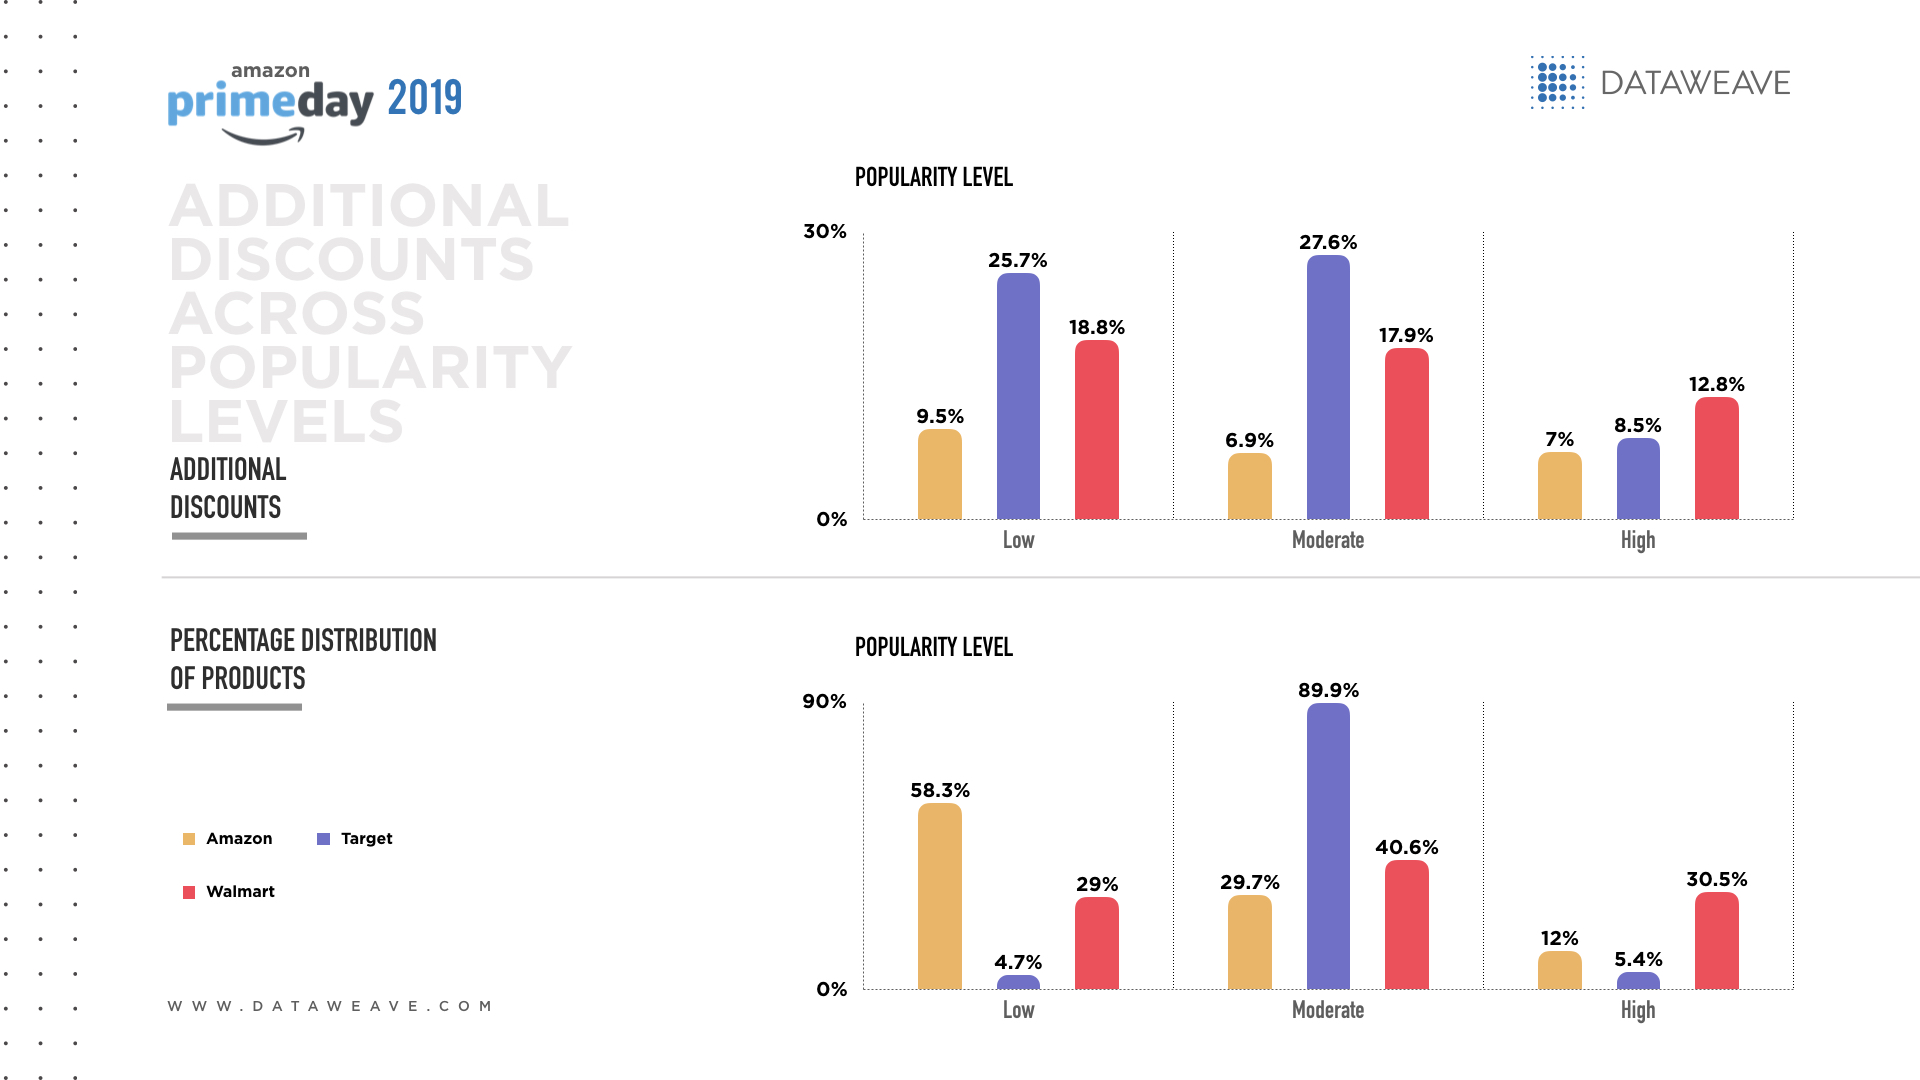
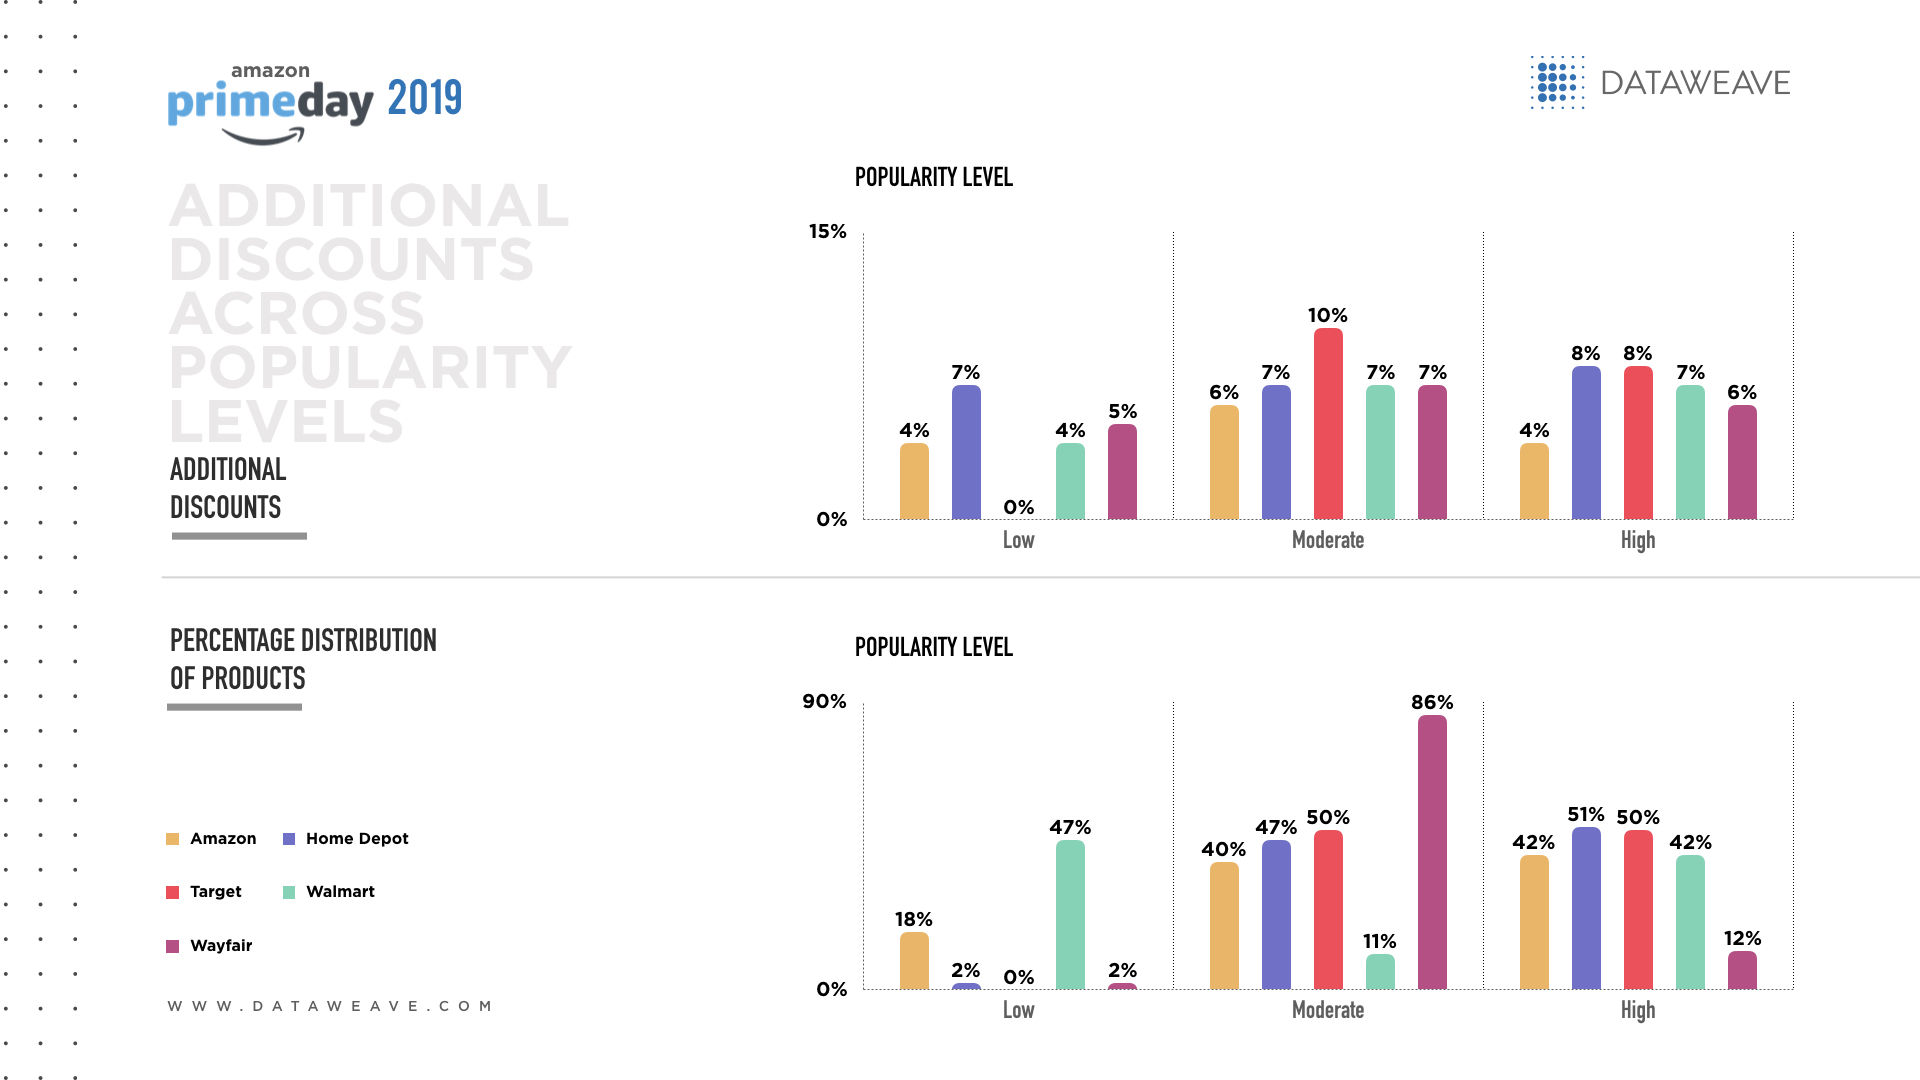
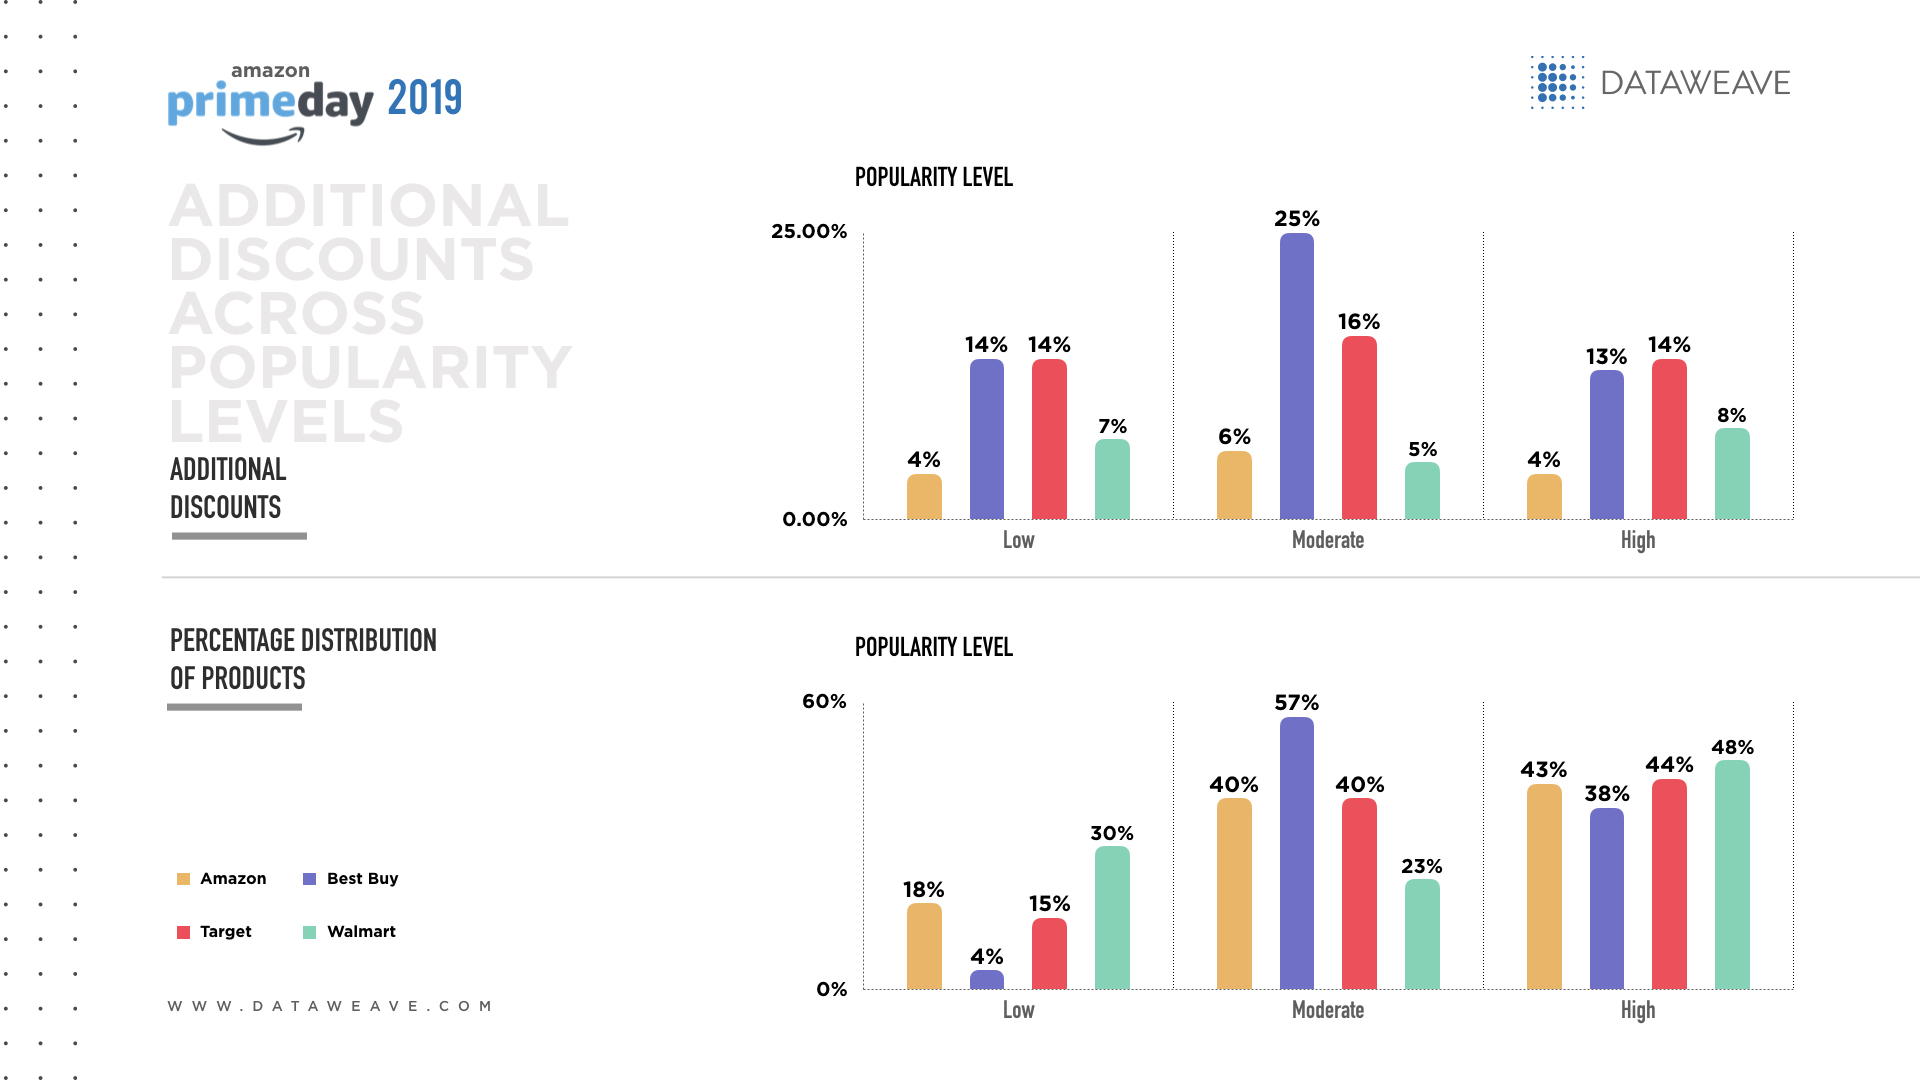
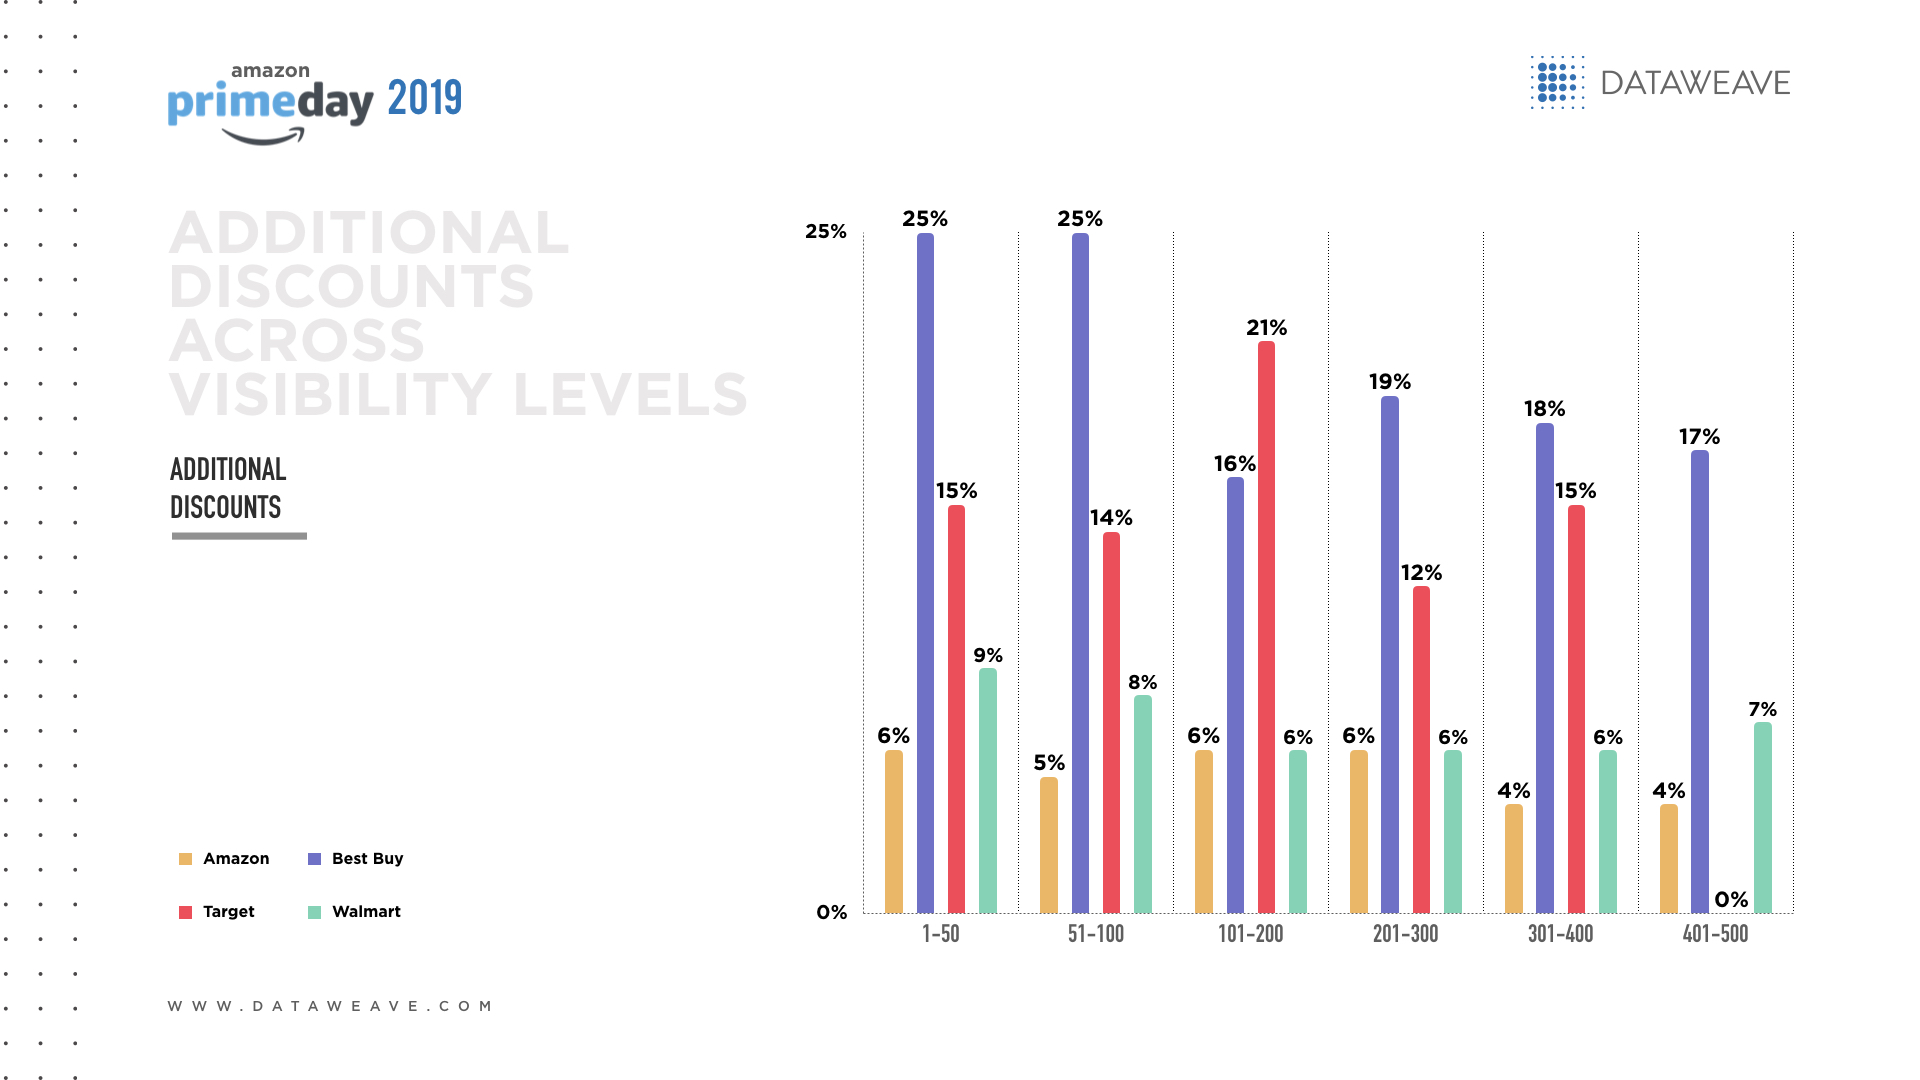
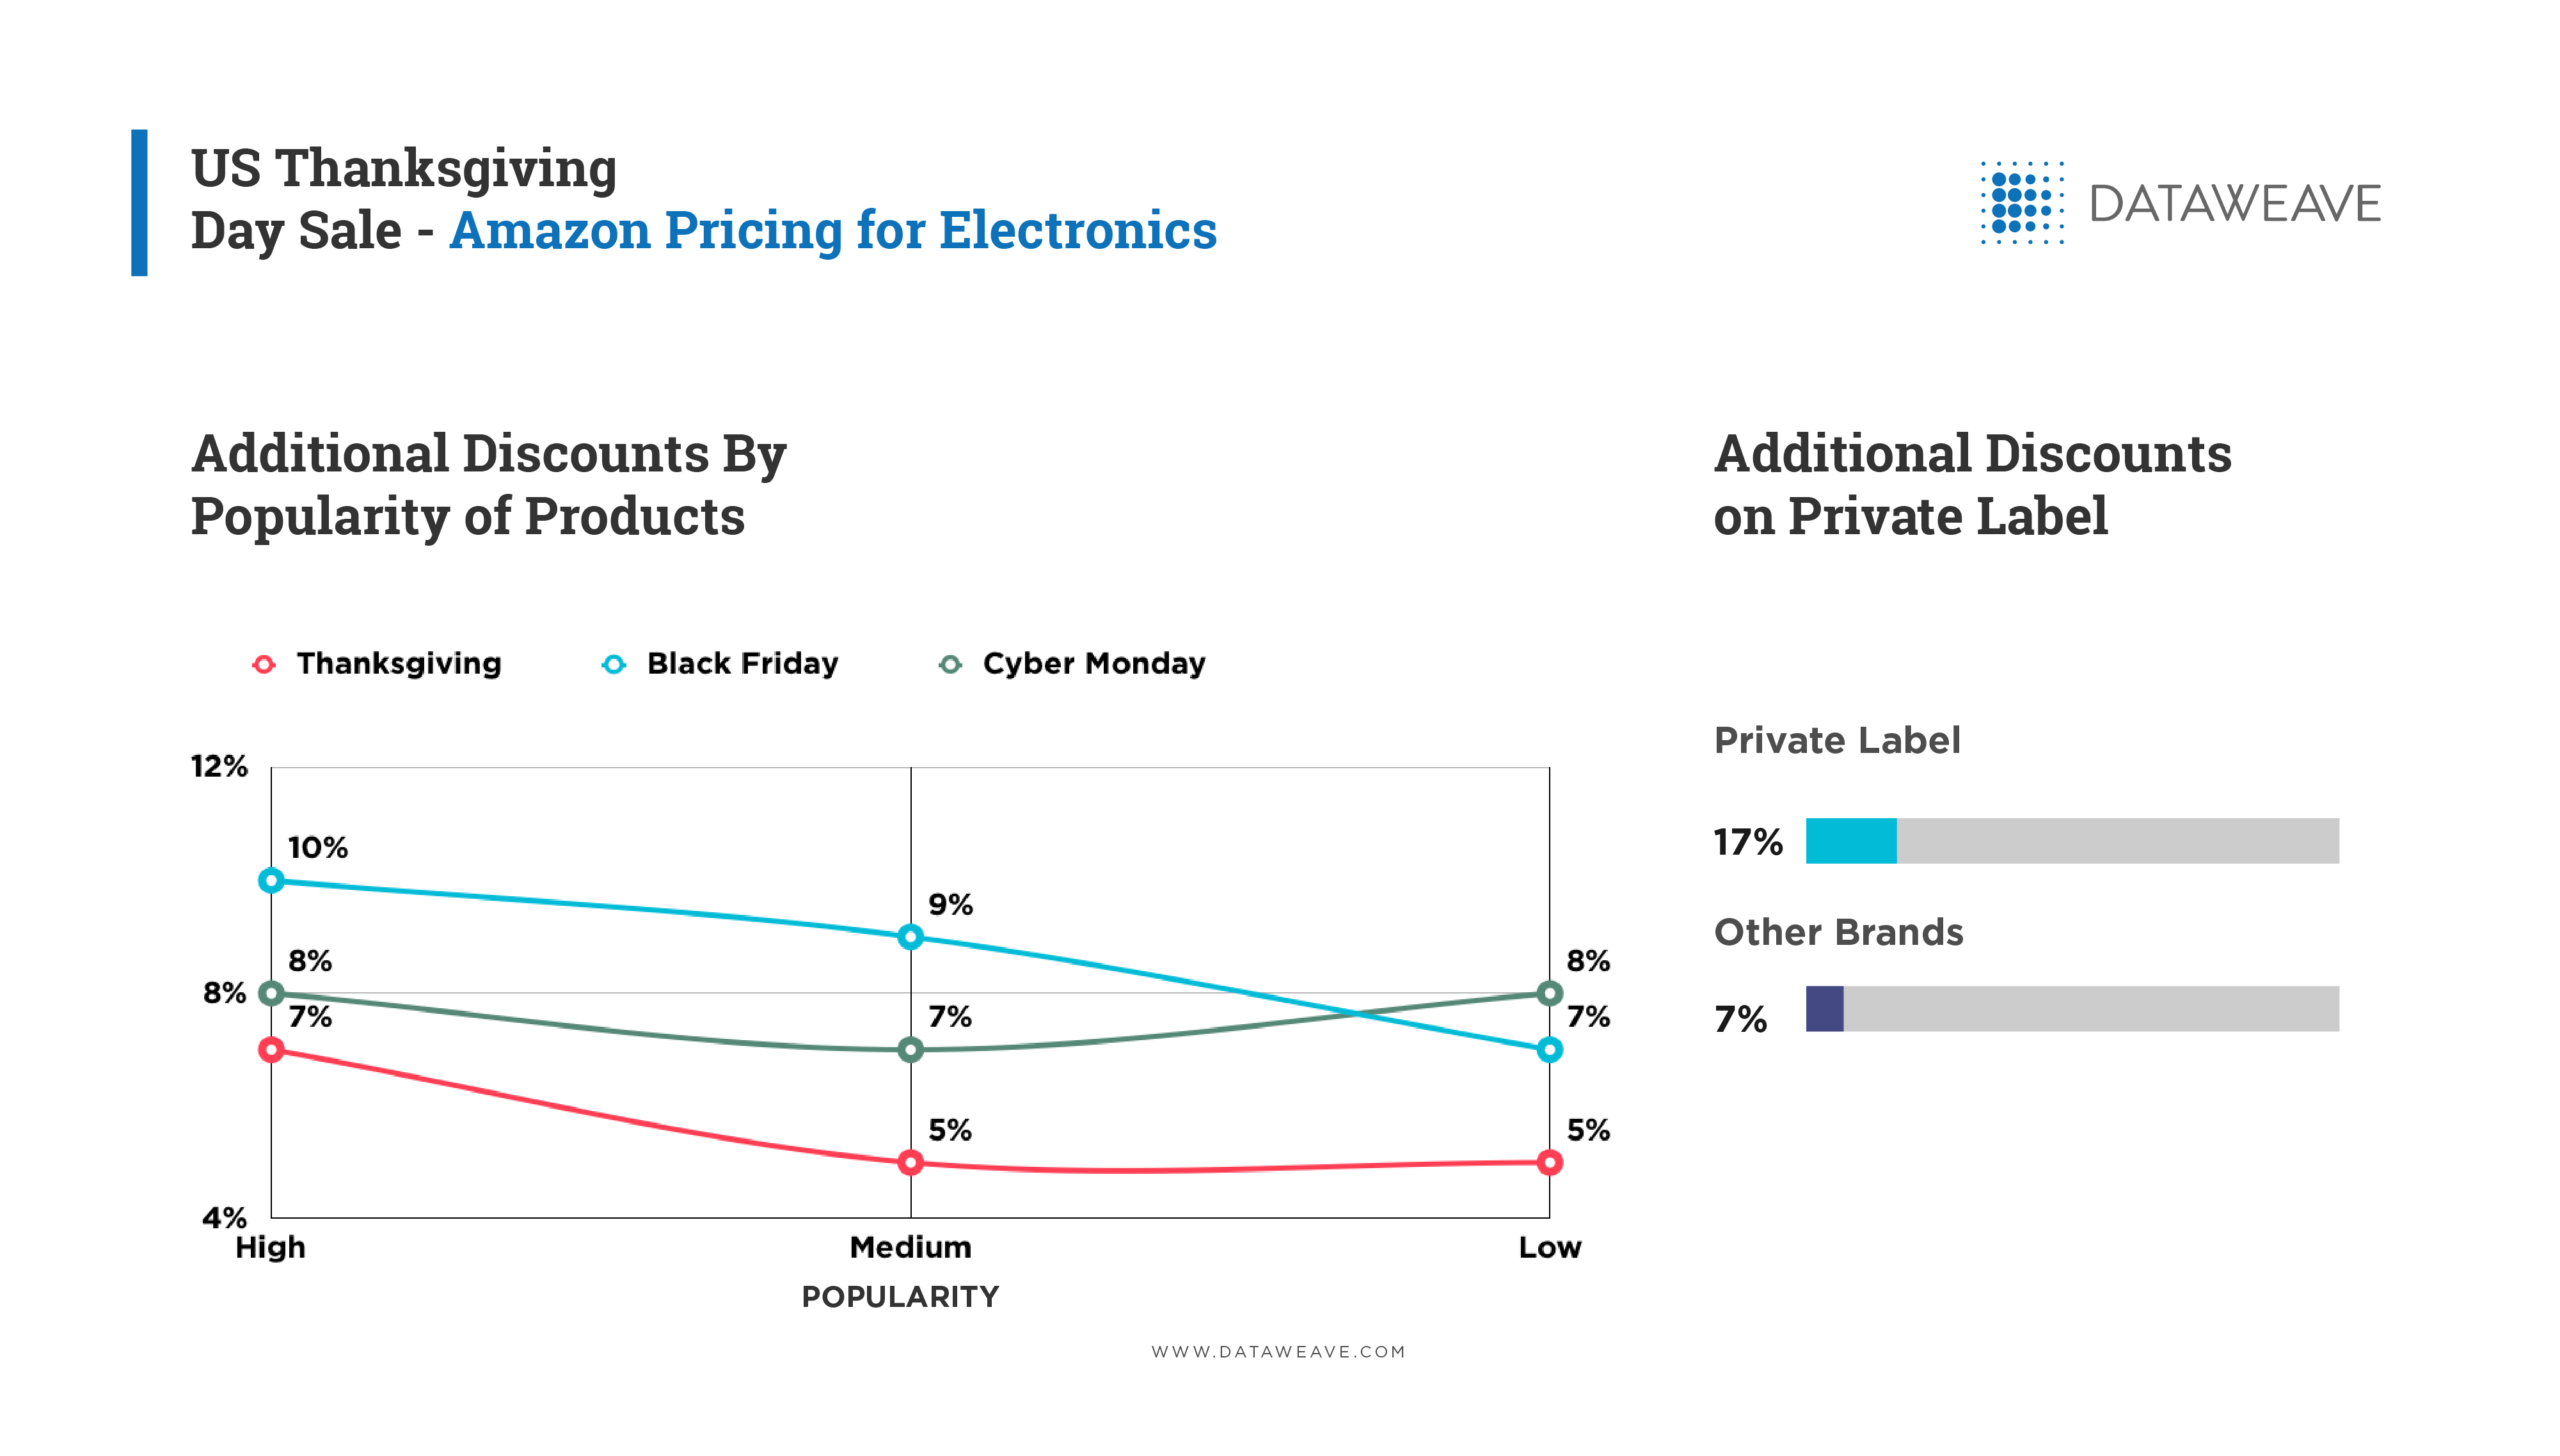
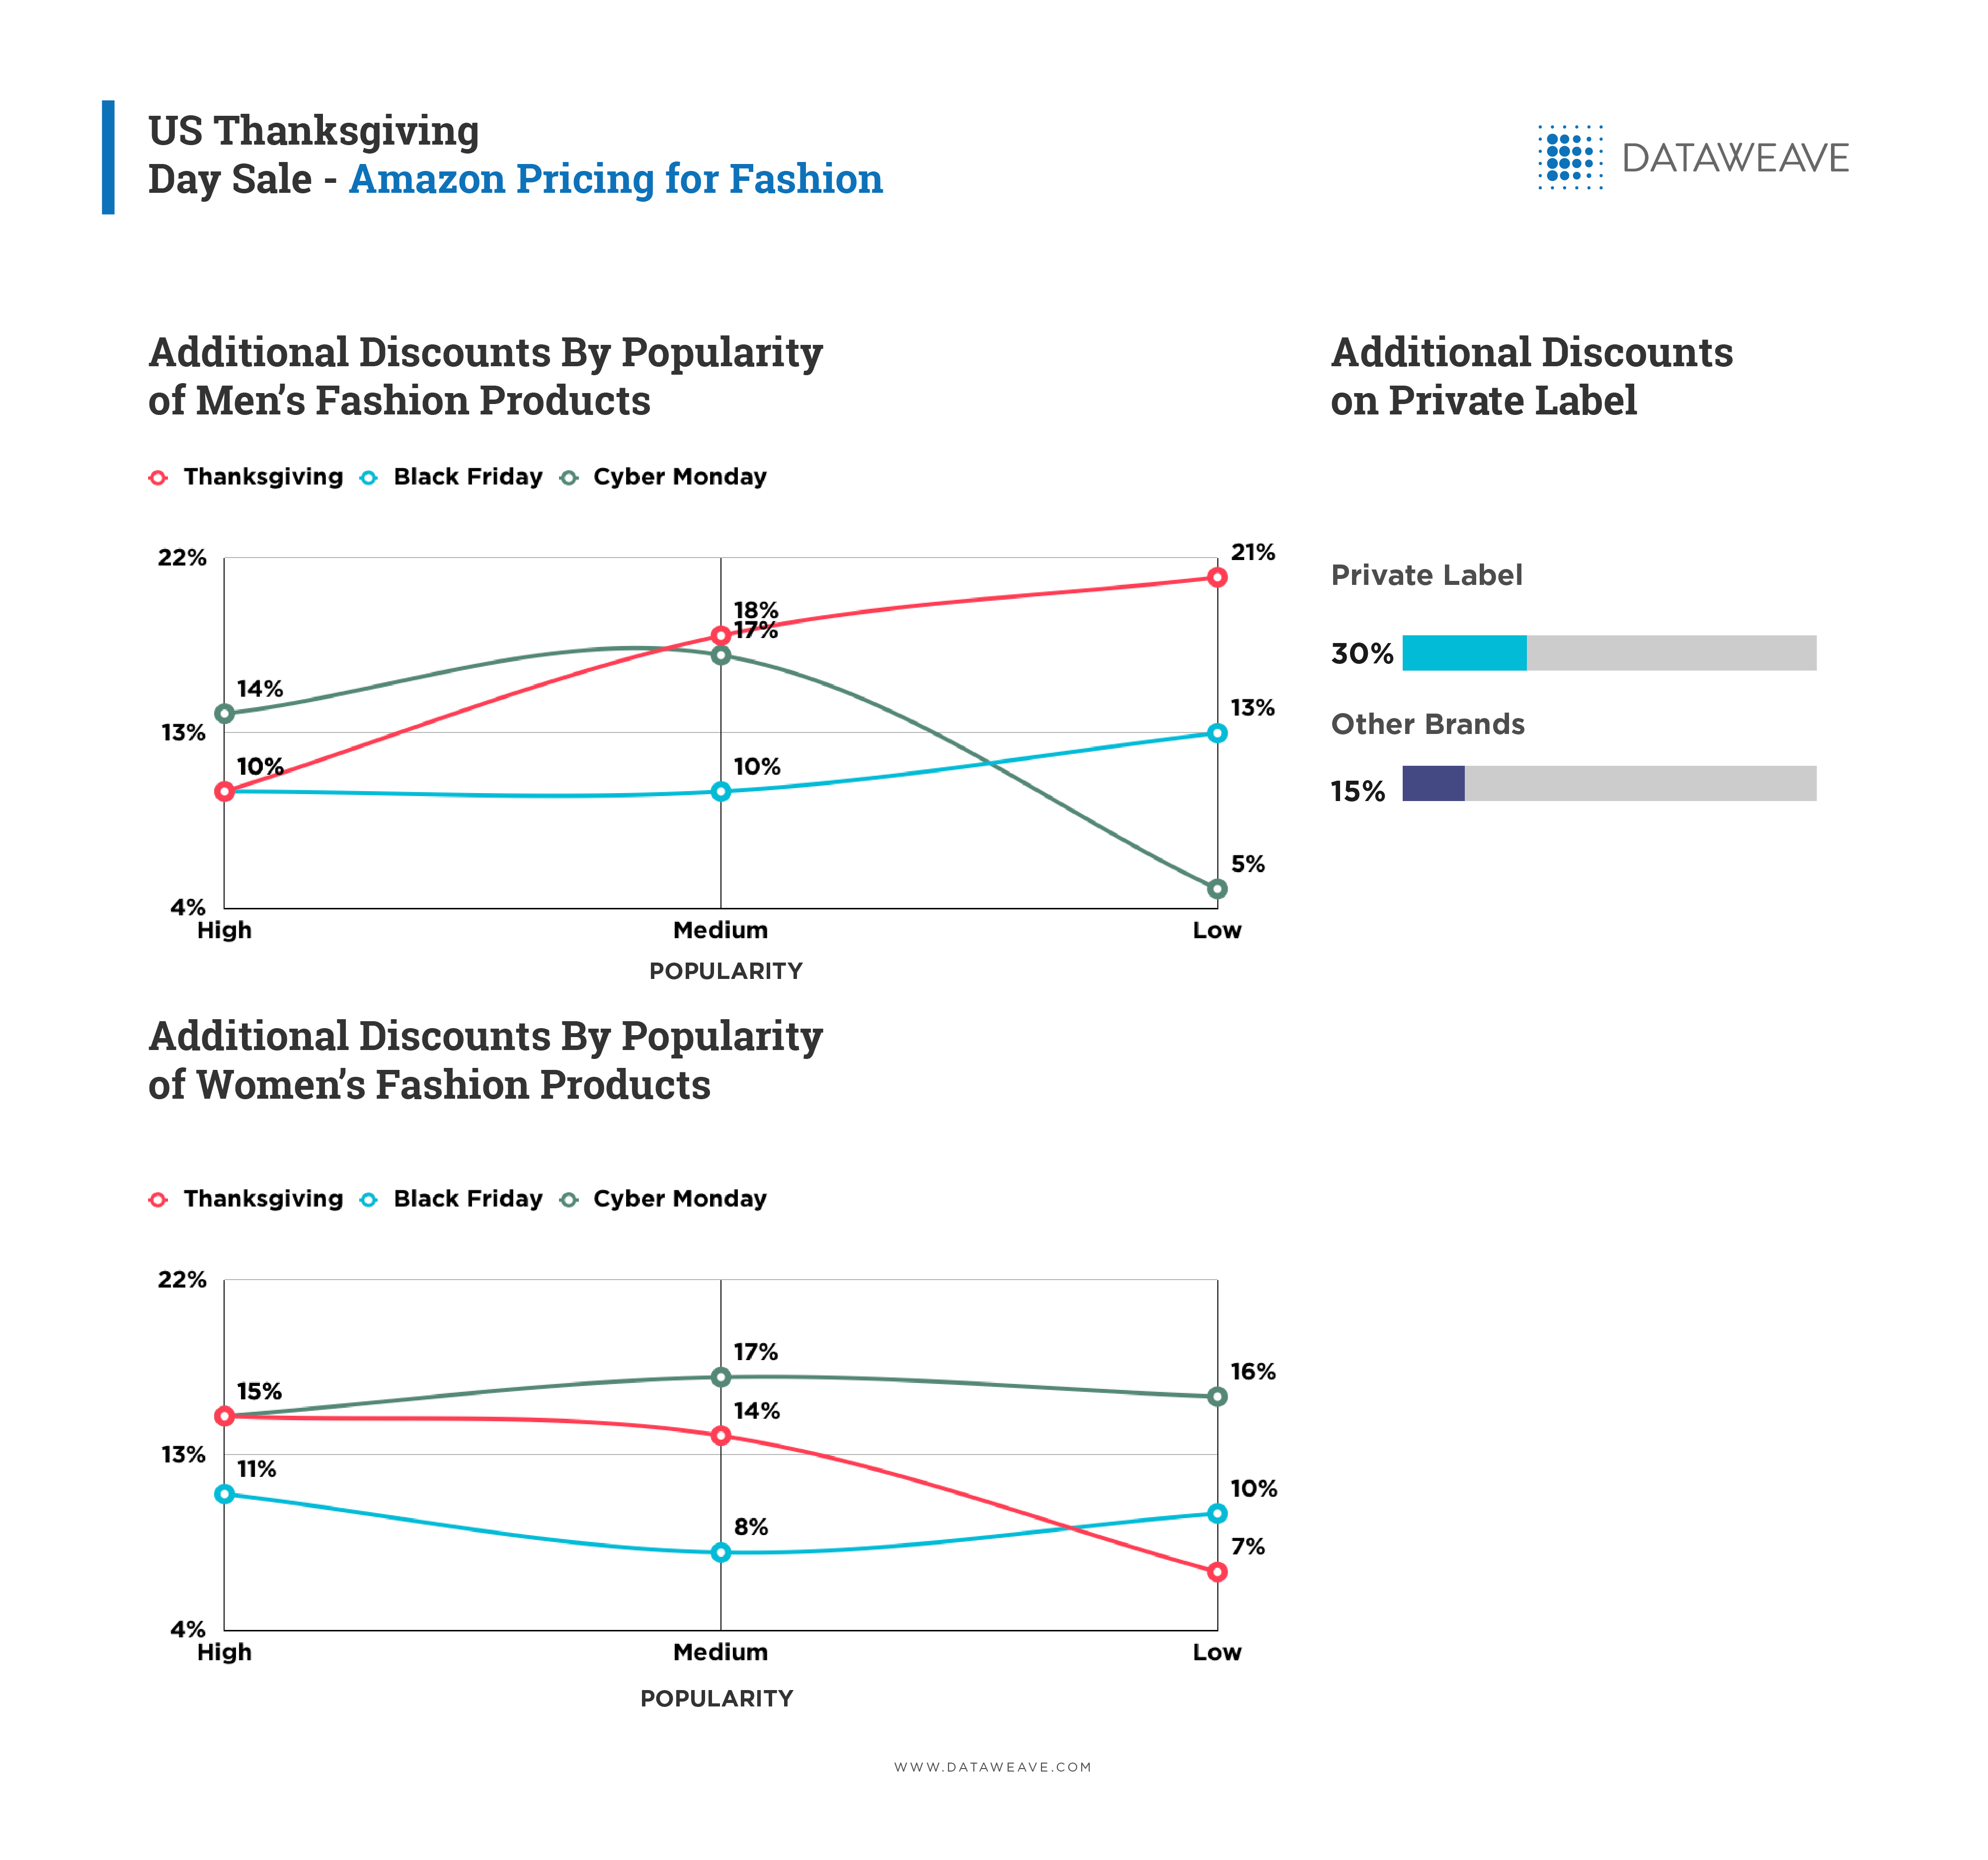
Popularity
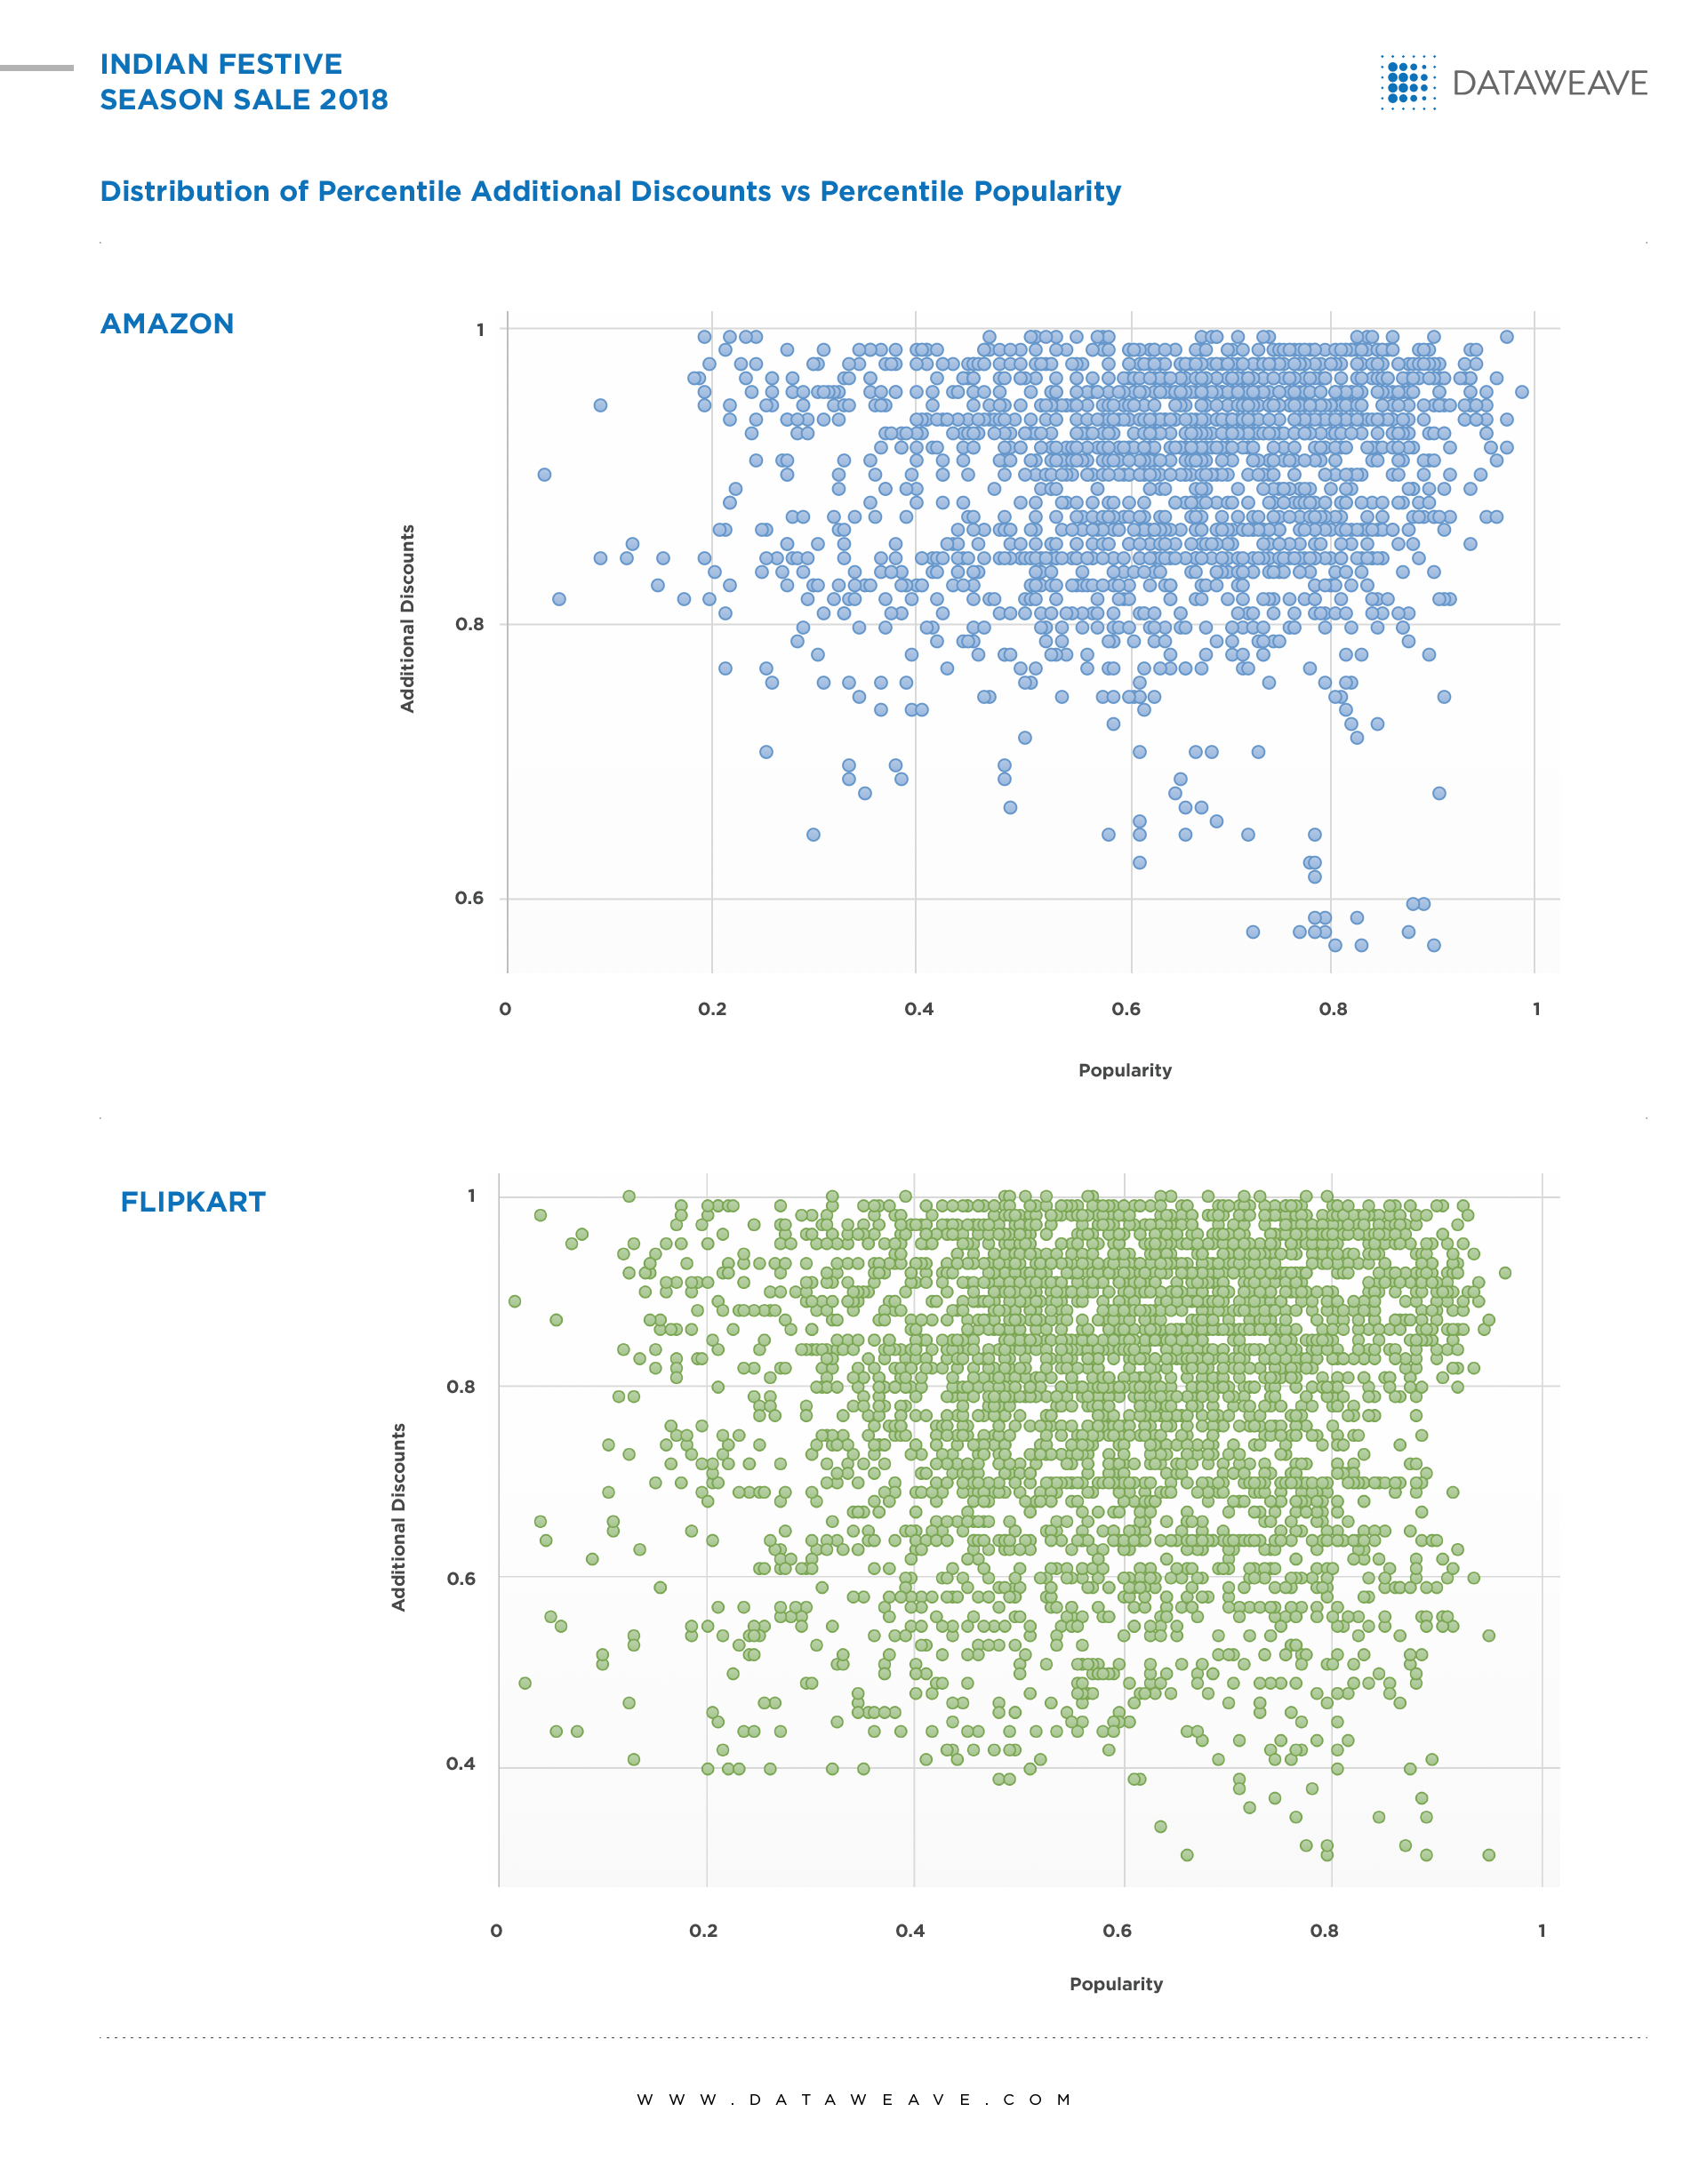
Similar to categorizing the products at levels of product premiumness, we categorized them into levels of popularity as well. Here, popularity is defined using a combination of the average review rating and number of reviews obtained for each product.
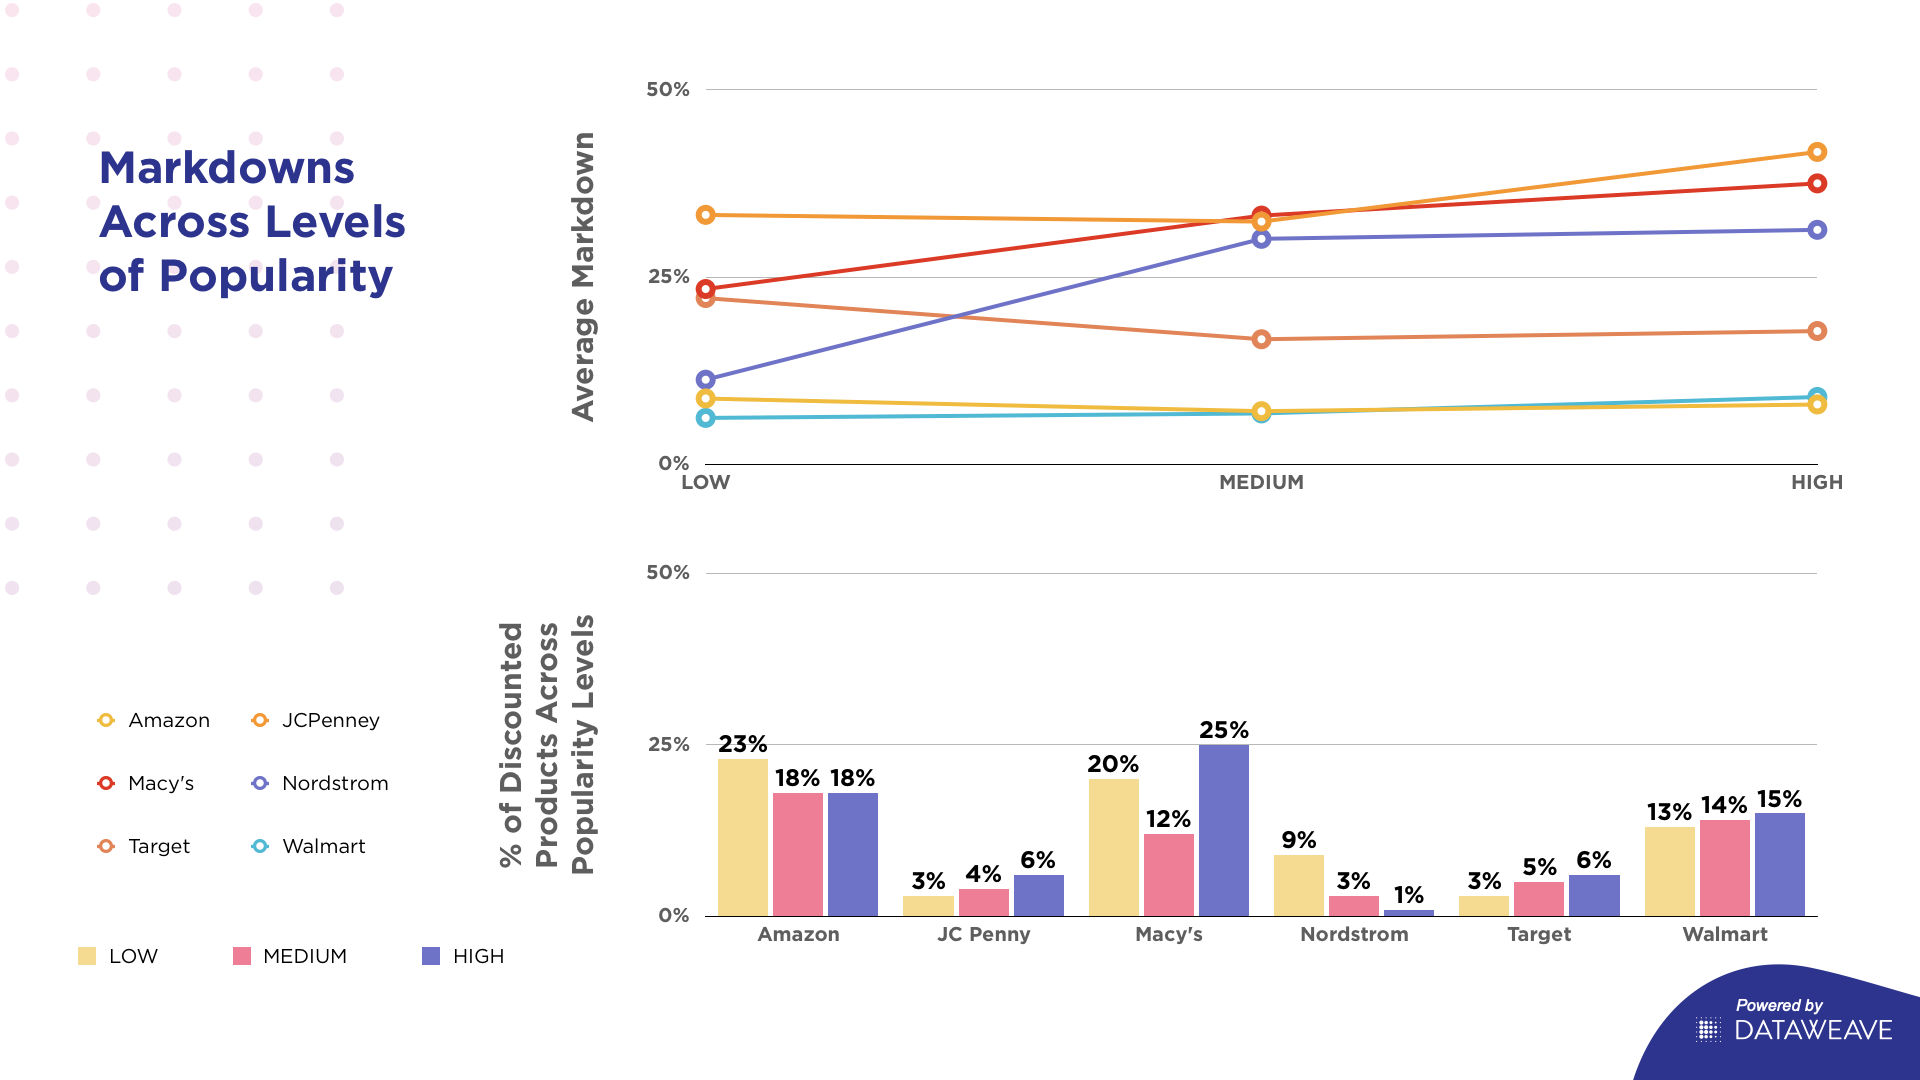
Interestingly, no consistent pattern has emerged that indicates a strategic focus on factoring product popularity into their pricing strategies for Black Friday.
Macy’s, JC Penney, and Nordstrom chose to provide higher markdowns on their highly popular products, of which only JC Penney and Macy’s chose to also markdown a higher portion of their highly popular products. It was just as common though to see retailers (including Amazon) marking down the prices of their least popular products. This is likely an attempt by the retailers to liquidate their excessive stock of less popular products during the sale.
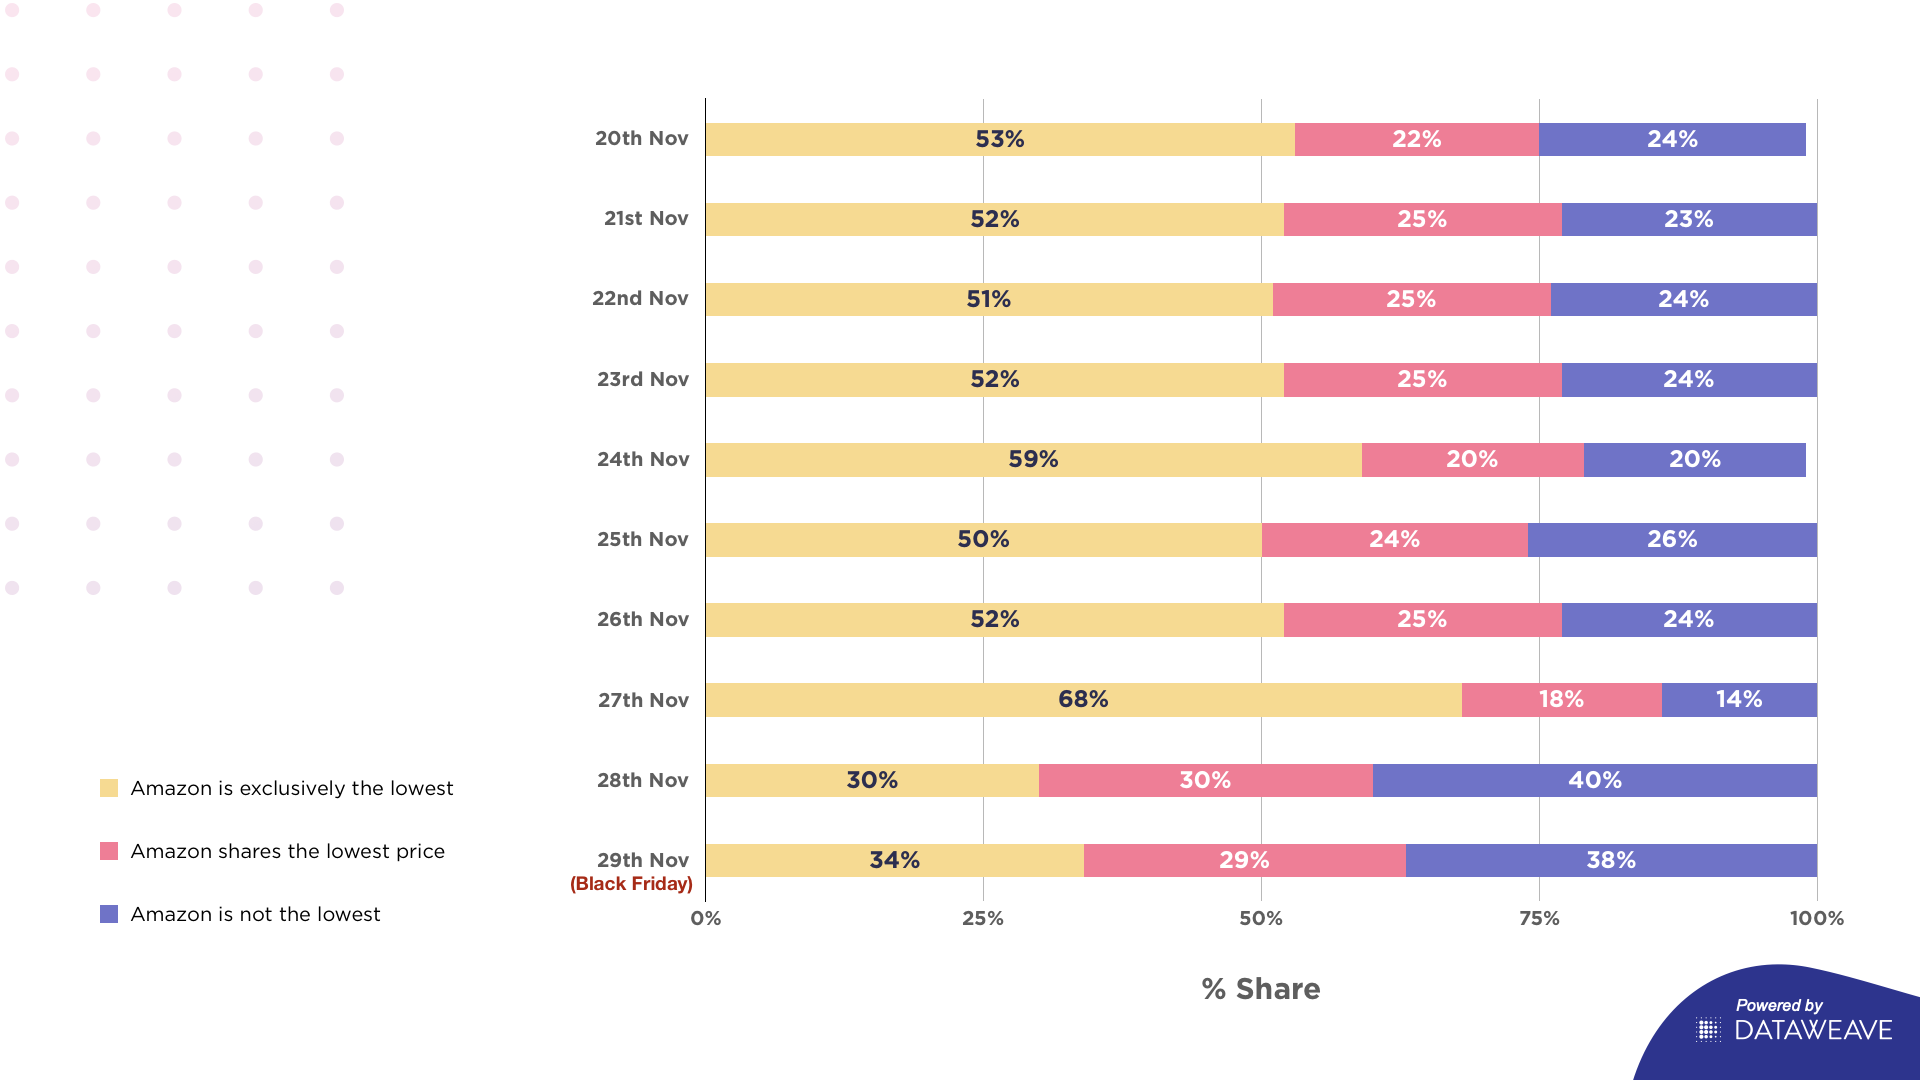
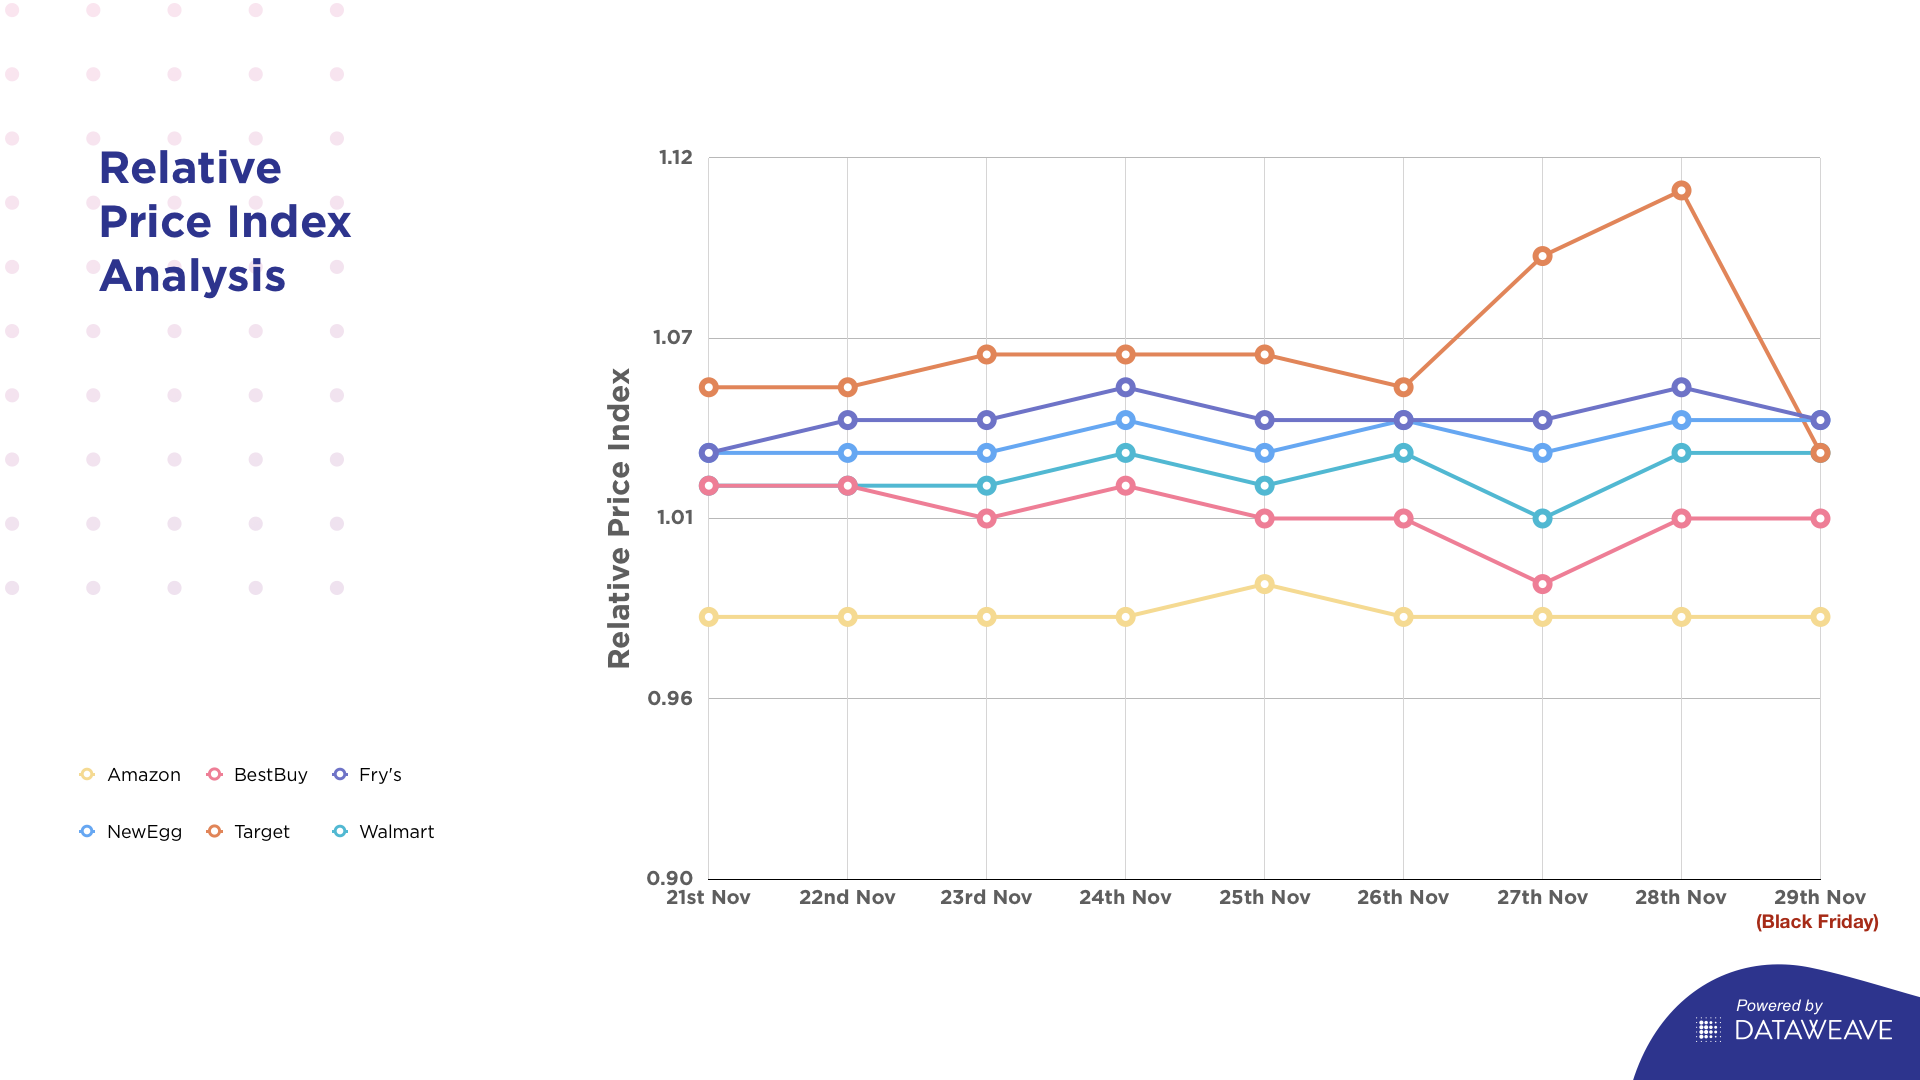
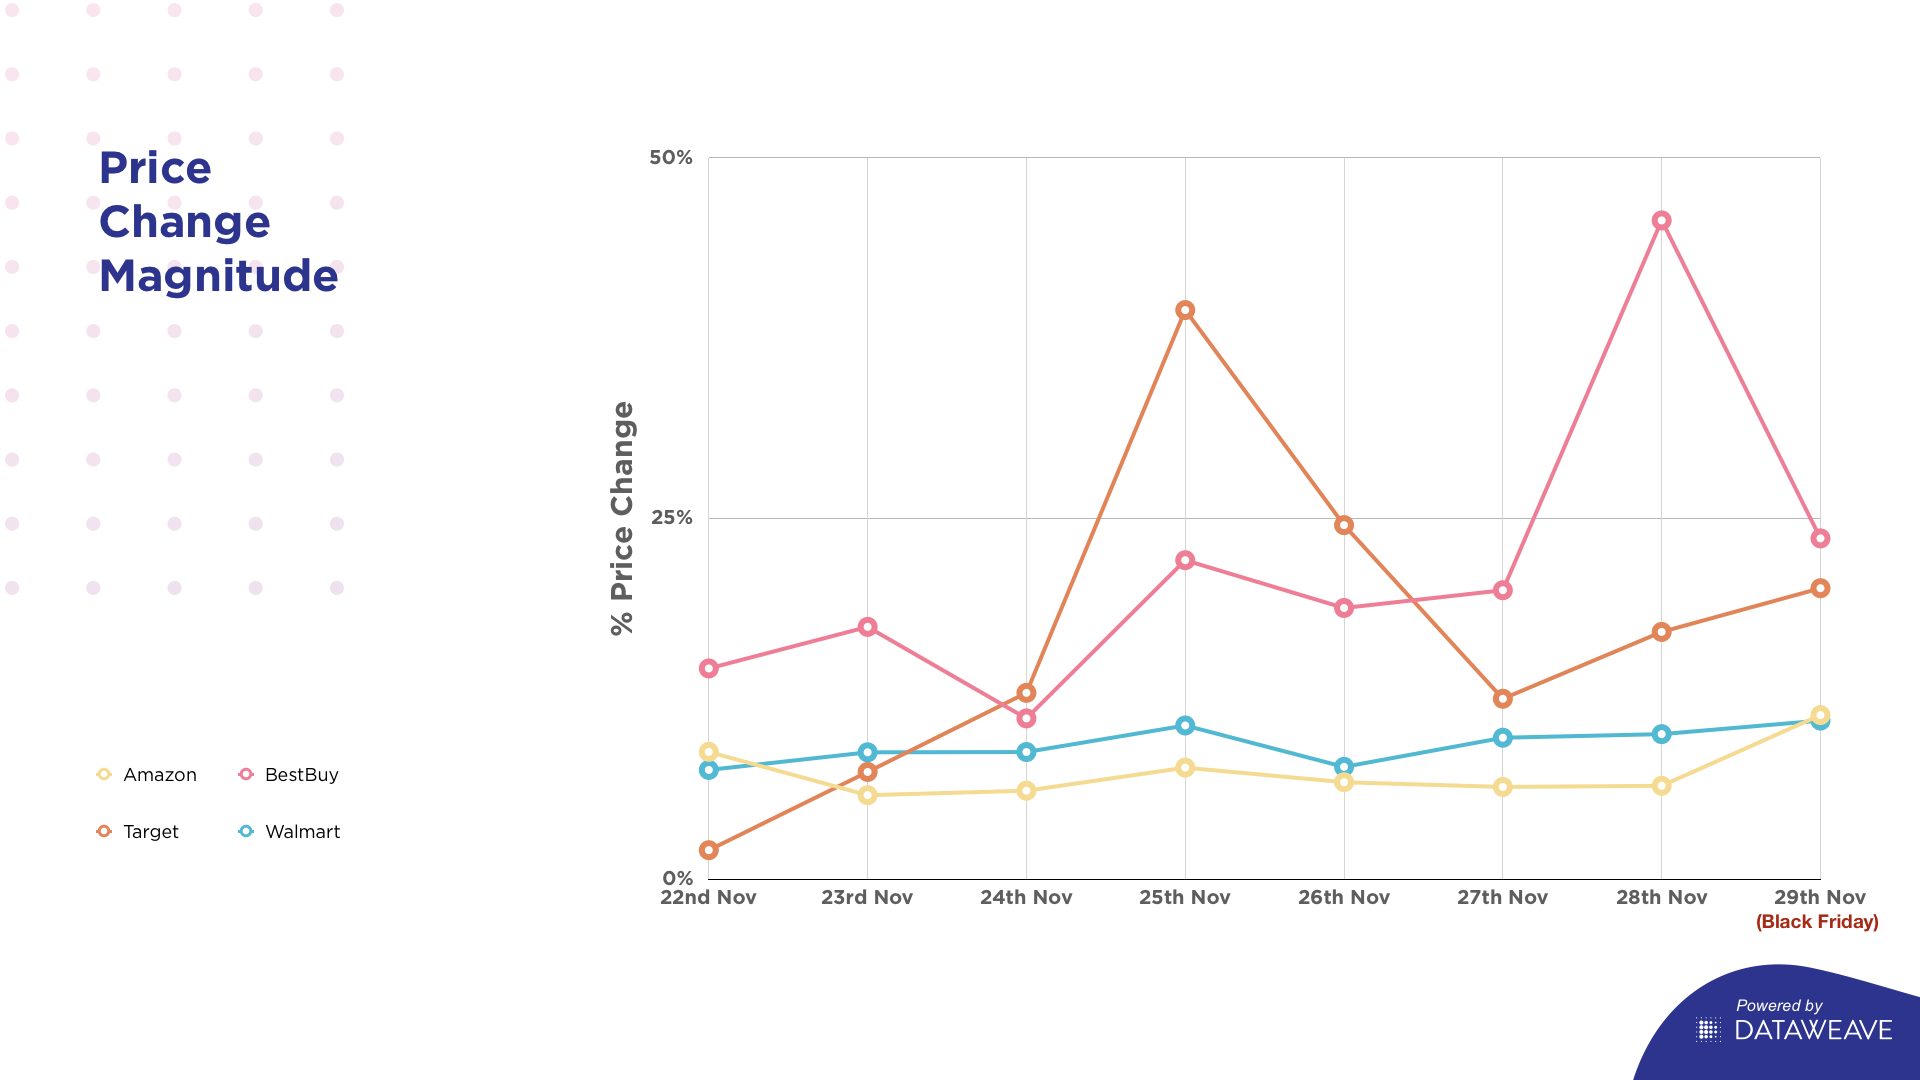
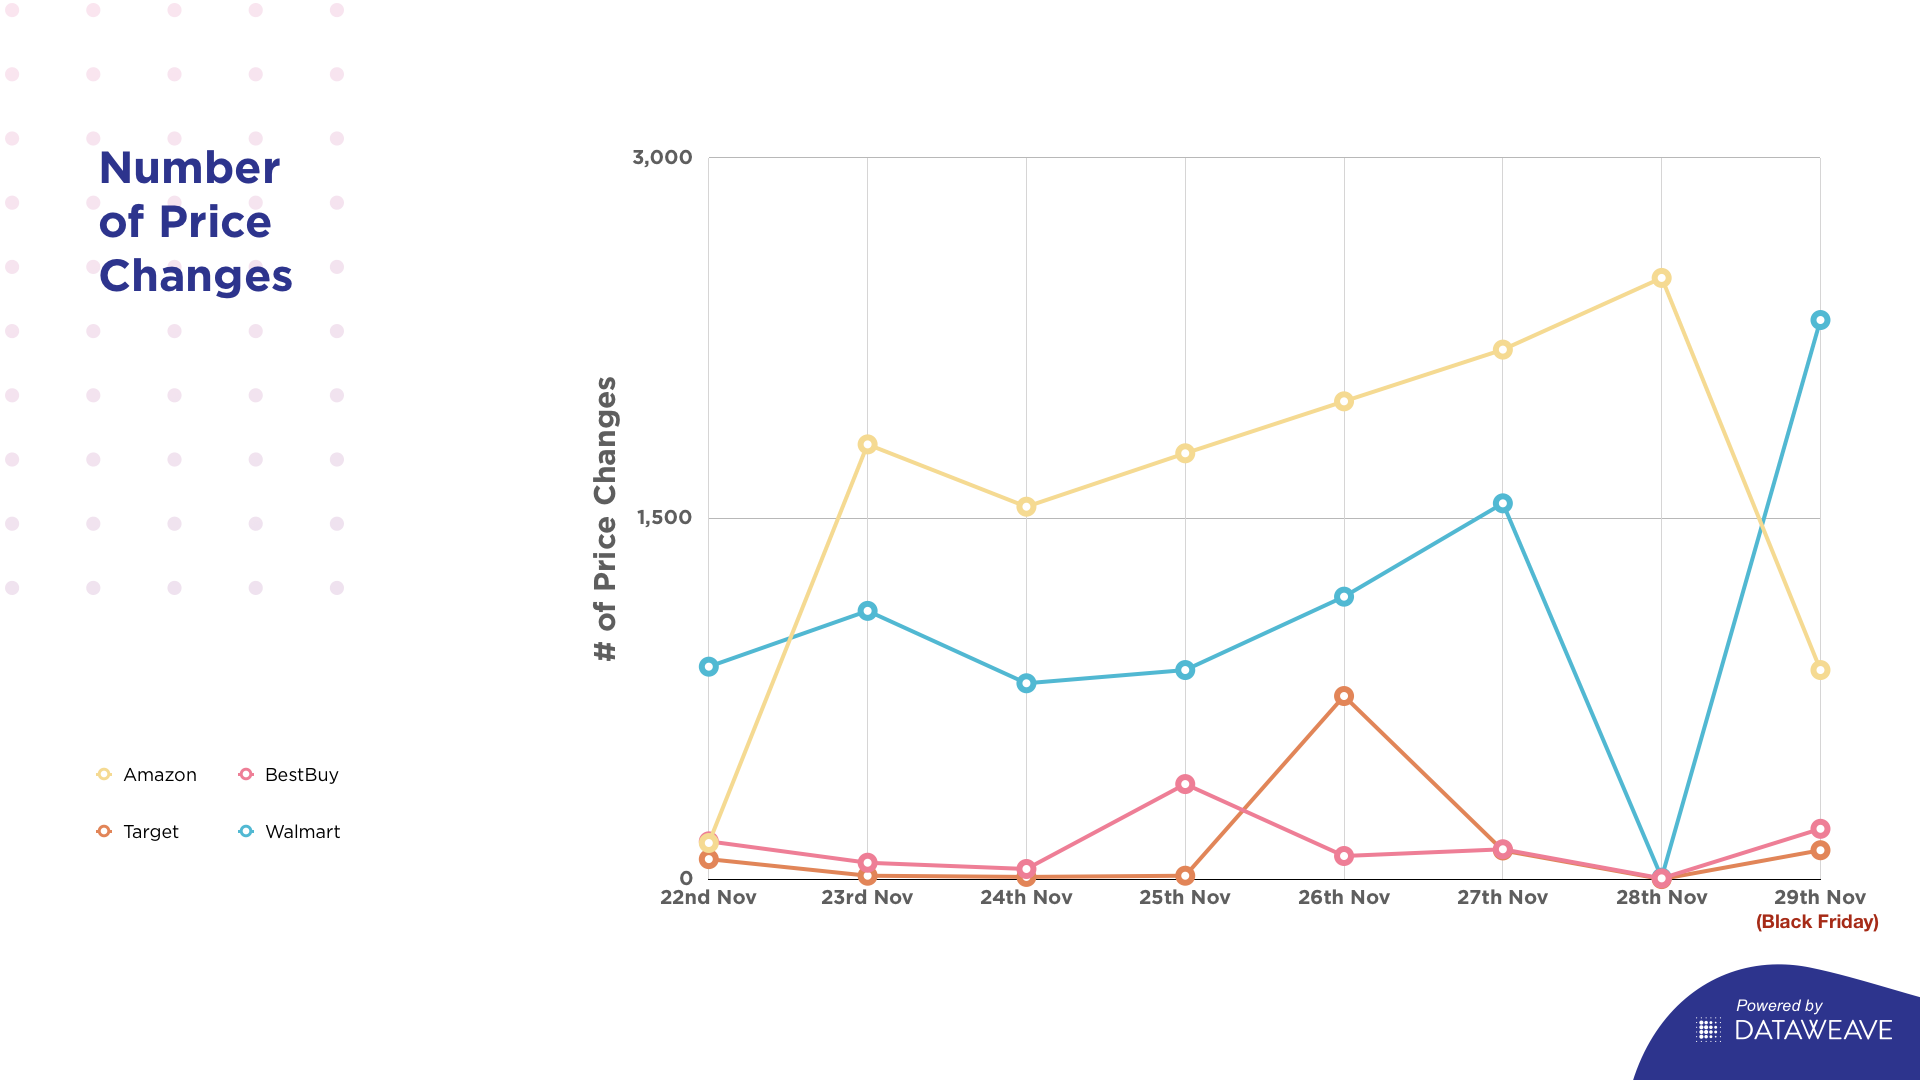
Price Change Activity
As documented quite often in recent years, the Black Friday sale is no longer limited only to a single day, but attractive offers are often seen right through November, especially over the last week of the month. We tracked the level of pricing activity across retailers over the last week of November, in terms of number of price changes as well as the average price variation for each retailer.
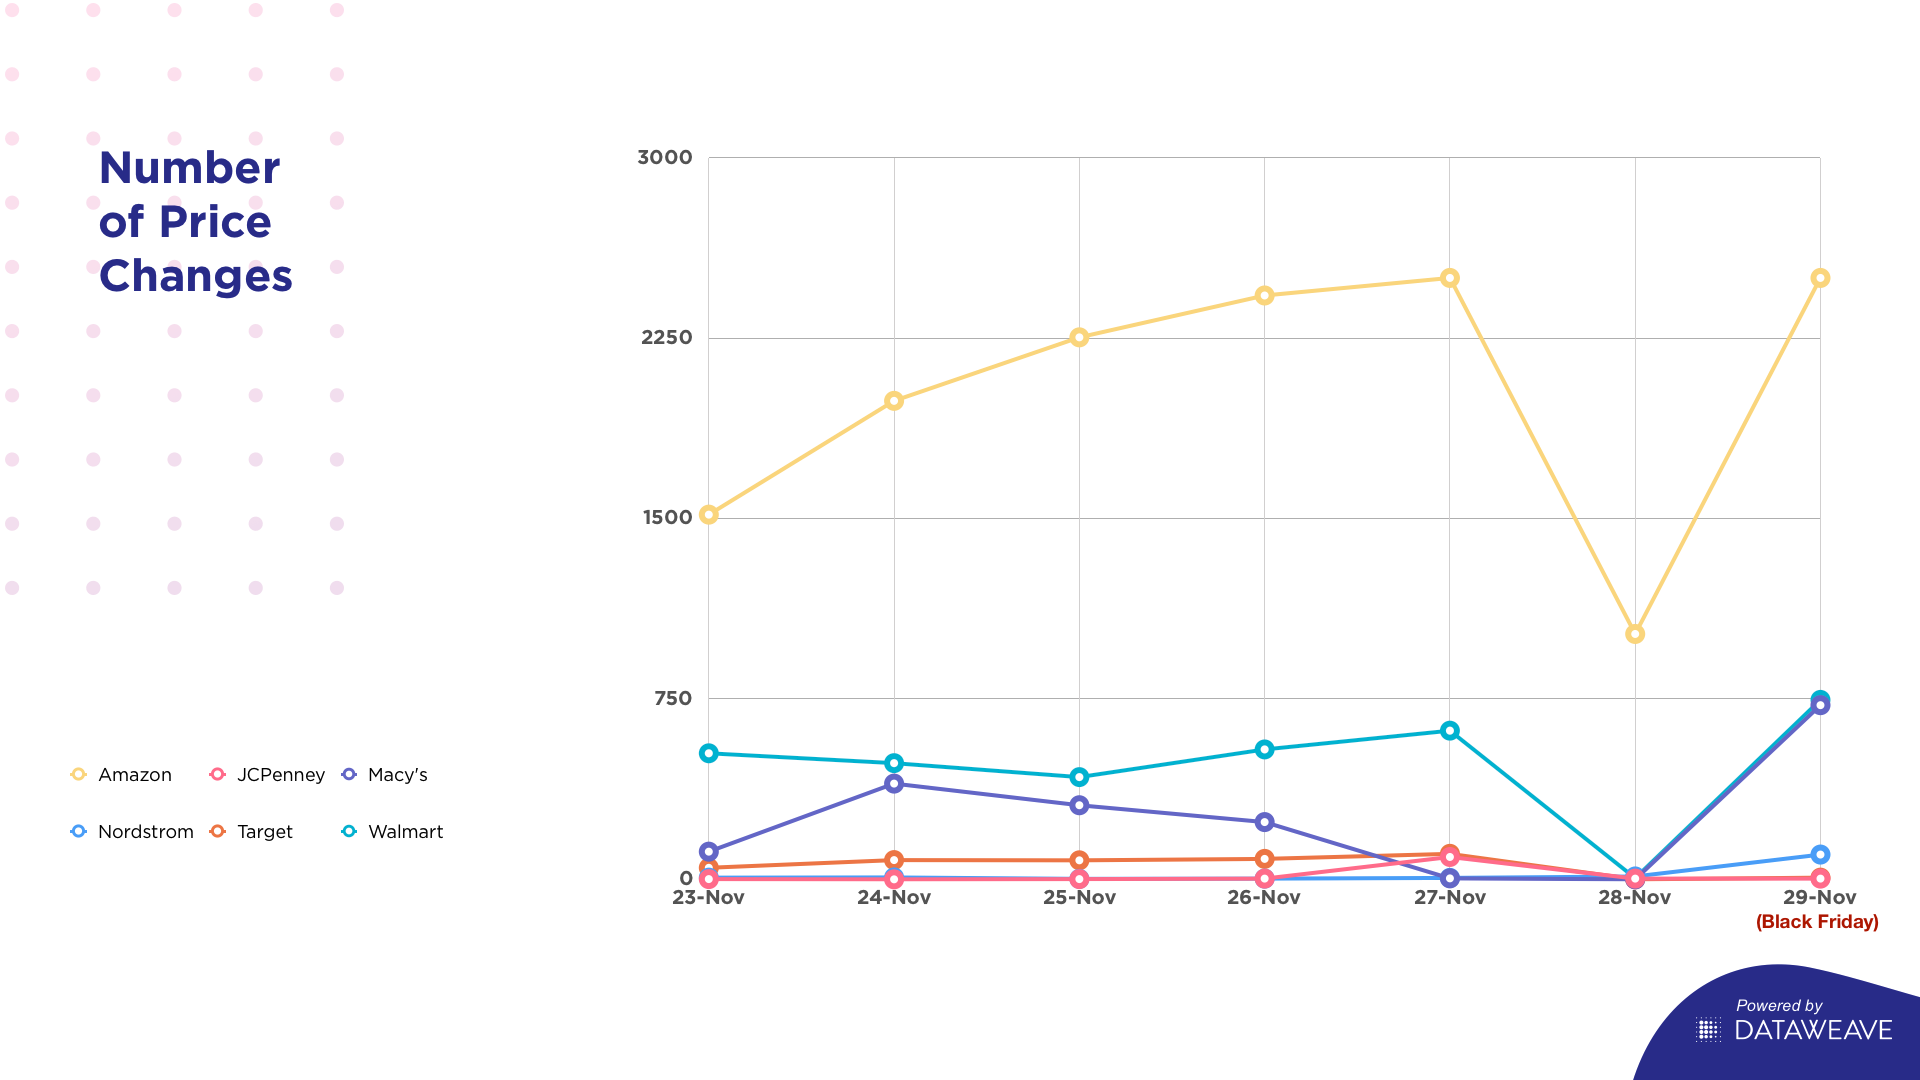
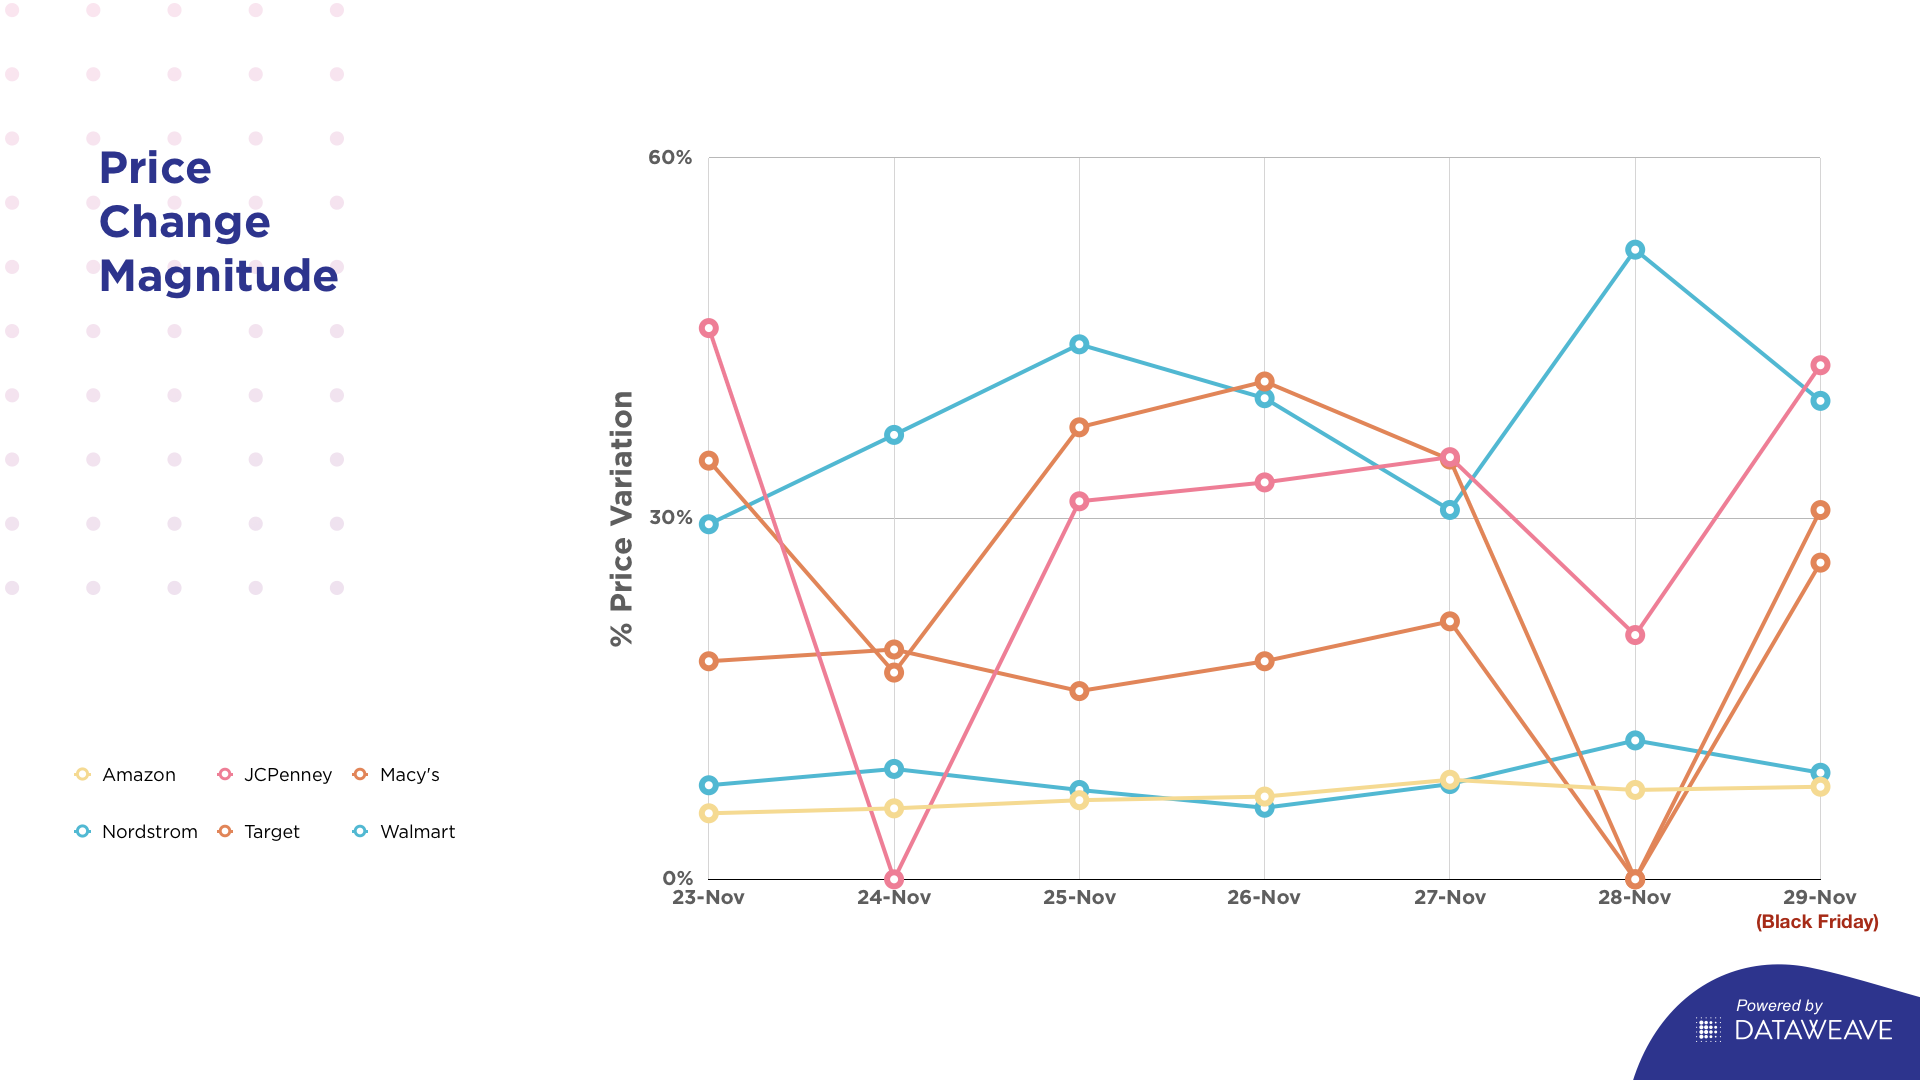
In typical fashion, we observed that Amazon had the most number of pricing changes by a large margin, peaking at 2500 for the set of products tracked. The next in line was Walmart a long way down at 618 changes on the 27th. Even after the multiple changes, their average price change variation remained at the lower end of the scale – in and around 10%.
The rest of the retailers exercised fewer price changes, with the slight exception of Macy’s in the days leading up to Black Friday. However, the changes almost ceased from the day before only to marginally rise on the 29th.
While all the retailers tended to follow a predictable pattern of decreasing variation on the 28th and sharply increasing it the next day, Nordstrom and Walmart did the exact opposite, having likely chosen to jump the gun in offering discounts during Black Friday.
Conclusion
To conclude, we deduced that Macy’s had relatively higher markdowns on more of its products than the rest. JC Penney, Nordstrom and Target offered high markdowns on the face of it but on a very small section of products. Unsurprisingly, Amazon and Walmart stayed true to their past patterns and remained conservative in their additional markdowns during the sale but generous in their reach.
Have a look here at our other observations regarding the Black Friday sale and stay tuned for more insights from our analysis of other product categories!