Author: DataWeave Marketing

  • Similarity matching keeps retailers competitive: Know your rivals

    Similarity matching keeps retailers competitive: Know your rivals

    Soaring e-commerce growth has made retail more crowded, complex and competitive. Now retailers face an urgent need to keep an eye on more rivals with potential substitute products to maximize their own e-commerce growth.

    Consider these recent figures, which illustrate online shoppers’ abundance of product choices:
     

    • 24% year-over-year increase in direct-to-consumer (DTC) brands in the U.S. alone was estimated for 2020 as more brands bypass retailers1
    • 55% of shoppers have purchased private label in the past year and many retailers are investing more in their own brands2
    • 110% average increase in small retailers’ 2020 online holiday sales, as more players launched new e-commerce shops during the pandemic3
    • 39% of U.S. consumers have changed brands, with the level of brand switching doubling in 2020 compared to 2019, especially among Gen Z and Millennial consumers, as loyalty declines4

    These statistics prove that in 2021 retailers need to navigate more online players and products. Now retailers need a new approach to stay on top of market trends to keep their e-commerce strategies competitive, profitable and attractive to discerning online shoppers. 


    Retailers reduce the risk of substitutes with similarity matching

    In response to online crowding, more leading retailers are turning to similarity matching. Similarity matching is a type of retail analytics that scour global e-commerce sites to find products that exactly match a specific item as well as products that closely match it. Similarity matching insights have grown in strategic significance because they increase retailers’ visibility into potential substitute products, so they can respond to all rivals’ moves with greater agility and efficiency to stay competitive.


    In terms of e-commerce applications, similarity matching helps retailers gather insights on potential substitute products so they can adjust their pricing and assortment strategies accordingly. Retailers can align their pricing with rivals’ pricing moves for similar items to protect their margins and maximize profitability. They can also make informed assortment decisions, including which product mix of bestsellers, unique items and private labels could optimize their online sales performance.

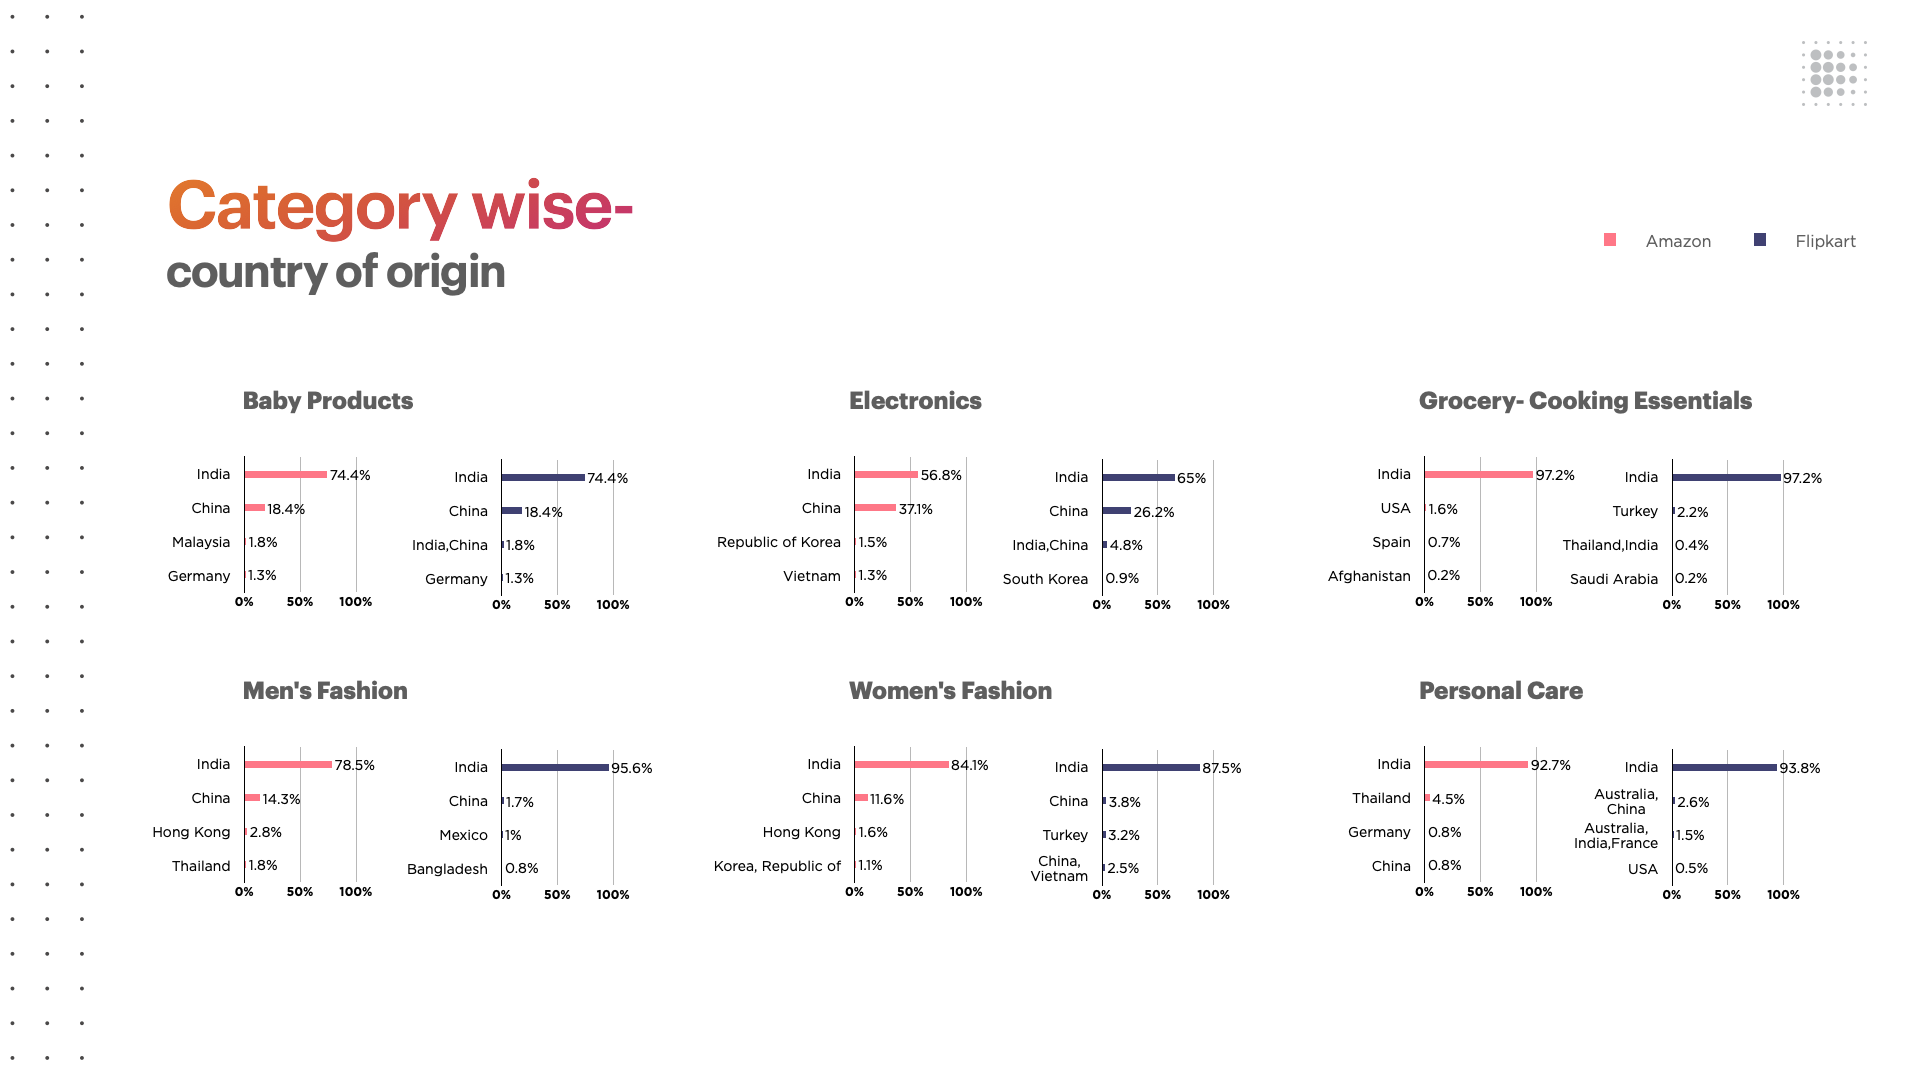
    Online shoppers search for products differently across different categories

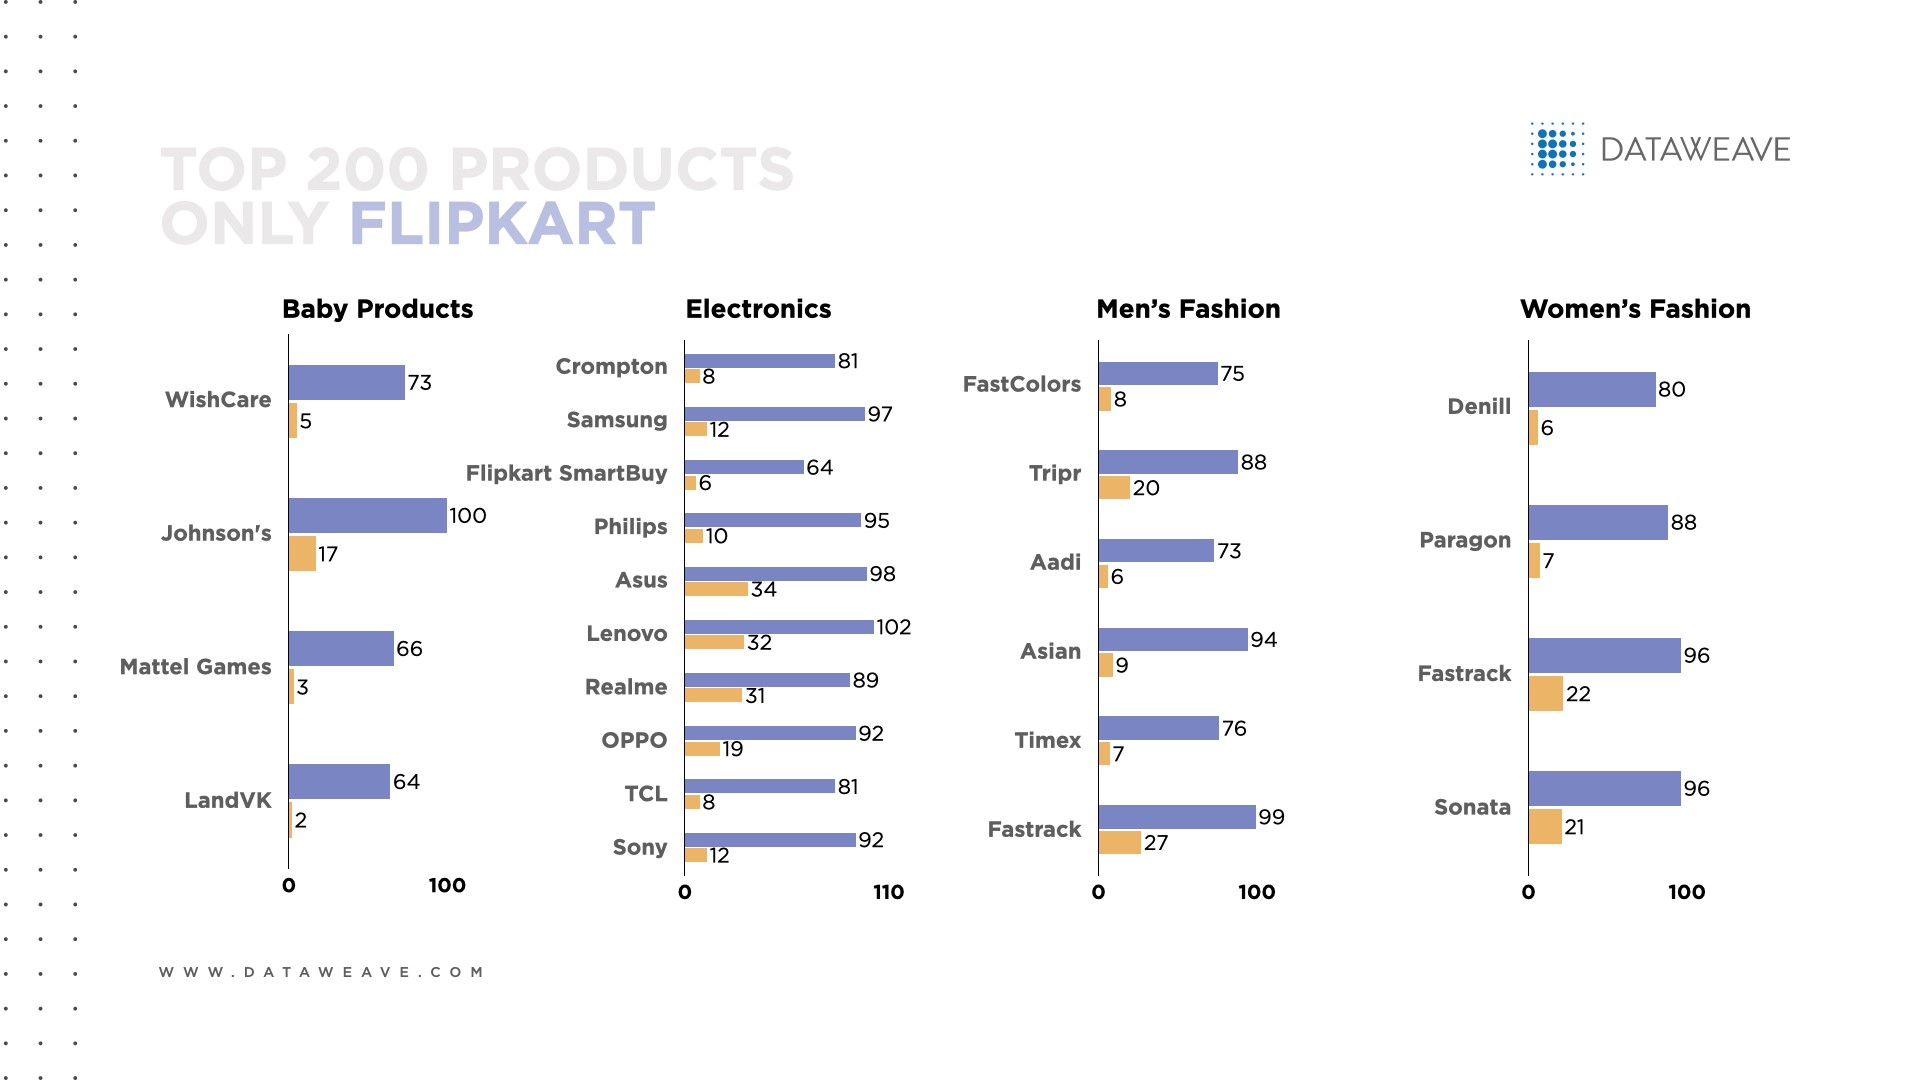
    Consumer behavior plays a role, as online search habits differ across product categories, which influences the type of similarity matching retailers need. For example, categories like fashion, toys, home and kitchen work best with similarity matching based on text and images. In these highly-visual categories, consumers can quickly determine whether a product fits the design and aesthetic they are looking for. As a result, e-commerce product titles, descriptions and product images play a big role in consumers’ purchase decisions.

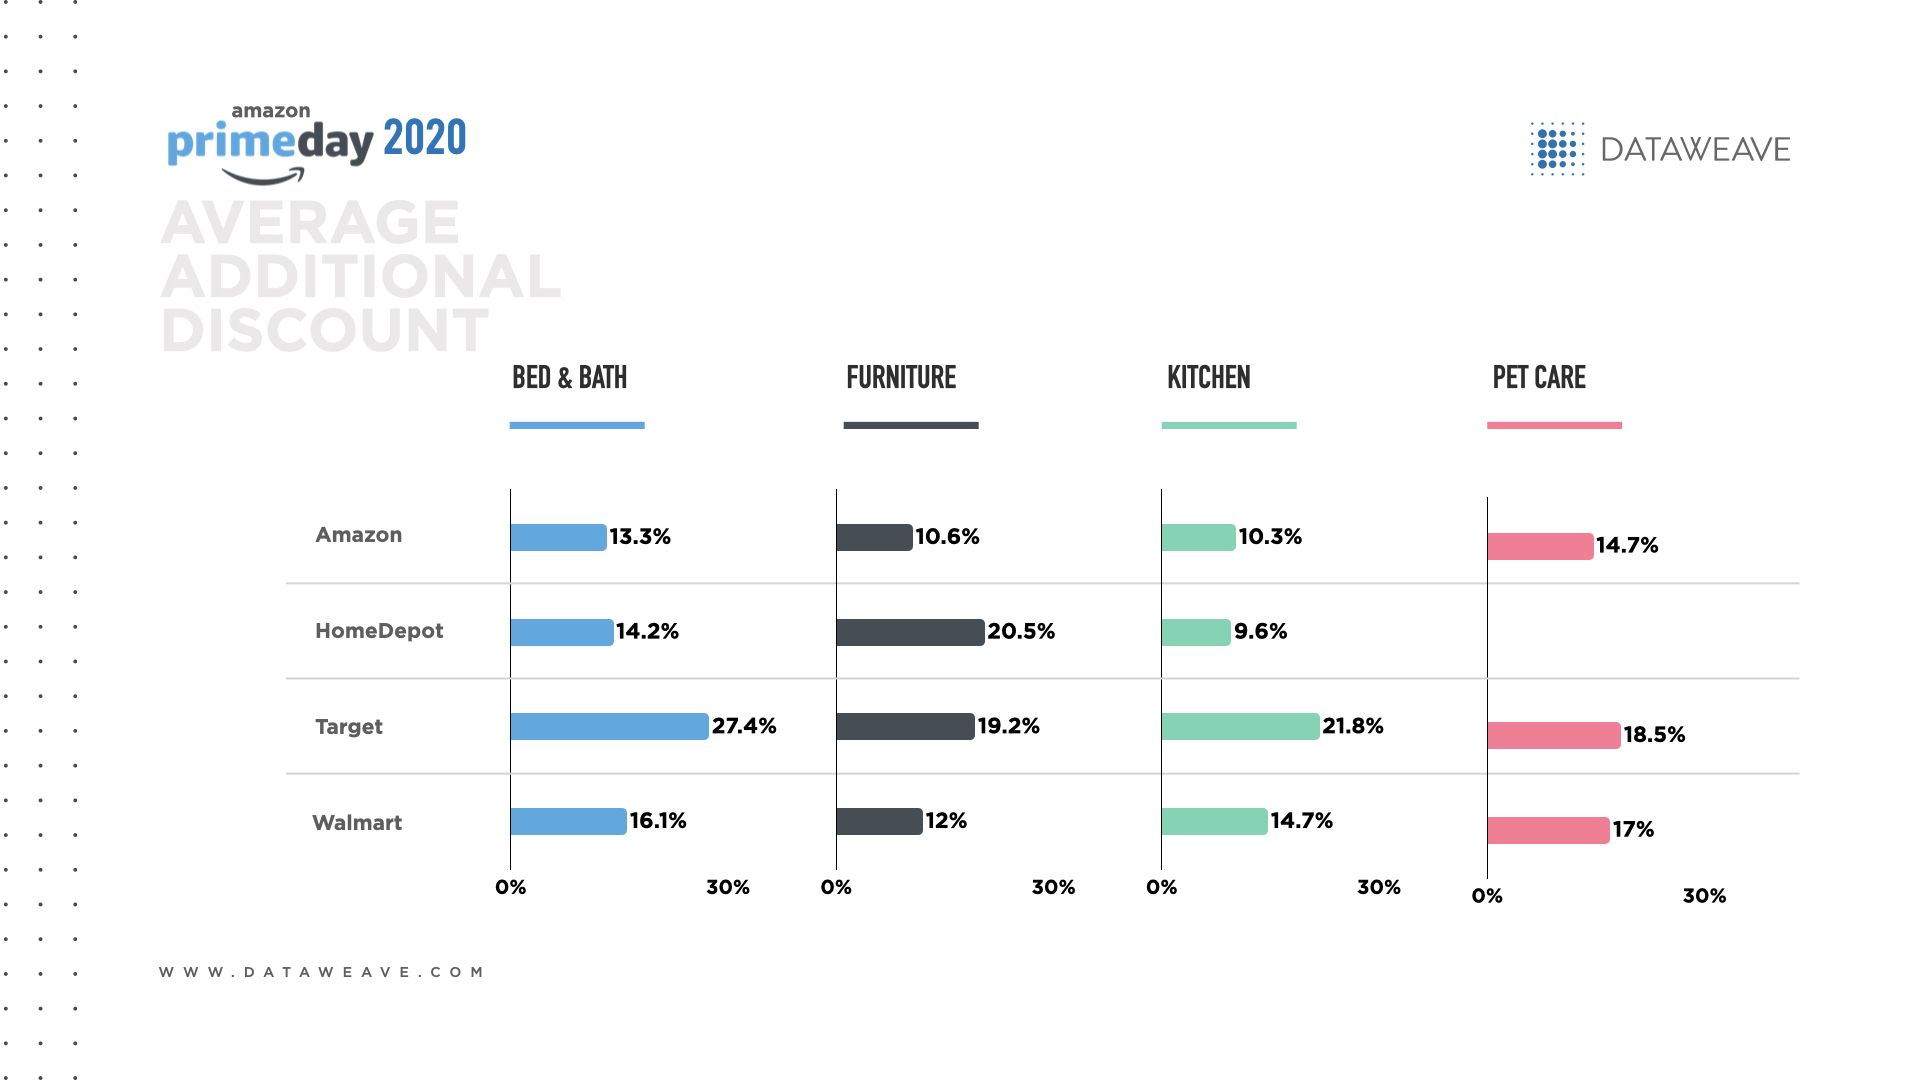
    By contrast, consumer electronics and furniture are categories in which consumers tend to seek specific product attributes, such as a certain level of resolution for their high-definition TV or a couch with particular dimensions so it fits their living room. For these types of products, consumer purchases are driven by product specifications, so similarity matching takes into account their specific needs as well as a degree of tolerance for exact or near-similar attributes across online competitors.

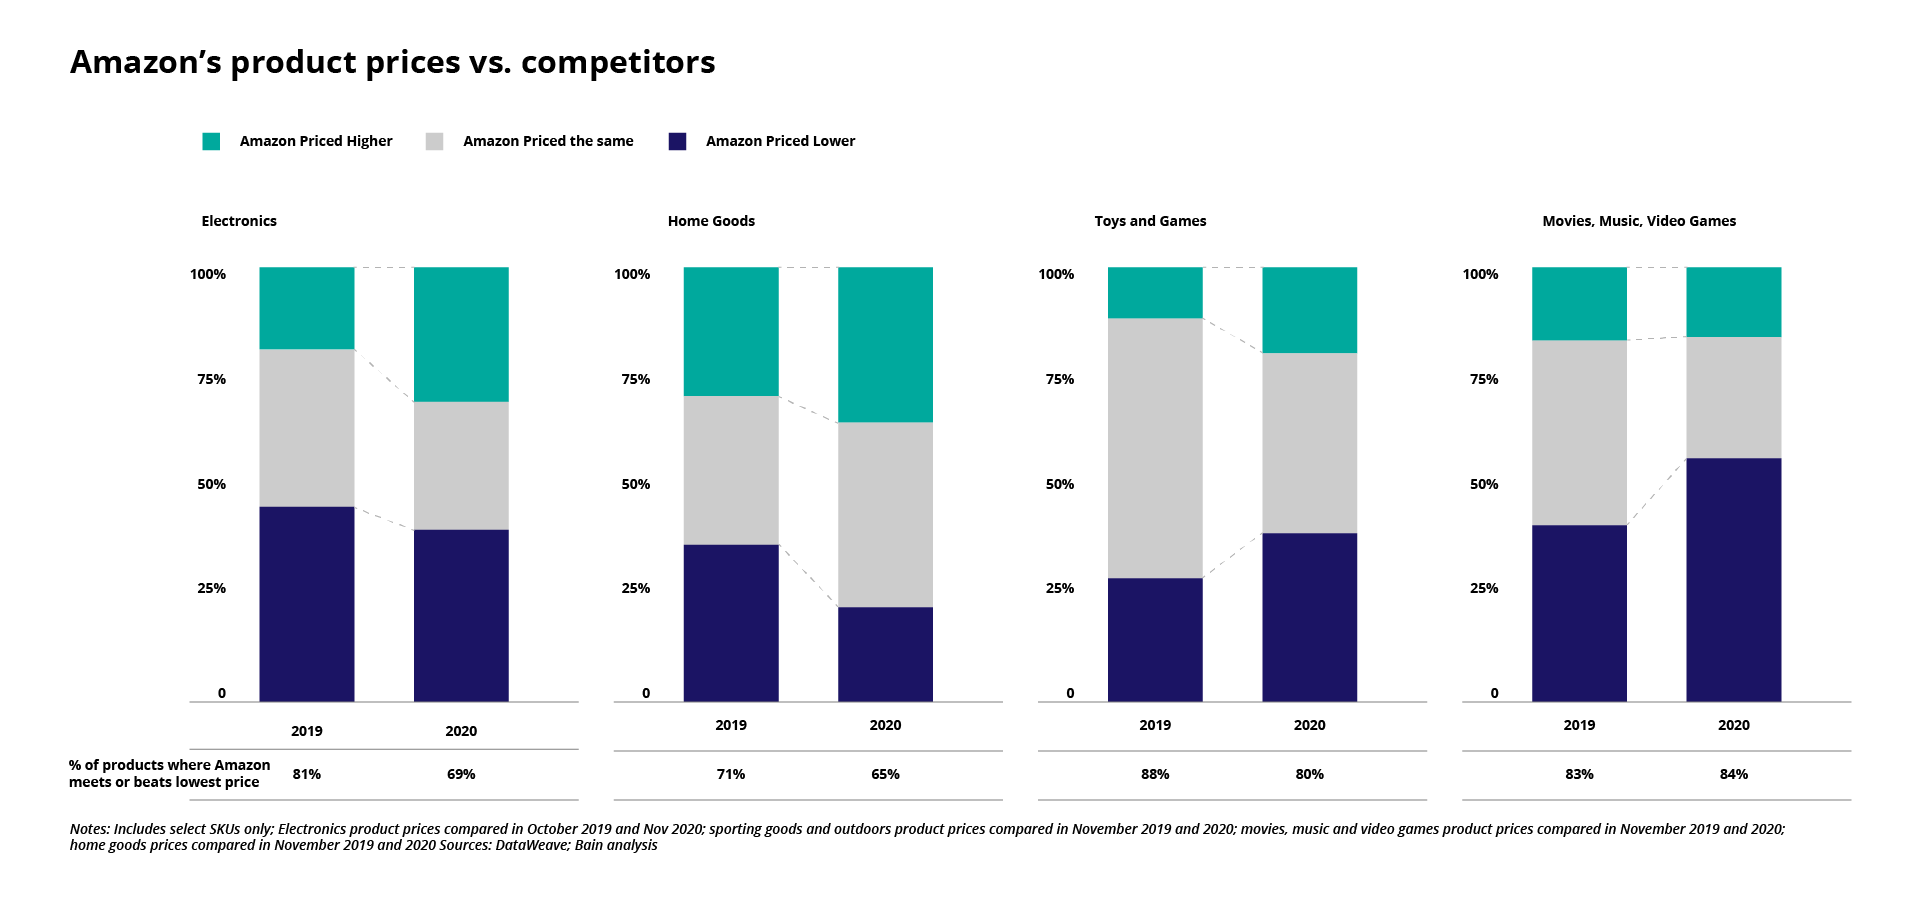
    Expect intense e-commerce rivalry in 2021

    As more consumers shop online, they are increasingly informed by online product comparison information. A wide variety of product choices means consumers can substitute similar goods with ease, especially if a particular item is out-of-stock. Perceived product differentiation, price sensitivity and private labels can also influence consumers’ purchase decisions.

    Across categories, e-commerce growth is outpacing total retail growth. When competition is this fierce, there is an increased risk that numerous and aggressive players will drive down profit margins. Leading retailers are now seizing opportunities to earn consumer loyalty. Using similarity matching helps retailers by offering in-demand products that consumers will actually buy and deliver exceptional online experiences to prevent shoppers from switching to rivals and their comparable products.

    Similarity matching lets you stay competitive

    As e-commerce traffic and rivalry increase, similarity matching helps retailers stand out and serve online shoppers more effectively.

    Retailers gain visibility into their entire competitive landscape to keep their e-commerce strategy responsive to shifts among consumers and rivals. By knowing the full scope of potential substitute products available online, retailers can keep their pricing and assortment strategies in line with rivals’ to reduce their risk of losing sales to rivals, and boost their top line, profitability and cost savings.

    The data insights give retailers the flexibility they need to align with online shoppers’ different needs across categories. As a result, retailers can use similarity matching to boost agility and gain a competitive advantage by adapting to online shoppers’ needs, winning their sales and fueling e-commerce growth.DataWeave’s similarity matching capability lets clients


    1 US Direct-to-Consumer Ecommerce Sales Will Rise to Nearly $18 Billion in 2020. eMarketer. April 2, 2020.

    2 Ochwat, Dan. Shopper study: Private brands purchased because they’re preferred. Store Brands. February 24, 2021
    3 Miranda, Leticia. Small businesses who pivoted to e-commerce saw record sales during Black Friday weekend. December 1, 2020.
    4 Charm, Tamara, Harrison Gillis, Anne Grimmelt, Grace Hua, Kelsey Robinson and Ramiro Sanchez Caballero. Survey: US consumer sentiment during the coronavirus crisis. McKinsey & Company. March 24, 2021.

  • How Brands Make Their Marketing Magnetic

    How Brands Make Their Marketing Magnetic

    E-commerce is getting crowded.

    The proliferation of informed shoppers, e-commerce sites, and competitors of all sizes has increased the complexity of – and lucrative opportunities in – brand management.

    Now more brands rely on data insights to uncover specific ways to make their digital marketing more arresting, effective and profitable. Many brands struggle with e-commerce profitability due, in part, to advertising expenses that often yield lackluster results.1

    Analytics are growing in retail significance, as 88% of retail and consumer goods marketers say data improves their marketing by allowing them to personalize touchpoints. Relevant marketing and great marketers helps brands connect with consumers. Let’s see why leading brands are adding data insights to their 2021 marketing strategies to fuel online sales growth.

    Brands discover how to get discovered

    Consumer goods brands no longer leave it up to chance that consumers will find them online. The digital migration of companies and consumers over the past year means more noise for brands to breakthrough.

    Now search is growing in importance to improve brands’ online product discovery. Here’s why:

    • 87% of shoppers begin their hunt in digital channels3
    • 17% rise in paid search in late 20204
    • 24% rise in paid social advertising during the same period5

    To grab consumers’ attention by being easier to see, more brands are turning to data insights to track their online visibility.

    Brands need to look for ways to mitigate the high costs of acquiring customers online6

    Brands use marketing analytics related to keywords and navigation searches help brands know exactly how much space on the digital shelf they occupy across different online platforms.

    These DataWeave’s Share of Search solutions help brands understand what percentage of the digital shelf they command through either keywords or navigation. These insights can help brands decide whether to boost their brand visibility using sponsored ads to ensure their products show up more prominently in online search results to boost brand reach and awareness on each channel. For instance, brands can tell whether consumers search for products using branded, generic or category-specific keywords to align their marketing accordingly.

    In addition, brands can see how their organic and sponsored results rank compared to their competitors to spot ways to improve their visibility rank and decrease customer acquisition costs.

    Content differentiates a brand’s digital shelf

    For a striking digital presence and enhanced discoverability, leading brands measure how effectively their content inspires online shoppers to choose them.

    Brands can improve their digital marketing results by using Content Audit insights to spot patterns among their top-performing campaigns. They can also benchmark their content with category bestsellers to discover how to optimize their online performance to grow sales volume and market share.


    Strategic advertising requires high-quality photography and data-driven content7

    Using these data insights from DataWeave helps brands determine how well their content (including product description pages and images) align with e-commerce algorithms and lead to online traffic, engagement and sales. Brands also adapt faster by adjusting underperforming campaigns to reduce costs and optimize their digital marketing spends.

    Brands can fill content gaps across online channels with enhanced product information that aligns content and images with brands’ product information management (PIM). Using analytics to deliver a consistent brand experience across all online channels can help brands build relationships with consumers and earn their trust.


    Alluring promotions help brands secure the sale

    As e-commerce evolves, brands have matured beyond Google AdWords and Facebook campaigns to offer targeted promotions across digital touchpoints, which increases marketing reach and complexity.

    To boost clarity, be in demand and drive sales across online platforms, more leading brands use data insights to measure the effectiveness of their digital Promotions. Promotional insights from DataWeave keep brands informed of trending categories and products to keep their online offerings relevant and timely. Brands can pinpoint exactly which products to promote and which e-commerce sites help them drive the most profitable results with compelling digital offers.

    Brands that respond quickly to their customers’ needs have the upper hand8

    Analytics also keep brands competitive and relevant by benchmarking their promotional strategies with their rivals’ and continuously monitoring rivals’ online moves. For instance, brands can track the promotions their competitors offer for similar products across different e-commerce sites. These competitive insights help brands quickly spot opportunities to optimize their online conversions with appealing promotions that reflect market trends.

    Better marketing decisions can help brands grow sales and share

    Data insights make brands more enticing by connecting the dots among their online visibility, content and promotions. Brands uncover ways to make smarter marketing decisions faster to improve their top line and decrease customer acquisition costs. DataWeave analytics also help brands stand out and improve product discovery, engagement and sales. As a result, brands save time and boost their agility with relevant marketing that resonates and inspires shoppers to keep coming back.


    1 Jansen, Caroline, Cara Salpini and Maria Monteros. 8 DTC trends to watch in 2021. Retail Dive. February 3, 2021
    2 Casna, Kathryn. Ecommerce Trends That Are Shaping the Way Businesses Sell Online. Salesforce. 2021.
    3 Casna, Kathryn. Ecommerce Trends That Are Shaping the Way Businesses Sell Online. Salesforce. 2021.
    4 The Future of eCommerce in 2021. Shopify Plus. 2021.
    5 The Future of eCommerce in 2021. Shopify Plus. 2021.
    6 Jansen, Caroline, Cara Salpini and Maria Monteros. 8 DTC trends to watch in 2021. Retail Dive. February 3, 2021.
    7 Glasheen, Jasmine. 2021 Forecast: Next Gens in a Brand-New World. The Robin Report. January 3, 2021.
    8 Monteros, Maria. Forrester: Few brands can anticipate and act on consumer needs. Retail Dive. February 10, 2021.

  • How Brands Boost Their E-Commerce Profitability

    How Brands Boost Their E-Commerce Profitability

    Brands that protect their bottom line will win online.

    As global e-commerce smashes sales records, more brands are now taking control over their online presence (“digital shelf”) to enhance their performance and profit margins.

    In the U.S., the increase in e-commerce penetration during the first half of 2020 was equivalent to that of the last decade.1 Last year also marked the first time in history that all retail sales gains came from e-commerce.2 E-commerce has lasting appeal, as two-thirds of consumers plan to continue to shop online after the pandemic.3

    “Brands need to continue to look for ways to
    mitigate the high costs of acquiring customers online.”
    4

    To keep up as shopping migrates online, brands face bigger expenditures. In the second quarter of 2020, e-commerce costs grew much faster (up 60% year-over-year) than revenues (up 40%).5 Namely, brands face steep costs for customer acquisition and logistics, which erode their online profit margins.

    The bottom line for brands is they must sell online – profitably – to stay competitive. They urgently need new ways to drive online sales and incur fewer costs. Let’s see why brand leaders are using data insights to optimize their e-commerce decisions and profitability.

    Brands find new growth opportunities

    Over the past year, e-commerce has gotten more crowded. Now brands seek proven ways to differentiate their offerings and consistently deliver an alluring online experience. That’s because a recent study found 42% of consumers cite less trust in online shopping due to poor experiences, such as inconsistent pricing and out-of-stock merchandise.6 In response, these e-commerce best practices can help brands improve the customer journey and top line sales.

    To help consumers find their products online with ease, brands can use data insights for superior product discovery. Insights help brands know exactly which keywords shoppers search for to earn high visibility rankings among consumers’ online search results. Data analytics direct brands to the most relevant keywords, which they can use in marketing, including product descriptions, for effective online discovery.7


    Brands also face increased pressure to keep up with rivals’ real-time pricing changes across retailers’ e-commerce sites, online marketplaces and social media. Insights help brands price competitively across channels by monitoring and promptly adapting to competitors’ online pricing moves. Brands can even use data to ensure merchants consistently respect pricing policies.

    Data analytics also help brands measure their marketing effectiveness and popularity across e-commerce

    websites, and how they compare to their rivals. Brands can improve how they promote their products by using targeted digital content that resonates. For instance, they can publish unique content on each channel tailored to the platform’s unique algorithm and use data to discover patterns among their top performing campaigns. Also, brands can determine when to use their own social media channels or pay for sponsored ads to drive more sales.


    As we saw last March, in-stock merchandise is essential to maximize online sales. Data analytics help brands track their stock status to ensure products are available across all their digital channels for reliable service that sparks more sales. 

    Brands find new efficiencies

    Cost effectiveness is also vital and these e-commerce best practices help brands boost their online efficiencies.

    Brands use insights to pinpoint and keep sharing content that effectively resonates with and enages their target audience. They can use data insights to see where to allocate their marketing spend for online promotions and either revitalize or drop underperforming online promotions. Brands can also track whether their online promotions align with rivals’ promotions to stay competitive and agile.

    Likewise, measuring a brand’s popularity through consumer reviews reveals which underperforming products to downplay to conserve marketing resources for the specific products and bundles that perform best in their categories. For instance, PepsiCo’s and Kraft Heinz’s new online shops offer only large items or bundles for basket sizes large enough to offset shipment costs.8


    To reduce the high cost of product returns, brands can use data insights to prioritize bestselling products rather than items consumers are more likely to send back. Using clear, up-to-date content, including product descriptions with accurate dimensions, can also help online consumers know exactly what they’re buying to minimize returns.


    How brands and consumers profit

    When brands use insights to make better e-commerce decisions, they can compensate for ballooning expenses. Analytics help brands connect the dots among their online visibility, promotions, performance and reviews. These best practices can give brands an edge by uncovering how to be more aggressive with revenue-earning and cost-cutting opportunities. Brands find effective ways to acquire more online customers to improve their top line and offset e-commerce expenses with new efficiencies. Data-driven digital marketing decisions help brands improve their e-commerce effectiveness to stay profitable and competitive. 


    Meanwhile, consumers also win by having an inviting, smooth and reliable online shopping experience. They find the products they want with greater ease, and feel confident enough to buy based on information like a brand’s pricing, promotions and product availability.


    1 Arora, Arun, Hamza Khan. Sajal Kohli and Caroline Tufft. DTC e-commerce: How consumer brands can get it right. McKinsey & Company. November 30, 2020.
    2 Ali, Fareeha. US ecommerce grows 44.0% in 2020. Digital Commerce 360. January 29, 2021.
    3 Arora, Arun, Hamza Khan. Sajal Kohli and Caroline Tufft. DTC e-commerce: How consumer brands can get it right. McKinsey & Company. November 30, 2020.
    4 Jansen, Caroline, Cara Salpini and Maria Monteros. 8 DTC trends to watch in 2021. Retail Dive. February 3, 2021.
    5 Haber, John. Logistics Costs Challenge E-Commerce Profit Margins. Parcel Industry. October 9, 2020.
    6 O’Carroll, Derek. 5 Hidden Trends That Will Shape E-Commerce in 2021. Total Retail. February 4, 2020.
    7 Leong, Brandon. COVID-19 strategy: Use the power of your digital sell sheet. Digital Commerce 360. August 23, 2020.
    8 Arora, Arun, Hamza Khan. Sajal Kohli and Caroline Tufft. DTC e-commerce: How consumer brands can get it right. McKinsey & Company. November 30, 2020.

  • Black Friday Prices Tempt Health & Beauty Shoppers

    Black Friday Prices Tempt Health & Beauty Shoppers

    Black Friday looked downright sultry with desirable discounts on health and beauty products.

    This year, health and beauty sales faced the threat of declining demand, as the pandemic keeps many consumers cooped up at home and in-store product testers no longer allowed. Yet consumers’ enduring desire to look and feel their best means this category will remain resilient. (Plus, we want to look smokin’ hot on Zoom.)

    That’s why we were curious to know how retail rivals, ranging from discounters to department stores, are battling it out to become bodacious beauty destinations to win the hearts, wallets and fake lashes of online shoppers.

    To calculate which retailers’ prices offered the broadest and most generous discounts, we examined health and beauty products’ pricing at Amazon, JC Penney, Macy’s, Neiman Marcus, Overstock, Nordstrom, Target and Walmart. We compared the pre-sale period (November 24-26) to the holiday sales period (Black Friday on November 27 through Cyber Monday on November 30) for a glimpse of retailers’ pricing strategies in this fiercely competitive category.

    BlackFriday_Health_Beauty_img1

    To gain insights into retailers’ competitive pricing strategies, we tracked three scenarios: whether prices decreased, increased or remained the same during the last week of November 2020. The vast majority of health and beauty products (91.0%) maintained the same prices during the pre-sale and sales periods. An astounding 99.7% of Target’s health and beauty prices stayed the same during the period.

    Amazon had the highest proportion of health and beauty products that offered a price decrease (18.1%), particularly on men’s fragrance, women’s fragrance and men’s hair care. Offering discounts on more items hints that Amazon wants to attract more health and beauty consumers, including men, by making more items affordable. Target offered the lowest proportion of health and beauty products with price decreases (0.8%).

    Amazon also had the greatest proportion of health and beauty products with a price increase (7.0%) with 15.3% of men’s fragrance earning a price hike.

    BlackFriday_Health_Beauty_img2

    On Black Friday, among health and beauty products with price decreases, Target gave the most generous average discount (37.6% vs. 7.2% for Overstock). However, Target’s discounts applied to only 12 products compared to 798 for Overstock.

    Common types of health and beauty products with the highest average discount on Black Friday have included face makeup, men’s fragrance, men’s hair care, and shampoo and conditioner.

    Among health and beauty products with price increases on Black Friday, Nordstrom had the highest average price hike (43.8% on one women’s fragrance) and Walmart offered the lowest (10.3% on 250 products).

    These findings suggest that Target was willing to create aggressive loss leaders in this category and Amazon wanted to boost health and beauty sales among male shoppers.

    Black Friday vs. Cyber Monday

    BlackFriday_Health_Beauty_img3

    This year, most retailers offered more additional discounts on health and beauty products on Cyber Monday than on Black Friday, possibly to prioritize clearing out their inventory before year-end. JC Penney and Macy’s were the exception. Overall, the top product types that received additional discounts included shave and hair removal, women’s fragrance and face makeup.

    On Cyber Monday, Amazon offered additional discounts on the greatest proportion of health and beauty products (21.1% vs. 2.1% for Target). Amazon focused on men’s hair care, shampoo and conditioner and face makeup.

    BlackFriday_Health_Beauty_img4

    Half the retailers (Amazon, JC Penney, Nordstrom and Overstock) offered deeper additional discounts on health & beauty on Cyber Monday than Black Friday, possibly to clear out their inventory before the end of the year. Cyber Monday discounts ranged from 35.0% for Nordstrom to 7.8% for Overstock.

    Meanwhile, both Neiman Marcus and Walmart offered the same levels of discounts on both Black Friday and Cyber Monday.

    Overall, the types of health and beauty products with the deepest discounts on both Black Friday and Cyber Monday were shampoo and conditioner, men’s hair care and face makeup.

    Additional discounts across products by “premiumness” level

    For almost all the retailers, the percentage of health and beauty products with additional discounts was higher on Cyber Monday than on Black Friday. Overstock had the highest proportion (20.2%), slightly more than Amazon (20.0%).

    JC Penney had a higher percentage of products with additional discounts on Black Friday. Neiman Marcus had the same percentage of products on both sales days.

    All the retailers except JC Penney and  Neiman Marcus allocated the greatest percentage of their additional discounts to health and beauty products at the high level of premium. The retailers may have wanted to appeal to upscale shoppers and make high premium goods more accessible to a broader audience of consumers.

    Half of the retailers (JC Penney, Nordstrom, Target and Walmart) offered deeper discounts on Black Friday than Cyber Monday.

    Target offered the most generous discounts on Black Friday with an average additional discount of 39.7%, which ranged from 50.1% on moderately premium health and beauty products to 28.6% for products at a high premium level. Target appeared to make more beauty items, including high premium items, affordable to more consumers to stay competitive as a beauty destination.

    Conversely, Amazon, Overstock and Macy’s were more generous with additional discounts on Cyber Monday. Among the high premium level of health and beauty products on Cyber Monday, Macy’s offered the deepest discounts (31.3%), edging out department store rival JC Penney (30.4%) in competing for upscale shoppers.

    Health & Beauty’s Ravishing Holiday Prices

    This year’s Black Friday and Cyber Monday pricing strategies showed retailers’ attempts to stand out, expand their market reach to stay competitive. Appealing to a broader audience included spanning upscale and value tiers, and wooing more male online shoppers to grow their top line and boost loyalty in an intense category amid a pandemic.

    Stay tuned for more Black Friday and Cyber Monday 2020 analysis to discover how retailers strategically price their products to win in leading e-commerce categories.


  • Who Won Black Friday’s Electronics Price War?

    Who Won Black Friday’s Electronics Price War?

    Electronics have never been hotter.

    This year’s COVID-19 pandemic created a seismic shift towards tech, directly affecting retailers’ Black Friday and Cyber Monday pricing strategies for electronics. Prime Day 2020’s new fall date also inevitably influenced pricing and purchasing patterns. If consumers pampered themselves with a 75-inch TV in October, what are the odds they’re in the market for another big-screen TV in late November?

    Consumer electronics are perennial holiday bestsellers because they make gift-giving easy, whether we buy them for others or for personal indulgence. Continuous innovation also means a comparatively shorter product lifecycle, making electronics an exciting, progressive retail category.

    To determine which retailers’ pricing strategies offered the most generous discounts on electronic products, we examined electronics pricing at Amazon, Best Buy, Overstock, Target and Walmart. We compared during the pre-sale period (November 24-26) to the holiday sales period (Black Friday on November 27 through Cyber Monday on November 30) for a glimpse of retailers’ pricing strategies to stay competitive in 2020.

    For competitive pricing insights, we tracked three scenarios before and during 2020’s traditional holiday sales season: whether prices decreased, increased or remained the same. Most strikingly, the overwhelming majority of electronics products (89.8%) maintained the same prices during the pre-sale and sales periods. For instance, Target kept a whopping 98.0% of its electronics prices the same during the period.

    Amazon had the greatest proportion of electronics products that offered a price decrease (11.7%), particularly on laptops, mobiles and wearable technology. These results also suggest Amazon wants to reach more consumers by making more electronics affordable with discounts. Target offered the lowest proportion of electronics with price decreases (2.5%).

    Overstock had the greatest proportion of electronics products that offered a price increase (10.7%) with 30.3% of TVs increasing in price. Best Buy offered the lowest proportion of electronics with price increases (1.2%).

    Among electronics products with price decreases on Black Friday, Best Buy offered the highest average discount (16.6%) and Amazon offered the lowest (10.2%). Among all the retailers, the types of electronics with the highest average discount included tablets, headphones, laptops and TVs.

    Among electronics products with price increases on Black Friday, Best Buy had the highest average price hike (30.2%) and Amazon offered the lowest (9.8%). That said, Best Buy increased the price of one laptop by 73.1% whereas Amazon increased the price of 44 laptops by an average of 4.2%.

    These findings show that Best Buy aggressively protected its market share in this competitive category by offering the most generous discounts.

    Black Friday vs. Cyber Monday

    Without exception, the retailers offered more additional discounts across the electronics category on Cyber Monday than on Black Friday. Retailers may have wanted to clear out their inventory to make room for new, innovative products in their assortments.

    Amazon had the greatest proportion of electronics with additional discounts on Cyber Monday (15.7%, which is more than double the 7.3% each for Overstock and Target). Amazon’s additional discounts focused on mobiles, laptops and wearable technology.

    Overall, the greatest proportion of additional discounts on electronics on Cyber Monday focused on laptops, desktops and USB flash drives.

    While most retailers offered deeper discounts on electronics on Cyber Monday than Black Friday, Overstock was the sole exception.

    On Cyber Monday, Target offered the most generous average additional discounts (19.6% vs. 10.2% for Amazon); however, Target’s discounts applied to 260 electronics products compared to 924 for Amazon.

    Overall, the types of electronics with the deepest discounts on Cyber Monday on electronics were USB flash drives, tablets and headphones.

    Additional discounts across products by “premiumness” level

    When we examine electronics’ additional discounts according to the products’ premium level, several patterns stand out.

    Most apparent is that every retailer offered a higher proportion of additional discounts on Cyber Monday compared to Black Friday, ranging from 15.9% for Amazon to 6.4% for Best Buy.

    With only one exception, Amazon offered the greatest proportion of additional discounts across all premium levels. Only Target offered a slightly higher proportion among low premium electronics (11.9% vs. 11.3% for Amazon). This approach could help Amazon make more electronics products more affordable to more consumers and boost its reach in this competitive category.

    Among electronic items at the high premium level, Amazon was most aggressive in allocating additional discounts (21.0% vs. 5.4% for Target), which could help the e-commerce giant earn top-of-mind status among affluent shoppers in the market for big-ticket electronics.

    Most retailers (Amazon, Best Buy and Walmart) offered deeper discounts on Cyber Monday than Black Friday. By contrast, Overstock and Target were more generous on Black Friday.

    Interestingly, Target’s average additional discount on Cyber Monday (18.8%) was still more generous than those of the other retailers.

    Among moderately premium items, Target’s average additional discount was 22.3%, more than double Amazon’s 10.3%. Target may have tried to make mid-market electronics more affordable to its core audience of value-seeking shoppers.

    Additional discounts across products by “popularity” level

    A review of retailers’ additional discounts by electronics’ popularity level reveals that most retailers allocated a bigger proportion of discounts on Cyber Monday than on Black Friday. Overstock was the exception. Again, clearing out 2020 inventory before year-end likely influenced retailers’ pricing strategies.

    Overall, on Cyber Monday retailers showed a direct relationship between additional discounts and electronics’ popularity levels. For instance, Amazon offered additional discounts on 21.7% of highly popular electronics and 15.3% on moderately popular electronics. Since Amazon strives to be “The Everything Store,” it makes sense to make more products more appealing and affordable to more consumers. Meanwhile, Target offered nearly double the proportion of additional discounts of less popular electronics than discount rival Walmart (12.5% vs. 6.7%) to tempt value-seekers with deals.

    Most retailers (Amazon, Best Buy, Target and Walmart) offered deeper discounts on Cyber Monday than Black Friday. Overstock was more generous on Black Friday.

    On Cyber Monday, Target’s average additional discount (21.8%) was the most generous of all the retailers, nearly double that of Amazon (11.1%). However, Target’s discounts applied to 259 electronics products. vs. 903 for Amazon.

    Both Amazon and Overstock gave their most generous discounts to less-popular electronics, possibly to clear out their inventory to make room for more popular or higher-margin items.

    Black Friday & Cyber Monday 2020 Electronics Pricing Strategies

    This year, the pandemic jolted consumers to focus on digital technology to stay connected to work, school and retail, which heightened demand for electronics.

    In response, retailers’ 2020 pricing strategies for Black Friday and Cyber Monday suggest a desire to extend their reach beyond their core audience to maximize their brand appeal and steal rivals’ market share.

    The Cyber Monday findings, in particular, suggest retailers decluttered their assortments to make space for the latest and highest-margin tech gadgets in time for Christmas.

    Click here for more Black Friday and Cyber Monday 2020 analysis for greater clarity on the evolving pricing positions of retail rivals across top e-commerce categories.


  • Black Friday Furniture Prices Inspire Home Makeovers

    Black Friday Furniture Prices Inspire Home Makeovers

    As most of us stay home for the holidays this year, retailers hope we’ll invest in our nest.

    The global pandemic ignited sales in the red-hot home furniture category, as our domestic comfort, functionality and aesthetics suddenly became urgent priorities in 2020. Now we’re investing more in domestic leisure, organizing and redecorating as our consumption habits shift.

    That’s why we wanted to know how retailers adapted their Black Friday and Cyber Monday furniture pricing strategies to meet consumers’ needs. For instance, did retailers give the best deals on low-commitment furniture like area rugs or on big-ticket items like dining room sets?

    To pinpoint which retailers offered the greatest proportion of discounts and the deepest discounts, we reviewed furniture at Amazon, Home Depot, JC Penney, Overstock, Target, Walmart and Wayfair. We compared the pre-sale period (November 24-26) to the holiday sales period (Black Friday on November 27 through Cyber Monday on November 30) to monitor retailers’ furniture pricing moves.

    Top product types by additional discount

    BlackFriday_homefurnishings

    To review retailers’ holiday pricing strategies in the furniture category, we tracked three scenarios: whether prices decreased, increased or remained the same during the last week of November 2020.

    The proportion of furniture items that maintained the same prices during the pre-sale and sales periods ranged widely, from 91.6% for Home Depot to only 22.6% for Wayfair.

    That’s because Wayfair had by far the highest proportion of furniture with a price decrease (77.2% on 4254 products vs. 7.1% on 342 products for Home Depot). Since Wayfair specializes in home décor, it makes sense for the retailer to aggressively distribute discounts across its furniture assortment.

    Among all retailers, the top types of furniture with discounts included bookcases, entertainment units, sofas and storage and cabinets. These findings suggest we are investing in domestic leisure, relaxation and organization.

    BlackFriday_homefurnishings_saleanalysis

    On Black Friday, JC Penney offered the most generous average discount (21.3% vs. 4.6% for Wayfair). This means that although Wayfair spread discounts across its furniture subcategories, the actual discounts were lower than rivals’.

    Types of furniture with the highest average discount on Black Friday at JC Penney included storage and cabinets, bookcases and rugs. These products tend to be affordable additions to our homes compared to bigger investments like a dining room set.

    Black Friday Vs. Cyber Monday

    CyberMonday_homefurnishings

    On Cyber Monday, Target offered additional discounts on the greatest proportion of furniture (27.4% vs. 7.8% for JC Penney). These findings suggest Target really wants to be a convenient option for shoppers, including their home furnishing needs.

    Among all retailers, the top types of discounted furniture included rugs, beds and entertainment units.

    Most retailers offered deeper additional discounts on furniture on Cyber Monday than Black Friday, possibly to maximize sales before the end of the year. Cyber Monday discounts for furniture ranged from 20.9% for JC Penney to 4.9% for Wayfair. Among all retailers, the top types of furniture that received discounts on Cyber Monday were rugs, storage and cabinets and dining table sets, which show that redecorating and organizing were in style this holiday season.

    Additional discounts across product “premiumness” levels

    BlackFridayVsCyberMonday_homefurnishings

    Nearly all retailers had a higher proportion of furniture with additional discounts on Cyber Monday than on Black Friday. Wayfair had the highest proportion (79.2% for both Cyber Monday and Black Friday vs. 9.3 for Home Depot). Wayfair’s use of discounts across all premium levels on both major sales days shows the retailer wants to extend its brand reach, own this category and earn top-of-mind status across diverse furniture shoppers at all price points.

    Only JC Penney had a higher percentage of furniture with additional discounts on Black Friday.

    Every retailer offered deeper discounts on Cyber Monday than Black Friday, likely to clear out 2020 merchandise.

    On Cyber Monday, JC Penney offered the most generous furniture discounts, with an average additional discount of 38.0%, which ranged from 35.1% at the low premium level to 40.9% at the moderately premium level. Aggressive discounts could set JC Penney apart among department stores and attract more low- to mid-market consumers with tempting furniture deals.

    Also, most retailers gave the deepest discounts on furniture at the high premium level, which can help to make upscale items accessible and affordable to a greater number of consumers.

    Additional discounts across product “popularity” levels

    CyberMondayVsBlackFriday_homefurnishings

    Almost all retailers offered a greater proportion of additional furniture discounts on Cyber Monday than on Black Friday, ranging from 67.6% for Wayfair to 7.8% for Home Depot.

    Across all levels of popularity for furniture, Wayfair dominated with discounts on the most diverse array of products to give more furniture shoppers an opportunity to save money.

    Meanwhile, Amazon and JC Penney offered the greatest proportion of discounts at the low level of popularity, possibly to declutter their furniture assortment to make room for in-demand products.

    Nearly every retailer offered deeper discounts on furniture on Cyber Monday than on Black Friday, with JC Penney being the most generous (39.1% vs. 5.3% for Wayfair).

    Home Depot and Wayfair prioritized discounts among less popular furniture, likely to clear them out and make more room in their assortments for items people really want.   

    Amazon and Walmart gave deeper discounts on highly popular furniture to battle it out over bestsellers.

    Holiday Furniture Pricing Inspires Us to Reimagine Our Space

    This year, more consumers decluttered their homes and more retailers decluttered their furniture assortment by clearing out 2020 merchandise with desirable deals on Black Friday and Cyber Monday.

    The findings of this pricing analysis hint at retailers’ competitive positioning. To own the furniture category, Wayfair aggressively allocated discounts across its assortment even if rivals gave deeper discounts. Target’s deep discounts helped to position the chain as a convenient option for shoppers’ cross-category needs, including furniture. JC Penney’s astonishingly deep discounts on Black Friday and Cyber Monday could help to liquidate inventory, whereas Amazon and Walmart battled over bestsellers.

    Click here for more Black Friday and Cyber Monday analysis to learn about retailers’ holiday pricing strategies during 2020’s e-commerce boom.

  • Black Friday Prices Wowed Fashionistas

    Black Friday Prices Wowed Fashionistas

    Retailers really wanted to dress us up this holiday season.

    This year’s Black Friday and Cyber Monday fashion pricing trends reflect how retailers have responded to the pandemic’s influence on apparel shopping to boost their resilience and competitiveness.

    For instance, since most consumers now cocoon at home, few of us are likely to splurge on fancy gowns or suits as holiday gifts for ourselves or others. That’s why we wanted to know which retailers doubled down on Black Friday fashion discounts and which ones used Cyber Monday discounts to make room for in-demand merchandise.

    To calculate which retailers’ prices offered the greatest proportion of discounts and the deepest discounts, we analyzed men’s and women’s fashions at Amazon, Bloomingdale’s, JC Penney, Macy’s, Neiman Marcus, Overstock, Nordstrom, Target and Walmart. We compared the pre-sale period (November 24-26) to the holiday sales period (Black Friday on November 27 through Cyber Monday on November 30) to gain insights into retailers’ pricing strategies in fashion.

    Top product types by additional discounts- Men’s fashion

    To review retailers’ holiday pricing strategies, we tracked three scenarios: whether prices decreased, increased or remained the same during the last week of November 2020.

    The overall proportion of men’s fashion items that maintained the same prices during the pre-sale and sales periods was 88.6%, ranging from 99.5% for JC Penney to 75.0% for Neiman Marcus.

    Neiman Marcus had the highest proportion of men’s fashions with a price decrease (25.0% vs. 1.4% for JC Penney). Top types of men’s fashions that had discounts were formal shoes, jackets and coats, and sports shoes. These findings seem to reflect how we rarely go out during the pandemic yet we’re exercising more.

    In addition, Amazon and Walmart were most active in offering discounts across all men’s fashion subcategories with Amazon offering more than double Walmart’s percentage of products discounted (15.9% vs. 7.1%).


    On Black Friday, JC Penney offered the most generous average discounts (35.6% vs. 9.4% for Overstock). While that contrast seems dramatic, it’s important to note JC Penney’s discounts applied to only 8 products compared to 929 for Overstock.

    Men’s fashions with the highest average discount on Black Friday included formal shoes, jackets and coats and jeans.

    Top product types by additional discounts- Women’s fashion

    For women’s fashions we also tracked whether prices decreased, increased or remained the same during the last week of November 2020. The vast majority of women’s fashions (89.3%) maintained the same prices during the pre-sale and sales periods. A whopping 99.3% of Target’s women’s fashion prices stayed the same.

    Neiman Marcus had the highest proportion of women’s fashions with a price decrease (33.4%), particularly on casual shoes, t-shirts and lingerie. JC Penney and Target offered the lowest proportion of price decreases on women’s fashions (1.9%).

    Similar to men’s fashions, Amazon and Walmart offered price discounts across all the women’s fashion subcategories with Amazon offering a higher proportion of products with discounts. (10.7% vs. 7.7% for Walmart)

    On Black Friday, JC Penney offered the most generous average discounts (45.0% vs. 12.2% for Overstock) yet JC Penney’s discounts applied to only 28 products compared to 1952 for Overstock.

    The types of women’s fashions with the highest average discount on Black Friday included tops, casual shoes and handbags. Perhaps women pampered themselves with a new purse and new tops to look chic on Zoom calls.

    Black Friday Vs Cyber Monday

    During this year’s holiday sales events, almost all retailers offered more additional discounts on men’s and women’s fashion on Cyber Monday than on Black Friday, possibly to sell off seasonal inventory before year-end. Nordstrom was the only exception, offering more discounts on Black Friday.

    On Cyber Monday, Target offered additional discounts on the greatest proportion of men’s fashions (63.3% vs. 10.6% for Walmart). Top types of men’s fashions with discounts included underwear, jeans, jackets and coats.

    Similarly, Target offered additional discounts on the greatest proportion of women’s fashions on Cyber Monday (79.4% vs. 3.2% for JC Penney). The most common types of discounted women’s fashions were dresses and jumpsuits, t-shirts and casual shoes.

    These findings suggest Target is aggressively pursuing value shoppers and positioning the chain as a convenient source for all the whole family’s apparel needs.

    Most retailers (Amazon, Nordstrom, Overstock, Target and Walmart) offered deeper additional discounts on men’s fashions on Cyber Monday than Black Friday, possibly to maximize year-end sales and clear out seasonal inventory. Cyber Monday discounts for men’s fashions ranged from 29.8% for Nordstrom to 11.0% for Overstock. Top types of men’s fashions that received Cyber Monday discounts included jackets and coats, formal shoes, sunglasses and t-shirts, which reflect how men are going out less.

    Conversely, most retailers (JC Penney, Macy’s, Neiman Marcus, Nordstrom and Walmart) offered deeper additional discounts on women’s fashions on Black Friday than Cyber Monday, possibly to entice women to get a jumpstart on the holiday sales weekend to maximize top line performance in this competitive category. Black Friday discounts for women’s fashions ranged from 45.0% for JC Penney to 12.2% for Overstock. Top types of women’s fashions with Black Friday discounts included swimwear, lingerie and t-shirts, which reflect seasonal merchandise.

    Additional discounts across products by “premiumness” level

    For almost every retailer, the percentage of fashions with additional discounts was higher on Cyber Monday than on Black Friday. Target had the highest proportion (62.7% vs. 5.7% for JC Penney). It appears Target really wants to win value-seeking apparel shoppers, by offering additional discounts on 93.3% of fashions at the low premium level (vs. 4.6% for Walmart).

    By contrast, Nordstrom had a higher percentage of fashions with additional discounts on Black Friday.

    Most retailers (Amazon, Bloomingdale’s, Neiman Marcus, Overstock, Target and Walmart) offered deeper discounts on Cyber Monday than Black Friday, likely make room for new seasonal merchandise.

    Neiman Marcus offered the most generous fashion discounts on Cyber Monday with an average additional discount of 30.1%, which ranged from 31.7% at the high premium level to 28.9% at the low premium level. This aggressive discounting could help Neiman Marcus stand out among department stores, and extend its reach and appeal by making fashions more affordable across price points.

    Conversely, JC Penney, Macy’s and Nordstrom offered deeper discounts on Black Friday. All three department stores were most generous at the low premium level for fashions, with JC Penney offering the deepest discounts (47.8%) to turn low premium fashions into irresistible Black Friday bargains.

    Additional discounts across products by “popularity” level

    Almost all retailers offered a greater proportion of additional fashion discounts on Cyber Monday than on Black Friday, ranging from 69.2% for Target to 5.2% for JC Penney, with a direct relationship between product popularity and additional discount percentage. Across all levels of popularity for fashions, Target was by far the most aggressive with discounts to appeal to the broadest variety of fashion shoppers.

    Only Nordstrom offered a higher proportion of additional discounts on fashions on Black Friday, focusing on both high and low levels of popularity.

    Most retailers (Amazon, Neiman Marcus, Overstock, Target and Walmart) offered deeper fashion discounts on Cyber Monday than on Black Friday, with both Neiman Marcus and Target being the most generous (28.8%). Amazon and Neiman Marcus were most generous with discounts among less popular items, while Overstock, Target and Walmart were most generous among moderately popular fashions.

    Conversely, JC Penney, Macy’s and Nordstrom offered more generous fashion discounts on Black Friday, with JC Penney being the most generous (39.2%). All three retailers offered the deepest discounts at the low level of popularity, possibly to make room for in-demand fashion items.

    2020’s Fashionable Holiday Prices

    As this year’s Black Friday and Cyber Monday fashion pricing results show, we prioritized comfort and basics over debonair formalwear. Since staying at home is in style, many retailers discounted dressier attire.

    In terms of competitive pricing strategies, Target’s aggressive discounts could boost the chain’s appeal among diverse fashion shoppers. Also, Neiman Marcus stood out among department stores by extending its reach and affordability across pricing tiers. 

    Click here for more Black Friday and Cyber Monday analysis to learn about retailers’ holiday pricing strategies during 2020’s e-commerce boom.


  • Country of Origin: E-retailers in India | DataWeave

    Country of Origin: E-retailers in India | DataWeave

    ‘Make in India’ is a headline you’re likely to have seen smeared across newspapers or as campaign rhetoric. E-retailers in India were mandated to display the country of origin against all the products starting 1st August, 2020. The rationale behind this move was to provide the customer the information which would aid the government to accelerate their plans on curbing imports.  

    To get an idea of the extent that this was followed, we looked at 29,000+ products on Amazon and 20,000+ products on Flipkart, across popular categories.

    What our data revealed (illustrated in the chart above) is that Flipkart had updated the country of origin information for 91% of the products while Amazon had updated for only 56%. In categories like Grocery/ Cooking Essentials and Personal Care, Flipkart updated this information across 100% of products that we looked at. 

    The chart above reveals interesting insights into the respective product mixes of Flipkart and Amazon. We narrowed our study to three categories that stood out; Electronics, Baby products and Men’s’ fashion. These are the categories we noticed that have the most number of products that are manufactured out of India. Apart from India, the largest manufacturer is China, where a lot of these products come from. Looking at this chart, we see that most of Flipkart’s products are manufactured in India, compared to its counterpart.

    To sum up, we noticed that Flipkart has updated 91% of its products while Amazon has updated only 56% of their products of the products we tracked. 

    With the heightened emphasis on Make in India and reducing imports, sellers importing from other countries might have to rethink how to replace the products they currently are sourcing with local products. This also provides an opportunity to the Indian manufacturers to produce popular products which are currently being imported.

    We’ll now have to wait and watch over the coming months to see how things unfold for these retailers and the sellers.

  • Amazon’s losing its pricing advantage this holiday season

    Amazon’s losing its pricing advantage this holiday season

    Amazon’s pricing advantage has declined in key categories, compared to last year as we enter 2020’s holiday season.

    The holidays are here and the retail industry is gearing up for the yearly stampede. In a report published by Bain & Company, in partnership with DataWeave, it was observed that, “When it comes to pricing, Amazon’s historical advantage is also deteriorating. The research shows that in October and November 2019, Amazon matched or beat competitors’ prices 81% of the time in the categories studied. By November of 2020, that rate dropped to 74%”. This was based on the four key categories where we had pricing data for Amazon and at least one other competitor.

    Amazon’s pricing advantage has declined in key categories

    Amazon_product_pricing

    Aggressive pricing, which was once Amazon’s forte, seems to be on a downward trend this year. All but one category saw an increase in the percentage of products where they beat the lowest price, ‘movies, music, video games’ – by a small margin of one percentage point.

    What could this shift be attributed to? The obvious would be the repercussions of COVID but there perhaps is more at work here. As observed last year, the behemoth that Amazon is, does not deter its competitors from constantly biting at the heels, with a steely determination to rope in market share. Everything from increased and specific customer demands, to government legislation, there are a lot of moving parts.

    One thing is for sure, this is surely just the beginning of the great e-commerce battle. For access to the full article that was published in the Retail Holiday Newsletter by Bain & Company and powered by DataWeave, click here.

  • How Essential Goods Have Shaped Retail Strategies

    How Essential Goods Have Shaped Retail Strategies

    The rapid evolution in essential goods is rattling retail. That’s because the COVID-19 pandemic has dramatically changed shopping habits and retail necessities, leading to unpredictable shifts in demand.

    Most notably, U.S. e-commerce has surged by an astonishing 45% year-over-year, as the pandemic accelerated online shopping by five years.[1] Since more consumers now work and learn from home, many pandemic-inspired habits will likely shape retail for years to come.[2]

    Now that the risk of the second wave lies ahead, it’s the ideal time for retailers to review pandemic bestsellers and patterns to adapt to shifts in shopping behavior.


    Pandemic’s bestsellers shape retail strategies

    2020’s unexpected consumption patterns give retailers a glimpse of how they can adapt and thrive. The best-selling essential goods during the pandemic have included:

    • Toilet paper: +734% year-over-year (YoY) growth in March[3]
    • Disposable gloves: +670% in March[4]
    • Fitness equipment: + 535% YoY in online sales for February to March[5]
    • Hand sanitizer: +470% YoY for the week ending March 7[6]
    • Yeast: +410% YoY for the four weeks ending April 11[7]
    • Puzzles: +370% YoY in the last two weeks of March
    • Pyjamas: + 143% in online sales between March and April[8]

    As such, retailers can ensure their assortments contain these types of popular cross-category items, which reflect overall themes of consumers’ needs for self-sufficiency, wellness and comfort.

    E-grocery is also soaring, as experts predict a 40% rise in U.S. online grocery sales in 2020 due to the pandemic.[9] Top categories bought by online grocery shoppers include:

    • Packaged non-fresh food (69%)
    • Toiletries, personal care and diapers (63%)
    • Household cleaning and paper products (61%)[10]

    In response to these trends, retailers can prioritize shelf-stable center store products and non-food consumer goods throughout the pandemic.

    How retailers boost agility, clarity and sales amid COVID-19 chaos

    Consumer panic led to pricing volatility for hard-to-find items like hand sanitizer, disinfectant wipes and masks.[11] To keep up with competitors’ online price fluctuations, more retailers use competitive analytics to adapt their own prices accordingly. Notably, McKinsey & Company cites data insights and price sensitivity as the top two disruptive trends the pandemic has turbocharged.[12]

    In March, shortages of toilet paper and flour led consumers to react with panic and hoarding that created urgent supply chain issues. To avoid out-of-stock items, more retailers now turn to data insights to identify potential disruptions. Up-to-date insights help retailers spot emerging market trends and adapt their assortment to stock in-demand items.

    Now that more consumers shop online, retailers are investing in digital promotions to boost sales. Data analytics help retailers quickly evaluate the effectiveness of their promotions, which can inspire consumers to fill their baskets. Nimbly adapting to competitors’ promotions is essential, as McKinsey cites rising competition for deals among the pandemic’s most disruptive retail trends.[13]

    Avoid empty shelves: The pandemic has motivated more retailers to rely on data insights to make fast, effective pricing and assortment decisions.

    As consumption habits evolve, high-level dashboards help retailers quickly spot inventory shortages to prevent out-of-stocks.

    To make their retail strategies pandemic-proof, leading retailers are collaborating with DataWeave to access accurate, actionable insights that boost online agility and sales. Applying DataWeave’s trusted data gives retailers clarity amid today’s chaotic market and shifting demand for essential goods, so they can make effective decisions fast. Insights also help retailers enhance the customer experience by supporting in-stock product assortments, competitive pricing and effective promotions that boost sales, trust and loyalty. To see how DataWeave helps retailers stay agile and competitive, visit dataweave.com.


    [1] Perez, Sarah. COVID-19 pandemic accelerated shift to e-commerce by 5 years, new report says. TechCrunch. August 24, 2020.

    [2] Gottlieb, David. 5 Strategic Imperatives for Retail’s New Normal. Total Retail. August 18, 2020.

    [3] Weiczner, Jen. The case of the missing toilet paper: How the coronavirus exposed U.S. supply chain flaws. Fortune. May 18, 2020.

    [4] Clement, J. COVID-19 impact on fastest growing e-commerce categories in the U.S. 2020. Statista. June 19, 2020.

    [5] Gibson, Kate. Coronavirus inspires fitness buying binge that tops New Year’s. CBS News. April 1, 2020.

    [6] Chasark, Krisann. Coronavirus impact: Hair dye becoming next high-demand item amid COVID-19 pandemic. ABC News. April 11, 2020.

    [7] Guynn, Jessica and Kelly Tyko. Dry yeast flew off shelves during coronavirus pantry stocking. Here’s when you can buy it again. USA Today. April 23, 2020

    [8] Thomas, Lauren. Comfort is en vogue during coronavirus: PJ sales surge 143%, pants sales fall 13%. CNBC. May 12, 2020.

    [9] Redman, Russell. Online grocery sales to grow 40% in 2020. Supermarket News. May 11, 2020.

    [10] Redman, Russell. Online grocery sales to grow 40% in 2020. Supermarket News. May 11, 2020.

    [11] Levenson, Michael. Price Gouging Complaints Surge Amid Coronavirus Pandemic. The New York Times. March 27, 2020.

    [12] Kopka, Udo, Eldon Little, Jessica Moulton, René Schmutzler, and Patrick Simon. What got us here won’t get us there: A new model for the consumer goods industry. McKinsey & Company. July 30, 2020.

    [13] Kopka, Udo, Eldon Little, Jessica Moulton, René Schmutzler, and Patrick Simon. What got us here won’t get us there: A new model for the consumer goods industry. McKinsey & Company. July 30, 2020.

  • How E-commerce Brands Build Customer Trust | DataWeave

    How E-commerce Brands Build Customer Trust | DataWeave

    Brands that build consumer trust will win big as online shopping explodes this year. As the COVID-19 pandemic propels more shoppers online, an astounding $5 trillion (30%) of annual global retail sales is up for grabs as the market shifts to e-commerce, according to Boston Consulting Group.[1]

    Notably, e-commerce has changed brands’ retail processes. Unlike brick-and-mortar stores, the digital shelf is where brands manage their company and products among online shoppers, influencing what they browse and buy.

    Rather than stocking merchandise through retailers’ physical stores, brands can now manage their online products by working with logistics experts like Fulfillment by Amazon. Instead of merchandising in stores with planograms and endcap displays, brands promote their digital assortment with targeted product content that resonates and keeps them coming back.[2] The evolution of retail can help brands save time and effort, and increase their agility and effectiveness.


    Gaining high visibility on the digital shelf can help brands boost their reach, brand awareness and sales. That’s why more brands are now investing in proven e-commerce best practices to increase consumer confidence by offering reliable products, relevant marketing and a smooth online experience. Now that the 2020 holiday sales season is underway, it’s the perfect time to see how leading brands compete in the increasingly crowded online market by demonstrating credibility and consistency.


    Market fragmentation increases brand complexity

    Selling across multiple online touchpoints means brands have more e-commerce websites and digital shelves to monitor to ensure compliance with brand guidelines to ensuring a consistent customer experience. To engage online shoppers, brands’ marketing strategies must now diligently manage their digital shelf across diverse online shopping arenas, including:

    • Direct-to-consumer (DTC) sites: More brand manufacturers are shortening the supply chain by bypassing retailers and selling directly to consumers, including sales through their own e-commerce websites.eMarketer predicts that U.S. DTC e-commerce sales will grow by 24% to reach nearly $18 billion in 2020.[3]

    • Retailers’ e-commerce sites: Brands are also migrating online because the retailers who sell their merchandise moved online this yearto adapt to the pandemic and survive shuttered storefronts. As of April 21, e-commerce grew 129% year-over-yearin U.S. and Canadian orders and U.S. e-commerce sales are on track to hit nearly $710 billion this year.[4] More than ever, sharing timely, accurate product information with retail partners is essential for success.

    • Online marketplaces: A growing number of brands are investing in digital advertising and content to stand out on popular, high-traffic online marketplaces. Global e-commerce leaders Amazon, eBay and China’s Alibaba and JD, are mostly search-based sites, as users know what they want and search for it, which makes product description pages and ads important marketing tools. Conversely, China’s Pinduoduo platform involves group-buying and interactive games to boost brand awareness and sales by entertaining online consumers and inspiring flattering word-of-mouth.[5] Among online marketplaces, digital content fuels brand discovery and sales.

    • Last-mile delivery channels: Brands can also sell in collaboration with their last-mile partners. Last-mile experts like Peapod, Instacart, Uber and Shipt offer online advertising opportunities for brands to reach new audiences. For instance, Instacart launched a self-serve advertising platform that lets brands promote their products in search results. Brands can choose the products to promote, set a budget and pay when users engage with those products.[6]

    • Social media: To reach and influence consumers where they already spend their time, more brands are investing in social media promotions and even embracing social commerce innovation. Social media matters to brands’ marketing effectiveness, as 52% of online brand discovery happens on social feeds.[7] Also, 92% of Instagram users say they’ve followed a brand, visited their website or made a purchase after seeing a product on Instagram.[8]

    Brand promotions have evolved beyond Google AdWords and Facebook campaigns. Now promotions include digital content and ads across all of these digital touchpoints, which increases the scope of brand marketing efforts to reach online consumers.

    How brands transform digital shelf complexity into clarity

    To earn online shoppers’ trust across e-commerce arenas, more leading companies are turning to a common solution: data.


    Too often, online shoppers abandon their cart due to concerns that they will unwittingly buy inauthentic products from fraudulent sellers. To protect their brands, manufacturers use data insights to pinpoint and prevent unauthorized sellers, counterfeit products and minimum advertised price (MAP) violations to demonstrate authenticity, accountability and price parity.

    Digital is the new normal”
    ~ Nike CEO John Donahoe
    [9]

    To invigorate underperforming online promotions, brands rely on analytics to connect the dots among their online promotions, marketing performance and share of voice. Insights on advertising, keywords and consumer reviews help brands make better marketing decisions faster. These insights help brands stand out from competitors and build relationships with shoppers by ensuring their promotions resonate and drive more sales online.

    To overcome low online traffic and sales, more brands apply data insights to improve their digital presence, visibility and sell-through rates. Brand analytics measure their popularity on e-commerce websites and track their stock status to improve accessibility, optimize digital shelf velocity and deliver a reliable customer experience that builds trust.


    Watch over your brand: To stay competitive and earn consumer trust, more brands now rely on data insights to make fast, effective decisions that enhance their reputation and boost online sales.

    As e-commerce explodes, more leading brands are collaborating with DataWeave for actionable brand analytics to protect their digital shelves, decrease complexity and boost consumer trust. These accurate, trusted insights help brands gain clarity to make smarter e-commerce decisions faster. Making data-driven brand management, promotional and digital marketing decisions helps brands prove their authenticity, improve marketing effectiveness and boost online sales. To see how DataWeave helps brands stand out, sell more and stay competitive, visit www.dataweave.com.


    [1] Taylor, Lauren, Chris Biggs, Ben Eppler, Henry Fovargue and Gaby Barrios.  How Retailers Can Capture $5 Trillion of Shifting Demand. Boston Consulting Group. August 31, 2020.

    [2] Gibbons, David. Ecommerce and content: How retailers have shifted strategies during the COVID-19 pandemic. Digital Commerce 360. August 18, 2020.

    [3] US Direct-to-Consumer Ecommerce Sales Will Rise to Nearly $18 Billion in 2020. eMarketer. April 1, 2020.

    [4] Wertz, Jia. 3 Emerging E-Commerce Growth Trends To Leverage In 2020. Forbes. August 1, 2020.

    [5] Lee, Emma. The incredible rise of Pinduoduo, China’s newest force in e-commerce. TechCrunch. July 26, 2018.

    [6] Goyal, Vivek. Browsing e-commerce: An untapped $250B+ opportunity. Medium. September 27, 2020.

    [7] Cooper, Paige. 43 Social Media Advertising Statistics that Matter to Marketers in 2020. Hootsuite. April 23, 2020.

    [8] Cooper, Paige. 43 Social Media Advertising Statistics that Matter to Marketers in 2020. Hootsuite. April 23, 2020.

    [9] Grill-Goodman, Jamie. ‘Digital is the New Normal,’ Nike CEO Says. RIS News. September 23, 2020.

  • Amazon Great Indian Festival Vs Big Billion Day- Who offered better discounts?

    Amazon Great Indian Festival Vs Big Billion Day- Who offered better discounts?

    The Great Indian Festival finally arrived and it coincided with Flipkart’s Big Billion Day Sale. The pandemic has pushed consumers to shop online and both, the Great Indian Festival and the Big Billion Day sales had been eagerly anticipated. Flipkart’s sale lasted between 16-21 October, while Amazon’s (in India) took started on 17th October.

    It is claimed that Amazon and Flipkart have hit $3.5 billion in sales in just four days. On the last day of its Sale, Flipkart claimed to have achieved 10 times growth as compared to last year’s Big Billion Day sale. Clearly, the sales have surpassed all the forecasts made for this year’s sale. We at DataWeave took a closer look to analyze the discounts that were offered across popular categories, to see if customers really had access to better deals and discounts. 

    Our Methodology:

    We looked at the top 500 products across categories like Fashion – men and women, electronics, Amazon devices, baby products, grocery and personal care. The pricing offered on these products across the sale period was compared with the pre-sale price, to understand the trend in discounts across the popular categories and brands.

    The Verdict:

    We segmented the products we were tracking into the following:

    Type 1: Products were either priced the same or were discounted over the sale compared to pre-sale 

    Type 2: Products were either priced the same or witnessed price increase during the sale compared to pre-sale 

    Type 3: Products which saw both price increase and decrease during sale compared to pre-sale

    Type 4: Products whose price continued to be the same even during the sale 

    flipkart_big_billion_day_2020_chart_1

    Flipkart clearly provided the better deals to customers for the categories we looked at during their Big Billion Day sale compared to Amazon. Flipkart discounted 54% of its products during the sale period compared to Amazon, and 26% of the products were discounted. 

    It is also interesting to note that in addition to offering more discounted products, Flipkart also offered additional discounts than Amazon.

    Amazon offered 13.2% additional discount and most of this average discounting can be attributed to a 33.8% discount on Amazon devices. It also ended up increasing the pricing for 16% of the products during the sale period, while Flipkart hiked the pricing for 6% products. 56% of products on Amazon continued being sold at the same price even during the sale. 

    Additional discounts across product premiumness levels

    Premiumness was based on the actual price of a product before the sale event. This was divided into low, medium and high premiumness levels, with high indicating higher selling prices.

    flipkart_big_billion_day_2020_chart_2
    big_billion_day_great_indian_sale_2020

    In Amazon devices, baby products, electronics and grocery-cooking essentials, Amazon showed a direct relationship between its additional discounts and the level of premiumness. While Flipkart did not seem to follow a particular pattern with respect to product premiumness. 

    Flipkart offered the highest discounts for premium products in the Fashion category (for both men and women) compared to the rest. 

    Top brands by additional discounts:

    We looked at popular brands across categories to arrive at brands that were being sold at the maximum discount. These brands appeared at least twenty times in the top 500 ranks we considered.

    amazon_great_indian_sale_2020_electronics

    Acer, Philips, Samsung, Lenovo, Bajaj, Asus which were common brands across both Flipkart and Amazon in the electronics category, were being sold at much deeper discounts on Flipkart (almost double), compared to that on Amazon.

    Avita was extremely popular under the laptop sub-category on Flipkart and was observed to be discounted the highest during the sale.

    In Fashion, Titan was the most discounted brand with 53.9% additional discount but only 4% and 2% of the products offered discounting in mens’ and womens’ fashion respectively. Reebok in mens’ fashion and Fastrack, Sonata and Puma in womens’ wear on Flipkart, had discounts across almost all the products. 

    amazon_great_indian_sale_2020_baby_care
    flipkart_big_billion_day_2020_baby_care

    In the baby care category, Hasbro gaming on Flipkart had the highest additional discount followed by Funskool. Both the brands had more than 85% of their products discounted. 

    Johnson’s, which was common on both Amazon and Flipkart, was offered at higher discounts on Amazon compared to Flipkart. However, only 31% products were discounted vs 72% on Flipkart.

    Most Visible Brands

    We looked at the top 200 ranks across each sub-category to narrow down on the most visible brands across the sale period.

    amazon_great_indian_sale_top_brands
    flipkart_big_billion_day_2020_top_brands

    Across all categories and their sub-categories, the sub-category laptop had distinct brands that hold the majority of the products. This is observed both in Amazon and Flipkart where brands like Lenovo, HP, Asus hold more than 33% share of the first 200 products. 

    “Mobile” category was dominated by brands like Redmi and Boat on Amazon, and Realme and OPPO on Flipkart. These brands occur at least 24% of the time in the top 200 ranks.

    Who Won?

    There are many ways to look at this. To begin with, the combined sales of Flipkart and Amazon during the festive season in India accounted for more than 90% of the e-commerce industry’s gross sales. That amounts to a 55% year-on-year growth. Delving further, we see that Flipkart was far more aggressive with their offerings.

    They discounted 56.8% additional products at an overall discount of 15%. On the other hand, Amazon retained their typical cautious approach to discounting, with only 28.4% of the products, at an overall discount of 12.8%.

    If we adopt a more macro view of the sales, we have to take into account that this year is somewhat of an anomaly. Given the social distancing norms and other SOPs governing the common man, more people have been ushered into the world of online shopping. The penetration extended far into the Tier 2 and Tier 3 cities as well, thus potentially benefiting Flipkart, owing to their interior reach.

    Going by the numbers, Flipkart seems to have taken this round without a doubt. As we observed though, there are many ways to look at this and what seems to stand out from these two giants, is the consumer. At the end of the day, it’s the consumer that in spite of these strange times, has shopped more than before, indicating that the situation is getting back to a semblance of normalcy.

    So Flipkart’s got the sales numbers but the consumer got deeper discounts on more products. As the old adage goes, ‘consumer is king’.

  • Prime Day 2020: Home categories fuel retail rivalry & desirable discounts

    Prime Day 2020: Home categories fuel retail rivalry & desirable discounts

    According to our preliminary analysis of Prime Day 2020, Amazon’s rivals offered more generous discounts within Home categories to stay competitive as more consumers invest in their homes this year.

    This year the COVID-19 pandemic has transformed consumers into homebodies who increasingly work, learn and shop from home. This year also marks the first time Prime Day took place in the Fall, jumpstarting the holiday sales season.

    At DataWeave, we wanted to know whether Prime Day 2020 lived up to the hype and how Amazon’s deals compared to other retailers’ discounts. Our analysis examines products across four popular Home categories: Bed & Bath, Furniture, Kitchen and Pet Care.

    Our Methodology

    We tracked the pricing of several leading retailers (Home Depot, Target, Walmart and Amazon) selling the Home categories of Bed & Bath, Furniture, Kitchen and Pet Care to assess their pricing and assortment strategies during this annual sales event. Our analysis focused on additional discounts offered during the sale to estimate the true value that the sale represented to consumers. Our calculations compared product prices on Prime Day versus the prices prior to the sale. The sample consisted of up to the top 750 ranked products across 16 popular product types for the home.

    The Verdict 

    Overall, Amazon reported the lowest price reduction in all Home categories (12.4%), compared to Target (22.1%), Home Depot (16.5%), and Walmart (15.1%). Yet Amazon reported the second-highest percentage of additionally discounted products (9.6% vs. 11.0% for Target).

    After Prime Day ended, certain retailers’ Home assortments saw more significant price increases than others. For instance, 88% of Target’s 760 products in Bed & Bath, Furniture, Kitchen and Pet Care received a price increase during the post-sale period, compared to 47% of Walmart’s 1005 products. Walmart’s everyday low price strategy helps to explain the difference between the two big box retailers.

    These results suggest that Prime Day 2020 may boost Amazon’s marketing and PR engagement yet its rivals offered the most generous deals in Home categories. As home-related categories’ sales soared during the pandemic, Amazon’s competitors offered deep discounts to stand out online and grow their market share. As such, consumers may want to embrace the habit of comparing multiple retailers’ websites to discover the best Prime Day deals in Home categories.

    Top product types by additional discount

    In Bed & Bath, Target offered the biggest average additional discount (27.4%) and Amazon offered the lowest (13.3%). Bed sheets and pillowcases were a popular product category for additional discounts across all four retailers, with Target offering the best average additional discount at 31.3%. Other popular product types among rival retailers included blankets, comforters and bathroom furniture.


    In Furniture, Home Depot (20.5%) offered the biggest overall additional discount, closely followed by and Target (19.2%). Living room furniture was a popular subcategory for all four retailers, with Home Depot offering the highest additional discount (29.1%). Other popular product types included furniture for the bedroom, home office, kitchen and dining room.

    In the Kitchen category, Target offered the biggest average additional discount for small appliances (21.8%), a subcategory in which all four retailers offered discounts. Within the large appliance subcategory, Walmart’s additional discounts were nearly triple Amazon’s (15.7% vs. 5.6%).

    Within the Pet Care category, Target offered the biggest average additional discount (18.5%). Cat food was a popular product category, with Target offering the best average additional discount (50.0%). Other popular product types across all four retailers included dog collars, leashes and dry dog food.

    Additional discounts across product “premiumness” levels

    Premiumness was calculated as the average selling price before the sale event. This was divided into low, medium and high premiumness levels, with high indicating higher selling prices.

    In Bed & Bath, most retailers showed an inverse relationship between their additional discounts and the products’ level of premiumness. Target offered the biggest additional discounts across all levels of premiumness, more than double Amazon’s discounts (27.2% vs. 12.3%). Target’s bold discounting strategy shows a commitment to protecting its competitive position across the entire Bed & Bath category.

    By far, Amazon offered the greatest percentage of additional discounts in Bed & Bath compared to its rivals across all levels of premiumness. Comparatively pervasive discounts help the e-commerce giant offer a greater variety of appealing deals within this category.

    In Furniture, most retailers showed a direct relationship between their additional discounts and the level of premiumness. Notably, Home Depot offered massive additional discounts at the high premium level, nearly triple Amazon and Walmart (34.5% vs. 12.7%). This move suggests Home Depot is serious about winning the business of upscale consumers in the Furniture category.

    Target differentiated its assortment by discounting by far the greatest portion of its Furniture at all premiumness levels (22.4%) and Home Depot discounted the least (4.4%). Amazon and Walmart distributed the greatest portion of their additional discounts to the moderate level of premiumness. Target’s strategy tries to attract all Furniture shoppers while Amazon and Walmart try to make their mid-market offerings affordable to more consumers.

    Across all levels of premiumness for Kitchen products, Target offered the biggest additional discounts, including almost double Amazon’s discounts at the medium level (22.5% vs. 13.4%). Target’s aggressive discounting shows a desire to be more competitive by attracting consumers at all levels of the Kitchen category.

    In the Kitchen category, most retailers offered a direct relationship between the proportion of additional discounts and the level of premiumness, yet Home Depot showed an inverse relationship. Amazon’s proportion of additional discounts across all levels of premiumness nearly tripled Home Depot’s (10.1% vs. 3.7%). This discount strategy shows Amazon’s willingness to offer shoppers deals across a broader variety of Kitchen items.

    In Pet Care, Walmart offered the highest overall additional discounts (16.2%), which could fortify its low-cost leadership position for pet lovers at all price points.


    While Target offered the greatest overall percentage of additional discounts in Pet Care, Amazon applied more discounts to the higher end of the premium spectrum and Target focused on the lower end.

    Additional discounts across visibility levels

    In Bed & Bath, Target offered the highest overall additional discounts across all levels of visibility (27.3%) and Amazon offered the lowest (12.4%). Amazon focused its additional discounts on the most visible Bed & Bath products to help online shoppers discover those items with ease and make them appealing enough to add to their cart.


    Amazon offered the lowest additional discounts in the Furniture category across all levels of product visibility. Yet, among the Furniture category’s most visible items, Amazon offered its highest additional discounts. Home Depot’s additional discounts approach was the most aggressive except among the lowest product visibility levels. Home Depot’s discount strategy shows a desire to compete for Furniture’s most visible items.

    In the Kitchen category, Home Depot consistently offered the lowest additional discounts among products at the higher visibility levels. Conversely, Target was the most aggressive in this category, offering additional discounts of up to 43.2% at moderate levels of visibility and double Home Depot’s discounts (26.3% vs. 13.4%) among the most visible items. Amazon may feel confident that men already choose Amazon for their apparel needs.

    In Pet Care, the retailers generally offered the most additional discounts for items in the middle of the visibility spectrum. Walmart offered the most aggressive additional discounts among the most visible Pet Care items, more than double Target’s discounts (13.5% vs. 6.5%).

    Overall, Prime Day 2020 offered an ideal time for Amazon to attract homebound consumers to invest in domestic products, yet its rivals offer much higher additional discounts in Bed & Bath, Furniture, Kitchen and Pet Care. How about other categories? Watch this space for more insights!

  • How Prime Day 2020 Deals Influenced Retail Pricing Strategies

    How Prime Day 2020 Deals Influenced Retail Pricing Strategies

    Our preliminary analysis reveals that Prime Day 2020 motivated Amazon’s rivals to offer deeper discounts in key categories to try to make their merchandise more magnetic and lure consumers away from the e-commerce giant.

    This year’s Prime Day is momentous, as the COVID-19 pandemic has encouraged more consumers to make online shopping a more regular habit. It also marks the first time Prime Day took place in the strategically significant final quarter of the year, kicking off the holiday sales season.

    At DataWeave, we wanted to know whether Prime Day 2020 lived up to the hype and how Amazon’s deals compared to other retailers’ discounts. Our analysis examines products across three popular categories: electronics, beauty and fashion.

    Our Methodology

    We tracked the pricing of several leading retailers (Best Buy, Target, Walmart and Amazon) selling consumer electronics, beauty and fashion to assess their pricing and assortment strategies during this annual sales event.

    Our analysis focused on additional discounts offered during the sale to estimate the true value that the sale represented to consumers. Our calculations compared product prices on Prime Day versus the prices prior to the sale. The sample consisted of up to the top 750 ranked products across 21 popular product types in consumer electronics, beauty and fashion.

    The Verdict

    Overall, Amazon reported the lowest price reduction in the Electronics, Beauty and Fashion categories (13.4%), compared to Best Buy (22.5%), Target (21.7%) and Walmart (16.3%). Yet Amazon reported the second-highest percentage of additionally discounted products (12.0% vs. 15.7% for Target).

    After Prime Day ended, certain assortments reflected more significant price increases than others. For instance, 97% of Target’s 158 products in Electronics, Beauty and Fashion had a price increase during the post-sale period, compared to 49% of Walmart’s 986 products. This discrepancy makes sense given Walmart’s everyday low price strategy.


    These results suggest that although Prime Day generates tremendous media buzz for Amazon, the most generous deals come from its rivals. To stand out and lure shoppers away from Amazon, competitors offered comparatively deeper discounts, especially in categories in which they want to grow their market share. This means online shoppers would be wise to compare prices across retailers’ websites to find the best cross-category deals on Prime Day.

    Top product types by additional discount

    In Electronics, Best Buy offered the biggest average additional discount (22.4%) and Amazon offered the lowest (9.4%). Tablets were a popular product category among Amazon, Best Buy and Walmart, with Best Buy offering the best average additional discount at 19.1%. Other popular product types among rival retailers included TVs, desktops and laptops.


    In Beauty, Target (13.2%) and Walmart (13.1%) almost tied for the biggest overall additional discount. Makeup was a popular beauty subcategory, with Walmart offering the highest additional discount at 19.7%. Other popular product types included hair care, skin care and fragrance.

    In Men’s Fashion, Target offered the biggest average additional discount of 28.1%. Suits and blazers were a popular fashion subcategory, in which Target offered the highest average additional discount at 50.0%. Other popular product types included T-shirts and tank tops, shirts and jeans.


    Within the Women’s Fashion category, Walmart offered the biggest average additional discount of 20.5%. Tops and tees were a popular product category across all three fashion rivals, with Walmart offering the best average additional discount at 23.6%. Other popular product types included dresses, jumpsuits and jeans.

    Additional discounts across product “premiumness” levels

    Premiumness was calculated as the average selling price before the sale event. This was divided into low, medium and high premiumness levels, with high indicating higher selling prices.


    In Electronics, Amazon showed a direct relationship between its additional discounts and the level of premiumness; Best Buy and Walmart showed an inverse relationship. Best Buy offered the biggest additional discounts across all levels of premiumness, nearly triple Amazon’s discounts (20.7% vs. 7.0% ) at the low end of the premium spectrum, and more than double Amazon’s discounts (18.5% vs. 7.3%) at the moderate level. Best Buy’s discounting strategy show it’s serious about protecting its competitive position in electronics.

    Best Buy and Walmart offered the most additional discounts at the high end of the premiumness spectrum, making both retailers more competitive in the high-ticket electronics category. By contrast, Amazon offered nearly double the additional discounts of its rivals within the low segment, which helps to protect its margins while making products even more affordable and appealing.


    In Beauty, Amazon and Walmart offered their biggest additional discounts at the low premium level, possibly to position those products as loss leaders. Meanwhile Target nearly doubled and tripled its rivals’ additional discounts at the high premium level (30.0% vs. 16.0% for Walmart and 11.0% for Amazon) to stand out in this intensely competitive category.

    Amazon stood out by discounting the greatest portion of its Beauty offerings at all premiumness levels and Target discounted the least. Amazon and Walmart showed a direct relationship between their distribution of additional discounts and the beauty products’ premiumness level.


    Across all levels of premiumness for Men’s Fashion, Target offered the biggest additional discounts, including more than triple Amazon’s discounts at the high end (38.4% vs. 12.4%). Target’s aggressive discounting shows a desire to be more competitive within the most premium segment of Men’s Fashion.

    Amazon’s additional discounts accounted for the greatest percentage of its Men’s Fashions across all levels of premiumness, nearly triple Target’s overall average (15.4% vs. 5.3%). This approach shows Amazon’s willingness to give shoppers deals across a broader variety of Men’s Fashion items.

    In Women’s Fashion, Target’s and Walmart’s overall additional discounts were comparable, and Amazon’s discounts were consistently the lowest among all levels of premiumness. Walmart offered its most generous discounts at the low and medium level of premiumness, which could reinforce its low-cost leadership image.

    While Amazon and Target offered a comparable overall percentage of additional discounts in Women’s Fashions, Amazon applied more discounts to the higher end of the premium spectrum and Target focused on the lower end.

    Additional discounts across visibility levels

    In Electronics, Amazon offered the lowest average additional discounts across all levels of visibility. Among the most visible electronics, Amazon and Best Buy gave the most visible electronics higher additional discounts to make those items more alluring to help consumers find the items fast and add them to their online baskets.

    Among the Beauty category’s most visible items, Amazon and Target offered their highest additional discounts. Yet Target was most aggressive in beauty, offering a 30% additional discount at the most visible end of the spectrum as well as at the least visible. This discount strategy shows Target wants to compete in Beauty, spreading its generosity beyond an exclusive focus on highly visible items.

    In Men’s Fashion, Amazon consistently offered the lowest additional discounts at all visibility levels. Target was the most aggressive in this category, offering additional discounts of 50% at moderate levels of visibility and 34.5% among the most visible items. Amazon may feel confident that men already choose Amazon for their apparel needs.

    In Women’s Fashion, the retailers generally offered the most additional discounts for items at the higher end of the visibility spectrum. Walmart offered the most aggressive additional discounts among the most visible items in Women’s Fashion to try to boost its market share in this category.

    Overall, while Prime Day is an effective way for Amazon to boost brand engagement, its rivals overwhelmingly offer higher additional discounts in Electronics, Beauty and Fashion. How about other categories like the booming Home space? Watch this space for more insights!

  • Food Delivery Boom Fuels Competition Among Restaurants

    Food Delivery Boom Fuels Competition Among Restaurants

    This year, homebound consumers crave the convenience of food delivery.
    Growing 20% since 2015, restaurant delivery has sparked intense rivalry to reach consumers’ homes. Although the pandemic led to $165 billion in lost sales industry-wide between March and July, experts predict online food delivery sales will reach $220 billion by 2023, accounting for 40% of total restaurant sales.[1,2]

    This massive market opportunity makes food delivery an urgent priority for restaurants to stay competitive and solvent during the pandemic. This year nearly one in six U.S. restaurants have closed either permanently or long-term.[3]

    Also, 40% of U.S. operators say they will likely be out of business within six months if economic conditions persist and 60% of Canadian restaurants could close permanently by November.[4,5]


    COVID-19 compounds market complexity

    Powerful market trends are rattling restaurants. During the pandemic, nearly 70% of operators have added third-party delivery to lift sales.[6]

    This year, third-party delivery from food delivery apps like Uber Eats, Grubhub and DoorDash will grow 21% over 2018.[7] The global market for cloud kitchens (also called ghost kitchens or virtual kitchens), commercial kitchens intended for delivery-only orders, will grow from $650 million in 2018 to $2.6 billion by 2026.[8]


    To avoid the need to rely on delivery partners, many chains invest in their own last-mile delivery capability to serve their fleet of restaurants.
    E-grocery sales are poised to surge 40% in 2020 and meal kits have boomeranged back into popularity, nearly doubling 2019 sales.[9, 10]

    Consumers demand speed to keep their food fast, fresh and hot. Prompt service matters, as one survey found when consumers face a food delivery issue, 93% want it resolved within 10 minutes.[11]

    The recession and job losses mean more consumers now need affordable food options. Meanwhile, restaurants are investing more in technology to modernize operations for efficient omnichannel service.

    How restaurants are adapting to 2020’s disruption


    Restaurant prices have risen during the pandemic to cover operating costs. Third-party delivery fees have led 41% of consumers to prefer to order food by contacting the restaurant directly (vs. 16% for third-party delivery).[12] To optimize pricing competitiveness, more restaurants now compare their delivery fees and offerings with rivals’ to spot and correct gaps, and keep their prices affordable.

    To streamline operational processes and costs during the pandemic, 28% of restaurants shrank their menus.[13]

    For clarity on which items to keep, operators now use data insights on restaurant listings and menu items down to the ZIP code level. This information also helps them decide whether to adapt to consumers’ diverse tastes, including vegan, gluten-free and organic, for competitive local assortments.


    Outperform rivals: Restaurant operators seek proof of their brand visibility on food delivery apps’ homepages.


    Restaurants have discovered consumers welcome reasons to celebrate at home this year. One chain’s weekly virtual happy hours on Facebook Live drew 80,000 participants and a $40,000 sales increase from delivery and takeout orders.[14]

    More restaurants now compare their promotional strategies with rivals’ to evaluate marketing performance, including homepage discoverability and visibility ranking, to ensure consumers find their brand online with ease.

    Delivery speed and precision also matter. A survey found 70% of consumers had food delivery order complaints, including late delivery (50%), incorrect order (37%) and cold or stale food (36%).[15] Using accurate geographic data can help restaurants improve speed and the customer experience.

    To gain a competitive advantage in today’s booming food delivery market, a growing number of leading chains and food delivery providers are collaborating with DataWeave to access actionable insights to make better strategic and operational decisions faster. Using trusted insights to make data-driven pricing, menu and promotional decisions help restaurants save time, reduce risk and gain clarity in today’s evolving market.

    Applying DataWeave’s accurate, up-to-date information also helps restaurants deliver affordability, convenience and variety to remain responsive to consumers and agile among competitors. To see how DataWeave helps restaurants stay relevant and competitive, contact us today.


    [1] Rogers, Kate. Winter is coming, bringing a new challenge to already-struggling restaurants. CNBC. September 14, 2020.
    [2] Zahava Dalin-Kaptzan. Food Delivery: Industry Trends for 2020 and beyond. Bringg. April 30, 2020.
    [3] Klein, Danny. 100,000 Restaurant Closures Expected in 2020. QSR. September 14, 2020.
    [4] Rogers, Kate. Winter is coming, bringing a new challenge to already-struggling restaurants. CNBC. September 14, 2020.
    [5] Charlebois, Sylvain. Don’t Want to Save the Restaurant Industry? Fine, but Use it to Save the Canadian Economy. Retail Insider. September 11, 2020.

    [6] Rogers, Kate. Winter is coming, bringing a new challenge to already-struggling restaurants. CNBC. September 14, 2020.
    [7] US Food Delivery App Usage Will Approach 40 Million Users in 2019. eMarketer. July 2, 2020.
    [8] Levy, Ari. Virtual Kitchen, founded by ex-Uber execs to help restaurants with delivery, raises $20 million. CNBC. Sept. 8 2020
    [9] Redman, Russell. Online grocery sales to grow 40% in 2020. Supermarket News. May 11, 2020.
    [10] De Leon, Riley. How the coronavirus pandemic delivery surge created a lifeline for Blue Apron meal kits. CNBC. May 22, 2020.
    [11] Guszkowski, Joe. Delivery services have room to improve, consumers say. Restaurant Business Online. Sept. 1, 2020.
    [12] Guszkowski, Joe. Consumers’ desire to order directly from restaurants is a big opportunity. Restaurant Business Online. Aug. 27, 2020.
    [13] Romeo, Peter. Best practices for weathering a second COVID wave. Restaurant Business Online. Aug. 28, 2020.
    [14] Ibid. 
    [15] Guszkowski, Joe. Delivery services have room to improve, consumers say. Restaurant Business Online. Sept. 1, 2020.

  • Introducing the CPG Brand Monitor by DataWeave

    Introducing the CPG Brand Monitor by DataWeave

    As DataWeave continues to engage with brands and manufacturers of all sizes, a consistent theme keeps emerging, “click and collect tracking”. Right now, brands rely on manual-store checks or waiting upwards of two weeks for a retailer to report sales data, which reveals low sales because a product is out of stock. In addition, there are always questions about the local price of your products compared to top competitors in the category. This is where DataWeave’s CPG Brand Monitor solution can help. 

    Click here for a quick tour of our dashboard.

    What we cover?

    On a daily basis, we track over 13,000 variant level SKUs across 100 stores, via seven of the top grocery retailers. We have selected the largest grocers in each region of the US, to allow for the widest coverage. These grocers include Albertsons/ Safeway in the west, HEB in Texas, Kroger in the upper mid-west, Wegmans in the Mid-Atlantic and Publix in the Southeast. 

    How does it work?

    In the application, you will see the list of all the SKUs we’re covering, with filters on the left side of the page to help with navigation. You can sort by Brand, Category, Store/ City, State, etc. After the filters are applied, the SKU list will be displayed based on these filters.  On the right side of the screen, you will see all the product level details including a 7-day price history, individual store level pricing/ stock availability and exportable charts and graphs. 

    How do I get access?

    Simply access the CPG Brand Monitor page, fill in your credentials via “Start Free Trial” and your login will be sent directly to your inbox. No commitments or phone calls are needed to test out the data. After a few days, our team will be in touch to make sure you understand how to navigate the tool and take you through our subscription options.   

    What else do we offer?

    DataWeave also offers a full Digital Shelf Analytics suite that covers Share of Voice (keyword, navigation and banner audits), Content Audit/ Optimization, Ratings/ Review Sentiment Analysis, Promotional Analysis, and much more. 

  • JioMart Launches Online Grocery Store

    JioMart Launches Online Grocery Store

    JioMart, the online channel for Reliance Retail Limited, launched in December 2019 as a contender in the e-grocery segment. Currently in India, this segment is being dominated by bigbasket, Amazon, Flipkart Supermart, Grofers, etc. After less than a year and from their initial launch in Mumbai, they now have their presence in 205 cities across India.

    According to their recent press release, they claim to be clocking over 250,000 daily orders, compared to bigbasket’s 220,000 and Amazon’s 150,000. To get an understanding of this rapid penetration, we had a look at the PIN codes that JioMart serves, spanning the country.

    The map below represents the percentage of PIN codes that are being served by JioMart’s online grocery in each state:

    **Disclaimer -Map for representation purposes only

    While states like Chandigarh, Delhi and Punjab in the North are covered extensively, JioMart has a stronger distribution in the Southern states.

    The image below shows the top ten states in India where JioMart’s online grocery has the highest presence:

    They’re yet to launch in 14 more states but it’s interesting to note that in this limited time, they’ve managed to cover 14% of the PIN codes in the country and all this, in the midst of lockdowns.

    Assortment

    To get an idea of the assortment in their range, we analyzed select PIN codes across three tiers of cities in India. The parameters we looked at were categories, brands and discounts to get an understanding of how JioMart is stacking up against its competitors. The cities we examined were:

    • Tier 1 – Bangalore, Delhi, Kolkata, Mumbai
    • Tier 2 – Ahmedabad, Jaipur, Kochi, Visakhapatnam
    • Tier 3 – Mohali, Mysore, Nagpur, Siliguri

    In its range, they offer eight broad categories, of which, we focussed on the four that offer the highest selection of products: home care, personal care, snacks & branded food and staples.

    The table below represents the average selection of products offered across each tier.

    Overview of discounts offered and the private label split

    Out of the assortment we looked at in the three tiers, we noticed that an average of 18% of the products are JioMart’s private labels. What stood out further is that private labels accounted for 48% in the Staples category and 24% in Personal Care. We noticed this trend (increase in the private label) when we did an analysis of Amazon.

    When it comes to discounts, we noticed that a near-total 91% of the products listed are being sold at a discount. Out of this, the highest discounts were witnessed in the Home Care and Staples categories.

    The brands with the highest number of products listed were Good Life, Reliance, Amul, Gillette and items sold loosely. All these accounted for 14% of the assortment. Out of these, Good Life, Reliance and the loose items are JioMart’s private labels.

    Competitor analysis

    To get an idea of where JioMart stands with relation to its competitors, we focussed on food and essentials in the Tier 1 cities. The table below highlights the number of product offerings in each category:

    It’s clear that in these categories (food and essentials), JioMart has the least number of products on discount. There’s no doubt that bigbasket is miles ahead in its product range/ assortment.

    To get a better idea of the discounting patterns, we analyzed the same categories to get a count of the number of products being discounted, as well as the average discount being offered. 

    We noticed that JioMart bookended our analysis – the least average discount, across the most number of products. Grofers offered the highest average discount of 23% with Flipkart Supermart and bigbasket closely behind. Lastly, bigbasket had the least number of products on discount with a little over 53%.

    Conclusion

    JioMart launched during a tumultuous and unprecedented time; the COVID-19 pandemic and the subsequent nation-wide lockdowns. Given this trial by fire, they managed to make an impact in this highly competitive space. Their expansion plans of tying up with mom and pop stores to fortify their penetration, had to take a back seat due to the ongoing situation but is sure to resume once conditions improve. This set-back did not however deter JioMart from attracting strategic investments from Facebook, Google and 12 other investors  in a span of 3 months. 

    In a study by Goldman Sachs, it found that India’s e-commerce business is expected to grow at a compound annual growth rate of 27% by 2024, resulting in a $99 billion market share. What’s even more shocking is that 50% of this market will be captured by Reliance Industries. It, therefore, stands to reason that all we’ve seen and heard of so far, is merely the tip of the iceberg and there’s surely more to come in the near future.

  • Market Intelligence Platform with Kenshoo

    Market Intelligence Platform with Kenshoo

    We’re thrilled to announce that we have teamed up with Kenshoo to offer an integrated marketing solution that combines DataWeave’s digital shelf analytics and commerce intelligence platform with Kenshoo’s ad automation platform. This in turn, provides better recommendations on promotions to retailers and consumer brands.

    As e-commerce surges, consumer brands can now promote their products through retail-intelligent advertising. Product discoverability, content audit, and availability across large marketplaces can be critical to a brand’s success. Using DataWeave’s digital shelf solutions, Kenshoo now can offer marketers greater visibility into a brand’s performance.

    Even large retailers and agencies can use our commerce intelligence platform to improve their price positioning, address category assortment gaps, and more.  

    Through this partnership, Kenshoo – a global leader in marketing technology, can help its significant base of consumer brands and retailers invest their marketing dollars intelligently and in a timely manner.

    At DataWeave, we have constantly strived to bring in a holistic approach to help our customers optimize their online sales channels. This partnership furthers our resolve in this direction. As we collectively strive to adjust to a post-COVID-19 world, we are observing an acceleration towards digital commerce. This acceleration and change in consumer behavior is going to be a lasting change, creating significant growth opportunities for both DataWeave and Kenshoo.

    With this partnership, we look forward to helping our customers make timely, intelligent, and data-driven decisions to grow their business.

  • Amazon Triples Down on its Private-label Product Portfolio

    Amazon Triples Down on its Private-label Product Portfolio

    Among Amazon’s most prominent and decisive steps in achieving retail dominance over the last few years has been its focus on expanding its private label portfolio.

    The most recent collaborative report between DataWeave and Coresight Research determines that Amazon’s private label assortment in early 2020 has grown three-fold over the previous two years, most of which is in categories outside of apparel and accessories.

    In addition, the report covers various facets of Amazon’s private label penetration and strategy. These include the size of Amazon’s private label portfolio, the distribution of private label products by category, the product ratings and number of reviews, the average price points across products and brands, and more.

    Our detailed and proprietary Amazon private label dataset includes information on over 20,000 products and 111 brands.

    Some of our key findings are:

    • Amazon’s private-label offering spans 22,617 products across 111 identified private labels.
    • Around half of the private-label products are in clothing, footwear and accessories, which is lower than the three-quarters found in our similar research from June 2018, indicating Amazon’s push into a broader range of categories.
    • The average Amazon private-label product generates a customer rating of 4.3 out of 5, representing positive customer feedback overall.

    Amazon’s Private-Label Offering Spans 22,617 Products across 111 Identified Private Labels

    The number of private-label products—22,617—is more than triple the total of 6,825 from June 2018 (see our previous report). The number of private-label brands also increased substantially (up 50% versus June 2018), indicating that the e-commerce giant has stepped up its private-label strategy.

    Around Half of Private-Label Products Are in Clothing, Footwear and Accessories

    Just over half of Amazon’s private-label products are in “clothing, footwear and accessories,” versus almost three-quarters when we undertook similar research in June 2018, indicating Amazon’s push into a broader range of categories. Other categories that feature more than 1,000 private-label products include “home and kitchen,” “grocery and gourmet food” and “tools and home improvement.”

    Source: DataWeave/Coresight

    The Average Amazon Private-Label Product Generates a Customer Rating of 4.3 out of 5

    We examined feedback provided by Amazon’s private-label customers: Customer satisfaction can be measured by the average star rating that customers have left in reviews. We chart both average star rating and average number of customer reviews per product in the graph below.

    The average Amazon private-label product generates a customer rating of 4.3 stars out of 5, suggesting overall solid customer satisfaction levels.

    Source: DataWeave/Coresight

    The full report is available for Coresight’s premium subscribers. It includes further details of categories and subcategories that suggest longer-term implications—including how Amazon targets a niche customer base through specific category labels but appeals to broader consumer needs by offering multicategory labels.

    To access DataWeave’s proprietary database on Amazon’s private label brands and products, reach out to us today!

  • Black Friday 2019 Pricing for Online Furniture

    Black Friday 2019 Pricing for Online Furniture

    For today’s shoppers, instant gratification is the need of the hour. It’s, therefore, no surprise that furniture e-retail has been picking up steam over the last decade. What was once a norm to physically touch and feel before making a purchase, is now just a few clicks away. Retailers have bridged the gap by making the purchase process as seamless as possible – easy finance options, hassle-free returns and variety.

    While several factors play a role in driving consumers to shop furniture goods online, price is the primary motivator, as is the case with most popular product categories sold online.

    During Black Friday 2019, DataWeave performed an analysis on a sample of 23,000+ products across six of the top furniture retailers – Amazon, Home Depot, JCPenney, Target, Walmart and Wayfair. Ten product types were covered in the furniture category (such as Beds, Bookcases, Mattresses, Sofas, etc.) and the analysis focused on the top 500 ranked products of each product type.

    To get an accurate depiction of the additional markdowns during the sale, we took the mode of the prices for the preceding week and compared them with that during the sale.

    Additional markdowns

    Target (25%) and Home Depot (21%) marked down their prices most aggressively during the sale.  JCPenney and Wayfair stood out for offering additional markdowns on the highest portions of their ranges (67% and 46% respectively), even though the average markdown percentage was fairly conservative. Amazon and Walmart were steady as usual, with additional markdowns of 8% and 10% on 15% and 17% of their assortment, respectively.

    Premiumness

    To further understand the furniture pricing strategies of these retailers, we categorized their products into buckets of how expensive or cheap the product is (High, Medium, and Low in terms of price), relative to the rest of the products hosted by the retailer, and studied how the additional markdowns varied across these buckets. Where the MRP was not displayed, the most expensive price of the product during the holiday period prior to Black Friday was considered to define the “premiumness” of the product.

    Two patterns clearly stand out from this analysis. Most of the retailers remained relatively equitable between their premium categories with nothing significant to report in terms of varying markdowns. Home Depot and and JCPenney are the only exceptions here, but not by much.  The other interesting insight is that the percentage of marked-down products had a near unanimous pattern of the high level being the most covered, followed by the medium and then low.

    Therefore, while there wasn’t a significant variation in the average markdown across premiumness levels, a larger portion of the high-premium goods were consistently offered at a discount across all retailers.

    Popularity

    Much like our premiumness categorization, we investigated products based on their popularity levels as well. We’ve defined popularity using a combination of the average review rating and the number of reviews for each product, condensed to a scale of low, medium and high.

    We observe slightly different furniture pricing strategies adopted by retailers across popularity levels. While Home Depot, Amazon, and Wayfair chose to provide higher markdowns on their more popular products, Target, JCPenney, Walmart chose to provide higher markdowns on their least popular products. In addition, a larger portion of the least popular products were consistently offered on discount by almost all retailers.

    In combination with our findings across premiumness levels, we can surmise that part of the strategy of most retailers was to liquidate their stock of expensive and unpopular products during the sale.

    Price Change Activity

    As part of our analysis, we also tracked the level of pricing activity across retailers over the last week of November, in terms of the number of price changes made as well as the average price variation for each retailer.

    In general, we can see that Amazon and Walmart  consistently made several price changes through the week, though the average magnitudes of these price changes were relatively low. This echoes the pattern we’ve observed through our analysis of other product categories during the sale event, as well.

    Also, we see an almost coordinated increase in the number of price changes and the average magnitude across the 27th and 28th of November. This is likely an attempt by the retailers to get a head start on Black Friday deals.

    An unusual and interesting pattern was observed with Wayfair, which started out the week with the most changes at 2500. It then tanked the next day and hovered around 500 till the 28th, only to spike to 2500 again. All these changes though, had their variation in and around 5%.

    In summary, its interesting to observe how different retailers approached the much-anticipated holiday season sale events differently. As one might expect, there are significant variations among retailers in the aggressiveness of discounting activity as they approached Black Friday, and on Black Friday itself. Contrasting pricing strategies for popular and premium goods were also observed.

    If you would like to learn more about the pricing of top U.S. retailers across other product categories like consumer electronics, fashion, and beauty & health, check out our series of articles on Black Friday 2019.