Lessons from Kroger, Albertson’s, and Safeway’s Optimized Online Positioning
As consumers continue their migration to online shopping through and after the pandemic, Halloween shopping is no exception.
If that’s the new paradigm, what clues should retailers and brands be looking for to enhance their sales? With Halloween around the corner, the analyst team at DataWeave wanted to see how successfully grocers are partnering with brands to prepare for the influx of online Halloween shoppers. We tracked insights from September 14 to 24, 2021, using data from Kroger, Albertson’s, and Safeway websites to understand the preparedness of each retailer, their partnered brands, and how their online strategies compare with one another.
There are hundreds of ways for a consumer to search for a brand’s products online and of critical importance, almost 50 percent of traffic across the top 1000 retailers come through search. At the same time, consumers are becoming less brand conscious. This is a significant development, and there are significant ramifications to consumers searching for products using generic category specific keywords without including brand names in the search. Consequently, we can’t sufficiently stress how understanding online channel experiences is critical to successful outcomes. Retailers and brands alike need an integrated view of how to improve their discoverability and share of search by considering all touchpoints in the digital commerce ecosystem.
The Importance of Product Descriptions, Assortment, Sizes, Price Points
With 75 percent of people never scrolling past the first page of a website when searching for the goods they desire, getting products to page one is imperative to a brand’s success. While in-store, festive displays will help drive traffic and availability awareness, the ‘digital shelf’ is a totally different locus of opportunity. Here, brands rely on proper product descriptions, the right assortment, sizes, and competitive price points to stand out among the crowd and modify their positioning, given each retailer’s consumer base and assorted competitive brands.
Optimizing the Digital Shelf and leading Share of Search for page one across all retail websites isn’t achievable overnight, but it is never too early or too late to start, given the 24/7 visibility your products have online. When it comes to Halloween candies, confectionery brands must consider many factors when differentiating their online positioning, such as finding the ‘sweet spot’ for pricing, size, and variety within each product offered, and knowing the right and wrong times to drive promotions. Additional elements to consider when introducing seasonal candies include cannibalization of non-holiday inventory, which can increase spoilage for aged inventory, or if holiday items are successful, could cause an abundance of markdown items to be sold before replacement inventory can be ordered.
To better understand what retailers are doing—or should be doing—to optimize their Halloween holiday sales, we turned to our DataWeave Digital Shelf Analytics data to answer these questions:
- Which brands and products are dominating “Share of Search” page one results across all three retailer websites?
- How do discounts and promotions vary among candy brands and retailers?
- How does each retailer use Halloween-specific and ‘variety’ labeling within the product descriptor to differentiate their holiday season assortment?
- What sizes of candy packages is each retailer offering, and how does this play out in online positioning?
Winning Candy Brands
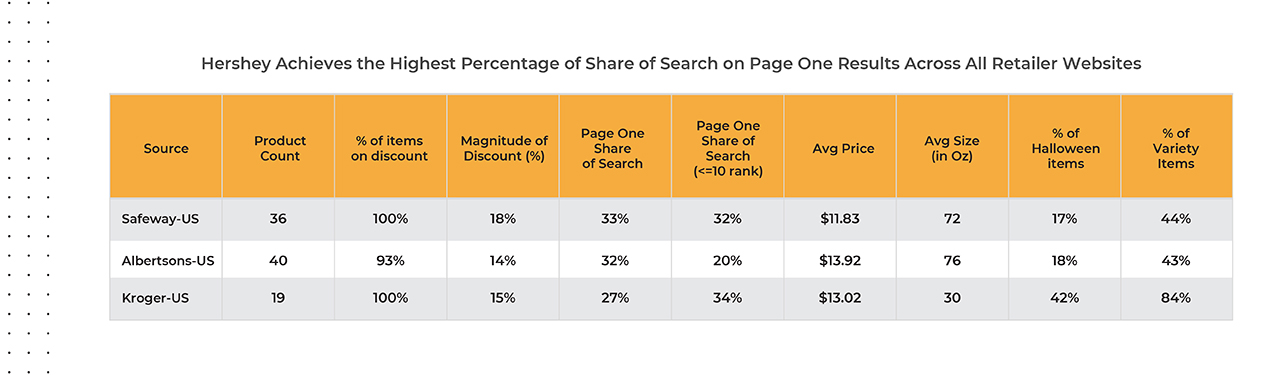
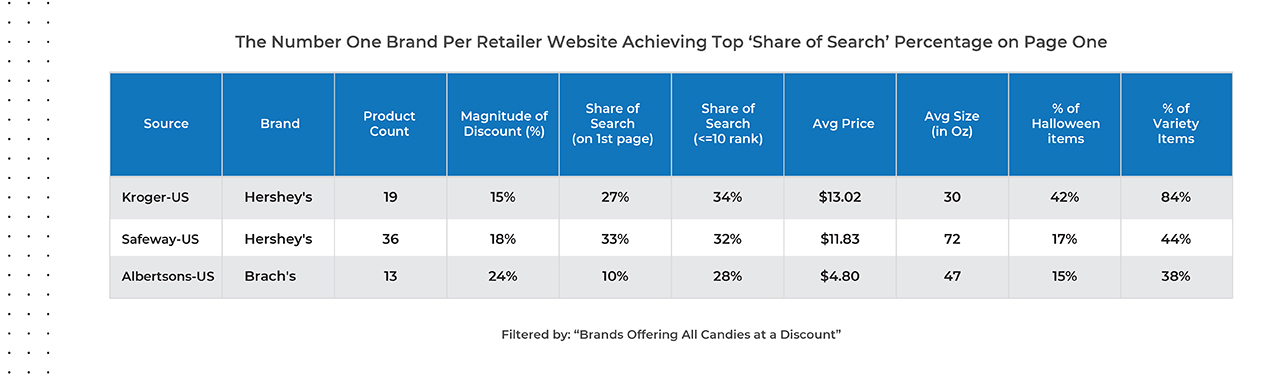
Which Halloween candies are people searching for—and presumably buying? Our data shows that Hershey’s branded candies achieved the greatest page one ‘Share of Search’ results across all three retailers’ websites—Albertson’s, Kroger and Safeway. This was unsurprising, given their total SKU count as well as the brand loyalty Hershey’s steadily maintains throughout the year. There is a high likelihood of consumers buying what they see on page one, so in our analysis, Hershey’s has the best chance of ‘winning’ this holiday season within all three of these retail channels.
That said, looking more specifically at how candy items are labeled and bundled adds another layer of insight to how candy brands are performing at each of these retailers.
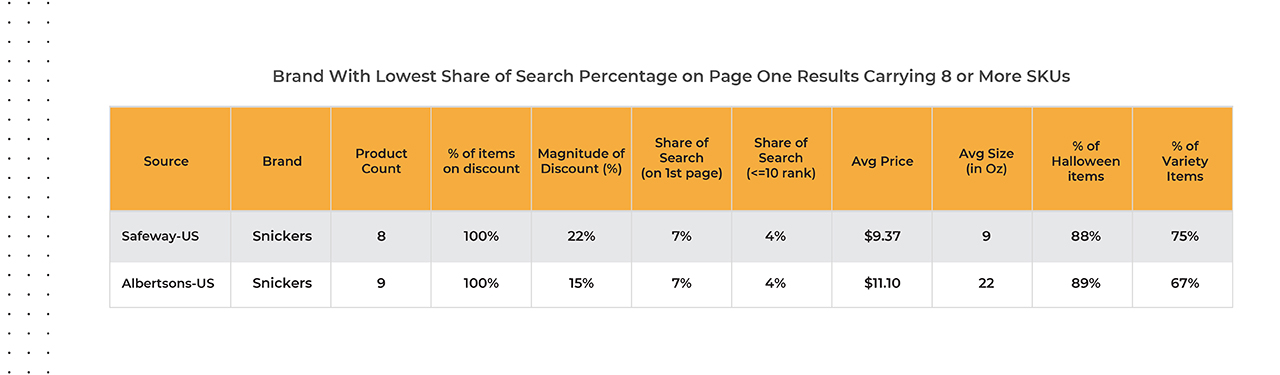
Historically speaking, Snickers is almost always within the top five confectionery brands sold during the Halloween season, but with the migration of more consumers shopping online, Mars may be leaving opportunity on the table this year. Our data shows that Snickers had the lowest Share of Search percentage on page one results on Safeway.com and Albertson’s.com for brands carrying 8 or more SKUs each, indicating they will most likely not make the first page results—and therefore may end up as a clearance item after Halloween if relying on online promotional efforts to achieve sales goals.
What Size Candy Packages Are Retailers Carrying/Betting On?
For example, Albertsons.com and Safeway.com’s assortment includes 124 SKUs and 108 SKUs respectively with most of those items falling within the 5 to 16-ounce (averaging 25 percent) and 32 to 64-ounce (averaging 29 percent) sizes, Kroger.com is betting on a ‘smaller is better’ strategy, with a majority (63 percent) of their candies sold in the 5 to 16-ounce package size.
The average Hershey candies available through all three retailers happen to be much greater in size and price point, on average, than other top ranked items, and while these larger items appear to mostly be variety packs, a majority are not labeled as ‘Halloween’ candy.
How Important Is Halloween-Specific Branding?
Our data shows that Kroger.com included the name ‘Halloween’ within the product description for most (around 80 percent) of the candies sized 16 ounces or smaller, and overall have labeled more than two-thirds of their total candy items sold as ‘Halloween.’ This indicates they are staged well for the peak of the seasonal demand and anticipate their shoppers to buy smaller unit sizes, comparatively speaking.
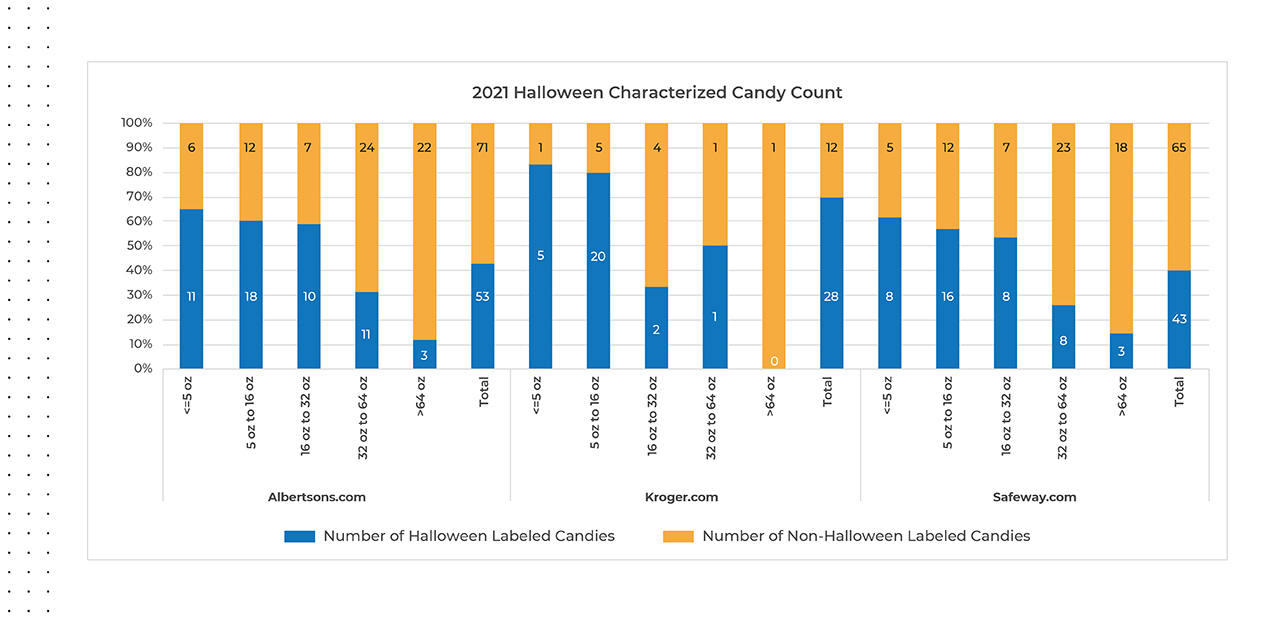
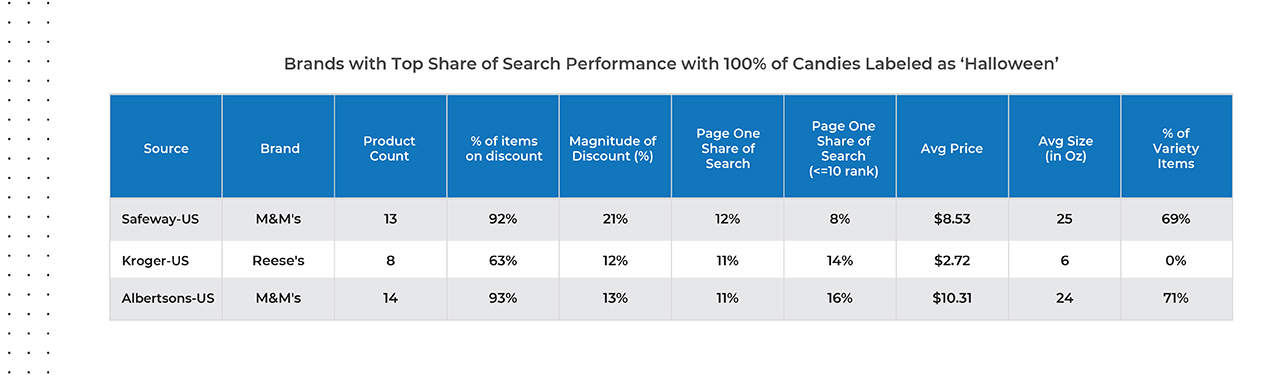
Taking a closer look at all items positioned as ‘Halloween’ across the three retailer websites, Hershey’s brand Reese’s is set for success at Kroger.com for total Share of Search percentage, considering they carry eight Reese’s, non-variety SKUs. Competing in the audience of others leading with variety packs indicates the weight the Reese’s brand carries and also indicates they will also have a great likelihood of success for increased sales this Halloween season.
Mars M&M’s brand came out on top at Safeway.com and Albertsons.com within the ‘Halloween’ labeled SKUs, but a majority (around 70 percent) of these are variety packs that leads with the M&M’s brand versus an M&M’s only bag.
How Much (Less) Are People Paying for Halloween Candy?
To determine whether candy promotions are increasing Share of Search, DataWeave measured the average promotional discount these retailers and top candy brands are offering online. When looking only at brands offering discounts on 100% of the SKUs they carry within each retailer, Brach’s brand is performing best on Albertson’s.com, and Hershey products are positioned at the top for Kroger.com and Safeway.com.
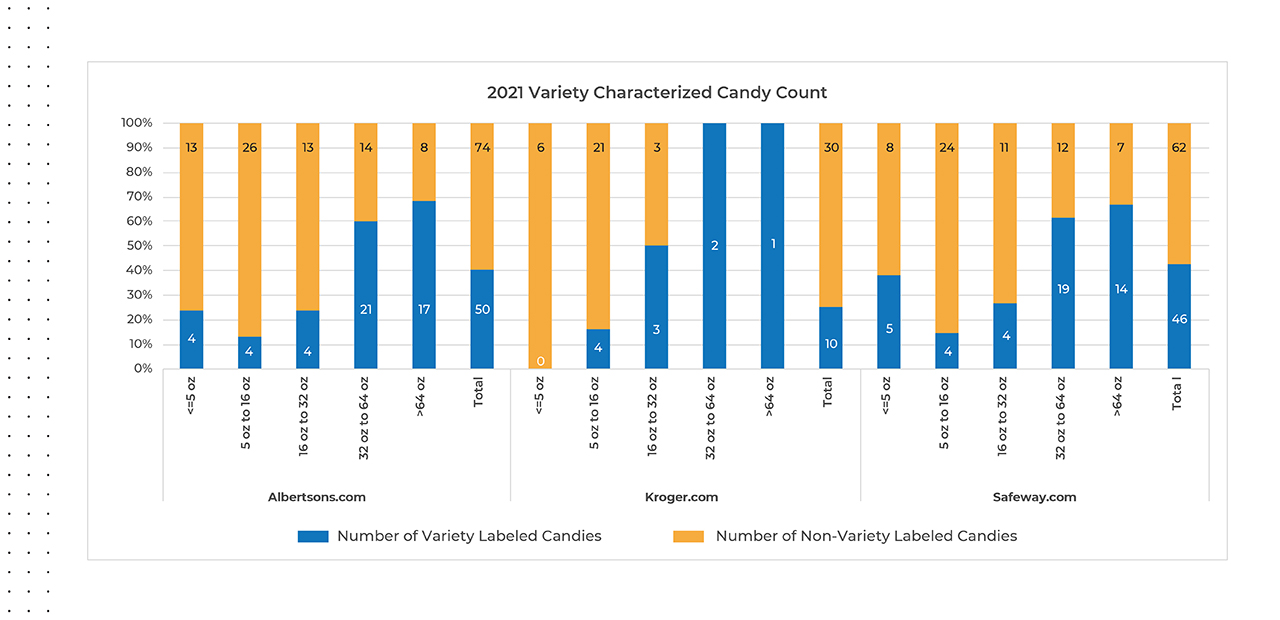
Do Consumers Search For ‘Variety’ Candy Bags, or One-Product-Only Bags?
DataWeave tagged the word ‘variety’ and found that across all three retailers’ websites, non-variety candy bags take up a greater overall Share of Search than ‘variety’ bags. Either this isn’t an important search word or retailers could try adding ‘variety’ to product descriptions to increase Share of Search.
Time to Make a Change
Getting products to page one on retailers’ websites can improve sales by as much as 50 percent, but determining the right levers to pull to get there is no easy feat. Based on our preliminary analysis of Halloween insights, our advice to confectionery brands this Halloween season is to invest now to increase visibility to the fast-changing market, to get orders right and on time, establish effective pricing and promotional plans, and get the right candies in stock, to the right locations. Retailers able to get an end-to-end view of the online competitive landscape will be able to make calculated marketing decisions that stand to help generate growth and profitability.
We are now within the prime Halloween shopping season, given that 55 percent of candy sales usually happen in the last two weeks of October (According to Timothy LeBel, President of U.S. Sales for Mars Wrigley). With online sales still growing as consumers have shifted their comfort level in buying more online, retailers should be looking for ways to optimize their product positioning, increase their Share of Search, to improve the likelihood of consumers ordering their brand’s candy to ply those Trick-or-Treaters knocking on their doors.
About DataWeave
DataWeave is a leading provider of advanced sales optimization solutions for e-commerce businesses, consumer brands and marketplaces. The AI-driven proprietary technology and language-agnostic platform aggregates consumable and actionable Competitive Intelligence across 500+ billion data points globally, in 25+ languages, with insights to performance for more than 400,000 brands across 1,500+ websites tracked across 20+ verticals, to ensure online performance is always optimized.
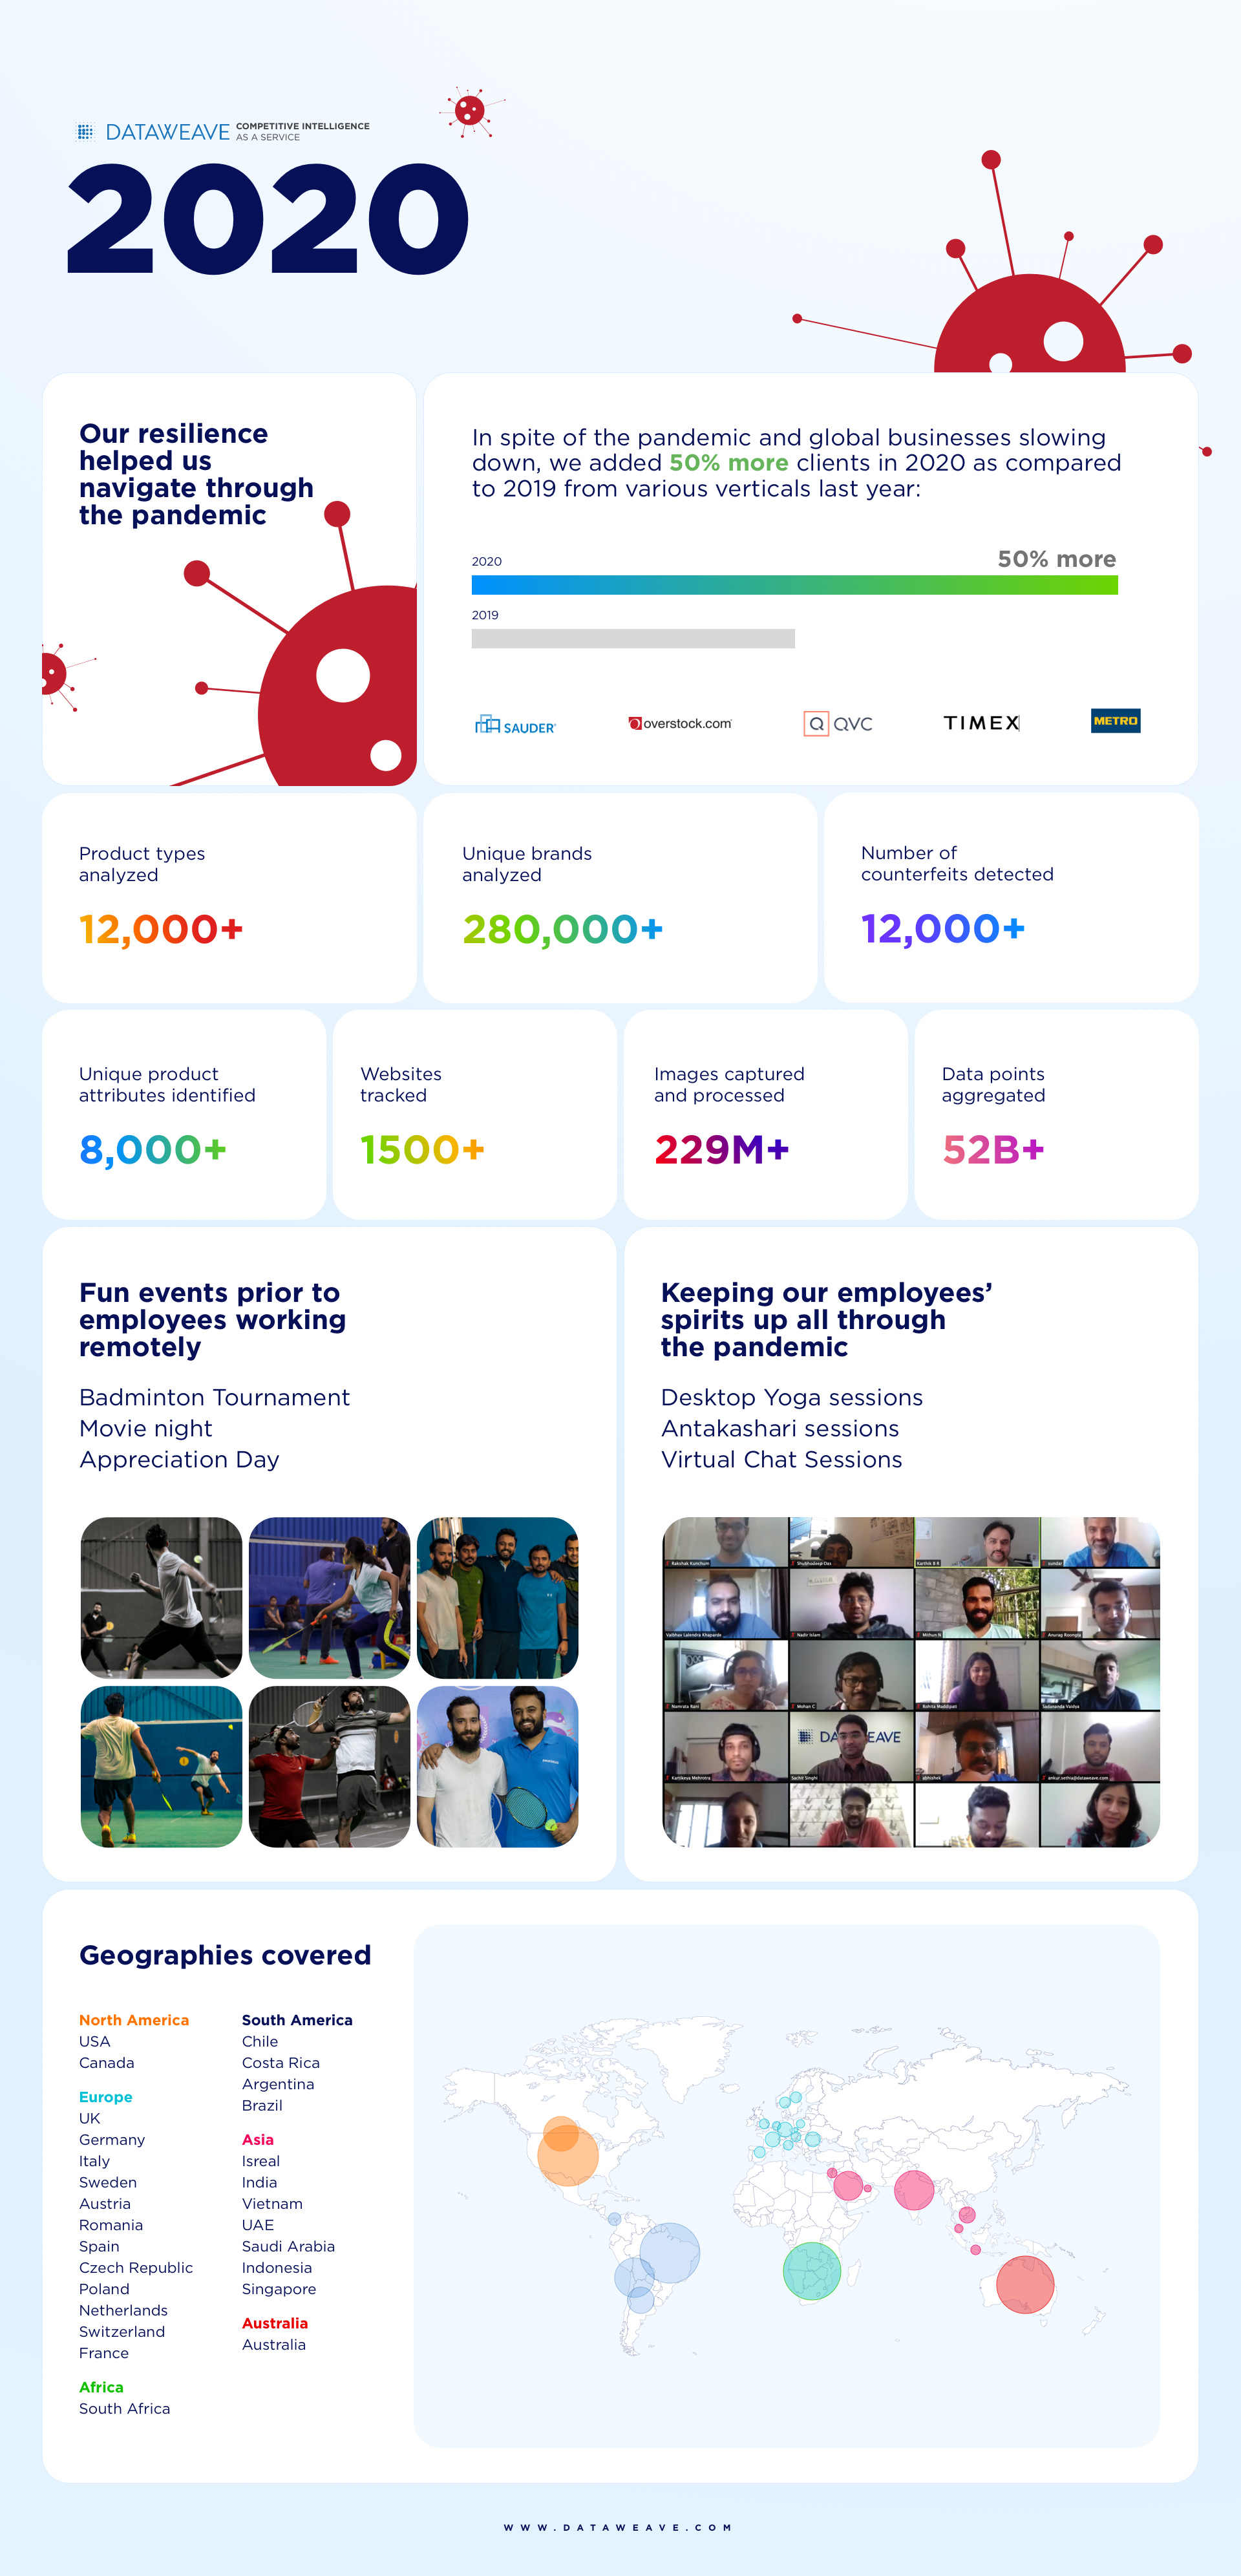
![[INFOGRAPHIC] 2020: The Year the World Navigated Uncertainty Together](https://stage-cdnblog.dataweave.com/wp-content/uploads/2021/01/Year2020_At_DataWeave-e1688039574468.jpg)
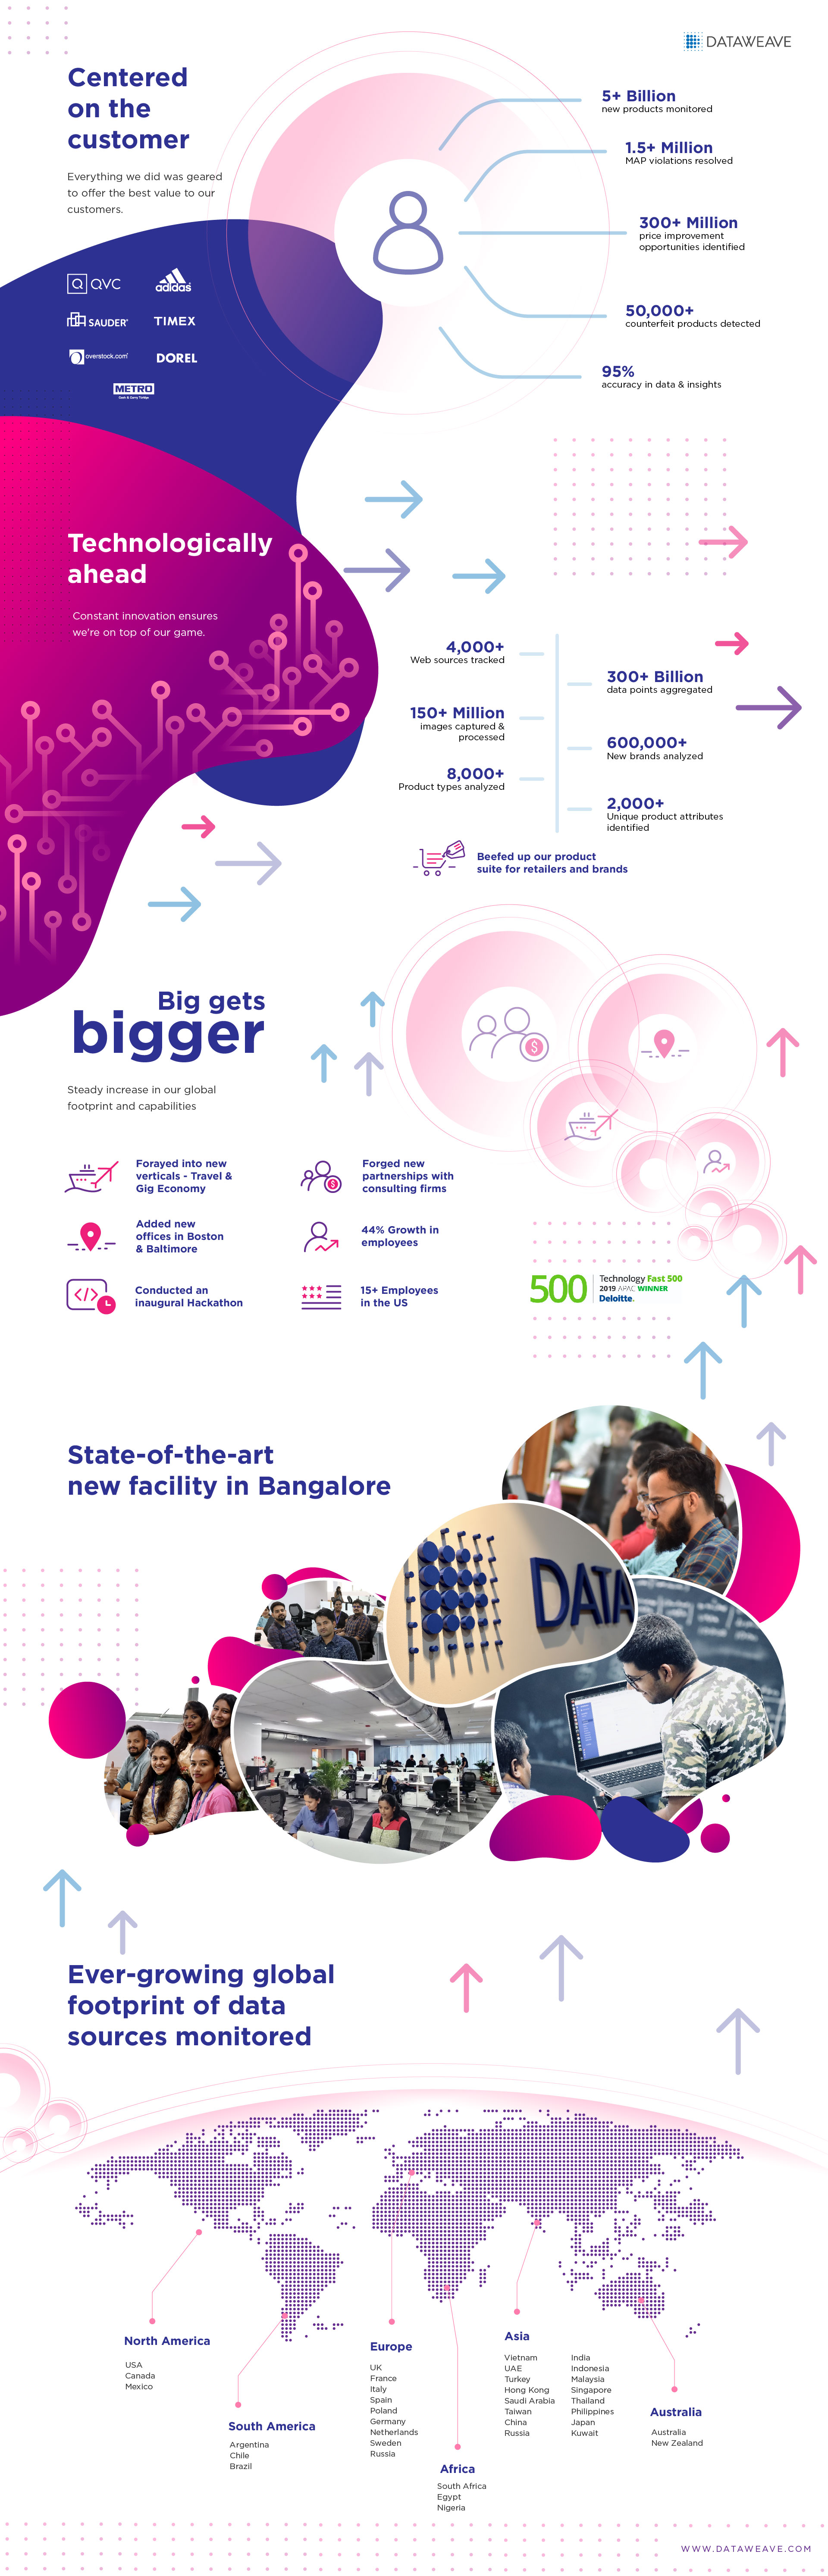
![[INFOGRAPHIC] 2019 at DataWeave: Blazing New Trails](https://stage-cdnblog.dataweave.com/wp-content/uploads/2020/01/2020-.jpg)

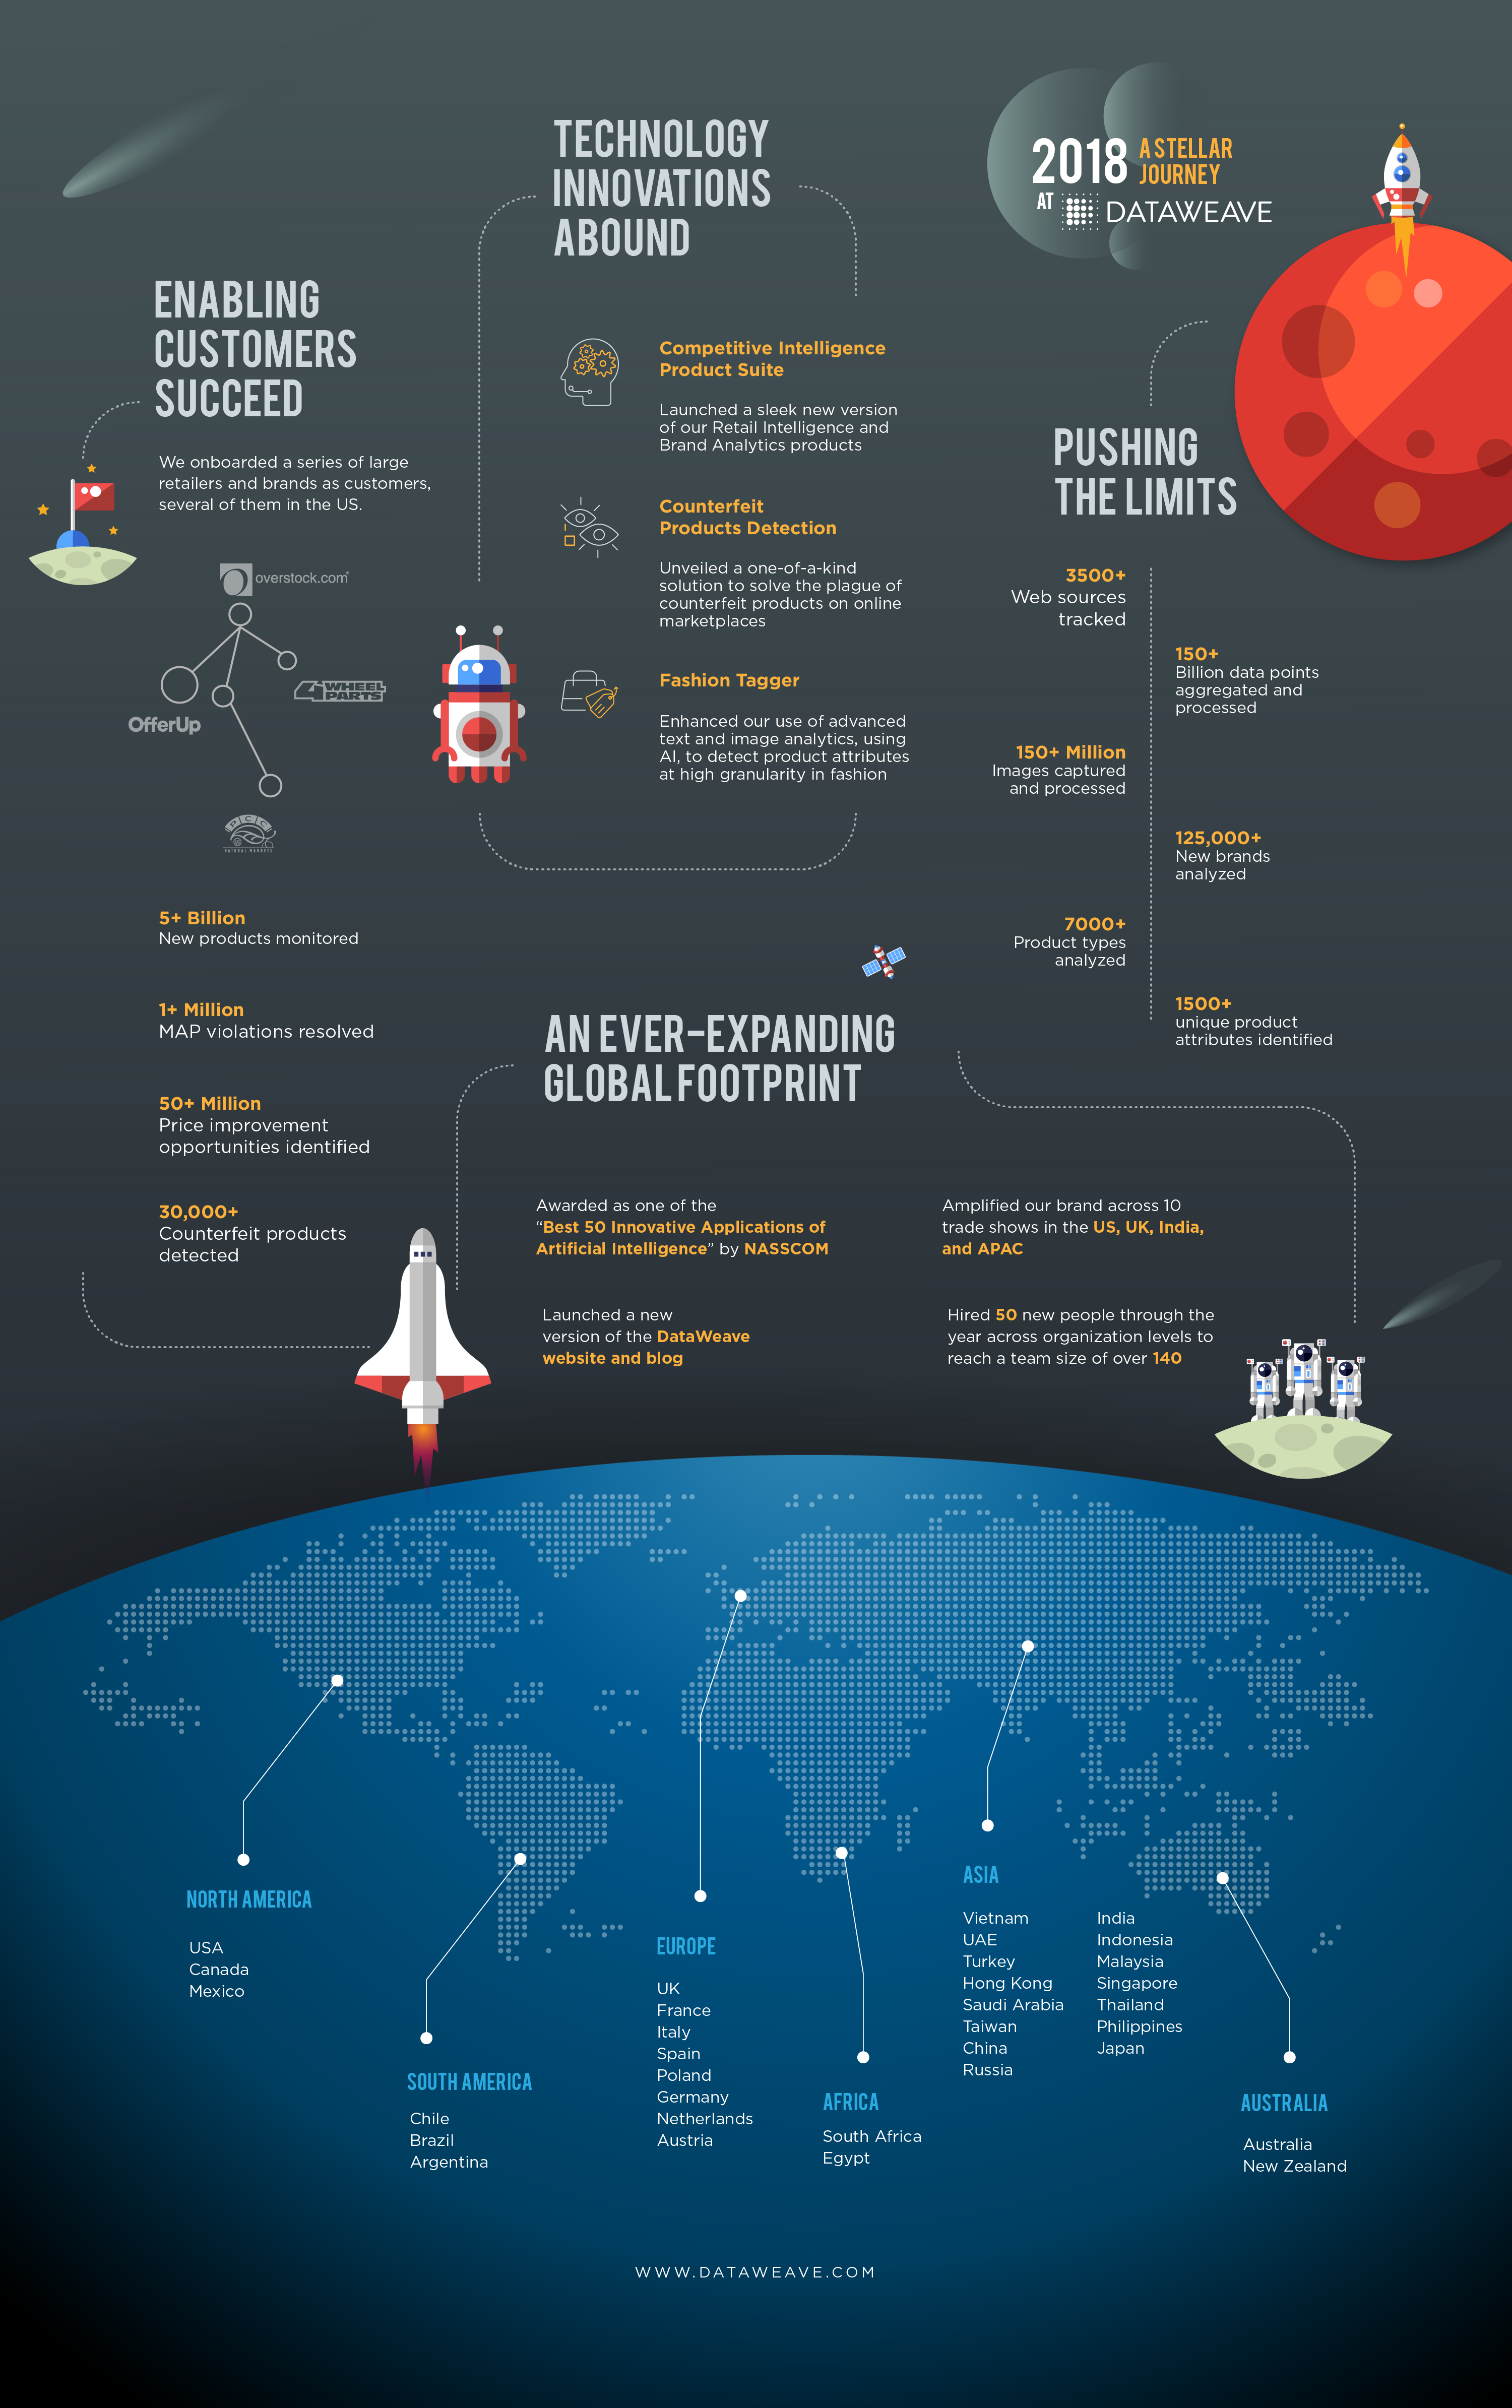
![[INFOGRAPHIC] 2017 at DataWeave: A Year in Retrospect](https://stage-cdnblog.dataweave.com/wp-content/uploads/2018/09/pic3-e1688040963744.jpeg)