When it comes to shopping events, Black Friday stands out as one of the most anticipated dates for scoring deals. Typically occurring the day after Thanksgiving, the weekend kicks off the holiday shopping season with a frenzy of discounts. But Boxing Day, celebrated on December 26, is also well-known for its post-Christmas clearance sales.
This Black Friday, US eCommerce sales increased by a hefty 14.6% in 2024, according to Mastercard SpendingPulse. While Black Friday leads in overall revenue generation for retailers, Boxing Day presents unique opportunities for clearing post-holiday inventory.
For a consumer, which sale event is likely to offer the most attractive deals?
At DataWeave, we analyzed discounts across retailers and categories to uncover the answer.
Our Methodology
For this analysis, we tracked pricing data across major retailers for Black Friday and Boxing Day. To provide a comprehensive analysis of Black Friday pricing strategies, we explored a matched products dataset, comparing identical 14,000+ SKUs across retailers within key categories.
Categories included: Consumer Electronics, Home & Furniture, Apparel, Health & Beauty, Grocery
Retailers included: Amazon, Target, Walmart, Sephora, Ulta Beauty, Overstock, Home Depot, Best Buy, Saks Fifth Ave, Nordstrom, Macy’s, Bloomingdale’s, Neiman Marcus
Timeline: November 26 (Black Friday), December 26 (Boxing Day)
Average Discounts: Black Friday vs Boxing Day
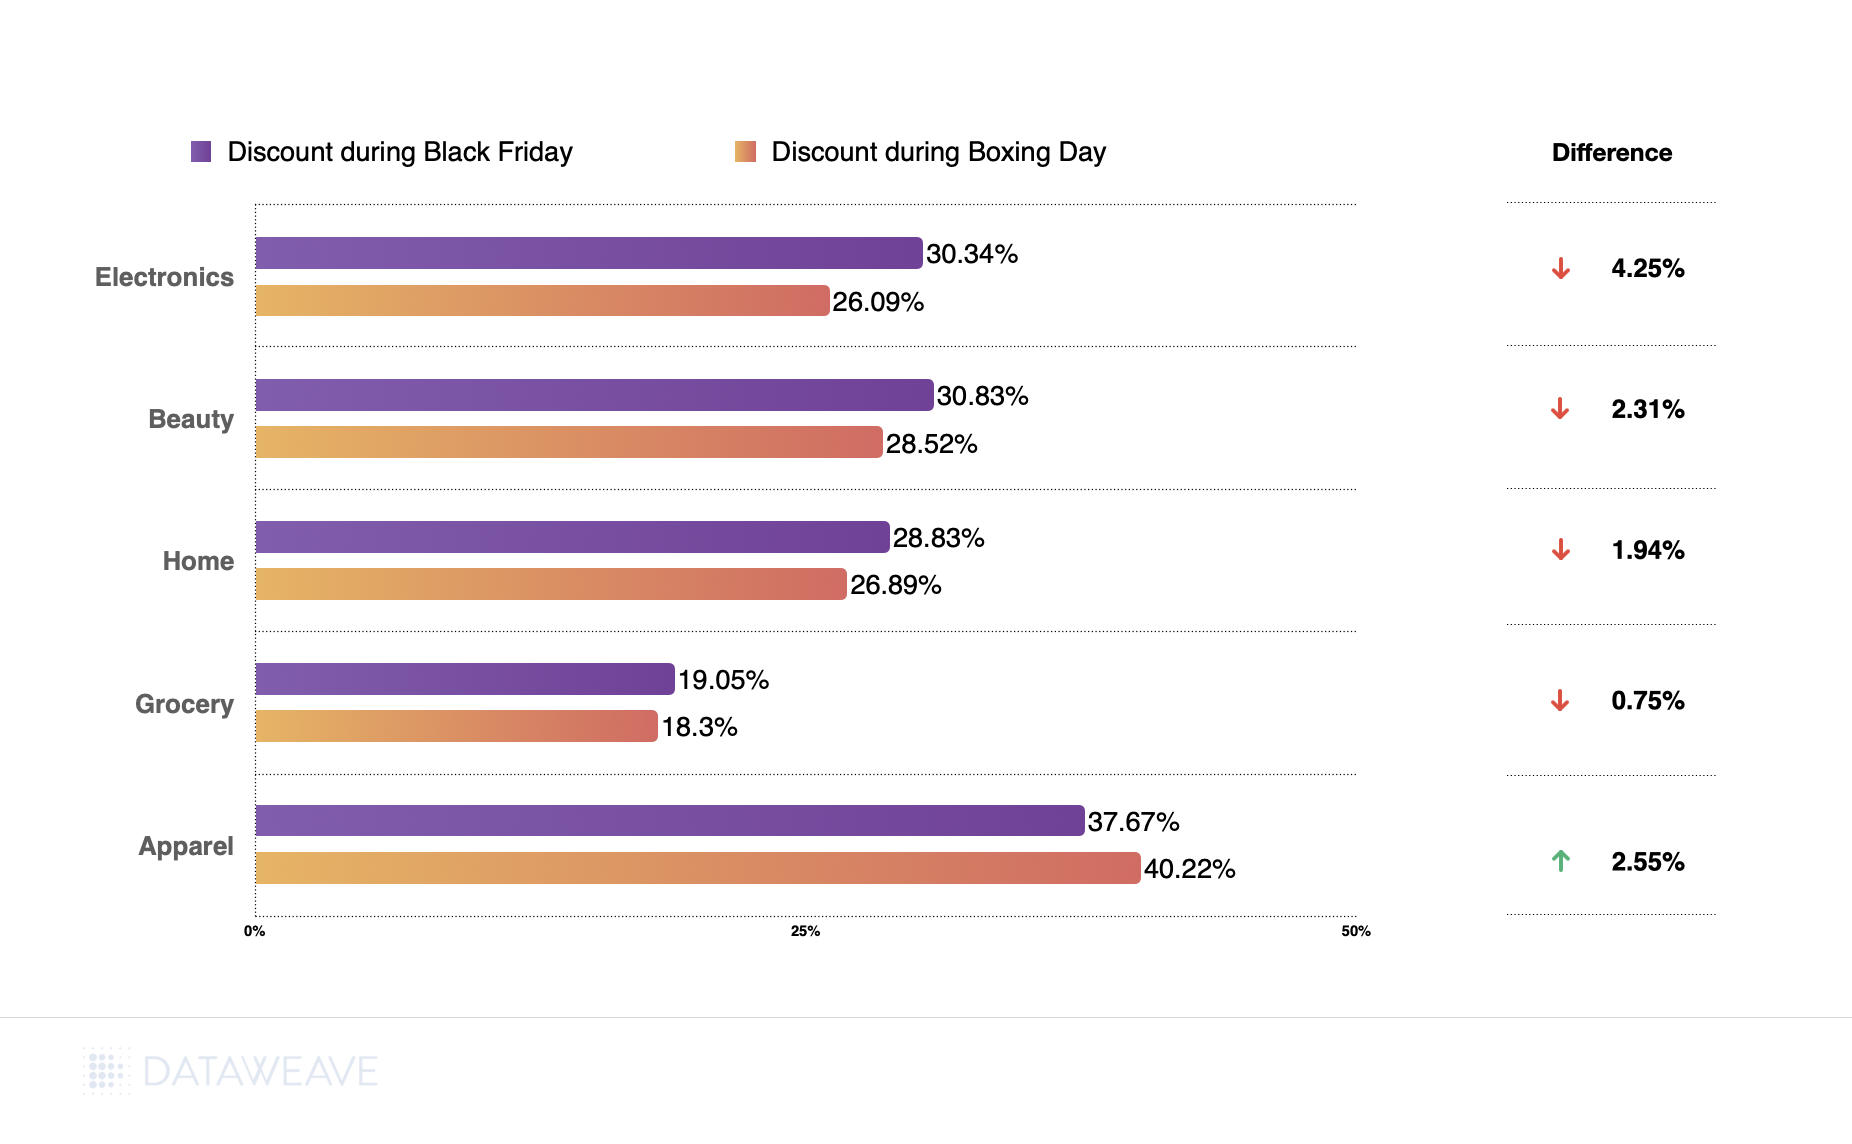
Our analysis reveals that Black Friday generally offered steeper discounts across most categories, although Boxing Day wasn’t far behind. Here’s a breakdown:
While Black Friday led in most categories, Apparel saw a slight edge on Boxing Day, with discounts averaging 40.22% compared to 37.67% on Black Friday. Electronics, Beauty, and Home, however, remained more lucrative during Black Friday.
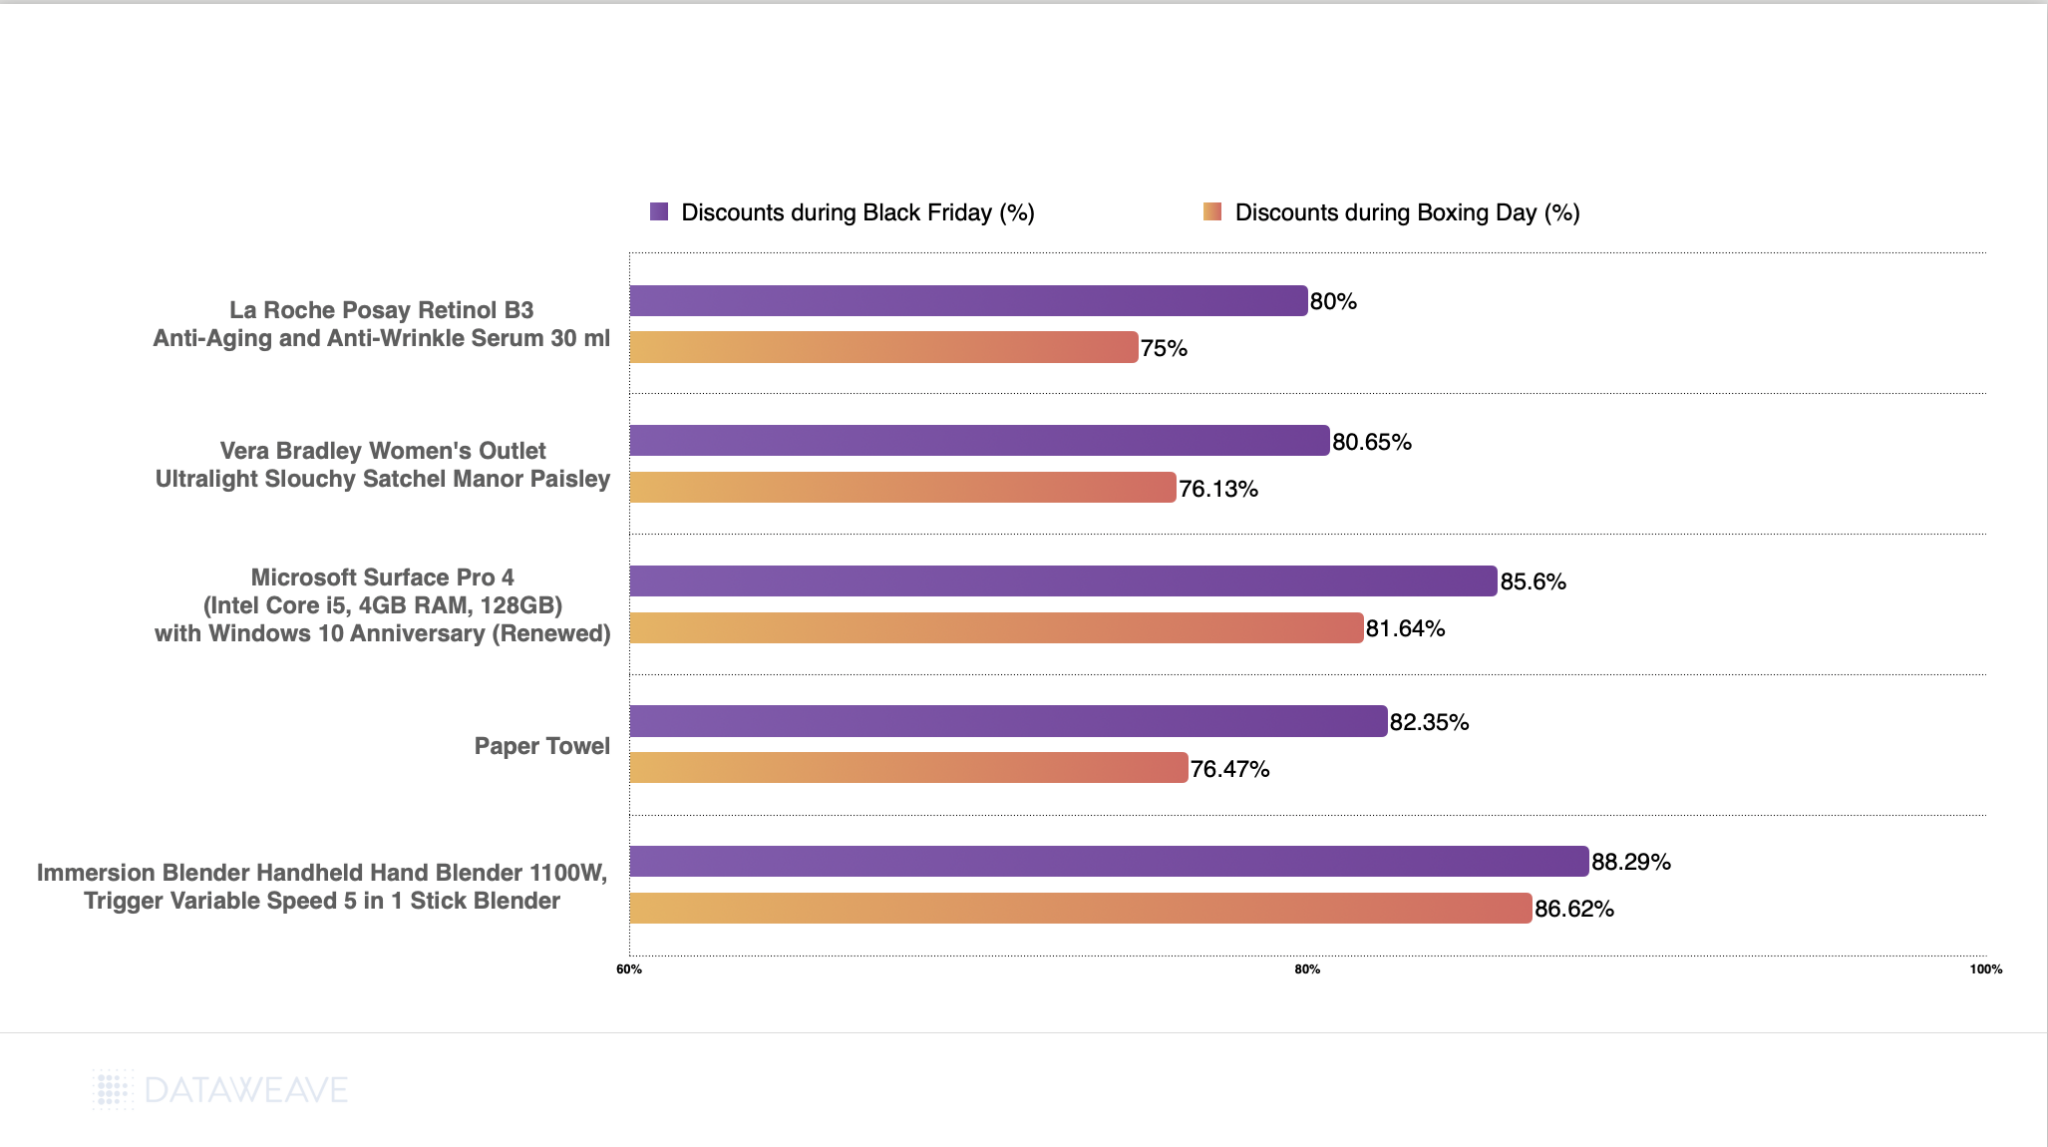
Top 5 Products Higher Discounts on Black Friday
Diving deeper into specific products, here are our top 5 picks offering better discounts during Black Friday.
Appliances like an Immersion blender set offering a discount of 88.29%, significantly higher than its Boxing Day offer of 86.62%.
High-end electronics like the Microsoft Surface Pro 4 also saw substantial markdowns at 84.60%.
In beauty and fashion, both La Roche Posay’s retinol serum and Vera Bradley’s satchel offered discounts above 80%.
Even everyday essentials like paper towels enjoyed generous discounts, with markdowns reaching 82.35% during Black Friday compared to 76.47% on Boxing Day.
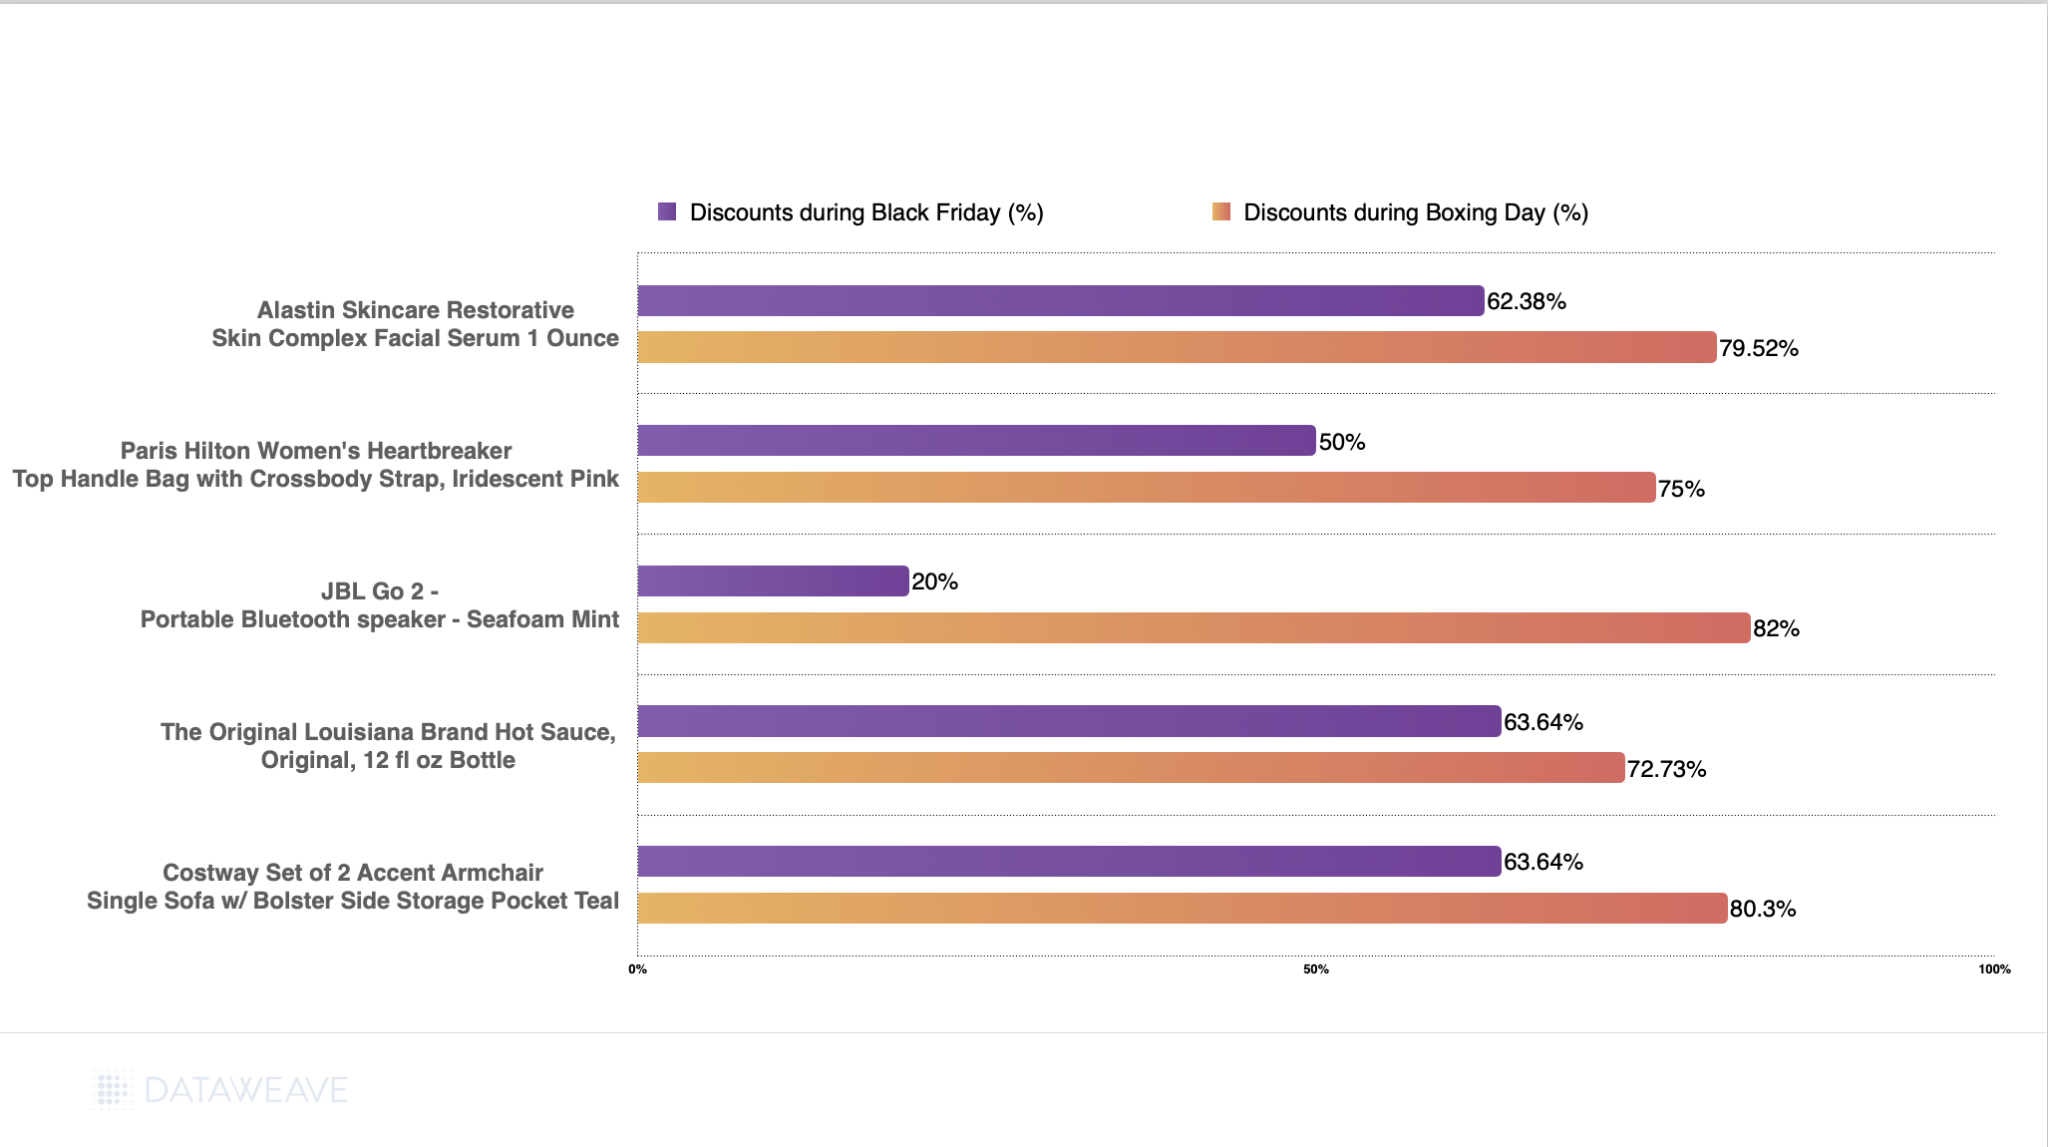
Top 5 Products With Higher Discounts on Boxing Day
Boxing Day revealed some remarkable deals across diverse categories, with certain products offering significantly better value than their Black Friday counterparts.
The JBL Go 2 portable speaker emerged as the standout, with an extraordinary 82% Boxing Day discount compared to just 20% on Black Friday—a dramatic 62% difference.
Home furnishings showed strong Boxing Day performance, with the Costway accent armchair set reaching 80.30% off.
In Conclusion
Black Friday reigns supreme in driving early holiday sales, offering deeper discounts and drawing larger crowds. However, Boxing Day remains critical for retailers to offload surplus inventory and attract post-holiday shoppers.
By combining insights from both events, retailers can refine their strategies to maximize revenue and enhance customer satisfaction. For shoppers, the decision comes down to timing—shop early for better deals or wait to capitalize on clearance markdowns. The products and categories with more attractive offers tend to vary between these two sale events. Hence, as a shopper, it’s a good idea to keep track of prices all through the holiday season to take advantage of the best deals.
For a deeper dive into the world of competitive pricing intelligence and to explore how our solutions can benefit apparel retailers and brands, reach out to us today!
Virtually every cuisine in the world uses eggs. They’re in your breakfast, lunch, dinner, and dessert — which is perhaps why the global egg market is expected to generate $130.70 billion in revenue in 2024 and is projected to grow to approximately $193.56 billion by 2029.
More specifically, the United States is the fourth-largest egg producer worldwide. The country’s egg market is projected to generate $15.75 billion in 2024 and increase to $22.51 billion by 2029.
Health-consciousness among consumers: Consumers value eggs for their essential nutrients and rich protein content.
Demand for convenience foods: Consumers’ preferences are shifting toward quick and easy foods, which drives demand for shell eggs and pre-packaged boiled or scrambled eggs.
Population Growth: A growing worldwide population increases the demand for eggs.
Affordability and accessibility: Eggs are an affordable and accessible nutrient-dense food source for many.
Despite these factors contributing to the U.S. egg market’s growth, recent times have seen egg prices fall dramatically.
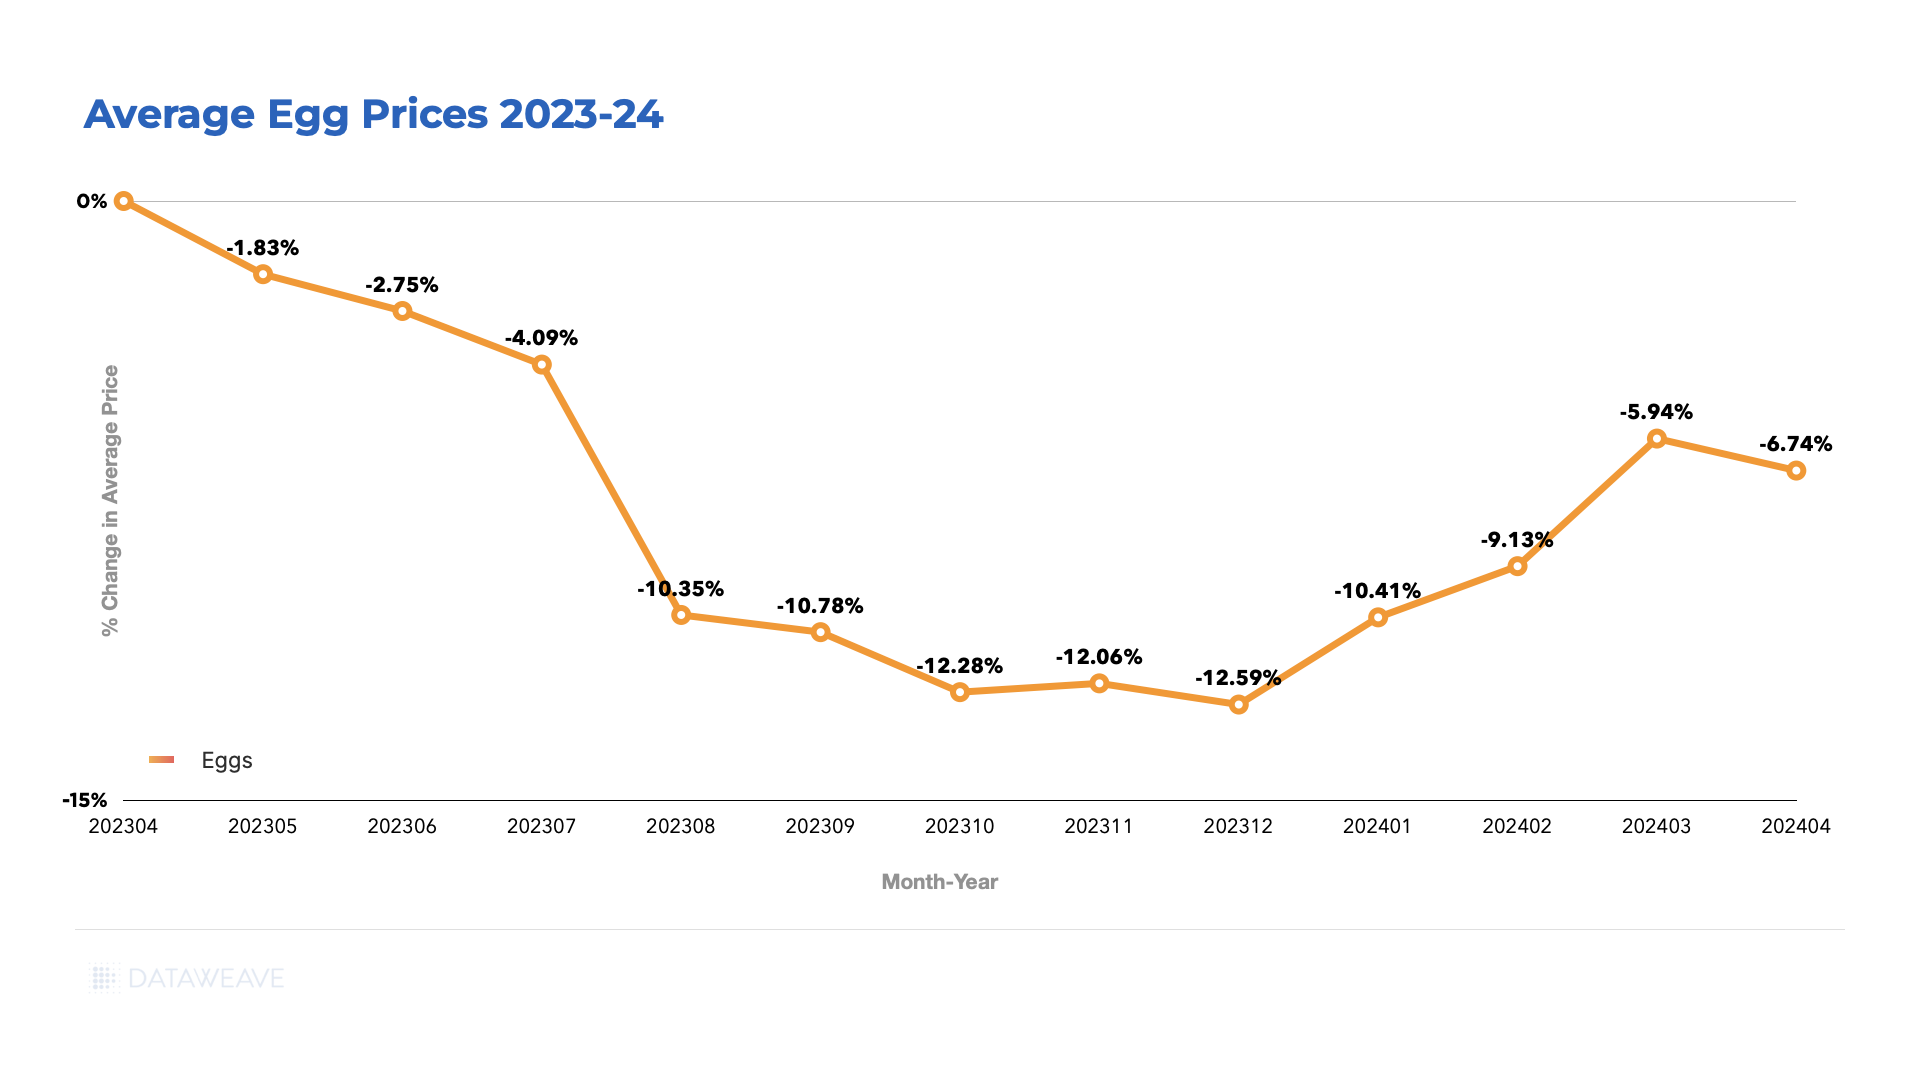
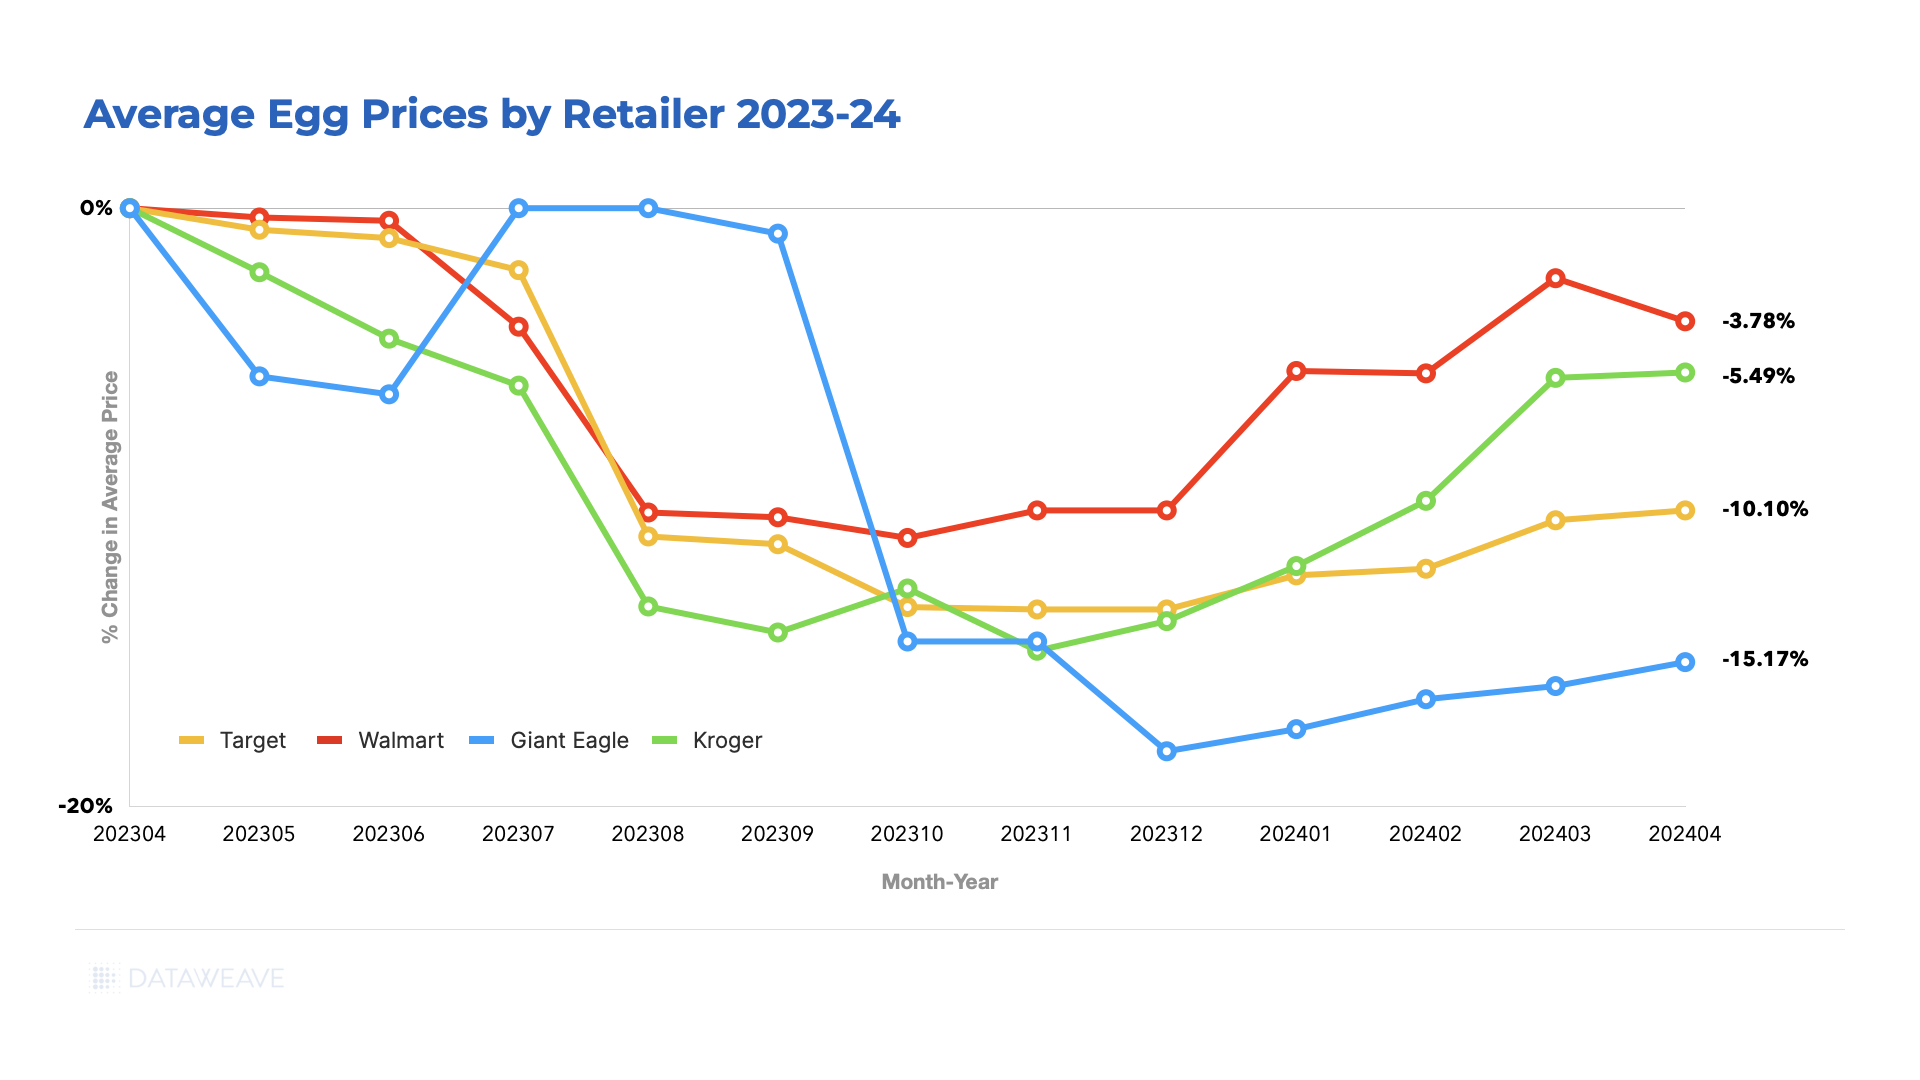
Based on a sample of 450 SKUs, DataWeave discovered that egg prices in the U.S. fell by 6.7% between April 2023 and April 2024, dipping to its lowest (-12.6%) in December 2023.
So, what’s causing the decrease in egg prices?
The Rise and Fall of Egg Prices: A Recent History
In 2022, avian influenza severely impacted the United States. The disease affected wild birds in nearly every state and devastated commercial flocks in approximately half of the country.
The 2022 incident was the first major outbreak since 2015 and led to the culling of more than 52.6 million birds, mainly poultry, to prevent the disease from spreading uncontrollably.
With almost 12 million fewer egg-laying hens, the United States produced around 109.5 billion eggs in 2022 — a drop of nearly two billion from the previous year.
Consequently, the cost of eggs soared, peaking at $4.82 a dozen — more than double the price of eggs in the previous year.
The avian flu continues to affect egg-laying hens and other poultry birds across the United States. As of April 2024, farms have killed a total of 85 million poultry birds in an attempt to contain the disease.
Despite the disease’s effects, production facilities have made significant efforts to repopulate flocks, leading to a steady increase in supply – and a much anticipated decrease in egg prices.
According to the U.S. Bureau of Labor Statistics, there was an increase in producer egg prices in 2022, reaching a peak in November 2022, at which point they began to fall.
Retailer’s egg prices followed suit. The egg price chart below depicts retailers’ declining egg prices over one year, from April 2023 to April 2024, with Giant Eagle showing the most significant price reductions and Walmart the least.
What Does the Future Hold for Egg Prices?
The USDA reported recent severe avian flu outbreaks in June 2024. These outbreaks are estimated to have affected 6.23 million birds.
With a reduction in egg-laying hens, egg prices are likely to increase — time will tell.
Nonetheless, the annual per capita consumption of eggs in the U.S. is projected to reach 284.4 per person in 2024 from 281.3 per person in 2023. So for now, producers and retailers can rest assured of the growing demand for eggs.
How Can Retailers Adapt to the Unpredictability of Egg Prices?
Egg prices were down to $2.69 for a dozen in May 2024. However, they are still significantly higher than consumers were used to just a few years ago—eggs were, on average, $1.46 a dozen in early 2020.
Additionally, while the avian flu puts pressure on producers, inflation and supply chain disruptions exert pressure on retailers.
With such challenging egg market conditions, what can retailers do to maintain customer loyalty amid reduced consumer spending while maintaining profitability?
1. Give the Customer What They Want: Increase Offerings of Organic, Cage-Free, and Free-Range Eggs
As mentioned, Data Bridge Market Research’s trends and forecast report highlighted a significant increase in consumer health consciousness. Additionally, animal welfare increasingly influences consumers’ purchasing decisions when buying meat and dairy products.
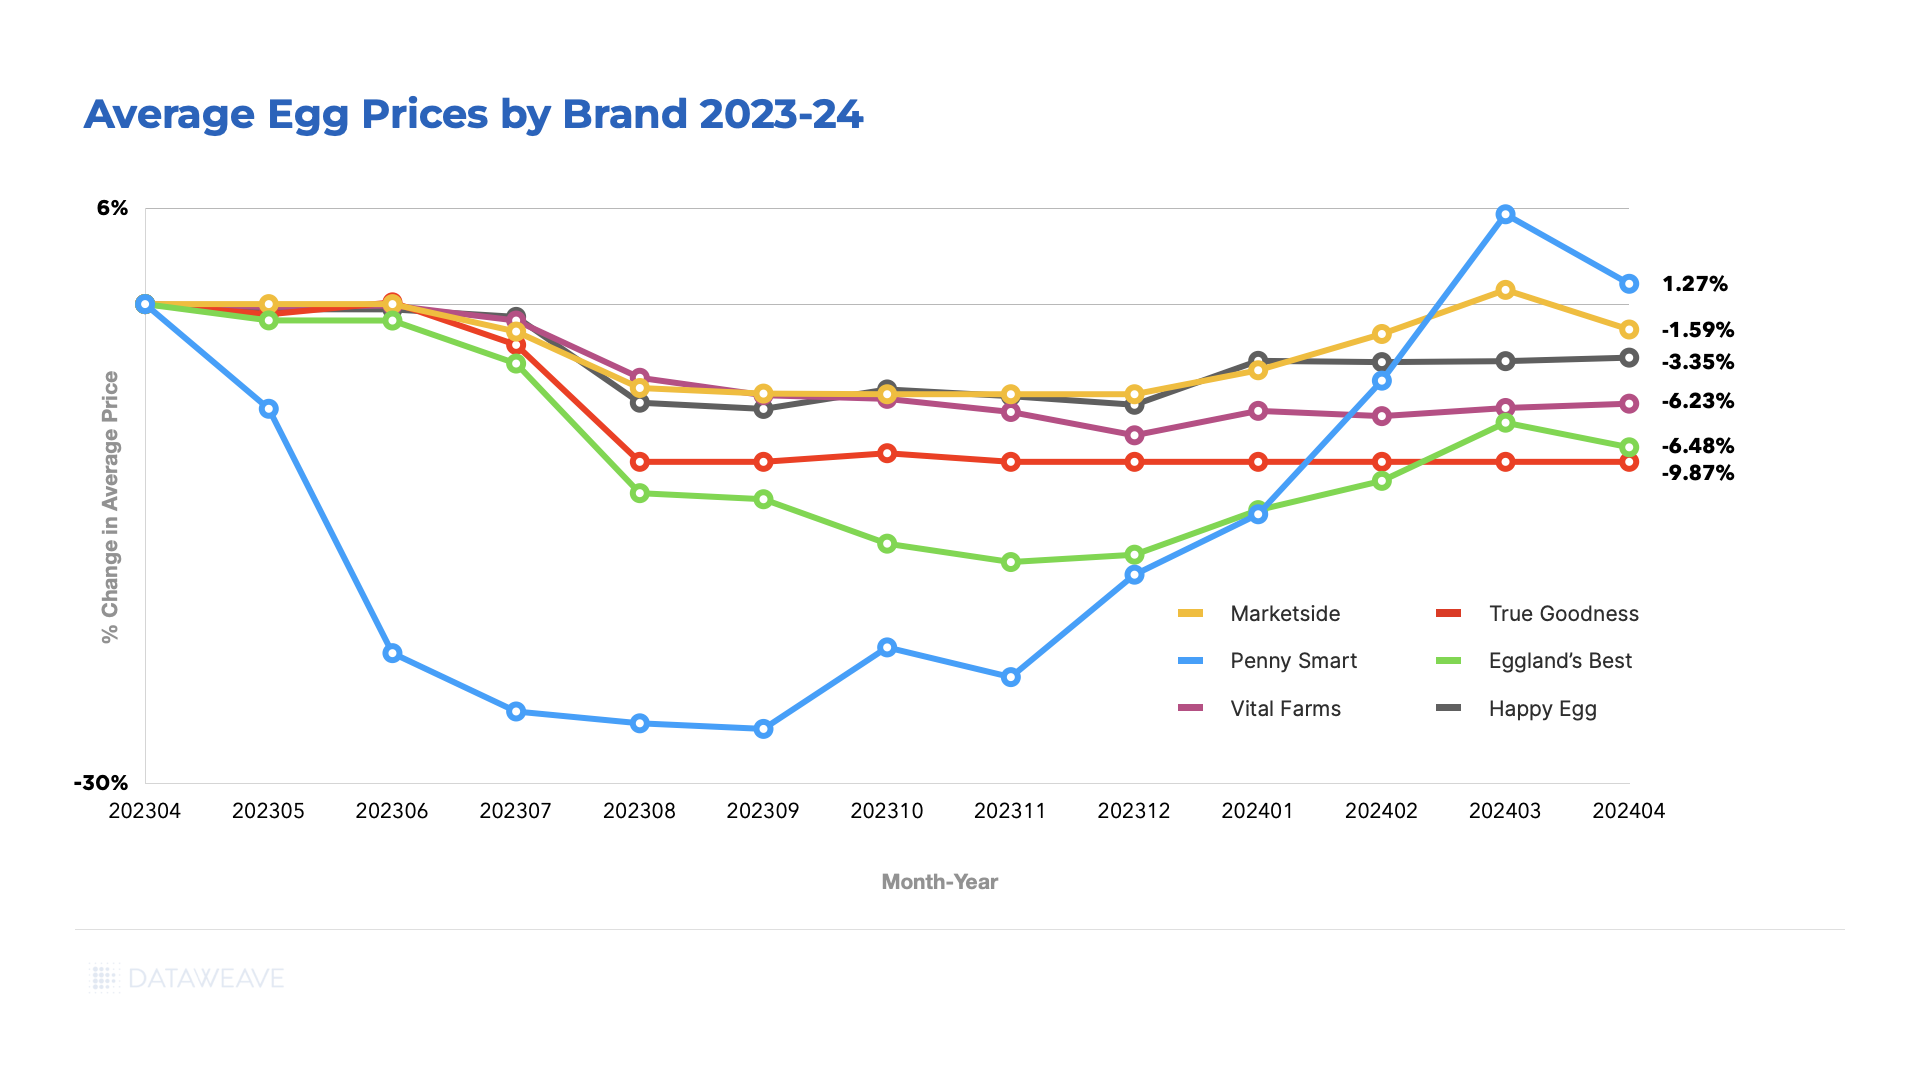
DataWeave data shows that the prices of organic, cage-free, and free-range eggs—such as those by brands like Happy Eggs and Marketside—have fallen less than those of non-organic, caged egg brands.
2. Increase Private-Label Offerings
Private labels typically offer retailers higher margins than national brands. These margins can shield consumers from sudden wholesale egg price swings, helping to preserve brand trust and consumer loyalty without sacrificing profitability.
Moreover, eggs are particularly suited to private labeling, given their uniform appearance and taste and the lack of product innovation opportunities.
Undoubtedly, this is why sales of private-label eggs dwarf sales of national egg brands in the United States. Statista reports that across three months in 2024, private label egg sales amounted to $1.55 billion U.S. dollars, while the combined sales of the top nine national egg brands totaled just $617.88 million U.S. dollars.
3. Price Intelligently
With the current and predicted fluctuations in egg prices over the foreseeable future, price competitiveness is paramount to margin management and customer loyalty.
This is especially true when lower prices are the primary factor influencing the average consumer’s choice of supermarket for daily essentials purchases.
AI-driven pricing intelligence tools like DataWeave give retailers valuable highly granular and reliable insights on competitor pricing and market dynamics. In today’s data-motivated environment, these insights are necessary for competitiveness and profitability.
Final Thoughts
Egg prices have fluctuated significantly due to the impact of avian flu. Despite recent price drops, future egg price increases are possible due to ongoing outbreaks. Retailers should adapt to unstable egg prices by increasing organic, free-range, cage-free, and private-label egg offerings while leveraging AI-driven pricing tools to maintain margins and customer loyalty.
As inflation hits another 40-year high at 9.1 percent, U.S. consumers geared up for their first sign of hope and relief in the form of anticipated discount buys – 2022 Amazon Prime Days, or so we thought. While Prime Days have grown to become a promotional period almost as important as Black Friday to digital shoppers, the combination of economic uncertainty, inflationary pressures, and supply chain challenges seemed to alter the discount strategy expected given activity seen during 2021 Prime Days.
Our analyst team has been hard at work aiming to provide a ‘first look’ at 2022 Prime Day Promotional Insights, tracking discounts offered across 46,000+ SKUs within key categories like Electronics, Clothing, Health & Beauty and Home, on seven major retailer websites – Amazon, Target, Best Buy, Sephora, Ulta, Lowe’s and Home Depot. Our analysis compares prices seen during Amazon Prime Day 2022 on July 12th, to pre-Prime Day maximum value prices seen in the ten days leading up to Prime Days, to determine the average change in discounts offered during the promotional period. Below is a summary of our findings.
Competitive Promotions Give Amazon a Run for their Money
Amazon offered the greatest average discount enhancements for Electronics at 5.6 percent followed by Health & Beauty items at 5.1 percent, and Home products at 4.2 percent versus pre-Prime Day discounts seen across the categories considered within our analysis. The only category reviewed where average discounts were greater on a competitor’s website was on Target.com within the Clothing category. As seen below, Clothing on Target.com average discounts were 6.8 percent greater than pre-Prime Day offers, which was 2.6 percent higher than the average discounts offered for Clothing on Amazon.
Target Capitalizes on Growth Opportunity in Clothing Category
Diving deeper into the details of where Target won within the Clothing category, you can see a majority of their promotional activity took place within Women’s Accessories where discounts offered were 18.5 percent greater than those seen pre-Prime Day 2022, which was almost 15 percent greater than the discount enhancements seen on Amazon for Women’s Accessories. In fact, Women’s Shoes and Sneakers were the only two categories where the average discounts offered were greater on Amazon than on Target.com.
Overall, the discounts offered on Target.com within the Clothing category were primarily concentrated within items priced $40 and lower, but what was most interesting is that within the $10 and under price bucket, Target offered average discounts of over 11 percent whereas Amazon increased prices for these items on average by over 9 percent.
While most of the Clothing available on both Amazon and Target.com during Prime Days 2022 were offered without a price change, the greatest discount percentages tracked were within the range of 10-25 percent off on Amazon whereas Target chose to offer the bulk of their promotions at 25 percent off an up.
Strategic Promotional Strategies Defined at the Electronics Subcategory Level
When it comes to the Electronics category on Prime Day, the big question is always who will win the battle of the brands. Below shows the difference in average pricing and promotions discounts offered between products manufactured by Samsung versus Apple across each retailer platform, noting discounts were almost 3 percent greater on average for Apple versus Samsung products on Amazon, and Apple discounts were almost 5 percent greater on Amazon versus than those seen on Target.com.
Amazon wasn’t going all in on Apple however, as we saw ‘Alexa’ devices (Amazon products) available on Best Buy and Target websites also, but the discounts were almost 4 percent greater on Amazon versus Target and over 7 percent greater than the discounts seen on BestBuy.com.
While the average discounts offered within the Electronics category were greatest on Amazon (5.6 percent) versus Best Buy (3.9 percent) and Target (3.4 percent) as noted within the first chart of this blog and across brands and technologies considered above, the discounts offered on Amazon were strategically focused between 10-25 percent as seen below.
Amazon’s Electronics promotions were also targeted at smaller price points, items priced between $20-500, whereas Best Buy and Target offered greater promotions for electronics priced $500 and up than Amazon.
Below is a snapshot of price buckets tracked for Electronics available on BestBuy.com, highlighting where most of the promotional activity was targeted at products priced $50 and up during Prime Days 2022, with discounts ranging from 10 percent up to greater than 25 percent greater than pre-Prime day prices.
The standout categories were TVs on Target.com with discounts averaging nearly 12 percent greater than those seen pre-Prime day, and smartphones on BestBuy.com with discounts averaging just over 11 percent greater than those seen pre-Prime Day. The category with the greatest average discount enhancements seen on Amazon during Prime Days 2022 was for Wireless Headphones with an average discount of 8.7 percent.
Home is Where Amazon’s Heart Was on Prime Day
Amazon dominated offers within the Home categories, especially for products within mid ($40-100) and higher price ranges (items priced $200-500), with the bulk of the discounts offered between 10-25 percent. There was little to no promotional activity seen across all price points on Lowe’s or Home Depot’s websites within the categories we tracked, and most other competitive offers on Home products were seen on BestBuy.com for products priced from $50-500. Even a subcategory like Tools offered deeper average discounts on Amazon (4.7 percent) than discounts seen on HomeDepot.com (1.1 percent) or Lowes.com (0 percent).
For Large Appliances, Amazon was the only retailer to off any significant discount across each major subcategory with the greatest average discount being on Ovens at 6 percent, followed by Refrigerators at 4 percent. One caveat with this category, when we reviewed Large Appliance prices two weeks prior to Prime Days, we saw average price increases around 16.7 percent occurring on Amazon.
During Prime Days 2022 however, Amazon also offered top average discounts for small appliances, except for on Instant Pots which appeared to have greater average discounts on Target.com (5.9 percent versus 4.2 percent on Amazon), and Vacuum Cleaners which appeared to have the best promotion of appliances small and large at 13.8 percent average discount on BestBuy.com. Another subcategory deeply discounted on BestBuy.com was weighted blankets, which averaged discounts around 18.5 percent versus Amazon’s average discount at only 6.2 percent.
Health & Beauty Retailer Pricing Strategies Revealed
Given the importance Health & Beauty Brands placed on Prime Day sales last year, we had anticipated to see more offers, especially within pure-play beauty retail channels, than we did for this booming category.
Amazon drove most of the Health & Beauty offers seen averaging 5.1% discounts versus other retailers only offering less than 1% on average, but discounts were aimed at a targeted group of SKUs on Amazon, bringing the average discount lower overall. Most of the promotions offered on Amazon fell within mid-range price points ($20-50) and were discounted between 10-25 percent versus pre-Prime Day prices.
Target.com offered the most comparable discounts to Amazon for Health & Beauty products on average, but their strategy primarily focused on items within the $20 and lower price range with discounts ranging primarily between 10-25 percent.
More 2022 Prime Day Insights Coming Soon
We know the significance visibility to critical pricing and promotional insights play in enabling retailers and brands to offer the right discounts to stay competitive, especially during promotional periods like Prime Days. While this blog is intended to provide a ‘sneak peek’ into 2022 Prime Day insights for the U.S. market, we will be providing more extensive, global coverage and will proactively share new insights with the marketplace as they become available throughout the month of July.
Be sure to also check out our Press page for access to the latest media coverage on Prime Day insights and more. Don’t hesitate to reach out to our team if there is any particular category you are interested in seeing in more detail, or for access to more information on our Commerce Intelligence and Digital Shelf solutions.
It’s common knowledge that upward of 70% of Amazon customers never scroll past the first page of search results. And that the first 3 products garner 64% of business generated. This is why it is critical for brands and businesses to make sure they rank well on Amazon. A good search ranking helps customers find your product with ease. And findability is fundamental! Having a better ranking is also a driver of the “flywheel effect” at online retailers. According to this effect, products that sell more tend to rank better in search results, and products that rank well in search results tend to sell more.
Negative impact on Sales Ranking due to Stockouts
If you want to stay on top of search rankings on Amazon, one of the things you need to keep an eye out for is your product stock availability. It’s not the ideal customer experience to have to click on a product listing only to find out it’s currently out of stock. This is why Amazon will not rank products at the top if they’re not available & customers cannot buy them immediately. Not only does this lead to a lost sale for a brand, to make things worse, but customers also end up buying a competitor’s product instead.
We were tracking product availability on Amazon for one of our customers in the CPG space. We tracked availability for products across varying ranks & looked at how going out of stock impacted their search rankings.
Product Availability
Impact on products with a Search Rank between 1 to 10:
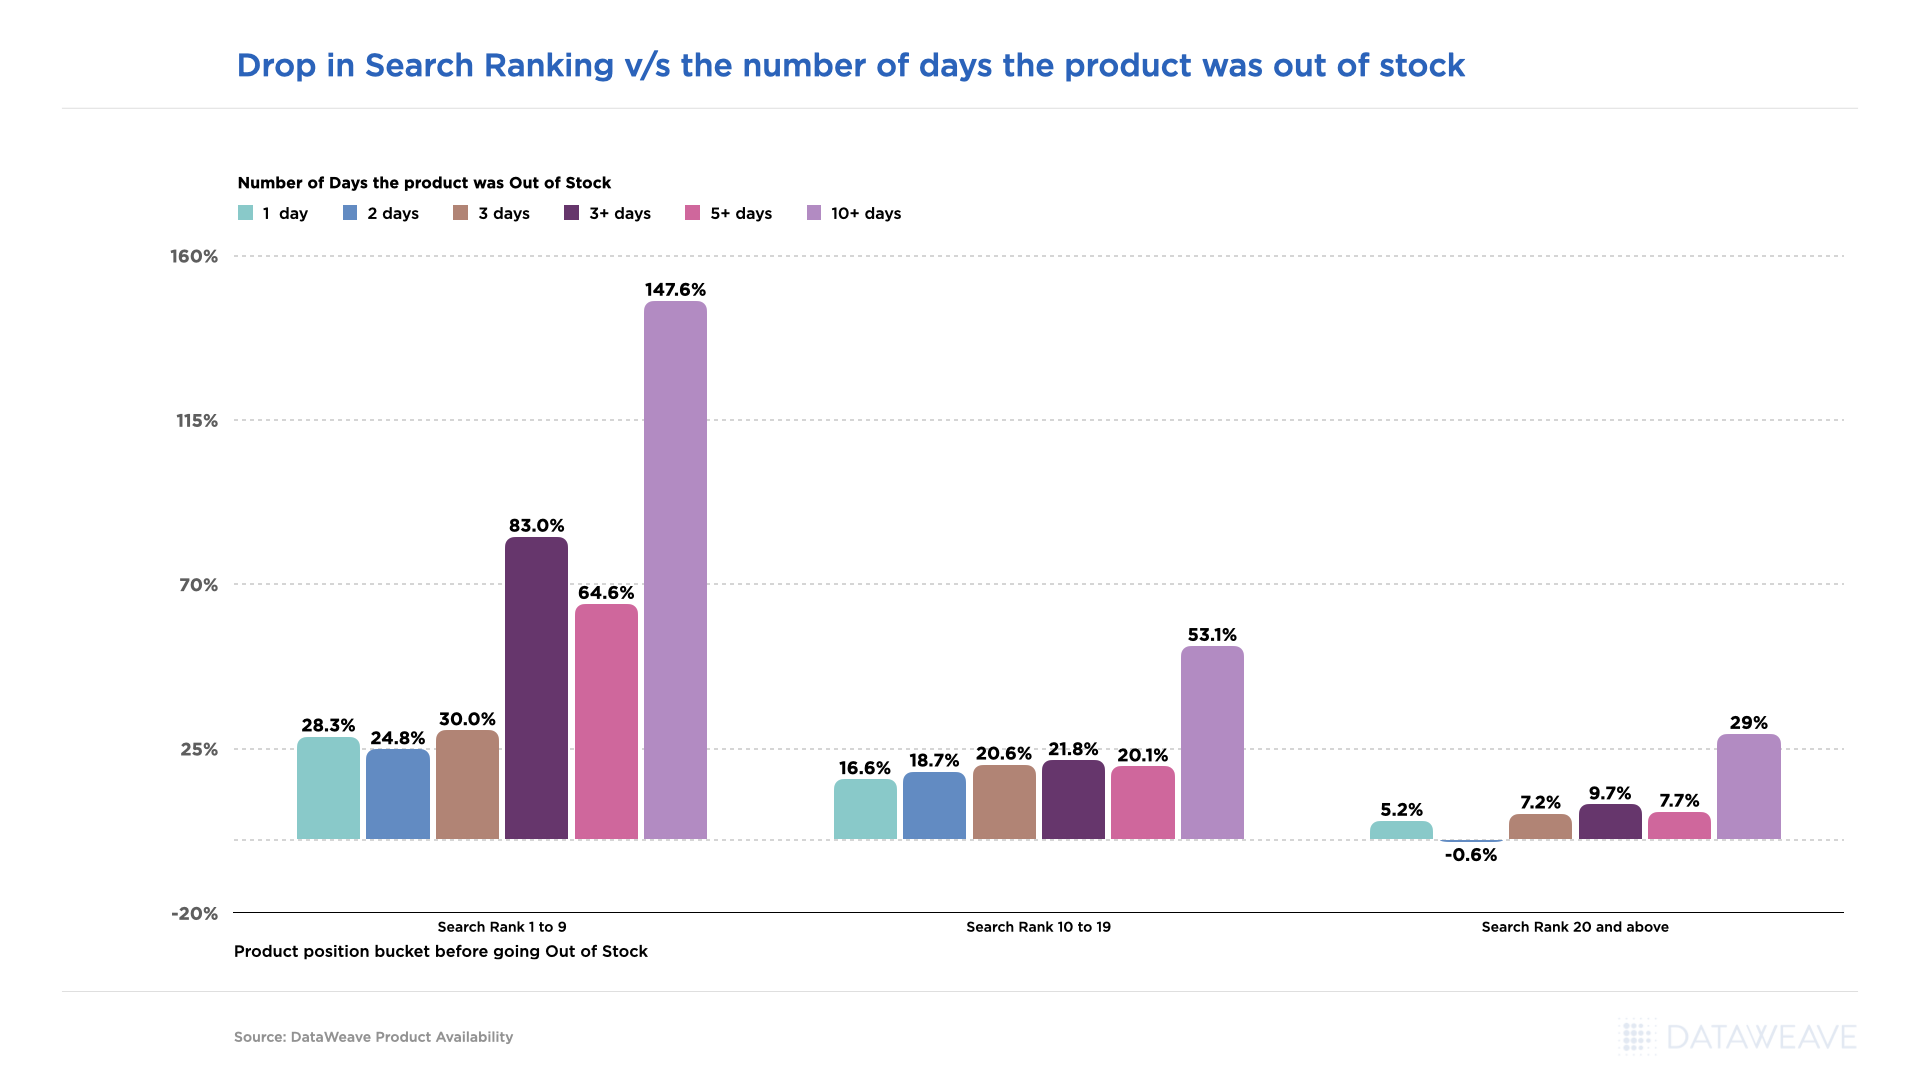
Our data showed that when products that ranked between 1-10 went out of stock for just 1 day, their rank fell by over 28%. After 3+ days of being out of stock, their rank fell by 83% and after being out of stock for over 10 days their rank fell by close to 150%!
This clearly illustrates that when the longer top-ranking products are out of stock, the greater the impact on search rank and product discoverability.
Impact on products with a Search Rank between 10 to 20:
The impact of being out of stock on products that ranked lower, i.e. between 10 to 20 was much lower. After being stocked out for 1 day, the ranking fell 17% compared to the 28% dip for products in the top 10 ranks.
Incremental change was minimal, too. After 3+ days of being OOS, search rank dropped by 22% and by 53% after 10+ days v/s close to 150% for higher-ranked products.
Impact on products with a Search Rank between 20 to 30:
These products had the least impact but there was an impact nonetheless.
After being OOS for 5+ days, search ranking fell by close to 8% and to close to 30% after 10 days of product unavailability.
Avoiding Stockouts with better Inventory Management
Customers can buy your product only when it is available. Failing to provide products at the right time will lead to losing sales to your competitors. If your products become unavailable, you’ll notice a drop in customers’ overall satisfaction and shopping experience too in addition to a lost sales rank on Amazon. In fact, your reputation and sales will take a beating long term in case of consistent product unavailability. Moreover, once the product is back in stock, the climb back to the top ranking is a slow and not-so-easy process. This is why brands need to maximize conversions by tracking product availability on a constant basis.
Conclusion
Stockout is a critical issue that has a significant impact on sales, brand image, and customer loyalty. Items ranking higher on eCommerce platforms take the biggest hit when they get out of stock. Brands can recapture their search share after restocking their inventory.
Want to maximize sales by reducing latency periods between stock replenishment? Reach out to our Digital Shelf Experts to know how!