Author: Abhinav Gupta

  • How VCs and Brand Rollups are using Data for faster Acquisitions

    How VCs and Brand Rollups are using Data for faster Acquisitions

    When it comes to brands – the biggest story of 2021 was the astronomical growth of Brand Roll-ups. For the uninitiated, Brand Roll-ups are companies that acquire multiple digital consumer brands and then scale these brands 100x by leveraging their own operational expertise across eCommerce platforms, Supply Chain, Warehousing, Marketing, and so on.

    Thrasio is the poster boy for the Brand roll-ups and is valued at over 10 Bn USD.

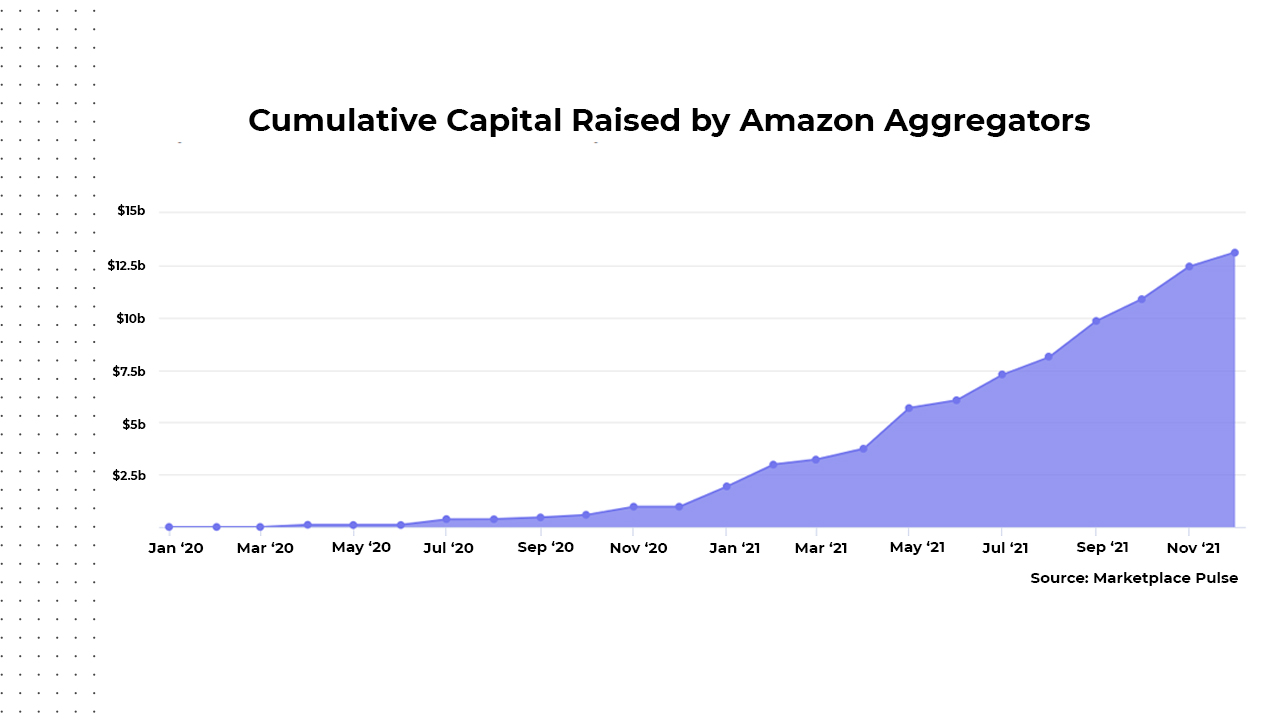
    Brand rollups have raised over $12 billion in 2021 and the trend only seems to be accelerating in 2022. Not only Brand Roll ups, but VCs too have been pouring money into digital brands. In India, 77+ brands have raised more than 2B USD in 2021. In the US this number is estimated to be north of $10 billion.

    Cumulative capital raised by Amazon Aggregators
    Cumulative capital raised by Amazon Aggregators

    Scaling fast doesn’t come easy. It comes with its own set of challenges. So even with ample experience in running and scaling brands, Brand roll-ups are posed with unique challenges.

    Challenge of Scouting the right brand

    There are 1000s of online consumer brands and new ones are launching every day. Every Brand roll-up wants to be the first one to scout a brand – but this is not easy.

    The challenge here is to identify & pick the right brands without having access to any sales or financial data. Every Brand Rollup has a wishlist with regards to the number of SKUs, price points, reviews, and ratings as well – but don’t have tools in place to scout brands with these criteria in mind. And across multiple platforms and categories, the problem gets more complicated.

    This is an ongoing problem since a brand that was not selling well yesterday may start hitting higher sales numbers a week down the line – and that is why Brand scouting has to be a continuous process.

    One way these aggregators have solved this challenge is by offering mouth-watering referral fees for referring a brand. But this is not a sustainable long-term solution.

    Data Comes to the Rescue

    What Brand Roll-ups need is a continuous and automated data first Brand Scouting solution to enable them to scout the right brands.

    • What are all the brands in a category of interest?
    • Which of these brands is within the filters of Number of SKUs, Price Range, etc.?
    • Which brands have shown an exceptional rise in search rankings?
    • Which brands have shown the most increase in the number of ratings and reviews?
    • Which brands have the highest gain in the customer ratings?
    • What are the estimated sales and market share of the brands?

    DataWeave’s Brand Scouting solution solves exactly this.

    DataWeave’s Brand Scouting Solution

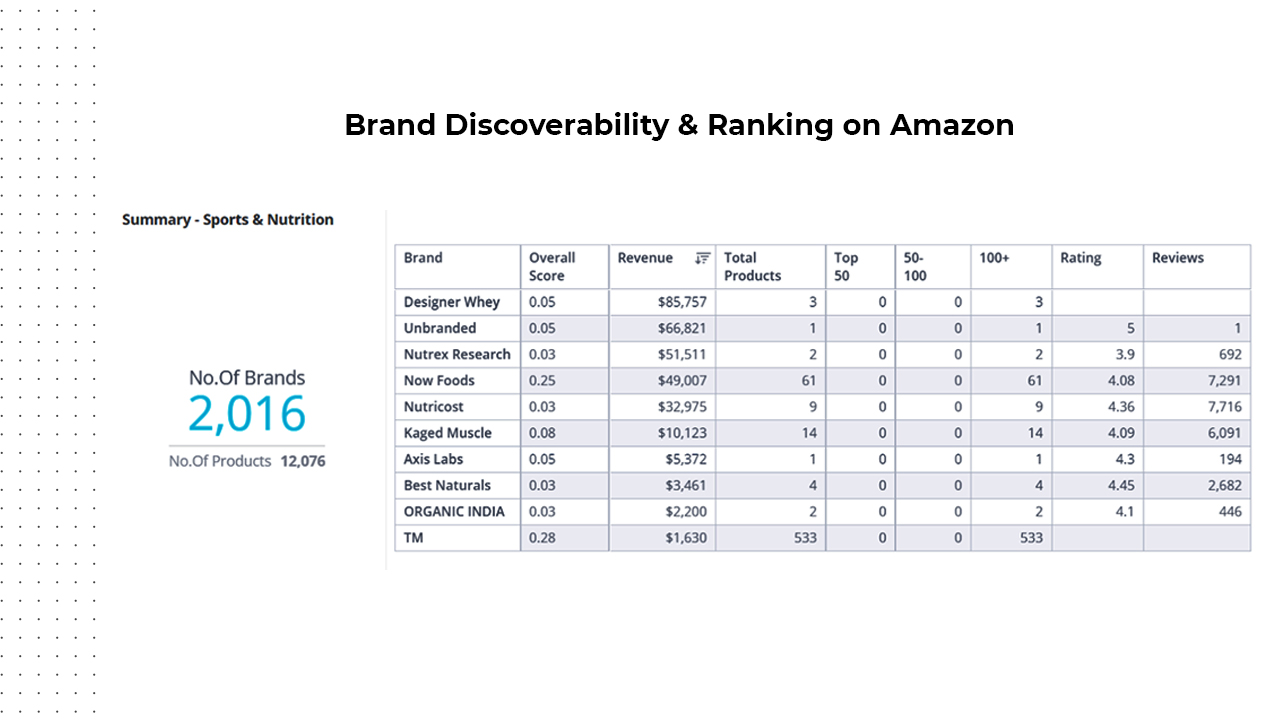
    DataWeave’s Brand Scouting Solution is a comprehensive solution to help Brand Rollups and VCs scout for the ideal brand that fits their acquisition profile. We leverage public data collected from multiple eCommerce platforms to get them the desired information on brands they’re looking for.

    For all the focused categories (Typically 30-40) – we collect data of all the SKUs (Typically 15,000-20,000) and aggregate that at a Brand level:

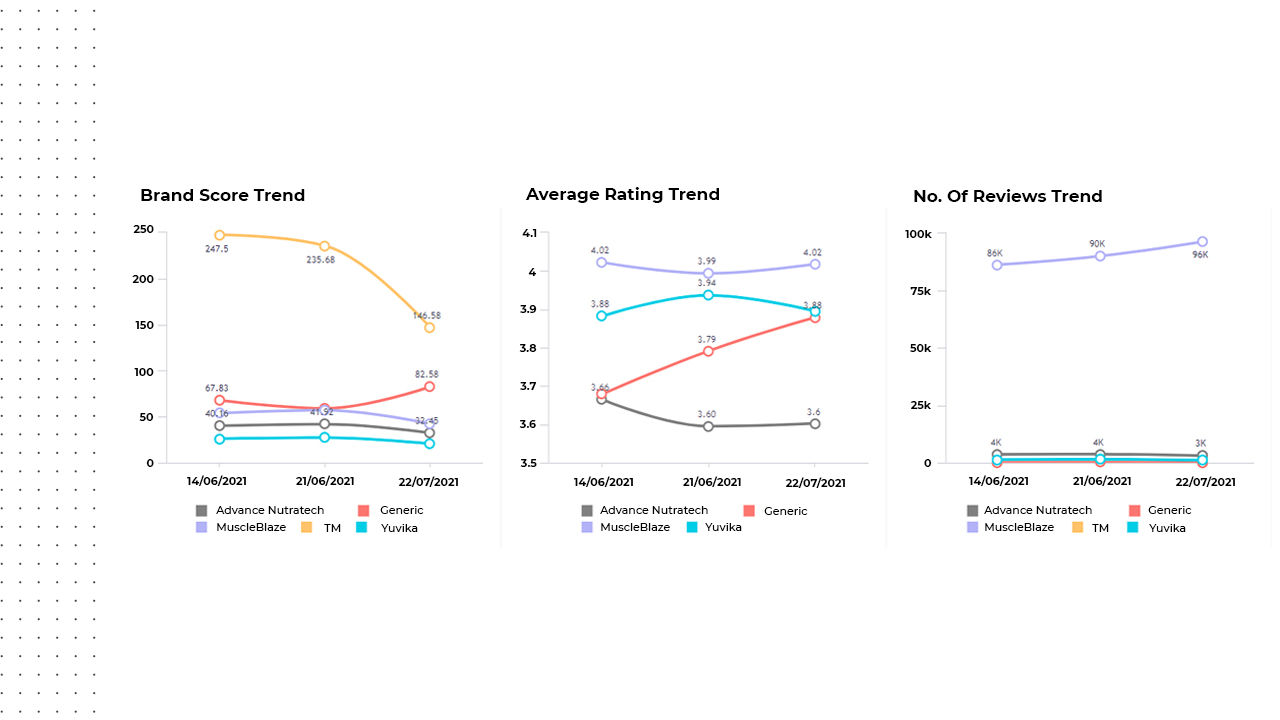
    • Ranking – Usually Brand Rollups are not interested in the Brands which are on the first page. But, they are interested in the brands which might be b/w 500 to 10,000 ranks but are showing an exceptional gain in ranking week on week.
    Brand Discoverability & Ranking on Amazon
    Brand Discoverability & Ranking on Amazon
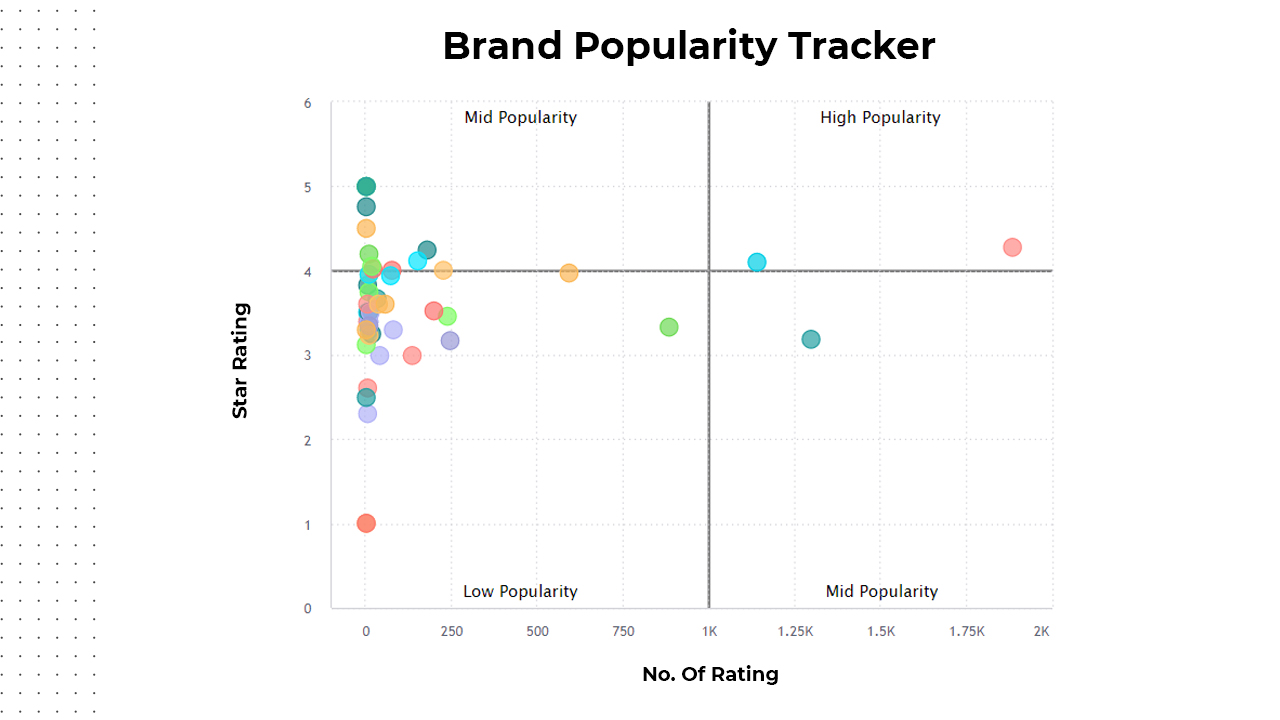
    • Ratings – It’s important to look at brands that are showing high improvement in ratings or have consistently shown high ratings. The proportion of 5 stars vs. 1 star is an important metric here.
    • Number of Reviews and Ratings We enable you to find brands that have both high ratings as well as a high number of reviews. This is a very good metric to find the brands in a category that are getting exceptional customer love.
    Brand Popularity Tracker
    Brand Popularity Tracker
    • Filters – We enable filtering in terms of – No. of SKUs, Price Range, Rating and Reviews and even can eliminate established brands so that you only see the brands which qualify your criteria. We also enable you to separately analyze brands that are buying sponsored ads in a category, so you have a clear distinction between organic and sponsored growth of these brands.
    • Trends – What is important is not just the static performance on the day of analysis – but a trend analysis over a period of time to find the brands which are growing exceptionally.
    Brand Score Trend, Average Rating trend & No of Reviews Trend
    Brand Score Trend, Average Rating trend & No of Reviews Trend

    … but, wait there’s more.

    We compliment Brand Scouting with three more solutions to provide the right context and further analysis needed to provide comprehensive insights into the category and platforms where you are scouting for brands:

    Category Analytics: When you are looking at a category and the brands in that category, it is often important to understand how dynamic that category is. We can help analyze:

    • If the category is crowded with more brands per product.
    • Does it have space for new brands?
    • What is the number of new brands entering that category?
    • What is the number of new SKUs entering that category?
    Category & Subcategory Evaluation
    Category & Subcategory Evaluation

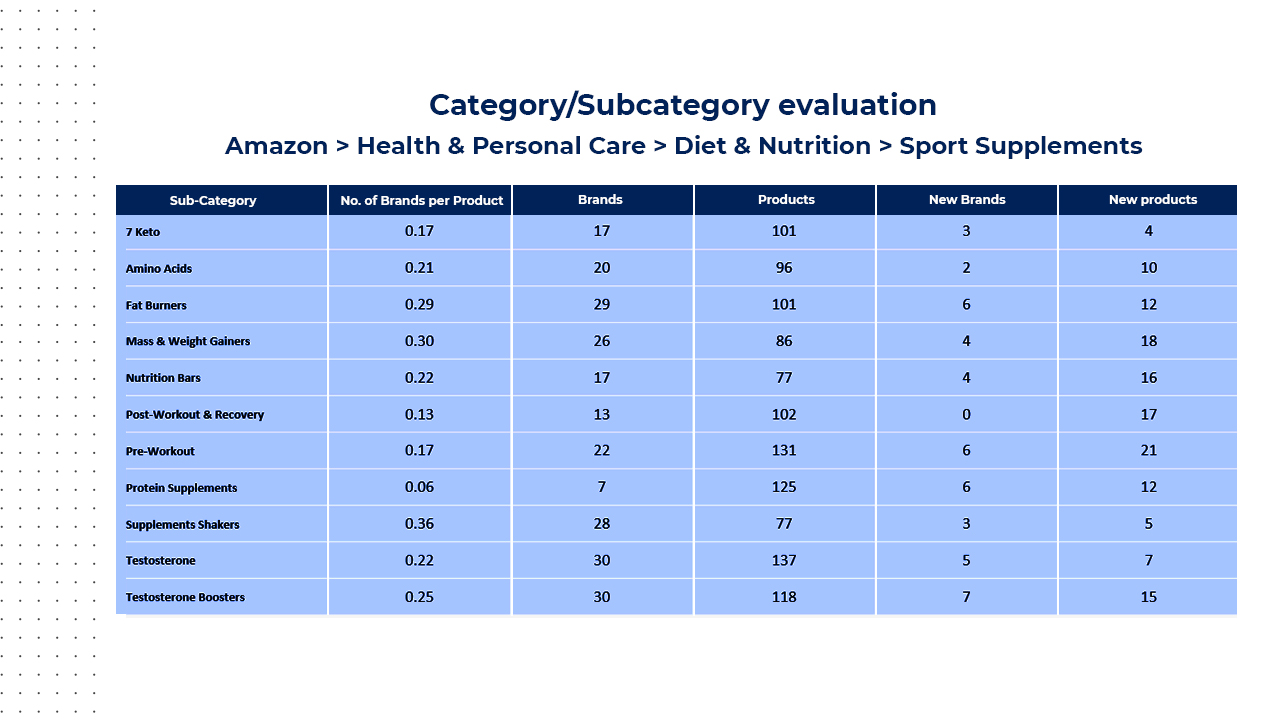
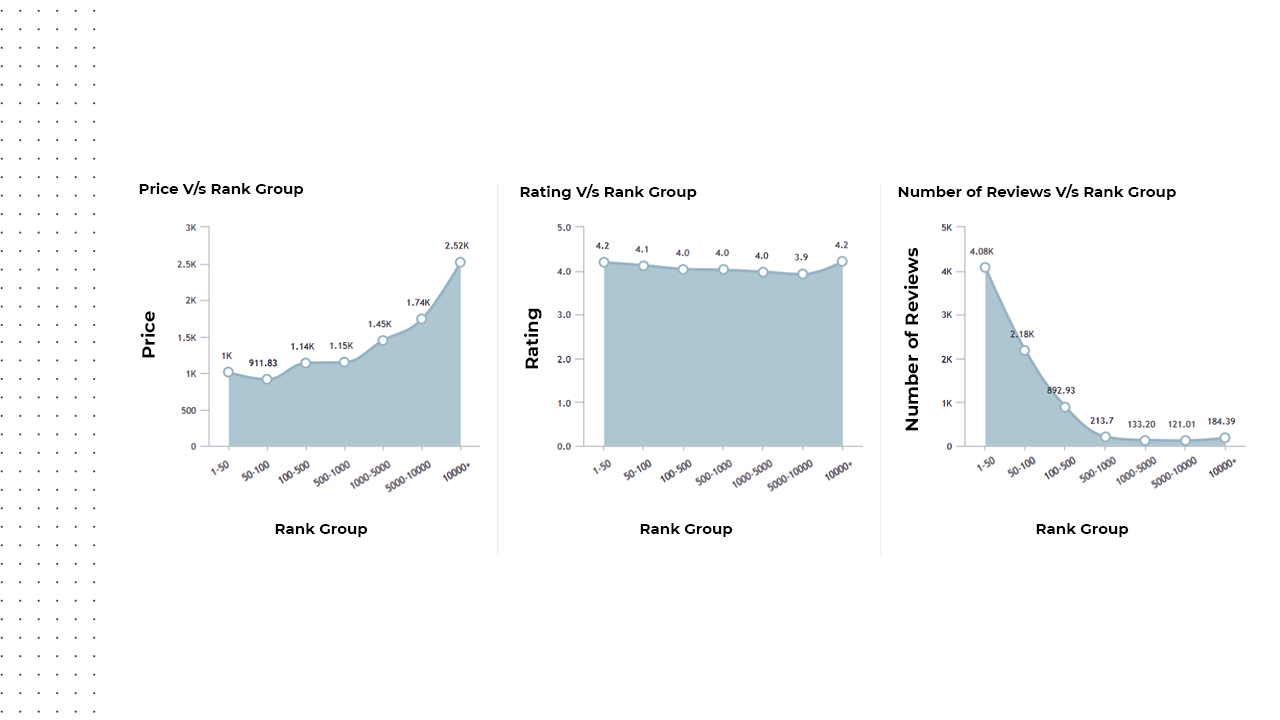
    We can also help with benchmarking the category – to help understand how the brand that you are scouting is doing when compared to its category peers.

    Rank Group versus Price, Rating & No of Reviews
    Rank Group versus Price, Rating & No of Reviews

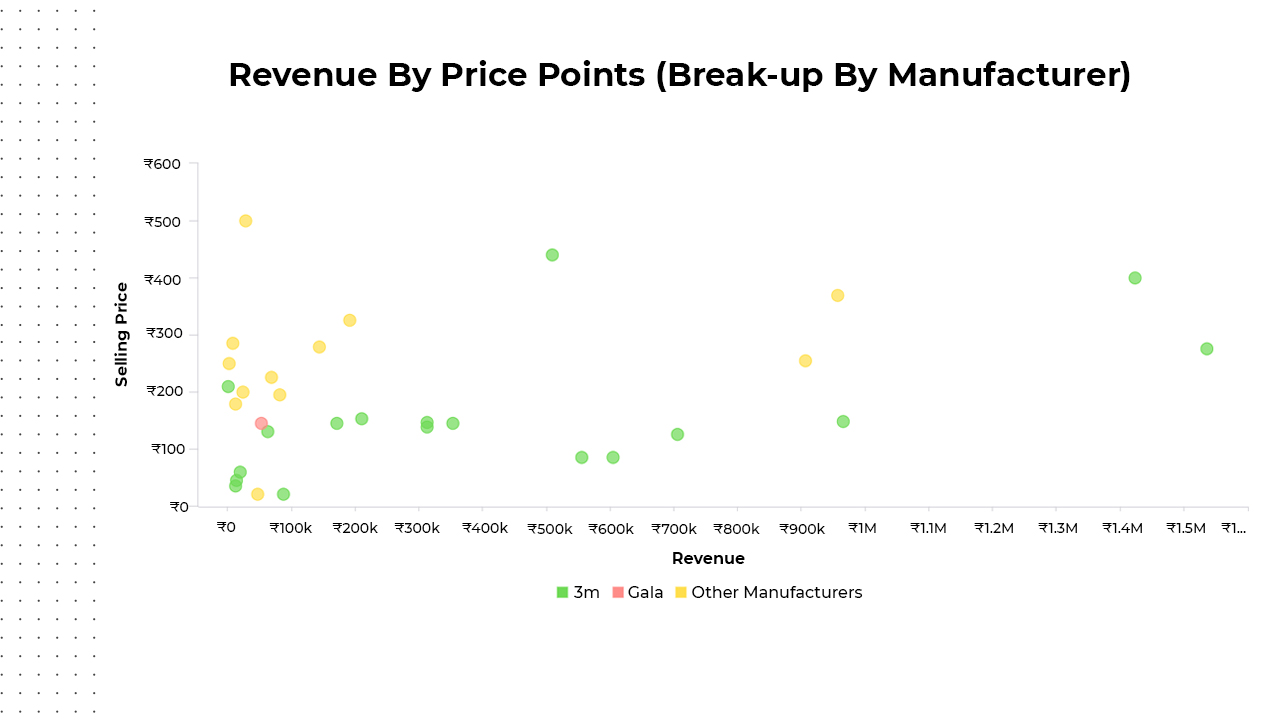
    Sales & Share: We can also provide a good directional estimate of the sales and market share of all the SKUs in the category wherein you are scouting for brands. These are estimates powered by our proprietary machine learning algorithms and can help you solidify your hypothesis around a blog or a category.

    Revenue by Price Points
    Revenue by Price Points

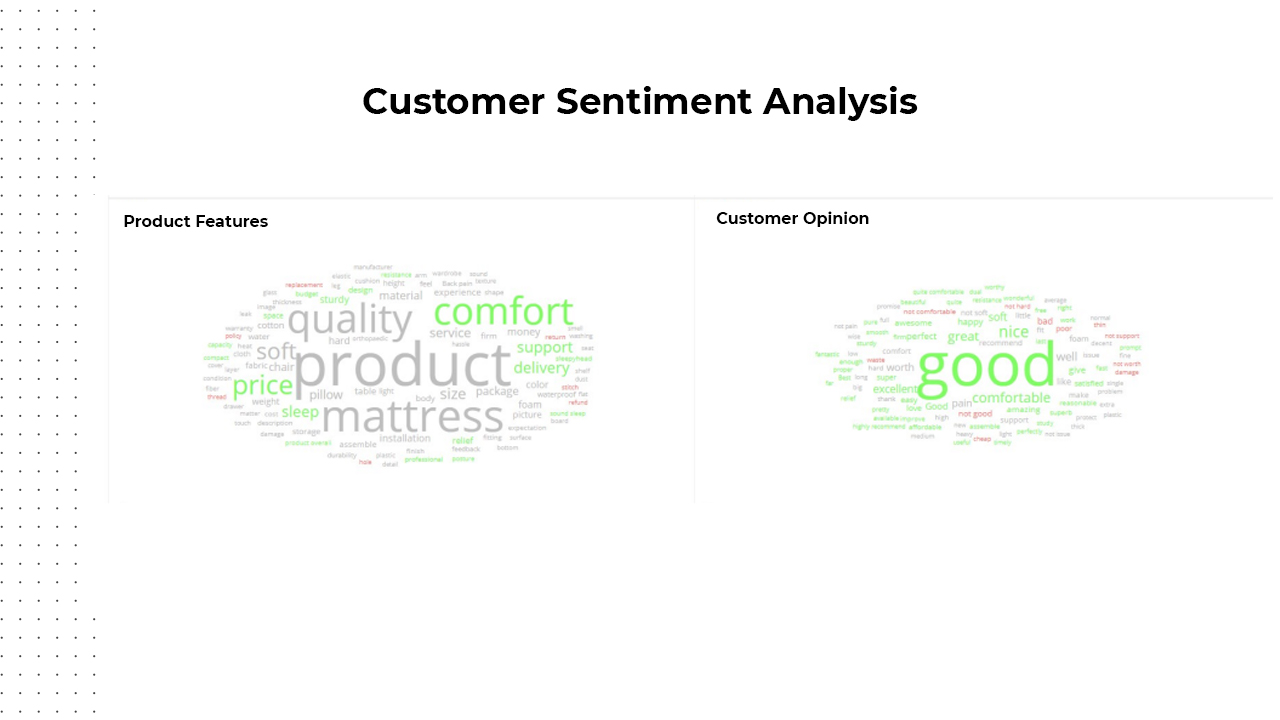
    Sentiment Analysis of Reviews: Customer reviews tell more about the qualitative aspects of the SKU and the brand itself. Our algorithms can help understand what features of a brand or a product do customers really care about. We can answer questions such as:

    • Which features are mentioned most commonly?
    • Which features are mentioned positively or negatively?
    • What adjective is used to describe that particular feature?
    Customer Sentiment Analysis
    Customer Sentiment Analysis

    The suite of Brand Scouting and complementary solutions is evolving rapidly as the space is evolving rapidly. We are supporting several VCs and Brand Roll-ups globally to scout for brands.

    The best aspect about DataWeave is our ability to scout brands across 2,000+ eCommerce platforms globally across geographies. We are super stoked to be playing an enabler in the Brand Rollup revolution.

    Beyond Brand Scouting – Digital Shelf Analytics

    The challenge for Brand roll-ups is not over by just scouting and acquiring a brand. The journey is just about starting – the next challenge that the Brand Rollup faces now is to scale up these brands.

    The challenge the Brand Rollup face is unique and very different from a single brand operator or even traditional CPG conglomerates.

    DataWeave’s flexible product philosophy enables Brand Roll-ups to diagnose and measure the performance of multiple brands across multiple platforms in one dashboard.

  • How an American QSR (Quick Service Restaurants) improved its Business ROI Food Apps

    How an American QSR (Quick Service Restaurants) improved its Business ROI Food Apps

    Traditionally, Quick Service Restaurants (QSRs) such as McDonald’s or Burger King, have been strategically operating on a brick and mortar model. However, according to some studies, an average QSR generates as much as 75% of its sales from online orders.

    With the advent of delivery apps such as Uber Eats and Doordash, a significant portion of QSRs’ business has moved to these platforms. The war to top rank on one of these platforms is an even greater feat. With each brand competing for the top listing, it’s much less about the dollars you pay and much more about optimizing your investments.

    The relationship between QSR chains and food delivery apps has its advantages and disadvantages. One of the critical grouses QSRs have against food apps is the incremental marketing spend required to participate on the platform and the inability to measure the impact of their investment. What makes matters worse is the limitation in metrics even available to measure the impact – neither the food apps provide them, nor does anyone else.

    At DataWeave, we have made it our mission to enable QSRs to not only define measurable metrics to achieve a positive ROI for food app marketing investments, but we also equip QSRs with the tools to track their competitive performance at granular, zip code-based level so that localized strategies can be modified as needed. Below is an example of a 1000+ store chain QSR we partnered with to optimize a pre-existing investment made with a large food aggregator app. Within months of engagement with us, they were able to achieve a 3X increase in sales without adding any additional marketing dollars.

    Below are the pain points we identified and solved together:

    1. No Defined Metric

    Problem – No leading metric to track marketing performance

    One of the first issues we realized was that sales was not a good metric for tracking marketing performance as it’s a lagging metric and doesn’t capture the issues that help grow or suppress sales.

    Most of the sales are driven by rank in the cuisine category and searches for branded keywords. But, the QSR chain had no way to track these ranks.

    In fact, 70%+ sales go to the first five restaurants for the category and keyword

    Comparing ranking on food delivery platforms
    Comparing ranking on food delivery platforms across different categories and times

    Solution – Establish ranking as a clear marketing metric

    By aggregating data across different food app platforms comprehensively, i.e. across locations, at different times of the day, we established the ranking of the QSR chain in critical categories and for priority keywords, identifying where they under or over-performed relative to the competition. As we did this daily- this became a straightforward metric that helped establish the performance of their marketing campaign.

    2. Geographical & Categorical Challenges

    Problem: Identifying poor-performing stores and zip codes

    We realized  it was not a simple exercise to identify well performing stores on food apps since sales depend on many factors such as competition, population of the area, local cuisine preference, etc.

    Solution: Zip Code Ranking and Attributes

    We tracked the ranking of each store within each Zip Code for keywords and created a list of poor-performing stores. We also extracted attributes such as estimated time of arrival (ETAs), Delivery Fee, Ratings, Reviews, etc., for each of these poor performing stores, to identify the reasons for the poor ranking. 

    Analysing key metrics at a store level
    Analysing key metrics at a store level – identifying worst & best performing stores

    E.g., We realized 356 of the stores were not populating on first page results, primarily because of poor ratings and High ETAs. After the focused initiative, 278 of these stores started showing on the first page and increased sales by 23%. 

    3. Sensitivity Analysis Deficiency

    Problem: Not clear about the contribution of Rating, ETAs, Fees, etc. on the Ranking

    The exact ranking algorithms of these food apps are not publicly shared – so the QSR chain wasn’t clear which variable of rating, ETAs, fees, ad spend, or availability contributed more or less to the overall ranking. 

    Solution: Sensitivity analysis for measuring contribution 

    Comprehensive data for multiple zip codes in various timestamps was analyzed to determine which variable contributes most significantly to the rankings and when. We also conducted A/B testing – simultaneously testing two different variables, such as reducing ETAs at one store and improving ad spend at another, calculating which led to greater rank and sales impact.

    For example, we realized reducing publicized ETA’s (even by decreasing the delivery radius) contributed much more to improve the rankings than changes to ratings.

    4. An Unknown Competitive Landscape

    Problem: Tracking competitor performance

    For example, we found the QSR chain performed well in key urban centers, but the competition was doing even better, but there wasn’t a good way to track and compare the performance of the competitors.

    Solution:

    We started tracking the QSR chain and the competition for each of the metrics and started comparing performance.

    Analysing competitive performance
    Analysing competitive performance on key metrics such as ETA, Availability etc

    We quickly realized ranking started quickly improving as we gained a slight edge in each metric against the competitors. For example, 5 minutes less ETA adds to higher ranking.

    In six months of this exercise with the QSR chain, we improved the average ranking from 24 to 11 for the QSR chain, getting them featured on the first page.

    5. Blind Advertising Investment Opportunities

    Problem: 

    The QSR chain was not clear on which banners (Popular near you, National Favorites, etc.)  to choose to invest in, and had to depend on the recommendations of the food platforms entirely. 

    They weren’t even provided a clear view of which position made the banner visible and at what rank among those banners was their promo visible. They were at times the 7th promo in the 6th banner, which has almost zero probability of being discovered by the user – this happened despite paying heavily for the banners.

    Solution: 

    We aggregated data for all banners populated within each zip code and found out the ranking and in which position the QSR chain was visible.

    Analysing right banners
    Identifying and analysing right banners for advertising spends

    The QSR chain invested in 630 zip code-based banners with guaranteed visibility, but our assessment indicated the banners were only visible in 301 zip codes. After selecting suitable banners for promotions, we improved visibility to 533 zip codes within enhancing the budget.  

    We are now using the same strategy for refining discounts, offers, promotions, and coupons. 

    6. Lack of Campaign Performance Monitoring

    Problem: Unsure of the long-term impact of marketing spend

    In general, increasing marketing spend does give a temporary boost to sales, but the QSR chain’s question was, how can we measure the long-term impact i.e., ranking keywords and the targeted zip codes.

    Solution: 

    We created a simple widget for every marketing campaign which showed the rank for the keywords for selected zip codes before the campaign, during the campaign, and post the campaign, clearly establishing the midterm impact of the campaign. This constant monitoring allowed the QSR to also quickly pivot on their strategy on account of national holidays etc, and act accordingly.

    7. Non-Existent ROI Measurement

    Problem: Establishing the impact of ranking on sales

    Though the QSR chain could track sales that were coming via the food app channel, they had no way of knowing incremental organic volume driven by marketing efforts. 

    One missing variable here was how much of extra sales could be attributed to improvement of QSR ranking? 

    Solution: 

    By combining the sales data with aggregated insights over time, we established for the QSR chain how much increase in sales they could anticipate from an increase in ranking, also knowing which changed variables led to the percentage of change increase.

    So, in essence, we were able to tell the QSR chain that for each store how much sales would increase by improving ETAs, rating, ad visibility, availability, etc., enabling precise ROI calculations for each intervention they make for their stores.

    Increasing sales by 3x within six months was only the beginning, and the journey of driving marketing efficiency using competitive and channel data has only just begun. 

    DataWeave for QSRs

    DataWeave has been working with global QSR chains, helping them drive their growth on aggregator platforms by enabling them to monitor their key metrics, diagnose improvement areas, recommend action, and measure interventions’ impact. DataWeave’s strategy eliminates the dependence on food apps for accurate data. We aggregate food app data and websites to help you with analysis and the justification of marketing spend and drive 10-15% growth.

    DataWeave’s strategy eliminates the dependence on food apps for accurate data. We aggregate food app data and websites to help you with analysis and the justification of marketing spend and drive 10-15% growth.

    If you want to know learn how your brand can leverage Dataweave’s data insights and improve sales, then click here to sign up for a demo

  • Seven tricks to win food wars on food aggregators apps

    Seven tricks to win food wars on food aggregators apps

    Food aggregators have emerged as a critical channel for Quick Service Restaurant (QSR) chains to grow their business – especially post-pandemic. Quick Service Restaurants, QSRs, as we call them, are capitalizing on the opportunity too. For many chains, as high as 50% of their revenue now comes via aggregator channels.

    However, most QSR chains are only beginning to leverage data and analytics to drive business on the food aggregator apps.

    Currently, QSRs spend vast amounts on marketing on Food apps but are always unsure of the return on their investment. Aggregators share some data, but they have an inherent motive to entice QSRs to buy more advertisements. They cannot share competitive insights as well. Moreover, as QSRs work with several platforms at once, it gets difficult to collate and analyze data from all these platforms together. These issues make leveraging data for QSR chains difficult. At Dataweave, we have collated some insights from our recent experience of working with global QSR chains helping them improve their sales on different food applications using data:

    1. Availability

    Availability of QSR and Availability Trends
    (L) Availability of QSR outlets across aggregator platforms at state, city, and outlet levels. (R) Availability trends at Lunch and Dinner slots across platforms. Such trends can highlight problem areas that need to be addressed.

    The easiest and most impactful fix is to ensure that all your outlets are available on the app at the peak slots, typically lunch and dinner. Availability increase of ~2% at peak times results in order volume increase by ~5%-7%.

    The reasons for unavailability range from lack of riders, overwhelming orders at the outlet, or just plain technical glitches. Tracking this metric and actively engaging with your stores and aggregator platforms to resolve any issues should be a daily priority.

     2. Monitoring Keyword Ranks

    High correlation between ranking and sales
    Illustrative chart showing a high correlation between ranking and sales

    If you are a Pizza chain but don’t show up among the first five ranks when your target customer is searching for Pizza, the chances of a sale are lower.

    What helps is to track the ranking for your brand, and your competitor brands, in different category listings across different keywords.

    Your ranking may differ a lot by region, markets, and Zip codes depending on consumer tastes, competitors, and your brand presence, and it’s helpful to track it granularly. 

    No surprises here – but rank is strongly correlated with your order volumes!

    3. Tracking competitors

    QSR chain rank
    Illustrative chart showing the rank of key QSR chains on the home page and various categories

    One of the tricks to rapidly gain in ranking is to monitor competitors in your category and ensure that you are doing better on each attribute – ranking, rating, ETAs (estimated time of arrival), fees, discounts, etc.

    A slight edge across your outlets translates to rapid gain in ranking and order volumes.

    4. Choosing suitable banners for promotions

    Position of banners
    Position of various banners at various zip codes. Important to choose banners that rank higher.

    Choosing banners is an essential strategy to gain visibility – but it’s vital to know two factors: 

    • At what rank does the banner you are choosing show up on the App/Website.
    • At what position does your brand show up in the banner?

    If you are on a 5th rank on the 4th banner, your marketing spend is probably going down the drain.


    5. A/B Testing

    Before starting an effective marketing campaign, it helps to do A/B testing by running two different banners in the same city one week apart to see which yields more impact.

    A/B testing can also be a tool to choose banners, discounts, offers, signature images, etc.

    6. Sensitivity analysis

    Delivery time impact
    Illustrative chart showing that ETAs are highly correlated with sales, whereas ratings do not have much impact.
    • What has more impact on sales – Ratings or ETAs? 
    • What will be the likely impact on sales of the marketing campaign in New York vs. Denver? 
    • What is the likely impact of competitors’ ad blitz on your sales?

    Data can answer these and many more questions, and this sensitivity analysis should be part of the QSR chain’s decision-making

    7. Monitoring campaign performance

    QSR chains spend millions of dollars of ad budget running campaigns on aggregator platforms combining banner ads, discounts, offers, etc.

    It’s a great idea to measure QSRs rank on these aggregator’s platforms before, during, and post the campaign in focus Zip Codes for priority keywords to see if the gain in ranking is temporary or lasts for a while.

    The ultimate factors for QSRs to win will remain the quality of food and consistency of the brand’s messaging. Leveraging the power of data can help understand the aggregator platform’s characteristics, competitor’s strengths, weaknesses, & strategy, and consumer behavior trends.

    Also, data can help better direct ad dollars and the eCommerce teams’ focus on the right initiatives to drive maximum sales and growth.

    DataWeave for QSRs

    DataWeave has been working with global QSR chains, helping them drive their growth on aggregator platforms by enabling them to monitor their key metrics, diagnose improvement areas, recommend action, and measure interventions’ impact. 

    DataWeave’s strategy eliminates the dependence on food apps for accurate data. We directly crawl food aggregators apps and websites and help you with data and analysis to solve the aforementioned issues and drive 10-15% growth.